
MCAS General Update Including LTC - E
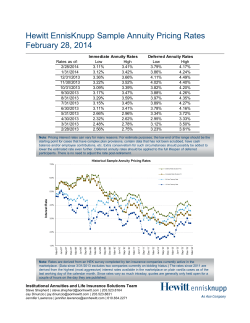
MCAS General Update
Including Long Term Care (LTC)
Objectives
After this session you will be able to:
• Describe the current trends in the Market
Conduct Annual Statement (MCAS) data
• Describe the Market Analysis Framework
• Describe the incorporation of MCAS Data
into the Market Analysis Framework.
Randy Helder
Assistant Director of Market Regulation
The
Market Analysis
Framework
and the
Market Conduct
Annual Statement
Market Regulation
Market regulation
• protect consumers
• by identifying
• and correcting
insurer operating practices that are in conflict
with contract provisions, state laws, rules,
regulations, or orders of the Commissioner.
Market Analysis
Market Analysis is a structured and
formalized system of collecting,
organizing, and analyzing data and other
information to enable regulators to identify
general market disruptions and specific
market conduct problems as soon as
possible, while maintaining an efficient and
effective regulatory framework.
Market Analysis Goals
•
•
•
•
Increase Effectiveness
Increase Efficiency
Improve Uniformity
Improve Collaboration
Funnel Analysis
Insurance Market
Subset of Companies
Focused Reviews
Single Company
Area of Interest
Market Analysis Framework
• Baseline Analysis
• Entire Market
• Level 1 Analysis
• Analysis of specific company
• Level 2 Analysis
• Increased analysis of specific company
Market Analysis Tools
• Baseline Analysis
• Market Analysis Prioritization Tool
• Market Conduct Annual Statement (MCAS)
•
Level 1 Analysis
• Market Analysis Review System
• Q14. - MCAS results analysis for single company
• Level 2 Analysis
• Market Analysis Review System
Market Analysis Tools
Market Conduct Annual Statement
•
•
•
•
Data call of market conduct related data
Collected at the state and LOB level of detail
Centralized at the NAIC
Used for state and national analysis
Market Analysis Tools
Market Analysis Prioritization Tool
• High level comparison based on financial,
complaint, and regulatory activity information
• Identifies companies that need further, more
detailed analysis
• Elevates these companies to a Level 1 Review
Market Analysis Tools
Market Analysis Prioritization Tool
• High level comparison based on financial,
complaint, and regulatory activity information
• Identifies companies that need further, more
detailed analysis
• Elevates these companies to a Level 1 Review
Market Analysis Tools
Market Analysis Prioritization Tool
• 11 different lines of business
• Generates scores in six key areas
•
•
•
•
•
•
Complaints
Regulatory Actions
Premium
Loss, Expense and Enrollment Experience
Exam History
Company Demographics
Market Analysis Tools
MCAS - Market Analysis Prioritization Tool
(or MCAS – MAPT)
• Side-by-side comparison of all companies
submitting MCAS data to a state
• Three years of ratio data
• being expanded to 3 years of all data
• Generates ranks for each ratio
Market Analysis Tools
Market Analysis Review System
Level 1 Analysis
• Detailed review of uniform information from
NAIC Databases (including MCAS).
• Ability to share information with other
analysts and states.
• Identifies companies that still needs further,
more detailed analysis.
Level 1 Analysis
1.
2.
3.
4.
5.
6.
7.
8.
9.
10.
11.
12.
13.
Company Operations/Management
Financial Ratios
Special Activities
Regulatory Actions
Examinations
Market Initiative Tracking System
Premiums
Market Share
Loss/Expense Ratios
Resisted/Unpaid Claims
Complaints
Market Conduct Annual Statement
Conclusion
Level 1 Analysis - MCAS
• Review the individual ratios at state level
• Overall and coverage level
• Ranks
• Compared to the state ratios
• Review the individual ratios at nat’l level
• Ranks
• Compared to the national overall ratio
• Review the data over three years
Market Analysis Tools
Market Analysis Review System
Level 2 Analysis
• Helps provide confirmation of a potential
market regulatory issues
• Helps determine the cause and extent of
the problem
National Analysis
Market Action Working Group (MAWG)
• 16 top market regulation professionals
• At least one from each NAIC zone
• All jurisdictions participate in discussions
• Annual National Analysis Process
• Uses the market analysis framework
•
•
•
•
Identifies companies / groups of concerns
Three lines of business – Life/Annuity, Health, P&C
Volunteers from any jurisdictions conduct Levels 1 and 2
MAWG considers analysis and takes action where needed
Market Conduct Annual Statement
- First Results • As of Friday morning, April 24
• Received
•
•
•
•
Auto
– 32% of the total expected filings
Homeowners – 33% of the total expected filings
Life
– 24% of the total expected filings
Annuity
– 19% of the total expected filings
• Expected April 30
• 29,500 filings from about 1,500 companies
Market Conduct Annual Statement
- First Results • Long-Term Care
• As of Friday morning, April 24
• Received
• Expected April 30
– 875 total filings (28%)
– 638 stand-alone
– 316 life-LTC, 45 annuity-LTC
– 3,129 total filings
Market Conduct Annual Statement
- First Results • P&C Ratio 1 (Closed without Payment)
– Private Passenger Auto
• 2011 / 2012 / 2013 = 26% / 27% /27.2%
• 2014 as of April 24 = 28.5%
– Homeowner
• 2011 / 2012 / 2013 = 25% / 26% /29%
• 2014 as of April 24 = 27.8%
Market Conduct Annual Statement
- First Results • P&C Ratio 3 (Claims Paid Past 60 Days)
– Private Passenger Auto
• 2011 / 2012 / 2013 = 21% / 18% / 19%
• 2014 as of April 24 = 20%
– Homeowner
• 2011 / 2012 / 2013 = 22% / 22% /28%
• 2014 as of April 24 = 28%
Market Conduct Annual Statement
- First Results • P&C Ratio 5 (Cancels Past 60 Days)
– Private Passenger Auto
• 2011 / 2012 / 2013 = .47% / .47% / .48%
• 2014 as of April 24 = .40%
– Homeowner
• 2011 / 2012 / 2013 = .71% / .68% /.73%
• 2014 as of April 24 = .6%
Market Conduct Annual Statement
- First Results -
• Life and Annuity Ratio 1 (Replacements)
– Life Cash Value
• 2011 / 2012 / 2013
• 2014 as of April 24
= 7% / 6% / 5%
= 4%
– Life Non-Cash Value
• 2011 / 2012 / 2013
• 2014 as of April 24
= 13% / 13% / 13%
= 6%
– Fixed Annuity
• 2011 / 2012 / 2013
• 2014 as of April 24
= 20% / 22% / 21%
= 19%
– Variable Annuity
• 2011 / 2012 / 2013
• 2014 as of April 24
= 23% / 25% / 25%
= 32%
Market Conduct Annual Statement
- First Results -
• Life and Annuity Ratio 4 (Surrenders < 10 yrs)
– Life Cash Value
• 2011 / 2012 / 2013
• 2014 as of April 24
= 39% / 38% / 37%
= 53%
– Fixed Annuity
• 2011 / 2012 / 2013
• 2014 as of April 24
= 74% / 74% / 70%
= 72%
– Variable Annuity
• 2011 / 2012 / 2013
• 2014 as of April 24
= 64% / 65% / 64%
= 64%
Market Conduct Annual Statement
- First Results -
• Life and Annuity Ratio 7 (Complaints per 1000 PIF)
– Life Cash Value
• 2011 / 2012 / 2013
• 2014 as of April 24
= .20 / .20 / .19
= .13
– Life Cash Value
• 2011 / 2012 / 2013
• 2014 as of April 24
= .25 / .21 / .23
= .24
– Fixed Annuity
• 2011 / 2012 / 2013
• 2014 as of April 24
= .37 / .35 / .43
= .26
– Variable Annuity
• 2011 / 2012 / 2013
• 2014 as of April 24
= .47 / .39 / .36%
= .16
Market Conduct Annual Statement
- First Results • LTC Ratio 1 (Replacements)
– Stand-Alone = 1.7%
– Life-LTC
= 2.0%
– Annuity-LTC = n/a
• LTC Ratio 2 (Complaints per 1000 PIF)
– Stand-Alone = .62
– Life-LTC
= .04
– Annuity-LTC = n/a
Market Conduct Annual Statement
- First Results • LTC Ratio 3 (Claimants per policy in force)
– Stand-Alone = .04
– Life-LTC
= 0
– Annuity-LTC = .012
• LTC Ratio 4 (Denied to New Claimants)
– Stand-Alone = 17%
– Life-LTC
= 5%
– Annuity-LTC = 0%
Market Conduct Annual Statement
- First Results • LTC Ratio 5 (Determinations >60 Days)
– Stand-Alone = 12%
– Life-LTC
= 2%
– Annuity-LTC = 0%
• LTC Ratio 6 (Benefit Requests Denied )
– Stand-Alone = 5%
– Life-LTC
= 0%
– Annuity-LTC = 0%
Market Conduct Annual Statement
- First Results • LTC Ratio 7 (Benefit Requests >60 days)
– Stand-Alone = .66%
– Life-LTC
= 0%
– Annuity-LTC = 0%
• LTC Ratio 8 (Benefit Denial >60 days)
– Stand-Alone = 5.62%
– Life-LTC
= n/a
– Annuity-LTC = n/a
Market Conduct Annual Statement
- First Results • LTC Ratio 9 (Lawsuits)
– Stand-Alone = 85%
– Life-LTC
= 100%
– Annuity-LTC = n/a
Market Conduct Annual Statement
- First Results • P&C Ratio 5 (Cancels Past 60 Days)
– Private Passenger Auto
• 2011 / 2012 / 2013 = .47% / .47% / .48%
• 2014 as of April 24 = .40%
– Homeowner
• 2011 / 2012 / 2013 = .71% / .68% /.73%
• 2014 as of April 24 = .6%
Market Conduct Annual Statement
- First Results • P&C Ratio 5 (Cancels Past 60 Days)
– Private Passenger Auto
• 2011 / 2012 / 2013 = .47% / .47% / .48%
• 2014 as of April 24 = .40%
– Homeowner
• 2011 / 2012 / 2013 = .71% / .68% /.73%
• 2014 as of April 24 = .6%


© Copyright 2026