
factors that influence employee performance at the fairmont norfolk
FACTORS THAT INFLUENCE EMPLOYEE PERFORMANCE AT THE FAIRMONT NORFOLK HOTEL BY SWABRA ABDALLAH SOUD UNITED STATES INTERNATIONAL UNIVERSITY SUMMER 2014 FACTORS THAT INFLUENCE EMPLOYEE PERFORMANCE AT THE FAIRMONT NORFOLK HOTEL BY SWABRA ABDALLAH SOUD A Project Report Submitted to the School of Business in Partial Fulfillment of the Requirement for the Degree of Masters in Business Administration (MBA) UNITED STATES INTERNATIONAL UNIVERSITY SUMMER 2014 STUDENT’S DECLARATION I, the undersigned, declare that this is my original work and has not been submitted to any other college, institution or university other than the United States International University in Nairobi for academic credit. Signed: ________________________ Date: _________________________ Swabra Abdallah (ID 622803) This project has been presented for examination with my approval as the appointed supervisor. Signed: _________________________ Dr. Zachary Mosoti Date: _________________________ Signed: _______________________ __ Date: _________________________ Dean, School of Business ii COPYRIGHT ©2014 Swabra Abdallah All rights reserved No part of this Research Project may be copied, replicated, used to create derivative works, publicly distributed or displayed, or transmitted including but not limited to storage in a retrieval system, or transmission electronically, mechanically via photocopying, recording, or other means without the prior written permission of the author. iii ABSTRACT The purpose of this study was to determine factors that influence employee performance at the Fairmont Norfolk Hotel. The following research questions guided this study: To what extent does remuneration impact employee performance at the Fairmont Norfolk Hotel? To what extent does creativity impact employee performance? To what extent does training and development impact employee performance at the Fairmont Norfolk Hotel? A descriptive survey research design was adopted for this study. The population of interest consisted of 320 employees who worked at various departments. The departments found at the hotel included the following: Front Office, Housekeeping, Laundry, Kitchen, Stewarding, Catering and Banquet, Food and Beverage Service, Health Club, Human Resources, Security, Procurement, Executive office, Engineering, Sales and Reservations. A sample size of 74 was drawn from the targeted population using a stratified random sampling technique. Moreover, a self- administered structured questionnaire was used to collect the data. Further, statistical methods such as, descriptive statistics; mode, median and mean as a measure of central tendency and measures of dispersion such as quartiles, percentiles, variance, standard deviation and range were used to analyze the data. Moreover, inferential statistics T-test was used to determine the factors that influence employee performance. Statistical Package for Social Scientist (SPSS) version 21 and Microsoft Excel 2010 was also used to analyze the data. Additional, tables and charts were used to present the study results. The findings regarding the impact of remuneration on employee performance showed that, employees generally agreed that if they are given good salaries and bonuses plus their remuneration being paid on time, their performance at the organization is positively impacted. Furthermore, in regards to the impact of creativity on employee performance, the researcher found out that, respondents are of agreement that the degree to which the organization embraces creativity had an impact on their performance. It should however be noted that, some creativity factors ranked higher than others in terms of preference by iv the respondents. Finally, findings regarding the impact of training and development on employee performance showed that, a large number of employees believed that if the organization embraced training and development then their performance improved. Nonetheless, it should also be noted that, not all training and development factors had the same ranking. A conclusion based on the remuneration factors having an impact on employee performance was that, remuneration had a very strong influence on how well employees performed at the hotel. Furthermore, in regards to the impact of creativity on employee performance, conclusion can be made by stating that, the degree to which the organization embraces creativity had a strong effect on employee performance. Finally, regarding the impact of training and development on employee performance at the hotel, conclusion can be made by stating that, respondents highly agreed that training and development influenced their performance. Based on the impact of remuneration on employee performance, the researcher recommends that, managers prioritize and put their concentration more on those remuneration factors that will satisfy their employees highly and increase their performance as presented in the study such as, paying employees on time, giving sufficient salaries and awarding bonuses where it necessary. In regards to the impact of creativity on employee performance, the researcher also recommends that, managers put more emphasis and concentration more on those creativity factors that appeal to the employees highly and this will in turn increase their performance such as recognition of employees for creativity and the hotel embracing an out an out of the box outlook. Finally, in regards to the impact of training and development on employee performance, the researcher also recommends that, managers critically address and put more resources to those training and development factors which the employees believe highly influence their performance such as, the degree to which training and development opportunities are visibly linked to the strategic path of the hotel and the degree to which the hotel inspires employees to take initiative in their own career development. v ACKNOWLEDGEMENT Completion of this project would not have been made possible without the blessings of the omnipresent GOD. I would like to express my gratitude for the perseverance and wisdom that has been bestowed upon me throughout this research project, and without doubt, throughout my life. Secondly, I would like to thank my supervisor, Dr Zachary Mosoti whose sincerity and encouragement I will never forget. Dr. Zachary has been my inspiration as I handle all the obstacles in the completion of this research. One simply could not wish for a better or friendlier supervisor. Foremost to the University for offering me the opportunity for this great experience. Last but not least, I would like to thank my parents and my sisters for their total support, both emotionally and financially throughout my Master‟s degree. May God bless them abundantly. Lastly, I would like to acknowledge the respondents in my study from Fairmont Norfolk Hotel, for availing time to fill my questionnaires and offering constant input towards my research. . vi DEDICATION This thesis is dedicated to my late grandparents, my parents, my sisters, my brothers, my nephews, my nieces and my auntie for their love, endless support and words of encouragement and push for tenacity ring in my ears. I will always appreciate all they have done to me. This thesis is only a beginning of my journey. vii TABLE OF CONTENTS STUDENT’S DECLARATION ........................................................................................ii COPYRIGHT ................................................................................................................... iii ABSTRACT ....................................................................................................................... iv ACKNOWLEDGEMENT ................................................................................................ vi DEDICATION..................................................................................................................vii TABLE OF CONTENTS .............................................................................................. viii LIST OF TABLES ............................................................................................................ xi LIST OF FIGURES .........................................................................................................xii CHAPTER ONE ................................................................................................................ 1 1.0 INTRODUCTION........................................................................................................ 1 1.1 Background of the Problem ........................................................................................... 1 1.2 Statement of the Problem ............................................................................................... 4 1.3 Purpose of the Study ...................................................................................................... 6 1.4 Research Questions ........................................................................................................ 6 1.5 Significance of the Study ............................................................................................... 7 1.6 Scope of the Study ........................................................................................................ 7 1.7 Definition of Terms....................................................................................................... 8 2.5 Chapter Summary .......................................................................................................... 9 CHAPTER TWO ............................................................................................................. 10 2.0 LITERATURE REVIEW ......................................................................................... 10 2.1 Introduction .................................................................................................................. 10 2.2 Impact of Remuneration on Employee Performance ................................................... 10 2.3 Impact of Creativity on Employee Performance ......................................................... 15 viii 2.4 Impact of Training and Development on Employee Performance .............................. 23 2.5 Chapter Summary ........................................................................................................ 27 CHAPTER THREE ......................................................................................................... 28 3.0 RESEARCH METHODOLOGY ............................................................................. 28 3.1 Introduction .................................................................................................................. 28 3.2 Research Design........................................................................................................... 28 3.3 Data Collection Methods ............................................................................................. 32 3.4 Data Analysis Methods ................................................................................................ 32 3.5 Chapter Summary ........................................................................................................ 33 CHAPTER THREE ......................................................................................................... 34 4.0 RESULTS AND FINDINGS ................................................................................... 34 4.1 Introduction .................................................................................................................. 34 4.2 General Information ..................................................................................................... 34 4.3 Impact of Remuneration On Employee Performance .................................................. 39 4.4 Impact of Creativity On Employee Performance......................................................... 47 4.5 Impact of Training and Development On Employee Performance ............................ 54 4.6 Chapter Summary ........................................................................................................ 60 CHAPTER FIVE ............................................................................................................. 61 5.0 DISCUSSIONS, CONCLUSIONS AND RECOMMENDATIONS ...................... 61 5.1 Introduction .................................................................................................................. 61 5.2 Discussions .................................................................................................................. 62 5.3 Conclusions .................................................................................................................. 67 5.4 Recommendations ........................................................................................................ 68 ix REFERENCES………………………………………………………………………….71 Appendix A: Questionnaire ............................................................................................ 82 Appendix B: Implementation Schedule ......................................................................... 86 x LIST OF TABLES Table 3.1 Population Distribution ...................................................................................... 29 Table 3.2 Sample Size........................................................................................................ 31 Table 4.1 Age of Respondent............................................................................................. 36 Table 4.2 Department of Respondent ................................................................................ 37 Table 4.3 Years of Service ................................................................................................. 38 Table 4.4 Employment Status ............................................................................................ 38 Table 4.5 Importance of Benefits....................................................................................... 41 Table 4.6 Payment on Time ............................................................................................. 47 Table 4.7 Bonus Given When Goals Are Achieved by Employees ................................. 47 Table 4.8 Motivation by Wages and Salaries .................................................................... 44 Table 4.9 Individual Impact of Remuneration on Employee Performance Factors...........46 Table 4.10 One-Sample Test.............................................................................................. 47 Table 4.11 Recognition for Creativity ............................................................................... 54 Table 4.12 Degree to Which the Hotel Has an Out of the Box Outlook and a Go For It Attitude. ….........................................................................................................................55 Table 4.13 Degree to which the Hotel Encourages a Dynamic Flow of Ideas ………….51 Table 4.14 Impact of Creativity on Employee Performance … ........................................ 57 Table 4.15 One- Sample Test …........................................................................................ 57 Table 4.16 Training Provided by the Hotel ....................................................................... 55 Table 4.17 Link of Training and Development Opportunities to Strategic Path of the Hotel…………………………………………………………………………………….. 55 Table 4.18 Employee Inspiration to Take Initiative in Determining Career Development……………………………………………………………………………..56 Table 4.19 Opportunities for Employee to Learn New Skills and Cross Train………….57 Table 4.20 Impact of Training and Development on Employee Performance…………..59 Table 4.21 One- Sample Test……………………………………………………………60 xi LIST OF FIGURES Figure 4.1 Gender of Respondent ..................................................................................... 35 Figure 4.2 Benefits Received ............................................................................................ 39 Figure 4.3 Benefit Satisfaction ......................................................................................... 40 Figure 4.4 Impacts of Benefits on Performance ............................................................... 42 Figure 4.5 Opportunity to be Creative .............................................................................. 48 Figure 4.6 Reward for Creativity ...................................................................................... 49 xii CHAPTER ONE 1.0 INTRODUCTION 1.1 Background of the Problem An organization‟s long term success will depend on how it sustains the deliverance of high quality services and products (Owen, Mundy, Guild and Gulid, 2011). However, despite the fact that sustaining high performance is a competence that is learnable, it is a significant concern that many organizations are still unable to sustain this high performance. There are three main reasons underlying this concern. First, the organization‟s vision and strategy are not well supported by the organizational processes and systems as a result thereof, the organization focuses and measures issues which are wrong or rather irrelevant. Second, not having a clear understanding of the marketplace in which the organization is to compete by the senior management. Should this be the case, then the mission, vision and strategies of the organization become inappropriate. Finally, the misalignment of the behavior required to effectively implement the strategy of the business with the marketplace requirements and customer. This is so true for employee behavior or management (Kaliprasad, 2006). As noted by Willcoxson (2000), the two high performance approaches include a humanistic framework and a rational process framework. In the former, the organization usually empowers its people, trust them and effectively connects with the community at large through involving the stakeholders who are external to the organization. Teamwork is also a strong attribute of the humanistic framework approach. While in the latter framework, organization usually are flexible enough to maintain values which are core while adjusting its output to meet new market conditions or rather new market demands. Such organizations are also capable of interpreting the business environment in which they are in and also have the ability to predict and act upon new business opportunities that might arise in the long run. This responsiveness to the systems and infrastructure, design and deployment, employee behavior and management and market place creates the culture of the organization. It is also the set of joint principles and experiences that fundamentally define an organization‟s identity and eventually guiding its behavior (Owen, Mundy, Guild and Gulid, 2011). According to Kaliprasad (2006), a high performing organization has a culture where every part of the organization shares in elements that characterize the organization. Having a strong 1 culture means that there is no need to dispute certain issues as everybody knows how to get the correct things done. By default, a culture that is developed will preserve what is tried and verified. When an organization culture aligns itself with an appropriate strategy that is well developed, the net result is a stronger culture and therefore a high-performing organization. This setup calls for reinforcement of existing culture by the leaders through encouraging, modeling and rewarding behaviors to the employees. According to Schein (1992), leadership and culture are two sides of the same coin. Leaders are responsible for creating and changing cultures, while the managers live inside them. Moreover, organizations with a strong company culture recognizes heroes whose actions and activities exemplify the corporation's joint viewpoint and apprehensions. Such organizations consider building an identity which is common; this enables members of the organization to comprehend what is required of them because there is a well-unstated sense of expectation and informal rules (Kaliprasad, 2006). Cameron and Pierce (1996) said that all organizations use promotion, benefits and pay to give assurance to those employees who perform better. Management of the companies frequently anticipates depending on the responsibility and the power of such workers and these expectations are usually different from company to company. According to Shahzad, Bashir and Ramay (2008), there is a direct link between employee performance and compensation practices. Further, systems to measure the performance of organizations (PMS) are one of the most important topics discussed in the field of business management and they are on the agenda of many organizations (Neely, 1999). Their importance emerged from the assumption that a performance measurement system is an essential tool that enables a company to achieve and control its preferred goals and objectives. Furthermore, such procedures usually permit managers to balance short-term and long-term performance, growth and control as well as opportunities and threats (Simons, 2000). For these reasons, several practitioners and researchers have devoted many years of study pertaining to this subject. Pertinent fields such as, marketing, operations management, accounting, organizational behavior and business strategy have all discussed and contributed to this field at length (Neely, 1999; Marr and Schiuma, 2003). On another note, the current situation in the hotel industry is characterized by increased competition and consequently demands effective operational decision-making processes based on sufficient information on performance. As a consequence, the different services that 2 usually play a vital role in hotels ought to be well analyzed and similarly their performance ought to be measured too. This is so true especially for the front-office services such as the direct customer relationship management and so is the back-office services, such as the facility management, which take place without direct interaction with the customer but are of the same importance (Gomez, Yasin and Lisboa, 2008). In any instance, there is an increased need for management tools and performance measurement that aid the assessment of the success of organizational objectives and the development of organizational strategies (Cruz, 2007). To measure the performance of hotel organizations, traditional measures such as financial statements have been valued as an important control tool (Brander Brown and Atkinson, 2001). In these traditional measures, the tangible resources are usually well detailed since they meet the standards such as the accurate determination of historical costs and the flow of benefits to the company (Zambon, 2002). Considering the constraints and weaknesses of the traditional performance measurement systems, studies have been turning their focus towards developing integrated methods that would capture the non-financial facets of performance. Such, the balanced PMS has been thought to gain a broad and multi-dimensional outlook of the organization‟s performance (Ghalayini and Noble, 1996; Mills, Wilcox, Neely and Platts, 2000). Examples of integrated systems for measuring performance are the performance pyramid system (Cross and Lynch, 1989), PMS in the service industry (PMSSI) (Fitzgerald, Johnston, Brignall, Silvestro and Voss, 1991), the performance prism (Neely, Adams and Crowe, 2001) and others. One of the most popular incorporated systems is the Balanced Scorecard (BSC), which was developed by Kaplan and Norton (1992). According to Maritz (1995); and Bass and Avolio (1997) leadership is the most significant factor for examining the performance of employees. For the organization to be outstanding one, it needs to have an outstanding leadership that provides a model for growing organizations. Jones and George (2000) stated that, leaders become efficient when they influence their subordinates by effectively achieving the organizational objectives. According to Bass and Avolio (1997), leadership is the most important aspect for determining the organizational performance. On another note, creating a tradition destined to endure was the Christmas present given to Kenya and Nairobi by Major C.G.R. Ringer when he opened the Fairmont Norfolk Hotel in 1904. At that point in time and presently, the hotel has been wholly and inevitably an 3 important part of the country's history. Without fear of correction, one could say that had there, actually, been no Norfolk Hotel, the capital might never have been there. It was at the Fairmont Norfolk Hotel that all new arrivals gathered, then men with the cash, aspiration and forethought to establish a Colony, for Kenya as a nation has existed only since the turn of the twentieth century (Fairmont Norfolk Hotel, 2014). Further, the hotel has played a principal part in Kenya's flamboyant history, and it remains to be the profligate finest-known hotel in Nairobi, Kenya. The urban and soon after the city of Nairobi developed around the hotel, still having its topic gardens which is private. The historical landmark hotel in Nairobi remains the traditional point of start for the African safaris and the Lord Delamere Terrace is the contemporary Nairobi's prevalent gathering place, where drinks and light meals are continuously served from morning until evening. Not to remark the modern Tatu resturant, a breathtaking disparity contrary to the themed Victorian elegant property; and the Cin Cin Wine Bar, which has a marvelous wide array of Intercontinental spirits and wines (Fairmont Norfolk Hotel, 2014). To conclude, the expansion of the hotel was in year 1999 and afterwards for its centennial celebrations in 2004 it was renovated. To have a modern touch, whilst conserving their glamour and exclusive nature, the Delamere and the Acacia Wing were revamped in year 2012. The hotel now offers luxury accommodations in 170 guest rooms and suites; it hosts 175 delegates, it has conference rooms which are 8 in number, it has a modern health Club with gymnasium, a heated al fresco swimming pool, steam room, sauna and gift shops (Fairmont Norfolk Hotel, 2014). 1.2 Statement of the Problem According to Kiruja and Mukuru (2013), the overall success of an organization in achieving its strategic objectives relies heavily on the performance level of employees. Employee performance is a function of ability and motivation, where ability is comprised of the skills, training and resources required for performing a task and motivation is described as an inner force that drives individual to act towards something. Flippo (2001) adds that, employee performance in organizations results in a more motivated work force that has the drive for higher productivity, quality, quantity, commitment and drive. According to Ouchi (2001), organizations would be more effective, efficient, flexible, committed and profitable as a result of an emphasis on trust, which goes hand in hand with productivity; less hierarchical 4 and bureaucratic structure; a high level of worker involvement; all of which would create an employee and organization management systems. Furthermore, Manzoor (2012) affirms that, in order to achieve affluence, organizations need to devise disparate strategies so that they are able to contend with its competitors and more so to increase the overall organization performance. A small number of organizations deem that employees and human personnel are the main assets of any organization and which can lead them to success or failure if not given attention. Not unless and until, the employees are contented with it, they are motivated to fulfill the tasks and achieving their respected goals and finally encouraged by their employers, no organization can attain victory or develop in the long run. Previous studies have done quite a bit to address factors that influence employee performance. A study carried out by Barney (1991) revealed that, the level of performance of employees relies not only on their actual skills but also on the level of motivation each person exhibits. Motivation is an inner drive or an external inducement to behave in some particular way, typically a way that will lead to rewards. Dessler (2003) observed that, over-achieving, talented employees are the driving force of all organizations so it is essential that, organizations strive to motivate and hold on to the best employees. The quality of human resource management is a critical influence on the performance of the institution. Linz (1990) also revealed that, several studies have found that there are positive relationship between intrinsic motivation and job performance as well as intrinsic motivation and job satisfaction. This is significant to institutions in today's highly competitive business environment in that, intrinsically motivated employees will perform better and therefore, be more productive and also because satisfied employees will remain loyal to their institution and feel no pressure or need to move to a different institution. Deci and Ryan (2000) conducted and replicated an experiment that showed the negative impact of monetary rewards on intrinsic motivation and performance. A group of college students were asked to work on an interesting puzzle. Some were paid and some were not paid for the work. The students that were not paid worked longer on the puzzle and found it more interesting than the students being paid. When the study was brought into a workplace setting, employees felt that their behavior was being controlled in a dehumanizing and alienating manner by the rewards. It was discovered that, rewards would seriously decrease 5 an employee's motivation to ever perform the task being rewarded, or one similar to it, any time in the future. Robbins (2003) emphasized the importance of employee job satisfaction as a factor influencing, amongst others, employee work performance. He argues that, happy workers are not necessarily productive workers. This argument is in line with Poisat‟s (2006) deduction that, satisfied employees are not necessarily productive employees. Robbins (2003), however, suggests that the opposite might be more accurate that productivity will probably lead to satisfaction. Spreitzer and Quinn (2001) touches on the feeling employees have of losing control over their work when they argue that, it has become a challenge for organizations to create an organizational culture where all employees would want to work to their full potential and where they can take initiative and act as an owner of the firm. They claim that, organizations that can create such a culture will attract and keep the best and the brightest employees who perform highly and hence generate an important competitive advantage. However, there is still much confusion about which factors really influence employee performance. The question therefore becomes, which factors influence employee performance? This study has focused on identifying clearly the pertinent and most significant discernable factors, established the relationships between such factors, as well as the importance of these factors to the employees. 1.3 Purpose of the Study The purpose of this study was to determine factors that influence employee performance at the Fairmont Norfolk Hotel. 1.4 Research Questions This study was guided by the following research questions: 1.4.1 To what extent does remuneration impact employee performance at the Fairmont Norfolk Hotel? 1.4.2 To what extent does creativity impact employee performance at the Fairmont Norfolk Hotel? 1.4.3 To what extent does training and development impact employee performance at the Fairmont Norfolk Hotel? 6 1.5 Significance of the Study The following stakeholders will benefit from this study: 1.5.1 The Fairmont Norfolk Hotel Organizations are unremittingly trying to modify, endure, accomplish and impact. Nonetheless, they are not always effective. Apprehending what they can or should change in terms of improving their capability to achieve, such organizations conduct organizational assessments. This analytic tool can assist organizations to acquire valuable data about their performance, identification of important factors that support or deter their achievement of results and positioning themselves with respect to their competitors. 1.5.2 The Hotel Industry The hotel industry is a numerous billion dollar industry that generally depends on the disposable income and availability of vacation time. A hospitality unit such as a hotel or restaurants consists of numerous groups such as direct operations, management, human resources, facility maintenance and marketing. Therefore, this research will help managers in such industries to improve their employees‟ performance so that they are able to keep up with the increasing competition in the hotel industry market. 1.5.3 Employees Employees are able to track their performance by finding out if they have completed their errands that were assigned by their supervisor within specific period of time. Since individual good performance is a step towards the achievement of organizational aims. 1.5.4 Scholars Scholars will also benefit in terms of the contribution to the general body of knowledge in the broad area of Performance. This will not only enhance the understanding of factors influencing performance of employees in organization but also enable the development of further areas of research interest. 1.6 Scope of the Study This study was conducted at the Fairmont Norfolk Hotel in Nairobi, Kenya. The research design adopted here was descriptive. The study population consisted of 320 employees who 7 worked at various departments. The departments found at the hotel included the following: Front Office, Housekeeping, Laundry, Kitchen, Stewarding, Catering and Banquet, Food and Beverage Service, Health Club, Human Resources, Security, Procurement, Executive Office, Engineering, Sales and Reservations. The respondents‟ of the study consisted of all employees working in the above departments. With respect to time dimension, the study covered the period between February 2014 to June 2014. The most significant limitation faced by the researcher was trying to convince the employees to fill the questionnaires. However, this was overcome by proper explanation on the relevance of the questionnaires to both the employees and the organization. 1.7 Definition of Terms 1.7.1 Organizational Culture This refers to patterns and assumptions that are shared and learned by a certain group as it tries to solve problems of internal integration and external adaptation and therefore, considered valid since they have worked well. Hence, they are taught to new members (Schein, 1992). 1.7.2 Employee Performance Employee performance refers to behaviors that are relevant to organizational goals and which are under the control of individual employees (Campbell, McCloy, Oppler and Sager, 1993). 1.7.3 Performance Management According to Martinez (2001), performance management is essentially about measuring, monitoring and enhancing the performance of staff, which is a contributor to overall organizational performance. 1.7.4 Motivation Bartol and Martin (1998) consider motivation as a powerful tool that reinforces behavior and triggers the tendency to continue. In other words, motivation is an internal drive to satisfy an unsatisfied need and to achieve a certain goal. It could also mean a process that starts through a psychological or physiological need that enables the stimulation of performance geared by a goal. 8 1.7.5 Productivity According to Landy and Conte (2007), productivity refers to the ratio of effectiveness (output) to the cost of achieving that level of effectiveness (input). 1.8 Chapter Summary This chapter has outlined the background of the problem, statement of the problem, purpose of the study, research questions, significance of the study, scope of the study and definition of terms. In chapter two literature review will be explored by the researcher .Chapter three will address research methodology adopted in this study. In chapter four results and findings will be explored and finally in chapter five discussions, conclusions and recommendations will be delved in. 9 CHAPTER TWO 2.0 LITERATURE REVIEW 2.1 Introduction This chapter will present a review of relevant theoretical and empirical literature on factors that influence employee performance such as remuneration, creativity and training and development in relation to the research questions: To what extent does remuneration impact employee performance at the Fairmont Norfolk Hotel? To what extent does creativity impact employee performance at the Fairmont Norfolk Hotel? To what extent does training and development impact employee performance at the Fairmont Norfolk Hotel? 2.2 Impact of Remuneration on Employee Performance Good remuneration has been found over the years to be one of the policies the organization can adopt to increase their workers performance and thereby increase the organizations productivity. Also, with the present global economic trend, most employers of labor have realized the fact that for their organizations to compete favorably, the performance of their employees goes a long way in determining the success of the organization (Muogobo, 2013). Bussin (2002) believes that, most organizations today have been adjusting and re-arranging themselves in most aspects in order to compete in the 21st century, but that in general remuneration systems have unfortunately been left lagging behind. He suggests that, extra effort is invested in order to allow remuneration and reward policies and strategies to catchup with organizations‟ business strategy. Bussin (2002) continues to propose an evolvement of remuneration policies through a consistent process he calls the pay continuum. He describes a model of the pay continuum as having five distinct stages. These stages typically present broad guidelines or indicators of the way through which organizations develop their remuneration policies and the further along the continuum an organization has moved, the stronger and more competitive their remuneration policy becomes. During the first stage, pay is centrally managed by the organization and emphasis is placed on internal equity. Stage two is characterized by the fact that, the pay process has been decentralized by the organization and more emphasis has been placed on the external market. An organization‟s pay system has progressed to stage three once performance becomes the focus. Team and organizational unit performance measures 10 are introduced. Stage four is characterized by a pay system that communicates organization‟s business goals and requirements. Finally, once pay and reward becomes customer-focused and the team becomes the key organizational performance-based unit, the organization has reached the final stage in remuneration and reward design. 2.2.1 Salary When it comes to our jobs, salary becomes the most obvious motivational factor. Employees compete constantly for positions which offer quick and easily accessible rewards. At times, employees sacrifice other motivational factors to attain job satisfaction. That is why whenever any associate got good pay in another hotel or another service sector he / she moves (Panwar and Gupta, 2012). Muogobo (2013) goes ahead and assert that, good remuneration or rather salaries that is paid at the right time has been found over the years to be one of the policies the organization can adopt to increase their workers performance and thereby increase the organization‟s productivity. Further, money is one of the inducement which is fundamental ; no other motivational method or rather incentive comes closer to it in regards to its influential nature (Rynes et al., 2004). Money has the preeminence to magnetize, uphold and inspire employees towards attaining high performance. Frederick Taylor and his scientific management colleague affirmed that, the most essential factor in inspiring the industrial workers to achieve greater output is money (Adeyinka et al., 2007). All organizations use promotion, pay, bonuses or other types of rewards inorder to inspire and push for a high level of performances by their employees (Reena et al., 2009). Inorder to use salary effectively as a motivator, managers must put into consideration the structures of the salary which should include the significance of the organization attached to each job, recompense according to employee performance, individual or unique allowances, pensions and fringe benefits (Adeyinka et al., 2007). In addition, salary is also considered a vital determinant factor for performance increment of employees and has also been seen to influence the decision of employees in regards to them leaving or staying in the organization (Kline and Hsieh, 2007). Moreover, there is an effective relationship between performance improvement of employees and payments based on performance. So every employee tries to put more effort in order to produce more units to earn more in the long run. Payments based on performance motivate employees to be more creative 11 when it comes to effort generation. Due to payments based on performance, employees who are capable tend to earn more than workers who are simply ordinary (Lazear, 1999). Using case studies of different firms, it can be concluded that, when the system changes from the system salary paid per month to daily wages, production increases immensely. This means that employee performance would increase because of increased wages (Lazear, 1999). In fruit pickers‟ case, when the pay system was shifted from the incentive pay, the progression of employees increased (Bandiera et al., 2005). In addition, bonuses based on performance given by the management are capable of enhancing the output of employees. Moreover, managers usually emphasizes on recruiting and retaining the best employees who are capable, by shifting them from piece rate system to salary, this is as far as posts of higher management are concerned. The main reason of indulging in this activity is to provide more appropriate incentives so that efficient man power is retained in the organization (Bandiera et al., 2007). 2.2.2 Employee Benefits Employee benefits over the past copious decades have developed in importance. Employee benefits are the membership-based and nonfinancial rewards offered to attract and keep employees (Decenzo and Robbins, 2002). Worldatwork (2010) assert that, benefits form part of the five key elements that constitute Total Reward Package. These are compensation, performance and recognition, career opportunities and development, work-life balance and benefits. According to Armstrong (2009), employee benefits are elements of remuneration given in addition to the various forms of cash pay. They also include items that are not strictly remuneration such as annual holidays. According to Herberg‟s two factor theory (motivation and hygiene), an employee benefits programme is a necessary and sufficient working condition. The hygiene factor will affect employees‟ work-motivation which in turn affects organizations‟ productivity (Hong, Yang, Wang, Chiou, Sun and Huang, 1995). The plan and the management of the benefits programs are frequently affected by the vibrant changes occurring inside and outside the organization. Organizational factors that are inside are termed inner alignment variables they include the following; business strategies, organization values, nature of the jobs and the outcomes level. While the outside organizational factors also identified as outer competitive variables they include the following; the government policy, laws and rules, economic force, possession, culture and mores (Henderson, 2006; Milkovich and Newman, 2007). Bearing in mind the above factors, 12 nearly all organizations have their paradigms shift from a customary work based benefits such as social needs and leisure time, obligatory allocations and welfare, to one that is emphasizing on contribution of employees such as benefit packages which are flexible (Henderson, 2006). Many scholars believe that in order to assist employees in fulfilling their requirements and expectations, as well as improving their standards of living and statutes in society, the management should allocate the type, level or number of benefits correctly based on all the criteria (Williams, 1995; Williams, Malos and Palmer, 2002). As a result, employees would support the organizational strategies and goals of human resource management (Henderson, 2006; Milkovich and Newman, 2007). Further, the development of the early compensation system greatly focused on the properties of the benefits program which are internal. For instance, a lot of researches explained the meaning, aim, kinds and significance of benefits program and also a process on how the distribution of non-financial incentives to all employees will be done in the organizations (Henderson, 2006; Williams, 1995). In addition, studies in regards to this area reveals that, when organizations distribute the types of benefits properly, this might influence employees‟ outcomes, particularly employee performance. For instance, official obligation claims, health benefits and promotion are recognized as being the most significant types of benefit. Allocation of these benefits based on job and individual performance would lead to the overall organizational performance (Henderson, 2006; Williams, 1995). Furthermore, benefits could be used as a means to achieve overall organizational goals, such as increasing the employee confidence and magnetizing and retaining high-quality employees; nonetheless, they go ahead and assert that, through operation of benefits programmes, benefits can also have an effect on employee stance and performance (Sutton, 1986; McCaffrey, 1987). 2.2.2.1 Medical Insurance As an employee benefit, the medical insurance usually covers physician costs, fees for the surgeon, drugs prescribed by the doctor and hospital accommodation. Moreover, as part of overall benefits package, visual care and dental could also be offered (Beam and McFadden, 2004). 13 2.2.2.2 Paid Time Off Paid time off is provided for the purpose of relaxation, rest and a planned interruption from the workplace or to attend to personal affairs. Paid time off is to be taken within the year accrued in order to receive the personal replenishment value intended. The paid time off is earned by the employees while working. The most common types of this employee benefit include holidays, vacation leave and sick leave (Beam et al., 2004). 2.2.2.3 Retirement Benefits Retirement benefits are funds which are set aside to avail people with pension or income after the ending term of their career. The common categories fitting in retirement plans include defined benefit plans and defined contribution plans. Pension entitlement is funds received by employees on retirement in relation to the size of funds accumulated by the combined contributions of the employer and the employee, the rate of return on the investment of the accumulated fund and the rate of return on an annuity purchased by the employer (Beam et al., 2004). 2.2.2.4 Leave Travel Allowances Leave travel allowances are provided by most hotels to their employees. Employees are given extra amount in the form of travel allowance and vacations with pay. Moreover, to ensure the wellbeing of an employee, vacations become vital. In addition, such benefit favor employees who need to spend time with their family and/ or who need time to care for their aging parents (Panwar and Gupta, 2012). 2.2.2.5 Meals Employee meals tend to vary between restaurants but usually involve one free or discounted item per shift. Every restaurant does this differently, depending on budget, food type or corporate rules. Furthermore, free meals are considered to be of paramount importance to most employees who work in hotel industries, because they improve employee morale. Therefore, employers try as much as possible to provide free meals per day, unlimited amount of soft drinks and coffee to their employees (Jerris, 1999). 14 2.2.2.6 Uniform Hotel uniforms are a unique niche in the apparel market. Hotels usually provide two set of uniforms to their employees which are laundered in the hotel itself. Therefore, creating a cohesive uniform program for your entire hotel staff, from the front office desk uniforms to restaurant aprons, maintenance work shirts and overalls, should be a hotel business and passion (Panwar and Gupta, 2012). 2.2.3 Employee Bonus According to McNamara (2008), employers pay performance bonuses to employees who achieve satisfactory or high ratings during their annual performance appraisals. An incentivebased bonus links the amount of the payment to the level of performance. For instance, an employee whose overall performance rating is outstanding or the highest level achievable may receive the largest bonus the company has determined it will pay each employee. An employee whose rating is satisfactory or above may receive a lesser amount, but a bonus nonetheless. The built-in incentive for employees is to strive for high performance throughout the entire evaluation period, which means their performance must be consistently high for a 12-month period if the company conducts annual performance appraisals. The impact of giving employees a bonus is that, employees remind themselves month after month that their efforts and hard work will be rewarded at the end of the year. A company that gives its employees bonuses is bound to motivate them to perform highly (Dohmen and Falk, 2007). Furthermore, Mwita (2002) concludes by stating that, the performance incentive bonus scheme is the logical process by which an organization includes its employees as individuals and team members, in refining organizational effectiveness in the achievement of organizational goals and mission. This information is further backed up by Kanji (2005) who stated that, performance Incentive Bonus Scheme is a pillar of any individual life and organization. He further states that, once employees appreciate what needs to be done and when and why/what is to be done, then the organization will achieve its goals and employees will feel empowered. 2.3 Impact of Creativity on Employee Performance Creativity remains an elusive and intangible contributor to workplace performance and change despite emphases from psychoeconomic perspectives (Cohen and Levinthal, 1990; 15 Runco and Rubenson, 1992; Zahra and George, 2002); agreement on the definition of the construct remains unresolved. Although creativity serves as the mantra for organizations competing in the global economy, Florida and Goodnight (2005) point out that, businesses have been unable to pull these notions of creativity together into a coherent management framework despite their assertion that a company„s most important asset is not raw materials, transportation systems, or political influence, it„s creative capital an arsenal of creative thinkers whose ideas can be turned into valuable products and services. Although Amabile„s (1996) definition of creativity has been widely accepted as the production of novel and useful ideas in any domain. Cowdroy and De Graaff (2005) defined what is understood by the idea of creativity rather than what is meant by the word creativity, providing a mindful view of different venues encompassed in creativity research. The idea of creativity embraces a multiplicity of notions, including imagined (conceptual) ideas, development of schemata such as constructs, analogies and diagrams emanating from the ideas and physical execution of ideas (the activity of making, and performing and created products resulting from the ideas such as works of art, manuscripts and performances). Further, creativity has also been described in terms of people, product, environment and process. Within the context of this investigation, creativity is thus defined as the ability to approach the situation at hand with a fresh perspective and link together previously unrelated or uncombined concepts to generate new and unexpected ideas that solve a problem or capture an opportunity (Stegmeier, 2008). Amabile (1998) asserts that, to encourage creativity organizations need to create a climate that support and enable the creative thinking of employees. In addition, organizations should try to get rid of barriers that might hinder creativity and enhance factors that enable creativity. Further, Andriopolous (2001) identified five major organizational dimensions under which characteristics and behaviors that enhance or inhibit creativity in a work environment. Those dimensions are skills, organizational structure and systems, organizational culture, leadership style and resources and organizational climate. Furthermore, Stegmeier (2008) goes ahead and assert that, the necessity for organizations to manage and create creative capability, transform new concepts into value in competitive markets and subsequently into profits for the firm introducing the innovation, has been a driving force for business leaders to better understand the dynamics of creativity and 16 innovation, and to develop and execute strategies to leverage the workforce, intellectual capital and the physical workplace in order to increase innovative output for the organization. Basadur and Gelade (2006) maintains that, organizations need to improve performance to capitalize on rapid change and establish or regain a competitive edge and hence creativity becomes important to organizations because, creative contributions can not only help organizations become more efficient and more responsive to opportunities, but also help organizations adapt to change, grow and compete in the global market. Researchers have mentioned that some level of creativity is needed in almost any job (Shalley, Gilson and Blum, 2000; Unsworth, 2001; Ford, 2000). Specifically, creativity influences innovation implementation. For example, when considering the tasks performed by Research and Development professionals, employee creativity is desirable and necessary. Shalley et al., (2004) further indicated that, even for the jobs of cashiers or assembly line workers, an incremental change in how work can be done efficiently is still dependent on employ creativity. To date, the focus of prior work on the importance of leadership for creativity (Mumford, Scott, Gaddis, and Strange, 2002) has predominantly centered on the relationship between leader behaviors and employee creativity and the creativity of the leader themselves (Sternberg and Vroom, 2002). Nonetheless, the vicinity where managers can impact employee‟s creativity strongly is through their clout on the environment in which the employees work. Therefore, while much has been written about the direct link between leader behaviors and creativity, less has been written about the more indirect, yet potentially equally or more important, relationship among leadership, context and creativity (Shalley et al., 2004). 2.3.1 Recognition As noted by Danish and Usman (2010), a situation where employees of the organization are rewarded based on different status is called recognition.Employees high performance and job satisfaction would be attributed to intrinsic factors or rather rewards such as recognition, opportunities, feedback and growth. Gong et al., (2009) concurs with the above statement by stating that, inorder to increase employee performance one of the significant factor that should be considered and which falls under the non financial rewards is recognition. 17 According to Yaseen (2013), an employee is deemed as being loyal to their organization whenever their efforts are rewarded. Many organizations are believed to be missing this component percieved as valuable yet the cost of its implementation is negligle if not insignificant. Employees appreciate the value of being recognised as they feel that they are part and parcel of the organizational growth at large (Sarvadi, 2005). When you recognize employees they feel valued and wanted and thus contributes towards the overall organizational performance and satisfaction which is normally attributed to the employees themselves. Finally, Barton (2002) opined that, recognition is the most significant factor among nonfinancial rewards in order to increase job satisfaction level of employees. It is through recognition that organizations are able to strengthen the relationship between the management leadership and the employees. Recognition brings about motivation and hence the employees remain competititive and give their all towards the realization of organizational success. 2.3.2 Out of the Box Thinking Thinking out of the box leadership is used to support the accomplishment of the mission or vision of an organization or group of people and it is an approach to organizational development. An organization that encourages employees to think out of the box will at the same time be giving opportunity to these employees to perform better. In a world that is ever changing with new technologies and processes, it is becoming necessary for organizations to encourage their employees to be innovative and think out of the box in order to ensure their continued success and stay competitive. In order to adapt to new changes, the need for innovation in organizations has resulted in a new focus on the role of leaders in shaping the nature and success of creative efforts.Without innovative and out of the box leadership, organizations are likely to struggle. This new call for out of the box thinking represents the shift from the 20th century traditional view of organizational practices, which discouraged employee innovative behaviors, to the 21st century view of valuing innovative thinking as a potentially powerful influence on employee and organizational performance (Carmeli and Schaubroeck, 2007). 18 2.3.4 Dynamic Flow of Ideas According to Ohly and Fritz (2010), all businesses are created first by ideas. Then once you are in business you need ideas for design, engineering, manufacturing, marketing, advertising, creative problem solving and customer retention. A company that encourages a dynamic flow of ideas also enjoys the advantage of high employee performace. The difference between success or failure in busines could be just one idea. Idea management systems and processes can help a company make innovation a discipline. They can help make the hunt for new possibilities each and every department's business, as well as involve broader and more enthusiastic participation among managers and employees. Disciplined and well managed creativity, breeds successful idea generation. Corporations have limited resources, funds and time to give creative dreamers free reign to magically produce new ideas. However, most companies are not short on new ideas, but they are short on ways to assess, screen, prioritize and execute those new ideas (Danish and Usman, 2010). 2.3.5 Role Expectations and Goals The occurrence of creative activity through goal setting could be a way in which leaders would influence. Goals influence motivation through their impact on self-regulatory mechanisms (Kanfer and Ackerman, 1989) and research has indicated that goal setting is an extremely effective motivational technique (Locke and Latham, 1990). Amabile and Gryskiewicz (1987) claimed that, a critical factor for high creativity for management was having a set of clear organizational goals. In contrast, when employees did not know what management desired, because no clear goals were given, they felt that lower levels of creativity resulted. In a study of 400 project teams, Pinto and Prescott (1988) found that, a clearly stated mission enabled teams to focus on the development of new ideas and subsequently predicted successful innovation. Thus, interested leaders who encourage activities which are creative should set goals which are creative too. A creativity goal can be a stated standard that an individual‟s output should be creative (i.e., novel and appropriate) or that individuals should attempt to engage in activities that could lead to creative outcomes (e.g., flexible thought, playing with ideas, environmental scanning, and data gathering (Shalley et al., 2004). Several studies have found that when individuals know that creativity is important they are more likely to actually be creative for example, (Manske and Davis, 1968; Speller and Schumacher, 1975) in a series of studies, Shalley 19 (1991; 1995) found that assigned creativity goals effectively enhanced creative performance. Similarly, Carson and Carson (1993) found that, individuals who were assigned a creativity goal performed more creatively than those not assigned a creativity goal. A related way in which leaders can foster the occurrence of creativity is by making it a requirement of the job, in other words, explicitly or implicitly making it known that creativity is required to perform the job effectively. Research has shown that employees can accurately identify when creativity is required by their job (Shalley et al., 2000). In addition, appropriate requirements and goals should be set by leaders to motivate employees to be more creative. At the same time, they need to be aware that if job requirements or goals are set for behaviors that may not result in creative outcomes or may directly contradict engaging in creative activities, then employees may exhibit less creativity in their jobs (Shalley et al., 2004). 2.3.6 Rewards Kerr (1977) wrote a seminal piece on the dangers of rewarding A while hoping for B. This analogy can be applied to creativity, where employees are rewarded in accordance with past behaviors and yet new practices, processes or outcomes are desired. Because an organization‟s culture and reward system may have a significant impact on creativity, it is important that leaders make it clear to employees how performance will be rewarded. For instance, if creativity is a role expectation, it should be rewarded appropriately. Rewards can be monetary or non-monetary, such as recognition or praise. The work by Amabile (Amabile, 1988; Amabile, Goldfarb, and Brackfield, 1990) has suggested that, it is intrinsic motivation rather than the expectation of receiving extrinsic rewards that fosters creativity. Amabile (1998) who writes that, creativity is truly enhanced when an entire organization supports it. Senior people therefore, must put in place appropriate structures and systems which emphasis that creative effort is a top priority within the organization. She proposes that, organizations that aim to support creativity should consistently reward it, taking care to avoid using money to pay people to come up with innovative ideas. She also suggests that, organizational leaders need to minimize infighting, politicking and gossip as they are particularly damaging to creativity. She also argues that, this sort of negativity can have severe consequences for creative contribution. However, Eisenberger and Armeli (1997) have argued that rewards are not, in and of themselves, bad for creativity but two critical factors that need to be considered are what 20 types of behaviors are being rewarded and how the rewards are distributed. For instance, they argue that, rewards can be used to convey important information to employees and it is this informational component of rewards that is linked to both intrinsic motivation and ultimately creativity. 2.3.7 Supervisory Support The link between supervisory support and creativity has been relatively well established in the literature (Shalley et al., 2004) for example, Andrews and Farris (1967) found that, scientists‟ creativity was higher when managers listened to their employees‟ concerns and asked for their input into decisions affecting them. Andrews and Gordon (1970) found that negative feedback from leaders inhibited scientists‟ creativity. Redmond, Mumford, and Teach (1993) affirmed that, greater subordinate creativity was as a result of leader‟s behaviors contributing to problems of construction and feelings of high self-efficacy. Scott and Bruce (1994) found that, the quality of the exchange or relationship between a supervisor and his or her subordinate (i.e., leader-member exchange, LMX) was related to the subordinate‟s innovativeness. Furthermore, they asserted that, the employees‟ perception of the existence of an innovation-supportive climate quality of the relationship was related to the quality of the relationship. Correspondingly, Oldham and Cummings (1996) established that, creating a work environment which is non-controlling and supportive by supervisor‟s fostered creativity. Furthermore, Tierney, Farmer and Graen (1999) found that, open interactions with supervisors and the receipt of encouragement and support lead to enhanced employee creativity. Studies also have indicated that, the results for supportive supervision can vary for those with different personality characteristics or cognitive styles (Shalley et al., 2004) for instance, Tierney et al., (1999) found out that, factors that affected creativity include, motivation, employees‟ intrinsic, LMX and cognitive style. Moreover, for creative performance, there were significant interactions between employee and leader intrinsic motivation and between LMX and employee cognitive style. Oldham and Cummings (1996) established that, employees with high scores on the Creative Personality Scale (Gough, 1979) and who worked on complex jobs and were supervised in a supportive and non-controlling fashion had the highest numbers of patent disclosures and supervisor creativity ratings. Finally, George 21 and Zhou (2001) found that one of the Five-Factor Personality traits, conscientiousness was related to creative behavior and interacted with close monitoring such that conscientious individuals who were monitored too closely by their supervisors and had unsupportive coworkers, had low levels of creativity. 2.3.8 Job Characteristics Job characteristics objective has a history of being significant when it comes to influencing employees‟ motivation and attitudes towards their work settings (Hackman and Oldham, 1975). Based on Amabile‟s (1988) creativity model, job characteristics ought to be an essential constituent that leaders must consider when they manage creativity. Regarding job characteristics, it has been recommended that the structure of the job contributes to inventive output at work (creativity) and intrinsic motivation of employees (Oldham and Cummings, 1996). For instance, when jobs become demanding and complex, employees pay more attention to the tasks at hand by considering different alternatives which would result in more creative outcomes in the long run. On the other hand, jobs that are more simple and routinized may not motivate employees or allow them the flexibility to try new ways of doing things, to take risks and potentially to perform creatively. In support of this, Shalley et al., (2000) found that when the work environment complemented the creative requirements of the job, individuals had higher job satisfaction and lower intentions to turnover. Therefore, leaders need to think about objective job characteristics as they differentiate between jobs. For example, is the job designed to be sufficiently challenging to motivate individuals to be creative? Taken together, the key is to provide employees with jobs that are sufficiently challenging but not so over stimulating that employees feel overwhelmed and unable to break out of habitual ways of doing their work (Shalley et al., 2004). Finally, autonomy as a job characteristic has received the most attention (Ford and Kleiner, 1987). Research suggests that, creativity of employees could be enhanced when individuals feel they have some autonomy on how their work is to be conducted or planned. However, we note that, managers become cautious of giving too much autonomy to their employees. Conversely, giving apposite autonomy levels to employees may be helpful (Shalley et al., 2004). For example, in a study of R&D professionals, Bailyn (1988) found that these individuals did not expect to have full autonomy and were satisfied with being able to determine the approach they took to their research after the agenda had been set (Shalley et al., 2004). 22 2.4 Impact of Training and Development on Employee Performance Training and development has been acknowledged to be a very important factor of organizational performance .However, it is not an end goal rather training is characterized as a means to an end , the end being productive, efficient work organizations, populated by informed workers who see themselves as significant stakeholders in their organizations‟ success (Barney, 1991). Training and development is basically directed at employee but its ultimate impact goes to organization, because the end user of its benefits is the organization itself (Raja et al., 2011). Many organizations have over the years introduced good manpower training and development strategies in order to enhance better employee performance at work and increase their productivity. However, the efforts of such strategies in most cases have always been jeopardized in most organizations, as a result of some factors that impede against the achievement of their objectives. Some of the impeding factors include recruitment/selection problems, training procedure and inadequate facilities, government policy, the economy and labor legislation (Nguyen, 2009). Further, Heathfield (2012) assert that, the right development, education and employee training at the right time, usually bring big payoffs for the organization in relation to increase in knowledge, productivity, contribution and loyalty. In regards to the above, Brody (1987) quotes a Motorola company spokesperson as saying “we have documented the savings from the statistical process control methods and problem solving methods we have trained our people in. We run a rate of return of about 30 times the dollars invested – which is why we have gotten pretty good support from senior management”. This is a clear indication that, a systematic and well planned training and development policy that is well executed would surely bring returns to the organization in cost savings (reducing in waste and scrap for example, increased productivity and so on), employee effectiveness and efficiency and the list could go on and on. 2.4.1 Employee Training The success or failure of any organization or business basically relies on the performance of employees. No wonder they are termed as valuable, non-imitable and rare resource of a firm. Thus, having this in mind, organizations are willingly investing in training programs to develop their employees. Training employee effectively is considered important when it comes to performance improvement of employees, since it enhances employee level and 23 competency of the firm and it provides support when it comes to filling the gap between what exactly is performance if required and what performance is happening, that is a gap between the performance that is desired and the actual performance of employee. Therefore, training becomes an important requirement in the organization or rather workplace. Without it, employees do not have a firm grasp on their responsibilities or duties (Elnaga and Imran, 2013). Moreover, one of the most important aspects in the contemporary hotel industry is employees‟ acquaintance with new methods and techniques of hotel management through training. In fact training is formal as well as an informal process, which is carried out for improving the performance of employees. Therefore, the implementation of an effective training process at all levels of management has a significant impact on the performance of the employees (Ul Afaq, Yusoff, Khan, Azam and Thukiman, 2011). Moving on, effective training programs are systematic and continuous. In other words, training must be viewed as a long term process, not just an infrequent and/or haphazard event (Tannenbaum and Yukl, 1992; Wexley and Latham, 1991). Assessments of employee and organizational needs as well as business strategies should be conducted and then used in selecting training methods and participants (Goldstein, 1991). Training programs that are consistent with employee and organizational goals and needs and fit with the business strategy will meet with greater success than those that are not (Wexley and Latham, 1991). Preferably, employees will be trained based on the results of assessments of their work. Finally, according to Singh and Muhanty (2012), for training to be effective, various methods must be used because adults learn in different ways. Some individuals need written documents while others need to hear the information spoken aloud. Some do well in classroom settings and others excel through e-learning. However, all training should have one thing in common: it should incorporate application. To read or hear about something is not enough; successful training requires theory, demonstration as well as application. 2.4.1.1 Opportunities to Learn New Skills and Cross Train One very important responsibility of a supervisor or manager is to help your staff with their professional and career development. You can do this by providing opportunities for them to develop the knowledge, skills, abilities, tools, resources and opportunities to be successful in their job and career. Examples include providing on-the-job training and coaching, giving 24 them performance goals and feedback, asking about and supporting their development goals and helping them write an individual development plan (IDP). Consequently, an organization that provides opportunity for employees to learn new skills and cross train with others directly increases on the performance of those employees (Raja et al., 2011). 2.4.2 Employee Development Employee development is the most crucial Human Resource Management function in the organization and it refers to developing employees and organization‟s abilities as a whole (Elena, 2000). Therefore, there is a direct association between development of employees and their performance. When employees become more developed, they tend to be more content with the job, more dedicated with the job and hence performance would eventually heighten. Hence, organizational effectiveness will be achieved when the performance of employee increases (Champathes, 2006). Further, activities involved in employee development are important, when an employee performs the activities; it‟s an indication that the organization is concern about their workers development (Elena, 2000). According to Hameed and Waheed (2011), a lot of organizations are investing in developing employees. When organizations contribute towards developing employee activities, the employees put more effort and make use of their skills to attain organizational goals. 2.4.2.1 Link of Training and Development to Strategic Path Apospori et al., (2008) suggest that, one of the best kept secrets in modern management is how to align the training program with organization‟s strategic path and how to measure the alignment. Traditional methods fail flat because, they focus on what “The Manager” (or the teacher) wants. It is common knowledge that the organizational training program (when there is one) should be aligned with organizational overall objective. Once those goals have been stated, a weak alignment means low effectiveness, high costs, low morale and lost opportunities. A successful training program manager in short, has seen the vision, understands the mission and knows what it takes to reach the business goals. The training program manager must also understand how and why people learn. By properly aligning training to the strategic path of the organization will increase employee performance (Colombo et al., 2008). 25 2.4.2.2 Employee Inspiration to Take Initiative in Their Own Career Development In a healthy organization, each member knows where everybody else is going. Each member, not just the manager, knows what it will take to get there and is empowered to plan and develop his or her own skills. An effective learning organization gives all members a reason to improve, an environment where they are not afraid of failure and the resources they need to learn (Nguyen, 2009). If you do not have such an organization, you may want to go back to the drawing board. If you are among the lucky ones, you still need a training program and a training program manager. Never mind the title: you need an individual with a clear understanding of your organization at the strategic, tactical and operational levels; an individual who knows what it takes to execute the business plans and understands how to build the skills needed to make products and services the customer wants to pay for (Abeeha and Bariha, 2012). 2.4.2.3 Coaching Coaching is one of the most important activity when it comes to developing of employees. In coaching, employees are treated as individual partner in attaining both individual and organizational goals. Hence, coaching can be used by employees to solve problems (Agarwal et al., 2006).When problems get resolved, it would lead to enhancement in performance of the organization since employees would be in a position to attain goals of the organization (Hameed and Waheed 2011). 2.4.2.4 Developmental Centers’ and 360 Degree Feedback Development Centers and the 360 Degree Feedback are based on a defined preceding assessment criteria and are generally preplanned. Development Centers presence outside and inside the organizations are usually important since they provide training to employees (Hazucha et al., 1993). Moreover, employee development is only possible when employees have the drive to be developed (Hameed and Waheed 2011). 2.4.2.5 Competitive Advantage Developmental activities of employees are not usually considered to be having much value by most organizations. The managers only center on achieving organizational goals. They are not concerned about the employee development. However, enhancement of employee skills 26 will only be possible if developmental activities of employees are put into consideration by the organization (Chey et al., 2003). 2.5 Chapter Summary This chapter has presented a review of pertinent theoretical and empirical literature on factors that influence employee performance according to the three research questions: To what extent does remuneration impact employee performance at the Fairmont Norfolk Hotel? To what extent does creativity impact employee performance at the Fairmont Norfolk Hotel? To what extent does training and development impact employee performance at the Fairmont Norfolk Hotel? The next chapter will present the research methodology that was used to conduct this study. 27 CHAPTER THREE 3.0 RESEARCH METHODOLOGY 3.1 Introduction This chapter presents the research methodology that was adopted and followed by the researcher in the process of conducting the study and therefore, it focused on the following: research design, population and sampling design (population, sampling design, sampling frame, sampling technique, and sample size), data collection methods, research procedures and data analysis methods. 3.2 Research Design There are many definitions of research design but no one definition imparts the full range of its important aspects. There are five essentials of research design: an activity and time based plan, a plan always based on the research question, a guide for selecting sources and types of information, a framework for specifying the relationships among variables of the study and a procedural outline for every research activity (Cooper and Schindler, 2011). This study used the descriptive survey research design. A descriptive study is concerned with finding out who, what, where, when or how much? Descriptive studies are structured with clearly stated hypothesis or investigative questions and they serve a variety of study objectives which include: making descriptions of phenomena or characteristics associated with a subject; making estimates of the proportions of a population that have these characteristics and also discovery of associations among different variables which is sometimes referred to as a correlation study, a subset of descriptive studies (Cooper and Schindler, 2011). Hence, a descriptive survey research was appropriate for this study because this study was concerned with finding out factors that influence employee performance at the Fairmont Norfolk Hotel. 28 3.3 Population and Sampling Design 3.3.1 Population “Population refers to the elements about which we wish to make some inferences” (Cooper and Schindler, 2006: p. 722). While “population element refers to the individual participant or object on which the measurement is taken. It is the unit of study” (Cooper and Schindler, 2006: p. 402). The population of this study consisted of 320 employees who worked at the Fairmont Norfolk Hotel. Table 3.1 Population Distribution No Department Total Population 1 2 3 4 5 6 7 8 9 10 11 12 13 14 15 16 Front Office House Keeping Laundry Kitchen Stewarding Catering and Banquet F&B Service Health Club Human Resources Security Procurement Finance Executive Office Engineering Reservations Sales Total 34 28 23 39 17 10 58 9 5 9 13 31 5 17 10 12 320 Percentage of Entire Population 10.63 8.75 7.19 12.19 5.31 3.13 18.13 2.81 1.56 2.80 4.06 9.69 1.56 5.31 3.13 3.75 100% 3.3.2 Sampling Design In this section, detailed description of sampling frame, sampling technique and the actual sample size will be provided. 29 3.3.2.1 Sampling Frame “A sample frame refers to a list of elements in the population from which the sample is actually drawn‟‟ (Cooper and Schindler, 2006: p.725). “However, as a practical matter, the sampling frame often differs from the theoretical population because of errors and omissions” (Cooper and Schindler, 2006: p.411). Just how much inaccuracy one can tolerate in choosing a sampling frame is a matter of judgment (Cooper and Schindler, 2011).The sampling frame for this study included employees in various departments working at the Fairmont Norfolk Hotel and the information was be obtained from the Human Resource Department. 3.3.2.2 Sampling Technique This study used a stratified random technique. “A stratified random technique refers to the probability sampling that includes elements from each of the mutually exclusive strata within a population” (Cooper and Schindler, 2006: p.727). In stratified random sampling, the strata are formed based on members‟ shared attributes or characteristics. A random sample from each stratum was taken in a number proportional to the stratum‟s size when compared to the population. These subsets of the strata were then pooled to form a random sample. The main advantage with stratified sampling is how it captures key population characteristics in the sample. Similar to a weighted average, this method of sampling produces characteristics in the sample that are proportional to the overall population. Stratified sampling works well for populations with a variety of attributes, but is otherwise ineffective, as subgroups cannot be formed (Zikmund, Babin, Carr and Griffin, 2010). 3.3.3.3 Sample Size “A sample refers to a group of cases, participants, events or records consisting of a portion of the target population, carefully selected to represent that population” (Cooper and Schindler, 2006: p.725). “Some of the principles which influence sample size comprises of the following: the greater the dispersion or variance within the population, the larger the sample must be, the narrower or smaller the error range, the larger the sample must be, the higher the confidence level in the estimate, the larger the sample must be and the greater the number of subgroups of interest within a sample, the greater the sample size must be, as each sub group must meet minimum sample size requirements” (Cooper and Schindler, 2006: p.413). 30 As noted by Saunders, Lewis and Thornhill (2009), the formula for calculating the sample size include the following: n= p% * q% * (2 / e% )2 A worst case scenario would have p at 50% at a 95% level of confidence within an error of ± 10, this yields a sample of 97 employees as shown below: n= 50 * 50 *(1.96 / 10)2 = 97 employees However, Saunders, Lewis and Thornhill (2009) suggested that, if the population is less than 1000, then the sample size can be adjusted without affecting accuracy using this formula; n= n / (1) + (n / N) The final sample size adopted for this study was therefore 74 respondents. Table 3.2 Sample Size No Department Total Population 1 2 3 4 5 6 Front Office House Keeping Laundry Kitchen Stewarding Catering and Banquet F&B Service Health Club Human Resources Security Procurement Finance Executive Office Engineering Reservations Sales Total 7 8 9 10 11 12 13 14 15 16 Sample Size 34 28 23 39 17 10 Percentage of Entire Population 10.63 8.75 7.19 12.19 5.31 3.13 58 9 5 18.13 2.81 1.56 14 2 1 9 13 31 5 17 10 12 320 2.80 4.06 9.69 1.56 5.31 3.13 3.75 100% 2 3 7 1 4 2 3 74 31 8 7 5 9 4 2 3.4 Data Collection Methods “The gathering of data may range from a simple observation at one location to a grandiose survey of multinational corporations at sites in different parts of the world. The method selected will largely determine how the data are collected” (Cooper and Schindler, 2006: p.77). Hence, for this study, a structured questionnaire was adopted. The structured questions usually offer the benefits of attaining the most information possible from the limited space on the form. In addition, they also facilitate the analysis of data from a large number of participants on a repeat basis. Further, the questionnaire was divided into four parts: Section A was designed to collect general information about the respondents. Section B looked at how remuneration factors influenced employee performance at the Fairmont Norfolk Hotel. Section C was designed to collect information on the impact of creativity on employee performance. Finally, section D was designed to collect information on how training and development impact employee performance. 3.5 Research Procedures The data collection instrument: a self - administered structured questionnaire was developed by the researcher based on the research questions. This data collection instrument was then pilot tested with 5 respondents from each department. Problems that arose during pilot testing of the data collection instruments were resolved through adjustments based on these problems, before administering it on the whole study sample (which is also the population).When the revision of the instruments were made, the study sample was subjected to the instrument used to collect the data. Finally, methods such as drop and pick later and follow ups through reminders via email and telephone were adopted to improve rate of responses. 3.6 Data Analysis Methods According to Cooper and Schindler (2011), managers need information and not raw data. Researchers generally generate information by analyzing the data after it has been collected. “Data analysis refers to the process of editing and reducing accumulated data to a manageable size, developing summaries, looking for patterns and applying statistical techniques” (Cooper 32 and Schindler, 2006: p.713). This study used statistical methods to analyze data that is, descriptive statistics: mean, median and mode as a measure of central tendency and measures of dispersion such as standard deviation, variance, percentiles, range and quartiles. Moreover, inferential statistics T-test was used to determine the factors that influence employee performance and its impact on employees. Statistical Package for Social Scientist (SPSS) version 21 and Microsoft Excel 2010 were also used to analyze the data. The study results were presented in tables and charts. 3.7 Chapter Summary This chapter has presented the research methodology that was adopted to conduct this study. It has outlined the research design, population and sampling design, data collection methods, research procedures and data analysis methods. The next chapter will present the results findings of this study. 33 CHAPTER FOUR 4.0 RESULTS AND FINDINGS 4.1 Introduction This chapter has presented the results and findings of this study. It has focused on the following: general information; the impact of remuneration on employee performance; the impact of creativity on employee performance and the impact of training and development on employee performance. Further, statistical methods such as, descriptive statistics; mode, median and mean as a measure of central tendency and measures of dispersion such as quartiles, percentiles, variance, standard deviation and range were used to analyze the data. Moreover, inferential statistics T-test was used to determine the factors that influence employee performance. Statistical Package for Social Scientist (SPSS) version 21 and Microsoft Excel 2010 was also used to analyze the data. Additional, tables and charts were used to present the study results. 4.2 General Information The general information section for this chapter comprised of the gender, age group, number of years of service in the organization, department of employment and employment status. This information was sought in order to ascertain the respondents‟ demographic characteristics. 4.2.1 Gender of Respondent The purpose of this question was to find out the gender distribution of the various respondents in the hotel. The results of the findings are presented in the Figure 4.1. The results showed that 56.8% of the respondents were male and 43.2% of respondents were female. Male respondents were more than female respondents by 13.6% 34 Figure 4.1 Gender of Respondent 4.2.2 Age of Respondent The purpose of this question was to find out the age groups of different respondents at the hotel. The purpose of this question was to determine if there was inconsistency of data as stated by the respondents. The results of the findings are presented in the Table 4.1. The findings showed that 23% of the respondents were between 20-39 years of age, 36.5% were between 30-39 years, 24.3% were between 40-49 years, 10.8% were between 50-59 years and 5.4% were above 60 years of age. 35 Table 4.1 Age of Respondent Frequency Percent Valid Percent Cumulative Percent Valid 20-29 17 23.0 23.0 23.0 30-39 27 36.5 36.5 59.5 40-49 18 24.3 24.3 83.8 50-59 8 10.8 10.8 94.6 Above 60 4 5.4 5.4 100.0 74 100.0 100.0 Total 4.2.3 Department of Service This particular research question sought to determine the various departments in which the respondents in the hotel worked. The results of the findings are presented in the Table 4.2. The findings presented showed that most employees work in the Kitchen department with 14.9% of the respondents and the front office department with 14.9% of the respondents. The smallest number of respondents worked in the food and beverage service department with 1.4% of the respondents and the Human Resources department with 1.4% of the respondents. 36 Table 4.2 Department of Respondent Frequency Percent Valid Front Office Valid Percent Cumulative Percent 11 14.9 14.9 14.9 House Keeping 8 10.8 10.8 25.7 Laundry 5 6.8 6.8 32.4 Kitchen 11 14.9 14.9 47.3 Stewarding 5 6.8 6.8 54.1 Catering and Banquet 3 4.1 4.1 58.1 Food and Beverage Service 1 1.4 1.4 59.5 Health Club 2 2.7 2.7 62.2 Human Resources 1 1.4 1.4 63.5 Security 4 5.4 5.4 68.9 Procurement 2 2.7 2.7 71.6 Executive Office 2 2.7 2.7 74.3 Sales 4 5.4 5.4 79.7 Engineering 6 8.1 8.1 87.8 Reservations 2 2.7 2.7 90.5 Finance 7 9.5 9.5 100.0 74 100.0 100.0 Total 4.2.4 Years of Service This question sought to discover how many years the various respondents had worked in the hotel. The findings are presented in the Table 4.3. The results showed that 39.2% of the employees had served in the organization for less than 5 years, 43.2% had served for 5-10 years, 14.9% had served for 11-15 years, 1.4% had served for 21-25 years and 1.4% had served for 26-30 years in the hotel. 37 Table 4.3 Years of Service Valid Percent Frequency Percent Cumulative Percent Valid Less Than 5 29 39.2 39.2 39.2 5-10 32 43.2 43.2 82.4 11-15 11 14.9 14.9 97.3 21-25 1 1.4 1.4 98.6 26-30 1 1.4 1.4 100.0 Total 74 100.0 100.0 4.2.5 Employment Status This question sought to find out the employment status of the various respondents. The findings can be observed in the Table 4.4. The findings showed that 75.7% of the respondents were fulltime employees in the hotel, 17.6% were employees on contract, 5.4% were part time and 1.4% of the respondents were casual workers. Table 4.4 Employment Status Frequency Percent Valid Full Time Valid Percent Cumulative Percent 56 75.7 75.7 75.7 Contract 13 17.6 17.6 93.2 Part Time 4 5.4 5.4 98.6 Casual Worker 1 1.4 1.4 100.0 74 100.0 100.0 Total 38 4.3 Impact of Remuneration on Employee Performance 4.3.1 Benefits Received This question sought to find out if employees received any benefits at the hotel. The findings are presented in the Figure 4.2. The results showed that 100% of the respondents agreed that they received some benefits at the hotel. Figure 4.2 Benefits Received 4.3.2 Benefit Satisfaction This question was aimed at finding out whether employees were satisfied with the kind of benefits that the hotel was providing to them. The results can be assessed in the Figure 4.3. 39 The findings to this question showed that 66.2% of the respondents agreed that they were satisfied with the benefits provided by the hotel while 33.8% were of the view that the benefits provided were not satisfactory. Figure 4.3 Benefit Satisfaction 4.3.3 Importance of Benefits This question sought to find out to what extent the respondents believed the benefits they were receiving were important to them. The findings are shown in the Table 4.5. The findings showed that 45.9% of the respondents were of the say that the benefits were important and 41.9% were of the say that the benefits were very important. The total cumulative percentage of employees who believed that benefits were important was 87.8. 40 Table 4.5 Importance of Benefits Frequency Valid Percent Valid Percent Cumulative Percent Not Important 2 2.7 2.7 2.7 Neutral 7 9.5 9.5 12.2 Important 34 45.9 45.9 58.1 Very Important 31 41.9 41.9 100.0 Total 74 100.0 100.0 4.3.4 Impact of Benefits on Performance This question particularly sought to discover if the benefits received by the respondent had an impact on their performance at work. The findings can be seen in the Figure 4.4. The findings showed 93.2% of the respondents believed that the benefits offered by the hotel had an impact on their level of performance while 6.8% of respondents believed that benefits did not have any impact on their performance. 41 Figure 4.4 Impacts of Benefits on Performance 4.3.5 Payment on Time This question sought to find out the degree to which the employee believed they were always paid on time by their employer. The findings can be seen in the Table 4.6. The results showed that 58.1% of employees agreed that they are paid on time while 27% strongly agreed. The cumulative percentage total of all those in agreement that they are paid on time by their employer was 85.1 42 Table 4.6 Payment on Time Frequency Valid Percent Valid Percent Cumulative Percent Strongly Disagree 5 6.8 6.8 6.8 Disagree 3 4.1 4.1 10.8 Neutral 3 4.1 4.1 14.9 Agree 43 58.1 58.1 73.0 Strongly Agree 20 27.0 27.0 100.0 Total 74 100.0 100.0 4.3.6 Bonus Given When Goals are Achieved by Employees This question sought to find out the degree to which employees agreed that they are given a bonus when they achieve their set goals. The findings can be seen in the Table 4.7. The results obtained showed that 63.5% of the respondents agreed that they are given a bonus when they achieve their set goals and 23% of the respondents strongly agreed to the same. The total cumulative percentage of all those in agreement to this statement was 86.5 Table 4.7 Bonus Given When Goals are Achieved by Employees Frequency Valid Percent Valid Percent Cumulative Percent Strongly Disagree 2 2.7 2.7 2.7 Disagree 4 5.4 5.4 8.1 Neutral 4 5.4 5.4 13.5 Agree 47 63.5 63.5 77.0 Strongly Agree 17 23.0 23.0 100.0 Total 74 100.0 100.0 43 4.3.7 Motivation by Wages and Salaries This research question sought to find out the degree to which the respondents were motivated by the wages and salaries paid by their employer. The findings can be seen in the Table 4.8. The findings showed that 56.8% of the respondents agreed that they are motivated by the wages and salaries and 28.4 % of respondents strongly agreed. The total cumulative percentage of all those in agreement to the statement was 85.2 Table 4.8 Motivation by Wages and Salaries Frequency Valid Percent Valid Percent Cumulative Percent Strongly Disagree 3 4.1 4.1 4.1 Disagree 2 2.7 2.7 6.8 Neutral 6 8.1 8.1 14.9 Agree 42 56.8 56.8 71.6 Strongly Agree 21 28.4 28.4 100.0 Total 74 100.0 100.0 4.3.8 Individual Impact of Remuneration on Employee Performance Factors In reference to Table 4.9, the results showed that the average response of respondents on the factor of employees being paid on time by the employer was 3.95 (Agree). This therefore showed that most of the respondents agreed that being paid on time by the employer had an influence on their performance. Further, the bonus given by the employer when goals are achieved had an average response of 3.99 meaning that the respondents agreed that this factor indeed had an influence on employee performance. On the degree to which employees are motivated by salaries and wages had an average response rate of 4.03 which is the highest among the three factors meaning that this factor indeed influenced employee performance. 44 The mode or the most frequent score of the respondents in relation to the above factors was 4. The range or difference between the highest and lowest score was 4. The average deviation of the sample means from the population mean for employees being paid on time by the employer was 0.122, while the bonus given by the employer when goals are achieved had a standard error of 0.101 and finally, on the degree to which employees are motivated by salaries and wages was 0.107 (standard error of the mean). The measure of the average deviation of each score from the mean for employees being paid on time by the employer was 1.045, while for the bonus given by the employer when goals are achieved was 0.868 and finally the degree to which employees are motivated by salaries and wages had standard deviation of 0.921 (standard deviation).The measure of asymmetry in the distribution of scores for employees being paid on time by the employer was -1.590, while for the bonus given by the employer when goals are achieved was -1.524 and finally, the degree to which employees are motivated by salaries and wages had a skewness of 1.567 (skewness). 45 Table 4.9 Individual Impact of Remuneration on Employee Performance Factors Payment on Time Bonus Given when Goals are Achieved by Employees Motivation by Wages and Salaries 74 74 74 0 0 0 Mean 3.95 3.99 4.03 Std. Error of Mean .122 .101 .107 Median 4.00 4.00 4.00 4 4 4 Std. Deviation 1.045 .868 .921 Variance 1.093 .753 .849 Skewness -1.590 -1.524 -1.567 .279 .279 .279 Range 4 4 4 Minimum 1 1 1 Maximum 5 5 5 292 295 298 25 4.00 4.00 4.00 50 4.00 4.00 4.00 75 5.00 4.00 5.00 N Valid Missing Mode Std. Error of Skewness Sum Percentiles 46 4.3.9 Impact of Remuneration on Employee Performance In reference to Table 4.10, the results showed that the significance level of all the remuneration factors was 0.000 (P<0.05) which is within the acceptable level. This means that remuneration had an impact on employee performance. Table 4.10 One-Sample Test Test Value = 0 t Df Sig. (2tailed) Mean Difference 95% Confidence Interval of the Difference Lower Payment on Time Upper 32.469 73 .000 3.946 3.70 4.19 Bonus Given when Goals 39.513 73 are Achieved by Employees .000 3.986 3.79 4.19 Motivation by Wages and Salaries .000 4.027 3.81 4.24 37.606 73 4.4 Impact of Creativity on Employee Performance 4.4.1 Opportunity to be Creative This research question was aimed to discover whether employees believed they were given an opportunity to be creative by their employer. The results can be seen in the Figure 4.5. The findings showed that 93.2% agreed that they are given an opportunity to be creative by their employer while 6.8% of the respondents disagreed with this statement. 47 Figure 4.5 Opportunity to be Creative 4.4.2 Reward for Creativity This question sought to find if employees believed that they were being rewarded if they showed a degree of creativity. The results can be seen in the Figure 4.6 The results showed that 55.4% of the respondents agreed that they are rewarded by their employer when they show some level of creativity while 44.6% disagreed with this statement. 48 Figure 4.6 Reward for creativity 4.4.3 Recognition for Creativity This question sought to find out the degree to which employees feel they are recognized by the hotel if they show creativity in their work. The findings can be seen in the Table 4.11. The findings showed that 56.8% of respondents agreed that they are recognized by the hotel when they show some level of creativity while 20.3% strongly agreed. The total cumulative percentage of all those respondents in agreement with this statement was 77.1 49 Table 4.11 Recognition for Creativity Frequency Valid Percent Valid Percent Cumulative Percent Strongly Disagree 2 2.7 2.7 2.7 Disagree 4 5.4 5.4 8.1 Neutral 11 14.9 14.9 23.0 Agree 42 56.8 56.8 79.7 Strongly Agree 15 20.3 20.3 100.0 Total 74 100.0 100.0 4.4.4 Degree to Which the Hotel Has an Out of the Box Outlook and a Go for it Attitude The purpose of this question was to determine the degree to which employees believed the hotel has an out of the box outlook and a go for it attitude. The results are presented in the Table 4.12. The findings showed that that 60.8% of the respondents agreed that the hotel has an out of the box outlook and a go for it attitude and 20.3% of the respondents strongly agreed to this statement. The total cumulative percentage of all those respondents in agreement is 81.1 50 Table 4.12 Degree to Which the Hotel Has an Out of the Box Outlook and a Go for it Attitude Frequency Valid Percent Valid Percent Cumulative Percent Strongly Disagree 1 1.4 1.4 1.4 Disagree 2 2.7 2.7 4.1 Neutral 11 14.9 14.9 18.9 Agree 45 60.8 60.8 79.7 Strongly Agree 15 20.3 20.3 100.0 Total 74 100.0 100.0 4.4.5 The Degree to Which the Hotel Encourages a Dynamic Flow of Ideas This question sought to find out the extent to which the hotel encouraged a dynamic flow of Ideas. The findings are presented in the Table 4.13. The findings showed that 44.6% of the respondents agreed that the hotel encourages a dynamic flow of Ideas while 35.1% of the respondents strongly agreed. The total cumulative percentage of all the respondents who agreed that the hotel encourages a dynamic flow of ideas is 79.7 Table 4.13 Degree to Which the Hotel Encourages a Dynamic Flow of Ideas Frequency Valid Strongly Disagree Percent Valid Percent Cumulative Percent 3 4.1 4.1 4.1 Neutral 12 16.2 16.2 20.3 Agree 33 44.6 44.6 64.9 Strongly Agree 26 35.1 35.1 100.0 Total 74 100.0 100.0 51 4.4.6 Impact of Creativity on Employee Performance In reference to Table 4.14, the results showed that, the average response of respondents on the factor of recognition for creativity by the employer was 3.86 (Agree). This therefore showed that most of the respondents agreed that recognition for creativity by employer had an influence on their performance. Further, the degree to which the hotel had an out of the box outlook and a go for it attitude had an average response of 3.96 meaning that the respondents agreed that this factor indeed had an influence on employee performance. To finish off, the degree to which the hotel encourages a dynamic flow of ideas had an average response rate of 4.07 which is the highest among the three factors meaning that this factor indeed influenced employee performance. The mode or most frequent score of the respondents in relation to the above factors was 4. The range or difference between the highest and lowest score was 4. The average deviation of the sample means from the population mean for recognition for creativity by employers was 0.104, while the degree to which the hotel had an out of the box outlook and a go for it attitude had a standard error of 0.089 and lastly, the degree to which the hotel encourages a dynamic flow of ideas had a standard error of 0.109 (standard error of the mean). The measure of the average deviation of each score from the mean for recognition for creativity by employers was 0.896, while the degree to which the hotel has an out of the box outlook and a go for it attitude had a standard deviation of 0.766 and the degree to which the hotel encourages a dynamic flow of ideas had a standard deviation of 9.41 (standard deviation).The measure of asymmetry in the distribution of scores for recognition for creativity by employers was -1.135, while the degree to which the hotel had an out of the box outlook and a go for it attitude had a skewness of -1.056 and lastly, the degree to which the hotel encourages a dynamic flow of ideas had a skewness of -1.353 (skewness). 52 Table 4.14 Impact of Creativity on Employee Performance Recognition for Creativity N Valid Degree to Which the Hotel Has an Out of the Box Outlook and a Go For It Attitude Degree to Which the Hotel Encourages a Dynamic Flow of Ideas 74 74 74 0 0 0 Mean 3.86 3.96 4.07 Std. Error of Mean .104 .089 .109 Median 4.00 4.00 4.00 4 4 4 Std. Deviation .896 .766 .941 Variance .803 .587 .886 -1.135 -1.056 -1.353 .279 .279 .279 Range 4 4 4 Minimum 1 1 1 Maximum 5 5 5 286 293 301 25 4.00 4.00 4.00 50 4.00 4.00 4.00 75 4.00 4.00 5.00 Missing Mode Skewness Std. Error of Skewness Sum Percentiles 53 4.4.7 Impact of Creativity on Employee Performance In reference to table 4.15, the results showed that the significance level of all the creativity factors was 0.000 (P<0.05) which is within the acceptable level. This means that creativity had an impact on employee performance. Table 4.15 One-Sample Test Test Value = 0 T Df Sig. Mean (2Difference tailed) 95% Confidence Interval of the Difference Lower Upper Recognition for Creativity 37.092 73 .000 3.865 3.66 4.07 Degree to Which the Hotel Has an Out Of the Box Outlook and a Go for It Attitude 44.442 73 .000 3.959 3.78 4.14 Degree to Which the Hotel Encourages A Dynamic Flow of Ideas 37.178 73 .000 4.068 3.85 4.29 4.5 Impact of Training and Development on Employee Performance 4.5.1 Degree to Which Hotel Provides Training This question sought to find out the degree to which respondents agree that the hotel provides training for its employees. Findings are presented in the Table 4.16. The findings showed that 70.3% of the respondents agreed that the hotel provided training for its employees and 21.6% of the respondents strongly agreed to this statement. The total cumulative percentage of all those in agreement that the hotel provides training for its employees was 91.9. 54 Table 4.16 Training Provided by the Hotel Valid Frequency Percent Valid Percent Cumulative Percent Disagree 2 2.7 2.7 2.7 Neutral 4 5.4 5.4 8.1 Agree 52 70.3 70.3 78.4 Strongly Agree 16 21.6 21.6 100.0 Total 74 100.0 100.0 4.5.2 Link of Training and Development Opportunities to Strategic Path of the Hotel This question sought to find out the degree to which employees believed that the training and development opportunities are visibly linked to the strategic path of the hotel. The findings are presented in the Table 4.17. The findings showed that 56.8% of respondents agreed that the training and development opportunities were visibly linked to the strategic path of the hotel and 32.4% of the respondents strongly agreed. The total cumulative percentage of all the respondents in agreement with the statement was 89.2. Table 4.17 Link of Training and Development Opportunities to Strategic Path of the Hotel Frequency Valid Percent Valid Percent Cumulative Percent Strongly Disagree 1 1.4 1.4 1.4 Disagree 3 4.1 4.1 5.4 Neutral 4 5.4 5.4 10.8 Agree 42 56.8 56.8 67.6 Strongly Agree 24 32.4 32.4 100.0 Total 74 100.0 100.0 55 4.5.3 Employee Inspiration to Take Initiative in Determining Career Development This question sought to discover the degree to which the employees are inspired to take initiative in determining their own career development. The results are presented in the Table 4.18. The findings showed that 45.9% of the respondents agreed that they are inspired to take initiative in determining their career development and 45.9% strongly agreed. The total cumulative percentage of all those respondents in agreement with the statement was 91.8 Table 4.18 Employee Inspiration to Take Initiative in Determining Career Development Frequency Valid Percent Valid Percent Cumulative Percent Strongly Disagree 1 1.4 1.4 1.4 Disagree 4 5.4 5.4 6.8 Neutral 1 1.4 1.4 8.1 Agree 34 45.9 45.9 54.1 Strongly Agree 34 45.9 45.9 100.0 Total 74 100.0 100.0 4.5.4 Opportunities for Employee to Learn New Skills and Cross train This question sought to find out the extent to which employees believed there were opportunities for them to learn new skills and cross train. The findings are presented in the Table 4.19. The findings showed that 41.9% agreed that there were opportunities for them to learn new skills and cross train and 48.6% strongly agreed. The total cumulative percentage of all the respondents in agreement with the statement was 90.5. 56 Table 4.19 Opportunities for Employee to Learn New Skills and Cross Train Frequency Valid Percent Valid Percent Cumulative Percent Neutral 7 9.5 9.5 9.5 Agree 31 41.9 41.9 51.4 Strongly Agree 36 48.6 48.6 100.0 Total 74 100.0 100.0 4.5.5 Impact of Training and Development on Employee Performance In reference to table 4.20, the results established that, the average response of respondents on the factor of training provided by the hotel was 4.11 (Agree). This therefore shows that most of the respondents agreed that the training provided by the employer had an influence on their performance. Further, the factor of linking of training and development opportunities to strategic path of the hotel had an average response of 4.15 meaning that, the respondents agreed that this factor indeed had an influence on employee performance. On the degree to which the employees are inspired to take initiative in determining their own career development had an average response rate of 4.30 and finally the opportunities for employees to learn new skills and cross train had an average response of 4.39 meaning that, this factor indeed influenced employee performance. The mode or most frequent score of the respondents in relation to training provided by the hotel was 4, while the factor of linking training and development opportunities to strategic path of the hotel was 4, while the degree to which the employees are inspired to take initiative in determining their own career development had a mode of 4a and finally opportunities for employees to learn new skills and cross train had a mode of 5. The range or difference between the highest and lowest score for training provided by the hotel was 3, for the factor of linking training and development opportunities to strategic path of the hotel was 4, while the degree to which the employees are inspired to take initiative in determining their own career development had a range of 4 and finally the opportunities for employees to learn new skills and cross train had a range of 2. 57 The average deviation of the sample means from the population mean for training provided by the hotel was 0.071, while the factor of linking training and development opportunities to strategic path of the hotel was 0.094, on the other hand, the degree to which the employees are inspired to take initiative in determining their own career development had a standard error of 0.099 and finally, opportunities for employees to learn new skills and cross train was 0.077 (standard error of the mean). The measure of the average deviation of each score from the mean for training provided by the hotel was 0.610, while for the factor of linking training and development opportunities to strategic path of the hotel was 0.806, on the other hand, the degree to which the employees are inspired to take initiative in determining their own career development had a standard deviation of 0.856 and finally opportunities for employees to learn new skills and cross train had a standard deviation of 0.658 (standard deviation). The measure of asymmetry in the distribution of scores for training provided by the hotel was 0.801, while the factor of linking training and development opportunities to strategic path of the hotel was -1.411, Further, the degree to which the employees are inspired to take initiative in determining their own career development had a skewness of -1.699 and finally, opportunities for employees to learn new skills and cross train had a skewness of -0.624 (skewness) 58 Table 4.20 Impact of Training and Development on Employee Performance Training Provided by the Hotel N Valid Link of Training and Development Opportunities to Strategic Path of the Hotel Employee Inspiration to Take Initiative in Determining Career Development Opportunities for Employee to Learn New Skills and Cross Train 74 74 74 74 0 0 0 0 Mean 4.11 4.15 4.30 4.39 Std. Error of Mean .071 .094 .099 .077 Median 4.00 4.00 4.00 4.00 4 4 4a 5 Std. Deviation .610 .806 .856 .658 Variance .372 .649 .732 .433 Skewness -.801 -1.411 -1.699 -.624 .279 .279 .279 .279 Range 3 4 4 2 Minimum 2 1 1 3 Maximum 5 5 5 5 Sum 304 307 318 325 Percentiles 25 4.00 4.00 4.00 4.00 50 4.00 4.00 4.00 4.00 75 4.00 5.00 5.00 5.00 Missing Mode Std. Error of Skewness 59 4.5.6 Impact of Training and Development on Employee Performance In reference to Table 4.21, the results showed that the significance level of all training and development factors was 0.000 (P<0.05) which is within the acceptable level. This means that training and development had an impact on employee performance. Table 4.21 One-Sample Test Test Value = 0 T df Sig. (2tailed) Mean Difference 95% Confidence Interval of the Difference Lower Upper Training Provided by the Hotel 57.963 73 .000 4.108 3.97 4.25 Link of Training and Development Opportunities to Strategic Path of the Hotel 44.305 73 .000 4.149 3.96 4.34 Employee Inspiration to Take Initiative in Determining Career Development 43.198 73 .000 4.297 4.10 4.50 Opportunities for Employee to Learn New Skills and Cross Train 57.391 73 .000 4.392 4.24 4.54 4. 6 Chapter Summary This chapter has presented the results and findings of this study. It has focussed on the following: general information; the impact of remuneration on employee performance; the impact of creativity on employee performance and the impact of training and development on employee performance. The next chapter will present the discussions, conclusions and recommendations of this study. 60 CHAPTER FIVE 5.0 DISCUSSIONS, CONCLUSIONS AND RECOMMENDATIONS 5.1 Introduction This chapter provides a discussion based on the results and findings of chapter four. These results and findings were specifically based on the research questions and the literature review presented in chapter two. Further, the summary of the study and the recommendations for further research were delved in. 5.2 Summary The purpose of this study was to determine factors that influence employee performance at the Fairmont Norfolk Hotel. The following research questions guided this study: To what extent does remuneration impact employee performance at the Fairmont Norfolk Hotel? To what extent does creativity impact employee performance? To what extent does training and development impact employee performance at the Fairmont Norfolk Hotel? This study used the descriptive survey research design .The study population consisted of 320 employees who worked at various departments. The departments found at the hotel included the following: Front Office, Housekeeping, Laundry, Kitchen, Stewarding, Catering and Banquet, Food and Beverage Service, Health Club, Human Resources, Security, Procurement, Executive office, Engineering, Sales and Reservations. Further, a sample size of 74 respondents was selected randomly from the approximate target population. Besides, this study used a stratified random sampling technique to select the members of a sample. The data collection instrument for the study was a self-administered structured questionnaire developed by the researcher. Further, this study used statistical methods such as, descriptive statistics; mode, median and mean as a measure of central tendency and measures of dispersion such as quartiles, percentiles, variance, standard deviation and range were used to analyze the data. Moreover, inferential statistics T-test was used to determine the factors that influence employee performance. Statistical Package for Social Scientist (SPSS) version 21 61 and Microsoft Excel 2010 was also used to analyze the data. Additional, tables and charts were used to present the study results. The findings regarding the impact of remuneration on employee performance showed that, employees generally agreed that if they are given good salaries and bonuses plus their remuneration being paid on time, their performance at the organization is positively impacted. Furthermore, in regards to the impact of creativity on employee performance, the researcher found out that, respondents are of agreement that the degree to which the organization embraces creativity has an impact on their performance. It should however be noted that, some creativity factors ranked higher than others in terms of preference by the respondents. Finally, findings regarding the impact of training and development on employee performance showed that, a large number of employees believe that if the organization embraces training and development then their performance will be impacted and improve. Nonetheless, it should also be noted that, not all training and development factors had the same ranking. 5.3 Discussions 5.3.1 Impact of Remuneration on Employee Performance The findings indicated that 85.1% of the respondents were in agreement that the employer always pays them on time and that this had an impact on their performance. This is in agreement with Muogobo (2013) who argued that, good remuneration that is paid at the right time had been found over the years to be one of the policies the organization can adopt to increase their workers performance and thereby increase the organizations productivity. The findings showed that 45.9% of the respondents were of the say that, the benefits were important. This finding is in agreement with Hong, Yang, Wang, Chiou, Sun and Huang, (1995) who asserted that, according to Herberg‟s two factor theory (motivation and hygiene), an employee benefits programme is a necessary and adequate working situation. Moreover, the hygiene factor will have an adverse effect on employees‟ work-motivation and thus productivity. To concur with the above, Armstrong (2009) asserted that employee benefits are elements of remuneration given in addition to the various forms of cash payment and included items that are not strictly remuneration such as annual holidays. 62 The findings showed that 100% of the respondents agreed that they receive some benefits at the hotel. This finding is in agreement with Worldatwork (2010) who asserted that, benefits form part of the five key elements that constitute Total Reward Package. These are compensation, performance and recognition, career opportunities and development, work-life balance and benefits. The findings showed that 93.2% of the respondents believed that the benefits offered by the hotel had an impact on their level of performance. This finding is in agreement with Henderson, (2006); and Williams, (1995) who said that further research in this area reveals that distributing benefit types properly may directly influence individual outcomes, especially job performance. For example, medical benefits, official duty claims and promotion are identified as the most important benefit types. If these benefits are properly allocated based on job and performance, this can lead to an enhanced job performance in organizations. The findings showed that 86.5% of the respondents are in total agreement that they are given a bonus by the employer when they achieve their set goals and that this had an impact on their performance. This finding is in agreement with those of Dohmen and Falk (2007) who stated that, the impact of giving employees a bonus is that employees reminded themselves month after month that their efforts and hard work will be rewarded at the end of the year. A company that gives its employees bonuses is bound to motivate them to perform highly. More so, according to McNamara (2008), employers pay performance bonuses to employees who achieve satisfactory or high ratings during their annual performance appraisals. An incentive-based bonus links the amount of the payment to the level of performance. Furthermore, Mwita (2002) concluded by stating that, the performance incentive bonus scheme is the logical process by which an organization includes its employees, as individuals and team members, in refining organizational effectiveness in the achievement of organizational goals and mission. This information is further backed up by Kanji (2005) who stated that, performance Incentive Bonus Scheme is a pillar of any individual life and organization. He further stated that, once employees appreciate what needs to be done and when and why/what is to be done, then the organization will achieve its goals and employees will feel empowered. The findings indicated that 85.2% of the respondents were in total agreement that the wages and salaries paid to them by their employer motivated them to perform better. This goes in 63 agreement with the observation made by Rynes et al., (2004) that money is the fundamental inducement; no other incentive or motivational technique comes even close to it with respect to its influential value. It has the supremacy to maintain , motivate and magnetize employees towards higher performance. Further, Panwar and Gupta ( 2012) goes ahead and asserted that, salaries are the most obvious motivational factor. Employees are usually competiting for positions that offer the most accessible and quickest reward. At times, other motivational factors may be sacrificed by the employees inorder to attain job satisfaction. This is why whenever any opportunity arises in another hotel in relation to good pay he or she moves. 5.3.2 Impact of Creativity on Employee Performance The findings indicated that 93.2% of respondents agreed that they are given an opportunity to be creative by their employer. This concurred with the findings of Amabile (1998) that, to encourage creativity organizations need to create a climate that supports and enables the creative thinking of employees. In addition, organizations should try to get rid of barriers that might hinder creativity and enhance factors that enable creativity. Further, Andriopolous (2001) identified five major organizational dimensions under which characteristics and behaviors that enhance or inhibit creativity in a work environment. These dimensions are skills, organizational structure and systems, organizational culture, leadership style and resources and organizational climate. Furthermore, Stegmeier (2008) asserted that, the necessity for organizations to manage and create creative capability, transform new concepts into value in competitive markets and subsequently, into profits for the firm introducing the innovation, has been a driving force for business leaders to better understand the dynamics of creativity and innovation, and to develope and execute strategies to leverage the workforce, intellectual capital and the physical workplace inorder to increase innovative output for the organization. The findings indicated that 55.4% of respondents agreed that they are rewarded by their employer when they show some level of creativity. This is in agreement with the observation made by Amabile (1998) who wrote that, creativity is truly enhanced when an entire organization supports it. Senior people therefore, must put in place appropriate structures and systems which emphasis that creative effort is a top priority within the organization. She proposed that, organizations that aim to support creativity should consistently reward it, taking care to avoid using money to pay people to come up with innovative ideas. Amabile 64 also suggested that, organizational leaders need to minimize infighting, politicking and gossiping as they are particularly damaging to creativity. She argued that, this sort of negativity can have severe consequences for creative contribution. The findings indicated that 77.1% of respondents agreed that they are recognized by the organization when they show some level of creativity and that this had an impact on their performance. This concurrred with the findings of Danish and Usman (2010) that, intrinsic rewards like recognition growth, feedback and opportunities for promotion lead employees greatly towards high job performance and satisfaction. Further, Barton (2002) described that, recognition is considered the most important factor among non-financial rewards in order to increase job satisfaction level of employees. Recognition can be said to be the component that is used to strengthen the relationship between the organization leaders and the employees. Through recognition, employees feel rewarded and motivated. By giving recognition to the employees, competitive advantage can be achieved. An organization achieves its well-being through giving rewards and recognition to its employees. The findings showed that 81.1% of the respondents agreed that the hotel had an out of the box outlook and a go for it attitude and that this had an impact on their performance. This agrees with Carmeli and Schaubroeck (2007) argument that, an organization that encouraged employees to think out of the box will at the same time be giving opportunity to these employees to perform better. Further, without innovative and out of the box leadership, organizations are likely to struggle. This new call for out of the box thinking represents the shift from the 20th century, view of traditional organizational practices, that discourages employee innovativeness to the 21st century view which values innovative thinking that is potentially powerful and which influences employee and organizational performance. The findings indicated that 79.7% of the respondents agreed that the hotel encouraged a dynamic flow of Ideas and this had an impact on their performance. This is in agreement with the observation made by Ohly and Fritz (2010) that, a company that encouraged a dynamic flow of ideas also enjoyed the advantage of high employee performance.Moreover, disciplined and well managed creativity, usually breeds a successful idea generation. More so, Corporations have limited funds, time and resources to give to those creative dreamers the free reign to magically come up with new ideas. However, most organizations are not short 65 on new innovative ideas, but they are short on ways to screen, prioritize, assess and execute those new innovative ideas (Danish and Usman, 2010). 5.3.3 Impact of Training and Development on Employee Performance The findings indicated that 91.1% of the respondents agreed that the hotel provided training for its employees and this had an impact on their performance. This is in line with an observation made by Barney (1991) that, training and development has been acknowledged to be a very important factor of organizational and employee performance. However, it is not an end goal rather training is characterized as a means to an end, whereby the end being efficient work organizations, productive, populated by the informed workers who see themselves as significant stakeholders in their organizations‟ success. Further, Heathfield (2012) concurred with above by asserting that, the right development, education and employee training, at the right time, usually bring big payoffs for the organization in relation to increase in knowledge, productivity, contribution and loyalty. In regards to the above, Brody (1987) quotes a Motorola company spokesperson as saying “we have documented the savings from the statistical process control methods and problem solving methods we have trained our people in. We run a rate of return of about 30 times the dollars invested – which is why we have gotten pretty good support from senior management” . This is a clear indication that a systematic and well planned training and development policy that is well executed would surely bring returns to the organization in cost savings (reducing in waste and scrap for example, increased productivity and so on), employee effectiveness and efficiency and the list could go on and on. The findings indicated that 89.2% of respondents agreed that, the training and development opportunities are visibly linked to the strategic path of the hotel and that this had an impact on their performance. This agrees with Colombo et al., (2008) observation that, it is common knowledge that the organizational training program (when there is one) should be aligned with organizational overall objective. Once those goals have been stated, a weak placement means it is going to have a low efficiency, high costs, low morale and low employee performance. Further, Apospori et al., (2008) suggested that, one of the best kept secrets in modern management is how to align the training program with organization‟s strategic path and how to measure the arrangement. Traditional methods do not succeed since they focus on 66 what “The Manager” (or the teacher) wants. It is common knowledge that the organizational training program (when there is one) should be aligned with organizational overall objective. The findings indicated that 91.8% of the respondents agreed that, they were inspired to take initiative in determining their career development and that this had a direct impact on their performance. These findings are in line with those made by Nguyen (2009) that, an effective learning organization gives all members a motive to progress, creating an atmosphere where employees are not scared of failure and providing resources to enable them learn better. If you do not have such an organization, you should go back to the drawing board and recheck if you are amongst the fortunate ones, you would still require a training program and a training program administrator (Abeeha and Bariha, 2012). The findings showed that 90.5% of the respondents agreed that, there were opportunities for them to learn new skills and cross train in the organization and this positively impacted their performance. Thus is in agreement with the argument of Raja et al., (2011) that, an organization that provides opportunity for employees to learn new skills and cross train with others, directly increases on the performance of those employees. Moreover, one very important responsibility of a supervisor or manager is to help your staff with their career development and professional .This is usually done by creating opportunities for them to develop skills, tools, the knowledge, resources, opportunities and abilities to be victorious in their careers and job. 5.4 Conclusions 5.4.1 Impact of Remuneration on Employee Performance The first major research question focused on finding out if remuneration had an impact on employee performance at the Fairmont Norfolk Hotel. A conclusion on this research question can be made by stating that, it was discovered that remuneration had a very strong impact on how well employees performed at the hotel. Respondents generally agreed that, if they are given good salaries and bonuses plus their remuneration being paid on time, their performance at the organization is positively impacted. 67 5.4.2 Impact of Creativity on Employee Performance The second major research question had its focus on discovering the impact of creativity on employee performance at the Fairmont Norfolk Hotel. Conclusion can be made towards this particular research question by stating that, it was discovered that the degree to which the organization embraced creativity had a strong impact on the employee performance. Respondents strongly agreed that, if the organization recognizes their creativity, embraces an out of the box attitude and encourages a dynamic flow of ideas, their performance is positively impacted and their level of productivity increases. 5.4.3 Impact of Training and Development on Employee Performance The third research question had its focus on investigating the impact of training and development on employee performance at the Fairmont Norfolk Hotel. Conclusion can be made towards this research question by stating that, respondents highly agreed that training and development at the hotel impacted their performance. Most of the respondents were in agreement that the hotel providing an opportunity for training, linking the training and development to the strategic path of the hotel and inspiring employees to take initiative in determining their own career development, had a positive impact on their overall performance at the hotel. 5.5 Recommendations 5.5.1 Recommendations for Improvement 5.5.1.1 Impact of Remuneration on Employee Performance This study has shown that the employees are of the say that, remuneration provided by their employers has an impact on their performance as confirmed by the results of the T-test. However, it was noted that some remuneration factors have ranked higher than others. It is therefore recommended that, managers prioritize and put their concentration more on those remuneration factors that will satisfy their employees highly and increase their performance as presented in the study. The factors where emphasis should be based are paying employees on time, giving sufficient salaries and awarding bonuses where it necessary. It is also recommended that, managers of the hotel avoid putting too much weight and resources towards those factors of remuneration that respondents did not feel had a serious impact on their performance. 68 5.5.1.2 Impact of Creativity on Employee Performance Findings of the study have shown that, the respondents are of agreement the degree to which the organization embraces creativity has an impact on their performance and this has been backed up by the results obtained from the T-test. It should however be noted that, some creativity factors ranked higher than others in terms of preference by the respondents. It is therefore recommended that, managers put more emphasis and concentration more on those creativity factors that appeal to the employees highly and this will in turn increase their performance as presented in the study. In relation to the findings made from the study, the recommended factors where managers should put emphasis include recognition of employees for creativity, the hotel embracing an out of the box outlook and the hotel encouraging a dynamic flow of ideas. 5.5.1.3 Impact of Training and Development on Employee Performance The study has manifested that, training and development has an impact on employee performance. A large number of employees believe that, if the organization embraces training and development then their performance will be impacted and improve and this was confirmed by the results of the T-test. It was also analyzed that, not all training and development factors had the same ranking. It is therefore recommended that, managers critically address and put more resources to those training and development factors which the employees believe highly influence their performance. These factors include the degree to which the hotel provides training, the degree to which training and development opportunities are visibly linked to the strategic path of the hotel and the degree to which the hotel inspires employees to take initiative in their own career development. 5.5.2 Recommendations for Further Research It can be confidently said that, employee performance is a very significant topic in all types of industries. This study was carried out at the Fairmont Norfolk Hotel which is a service industry. However, it is recommended that, further research should be done on the factors influencing employee performance but with a focus on the production industry. This is because the factors that may influence performance in the service industry may be unique to this industry in relation to those that may influence performance of employees in the 69 production industry. Having a clear perspective of these factors in both the types of industries would go a long way in improving performance of employees in our economy. 70 REFERENCES Abeeha, B. & Bariha, B. (2012). Effects of Employees Training on the Organizational Competitive Advantage: Empirical Study of Private Sector of Islamabad, Pakistan. Far East Journal of Psychology and Business,Vol. 6, No.1, pp.59-72. Adeyinka, M., Allen, R. & Arthur, J.B. (2007). Effects of Human Resource Systems on Manufacturing, Performance and Turnover. Academy of Management Journal, Vol. 37, pp.67-87. Agarwal, R., Angst, C. M. & Magni, M. (2006). The Performance Effects of Coaching: A Multilevel Analysis using Hierarchical Linear Modeling. Human Resource Management Journal, Vol.5, No.4, pp. 230-256. Amabile, T.M. & Gryskiewicz, S. (1987). Creativity in the R &D Laboratory. Technical Report 30. Greensboro, NC: Center for Creative Leadership. Amabile, T. M. (1988). A Model of Creativity and Innovation in Organizations. Research in Organizational Behavior, Vol.10, pp. 123-167. Amabile, T. M. (1996). Creativity in Context. San Diego, CA: Elsevier, Inc. Amabile, T. M. (1998). How to kill Creativity. Harvard Business Review, Sept -Oct, pp. 7787. Amabile, T. M., Goldfarb, P. & Brackfield, S. (1990). Social Influences on Creativity: Evaluations, Coaction and Surveillance. Creativity Research Journal, Vol. 34, pp. 6 21. Andrews, F. M. & Farris, G. F. (1967). Supervisory Practices and Innovation in Scientific Teams. Personnel Psychology, Vol. 20, pp. 497–575. Andrews, F. M. & Gordon, G. (1970). Social and Organizational Factors Affecting Innovation Research. Proceedings for the American Psychological Association, Vol.78, pp.570-589. Andriopolous, C. (2001). Determinants of Organizational Creativity. Management Decision, Vol. 39, No.10, pp. 834-838. Apospori, E., Nikandrou, I., Brewster, C. & Papalexandris, N. (2008). HRM and Organizational Performance in Northern and Southern Europe. International Journal of Human Resource Management, Vol. 19, No. 7, pp. 1187–1207. 71 Armstrong, M. (2009). A Handbook of Human Resource Management Practice. 10th Ed. London, UK: Kogan Page Ltd. Bailyn, L. (1988). Autonomy in the Industrial R&D Lab. In R. Katz (Ed.). Managing Professionals in Innovative Organizations. A Collection of Readings. Cambridge, MA: Ballinger. Bandiera, O., Barankay, I. & Rasul, I. (2005). Social Preferences and the Response to Incentives: Evidence from Personnel Data. Quarterly Journal of Economics, Vol. 120, pp. 917- 962. Bandiera, O., Barankay, I. & Rasul, I. (2007). Incentives for Managers and Inequality among Workers: Evidence from a Firm Level Experiment. Quarterly Journal of Economics, Vol. 8, pp. 729–773. Barton, G. M. (2002). Recognition at Work. Scottsdale, AZ: World at Work. Bartol, K.M. & Martin, D.C. (1998). Management. New York, NY: McGraw Hill International Editions. Barney, J. (1991). Firm Resources and Sustained Competitive Advantage. Journal of Management, Vol. 17, No.1, pp. 99-120. Basadur, M. & Gelade, G. A. (2006). The Role of Knowledge Management in the Innovation Process. Creativity and Innovation Management, Vol. 15, No.1, pp. 45-61. Bass, B. M. & Avolio, B. J. (1997). Full Range Leadership: Manual for the Multifactor Leadership Questionnaire. Palo Alto, CA: Mind Garden. Beam, B.T. & McFadden, J.J. (2004). Employee Benefits. Chicago, IL: Dearborn Financial Publishing. . Brander Brown, J. & Atkinson, H. (2001). Budgeting in the Information Age: A Fresh Approach. International Journal of Contemporary Hospitality Management, Vol. 13, No. 3, pp.136-43. Brody, J.E. (1987). Helping Workers to Work to Smart. Fortune, pp. 86-88. Bussin, M. (2002). Reward and Recognition Schemes. In The Nuts & Bolts Business Series. Randburg, SA: Knowledge Resources. 72 Cameron, J. & Pierce, W. D. (1996). The Debate about Rewards and Intrinsic Motivation: Protests and Accusations do not alter the Results. Review of Educational Research, Vol. 66, pp. 39-51. Campbell, J. P., McCloy, R. A., Oppler, S. H. & Sager, C. E. (1993). A Theory of Performance. In N. Schmitt & W. C. Borman (Eds.).Personnel Selection in Organizations. San Francisco, CA: Jossey-Bass. Carmeli, A. & Schaubroeck J. (2007). The Influence of Leaders and other Referents‟ Normative Expectations on Individual Involvement in Creative Work. Leadership Quarterly, Vol.18, pp. 35-48. Carson, P. P. & Carson, K. D. (1993). Managing Creativity Enhancement through Goal Setting and Feedback. Journal of Creative Behavior, Vol. 27, pp. 36–45. Champathes, M. R. (2006). Coaching for Performance Improvement: The Coach Model. Development and Learning in Organizations, Vol. 20, No. 2, pp.17-18. Chey, H. L., Norman T. & Bruvold, T. (2003). Creating Value for Employees: Investment in Employee Development. International Journal of Human Resource Management, Vol.14, No. 6, pp. 981–1000. Cohen, W. M. & Levinthal, D. A. (1990). Absorptive Capacity: A New Perspective on Learning and Innovation. Administrative Science Quarterly, Vol. 35, No.1, pp.128152. Colombo, E. & Stanca, L. (2008). The Impact of Training on Productivity: Evidence from a Large Panel of Firms, Available at SSRN. Cooper, D.R. & Schindler, P.S. (2011). Business Research Methods. 11th Ed. New York, NY: McGraw Hill International Editions. Cooper, D.R. & Schindler, P.S. (2006). Business Research Methods. 9th Ed. New York, NY: McGraw Hill International Editions. Cowdroy, R. & De Graaff, E. (2005). Assessing Highly-Creative Ability. Assessment and Evaluation in Higher Education, Vol. 30, No. 5, pp. 507-518. Cruz, I. (2007). How might Hospitality Organizations Optimize their Performance Measurement Systems? International Journal of Contemporary Hospitality Management, Vol. 19, No. 7, pp. 574-88. 73 Cross, K. & Lynch, R. (1989) .The SMART way to Define and Sustain Success. National Productivity Review, Vol. 8, No. 1, pp. 23-33. Danish, Q. D. & Usman, A. (2010). Impact of Reward and Recognition on Job Satisfaction and Motivation: An Empirical Study from Pakistan. International Journal of Business & Management, Vol. 5, No.2, pp. 159-167. Decenzo, D. A. & Robbins, S. P. (2002). Human Resource Management. 7th Ed. New York, NY: The Von Hoffman Press. Deci, E L. & Ryan, M. (2000). “What” and „Why” of Goal Pursuits: Human Needs and the Self Determination of Behaviour. Psychological Inquiry, Vol. 11, pp.87-100. Dessler, G. (2003). Human Resource Management. 9th Ed. New Delhi, India: Pearson Education (Singapore) Private Limited. Dohmen, T. & Falk, A. (2007). Performance Pay and Multi-Dimensional Sorting Productivity, Preferences and Gender. IZA Discussion Papers, pp. 1-66. Eisenberger, R. & Armeli, S. (1997). Can Salient Reward increase Creative Performance Without Reducing Intrinsic Creative Interest? Journal of Personality and Social Psychology, Vol. 72, pp. 652–663. Elena, P. A. (2000). Employee Development through Self-development in Three Retail Banks. Journal of Personnel Review, Vol. 29, No. 4, pp. 491-508. Elnaga, A. & Imran, A. (2013). The Effect of Training on Employee Performance. European Journal of Business and Management, Vol.5, No.4, pp.137-147. Fairmont Norfolk Hotel. (2014). Introduction. Retrieved on February 5, 2014 from http://www.fairmont.com/norfolk-hotel-nairobi. Fitzgerald, L., Johnston, R., Brignall, S., Silvestro, R. & Voss, C. (1991). Performance Measurement in Service Business. New York, NY: McGraw Hill International Editions. Flippo, E (2001). Personnel Management. New York, NY: McGraw Hill International Editions. Florida, R. & Goodnight, R. (2005). Managing for Creativity. Harvard Business Review, Vol.83, No. 7, pp. 125-131. Ford, C. (2000). Creative Developments in Creative Theory. Academy of Management Review, Vol.25, No.2, pp.284-287. 74 Ford, B. & Kleiner, B. H. (1987). Managing Engineers Effectively. Business Journal, Vol. 37, pp. 49–52. George, J. M. & Zhou, J. (2001). When Openness to Experience and Conscientiousness are Related to Creative Behavior: An Interactional Approach. Journal of Applied Psychology, Vol. 86, pp. 513–524. Ghalayini, A. & Noble, J. (1996). The Changing Basis of the Performance Measurement. International Journal of Operations & Production Management, Vol. 16, No. 8, pp. 63-80. Goldstein, I. L. (1991).Training in Work Organizations. In M. D. Dunnette & L. M. Hough (Eds.). Handbook of Industrial and Organizational Psychologists Press. Palo Alto, CA: Consulting Psychologists Press. Gomez, C. F., Yasin, M. M. & Lisboa, J. (2008). The Effectiveness of Hospitality Service Operations: Measurement and Implementation Concerns. International Journal of Contemporary Hospitality Management, Vol. 19, No. 7, pp. 560-573. Gong, Y., Huang, J. C. & Farh, J.L. (2009). Employee Learning Orientation, Transformational Leadership and Employee Creativity: The Mediating Role of Employee Creative Self-efficacy. Academy of Management Journal, Vol. 52, No.4, pp. 765-778. Gough, H. G. (1979). A Creative Personality Scale for the Adjective Check List. Journal of Personality and Social Psychology, Vol. 37, pp. 1398–1405. Hackman, J. R. & Oldham, G. R. (1975). Development of the Job Diagnostic Survey. Journal of Applied Psychology, Vol. 60, pp. 159–170. Hameed, A. & Waheed, A. (2011). Employee Development and its Effect on Employee Performance: A Conceptual Framework. International Journal of Business and Social Science, Vol. 2, No. 13, pp.23-37. Hazucha, J., Hezlett, S. & Schneider, R. (1993). The Impact of 360-degree Feedback on Management Skills Development. Human Resource Management, Vol. 32, No. 2, pp. 325-351. Heathfield, S. M. (2012). Training: Your investment on People Development and Retention. Henderson, L. (2006). Theorizing a Multiple Cultures Instructional Design Model for E Learning and E Teaching. In A Edmundson, (Ed.). Globalized ELearning Cultural Challenges .Hershey, Pennsylvania: Idea Group Inc. 75 Hong, J. C., Yang, S. D., Wang, L. J., Chiou, E. F., Sun, F. Y. & Huang, T. L. (1995). Impact of Employee Benefits on Work Motivation and Productivity. The International Journal of Career Management, Vol.7, No, 6, pp.10-14. Jerris, A. L. (1999). Human Resource Management for Hospitality. Upper Saddle River, NJ: Prentice-Hall, Inc. Jones, G. R. & George J. M. (2000). Essentials of Managing Organizational Behavior. Upper Saddle River, NJ: Prentice-Hall. Kaliprasad, M. (2006). The Human Factor II: Creating a High Performance Culture in an Organization. Technical Article Cost Engineering Journal, Vol. 48, No. 6, pp. 67-89. Kanfer, R. & Ackerman, P.L. (1989). Motivation and Cognitive Abilities: An Integrative Aptitude Treatment Interaction Approach to Skill Acquisition. Journal of Applied Psychology, Vol.74, pp.657-690. Kanji, G.K. (2005). Sustainable Growth and Business Excellence. Total QualityManagement Business Excellence, Vol. 16 No‟s 8/9, pp.1069-1078. Kaplan, R.S. & Norton, D.P. (1992). The Balanced Scorecard- Measures that Drive Performance. Harvard Business Review, Vol. 70, No. 1, pp. 71-79. Kerr, S. (1977). Substitutes for Leadership: Some Implications for Organizational Design. Organizational Administration Science, Vol.2, pp.135-146. Kiruja, Ek. & Mukuru, E. (2013). Effect of Motivation on Employee Performance in Public Middle Level Technical Training Institutions in Kenya. International Journal of Advances in Management and Economics, Vol.2, No.4, pp.73-82. Kline, S. & Hsieh, Y. (2007). Wage differentials in the Lodging Industry. Journal of Human Resources in Hospitality & Tourism, Vol. 6, pp. 69-84. Landy, F.J. & Conte, J.M. (2007). Work in the 21st Century: An Introduction to Industrial and Organizational Psychology. 2nd Ed. Oxford, UK: Blackwell Publishing. Lazear, E.P. (1999). Personnel Economics: Past Lessons and Future Directions. Journal of Labor Economics, Vol.17, No.2, pp.199-236. Linz, S.J. (1990). Motivation and Reward. A Case Study of Russian Workers. Problems of` Reforms. San Francisco, CA: Jossey-Bass Inc. 76 Locke, E.A. & Latham, G.P. (1990). A Theory of Goal Setting and Task Performance. Englewood Cliffs, NJ: Prentice-Hall. Manske, M.E. & Davis, G.A. (1968). Effect of Simple Instructional Biases upon Performance in the Unusual Uses Test. Journal of General Psychology, Vol.79, pp.25- 33. Manzoor, Q. (2012). Impact of Employees Motivation on Organizational Effectiveness. Business Management and Strategy, Vol. 3, No. 1, pp.1-12. Maritz, D. (1995). Leadership and Mobilizing Potential. Human Resource Management, Vol. 10, pp. 8-16. Marr, B. & Schiuma, G. (2003). Business Performance Measurement – Past, Present and Future. Management Decision, Vol. 41, No. 8, pp. 680-687. Martinez, J. (2001). Assessing Quality, Outcome and Performance Management. Workshop on Global Health Workforce Strategy. World Health Organization. McCaffrey, R. (1987). Organizational Performance and the Strategic Allocation of Indirect Compensation. Human Resource Planning, Vol.12, No.3, pp.229-238. McNamara, C. (2008). Employee Benefits and Compensation: Basics about Employee Motivation: Nuts-and-bolts guide to Leadership and Supervision in Business. Minneapolis, MN:Authenticity Consulting LLC. Mills, M., Wilcox, M., Neely, A. & Platts, K. (2000). Designing, Implementing and Updating Performance Measurement Systems. International Journal of Operations & Production Management, Vol. 20, No. 7, pp. 754-71. Milkovich, G.T. & Newman, T. (2007). Compensation. 5th Ed. Piano, TX: Business Publications. Muogobo, U. S. (2013). The Impact of Employee Motivation on Organisational Performance. A Study of Some Selected Firms in Anambra State Nigeria. The International Journal of Engineering and Science, Vol. 2, No. 7, pp. 70-80. Mumford, M. D., Scott, G. M., Gaddis, B. & Strange, J. M. (2002). Leading Creative People: Orchestrating Expertise and Relationships. The Leadership Quarterly, Vol.13, pp. 705–750. Mwita, J.I. (2002). The Role of Motivation in Performance Management: The Case of Performance-Related-Pay Scheme in British Local Authorities. (Thesis) 77 Neely, A. (1999). The Performance Measurement Revolution: Why Now and What next? International Journal of Operations & Production Management, Vol. 19 No. 2, pp. 205-218. Neely, A., Adams, C. & Crowe, P. (2001). The Performance Prism in Practice. Measuring Business Excellence, Vol. 5, No. 2, pp. 6-12. Nguyen, N. T. (2009). Human Resource Training, Organisational Strategy and Firm Performance in Emerging Economies: The Case of Vietnam. An Unpublished Ph. D Thesis of Department of Management, Innovation and Entrepreneurship, Ghent University. Ohly, S. & Fritz, C. (2010). Work Characteristics, Challenge Appraisal, Creativity and Proactive Behavior: A Multi-Level Study. Journal of Organizational Behavior, Vol 31, pp.543-565. Oldham, G. R. & Cummings, A. (1996). Employee Creativity: Personal and Contextual Factors at Work. Academy of Management Journal, Vol. 39.pp, 607–634. Ouchi, W. G. (2001). Theory Z. How American Business can meet the Japanese Challenge. New York, NY: Addison-Wesley. Owen, K., Mundy R., Guild, W. & Guild, R. (2001) .Creating and Sustaining the High Performance Organization. Managing Service Quality, Vol. 11, No. 1, pp. 10-21. Panwar, S. & Gupta, N. (2012). Money: Does It Really Affect Hotel Employee‟s Performance as a Motivational Factor!!! International Journal of Business and Management Research, Vol. 2, No, 2, pp. 38-46. Pinto, J. K. & Prescott, J. E. (1988). Variations in Critical Success Factors over the Stages in the Project Life Cycle. Journal of Management, Vol. 14, pp. 5–18. Poisat, P. (2006). A Critical Analysis of Organisational Strategies for Employee Engagement. Unpublished Doctoral Thesis. Nelson Mandela Metropolitan University, Port Elizabeth, South Africa. Raja, A. G. K., Furqan, A. K. & Muhammad, A. K. (2011). Impact of Training and Development on Organizational Performance. Global Journal of Management and Business Research, Vol.11, No.7.pp.63-68. Redmond, M. R., Mumford, M. & Teach, R. J. (1993). Putting Creativity to Work: Leader Influence on Subordinate Creativity. Organizational Behavior and Human Decision Processes, Vol. 55, pp.120–151. 78 Reena, A. & Ahmed, M.S. (2009). The Impact of Reward and Recognition Programs on Employee‟s Motivation and Satisfaction: An Empirical Study. International Review of Business Research Papers, Vol.5, No.4, pp.270-279. Robbins, S.P. (2003). Organizational Behavior. 10th Ed. New York, NY: PrenticeHall, Inc. Runco, M. A. & Rubenson, D. L. (1992). The Psycheconomic Approach to Creativity. New Ideas in Psychology, Vol.10, pp. 131-147. Rynes, S.L., Gerhart, B.S. & Minette, K.A. (2004).The Importance of Pay in Employee Motivation: Discrepancies between What People say and What they Do. Human Resource Management, Vol.43, No.4, pp.381-394. Sarvadi, P. (2005). The Best Way to Reward Employees. Solutions for Growing Business. Retrieved February 14, 2014, from http:www.entrepreneur.com. Sauders, M., Lewis, P. & Thornhill, A. (2003). Research Methods for Business Students. 3rd Ed. London, UK: Prentice Hall. Schein, E.J. (1992). Organizational Culture and Leadership. 2nd Ed. San Francisco, CA: Jossey Bass. Scott, S.G. & Bruce, R. A. (1994).Determinants of Innovative Behavior: A Path Model of Individual Innovation in the Workplace. Academy of Management Journal, Vol.37, pp.580-607. Shahzad, K., Bashir, S. & Ramay, M. I. (2008). Impact of HR Practices on Perceived Performance of University Teachers in Pakistan. International Review of Business Research Papers, Vol.4, No.2, pp. 110-123. Shalley, C. E. (1991). Effects of Productivity Goals, Creativity Goals and Personal Discretion on Individual Creativity. Journal of Applied Psychology, Vol.76, No.2, pp.179–185. Shalley, C. E. (1995). Effects of Coaction, Expected Evaluation and Goal Setting on Creativity and Productivity. Academy of Management Journal, Vol. 38, No.2, pp. 483–503. Shalley, C. E., Gilson, L. L. & Blum, T. C. (2000). Matching Creativity Requirements and the Work Environment: Effects on Satisfaction and Intentions to Leave. Academy of Management Journal, Vol. 43, No.2, pp. 215-223. 79 Shalley, C., Zhou, J. & Oldham, G. (2004). The Effects of Personal and Contextual Characteristics on Creativity: Where Should We Go from Here? Journal of Management, Vol. 30, No.6, pp. 933-958. Simons, R. (2000). Performance Measurement and Control Systems for Implementing Strategy: Text & Cases. Upper Saddle River, NJ: Prentice Hall. Singh, R. & Mohanty, M. (2012). Impact of Training Practices on Employee Productivity: A Comparative Study. Interscience Management Review, Vol. 2, No.2, pp. 87-92. Speller, K. G. & Schumacher, G. M. (1975). Age and Set in Creative Test Performance. Psychological Reports, Vol. 36, No.2, pp. 447–450. Spreitzer, G.M. & Quinn, R.E. (2001). A Company of Leaders: Five Disciplines for Unleashing the Power in Your Workforce. San Francisco, CA: Jossey-Bass. Sternberg, R. J. & Vroom, V. (2002). The Person versus the Situation in Leadership. The Leadership Quarterly, Vol. 13, No.3, pp. 301–323. Stegmeier, D. (2008). Innovations in Office Design: The Critical Influence Approach to Effective Work Environments. Hoboken, NJ: John Wiley & Sons. Sutton, N. (1986). Are Employees Meeting their Benefit Objectives? Benefits Quarterly, Vol 2, No. 3, pp. 14-20. Tannenbaum, S. L. & Yukl, G. (1992). Training and Development in Work Organizations. Annual Review of Psychology, Vol.43, pp.399-441. Tierney, P., Farmer, S. M. & Graen, G. B. (1999). An Examination of Leadership and Employee Creativity: The Relevance of Traits and Relationships. Personal Psychology, Vol. 52, pp. 591-620. Ul Afaq, F., Yusoff, R., Khan, A., Azam. K. & Thukiman, K. (2011). Employees‟ Training and Performance Relationship in Hospitality Sector. A Case of Pearl Continental Hotel, Karachi, Pakistan. International Review of Business Research Papers, Vol. 7. No.3, pp. 149 – 158. Wexley, K. N. & Latham, G. P (1991). Developing and Training Human Resources in Organizations. 2nd Ed. New York, NY: HarperCollins. Willcoxson, L. (2000). Defining and Creating a High Performance Organization. Australian Journal of Management & Organizational Behavior, Vol. 4, No. 1, pp. 100-106. 80 Williams, M.L. (1995). Determinants of Employee Benefit Level Satisfaction: A Test of a Model. Journal of Management, Vol.21, pp.1097-1128. Williams, M.L., Malos, S.B. & Palmer, D.K. (2002).Benefit System and Benefit level Satisfaction: An Expanded model of Antecedents and Consequences. Journal of Management, Vol.28, No.2, pp.195-215. WorldatWork. (2010). The WorldatWork Handbook of Compensation Benefits and Total Rewards. Hoboken, NJ: John Wiley and Sons, Inc. Yaseen, A. (2013). Effect of Compensation Factors on Employee Satisfaction: A Study of Doctor‟s Dissatisfaction in Punjab. International Journal of Human Resource Studies, Vol. 3, No.1, pp, 142-157. Zambon, S. (2002). Accounting, Intangibles and Intellectual Capital: an Overview of the Issues and Some Considerations. University of Ferrara, Ferrara. Zikmund, W.G., Babin, B.J., Carr, J. C. & Griffin, M. (2010). Business Research Method .8th Ed. Mason, OH: South- Western.Cengage learning. 81 Appendix A: Questionnaire Questionnaire Number......... Self-Administered Survey RE: PLEA FOR YOUR ENGROSSMENT IN MY ACADEMIC RESEARCH I am a student at United States International University pursuing a Master‟s degree in Business Administration. In fulfillment of the requirement for the degree I am required to conduct a research in regards to my topic of interest. Therefore, this study is geared towards finding out factors that influence employee performance at the Fairmont Norfolk Hotel. This study will be beneficial to the hotel, the hotel industry, scholars and also the employees. I therefore, humbly request you to take your time to complete this questionnaire. The information that you provide will remain confidential and is sought exclusively for the completion of an MBA research project. Yours Sincerely MBA Student 82 SECTION A: BACKGROUND INFORMATION Please tick in the appropriate box. What is your Gender? Male Female What is your age group (years)? 20- 29 30-39 40-49 50-59 60 and above Which department do you work in? Front Office [ ] Housekeeping [ ] Laundry [ ] Kitchen [ ] Stewarding [ ] Catering and Banquet [ ] Food and Beverage Service [ ] Health Club [ ] Human Resources [ ] Security [ ] Procurement [ ] Executive Office [ ] Sales [ ] Engineering [ ] Reservations [ ] Finance [ ] How long have you worked for the Fairmont Norfolk Hotel? Less than 5 Years ago [ ] 5 - 10 Years [ ] 11- 15 Years [ ] 16 - 20 Years [ - 25 Years [ ] 26 -30 - Years [ ] More than 30 Years ago [ ] ] 21 What is your Employment Status? Full Time [ ] Contract [ ] Partime [ ] Casual Worker [ ] SECTION B: IMPACT OF REMUNERATION ON EMPLOYEE PERFORMANCE Please tick in the appropriate box. 1. Do you receive any benefits at the Fairmont Norfolk Hotel (for example Medical Insurance, Paid Time Off, Retirement Benefits, Leave Travel Allowance, Free Uniforms and Free Meals)? Yes [ ] No [ ] 2. Are you satisfied with the kind of benefits the hotel provides you? Yes [ If yes kindly attest the level of satisfaction? Very Satisfied Satisfied [ ] The benefits provided by the hotel how important are they to you? Very important Important Neutral [ 83 ] Not important ] No [ ] The benefits received from the hotel, do they have an impact on how you perform your work Yes No In the following section, kindly indicate your views by ticking appropriate box based on your opinion. Statement Strongly Disagree Disagree Neutral Agree Strongly Agree My employer always pays me in time. Employees are given a bonus when they achieve their set goals. The wages and salaries that I am paid by my employer usually motivate me. SECTION C: IMPACT OF CREATIVITY ON EMPLOYEE PERFORMANCE Are you given the opportunity to be creative by your employer? Yes [ Is there a reward if an employee shows creativity at work? Yes [ ] No [ ] No [ ] ] In the following section, kindly indicate your views by ticking appropriate box based on your opinion. Statement Strongly Disagree Disagree If employees show creativity in their work they are recognized by the employer. The Norfolk hotel has an out of the box outlook and a go for it attitude. The Norfolk hotel encourages a dynamic flow of ideas. 84 Neutral Agree Strongly Agree SECTION D: IMPACT OF TRAINING AND DEVELOPMENT ON EMPLOYEE PERFORMANCE. In the following section, kindly indicate your views by ticking appropriate box based on your opinion. Strongly Disagree Statement Disagree Neutral The Fairmont Norfolk hotel provides training most of the times. Training and development opportunities are visibly linked to the strategic path of this hotel. As an employee I am inspired to take the initiative in determining my own career development. At the hotel there are opportunities for me to learn new skills and cross-train. THANK YOU FOR YOUR INPUT GOD BLESS YOU!!!! 85 Agree Strongly Agree Appendix B: Implementation Schedule A B C D E F 6 12 14 16 DURATION IN WEEKS ACTIVITY DESCRIPTION A CLARIFYING RESEARCH QUESTION B PROPOSING THE RESEARCH C DESIGNING THE RESEARCH PROJECT D DATA COLLECTION AND PREPARATION E DATA ANALYSIS AND INTERPRETATION F REPORTING THE RESULTS 86 18
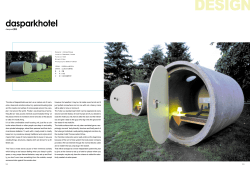


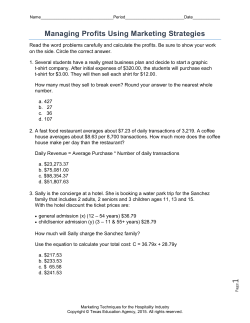


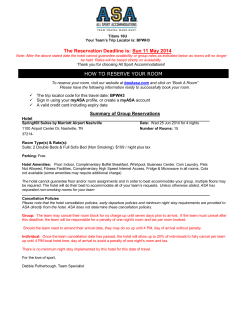
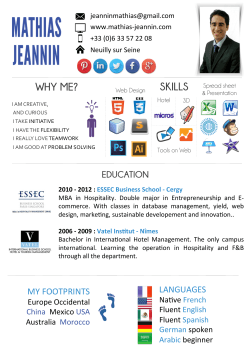
© Copyright 2026