
RELATIONSHIPS AMONG MATERNAL STRESS AND IMMUNE
RELATIONSHIPS AMONG MATERNAL STRESS AND IMMUNE COMPONENTS OF MOTHERS’ MILK By Shelley Swann Blankenship Thibeau Dissertation Submitted to the Faculty of the Graduate School of Vanderbilt University in partial fulfillment of the requirements for the degree of DOCTOR OF PHILOSOPHY in Nursing Science May, 2015 Nashville, Tennessee Approved: Karen D’Apolito, PhD, APRN, NNP-BC, FAAN Ann Minnick, PhD, RN, FAAN Mary Dietrich, MS, PhD Maureen Groer, PhD, RN, FAAN Copyright © 2015 by Shelley Swann Blankenship Thibeau All Rights Reserved To all of the mothers who participated in this study knowing that their contribution would benefit mothers in the future iii ACKNOWLEDGEMENTS This work was successfully completed in part because of the financial support of the Vanderbilt University Clinical Translational Science Award Grant VR3203.2, the PhD Faculty Fund of Vanderbilt University School of Nursing, the Epsilon Nu Chapter of Sigma Theta Tau International, Medela, Inc., and the Ochsner Bridge Grant Fund. I am indebted to each of my Dissertation Committee members, Dr. Ann Minnick, Dr. Mary Dietrich, and Dr. Maureen Groer for their unlimited personal and professional guidance on scientific research. I would like to especially thank my chair, Dr. Karen D’Apolito, for her guidance without which this work would not be possible. I wish to personally thank the entire faculty and staff of the Vanderbilt University School of Nursing, Vanderbilt Institute for Clinical and Translational Research, Vanderbilt Clinical Research Lab, University of South Florida School of Nursing Bio-Behavioral Lab, and Ochsner Health System for their tremendous support and direction every step along the way. In particular, I would like to acknowledge Dr. Karen Rice, who encouraged me to pursue doctoral education, Dr. Richard Ashemore, who kept me focused on achieving the end point, Fr. Anthony de Concilliis for his prayers, and my research team, Cynthia Boudreaux, Jennifer Annino, Barbara Conley, Brooke Towne, Alyssa Simon, and Rachel Thompson for their time commitment to this research. Most importantly I wish to thank my loving husband, Terry, my son Geoffrey and his family, my daughter Stephanie, my brother Steve and his family, and my deceased parents and brother, all of whom provided love and support on this journey. iv TABLE OF CONTENTS Page DEDICATION ............................................................................................................................... iii ACKNOWLEDGEMENTS ........................................................................................................... iv LIST OF TABLES ....................................................................................................................... viii LIST OF FIGURES ....................................................................................................................... ix Chapter 1. INTRODUCTION AND SIGNIFICANCE .............................................................................1 Specific Aims and Research Hypotheses .................................................................................4 2. THEORETICAL FRAMEWORK AND LITERATURE REVIEW .......................................6 Theoretical Framework ............................................................................................................6 Literature Review .....................................................................................................................8 Maternal Stress, Immunity and Infant Outcomes .............................................................8 Stress and Immunity Overview .........................................................................................9 Stress, Cortisol, and Immunity .......................................................................................10 Maternal Stressors ...........................................................................................................14 Physical Stressors...................................................................................................15 Age .................................................................................................................15 Race ...............................................................................................................16 Number of Previous Pregnancies ...................................................................17 Mode of Delivery ...........................................................................................17 Smoking .........................................................................................................18 Infection .........................................................................................................19 Hypertension ..................................................................................................20 Diabetes ..........................................................................................................21 Psychological Stressors ..........................................................................................22 Perceived Stress ..............................................................................................22 Perceived Stress and Cortisol .........................................................................23 Perceived Stress Scale ....................................................................................25 Environmental Stressors ........................................................................................27 Lower Socioeconomic Status .........................................................................27 Caregiver Role ................................................................................................27 Relationship Status .........................................................................................28 v Milk Immune Properties and Maternal Characteristics ..................................................29 Secretory Immunoglobulin A ................................................................................30 Epidermal Growth Factor ......................................................................................33 Interleukin-4 ...........................................................................................................34 Interleukin-6 ...........................................................................................................35 Interleukin-8 ...........................................................................................................38 Interleukin-10 .........................................................................................................39 Tumor Necrosis Factor-Alpha ...............................................................................41 Interferon Gamma-Induced Protein-10, Monocyte Chemotactic Protein-1, Macrophage Inflammatory Protein-1α...................................................................43 Role of Milk in Infant Health..........................................................................................46 Definitions of Terms .......................................................................................................48 3. METHOLOGY .......................................................................................................................50 Design .....................................................................................................................................50 Setting .............................................................................................................................50 Sample and Sampling Plan .............................................................................................50 Methods for Participant Recruitment ..............................................................................51 Human Participant Protection .........................................................................................52 Data Collection and Analysis .................................................................................................53 Measurements and Instruments.......................................................................................53 Procedures .......................................................................................................................59 Data Preparation..............................................................................................................61 Missing Data ...................................................................................................................62 Data Analysis ..................................................................................................................62 General ...................................................................................................................62 Analysis Specific to Aim 1 ....................................................................................63 Analysis Specific to Aim 2 ....................................................................................64 4. RESULTS...............................................................................................................................65 Descriptive Summaries...........................................................................................................66 Validity of Milk Overall Changes by Day Post-Delivery ......................................................71 Analysis of Hypotheses ..........................................................................................................72 Aim 1 ..............................................................................................................................72 Day 3 ......................................................................................................................72 Physical Stressors ...........................................................................................72 Psychological Stressors ..................................................................................72 Environmental Stressors .................................................................................72 Day 9 ....................................................................................................................73 vi Physical Stressors ...........................................................................................74 Psychological Stressors ..................................................................................74 Environmental Stressors .................................................................................74 Salivary Cortisol .............................................................................................74 Day 14 ....................................................................................................................76 Multivariate Associations of Stress Indicators with Milk Immune Components ..77 Relationships of Stress Indicators with Salivary Cortisol......................................77 Cross-lagged Correlations of Maternal Stressors with Milk Immune Components ...........................................................................................................78 Associations of Stressors with the Change in Immune Components from Day 3-14 ........................................................................................................78 Aim 2 ..............................................................................................................................79 5. DISCUSSION ........................................................................................................................81 Changes in Milk Antibodies ...................................................................................................85 Changes in Pro-inflammatory Milk Immune Components ....................................................86 Changes in Anti-inflammatory Milk Immune Components...................................................90 Cortisol as Mediator of Milk Immune Components ..............................................................94 Conclusions ............................................................................................................................96 Strengths and Limitations .......................................................................................................96 Implications ............................................................................................................................99 Appendix A. Study Flyer ...........................................................................................................................102 B. Informed Consent .................................................................................................................103 C. Mothers’ Survey ...................................................................................................................107 D. Perceived Stress Scale ..........................................................................................................108 E. Maternal-Infant Data Collection Sheet.................................................................................110 F. Salivary Collection Instructions ...........................................................................................111 G. General Instruction Sheet for Mother Participants ...............................................................112 H. Training Manual for Study Staff ..........................................................................................113 REFERENCES ............................................................................................................................114 vii LIST OF TABLES Table Page 1. Summary Of Milk Immune Component Ranges Day 1-14 Post-Delivery............................30 2. Summary of Maternal Characteristics and Milk SIgA ..........................................................32 3. Summary of Maternal/Infant Characteristics and Milk EGF ................................................33 4. Summary of Maternal Characteristics and Milk IL-4 ...........................................................35 5. Summary of Maternal/Infant Characteristics and Milk IL-6 .................................................37 6. Summary of Maternal/Infant Characteristics and Milk IL-8 .................................................39 7. Summary of Maternal Characteristics and Milk IL-10 .........................................................41 8. Summary of Maternal Characteristics and Milk TNF-α .......................................................43 9. Summary of Maternal Characteristics and Milk IP-10..........................................................44 10. Summary of Milk MCP-1 and MIP-1α Values in the Literature ..........................................45 11. Outcomes of Infants Breastfed at Least 3 Months ................................................................48 12. Conceptual and Operational Definitions of Study Variables ................................................49 13. Comparison of Milk Immune Components in Preterm Milk Analyzed at USF ...................59 14. Sample Demographics ...........................................................................................................67 15. Summary of Maternal Physical Stress Indicators ..................................................................67 16. Summary of Maternal Psychological Stress Indicators .........................................................68 17. Summary of Maternal Environmental Stress Indicators .......................................................68 18. Summary of Cortisol Values .................................................................................................69 19. Summary of Milk Immune Component Values ....................................................................70 20. Summary of Milk Overall Changes by Day Post-Delivery ...................................................71 21. Day 3 Correlations of Maternal Stress Indicators with Milk Immune Components .............73 22. Day 9 Correlations of Maternal Stress Indicators with Milk Immune Components .............75 23. Day 14 Correlations of Maternal Stress Indicators with Milk Immune Components ...........76 24. Multiple Linear Regression of Maternal Stressors with Milk Immune Components by Day ...................................................................................................................................77 25. Correlations of Maternal Stress Indicators with Cortisol AUC.............................................78 26. Correlations of Maternal Stress Indicators (Day 3) with Milk Immune Components (Day 14) .................................................................................................................................78 27. Correlations of Maternal Stress Indicators (Day 3) with Milk Immune Components Change (Day 3-Day 14) Controlling for Baseline Milk Values (Day 3) ..............................79 28. Direct and Indirect Associations Model ................................................................................80 viii LIST OF FIGURES Figure Page 1. Cortisol Mediation Pathway on Direct Associations of Maternal Stress Indicators with Milk Immune Components ..............................................................................................5 2. Post-Delivery Milk Model .......................................................................................................7 3. Direct Associations of Maternal Anger/Vigor with Milk SIgA ............................................24 4. Direct and Indirect Associations of Maternal Perceived Stress with Milk SIgA and Maternal Cortisol with Milk SIgA ..................................................................................25 5. Analytical Strategy for Aim 2 ...............................................................................................64 6. Summary of Data Variables Used in Analyses of Aims 1 and 2...........................................66 7. Matrix of Significant Relationships of Maternal Stressors with Milk Immune Components ...........................................................................................................................84 8. Significant Relationships of Maternal Stressors with Milk Antibodies ................................86 9. Significant Relationships of Maternal Stressors with Milk Pro-Inflammatory Immune Components.............................................................................................................87 10. Significant Relationships of Maternal Stressors with Milk Anti-Inflammatory Immune Components.............................................................................................................91 11. Mediation Model ...................................................................................................................94 ix CHAPTER 1 INTRODUCTION AND SIGNIFICANCE Scientific evidence supports that the nutritional and immunogenic properties of human milk improve health outcomes for infants worldwide. Despite this evidence, many mothers are not aware of the specific science of how human milk supports infant health. In fact, many women perceive that their milk does not satisfy their infant, does not promote adequate growth, or they misinterpret formula supplementation in the hospital as a signal that their milk is inferior to formula (Chantry et al., 2014; Odom et al., 2013). Identification of the immunologic properties of breastmilk that contribute to infant health may encourage more women to choose and sustain breastfeeding through their infants’ first year of life. Maternal education should include the evidence that milk is not just nutrition but it is the best medicine for infant health. Historically it has been reported that infants who were breastfed by women stressed by living in natural disasters or war-zones not only survive but are less vulnerable to disease than formula fed infants where sanitation and supplies formula preparation may be limited (World Health Organization, 2002; Shaker Berbari, 2013). Clearly, bringing the science of the immunogenic protective properties of breastmilk to the women making feeding choice decisions for their infants is needed to improve infant population health. The abundant protective properties of human milk are recognized worldwide. The World Health Organization recommends that breastfeeding is the optimal source of nutrition for infants during emergent crises (war or natural disasters) or maternal HIV infection (2007). The protective properties of milk consist of numerous immune components that function to instruct the infant intestinal components how to respond to both beneficial organisms and pathogens 1 (Agarwal, Karmaus, Davis & Gangur, 2011; Lawrence & Pane, 2007). These immune components are also associated with a reduction in the incidence of immune mediated diseases among breastfed infants not only during infancy but extending on to childhood and adulthood (Field, 2005). Breastfed infants in developed as well as under-developed countries have a decreased incidence of infection and allergies during the first 12 months of life (Labbock, Clark, & Goldman, 2004). The evidence is strong that breastmilk promotes and sustains infant health. The consumption of human milk is also associated with a decrease in health-care expenditures due to the lower incidence of hospital acquired infections in infants (Bisquera, Cooper, & Berseth, 2002; Leroyer et al, 1997; Rodriguez et al., 2005; Wall, 2007). Cost savings from the reduction of infant illness post discharge of those receiving human milk is estimated to be $475/infant during the first six months of life, generating a savings of $3.6 billion/year in federal expenditures on healthcare (Wall, 2007). With the ongoing increase in healthcare expenditures it is now estimated that over $13 billion/year could be saved if 90% of mothers breastfed their infants exclusively for 6 months (Bartick & Rienhold, 2010). Globally, human milk is associated with a reduction in infant mortality through the decreased incidence of respiratory and gastrointestinal disease (Arifeen, Black, Antelman, Baqui, Caulfield, & Becker, 2001; Labbock et al., 2004). In the US, there is a disparity in infant health outcomes associated with race. African American (AA) infants have the highest percentages of mortality during the first year of life related to low birth weight, <2500 grams, (AA=13.75% vs. non-Hispanic White =7.2%) and sudden infant death syndrome (AA=87% higher than nonHispanic Whites (Centers for Disease Control and Prevention, 2013a). Very low birth weight infants(<2500grams) that are breastfed reach optimal growth and development within the first year of life; however, AA mothers have the lowest breastfeeding initiation rates regardless of 2 education and socioeconomic background which places the AA infants at a significant disadvantage (Centers for Disease Control and Prevention, 2012a; Ludington-Hoe, McDonald, & Satyshur, 2002; March of Dimes, 2010). Historically, AA women were at risk for health disparities due to limited access to health care; however, recent evidence suggests that chronic stress may also play a role in health disparities such as hypertension, diabetes and adverse birth outcomes within this population (Hicken, Lee, Morenoff, House & Williams, 2014; Wallace & Harville, 2012). Stressors such as lower socioeconomic status are associated with health disparities. Many women of lower socioeconomic status are enrolled in Medicaid for healthcare. In 2010, nearly 48 % of all US births were supported by Medicaid (Kaiser Family Foundation, 2010; March of Dimes, 2009; Markus, Adres, West, Garro, & Pellegrini, 2013). Also in 2010, states such as Louisiana reported that 69 % of all births were supported by Medicaid and > 90% of these mothers were asked by their healthcare providers to provide breastmilk because scientific evidence supports that breastfeeding is the optimal feeding choice (Markus et al., 2013; U S Department of Health and Hospitals, 2010). Knowing that prenatal conditions such as socioeconomic status are likely to continue post-delivery it is not known whether maternal stressful conditions alter milk immune components. The evidence to date supports that breastmilk protects the infant regardless of maternal conditions (World Health Organization, 2002; Shaker-Berbari, 2013); however little is known about whether there are immunological changes in breastmilk as a result of maternal stress. Very little empirical data is available to assess the immunogenic properties of human milk among women who experience stress. Additionally, no research to date has examined the association between maternal self-perceived stress and milk immune components among AA 3 mothers; a population that experiences a higher percentage of immune mediated diseases (diabetes and hypertension) and mortality (Centers for Disease Control and Prevention, 2010; Office on Women's Health, 2013). Therefore, the purpose of this study is to explore the relationship between maternal stress and breastmilk immune components among AA women during the first 14 days post-delivery. Gathering this information could lead to effective interventions that reduce stress and decrease health disparities associated with stress for AA women and their children. Given there is a gap in health disparities for minorities such as AA, the immune components in breastmilk holds the potential to significantly improve population health for AA infants (Agarwal et al., 2011; Labbock et al., 2004). Specific Aims and Research Hypotheses The specific aims and hypotheses of this study include the following: 1. Assess the associations of maternal stress indicators with specific milk immune components (antibodies, cytokines, and chemokines) from AA mothers of term infants during the first 14 days post-delivery. H0 1 There will be no statistically significant simultaneous (within each collection day) or crosslagged associations (from Day 3- Day 14) of maternal stress indicators with levels of milk immune components (antibodies, cytokines, and chemokines) post- delivery. 2. Assess the mediation (indirect) effect of maternal cortisol on the direct association of maternal stress indicators and milk immune components (antibodies, cytokines, and chemokines) from AA mothers of term infants. H0 2 There will be no statistically significant mediation (indirect) effect of cortisol on the milk immune components (antibodies, cytokines, and chemokines). 4 Maternal stress indicators for Aim 1 were defined as physical (age, race, number of previous pregnancies, mode of delivery, smoking, infection, hypertension, diabetes), psychological (summed scores of the Perceived Stress Scale which measures the degree in which situations are perceived as unpredictable and burdensome during the past days/weeks/months), and environmental (socioeconomic status, number of children cared for, relationship status). Maternal Stress Indicators for Aim 2 were defined as the summed scored of the Perceived Stress Scale on Day 3, and salivary cortisol on Day 9. Breastmilk immune components that were measured were chosen for their contribution to infant health: antibodies-secretory Immunoglobulin A (SIgA), cytokines/chemokines and growth factors-epithelial growth factor (EGF), interleukins 4,6,8, and 10 (IL-4, IL-6, IL-8, Il-10), tumor necrosis factor-alpha (TNF-α), interferon gamma-induced protein 10 (IP-10), monocyte chemotactic protein-1 (MCP-1), and macrophage inflammatory protein (MIP-1α). The biomarker, salivary cortisol, was chosen as a mediating variable that may have an indirect effect on the direct associations of maternal stress indicators with breastmilk immune components. See Figure 1 below for a summary of the proposed cortisol mediation pathway. Salivary Cortisol Breastmilk Immune Components Maternal Stress Figure 1. Cortisol Mediation Pathway on Direct Associations of Maternal Stress Indicators With Milk Immune Components 5 CHAPTER 2 THEORETICAL FRAMEWORK AND LITERATURE REVIEW Theoretical Framework Early definitions of stress focused only on the physiology of the stress response (Seyle, 1976). Later, Borysenko (1987) proposed that psychological stressors moderate the homeostasis of the immune system beginning the science now known as psycho-neuro-endocrineimmunology (PNI). Ader, Cohen & Felten (1995) continued to refine the PNI theory by describing the mechanisms of interactions between the neuro-endocrine immune systems including the actions of neuro-endocrine mediators on cellular immune changes. Psychological self-perceived stress, defined by Lazarus and Folkman (1984), is the cognitive processes used to appraise and classify the stress in relation to the significance to the self. To further understand the relationship between self-perceived stress and immunity, research has focused on how the stressor is processed using cognitive perception and inter-related activation of the nervous, endocrine and immune systems (Rice, 2000). For mothers postdelivery there are numerous stressors that influence maternal self-perceived stress. These stressors post-delivery are described as arising from within the maternal-infant dyad (maternal/ infant health, role ambiguity) and external to the mother-infant dyad (socioeconomic issues, family issues, work/school) (Jevitt, Groer , Crist, Gonzales, & Wagner, 2012). During this stressful time, the maternal neuro-endocrine-immune systems work to promote healing in the mother and also provide the immune protective properties in the breastmilk. 6 Both the PNI framework (Ader et al., 1995) and the Lazarus and Folkman stress and coping framework (1984) contain concepts that can be used to describe the relationships between maternal perceived stress, milk immune components and their infant outcomes (Lyon, 2000). Relevant concepts from each of these frameworks were selected to guide the proposed study. Logical linkages among these concepts were used to develop the new proposed conceptual model which presents the inter-relationships of the theories of PNI and Lazarus & Folkman (1984). The concepts that are shadowed will not be explored at this time due to feasibility issues and scope of this dissertation but they remain relevant for future research. Maternal Physical Factors Age, Race, Parity, Mode of Delivery, Smoking, Antenatal Steroids Pre-eclampsia, Infection, Hypertension, Diabetes Maternal Stress Maternal Psychological Factors Perception of stress over time (PSS), and the PSS-NICU Term Infant Health Outcomes Birthweight, Gestational age Infections, Allergies, Diabetes, Obesity Human Milk Immune Components Antibodies, cytokines, and chemokines Neuroendocrine Transmitter Salivary Cortisol Maternal Environmental Factors Socioeconomic status, Number of children cared for at home, Relationship status, Preterm Infant Health Outcomes Birthweight, Gestational Age LOS NEC HAI Blood Infections NICU Environment MALT Pathway Factors (Number of skin to skin contacts and Number of maternal visits) Milk storage Standardized Feeding Guidelines Infection Prevention Best Practices Figure 2. Post-Delivery Human Milk Model This model posits that the individual appraisal of stressors post-delivery (physical- age, race, parity, mode of delivery, smoking, antenatal steroids, infection, diabetes, hypertension; 7 psychological- perceived stress; and environmental- socioeconomic status, relationship status, number of children cared for at home) influences the bio-behavioral stress response in the mother which may alter the protective immune components in breastmilk and in turn influence infant outcomes. The Post-delivery Human Milk model incorporates the interaction of neuroendocrine-immune systems that potentially mediate the stress response. Understanding the direction of these proposed concepts will lead to the development of healthcare interventions to support the quality of human milk and infant outcomes. Literature Review Maternal Stress, Immunity, and Infant Outcomes The definition of stress in the literature is multi-dimensional; physical stress, psychological stress, and the duration of stress. In stress-immune research, the duration of stress (physical or psychological) is associated with alterations in the immune response (Segerstrom & Miller, 2004). Acute psychological and physical stress can be time limited in the laboratory (mental exams, exercise), naturalistic (real time stressful situations such as delivery of an infant), or sequence events (loss of a loved one, job loss). Chronic stress, however, has no defined time limit or sequence. Science suggests that it is the instability of the time element in chronic stress that leads to life-altering changes in personal health and behaviors (Kiekolt-Glaser, Preacher, MacCallum, Atkinson, Malarkey & Glaser, 2003; Segerstrom & Miller, 2004). Examples of chronic stress include physical disabilities, the caretaker role (mother), socioeconomic burdens, living in high crime neighborhoods, or living in areas struck by natural disasters (Beckie, 2012; Callaghan et al., 2007; Cohen, Doyle, & Baum, 2006; Kiekolt-Glaser et al., 2003; Segerstrom & Miller, 2004). 8 Stress and Immunity Overview How stress influences the immune system is complex; the specific pathways between stress and the immune system are still being discovered (Segerstrom & Miller, 2004). Stress initially stimulates the sympathetic nervous system fibers that reach from the brain to the bone marrow and lymphoid tissues. This first reaction to stress stimuli induces changes on the receptors of white blood components which in turn creates a cascade of immune cell activities. If the stress is ongoing, the hypothalamic-pituitary-adrenal cortex (HPA) axis results in the secretion of cortisol. Other endocrine products released in stress include epinephrine, norepinephrine, melatonin, and prolactin. These hormones bind to receptors on white blood cells to regulate white blood cell function and distribution. The elasticity of the stress immune response is variable and can be influenced by vulnerabilities (age, prior disease states, and autoimmune states) and duration of the stressors. The immune response can be categorized as either innate immunity or acquired immunity (Janeway, Travers, Walport & Shlomchik, 2005; Segerstrom & Miller, 2004). Innate immunity is a swift immune response that does not provide a defense against a specific pathogen and it is characterized by inflammation (Segerstrom & Miller, 2004). During this response, the white blood cells (neutrophils and macrophages) rush to the site of injury to release toxic substances that damage the pathogen invader, and then destroy by engulfing the invader. Macrophages release cytokines which are the communicators of the immune system. Cytokines stimulate proinflammatory and anti-inflammatory responses and a balance is needed to protect the tissues from self-destruction. Acquired immunity is less rapid but it is a more targeted immune response using white blood cells known as lymphocytes with specific receptors on the cell surface that have affinity to the antigens on the pathogen invader. One lymphocyte called the T-helper cell 9 also produces cytokines that can augment the acquired immune response. Another lymphocyte type, B-cells, produce antibodies that can destroy the pathogen complex with antigenic toxins, bind to viruses to prevent their entry into the host cells, or coat the host cells with protection. In a meta-analysis of 30 years of stress immune research the immune responses to acute and chronic stress were reviewed (Segerstrom & Miller, 2004). Time limited stress such as acute and sequence events induce the flight or fright immune response which increases the production of cytokines and antibodies across the immune system. Conversely, chronic stress is associated with a decrease or alteration of the immune cell distribution and function. With chronic stress there can be a shift in the balance of cytokines as well as a decrease in the amount of cytokines and lymphocytes produced which increases the vulnerability of the host to disease (Elenkov, 2004). In human milk there is a balance of immune components designed to protect the infant (Garofalo, 2010; Goldman, 2007). These components are produced by mammary gland cells, mammary epithelium, or may diffuse from maternal serum across the mammary epithelium. The concentrations of the immune components in milk do not match those present in maternal serum suggesting that the mammary gland itself is the primary origin of most milk immune components (Agarwal, Karmaus, Davis & Gangur, 2011). Thus, it is not known whether the maternal stress response can influence immune cell changes in human milk. Stress, Cortisol, and Immunity The balance of the body’s immune response to stress is influenced by glucocorticoid neuroendocrine hormones such as cortisol (Elenkov, 2004). It was originally thought that cortisol inhibited the production and function of immune cells but more current evidence indicates that cortisol selectively influences immune cell response creating a shift in the specific immune response. The two arms of the specific immune response are Th1 cells which provide immunity 10 within the cellular components and Th2 cells which provide immunity outside of the cellular components. Cytokines that play a role in Th1 immunity include interleukin-2 interferon-gamma, and tumor necrosis factor-alpha; whereas, cytokines that play a role in Th2 immunity include interleukins-4, 5, 9, 10 and 13 (Elenkov, 2004; Janeway et al., 2005). Cortisol is associated with a decrease in Th1 cells leading to susceptibility to infection and or illness symptoms (Elenkov, 2004). Elevated corticoid states such as pregnancy directly influence a shift in the Th1/Th2 ratio of maternal immunity (Ruiz & Avant, 2005). During pregnancy, there is a suppression of Th1 cells but it is felt this suppression is needed to prevent the maternal rejection of the fetus. Both the maternal circulating cortisol and the placental produced cortisol are necessary for fetus growth and development and play a role in the immune cell shift that protects the fetus. With each additional week of gestation there is a 3.6% increase in cortisol (Giesbrecht, Campbell, Letourneau, Kooistra, & Kaplan, 2012). The rise in cortisol is thought to provide the necessary energy for fetal growth and also support the mother during labor and delivery (Ruiz & Avant, 2005). Post-delivery, there is a natural decline of the cortisol levels reaching pre-pregnancy levels between 1-2 weeks post-delivery (O'Keane et al., 2011). With the decline of cortisol postdelivery there is an increase in serum Th1 cells to pre-pregnancy levels (Ruiz & Avant, 2005). Maternal cortisol levels can increase with stress pre and post-delivery. In a randomized controlled trial of 61 pregnant women with self-reports of anxiety, those not receiving the supportive intervention had significantly greater salivary cortisol levels at 3 months post-delivery than mothers who received support (Area Under the Curve [AUC] = 32.7 ng/mL versus AUC=27.8 ng/mL, p<0.001) (Richter et al., 2012). Similarly, maternal self-report of stress postdelivery is associated with increased salivary cortisol levels for up to 6 months post-delivery. 11 Urizar and Munoz (2011) reported higher salivary morning cortisol in low-income mothers (n=24) versus low risk mothers (n=22) at 6 months post-delivery (9.3 ±2.3 ng/mL [95% CI= 8.4, 10.4] versus 8.3 ± 4 ng/mL [95% CI= 6.8, 10.1], p< 0.050). Among lactating women, those with previous pregnancies had greater levels of salivary cortisol on day 14 post-delivery than those mothers pregnant for the first time (3.4 ±0 .9 ng/mL [95% CI= 3.0,3.1] versus 3.2 ± .8 ng/mL [95% CI= 2.9, 3.5]) but these differences were not significant (Kawano, Emori, & Miyagawa, 2009). Normative salivary cortisol values for 43 women < 14 days post-delivery collected at noon (±2 hours) were 4.61± .03 ng/mL(95% CI= 4.6, 4.62) (Hampson, Phillips, Soares, & Steiner, 2013). Feeding status was not reported by Hampson and colleagues (2013), thus we do not know if the ranges of salivary cortisol between < 14 days post-delivery and day 14 postdelivery are related to lactation or the timing of the saliva collections (Hampson et al., 2013; Kawano et al., 2009). There is, however, limited research suggesting that lactation is associated with lower salivary cortisol levels in women post-delivery. Tu and colleagues, (2006a), explored salivary cortisol 5-20 weeks post-delivery among 24 breastfeeding and 24 bottle feeding primiparous and multiparous women. The breastfeeding women had significantly lower awake cortisol levels than bottle feeding women across all days of collections (breastfeeding =1.7- 1.8 ng/mL versus bottle feeding= 1.8- 3.2 ng/mL, p <0 .050). However, the lowered cortisol observed in lactating women may be short-lived. In a randomized control trail of 43 lactating women 8 weeks post-delivery, post-intervention salivary cortisol was lower in women who breastfed 15 minutes prior (n=20) to a brief psychosocial stressor versus those instructed to just hold their infant (n=23) (breastfed =2.57 ± .18 ng/mL [95% CI= 1.8, 3.3] versus held infant = 2.61±.25 ng/mL [95% CI=2.5, 2.7], p=0.006) (Heinrichs et al., 2001). Even though the decreased response to stress among lactating 12 women appears to be time limited, both animal and human research describe a reduction in the stress response to both physical and psychological stressors among lactating mothers (Heinrichs, Neumann & Ehlert, 2002). The use of salivary cortisol has a number of advantages over serum cortisol in health research (Kirschbaum & Hellhammer, 2000). Salivary cortisol levels rise more quickly than serum cortisol after a perceived psychological and/or physical stressor such as caring for a newborn post-delivery and salivary cortisol levels return to baseline faster than serum cortisol (Nicholson, 2008). Salivary cortisol is more feasible in field research for it is relatively easy for the participant to collect and remains stable at room temperature (Kirschbaum & Hellhammer, 2000). In health research, a standard method to measure salivary cortisol is the cortisol awakening response (CAR) where saliva is collected upon awakening, 30 minutes after waking and 45-60 minutes after waking (Fekedulegn et al., 2007). The multiple measures can be transformed into a single measure called area under the curve (AUC) and used to correlate with psychometric instruments. Correlations of salivary cortisol with psychometric instruments are difficult to trend across studies due to the timing of cortisol collections and the confounding variables that may reduce stress such as social support. In a large cohort of 1,587 pregnant women, the Perceived Stress Scale (PSS) summed scores correlated weakly with morning salivary cortisol at 24-29 weeks gestation (r=0.07, p<0.050) (Harville et al., 2009). A major limitation of this study was the lack of standardization of the timing of the salivary cortisol collections. Salivary cortisol is an isolated measurement of stress post-delivery. Consideration should be given to also measure other known stressors such as self-perceived stress, and maternal characteristics to clearly define maternal stress post-delivery. 13 The Perceived Stress Scale (PSS) which measures stress is a common psychometric instrument utilized in health research (Cohen, Kamarck, & Mermelstein, 1983). In a systematic review of psychometric instruments utilized to assess psychological stress in pregnant women, the PSS was found to be the most reliable instrument to measure the stress that may result from daily hassles (Nast, Bolten, Meinlschmidt, & Hellhammer, 2013). A more comprehensive discussion of the PSS instrument is included later in this review. The Perceived Stress Scale (PSS) measures the degree in which situations are regarded as unpredictable, uncontrollable and burdensome during the past days/weeks/month and it is adequate to measure disturbances by daily hassles. In summary, the cognitive perception of stress is processed through the central nervous systems (sympathetic and HPA axis) which in turn stimulates neurotransmitters such as epinephrine and cortisol that regulate immune cell functions. This psychoneuroimmunological pathway is primarily designed to protect the human body. However, prolonged stress stimulates the HPA axis and is manifested by an increase in neurotransmitters such as cortisol. Cortisol can negatively alter the cytokine balance which can increase vulnerability to inflammation and/or infections. The mothers’ immune status is designed to protect the fetus during pregnancy and breastmilk is designed to continue this protection post-delivery. It is important to explore whether maternal stress indicators (physical, psychological and environmental) are related to changes in immune components of breastmilk to determine the full potential of the protective properties of breastmilk for infant health. Maternal Stressors Stressors for women during the post-delivery period are defined in the literature as physical, psychological, and environmental. Physical stressors such as age, race, previous 14 pregnancies, mode of delivery, smoking, infection, diabetes and hypertension are all stressors that can impact both maternal and infant outcomes. Psychological stressors such as the daily hassles encountered adjusting to the new role of motherhood may influence maternal and infant immunity. Environmental stressors such as socioeconomic status, caregiver status (number of children cared for) and relationship status are all associated with decreased immunity. Using the current literature, each stress indicator will be further defined as it relates to mothers postdelivery. Physical Stressors Age. The median age for women delivering term infants in the US has increased steadily from 25.8 years in 2011 to 25.6 years in 2012 (Carolan & Fankowska, 2011; National Vital Statistics Reports, 2013). As of 2012, 34.4% of all women delivering infants were 20-29 years of age (March of Dimes, 2012). In a large cohort of 215, 344 births, advanced maternal age ( >40) was associated with adverse birth outcomes such as increased risk of stillbirth (RR=1.83, [95% CI=1.37, 2.43]), preterm birth (RR=1.25, [95% CI= 1.14, 1.36]), delivery of large for gestational age infant (RR=1.40, [95% CI= 1.25, 1.58}), and caesarian delivery (RR=1.83, [95% CI= 1.77, 1.90]) even after controlling for number of previous pregnancies, social deprivation, and ethnicity (Kenny et al., 2013). Comparing maternal age >35 to those aged 20-34, the odds increased for stillbirth (OR=1.5 [95% CI= 1.4, 1.7]), preterm birth (OR=1.2 [95% CI= 1.1, 1.2]), and early neonatal mortality (OR=1.2 [95% CI= 1.0, 1.4]) after controlling for facility and country in another large cohort of 308,149 women delivering among 9 countries (Laopaiboon et al., 2014). Advanced maternal age of > 30 years (49% of all US deliveries) is a significant maternal stressor and poses a risk of adverse maternal and infant outcomes (Carolan & Fankowska, 2011; Kenny et al., 2013; March of Dimes, 2012). 15 Race. Race is associated with health disparities thus can be considered a maternal stress indicator. In a systematic review, Beckie (2012) reported that race/ethnicity and socioeconomic status was associated with an increase in stress and health disparities. Although much research has focused on the unequal access to healthcare as a key driver of health disparities, a growing body of evidence is now exploring the effects of stress as a contributor to population health disparities. Here in the US, the health disparities for African Americans (AA) are numerous. African Americans are more likely to have hypertension and diabetes than non-Hispanic Whites and Hispanics (Centers for Disease Control and Prevention, 2010). African American women have greater rates of obesity, hypertension, pre-eclampsia and pregnancy related death than nonHispanic White and Hispanic women (Centers for Disease Control and Prevention, 2012c; Office on Women's Health, 2013). African American infants have the highest incidence of mortality during the first year of life and AA mothers have one of the lowest breastfeeding initiation rates regardless of socioeconomic or educational background (Centers for Disease Control and Prevention, 2012a; Ludington-Hoe, McDonald, & Satyshur, 2002; March of Dimes, 2010; Spencer & Grassley, 2013). Mothers of AA infants are less likely to receive breastfeeding education from their health provider, and less likely to receive family and community support to initiate and sustain breastfeeding (Spencer & Grassly, 2013). Race was also reported as a significant predictor of poor infant outcomes controlling for hospital characteristics and physician practice preferences in a large cohort of 25 facilities (N=62,816) (Wilson, Gance-Cleveland & Locus, 2011). African American infants were more likely to be admitted to a neonatal intensive care unit and to have lower Apgar scores (a measure of infant physiological stability) at 1 and 5 minutes post birth. African American children have greater rates of asthma and allergies than Non-Hispanic White and Hispanic children (Centers 16 for Disease Control and Prevention, 2013). Childhood obesity rates among AA children are greater than Non-Hispanic Whites, and childhood diabetes is highest among AA children compared to all races/ethnicities (Centers for Disease Control and Prevention, 2012b; National Diabetes Information Clearinghouse, 2011). Increasing the dose of breastmilk consumed by AA children holds potential to reduce these immune-mediated conditions. Number of Previous Pregnancies. Increased number of pregnancies can be a stressor for mothers. Women experiencing numerous pregnancies (multiparous) had associations with higher physical, psychosocial and environmental risk factors compared to women delivering their first child (primiparous) in a large cohort of 3, 260 mothers (Lanier & Jonson-Reid, 2014). Lower socioeconomic status (58.4%), smoking during pregnancy (28.5%), partner violence (7.5%), and low birth weight infants (30.3%) contributed to a significantly higher cumulative risk stress score (p<0.005) for multiparous women (Mean=5± 2.2) versus primiparous women (Mean= 3.8±1.9). In another large cohort, physical stress and strain was greater for primiparous (n=556) than multiparous (n=736). Primiparous were more likely to experience perineal trauma (OR= 2.54 [95% CI= 1.96, 3.29]), lack of sleep related to baby crying (OR =1.44 [95%CI= 1.01, 1.58]) in the first 8 weeks post-delivery compared with multiparous women (Thompson, Roberts, Currie, & Ellwood, 2002). Primiparous may undergo more physical stress than multiparous postdelivery, but numerous pregnancies potentially increases caregiver burden which is discussed later in this review. Mode of Delivery. Mode of delivery (vaginal, vaginal assist, and cesarean section) places different physical strain on the mothers’ physical and psychological recovery post-delivery. In a prospective observational study, mothers receiving anesthesia had significantly lower cortisol levels at delivery than mothers delivering without anesthesia regardless of mode of delivery. 17 Those mothers receiving epidurals (n=21) or cesarean sections (n=29) had lower cortisol levels (epidural=5.53 ±2 ng/mL, p=0.040, cesarean section= 2.64±.96 ng/mL, p<0.050) versus those women experiencing vaginal delivery (n=30) or extraction assist vaginal delivery (n=23) (vaginal= 7.43±22.6 ng/mL, extraction= 6.83±2.93 ng/mL) without anesthesia (Vogl et al., 2006). The authors propose that anesthesia used during delivery dampened the stress reactivity response but the sample size was small, thus more research is needed to generalize these findings. In contrast, Thomspon and colleagues (2002) reported more physical stress in women receiving cesarean sections. Those women receiving cesarean sections were more likely to be readmitted for maternal problems (OR= 2.46 [95% CI= 1.11, 5.43]) than those experiencing assisted vaginal birth (OR= 2.23 [95% CI= 0.88, 5.48], p=0.006) (Thompson et al., 2002). In addition, those women receiving cesarean sections reported greater exhaustion (OR= 1.45 [95% CI= 1.07, 1.98]) and bowel problems (OR= 1.57 [95% CI=1.16, 2.11]) at 8 weeks post-delivery than women experiencing assisted vaginal delivery. Physical recovery from birth mode can take up to 6 months post-delivery which adds to the maternal perceived stress during this critical time period. Smoking. Smoking exposes both the mother and infant to toxic chemicals such as nicotine, tar, and carbon monoxide both during pregnancy and post-delivery (March of Dimes, 2014). These toxic chemicals promote oxidation which releases free radicals that can harm maternal tissues as well as developing fetal tissues. Women of lower socio-economic status without healthcare access are at increased risk of smoking regardless of race/ethnicity (Mund, Louwen, Klingelheofer, & Gerber, 2013). In 2009, the estimated prevalence of smoking among women of reproductive years (18-44years) in the US was 18.7% (non-Hispanic white women= 22%, non-Hispanic black women= 15.7%) (Centers for Disease Control and Prevention, 2014b). 18 Obstetric complications for women who smoke during pregnancy include: premature rupture of membranes, preterm delivery, chorioamniotis, placental abruption, and pregnancy induced hypertension (Mund et al., 2013). The risk of stillbirth increased 23 % for smoking pregnant women. Children of women who smoke during pregnancy were at increased risk of low birth weight, congenital cardiac defects and oro-facial anomalies, preterm birth and sudden infant death syndrome (Centers for Disease Prevention and Control, 2014; Mund et al., 2013). Smoking mothers (2,602 of 11, 958) were less likely to breastfeed exclusively at 2 weeks (OR= 2.08 [95% CI= 1.94, 2.21]) than non-smoking mothers (Letson, Rosenberg, & Wu, 2002). Finally, women who smoke (n=82) had higher cortisol levels than non smoking mothers (n=118) at 6 months post-delivery (M=17.5 ± 10.6 ng/mL vs M =8.3 ±8.3 ng/mL) (Granger et al., 2007). Smoking is a significant stressor for maternal and infant health; however not much is known on whether smoking is related to changes in immune properties of breastmilk. Infection. Historically, pregnancy was thought to increase the risk of infection (Sappenfield, Jamieson, & Kourtis, 2013). Pregnancy does alter the cytokine balance within the mother in part to prevent the maternal immune system from rejecting the fetus (Ruiz & Avant, 2005). A systematic review was conducted to determine if pregnant women had an increased susceptibility to infection (Sappenfield, Jamieson, & Kourtis, 2013). The authors concluded that pregnancy was associated with an increased severity of infectious diseases, particularly viral diseases, and the degree of severity increased with advanced stages of pregnancy. Common infectious states for pregnant women include: pyelonephritis, chorioamnionitis, septic abortion, and pneumonia (Morgan & Roberts, 2013). Post-delivery complications include: endometritis after vaginal delivery (Median=5%, Range=0-24%), endometritis after non-elective cesarean section (Median=28.6%, Range= 3-61%), and pyelonephritis (3-4% of all readmissions). Women 19 of lower socio-economic status are at highest risk of urinary tract infection (Morgan & Roberts, 2013). Because urine and kidney infections are the most common cause of septic shock for obstetric patients, the American College of Obstetricians and Gynecologists recommends urine screening during prenatal visits and aggressive treatment of urinary tract infections both prenatal and post-delivery. Broad spectrum antibiotics are the gold standard which should illicit clinical improvement within 24-48 hours. Extended use of antibiotics can disturb the composition of the intestinal microbiome of both mother and infant (Murgas Torrazza & Neu, (2011). Here in the U.S., 29.7% of women reported receiving antibiotics during pregnancy (Centers for Disease Control and Prevention, 2014a). Maternal infection is a significant maternal stressor; however, not much is known about the relationship of maternal infection and/or antibiotic usage and alterations of immune components in breastmilk. Hypertension. Hypertension is considered an immune mediated disease for the precursor is inflammation of the arteries which is associated with stress (Alevizos et al., 2014; Calgani & Elenkov, 2006). The overall prevalence of hypertension among women aged 18-44 years in 2009 was 10.2%; AA women had the highest prevalence (19.2% [95% CI=17.5, 20.9]) versus nonHispanic whites (9.3% [95% CI= 8.9, 9.8]) and Hispanics (8.2% [95% CI= 7.3, 9.2]) (Centers for Disease Control and Prevention, 2014b). In the South, AA women with lower socioeconomic status had higher odds of cardiovascular disease including hypertension than white women with low socioeconomic status (OR= 3 [95% CI= 1.3, 6.9] versus OR= 1.67 [95% CI=0 .9, 3.1]) (Davis, Gebreab, Quarells, & Gibbons, 2014). Hypertensive pregnant women are at risk of life threatening co-morbidities (Bramham et al., 2014). Adverse pregnancy outcomes associated with hypertension include: pre-eclampsia (25.9% [95% CI= 21, 31.5]), cesarean section (41.4% [95% CI =35.5, 47.7]), low birth weight < 2500 grams (16.9% [95% CI= 13.1, 21.5]), and perinatal 20 death (4% [95% CI= 2.9, 5.4]) (Bramham et al., 2014). Hypertension is a physical stressor for the mother, and this stressor is also associated with delayed milk production (Hurst, 2007). Not known is whether stress-mediated diseases such as hypertension influence milk immune properties. Diabetes. Diabetes mellitus (Type 1) is considered immune mediated diseases. Perceived stress activates the nervous system neurotransmitters such as cortisol, which alters glucose metabolism and decreases sensitivity to insulin (Chida & Hamer, 2008). In a meta-analysis of psychological stress and the incidence of diabetes, the authors reported that there were no strong correlations among psychological factors (stressful events, and poor social support) and incidence of type 1 or type 2 diabetes; however, poor glucose control was associated with stressful events and poor social support (Chida & Hamer, 2008). The overall incidence of diabetes (excluding gestational diabetes) among women aged 18-44years was 3% in 2009; AA women had a greater incidence (5.1% [95% CI= 4.2, 6.2]) than non-Hispanic whites (2.3% [95% CI =2.1, 2.6]) or Hispanics (3.6% [95% CI= 2.9, 4.5]) (Centers for Disease Control and Prevention, 2014b). Gestational diabetes is a condition of abnormal glucose metabolism during pregnancy and the incidence is estimated as high as 9.2% among all pregnant women (Centers for Disease Control and Prevention, 2014c). Gestational diabetes is associated with both maternal and infant adverse outcomes: macrosomia (RR= 1.81[95% CI=1.47,2.22, p<0.001]), large for gestational age (RR=1.53 [95% CI=1.39, 1.69], p<0.001), perinatal mortality (RR=1.55 [95% CI=0.88, 2.73], p=0.130), preeclampsia (RR=1.69 [95% CI=1.31, 2.18], p<0.001) , and cesarean section (RR= 1.37 [95% CI =1.24,1.51], p<0.001) (Wendland et al., 2012). Although women with diabetes are less likely to initiate or sustain lactation, lactation hormones play a protective role in 21 reducing the risk of developing type 2 diabetes in women with gestational diabetes (Finkelstein, Keely, Feig, Tu, & Yasseen, 2013; Schwarz et al., 2010). Women diagnosed with diabetes prepregnancy or during pregnancy are at risk of adverse outcomes, decreased lactation initiation and duration but little is known about the related immune properties of breastmilk among women with diabetes. In summary, maternal physical stressors described here play unique roles in maternal stress with the potential to influence maternal and infant immunity. Breastmilk is the bridge between intra-uterine and extra- uterine immune protection of the newborn infant. Further research is warranted to explore whether there are significant alterations in milk immune protection related to maternal physical stress. Psychological Stressors Perceived Stress. Self-perceived stress is associated with immune dysregulation and dysfunction (Glaser & Kiecolt-Glaser, 2005; Segerstrom & Miller, 2004). During pregnancy and post-delivery women experience psychological stressors related to becoming a mother, and the changes in relationships with partners, family, and friends (Jevitt et al., 2012). Maternal prenatal self-perceived stress can impact the function of the infant immune system. Maternal cortisol and cytokines can cross the placenta to down-regulate or suppress the fetal immune system postdelivery. In animal studies, maternal stress hormones were associated with an increased level of interleukin 10 (IL-10) in the pup’s serum (Curtin, 2009). Interleukin-10 suppresses proinflammatory cytokines and thus could contribute to a suppression of the immune response to pathogens. Wright et al., (2009) examined cytokine changes in cord blood at birth associated with maternal prenatal stress among 557 low income women. Women reporting self-perceived stress had children with significantly increased cord blood interleukin-8 (IL-8), a pro- 22 inflammatory chemokine, creating a heightened immune state. Maternal prenatal self-perceived stress was used to predict infant illness in a longitudinal study of 174 women who delivered term infants (Beijers,Jansen, Riksen-Walraven, & de Weerth, 2010). Prenatal self-perceived stress predicted the following infant illnesses: respiratory infections (9.3%), general illness (10.7%), skin infection (8.9%), and antibiotic use (7.6%) during the first year of infant life. Post-delivery, there are relationships between maternal self perceived stress and immune function reported in the literature. Groer and colleagues, (2005), examined the relationships among maternal fatigue, infection and infection symptoms using the Carr Infection Symptom Checklist (SCL) in 50 women who delivered term infants. Greater maternal fatigue post-delivery correlated with higher maternal SCL scores (r = 0.22, p = 0.020), and greater maternal sleepiness correlated with more infections in both the mother (r = 0.29, p = 0.002) and infant (r = 0.28, p = 0.002). The act of breastfeeding may suppress neuroendocrine responsiveness to physical and psychological stress. In a study exploring stress and immunity among women who formula fed versus women who breastfed, Groer and colleagues (2006) reported that total infection symptoms among women who formula fed their infants positively correlated with maternal selfperceived stress on the day of the survey (r=0.26, p< 0.010) and the time since the birth of their infant 4-6 weeks ago (r =0.30, p< 0.001). The women who breastfed their infants did not demonstrate these correlations, nor were there significant correlations between maternal stress and serum cytokines. Perceived Stress and Cortisol. To date there is little research exploring the relationships among maternal self perceived stress, cortisol and milk immune composition post-delivery. In animal research, lactating rats were fed water laced with corticosterone. The infant pups had 23 greater levels of corticosterone in their serum and in the milk from their stomachs (Zahwa, Yorty & Bonneau, 2008). The infant rats also demonstrated immune suppression (decreased interleukin-2) in response to a herpes simplex virus exposure. In human research, Groer , Humenick & Hill (1994) found that increased maternal anger and vigor was significantly correlated with greater levels of milk secretory immunoglobulin A (SIgA) (Anger r=0.20, p<0.050, Vigor r=0.35, p< 0.050) in 29 mothers of preterm infants on day 5 post-delivery; however, the correlations were small leaving 88%-96% of the observed variances unexplained. There was an inverse relationship between milk cortisol and the milk SIgA (r= -0.35, p= 0.050). The authors noted that the elevated milk cortisol could have been related to the manipulation of breast tissues via breastfeeding or pumping. The inter-relationships of these variables from the mothers of preterm infants are depicted in Figure 3 below which illustrates that the milk cortisol was not influenced by maternal anger and vigor. ↓Maternal milk cortisol Not Significant ↑Maternal anger ↑Maternal vigor r=0.20, p<0.050 r= -0.35, p=0.050 ↑Milk SIgA r=0.35, p<0.050 Figure 3. Direct Associations of Maternal Anger/Vigor with Milk SIgA Later, Groer, Davis and Steele (2004) explored the relationships among maternal selfperceived stress, maternal serum cortisol, and milk immune composition among 50 mothers of term infants. The authors reported that mothers with higher self-perceived stress (PSS scores) had significantly higher serum cortisol values (r=0.25, p=0.040); and mothers with higher perceived stress had significant greater levels of milk SIgA (r=0.25, p=0.006) at 4-6 weeks postdelivery. Greater levels of maternal serum cortisol were correlated with significantly greater 24 levels of milk SIgA (r =0.26, p=0.035). Using the diagram in Figure 4 below, we can see that there was a slightly stronger relationship of maternal serum cortisol with increased levels of milk SIgA than maternal stress with increased levels of milk SIgA. The serum cortisol may have mediated the direct associations of maternal stress (PSS summed scores) and milk immune components; however, the relatively low correlation leaves 93% of the variance in this relationship unexplained and may not be clinically meaningful. Further research is needed to explore whether these relationships are consistent among different populations of women. r=0.25, p=0.040 ↑Maternal stress (PSS summed scores) ↑Maternal serum cortisol r=0.25, p=0.040 r=0.26, p=0.035 ↑Milk SIgA Figure 4: Direct and Indirect Associations of Maternal Perceived Stress with Milk SIgA and Maternal Cortisol with Milk SIgA Perceived Stress Scale. A psychometric instrument frequently used to measure self perceived stress in health research is the Perceived Stress Scale (PSS) (Cohen, Kamarck & Mermelstein, 1983). It is a 14 item instrument with a five point Likert type scale response format (0= never and 4= very often). The original instrument was tested in a community sample of college students (n=446) and a smoking cessation sample (n=64). The initial internal reliability for this scale ranged from α= 0.84-0.86. The test-retest reliability in the community sample was α= 0.85. Subsequent testing of the psychometric properties of the PSS using various languages and populations has shown consistent internal reliability (Leung, Lam, & Chan, 2010; Mimura & Griffiths, 2004; Ramirez, & Hernandez, 2007; Sharp, Kimmel, Kee, Saltoun, & Chang, 2007). During initial analyses of this scale, construct validity was demonstrated by significant correlations with the College Student Life Event Scale (r=0.76, p<0.001), and the 25 Cohen-Hoberman Inventory of Physical Symptoms (r=0.52, p<0.001) (Cohen, Kamarack, & Mermelstein, 1983). Subsequent analysis using the PSS in pregnant women reported internal reliability (α.= 0.84-0.86) and concurrent validity in women post-delivery with the Tennessee Post-Partum Stress Scale (r=0.62, p< 0.001), serum cortisol (r=0.25, p=0.040) and milk SIgA (r=0.25, p=.006) (Groer et al., 2005; Groer , Davis, & Steele, 2004; Nast, Bolten, Meinlschmidt, & Hellhammer, 2013). The PSS summed scores among women post-delivery at 4-6 weeks (N=352) in several studies were higher (M ranges= 21.3-27.7) than other adult females (25-34 years) in three large cohorts from 1983 (N=593, M =13.45), 2006 (N=331, M =17.78), and 2009 (N=433, M =17.46) (Cohen & Janicki-Deverts, 2012; Groer et al., 2005; Groer , 2005; Groer , Davis, & Steele, 2004). No studies to date have correlated the PSS scores with salivary cortisol within the first two weeks post-delivery which is the time when a mother is adjusting to the new and stressful care-taker responsibilities of motherhood. In summary, psychological stress is associated with immune system changes conducted via the psycho-neuro-endocrine-immunological pathways. Neurotransmitters such as cortisol influence immune cell function but these relationships are also influenced by personal factors such as physical and environmental stress indicators. Earlier research describes a weak but significant relationship of maternal stress with serum cortisol, and serum cortisol with increased antibodies in milk. Further research is needed to explore the relationships of maternal stress and salivary cortisol with milk cytokines which are the messengers of the immune system capable of altering the direction of the immune response (pro-inflammatory/anti-inflammatory). 26 Environmental Stressors Environmental stressors such as lower socioeconomic status, caregiver role, and relationship status are associated with immunity changes across populations (Beckie, 2012; Cohen, Doyle, & Baum, 2006). Lower Socioeconomic Status. For women of childbearing ages, lower socioeconomic status is associated with poor access to health care, poor health behaviors, and adverse pregnancy outcomes (Marinda, Maxson, & Edwards, 2009; Ruiz & Avant, 2005). In a cohort of 294 lowincome women, the following conditions increased the odds of delivering a low birth weight infant: home crowdedness (OR=2.7 [95% CI=1.3-5.6]), job loss (OR=3.1 [95% CI=1.2-7.9]), insecurity over food resources (OR=3.2 [95% CI=1.4-7.2]) (Bryant Borders, Grobman, Amsden, & Holl, 2007). Racial disparities exist among those with lower socioeconomic status: low income AA women deliver more infants with low birth weight <2500 grams) than non-Hispanic whites and Hispanics (Miranda et al., 2009). Public assistance for health care, Medicaid, is often used as a definition of lower socioeconomic status. Medicaid enrollment has increased since the roll out of the Affordable Care Act. Adults enrolled in Medicaid are 70% more likely to have access to a regular place for health care (The Henry J. Kaiser Family Foundation, 2013). It is too early to determine whether the health behaviors of pregnant or lactating women supported by Medicaid have increased related to regular access to care providers; however, the status of Medicaid support indicates the stressor of low income therefore remains an important environmental maternal stressor. Caregiver Role. Caregiver stress is associated with an increased susceptibility to disease (Kiekolt-Glaser et al., 2003; Rice, 2000; Segerstrom & Miller, 2014). The majority of care-giver stress and immunity research has been conducted on elderly caregivers. Immune cell alterations 27 such as the increased production of pro-inflammatory cytokines is associated with caregiver stress in those caring for the elderly (Lovell & Wetherell, 2011). Parents of medically fragile children report greater financial stress, relationship stress, fatigue, and susceptibility to illnesses than parents caring for healthy children (Kuster & Merkle, 2004). Mothers caring for more than one child report lower parenting satisfaction than mothers caring for one child (χ² =4.72, p=0.030); however breastfeeding and social support appears to buffer the effects of this stressor for all mothers (Hung, 2007; Lovell & Wetherell, 2011; Tu, Lupien, & Walker, 2006b). Caregivers of ill children had lower morning cortisol values and elevated pro-inflammatory immune cells thus it is logical that caregiver strain could be a maternal stressor for women caring for multiple children, at least during the first weeks post-delivery when the mother is also caring for a newborn (Jevitt et al., 2012; Lovell & Wetherell, 2011). Relationship Status. Supportive social networks (partner, family, and friends) can improve one’s ability to cope with a stressor (Beckie, 2012; Rice, 2005). Women reporting a lack of social support have greater odds of experiencing adverse outcomes such as the delivery of a low birth weight infant (OR=2 [95% CI=0.97, 4.1], p=0.060), and higher percentage of infant mortality (Centers for Disease Control and Prevention, 2013a). Relationship status can be a descriptive for social support. Single mothers are at greater risk of being below the federal poverty level, living in unstable environments, and dependent on public assistance (Child Trends Data Bank, 2014). In 2010, 39% of women aged 18-44 years old giving birth were either single, married and separated, or married with absent spouse (United States Census Bureau, 2013). In 2013, 71% of all births to non-Hispanic Blacks and 53% to Hispanics occurred outside of marriage compared to 29% non-Hispanic white women; although, there is an increasing trend of 28 births to unmarried cohabitating couples across all races/ethnicities. Given this information, social support can be defined as married, with partner, or single. In conclusion, post-delivery maternal stress is associated with alterations in maternal and infant immunity. Increased levels of maternal serum cortisol can be transferred into milk and potentially suppress the infant immune response in animals. However, lactation may dampen the degree of the maternal stress response. There are no clear relationships between maternal stress indicators (physical, psychological, and environmental), maternal cortisol, and milk immune components. Further study is needed to determine the explained variance of the milk immune components in association with maternal stress indicators (physical, psychological, and environmental) and maternal cortisol. Milk Immune Properties and Maternal Characteristics Human milk is considered the immunological bridge for protecting the infant after delivery by providing both passive and active immune protection (Garofalo, 2010). The milk immune components consist of many cells such as immunoglobulins, growth factors, cytokines and chemokines. Each immune component plays a special role in providing protection and instruction for the developing infant immune system (Agarwal et al., 2011; Goldman, 2007; Lars, 2004). Colostrum is the first milk produced 0-3 days post-delivery and contains larger amounts of immune components than mature milk (Agarwal et al., 2011; Goldman, 2007; Lars, 2004). After 5-9 days mature milk is established and contains increasing levels of fats and carbohydrates necessary for infant growth along with decreasing levels of immune components, primarily the pro-inflammatory cytokines. However, the volume of milk consumed by the infant 29 increases over time, thus it is postulated that the immune component levels consumed by the infant stabilize over time affording long-term on-going protective benefits to the infant. The immune components selected for this study provide the infant with optimum immune protection. These include: secretory Immunoglobulin A (SIgA), epidermal growth factor (EGF), Interleukin-4 (IL-4), Interleukin-6 (IL-6), Interleukin-8 (IL-8 or CXCL8), Interleukin-10 (IL-10), Tumor necrosis factor-alpha (TNF-α), Interferon gamma-induced protein 10 (IP-10 or CXCL10), Monocyte chemotactic protein 1(MCP-1 or CCL2), and Macrophage inflammatory protein (MIP-1α or CCL3). See below for a summary of the milk immune component ranges during the first 14 days post-delivery among mothers of term infants. Table1: Summary of Milk Immune Component Ranges Day1- 14 Post-Delivery Immune Component Cross-sectional Longitudinal Number of Participants Range Day 1-14 Post-delivery SIgA 5 3 576 0.35-117 mg/mL EGF 1 1 39 0-130.4 pg/mL IL-4 2 1 78 0.33-2150 pg/mL IL-6 6 6 562 0-1097 pg/mL IL-8 5 4 448 1.6- 16081 pg/mL IL-10 7 6 713 0-327 pg/mL TNF α 4 6 512 0-432.5 pg/mL IP10 1 1 106 0-2861.4 pg/mL MCP-1 1 0 13 0- 7.09 pg/mL MIP-1α 0 0 0 NA Note: References- Amoudruz et al., 2008; Araújo et al., 2005; Böttcher et al, 2008; Castellote et al., 2011, Ciardelli et al., 2007; Erbağci et al., 2005; Ermis et al., 2009; Fituch et al., 2004; Groer et al., 1994; Holmlund et al., 2010; Kverka et al., 2007; Marek et al., 2009; Mehta & Petrova et al., 2011; Meki et al., 2003; Montagne et al., 1999; Ogawa et al., 2004; Prokešová et al., 2006; Rigotti et al., 2006; Takahata et al., 2003; Tregoat et al., 2001; Yilmaz et al., 2007; Zannardo et al., 2007. Secretory Immunoglobulin A Secretory Immunoglobulin A (SIgA) is the predominant antibody in milk and is essential for the immune protection of the infant mucosa which is the location where pathogens cross-over into the blood stream and accounts for over 90% of infant infections (Agarwall et al., 2011; Brandtzaeg, 2003, 2010; Lawrence & Pane, 2007). Secretory IgA is very resistant to a harsh 30 environment such as the stomach and arrives intact in the infant intestines where infant immunity instruction begins. Eight studies have reported SIgA levels ranging between 0.35-117 mg/mL in colostrums and mature milk up to 14 days post-delivery among mothers of term infants (N=576); the range in values increases to 0.35-275 mg/mL up to 11 months post-delivery (Araújo et al., 2005; Böttcher et al., 2008; Castellote et al., 2011; Ciardelli et al., 2007; Cruz et al., 1982; Ermis, Yildrim, Tastekin & Ors, 2009; Groer et al., 2005; Groer & Shelton, 2009; Groer et al., 2004; Groer et al., 1994; Montagne, Cuillière, Molé, Béné & Faure, 1999; O’Connor, Schmidt, Carroll-Pankhurst & Olness, 1998; Sakamoto et al., 2007; Trègoat, Montagne, Bènè & Faure, 2001). At 3 days post-delivery, Asian mothers of term infants had significantly greater levels of SIgA than African, Eastern European or Italian mothers (Ciardelli et al., 2007). Within 5 days post-delivery, breastfeeding satisfaction was statistically significantly associated with decreased levels of SIgA among 29 mothers of term infants (Groer et al., 1994). At 4-6 weeks postdelivery, infection, serum cortisol, self-perceived stress were significantly associated with increased levels of milk SIgA (N= 50) ( Groer et al., 2004). All of these characteristics are considered maternal stressors. No changes in milk SIgA levels were detected with exercise (N=58), relaxation sessions (N=38), or supplementation with probiotics during pregnancy (N=54) up to 11 months post-delivery (Böttcher et al., 2008; Groer & Shelton, 2009; O’Connor et al., 1998). Lastly, a significant decrease in milk SIgA levels was associated with increased maternal age, smoking status, and higher income (N=50) (Groer et al., 2004). Overall, milk SIgA decreases steadily from 0-14 days post-delivery across all longitudinal studies (Böttcher et al., 2008; Castellote et al., 2011; Montagne et al., 1999). To date, maternal physical, psychological 31 and environmental stressors were associated with changes in the levels of milk SIgA (see Table 2); however, within 14 days post-delivery not much is known about these relationships. Table 2: Summary of Maternal Characteristics and Milk SIgA Time Condition Study N 3 days pp Böttcher et al., 2008 54 3 days pp Africa 3 days pp Asia 3 days pp Eastern Europe 5 days pp Breastfeeding satisfaction 1 mon pp Maternal history of allergy disease-prenatal probiotics Maternal history of allergy disease-placebo Böttcher et al., 2008 Ciardelli et al., 2007 Ciardelli et al., 2007 Ciardelli et al., 2007 Ciardelli et al., 2007 Groer et al., 1994 Böttcher et al., 2008 55 3 days pp Maternal history of allergy disease-prenatal probiotics Maternal history of allergy disease-placebo Italy 54 2.2 (1.4-2.7) Böttcher et al., 2008 55 O’Connor et al., 1998 O’Connor et al., 1998 Groer et al., 2004 Groer et al., 2004 Groer et al., 2004 Groer et al., 2004 Groer et al., 2004 Groer et al., 2004 Groer et al., 2009 14 2.2 (1.5-4.3) Mean±SD 0.47±0.29 9 0.49±0.42 50 497±3.17 9 1106 50 497±3.17 r=0.37 0.010 50 497±3.17 r=0.26 0.035 50 497±3.17 r=0.25 0.006 50 497±3.17 r= -0.34 0.008 r=0.12 <0.390 3 days pp 1 mon pp 4-6 wks pp Relaxation intervention 4-6 wks pp No relaxation intervention 4-6 wks pp Age 4-6 wks pp Smoking 4-6 wks pp Infection 4-6 wks pp Serum Cortisol 4-6 wks pp Perceived Stress (PSS) 4-6 wks pp Income 4-6 wks pp Exercise Note= Values reported mg/mL; pp= post-delivery 32 40 24 24 24 29 58 Milk Values Median (Range) 2.2 (1.4-2.7) 2.2 (1.5-3.5) 4.5 (1.9-8.3) 11.7 (5.2-27.8) 13.2 ( 1.4-42) 8.1 (3.1-36) 209 2.96± 0.29 Test p-value > 0.050 0.007 r= -0.51 0.006 > 0.050 > 0.050 r= -0.32 0.010 0.008 Epidermal Growth Factor Epidermal growth factor (EGF) is one of several growth factors present in human milk. Epidermal growth factor is considered an anti-inflammatory immune component that promotes intestinal epithelial cell growth and maturation thus it is a major contributor to infant intestinal wall integrity (Lars, 2004). However, EGF may also have some immune modulating effects on infant intestinal cells by increasing absorption and permeability. In two human milk studies enrolling mothers of term infants (N=69) the reported EGF levels ranged from 0-130.4 pg/mL from 0-14 days post-delivery; one study at 3-4 weeks postdelivery (N=30) found an increased range of EGF 35.3-283.2 pg/mL (Castellote et al., 2011; Kumral et al., 2009; Kverka et al., 2007). The EGF levels in colostrums were greater than mature milk during the 0-14 day post-delivery window. Infants with jaundice consumed milk with increased levels of EGF in the 3rd-4th week post-delivery compared to infants without jaundice (N=30) (Kumral et al., 2009) (see Table 3). In this study there were no significant differences in maternal demographic variables that may contribute to the variance in EGF; however, EGF could potentially increase infant intestinal absorption of bilirubin. More research is needed to clarify this relationship. In the one longitudinal study, the levels of EGF steadily declined over days 014 post-delivery (Castelotte et al., 2011) see Table 3. Table 3: Summary of Maternal/Infant Characteristics and Milk EGF Time Condition Study N 3±1 day pp Term 10± day pp Term 21-28 day pp Milk Consumed by Infants with Neonatal Jaundice Jaundice Milk Consumed by Infants with No Neonatal Jaundice 21-28 day pp Castelotte et al., 2011 Castelotte et al., 2011 Kumral et al., 2009 Kumral et al., 2009 Note: Values reported as pg/mL; pp= post-delivery. 33 22 Milk Values Mean±SD 75.6±54.8 p-value 22 29.4±9.5 0.050 15 232.2±51 0.020 15 129±35.5 Interleukin-4 Interleukin-4 (IL-4) is a cytokine in milk with a reported range of 0.33- 2,150 pg/mL in three studies enrolling 78 mothers of term infants from 0-14 days post-delivery; two additional studies reported ranges of 25-1031 pg/mL among 110 mothers up to 6 months post-delivery (Groer & Beckstead, 2011; Groer & Shelton, 2009; Kverka et al., 2007; Marek et al., 2009; Prokešová et al., 2006). Interleukin-4 influences changes in naïve T cell lymphocytes which stimulate increased production of more IL-4 components. Marek and colleagues (2009) reported decreased IL-4 levels in colostrums 2-3 days post-delivery from 30 mothers with allergic disease versus 46 mothers without allergic disease, although not statistically significant. In contrast, Prokešová and colleagues (2006) reported significantly greater levels of IL-4 at 3 and 6 months post-delivery in mothers with allergic disease delivering term infants (n=39) versus healthy mothers (n=37) but there were no differences in colostrum IL-4 levels (see Table 4). To date, there is not sufficient evidence to associate milk IL-4 levels with allergic symptoms in infants. The levels of IL-4 varied over time between mothers with or without allergies. Those mothers with allergies had increased levels of IL-4 over 0-3 months days post-delivery (Prokešová et al., 2006). 34 Table 4: Summary of Maternal Characteristics and Milk IL-4 Time Condition Study N 2-3 days pp 2-3 days pp Allergy No Allergy Marek et al., 2009 Marek et al., 2009 30 46 4 days pp Allergy Prokešová et al.,2006 20 4 days pp No Allergy Prokešová et al.,2006 21 3 mon pp Allergy Prokešová et al.,2006 14 3 mon pp No Allergy Prokešová et al.,2006 18 6 mon pp Allergy Prokešová et al.,2006 11 6 mon pp No Allergy Prokešová et al.,2006 16 Milk Values Mean±SD 0.33±0.34 0.36 ±0.37 Median (Range) 235 (134-2150) 172 (53-261) 362 (92-1031) 83 (13-180) 248 (84-363) 61 (25-114) p-value <0.053 0.118 0.009 0.032 Note: Values reported as pg/mL; pp=post-delivery Interleukin-6 Interleukin-6 (IL-6) is cytokine in milk possessing both pro-inflammatory and antiinflammatory actions (Agarwal et al., 2011). IL-6 crosses the blood brain barrier and is responsible for the symptoms of feeling ill and generating fever (Janeway et al., 2005). Although the main actions of IL-6 are to produce an inflammatory response to tissue injury, IL-6 can modulate other immune components to increase the production of SIgA and IL-10 (Agarwal et al., 2009). In 12 studies exploring the levels of IL-6 in mothers of term infants (N=562), the reported range was 0-1097 pg/mL from 0-14 days post-delivery; extending to 6 months postdelivery, the reported range of IL-6 was 1.1-8603 pg/mL (N=152) (Amoudruz et al., 2009; Apaydin et al., 2012; Castellote et al., 2011; Ciardelli et al., 2007; Erbağci et al., 2005; Groer & Beckstead, 2011; Groer & Shelton, 2009; Hawkes, Bryan, Makrides, Neumann & Gibson, 2002; Holmlund et al., 2010; Kverka et al., 2007; Mehta & Petrova, 2011; Meki, Saleem, AlGhazali, Sayed, 2003; Ogawa et al., 2004; Prokešová et al., 2006; Zanardo et al., 2007). 35 Among maternal characteristics, increased levels of milk IL-6 were associated with ethnicity at 5 days post-delivery; Asian mothers (n=24) had significantly increased levels of IL-6 compared with African (n=24), Italian (n=40) Eastern European mothers (n=24) (Ciardelli et al., 2007). Also at 3-5 days post-delivery, immigrants (n=32) had significantly greater levels of IL-6 than the local population (n=32) (Amoudruz et al., 2008); and mothers delivered by caesarian section delivery had greater levels of IL-6 (n=10) ( Mehta & Petrova et al., 2011). However, no changes in milk IL-6 were noted in another study comparing milk from immigrant (n=32) versus local populations (n=33) on day 5 (Holmlund et al., 2011). Maternal prenatal consumption of omega-3 fatty acid supplements (n=29) was associated with decreased levels of milk IL-4 versus placebo (n=25) at 4 weeks post-delivery (Hawkes et al., 2002) (see Table 5). The studies exploring the association of IL-6 with immigrant versus local populations were conducted in Sweden; the locals (Swedish mothers) were compared with women born in underdeveloped countries who then moved to Sweden. Amoudruz and colleagues (2008) suggest that the prior exposure to pathogens in under-developed countries might be the reason for the increased levels of IL-6 in the milk from the immigrant women but this was not supported in the study conducted by Holmlund and colleagues (2011). Further research is needed to explore this relationship. Interleukin-6 levels varied among milk consumed by infants with jaundice: one study reported infants with jaundice received significantly increased levels of milk IL-6 (n=32, p=0.010) versus those infants not jaundiced (n=29); whereas another study reported no differences in milk consumed by jaundiced infants (n=40) versus not jaundiced infants (n=40) (Apaydin et al., 2012; Zanardo et al., 2007). Small sample sizes and conflicting methods across studies indicate further research is needed to assess the variations of this component in milk associated with maternal/infant characteristics. The levels of IL-6 decreased over days 0-30 days 36 post-delivery in three longitudinal studies (Castelotte et al., 2011; Erbağci et al., 2005; Mehta & Petrova et al., 201l). Table 5: Summary of Maternal/Infant Characteristics and Milk IL-6 Time Condition Study N 3 days pp Zanardo et al., 2007 32 Zanardo et al., 2007 29 15.5 (6-40.8) 3 days pp Milk Consumed by Infants with Neonatal Jaundice Jaundice Milk Consumed by Infants with No Neonatal Jaundice Italy 40 3 days pp Africa 3 days pp Asia 3 days pp Eastern Europe 3-5 days pp Immigrant 3-5 days pp Local 3-5 days pp Immigrant 3-5 days pp Local 12-24 days pp 8.3 (4.5-25.1) 4.35 (1.8-25.7) 7 (3.6- 41.8) 9.6 (1.8- 48.1) 58.8 (7-411) 38 (5.4-1097) 44 (7-411) 29 (5.4-1097) 3 (1.4-11.4) Apaydin, 2012 20 20-29 days pp Milk Consumed by Infants with Neonatal jaundice Milk Consumed by Infants with No Jaundice Cesarean section Ciardelli et al., 2007 Ciardelli et al., 2007 Ciardelli et al., 2007 Ciardelli et al., 2007 Amoudruz et al., 2008 Amoudruz et al., 2008 Holmlund et al., 2010 Holmlund et al., 2010 Apaydin, 2012 10 4 wks pp 600 mg DHA 4 wks pp Placebo Mehta & Petrova et al., 2011 Hawkes et al., 2002 Hawkes et al., 2002 3 days pp 12-24 days pp Note: Values reported as pg/mL; pp=post-delivery 37 24 24 24 32 32 32 33 20 29 25 Milk Values Median (Range) 17.5 (11.6-32.3) p-value 0.100 0.004 0.035 > 0.050 0.174 7.2 (1.4-14.6) 32.6 ±8.1 845 (53-2598) 882 (50-2028) <0.050 <.0.050 Interleukin-8 Interleukin-8 (IL-8) is a pro-inflammatory chemokine that recruits white blood cells to tissues that are inflamed by infection or trauma, thus IL-8 plays a contributing role in signaling the inflammatory response (Agarwal et al., 2011). Among nine studies enrolling 448 mothers of term infants the reported range of IL-8 in milk was 0-16 801 pg/mL from 0-14 days postdelivery; the range did not change in additional studies (N=78) exploring milk from 0- 6 months post-delivery (Amoudruz et al., 2008; Apaydin et al., 2012; Castellote et al., 2011; Ciardelli et al., 2007; Erbağci et al., 2005; Groer & Shelton, 2009; Groer & Beckstead, 2011; Holmlund et al., 2010; Kverka et al., 2007; Mehta & Petrova & Petrova, 2011; Meki et al., 2003, Zanardo et al., 2007). Women 5 days post-delivery from Eastern Europe (n=24), and immigrants from underdeveloped countries living in Sweden had greater levels of IL-8 (n=64) versus locals (n=65) (Amoudruz et al., 2008; Ciardelli et al., 2007; Holmlund et al., 2010) (see Table 6). As seen with IL-6, there were conflicting IL-8 values reported in milk consumed by infants with jaundice and those without jaundice (Apaydin et al., 2012; Zanardo et al., 2007). Clearly the reported changes in milk consumed by infants with jaundice are not consistent and the variances described are most likely related to the small sample sizes and differences in collections. Associations are limited at this time. The levels of IL-8 decreased over days 0-30 post-delivery in four longitudinal studies (Castellotte et al., 2011; Erbağci et al., 2005; Mehta & Petrova et al., 2011; Meki et al., 2003). 38 Table 6: Summary of Maternal/Infant Characteristics and Milk IL-8 Time Condition Study N 3 days pp Zanardo et al., 2007 32 3 days pp Africa 3 days pp Asia 3 days pp Eastern Europe 3-5 days pp Immigrant 3-5 days pp Local 3-5 days pp Immigrant 3-5 days pp Local 12-24 days pp Milk Consumed by Infants with Neonatal jaundice Milk Consumed by Infants with No Jaundice Zanardo et al., 2007 Ciardelli et al., 2007 Ciardelli et al., 2007 Ciardelli et al., 2007 Ciardelli et al., 2007 Amoudruz et al., 2008 Amoudruz et al., 2008 Holmlund et al., 2010 Holmlund et al., 2010 Apaydin, 2012 29 3 days pp Milk Consumed by Infants with Neonatal Jaundice Jaundice Milk Consumed by Infants with No Neonatal Jaundice Italy Apaydin, 2012 20 3 days pp 12-24 days pp 40 24 24 24 32 32 32 33 20 Milk Values Median (Range) 752 (465-3496) 583 (247-7052) 2532 (931-8077) 2223 (1534-6298) 4676 (1483-15978) 10477 (2081-16081) 565 (83-3219) 191 (57-6955) 520 (61-3219) 305 (57-6955) 247 (101-439) 166 (75-478) p-value 0.090 0.026 0.017 0.043 0.285 Note: Values reported as pg/mL; pp=post-delivery. Interleukin-10 Interleukin-10 (IL-10) is a primary moderator of the anti-inflammatory immune response by suppressing the Th1 cytokine response and increasing the natural killer cells (NK) that can destroy pathogens. This immune component is needed to prevent the self-destruction of host tissues once a pro-inflammatory response has been initiated (Agarwal et al., 2012; Garofalo, 2010). In 13 studies of milk from mothers of term infants (N=713), the reported levels of IL-10 range 0-327 pg/mL from 0-14 days post-delivery; the range increases to 0-562.2 pg/mL extending to 6 months post-delivery in four mores studies (Apaydin et al., 2012; Böttcher et al., 2008; Castelotte et al., 2011; Ciardelli et al., 2007; Fituch, Palkowetz, Goldman, & Schanler, 39 2004; Groer & Beckstead, 2011; Groer & Shelton, 2009; Holmlund et al., 2010; Kverka et al., 2007; Marek et al., 2009; Mehta & Patrova, 2011; Meki et al., 2003; Ogawa et al., 2004; Prokešová et al., 2006; Rigotti et al., 2006; Yilmaz, Saygili-Yilmaz, & Gunesacar, 2007; Zanardo et al., 2007). Overall, IL-10 levels were decreased in mature milk compared to colostrums. Significantly increased levels of IL-10 were reported in the colostrums (3 days post-delivery) in mothers supplemented with probiotics (n=54) versus placebo (n=55) and significantly greater levels were detected in mothers with allergic disease (n=21) versus mothers without allergic disease at 3 and 6 months post-delivery (Böttcher et al., 2008; Prokešová et al., 2006) (see Table 7). Women born in Africa (n=20) had significantly lower levels of IL-10 than those born in Asia (n=24) , Eastern Europe (n=24) , or Italy (n=40) (see Table 7) (Ciardelli et al., 2007). At 7 days post-delivery, there were no significant differences in the levels of milk IL-10 from mothers of preterm and term infants; however within this cohort, preterm infants diagnosed with necrotizing enterocolitis consumed milk with undetectable or decreased levels of IL-10. This is logical for IL-10 is needed to prevent the infant host tissue destruction during an extreme inflammatory process such as necrotizing enterocolitis (Fituch et al., 2004). It is also suggested that IL-10 assists with the tolerance of friendly bacteria in the intestines which are needed for digestion, thus this cytokine is important to infant intestinal tissue health but the natural variations found in milk are still being discovered (Field, 2005). The levels of IL-10 both increased and decreased across time among four longitudinal studies (Böttcher et al., 2008; Kverka et al., 2007; Rigotti et al., 2006; Yilmaz et al., 2007). 40 Table 7: Summary of Maternal Characteristics and Milk IL-10 Time Condition Study N 3 days pp Böttcher et al., 2008 54 Böttcher et al., 2008 55 3 days pp Maternal history of allergy disease-prenatal probiotics Maternal history of allergy disease-placebo Italy Ciardelli et al., 2007 40 3 days pp Africa Ciardelli et al., 2007 24 3 days pp Asia Ciardelli et al., 2007 24 3 days pp Eastern Europe Ciardelli et al., 2007 24 4 days pp Allergy Prokešová et al.,2006 20 4 days pp No Allergy Prokešová et al.,2006 21 7 days pp Preterm Fituch et al., 2004 15 7 days pp Term Fituch et al., 2004 16 3 mon pp Allergy Prokešová et al.,2006 14 3 mon pp No Allergy Prokešová et al.,2006 18 6 mon pp Allergy Prokešová et al.,2006 11 6 mon pp No Allergy Prokešová et al.,2006 16 3 days pp Milk Values Median (range) 6.6 (4.5-19) 4.8 (1.2-12.7) 6.81 (0.29-106) 0.42 (0.17-4.3) 3.86 (0.25-85.7) 3.31 (0.37-28.2) 197 (46-327) 27 (16-247) 30 (0-283) 43 (31-227) 400 (205-524) 75 (18-335) 27 (13-280) 246 (148-525) p-value 0.046 0.045 0.072 0.630 0.005 0.022 Note: Values reported in pg/mL; pp= post-delivery Tumor Necrosis Factor-Alpha Tumor necrosis factor-alpha (TNF-α) is one of the most abundant milk immune components with pro-inflammatory actions and appears to regulate the immune components functions within milk (Argawal et al., 2010; Garofalo, 2010). The reported range of TNF-α in milk was 1-432.5 pg/mL among mothers of term infants (N=512) in 10 studies measuring milk 0-14 days post-delivery; the range increased to 1-5607 pg/mL in four additional studies extending out to 6 months post-delivery (N=156) (Amoudruz et al., 2008; Apaydin et al., 2012; 41 Böttcher et al., 2008; Castelotte et al., 2011; Erbağci et al., 2005; Ermis et al., 2009; Groer & Beckstead, 2011; Groer & Shelton, 2009; Hawkes et al., 2002; Holmlund et al, 2010; Kverka et al., 2007; Mehta & Petrova & Patrova, 2011; Meki et al., 2003; Zanardo et al., 2007). Not many maternal characteristics (maternal allergy, immigrant status, consumption of omega 3 fatty acids supplements, and milk consumed by infants with jaundice) are linked with significant changes in the levels of TNF-α except for the significantly increased levels of TNF-α found in mothers of preterm infants 6-15 and 20-29 days post-delivery (n=40) and decreased levels of milk TNF-α among mothers who smoke (n=21) versus non-smokers (n=23) (Amoudruz et al., 2008; Böttcher et al., 2008; Ermis et al, 2009; Holmlund et al., 2010; Mehta & Petrova & Patrova, 2011; Zanardo et al., 2007) (see Table 8). After controlling for gestational age on the Mehta and Petrova study (2011), those mothers delivered by caesarian section (n=40) had significantly greater levels of milk TNF-α which makes sense for a pro-inflammatory response would be the first immune response from tissue injury such as surgery. Milk TNF-α protects the infant intestinal cells by regulating a pro-inflammatory immune response to pathogens (Field, 2005; Garofalo, 2010). The levels of TNF-α decreased over 0-30 days post-delivery in five longitudinal studies (Böttcher et al., 2008; Erbağci et al., 2005; Meki et al, 2003; Mehta & Petrova, 2011). 42 Table 8: Summary of Maternal Characteristics and Milk TNF-α Time Condition Study N 3 days pp Böttcher et al., 2008 54 Böttcher et al., 2008 55 Zanardo et al., 2007 32 3 days pp Term- maternal history of allergy disease-prenatal probiotics Term- maternal history of allergy disease-placebo Term with neonatal jaundice Term Zanardo et al., 2007 29 3-5 days pp Immigrant Amoudruz et al., 2008 32 3-5 days pp Local Amoudruz et al., 2008 32 3-5 days pp Immigrant Holmlund et al., 2010 32 3-5 days pp Local Holmlund et al., 2010 33 6-15 days pp Preterm 30 6-15 days pp Term 7 days pp Smoking Mehta & Petrova et al., 2011 Mehta & Petrova et al., 2011 Ermis et al., 2009 7 days pp Non-Smoking Ermis et al., 2009 23 20-29 days pp Preterm Mehta & Petrova et al., 2011 30 20-29 days pp Term Mehta & Petrova et al., 2011 10 3 days pp 3 days pp 10 21 Milk Values Median (Range) 11 (3.9-21) 10 (3.9-23) 28.6 (19.5-46) 21.9 (18.6-37.5) 4.4 (1.8-69) 4.3 (2.7-69) 4.5 (1.8-34) 4.3 (2.6-69) 32.3 (11-69) 17.2 (13-25) Mean (SD) 65.5(32) Mean (SD) 158(117) 25.2 (10-58) p-value 0.450 0.749 <0.040 0.002 <0.020 15.3 (10-26) Note: Values reported as pg/mL; pp = post-delivery. Interferon Gamma-Induced Protein-10, Monocyte Chemotactic Protein-1, and Macrophage Inflammatory Protein-1α The next three immune components are chemokines which are small proteins grouped by two functions: facilitation of immune cell traffic near the site of an infection, and proinflammatory immune response by stimulation of the attraction of immune cells to a particular bacteria or virus (Garofalo, 2010; Janeway 2005). Interferon gamma-induced protein 10 (IP-10 or CXCL 10), monocyte chemotactic protein-1 (MCP-1 or CCL2), and macrophage 43 inflammatory protein-α (MIP-1α or CCL3) have been detected in milk but there is little data on the ranges of these cytokines to date. Current ranges in the literature in milk from mothers delivering term infants 0-4 days post-delivery include IP-10 (0-2861 pg/mL, N=141); and MCP1 (0-6.1 pg/mL, N=13); two other studies measuring milk from term mothers at 4-6 weeks postdelivery report ranges of IP-10 (0-2861 pg/mL, N=141); and MCP-1 (0-6.1 pg/mL, N=13 )and MIP-α ranged 14.1-41.5 pg/mL from 0-4 days post-delivery (N=78) (Groer & Beckstead, 2011; Groer & Shelton2009; Kverka et al., 2007; Takahata et al., 2003). These chemokines are important for they contribute to the protection of the infant against the transmission of viruses such as human immunodeficiency virus in breastmilk (Garofalo, 2010). There was statistically significant decreases in IP-10 levels between colostrum (Day 0-3 post-delivery) and mature milk (> 4 weeks post-delivery) among 72 mothers of term and preterm infants 0-> 4wks post-delivery (Takahata et al., 2003) (see Table 9). Table 9: Summary of Maternal Characteristics and Milk IP-10 Time Condition Study N 0-3 days pp Term and preterm Takahata et al., 2003 39 4-7 days pp Term and preterm Takahata et al., 2003 39 >4 wks pp Term and preterm Takahata et al., 2003 32 4-6 wks pp Term Groer et al., 2009 58 Milk Values Median (Range) 1144.2 (176-2861) 873.4 (0-2457) 518 (81-1162) 1618.3 (2219.3) p-value <0.001 Note: Values reported as pg/mL; pp=post-delivery. There were no statistically significant associations with maternal characteristics and milk chemokines MCP-1 and MIP-1α in the literature to date (see Table 10). 44 Table 10: Summary of Milk MCP-1 and MIP-1α Values in the Literature Time Condition Study MCP-1 0-3 day pp 4-6 wks pp 4-6 wks pp MIP-1α 4-6 wks pp 4-6 wks pp N Milk Values Mean±SD Term Term Term Kverka et al., 2007 Groer et al., 2009 Groer et al., 2011 13 58 20 6.1±0.99 1,653.7±2,644 682.7±2658 Term Term Groer et al., 2009 Groer et al., 2011 58 20 14.1±41.5 14.1±41.4 Note: Values reported as pg/mL; pp= post-delivery. In summary, many of the milk immune components originate from the mammary gland tissues and immune cells; thus the reported levels in milk vary greatly. The milk immune components function individually and synergistically to facilitate the development of an appropriate immune response within the immature infant immune system. Colostrum (days 0-3 post-delivery) in general has greater levels of all immune components than transitional milk (days 4-7) post-delivery and mature milk (> day 7 post-delivery). Significant variations in milk immune components associated with maternal conditions fall into two categories: non modifiable demographical characteristics (age, race/ethnicity, origin of maternal birth), and modifiable characteristics (type of delivery, maternal health, diet, health behaviors) (Agarwal et al., 2011; Thibeau & D'Apolito, 2012). Methodological issues that may contribute to the reported variations in milk immune cell levels include small sample sizes and differences in sample collection and analyses. Small sample sizes are related to feasibility issues of recruitment and collections. Differences in methods of collection such as (1) at the beginning or end of a feed, (2) pooled sample from several pumpings, (3) time of day of the collection, or (4) day post-delivery influences the milk immune cell levels making it difficult to delineate a trend. Variations in milk immune components that appear to be influenced by maternal conditions such as stress are important to explore for the science of milk defines milk as not just the best nutrition, but the best protection for infant health. 45 Role of Milk in Infant Health The biological function of immune components in milk is to protect the infant postdelivery (Agarwal et al., 2011; Brandtzaeg, 2010). Infants are born with a natural innate immune system that functions to generate an immune response but the specific response (proinflammatory/anti-inflammatory) is not fully developed (Lawrence & Pane, 2007; Newburg, 2005). Human milk immune components have the ability to interact directly with the infant mucosal linings of the respiratory and/or gastro-intestinal tracts by stimulating infant immune cell responses (Agarwal et al., 2011: Brandtzaeg, 2010). The infants’ immune memory as a result of this interaction is strengthened for life. Within milk, SIgA and probiotics function to facilitate the development of the acquired immune system in infants (Brandtzaeg, 2003; Newburg, 2005). The maternal transfer of antibodies across the placenta to the fetus occurs around 34 weeks gestation (Brandtzaeg, 2003; 2010). This serves to provide the infant with initial immune protection post-delivery. Once the mother/infant dyad spend time together post-delivery, the mothers mucosal associated lymphoid tissues (MALT) absorb bacteria/pathogens in the mother infant environment to create specific antibodies against these pathogens which is then transferred to the infant via human milk. This process may take 24-48 hours therefore components of the innate immune system (cytokines) serve as the front-line protection (Newburg, 2005). The cytokines within the infant’s innate immune system may have naïve capabilities, thus the maternal cytokines within human milk educate the immature infant cytokines to protect the intestinal mucosa and recognize or tolerate friendly bacteria essential for digestion (Field, 2005; R. Garofalo, 2010; Goldman, 2007). This milieu of immune cells and bacteria within the intestine is known as the intestinal microbiome. 46 It is postulated that the intestinal microbiome is responsible for maintaining a healthy equilibrium within the host intestines and also for mounting the appropriate immune response to promote intestinal health (Murgas Torazza & Neu, 2011). The intestinal microbiome can be manipulated by mode of delivery and breastfeeding. Post-vaginal delivery, the healthy term infants’ intestinal flora is colonized with maternal bacteria such as lactobacillus and bifidobacterium which serve as probiotics that aid indigestion. Post-cesarean section delivery, the infant bypasses this exposure and derives exposures from non-maternal bacteria which creates a less diverse microbiome. Human milk contains probiotics, prebiotics, antibodies and immune components that together influence the infant intestinal microbiome thus breastfeeding is the next best bridge to developing a healthy microbiome environment. New science is linking the developing intestinal microbiome to health and disease during infancy and beyond (Murgas Torazza & Neu, 2011). In a meta-analysis of breastfeeding and infant outcomes in developed countries, 43 studies identified the associations between breastfeeding and infant outcomes (Ip et al., 2007). Infants ever breastfed had lower odds of developing adverse outcomes, especially hospitalization for respiratory tract infections, and gastrointestinal infections including diarrhea than infants exclusively fed formula. See Table 11 for a summary of the outcome data. 47 Table 11: Outcomes of Infants Breastfed at least 3 Months Outcome Acute otitis media Atopic dermatitis Gastro-intestinal infections including diarrhea Hospitalization for lower respiratory tract infections during the first year of life Asthma during the first 2 years of life Obesity between 5-18 years Type 1 diabetes between10-16 years Type 2 diabetes in adolescents and adults Acute lymphocytic leukemia Sudden infant death syndrome Odds Ratio 0.60 0.68 0.36 0.28 95% CI 0.46, 0.78 0.52, 0.88 0.32, 0.80 0.14, 0.54 0.70 0.67 0.36 0.61 0.80 0.79 0.60, 0.81 0.62., 0.73 0.14, 0.94 0.44, 0.85 0.71, 0.91 0.67, 0.93 Clearly breastfeeding assists in developing the infant immature immune system by providing both acquired and innate immune support/instruction that impacts infant outcomes through the first year of life. Priming the intestinal microbiome with immune instructions from breastmilk immune cells reduces the odds of illnesses within the first year of life as well as longterm co-morbidities such as obesity and diabetes. Even though maternal stress may impact infant immune response shortly after birth, it is not yet known if maternal stress alters milk immune cells enough to impact infant health during the first year of life and beyond. Definitions of Terms The primary aims of this study were to explore the relationships among the following variables of interest: AA mothers of term infants, demographics of infants, maternal stress indicators, salivary cortisol, and milk immune components. See below for the conceptual and operational definitions of these variables. 48 Table 12: Conceptual and Operational Definitions of Study Variables Variable Conceptual Definition Operational Definition 1. AA Mothers of Term Infants Mothers who self-report AA race and deliver viable infants ≥ 37 weeks gestation (March of Dimes, 2010). The physical, psychological, and environmental factors that influence the psychobiological processing of perceived stress (Ader, Cohen & Felten, 1995; Lazarus and Folkman, 1984). Mother declares AA race on medical record, infant gestation ≥ 37 weeks in medical record 3. Salivary Cortisol Cortisol in saliva (ng/mL) is a responsive measurement of selfperceived stress and is best described using diurnal samples (Nicholson, 2008). The laboratory assays of salivary cortisol on Day 9 (upon awakening, 30 and 60 minutes after awakening known as the cortisol awakening response or CAR). Cortisol will be reported using ng/mL. Area under the curve will be calculated for the CAR. 4. Milk immune components The components in human milk that provide antiinflammatory, proinflammatory protection for the receiving infant (Goldman, 1993). Infant Birth Weight and Gestational Age are used to describe infant demographics across populations (March of Dimes, 2010). The laboratory assays of milk SIgA, EGF, TNFα, IL-4, IL-6, IL-8, IL-10, IP-10, MCP-1, MIP1α on days 3, 9, and 14 post-delivery. Self-report of the number of feedings/day to estimate immune components/volume of feeding 2. Maternal Stress Indicators 5. Infant Demographics Maternal physical characteristics (age, race, number of previous pregnancies, mode of delivery, smoking, infection, diabetes [selfreport], hypertension [self-report]; psychological characteristics (summed score of the perceived stress scale); and environmental characteristics (relationship status, number of children cared for, and socioeconomic status- private insurance, Medicaid, self-pay) Birth Weight measured in grams, Gestational Age on day of delivery as measured by prenatal ultrasound in weeks/days since gestation 49 CHAPTER 3 METHODOLOGY Design A descriptive study with a longitudinal design was used to explore the relationships among maternal stress indicators and milk immune components on days 3, 9, and 14 postdelivery. The rationale for this design was based on: (1) the known impact of self-perceived stress on the immune system function and overall health over time, and (2) the natural variation of milk immune components during the first two weeks post-delivery (Agarwal et al., 2011; Elenkov & Chrousos, 2002; Segerstrom & Miller, 2004). Prospective longitudinal cohort designs provide the opportunity for multiple measurements within the same panel of participants which strengthens internal and external validity by providing opportunities to observe individual changes in dependent outcomes over time and reducing multiple cohort effects by using the same group of participants (de Vaus, 2001). Setting The research setting was a quaternary teaching hospital in the New Orleans metropolitan area. This facility delivers over 2,500 term infants /year. Infants stay with the mother on the Mother baby unit if both the mother and infant are healthy post-delivery. There is a Regional Level III Neonatal Intensive Care Unit on site for infants that need specialized services. Sample and Sampling Plan Sample enrollment was projected to be 100 participants given a 20% drop-off rate based on a prior feasibility study, and a minimum of 75 participants which is required to achieve 50 statistical significance (80% statistical power, alpha=0.050) for a 0.30 correlation (small), and associations with shared variability of at least 10% (Malgady & Krebs, 1986). To reduce the response variability due to racial differences, only AA women were recruited. Study inclusion criteria including the following: maternal age ≥18 delivery of a viable term infant with 5 minute Apgar score ≥ 7, gestational age ≥37 weeks, and a birth weight ≥ 1800 grams able and willing to provide written informed consent able and willing to provide human milk samples Study exclusion criteria included the following: known drug addiction placental abruption Methods for Participant Recruitment All AA mothers who delivered healthy term infants in the research setting were approached by the lactation consultant team within 24 hours post-delivery. The lactation team presented the study flyer to the mother describing the study (see Appendix A). If the mother expressed interest, the lactation team notified the principal investigator of a potential participant or the potential participant called the principal investigator directly on the phone using the number provided. The principal investigator used the electronic medical record to ascertain inclusion/exclusion criteria information. The principal investigator or study staff approached all mothers meeting eligibility criteria within 72 hours post-delivery to further describe the study and answer any study related questions. It was estimated that greater than 90% of mothers approached would agree to participate in this study based on previous experiences in a feasibility 51 study where 100% women approached gave informed consent and 100% recommended this type of research study to other mothers (Thibeau & D'Apolito, 2011). Human Participant Protection Human participant protection was provided in accordance with the guidelines set forth by the Office of Research Integrity and Title 45 of the Code of Federal Regulations, Part 46 (45CFR 46), Subpart A-C. The research consent met these requirements (see Appendix B). The principal investigator contact information was given to all participants on the consent form. Once consent was signed, an individual participant ID was assigned to the participant. All mothers received the standard lactation services provided by the institution at all times regardless of participation in this study. Should the study participant report any issues related to pumping such as sore, cracked nipples, lumps, and/or fever during communication with the principal investigator or study staff, the mother was referred to the lactation and/or medical team for assessment and treatment. The provision of social services, a standard of care for all mothers post-delivery, was available for all study participants as part of their routine healthcare services. The principal investigator and study staff were responsible for notifying social services should individual selfreported psychosocial issues arise. All milk and cortisol samples were pre- labeled with the participant ID number and the day of collection. Participants were informed that the frozen milk and saliva samples would be stored in a biobank freezer for future data analysis in a secured storage in the lab designated by the institution of IRB record. The principal investigator and study staff had access to the participants’ medical record numbers (MRN) during data collection; the link between MRN and participant ID were stored on an encrypted computer of the principal investigator in a locked 52 office only accessed by the principal investigator. All demographic and survey data collected were archived in REDCap™, a secure electronic storage site of Vanderbilt University (Vanderbilt University, 2014). Biological data was stored on an encrypted computer of the principal investigator. Participants were informed that their participation was voluntary and that they could withdraw from the study at any time. Participants were also informed that there was no direct benefit to the mother or infant by participating in this study but the knowledge gained from this study may benefit future mothers and their infants. A $ 25 gift card was given to the participants when all study materials were received by the principal investigator. Data Collection and Analysis Measurements and Instruments The following instruments and measurements were used for data collection: 1. Mothers’ Survey –the self-report of maternal characteristics such as age, ethnicity, race, brief physical-social history that was relevant for this research (see Appendix C). Data points chosen were selected to increase external validity of the sample of mothers. 2. Perceived Stress Scale- The Perceived Stress Scale (PSS) is a 14 item instrument with Likert type response options ranging from 0-4 (0= never and 4= very often). A summed score was created by reversing the scores on the seven positive items (items 4, 5, 6, 7, 9, 10, and 13), e.g., 0=4, 1=3, 2=2, etc., and then summing across all 14 items (see Appendix D) (Cohen et al., 1983). 3. Maternal-Infant Data Collection Sheet -the following variables on each mother/infant dyad were obtained from the medical record (see Appendix E): a. Infant gender (nominal) - male, female 53 b. Infant birth weight (ratio) -first weight post-delivery in grams c. Gestational age (GA) (ratio) -reported GA on day of delivery determined by using the obstetrical estimate since last menstrual period and or prenatal ultrasound d. Infant length of stay (ratio) - calculated by the numbers of consecutive days hospitalized post-delivery e. Maternal diabetes - last HbA1C documented in the medical record of the mother f. Maternal blood pressure (interval)- last blood pressure documented in the medical record of the mother g. Volume of human milk feedings (ratio)- number of times infant breastfed or breasts pumped per day on Days 3, 9, and 14 post-delivery 4. Salivary Cortisol- Participants were given detailed instruction on collection and storage of saliva (see Appendix F). Saliva was collected from the participant after Day 14 of study procedures and stored in the biobank freezers (-20º C) of the institution of IRB record then bulk shipped overnight to the Vanderbilt Clinical Research Core lab for analysis using ELISA assay kits purchased from ALPCO which uses an immune-enzymatic colorimetric method for quantitative determination of cortisol concentration in saliva. a. The preparation of the quality controls, wash buffer, and substrate were prepared according to the manufacturer’s instructions. b. The previously frozen saliva samples were defrosted and centrifuged at 3000 rpm for 10 minutes; the clear saliva (separated from precipitants by the centrifuge) was used in the analysis. c. 20 µl of standards, controls, and saliva samples were pipetted to appropriate wells on each plate 54 d. 100 µl of conjugate (antibody) was added to each well e. The plates were incubated on a horizontal plate shaker for 45 minutes at room temperature (15-30º C) f. The wells were washed 3x with 300 µl of wash buffer and the plates were then tapped firmly against absorbent paper to ensure the plates were dry g. 150 µl of substrate solution was pipetted into each well at timed intervals h. The plates were incubated on a horizontal plate shaker for 15-20 minutes at room temperature (15-30º C) or until calibrator A turned a dark blue color i. The wells were aspirated and washed 5x with 250 µl of ELISA wash buffer j. 50 µl of ELISA stop solution was added to each well at the same timed intervals as in step c k. Using an ELISA reader at 450 nm the absorption was determined immediately To calculate the saliva values, the mean optical density was calculated and used to build a calibrator curve with the mean optical densities on the Y-axis and the calibrator concentrations on the x-axis. Control samples were analyzed for each run, those results outside the quality control values were reported as not valid (QNS). Results within the quality controls values were reported in ng/mL. 5. Milk measurements- Participants were given detailed instruction on the collection and storage of milk (see Appendix G). Milk was collected from participants after Day 14 of study procedures and stored in the biobank freezers (-80º C) of the institution of IRB record then bulk shipped overnight to the Biobehavioral lab at the University of South Florida for analysis. The previously frozen milk samples were defrosted then centrifuged at 5000 rpm 55 for 5 minutes. The fat layer was manually removed and the whey filtered before the sample was aliquotted into Eppendorf tubes and stored at – 80° C until analysis. a. Milk cytokines/chemokines (EGF, IL-4, IL-6, IL-8, IL-10, TNF-α, IP-10, MCP-1, MIP-1α) were measured in a Luminex MAGPIX instrument using a Milliplex MAP Kit purchased from EMD Millipore Corporation. The kit contained fluorescent-coded magnetic beads (microspheres) with antibody capture that bind with the individual cytokines/chemokines. b. The preparation of the quality controls, wash buffer, matrix and human cytokine standards followed manufacturer instructions. c. The plates were prepared using the following procedures i. 200 µl of wash buffer was added to each well then placed on horizontal plate shaker for 10 minutes at room temperature (15-30ºC) ii. The plates were inverted on an absorbent surface and gently tapped to drain the wells, 25 µl of standard or control was added to appropriate wells, 25 µl assay buffer to background and sample wells, 25 µl of matrix solution to background, standards and controls wells, 25µl of samples to sample wells, and 25 µl of beads to each well after vortexing bead bottle to suspend beads. iii. The plates were sealed with foil and incubated overnight (16-18 hours) on a horizontal plate shaker at 4ºC iv. The plates were inverted and tapped on absorbent surface to remove residual amount and then the wells were washed 2x with 200 µl of wash buffer (plates were inverted to drain after each wash) 56 v. Next, 25 µl of detection antibodies were added to each well, the plates were sealed with foil and incubated on a horizontal plate shaker for one hour at room temperature (15-30ºC) vi. The plates were not aspirated. Next, 25 µl of Streptavidin-Phycoerythrin was added to each well, then the plates were sealed with foil and incubated on a horizontal plate shaker for 30 minutes at room temperature (15-30ºC) vii. The plates were inverted to drain well contents on absorbent surface and then 150 µl of drive fluid was added to each well, then the plates were placed on horizontal plate shaker for 5 minutes d. The prepared plates were then placed in the MAGPIX where the microspheres were passed through a laser which stimulated a specific fluorescent dye on each microsphere. A high speed digital processor identified each microsphere and quantified each cytokine/chemokine assay. Control samples were analyzed for each run and those values outside the controls were reported as not valid. Values were reported as pg/mL. When the value was below the limit of detection (LOD), half the value was used between 0 and LOD. When the value was above the limit of detection, the average of the values was used. 6. The milk SIgA was measured using an ELISA kit purchased from ALPCO. a. The assay plates were prewashed 5x with 250 µl ELISA wash buffer before use. The whey milk (separated from fat ) was diluted in ELISA wash buffer to create a final dilution of 1: 60,000 for Plate 1; 1:150,000 for Plate 4; and 1:200,000 for Plates 2, 3, 5, and 6 using the following steps: i. 1:60,000 dilution 57 1. 5 µl milk sample + 495 µl wash buffer mixed well= dilution 1 (1:100) 2. 5 µl Diluent 1+495 µl wash buffer = dilution 2 (1:100) 3. 84 µl Diluent 2+416 µl wash buffer=Final solution to load onto plate (1:6) ii. 1: 150,000 dilution 1. 5 µl milk sample + 495 µl wash buffer mixed well= dilution 1 (1:100) 2. 5 µl Diluent 1+495 µl wash buffer = dilution 2 (1:100) 3. 15 µl Diluent 2+475 µl wash buffer=Final solution to load onto plate (1:15) iii. 1:200,000 dilution 1. 5 µl milk sample + 495 µl wash buffer mixed well= dilution 1 (1:100) 2. 5 µl Diluent 1+495 µl wash buffer = dilution 2 (1:100) 3. 25 µl Diluent 2+475 µl wash buffer=Final solution to load onto plate (1:20) b. 100 µl of standards and controls were added to appropriate wells, then incubated for one hour on a horizontal mixer at room temperature. c. The wells were then aspirated and washed with 250 µl ELISA buffer. In each well, 100 µl of conjugate were added and incubated for one hour on a horizontal shaker at room temperature. d. The contents of the plate were removed and the wells were washed 5 times 250µl wash buffer using a plate washer and 100 µl of substrate was added before the final incubation for 10-20 minutes at room temperature. 58 e. An ELISA stop solution (100 µl) was added to the wells and using a photometer the SIgA was quantified. SIgA were reported as mg/mL. In a previous feasibility study, the University of South Florida (USF) College of Nursing Biobehavioral Lab was used to process the samples of milk from mothers of preterm infants collected on Day 7 post-delivery (Thibeau & D'Apolito, 2011). The majority of the milk values from the feasibility study fell within ranges of milk analyzed at the USF lab (see Table 13) thus the USF lab was used for the analyses of milk samples from this study. Table 13: Comparison of Milk Immune Components in Preterm Milk Analyzed at USF Thibeau & D’Apolito (2011) Groerunpublished (2014) TNF Median (Range) 16.6 (9, 90) IL-4 Median (Range) 1.6 (1.6, 2.8) IL-6 Median (Range) 2.2 (0.8, 73.5) IL-8 Median (Range) 64.7 (0.8, 139) IL-10 Median (Range) 0.8 (0.8- 4) IP-10 Median (Range) 0.8 (0.8, 6288) MCP-1 Median (Range) 0.8 (0.8) M (SD) 20.3 (18.3) M (SD) 12.9 (29.2) M (SD) 22.9 (28) M (SD) 475 (2241.2) M (SD) 11.9 (23.1) M (SD) 1971.5 (2968.3) M (SD) 2047.2 (2559.8) Note: Values reported as pg/mL. Procedures The principal investigator met with the study staff to review training and procedures prior to enrolling participants (see Appendix H). Training included orientation to the following: presentation of study flyer to potential participants (see Appendix A), orientation to the consent process and consent form (see Appendix B), Maternal-Infant Data Sheet (see Appendix E), participant participation packet which included all necessary instructions (see Appendices F and G), and supplies required to participate in this study. A phone number to reach the principal investigator was given to each study staff and the nursing manager of the Mother-Baby Unit should any questions arise. This information was also written on the consent and instruction materials. 59 The principal investigator or study staff explained the purpose and details of the study to the participants and obtained the written informed consent. The written consent was obtained before the participants were discharged from the hospital. A signed copy of the consent was given to the participants and they were instructed to keep the copy with their personal records. All enrolled participants received a kit which included the following: 1. The collection, storage and transport of milk samples and survey instructions (see Appendix G) 2. Three small milk collection containers with study ID labels 3. The collection, storage and transport of saliva samples instructions (see Appendix F) 4. Three salivette collection containers with study ID labels 5. One paper copy of the Mothers’ Survey (Appendix C) 6. Three paper copies each of the Perceived Stress Scale (Appendix D) labeled with study ID labels and day to respond 7. One envelope labeled with study ID label 8. One pen 9. A milk transport bag with icepack, and microwave sterilization kit for pumping supplies The principal investigator or study staff instructed each participant on the proper collection, storage and handling of milk and saliva as well as transportation of the samples to the principal investigator. On collection days 3, 9 and 14 post-delivery, the enrolled participants were instructed by the principal investigator or study staff to do the following: (1) wash hands before pumping and/or handling milk; (2) pump both breasts and pour the colostrum/milk into a sterile container and place the container into a refrigerator; (3) place approximately 5 ml into the study container marked with study ID/date; (4) place the study milk sample in a home freezer; 60 (5) complete each of the perceived stress scales as instructed and place in the envelope provided; (6) complete the Mothers’ Survey on any day of collection and place in the envelope provided; (7) collect saliva samples on Day 9 following instructions; (8) bring the completed surveys and the milk samples to the principal investigator at the mutually scheduled time and location. Sample storage freezers (-80 º C for milk and – 20 º C for saliva) within the research settings were provided with emergency back-up electrical generators. A 24/7 telephone number to reach the principal investigator was placed on the outside of the freezer storage containers so that bio-bank could call at any time for any issues/concerns with stored samples. The stored milk samples were shipped overnight to the Biobehavioral Laboratory at University of South Florida in Tampa, Florida. The stored saliva samples were shipped overnight to the Clinical Research Center lab at Vanderbilt University, Nashville, Tennessee. Shipments were packed in dry ice pellets, labeled according to shipping guidelines, and received by respective labs the following morning. Confirmation of shipment integrity upon arrival was confirmed by the laboratory technicians in each receiving lab. Data Preparation All data were entered into REDCap™, the secure research electronic data capture storage web-portal of Vanderbilt University. Data files from REDCap™ were then downloaded and entered into SPSS V 18 on the principal investigator’s encrypted computer. Only the principal investigator had identification access to this computer. All data sheets and the individual surveys were stored in a locked cabinet within the principal investigators office. When all data analysis was complete, the individual surveys and data collection sheets were transferred to the secure storage of the IRB of record. All data files and analysis results were stored on the principal investigator’s encrypted computer for the duration of analysis. 61 Missing Data A complete data set per subject was defined as the following: completed Mothers Survey, PSS for Day 3, 9, and 14, milk samples on Day 3, 9, and 14, and saliva samples on Day 9. Incomplete surveys and biological specimens that were not sufficient for analysis were not included in the study analyses of Aims 1 and 2. A biological specimen was considered sufficient for analysis if there was enough milk or saliva within the collection container to use in the assay tests (quantities were determined by the laboratory technicians) and the values fell within the quality controls of the assay test. Data Analysis General Demographic and static maternal stressor data were collected at the beginning of the study. Subsequently, the Perceived Stress Scale (PSS), breast milk SIgA and cytokine/chemokine (C/C) content were collected on days 3, 9 and 14 postpartum. On day 9 a salivary sample was collected to analyze cortisol content. Cronbach’s alpha statistics were generated to measure the internal consistency of the PSS responses at each time of assessment. Descriptive statistics were used to summarize and assess the distributional characteristics of all study variables. Milk (SIgA, C/C) and salivary cortisol values were positively skewed. The square root transformation of these variables resulted in suitable distributions for use in parametric statistical analyses. The validity of the collected milk components (i.e., that the pattern of change was consistent with expectations) was assessed using mixed-level general linear models. Initially an overall test of differences among the 3 days of collection was conducted. If the overall test was statistically significant, post-hoc pairwise tests using a 62 Bonferoni-corrected alpha were conducted. Unless specifically noted, an alpha of 0.05 was used to determine the statistical significance of any results. Demographic and stress indicator data from those enrolled who completed the study compared to those who did not complete the study were compared (see Figure 6 for description of sample used in analysis). Chi-Square Tests of Independence were used to test for differences in the nominal data. Mann-Whitney Tests were performed to test for differences in the continuous data. Analysis Specific to Aim 1 Pearson correlations were used to assess the correlations among the study variables on each day of collection. Three matrices were generated for each day: (1) age, number of previous pregnancies, mode of delivery, smoking, antibiotics received during pregnancy, diabetes, hypertension, number of children under care, private insurance, Medicaid, self-pay, and relationship status; (2) PSS with matched milk immune components (SIgA, C/C) on each day; and (3) milk SIgA, EGF, IL-10, IL-4, IL-6, IL8, IP-10, MCP-1, MIP-1α, and TNF-α on Day 3, Day 9, Day 14. For Day 9, the addition of salivary cortisol was included. Pearson correlations were used to assess the correlations of study variables on Day 3 with Day 14. A new milk change variable was created by subtracting the Day 14 values from Day 3 values. The milk change values were rank transformed to obtain normal distributions except IL6, IP-10, and MCP-1 which were normally distributed. A linear regression was used to assess correlations of study variables on Day 3 with Day 14 controlling for the milk values of Day 3. Multiple linear regressions were used to assess previously reported maternal stress indicators as a single model on levels of milk immune components by day post-delivery. Pearson correlations were used to assess the correlations of maternal stress indicators with salivary 63 cortisol. Associations for Aim 1 were considered to be clinically meaningful if they indicated at least 10% variance shared (i.e. r (unadjusted) or beta (adjusted) =0.33). Analysis Specific to Aim 2 Multiple linear regressions were used to assess the meditational effect of maternal cortisol on the association of maternal self-reports of maternal stress with immune components. This proposed mediational effect is illustrated in Figure 5. The bolded, single-ended arrows illustrate a proposed mediational path of cortisol. The estimate of the degree to which cortisol mediates the relationship between maternal stress self-report and milk immune components is the estimate of the overall indirect effect of maternal stress on immune components (e.g., path: a12 [PSS-cortisol] +b23 [cortisol-milk]); an estimate of the respective overall direct effect of maternal stress on immune components (without cortisol mediation) is the direct path (e.g., c13 [PSSmilk]). Maternal Self-Report of Stress (PSS), T1] a12 c13 Maternal Salivary Cortisol [T2] b23 Milk SIgA & C/C [T3] 3 Days Post-delivery 9 Days Post-delivery 14 Days Post-delivery Figure 5: Analytical Strategy for Aim 2 64 CHAPTER 4 RESULTS During the 434 days of active enrollment, there were 865 AA term deliveries, of which 328 (38%) met eligibility criteria and were approached for consent to this study. A total of 139 (42%) of those women approached consented. Of the 139 women consented, 89 (64%) returned study materials and received a gift card valued at $25.00. Four of the 89 women returned incomplete surveys. Reasons that contributed to the 36 % attrition rate included: 21.5 % (30/139) stopped breastfeeding by Day 9, 8 % (11/139) stopped breastfeeding by Day 14, and 6.5% (9/139) were lost to follow-up. On day three 72% (n=100) of the participants submitted breast milk samples and 64% (n=89) submitted milk samples on days 9 and 14. On day nine 63% (n=88) of the participants submitted saliva samples. The number of saliva samples sufficient for lab analysis of cortisol at the three collection time periods on Day 9 was 83/88 (94%). The number of milk samples sufficient for lab analysis of milk immune components by day of collection included: Day 3= 63/100 (63%) of SIgA and 68/100 (68%) of cytokines/chemokines (C/C), Day 9=78/89 (88%) of SIgA, C/C, and Day 14=74/89 (83%) of SIgA, C/C (see Figure 6). Due to the nonrandom nature of the incomplete data, no values were imputed; therefore the data from 85 (61%) women were used for data analyses (for details see Figure 6). 65 Attrition N=50 Stopped breastfeeding Day 9=30 Stopped breastfeeding Day 14=11 Lost to follow-up=9 Enrolled N=139 Returned Samples and Surveys N=89 Returned Milk Day 3=100, Day 9=89, Day 14=89 Returned Saliva Day 9=88 Complete Surveys N=85 Milks Sufficient for Analysis Day 3 N=63 sIgA, N=68 C/C Day 9 N=78 all Day 14 N=74 all Cortisol Sufficient for Analysis N=83 Aim 1 Aim 2 Day 3 N=59 sIgA, N=63 CC Day 9 N=73 all milk Day 14 N=73 all milk Cortisol N=74 PSS matched to milk by day sIgA N=70 C/C N=70 Cortisol N=70 Day 3 PSS matched to milk Figure 6: Summary of Data Variables Used in Analyses of Aims 1 and 2 Descriptive Summaries The baseline characteristics of those women who completed the study (N=85) and those who did not (N=54) are summarized in Table 14. No statistically significant differences between groups were observed. The average age of the mothers was 27.8 years, 51.8% of the infants were male, the average infant gestation was 39.3 weeks, median infant birth weight was 3245 grams (7.2 lbs), and length of stay for mothers/infants was 3.12 days. 66 Table 14: Sample Demographics Inadequate Data= 54 Maternal Age- years Infant Birth Weightgrams Infant Gestational Age- weeks Mother/Infant Length of Stay- days M (SD) 26.6 (5.8) Study Sample= 85 Mdn (IQR) M (SD) 27.8 (4.7) 3220 (2994,3511) P Value Mdn (IQR) 3245 (3015,3713) 0.165 0.696 39.6 (1.0) 39.3 (1.1) 0.100 3.24 (0.6) 3.14 (0.5) 0.267 N (%) N (%) Infant Gender 0.387 Male 32 (59.3) 44 (51.8) Female 22 (40.7) 41 (48.2) Note: Independent t-Tests were performed for maternal age, infant gestation, mother infant length of stay; Mann Whitney Test was performed for infant birth weight; Chi Square Test of Independence was performed for infant gender. Baseline maternal physical stress indicators of the group of mothers in the study and those with inadequate data are summarized in Table 15. Again there were no statistically significant differences between the groups. Within the study sample, 64.7% experienced vaginal delivery, 34.1 % had no prior pregnancies, 34.1% received antibiotics, 7.1% reported hypertension and diabetes, and 3.5% reported smoking. Table 15: Summary of Maternal Physical Stress Indicators Inadequate Data=54 Study Sample=85 P Value N (%) N (%) Number of Previous Pregnancies 0.832 0 16 (29.6) 29 (34.1) 1 18 (33.3) 28 (32.9) =>2 20 (37.0) 28 (32.9) Mode of Delivery 0.835 Vaginal 34 (63.0) 55 (64.7) Cesarean section 20 (37.0) 30 (35.3) Smoking Unknown 3 (3.5) Infection- received antibiotics Unknown 29 (34.1) Hypertension Unknown 6 (7.1) Diabetes Unknown 6 (7.1) Note: Chi Square test of Independence was performed on Number of Previous Pregnancies and Mode of Delivery 67 Maternal self-perceived stress (PSS) summed scores on Days 3, 9, and 14 are summarized in Table 16. There were no statistically significant differences in the self-report of perceived stress between groups. Table 16: Summary of Maternal Psychological Stress Indicators Inadequate Data=54 PSS Summed Scores Day 3 Day 9 Day 14 PSS Items Day 3 Day 9 Day 14 N 22 11 11 22 11 11 Study Sample=85 Mdn (IQR) 20 (14,28) 14 (10,25) 24 (11,30) Cronbach’s alpha 0.92 0.89 0.93 N 63 74 74 63 74 74 Mdn (IQR) 16 (10,21) 19 (12,26) 18 (11,26) Cronbach’s alpha 0.88 0.89 0.89 P Value 0.099 0.699 0.463 Note: Mann Whitney Tests were performed. Baseline maternal environmental stress indicators of the group of mothers in the study and those with inadequate data are summarized in Table 17. Again there were no statistically significant differences between the groups. Approximately 46 % of the study sample was married, 52.9% cared for at least one child, and 63.5% reported Medicaid enrollment. Table 17: Summary of Maternal Environmental Stress Indicators Number of Children in Care 1 ≥2 Insurance Status Private Medicaid Self Pay Relationship Status Single Married W/Partner Inadequate Data=54 Study Sample=85 N (%) N (%) 28 (51.9) 26 (48.1) 45 (52.9) 40 (47.1) Unknown Unknown Unknown 49 (57.6) 54 (63.5) 3 (3.5) Unknown Unknown Unknown 23 (27.1) 39 (45.9) 23 (27.1) P Value 0.900 Note: Chi Square Test of Independence was used for Number of Children in Care. Baseline salivary cortisol values of the group of mothers in the study sample and those with subsequent inadequate data are summarized in Table 18. There were no statistically 68 significant differences between the groups. The peak cortisol value of mothers in the study sample (all African American) was at the 30 minutes post awake time period. This finding replicates similar findings reported in the literature with heterogenous racial groups describing the peak morning cortisol awakening response (CAR) being 30-45 minutes post awakening (Adam & Kumari, 2009; Fekedulgen et al., 2007). Table 18: Summary of Cortisol Values Salivary Cortisol Awake 30 minutes 60 minutes AUC Inadequate Data=9 Study Sample=73 Mdn (IQR) Mdn (IQR) 11 (7.7,38.2) 16 (5.3,35.0) 18 (8.4,30.0) 30 (13.7, 67.8) 19 (11.4, 25.0) 21 (12.3, 30.0) 18 (10.0, 27.0) 40 (24.3, 53.1) P Value 0.598 0.372 0.694 0.501 Note- Values reported as ng/mL; Mann Whitney Tests were performed. Milk immune component values are summarized in Table 19 below. The ranges on all three days of collection fell within those in the published literature (see Table 1 and Table 19). 69 Table 19: Summary of Milk Immune Component Values Final Analysis Set N Mdn (IQR) Day 3 SIgA EGF IL-10 IL-4 IL-6 IL-8 IP-10 MCP-1 MIP-1α TNF-α 59 63 63 63 63 63 63 63 63 63 SIgA EGF IL-10 IL-4 IL-6 IL-8 IP-10 MCP-1 MIP-1α TNF-α 73 73 73 73 73 73 73 73 73 73 24.4 (11.2, 46) 8542 (6350, 12436) 3.8 (1.2, 13.4) 1 (0.37, 1.6) 35 (17.1, 71.1) 144 (63, 738.5) 1392 (716, 2442) 532 (148.8, 1386) 63.2 (29.7, 199) 29 (15.7, 39) Day 9 13.3 (5.5, 16) 11696 (6732, 13491) 1.4 (0.82, 5.7) 0.6 (0.37, 1.6) 14 (5.2, 32.4) 33.2 (7.2, 98) 1539 (739, 2552) 558 (132.5, 2345) 12.8 (4.7, 33.5) 16.4 (8.7, 30) Day 14 73 12.5 (6, 17.8) SIgA 73 12087 (6732, 14227) EGF 73 1.7 (0.73, 4.5) IL-10 73 1 (0.37, 1.6) IL-4 73 12.3 (5.2, 33) IL-6 73 35 (7.5, 109) IL-8 73 1165 (630, 2108) IP-10 73 336.2 (113, 1016.4) MCP-1 73 12.5 (5.5, 46) MIP-1α 73 15.7 (11, 27) TNF-α Note- SIgA is reported as mg/mL, all other values reported as pg/mL. 70 Validity of Milk Overall Changes by Day Post-Delivery Milk immune component overall changes by day post-delivery are summarized in Table 20 below. There were statistically significantly decreased levels of SIgA, IL-6, IL-8, IL-10, MIP1α and TNF-α from Day 3 -Day 9 and from Day 3- Day 14; these differences were not statistically significant from Day 9-Day 14. There were statistically significant increased levels of EGF from Day 3 -Day 9 and from Day 3-Day 14. There were no statistically significant changes in milk values of IL-4, IP-10, and MCP-1 between Days 3, 9 and 14 (see Table 20). Table 20: Summary of Milk Overall Changes by Day Post-Delivery Milk Day 3 Day 9 Day 14 N Overall p-value a Post-Hoc b Median N Median N Median (IQR) (IQR) (IQR) SIgA 48 26.2 48 9.3 48 10.5 <0.001 Day 3 > 9,14 (10.5-47.8) (5.5-15.7) (6.1-20.6) EGF 51 9189 51 11697 51 12436 0.001 Day 9, 14 > 3 (6731-12435) (6732-12437) (6974-14285) IL-10 51 4.6 51 1.4 51 1.6 <0.001 Day 3 > 9,14 (1.3-13.8) (0.8-3.3) (0.7-4.2) IL-4 51 1 51 0.7 51 1 0.560 (0.4-1.6) (0.4-1.6) (0.4-1.6) IL-6 51 38.5 51 16.6 51 12.6 <0.001 Day 3 > 9,14 (18.8-81.8) (5-35) (5-40.2) IL-8 51 163.4 51 31.7 51 34.8 <0.001 Day 3 > 9, 14 (63.1-739) (6.8-97) (7.5-97.7) IP-10 51 1392 51 1087 51 1164 0.327 (763-2498) (575-2317) (633-2138) MIP-1α 51 61.4 51 12.7 51 12.5 <0.001 Day 3 > 9,14 (29.7-199.8) (4.9-32.6) (6.4-49.2) MCP-1 51 729.4 51 475 51 352 0.168 (198.5-1977) (108.4-2549) (122-891.5) TNF-α 51 29.5 51 15.2 51 16.1 <0.001 Day 3 > 9,14 (15.1-39.5) (8.6-26.6) (11.5-28.3) Note: a= Friedman test; b= Wilcoxin signed rank, statistical significance adjusted using bonferonni correction 0.05/3(days)=0.017. 71 Analysis of Hypotheses Aim 1 Assess the associations of maternal stress indicators with specific milk immune components (antibodies, cytokines, and chemokines) from AA mothers of term infants during the first 14 days post-delivery. Day 3 Summaries of the association of maternal stress indicators with milk immune components on Day 3 post-delivery are summarized in Table 21. Physical Stressors. Four out of the seven physical stressors measured in this study were statistically significantly associated with levels of milk immune components on Day 3. Lower levels of EGF were observed in women who had received antibiotics (r=-0.29, p=0.024) than those who had not, as well as in those women who self-reported a diabetes diagnosis (r=-0.30, p=0.016) compared to those who did not. Compared to women without the self-report of hypertension, those with hypertension had increased levels of EGF (r=0.28, p=0.027). Women with diabetes had higher levels of milk IL-4 compared to those who did not (r=0.27, p=0.031) and finally, women with one or more previous pregnancies had lower levels of milk MCP-1 than women with no previous pregnancies (r=-0.34, p=0.008) (see Table 21). Psychological Stressors. As self-perceived stress (PSS scores on Day 3 post-delivery) increased, there were statistically significant decreased levels of EGF, (r=-0.32, p=0.011), MIP1α (r= -0.25, p=0.048) and TNF-α (r= -0.27, p=0.034) (see Table 21). Environmental Stressors. As shown in Table 21, with the exception of relationship status, all of the environmental stressors studied were statistically significantly associated with levels of milk immune components on Day 3 post-delivery. Women who reported caring for 2 or more children had lower levels of MCP-1 (r= -0.26, p=0.042). Women who reported having 72 private insurance (a measure of socioeconomic status) had higher levels of EGF than did those with Medicaid or were self-pay (r=0.38, p=0.002). Mothers with Medicaid had higher levels of SIgA than did those with private insurance or were self-pay (r=0.32, p=0.012), while those reporting self-pay status had lower levels of milk SIgA than those mothers with private insurance or Medicaid (r= -0.30, p=0.022). Table 21: Day 3 Correlations of Maternal Stress Indicators with Milk Immune Components Age Pr Pg Del TNF- α SIgA EGF IL-10 IL-4 IL-6 IL-8 IP-10 MCP-1 MIP-1α -0.03 (0.829) -0.14 (0.279) -0.10 (0.432) 0.23 (0.075) -0.13 (0.300) -0.10 (0.493) -0.18 (0.153) -0.19 (0.139) -0.16 (0.198) 0.00 (0.970) -0.14 (0.271) 0.06 (0.624) -0.01 (0.946) -0.17 (0.171) -0.10 (0.435) -0.18 (0.160) -0.22 (0.089) -0.12 (0.371) -0.15 (0.242) -0.13 (0.295) -0.20 (0.113) -0.03 (0.848) -0.34 (0.008) -0.18 (0.164) -0.17 (0.195) -0.22 (0.084) 0.05 (0.725) -0.02 (0.895) -0.21 (0.094) -0.04 (0.788) 0.20 (0.133) -0.13 (0.340) 0.07 (0.608) -0.20 (0.145) -0.15 (0.257) 0.32 (0.012) -0.30 (0.022) -0.04 (0.800) 0.01 (0.970) -0.29 (0.024) 0.28 (0.027) -0.30 (0.016) -0.32 (0.011) 0.38 (0.002) -0.18 (0.170) -0.01 (0.941) -0.25 (0.053) 0.17 (0.177) -0.13 (0.317) -0.06 (0.649) -0.05 (0.680) -0.20 (0.132) -0.13 (0.323) -0.01 (0.962) -0.09 (0.509) -0.18 (0.171) 0.11 (0.409) 0.03 (0.789) -0.07 (0.599) 0.27 (0.031) -0.03 (0.807) -0.06 (0.664) -0.07 (0.602) -0.09 (0.493) -0.23 (0.074) -0.00 (0.986) 0.11 (0.401) -0.12 (0.370) 0.20 (0.109) -0.11 (0.382) 0.01 (0.917) 0.06 (0.623) -0.16 (0.226) -0.14 (0.290) 0.14 (0.291) 0.02 (0.890) -0.05 (0.693) -0.03 (0.823) -0.22 (0.080) 0.00 (0.981) 0.11 (0.375) -0.10 (0.450) -0.17 (0.188) 0.12 (0.338) -0.08 (0.513) -0.13 (0.324) -0.08 (0.543) 0.06 (0.624) 0.01 (0.972) 0.04 (0.752) 0.13 (0.322) -0.08 (0.522) 0.10 (0.468) 0.10 (0.417) 0.16 (0.209) -0.01 (0.929) -0.20 (0.116) -0.02 (0.861) -0.08 (0.555) -0.10 (0.431) -0.26 (0.042) 0.15 (0.236) 0.03 (0.824) -0.05 (0.725) 0.13 (0.324) -0.25 (0.048) -0.06 (0.655) 0.12 (0.332) -0.10 (0.421) -0.13 (0.307) 0.02 (0.804) 0.12 (0.342) 0.06 (0.636) -0.03 (0.847) -0.27 (0.034) 0.03 (0.803) 0.06 (0.642) -0.15 (0.240) -0.10 (0.451) 0.06 (0.658) Smk Abx Hbp Db PSS Ins MC Spy #Ch Rel Note: Values in the cells are r (p value); SIgA N=59, all others N=63, PrPrg= Previous Pregnancies (0=0, 1≥1); Del=Mode of Delivery(1=Vaginal, 2=Cesarean Section); Smk= Smoking Status (0=No, 1=Yes); ABX= Received Antibiotics During Pregnancy(0=No, 1=Yes); Hbp= Hypertension (0=No, 1=Yes); Db= Diabetes (0=No, 1=Yes); PSS- Summed Score of the Perceived Stress Scale; Ins= Private Insurance (0=No, 1=Yes); MC= Medicaid (0=No, 1=Yes); Spy= Self-Pay (0=No, 1=Yes); #Ch= Number of Children Under Care (1=1,2≥2); Rel= Relationship Status (0=Single, 1= Married/with Partner). Day 9 The same inter-correlations among the maternal stressors (with the addition of salivary cortisol) and milk immune components on Day 9 post-delivery are shown in Table 22. 73 Physical Stressors. As was found on Day 3 post-delivery, on Day 9 women who had received antibiotics had lower levels of EGF (r=-0.24, p=0.038) compared to those women who had not received antibiotics. Also like Day 3, women with one or more previous pregnancies had lower levels of milk MCP-1 (r= -0.24, p=0.038) and in addition had lower levels of TNF-α (r= -0.31, p=.0.008) than women with no prior pregnancies (see Table 22). Psychological Stressors. There were no statistically significant relationships of maternal stressors with milk immune components observed on Day 9 (see Table 22). Environmental Stressors. At Day 9 post-delivery, rather than an association with MCP-1 (as seen at Day 3), women who reported caring for two or more children had lower levels of milk IL-6 (r=-0.26, p=0.028) and TNF-α (r=-0.31, p=0.008) than did women caring for fewer children. Salivary Cortisol. Salivary cortisol represents the overall biological response to all of the maternal stressors. The only statistically significant association of this marker with the milk immune components was with EGF. As levels of salivary cortisol increased, levels of EGF decreased (r= -0.32, p=0.006). 74 Table 22: Day 9 Correlations of Maternal Stress Indicators with Milk Immune Components Age Pr Pg Del Smk Abx Hbp Db PSS AUC Ins MC Spy #Ch Rel SIgA EGF IL-10 IL-4 IL-6 IL-8 IP-10 -0.07 (0.584) -0.11 (0.373) -0.01 (0.910) 0.10 (0.529) -0.10 (0.393) -0.02 (0.853) -0.14 (0.248) -0.10 (0.451) 0.20 (0.874) 0.19 (0.117) -0.12 (0.329) -0.08 (0.517) -0.17 (0.162) -0.06 (0.624) 0.13 (0.280) 0.03 (0.822) -0.13 (0.267) -0.05 (0.629) -0.24 (0.038) 0.02 (0.893) -0.09 (0.465) -0.09 (0.322) -0.32 (0.006) 0.20 (0.099) 0.06 (0.595) -0.06 (0.659) -0.06 (0.616) -0.03 (0.803) -0.03 (0.778) -0.02 (0.844) -0.15 (0.192) -0.01 (0.932) -0.20 (0.106) -0.01 (0.700) -0.11 (0.343) -0.10 (0.434) -0.06 (0.624) 0.11 (0.374) -0.20 (0.093) 0.02 (0.888) -0.21 (0.073) -0.07 (0.587) -0.08 (0.505) 0.04 (0.761) -0.17 (0.163) -0.05 (0.704) -0.14 (0.245) -0.01 (0.702) -0.08 (0.490) -0.03 (0.828) -0.16 (0.183) 0.03 (0.821) -0.11 (0.341) -0.05 (0.704) -0.14 (0.247) -0.08 (0.495) -0.05 (0.707) -0.17 (0.156) -0.17 (0.152) 0.07 (0.531) -0.01 (0.914) -0.12 (0.302) -0.12 (0.311) 0.12 (0.919) 0.04 (0.763) 0.15 (0.221) -0.21 (0.081) 0.04 (0.735) -0.26 (0.028) -0.04 (0.737) 0.13 (0.266) 0.02 (0.899) 0.12 (0.329) 0.08 (0.528) 0.10 (0.407) -0.03 (0.837) 0.03 (0.808) 0.18 (0.139) 0.08 (0.490) 0.01 (0.956) -0.06 (0.657) -0.20 (0.892) -0.03 (0.827) 0.02 (0.938) 0.17 (0.155) -0.08 (0.513) -0.13 (0.276) -0.07 (0.534) -0.10 (0.382) -0.17 (0.156) -0.05 (0.707) 0.08 (0.557) 0.08 (0.525) -0.06 (0.640) -0.08 (0.512) 0.01 (0.965) 0.04 (0.764) -0.03 (0.772) MCP-1 -0.02 (0.865) -0.24 (0.038) -0.03 (0.787) 0.14 (0.246) -0.11 (0.376) 0.02 (0.898) 0.04 (0.714) -0.04 (0.749) -0.01 (0.917) 0.18 (0.118) -0.18 (0.137) 0.03 (0.787) -0.20 (0.090) 0.03 (0.816) MIP-1α 0.10 (0.429) -0.18 (0.123) 0.07 (0.586) 0.07 (0.546) 0.04 (0.735) -0.02 (0.864) -0.08 (0.517) -0.02 (0.868) -0.02 (0.877) 0.15 (0.193) -0.15 (0.195) -0.04 (0.739) -0.21 (0.080) -0.04 (0.764) TNF- α -0.04 (0.757) -0.31 (0.008) -0.10 (0.456) 0.10 (0.438) -0.13 (0.271) -0.01 (0.915) -0.13 (0.279) -0.15 (0.183) -0.09 (0.438) 0.13 (0.292) -0.11 (0.341) 0.03 (0.816) -0.31 (0.008) -0.09 (0.431) Note: Values in the cells are r ( p value); N=75; PrPrg= Previous Pregnancies (0=0, 1≥1); Del=Mode of Delivery(1=Vaginal, 2=Cesarean Section); Smk= Smoking Status (0=No, 1=Yes); ABX= Received Antibiotics During Pregnancy(0=No, 1=Yes); Hbp= Hypertension (0=No, 1=Yes); Db= Diabetes (0=No, 1=Yes); PSS- Summed Score of the Perceived Stress Scale; AUC= Salivary cortisol area under the curve; Ins= Private Insurance (0=No, 1=Yes); MC= Medicaid (0=No, 1=Yes); Spy= Self-Pay (0=No, 1=Yes); #Ch= Number of Children Under Care (1=1,2≥2); Rel= Relationship Status (0=Single, 1= Married/with Partner). 75 Day 14 On Day 14 post-delivery, there were no statistically significant relationships of maternal stress indicators with milk immune components (see Table 23). Table 23: Day 14 Correlations of Maternal Stress Indicators with Milk Immune Components Age Pr Pg Del Smk Abx Hbp Db PSS Ins MC Spy #Ch Rel SIgA EGF IL-10 IL-4 IL-6 IL-8 IP-10 -0.06 (0.637) -0.01 (0.950) 0.01 (0.952) -0.02 (0.843) 0.01 (0.941) -0.05 (0.673) 0.05 (0.683) 0.19 (0.107) 0.01 (0.949) -0.06 (0.618) -0.18 (0.129) 0.02 (0.867) 0.01 (0.951) -0.02 (0.899) 0.09 (0.454) -0.12 (0.303) -0.02 (0.839) -0.12 (0.301) -0.08 (0.495) -0.04 (0.772) -0.02 (0.884) -0.16 (0.166) 0.10 (0.400) -0.07 (0.583) 0.16 (0.376) 0.05 (0.671) -0.11 (0.370) 0.14 (0.233) -0.04 (0.717) -0.02 (0.840) -0.12 (0.312) 0.03 (0.801) -0.12 (0.306) 0.03 (0.815) 0.04 (0.758) -0.01 (0.948) -0.06 (0.613) -0.12 (0.319) -0.04 (0.737) -0.09 (0.430) 0.07 (0.564) -0.08 (0.482) 0.05 (0.664) -0.07 (0.549) 0.03 (0.789) -0.05 (0.664) 0.02 (0.902) 0.01 (0.960) -0.05 (0.664) -0.08 (0.520) -0.07 (0.581) -0.10 (0.444) -0.01 (0.929) 0.06 (0.634) -0.09 (0.445) -0.01 (0.958) 0.07 (0.574) 0.03 (0.775) -0.14 (0.231) 0.07 (0.540) -0.13 (0.285) 0.18 (0.131) -0.12 (0.310) -0.15 (0.208) 0.13 (0.258) -0.16 (0.172) 0.01 (0.965) 0.02 (0.843) 0.02 (0.863) 0.11 (0.378) -0.07 (0.564) -0.01 (0.908) 0.23 (0.054) -0.15 (0.220) 0.18 (0.133) 0.15 (0.214) -0.06 (0.640) -0.14 (0.233) -0.06 (0.617) 0.04 (0.727) -0.10 (0.380) -0.10 (0.461) -0.10 (0.386) -0.04 (0.723) -0.17 (0.161) 0.07 (0.547) -0.02 (0.842) -0.05 (0.684) 0.05 (0.683) 0.04 (0.766) 0.01 (0.933) MCP-1 -0.10 (0.433) -0.12 (0.302) 0.10 (0.386) 0.04 (0.761) 0.10 (0.406) -0.07 (0.582) -0.02 (0.867) 0.09 (0.437) -0.08 (0.511) 0.11 (0.348) -0.10 (0.421) -0.14 (0.245) 0.10 (0.425) MIP-1α -0.16 (0.182) 0.07 (0.563) -0.13 (0.291) -0.01 (0.906) 0.09 (0.454) -0.01 (0.906) -0.11 (0.371) 0.11 (0.350) -0.09 (0.458) 0.15 (0.207) -0.05 (0.689) -0.03 (0.807) 0.10 (0.396) TNF- α 0.03 (0.816) -0.04 (0.741) -0.03 (0.779) 0.01 (0.911) -0.06 (0.600) 0.07 (0.555) -0.08 (0.500) -0.09 (0.431) -0.12 (0.300) 0.21 (0.078) -0.12 (0.318) -0.15 (0.194) 0.14 (0.250) Note: Values in the cells are r (p value); N=73; PrPrg= Previous Pregnancies (0=0, 1≥1); Del=Mode of Delivery(1=Vaginal, 2=Cesarean Section); Smk= Smoking Status (0=No, 1=Yes); ABX= Received Antibiotics During Pregnancy(0=No, 1=Yes); Hbp= Hypertension (0=No, 1=Yes); Db= Diabetes (0=No, 1=Yes); PSS- Summed Score of the Perceived Stress Scale; Ins= Private Insurance (0=No, 1=Yes); MC= Medicaid (0=No, 1=Yes); Spy= Self-Pay (0=No, 1=Yes); #Ch= Number of Children Under Care (1=1,2≥2); Rel= Relationship Status (0=Single, 1= Married/with Partner). 76 Multivariate Associations of Stress Indicators with Milk Immune Components Using the model of maternal stress indicators there were no statistically significant multivariate associations with levels of any of the milk immune components on any day postdelivery (see Table 24). Table 24: Multiple Linear Regression of Maternal Stressors with Milk Immune Components by Day Multiple R (Adjusted R2, p-value) Component Day 3 Day 9 Day 14 N=63 N=73 N=73 SIgAa 0.20 (-0.08,0.917) 0.25 (-0.2, 0.613) 0.20 (-0.05, 0.830) EGF 0.21 (-0.07, 0.896) 0.24 (-0.2, 0.640) 0.22 (-0.04, 0.773) IL-10 0.36 (0.02, 0.315) 0.37 (0.06, 0.104) 0.34 (0.03, 0.222) IL-4 0.35(0.01, 0.360) 0.30 (0.01, 0.340) 0.22 (-0.04, 0.759) IL-6 0.33 (0.04, 0.413) 0.29 (0.00, 0.409) 0.32 (0.02, 0.275) IL-8 0.20 (-0.07, 0.899) 0.26 (-0.02, 0.558) 0.34 (0.03, 0.226) IP-10 0.34 (0.01, 0.395) 0.28 (-0.00, 0.467) 0.16 (-0.06, 0.944) MCP-1 0.36 (0.02, 0.320) 0.31 (0.02, 0.303) 0.27 (-0.01, 0.514) MIP-1α 0.32 (-0.01, 0.482) 0.28 (-0.01, 0.471) 0.28 (-0.00, 0.466) TNF- α 0.36 (0.03, 0.295) 0.37 (0.06, 0.113) 0.31 (0.01, 0.388) a Note: = N of 59; Predictors- Mothers Age; Previous Pregnancies (0=0, 1≥1); Mode of Delivery (1=Vaginal, 2- Cesarean Section); Smoking (0=No, 1=Yes); PSS Day 3, 9, 14- Summed Score of Perceived Stress Scale; Medicaid (0=No, 1=Yes). Relationships of Stress Indicators with Salivary Cortisol Summaries of the correlations of each of the maternal stress indicators with salivary cortisol AUC values on Day 9 are shown in Table 25. None of these associations were statistically significant. 77 Table 25: Correlations of Maternal Stress Indicators with Cortisol AUC, N=73 AUC Age (Years) 0.11 (0.340) Previous Pregnancy (0=0, 1≥1) 0.19 (0.119) Mode of Delivery (1= Vaginal, 2= Cesarean Section) 0.18 (0.134) Smoking (0= No, 1= Yes) 0.10 (0.398) Antibiotics Received During Pregnancy (0= No, 1= Yes) 0.10 (0.445) Hypertension (0=No, 1= Yes) -0.08 (0.488) Diabetes (0= No, 1= Yes) -0.00 (0.975) Private Insurance (0= No, 1= Yes) 0.00 (0.996) Medicaid (0= No, 1= Yes) -0.05 (0.679) Self-Pay (0= No, 1= Yes) 0.01 (0.969) Number of Children Under Care (1=1, 2≥2) -0.02 (0.890) Relationship Status (0=Single, 1= Married/Partner) 0.15 (0.219) Note: values in cells are r (p value). Cross-lagged Correlations of Maternal Stressors with Milk Immune Components Summaries of the cross lagged correlations of maternal stressors on Day 3 with milk immune components on Day 14 are shown in Table 26. All of the associations of maternal stress indicators with milk immune components were similar to those reported for Day 14 in Table 23 except for self-perceived stress. Women with higher scores of self-perceived stress on Day 3 had higher levels of IL-8 on Day 14 post-delivery (r=0.26, p=0.025). Table 26: Correlations of Maternal Stress Indicators (Day 3) with Milk Immune Components (Day 14) PSS SIgA EGF IL-10 IL-4 IL-6 IL-8 IP-10 0.71 (0.552) 0.02 (0.862) 0.11 (0.362) 0.04 (0.750) 0.19 (0.099) 0.26 (0.025) 0.04 (0.735) MCP-1 -0.01 (0.907) MIP-1α 0.22 (0.060) TNF- α -0.04 (0.769) Note: Values in cells are r and p value; N=73; PSS- Summed Score of the Perceived Stress Scale. Associations of Stressors with the Change in Immune Components from Day 3-14 Summaries of the association of stressors with the change in milk immune components are shown in Table 27. Women who received antibiotics had significantly less changes in the 78 levels of IL-10 from Day 3- Day 14 (r= -0.19, p=0.030) and those women who reported self-pay had greater changes in the levels of milk IL-8 from Day 3- Day 14 (r=0.15, p=0.040). Table 27: Correlations of Maternal Stress Indicators (Day 3) with Milk Immune Components Change (Day 3 to Day 14) Controlling for Baseline Milk Values (Day 3) Age Pr Pg Del MCP-1 MIP-1α TNF- α 0.02 (0.885) 0.10 (0.434) 0.02 (0.873) -0.03 (0.813) -0.06 (0.574) 0.12 (0.399) -0.20 (0.727) 0.10 (0.941) -0.02 (0.826) 0.03 (0.700) 0.08 (0.349) -0.05 (0.542) 0.05 (0.728) 0.05 (0.709) -0.04 (0.781) 0.14 (0.296) -0.04 (0.764) -0.02 (0.900) 0.02 (0.868) 0.07 (0.585) -0.06 (0.629) -0.10 (0.324) -0.03 (0.774) 0.02 (0.840) 0.02 (0.855) 0.08 (0.473) -0.00 (0.988) -0.06 (0.586) -0.12 (0.255) 0.07 (0.600) -0.01 (0.890) 0.03 (0.658) 0.03 (0.676) -0.02 (0.741) -0.05 (0.537) 0.06 (0.353) 0.05 (0.490) -0.03 (0.615) 0.04 (0.761) -0.07 (0.406) -0.01 (0.956) -0.02 (0.847) -0.02 (0.821) -0.10 (0.256) 0.15 (0.091) -0.04 (0.622) 0.10 (0.908) 0.14 (0.317) SIgA EGF IL-10 IL-4 IL-6 IL-8 IP-10 0.07 (0.352) 0.04 (0.585) 0.02 (0.758) -0.11 (0.384) 0.01 (0.970) -0.01 (0.943) 0.12 (0.893) 0.08 (0.380) 0.16 (0.830) -0.14 (0.225) 0.10 (0.929) 0.12 (0.292) 0.06 (0.529) -0.08 (0.363) -0.06 (0.544) -0.05 (0.457) 0.00 (0.992) -0.01 (0.945) -0.07 (0.321) -0.05 (0.464) -0.01 (0.843) 0.12 (0.872) 0.03 (0.651) -0.09 (0.238) -0.10 (0.179) 0.10 (0.904) -0.02 (0.732) -0.04 (0.740) -0.15 (0.230) 0.09 (0.473) 0.08 (0.507) -0.05 (0.723) -0.01 (0.913) -0.20 (0.109) -0.01 (0.952) -0.02 (0.850) -0.19 (0.030) 0.13 (0.164) 0.00 (0.963) 0.22 (0.809) -0.03 (0.741) 0.10 (0.263) 0.00 (0.991) -0.09 (0.328) -0.06 (0.490) 0.08 (0.477) 0.106 (0.368) 0.09 (0.470) 0.15 (0.200) -0.01 (0.951) 0.07 (0.542) 0.05 (0.665) -0.01 (0.892) 0.02 (0.894) 0.07 (0.480) -0.02 (0.848) -0.09 (0.387) 0.10 (0.296) -0.07 (0.476) 0.05 (0.612) -0.10 (0.294) -0.11 (0.217) 0.15 (0.103) -0.3 (0.743) -0.02 (0.784) 0.02 (0.749) 0.12 (0.104) 0.03 (0.658) 0.03 (0.682) 0.15 (0.040) -0.04 (0.559) -0.08 (0.311) Smk Abx Hbp Db PSS Ins MC Spy #Ch Rel Note: Values in cells are r (p value); N= [SIgA=48], [all others=51]; PrPrg= Previous Pregnancies (0=0, 1≥1); Del=Mode of Delivery(1=Vaginal, 2=Cesarean Section); Smk= Smoking Status (0=No, 1=Yes); ABX= Received Antibiotics During Pregnancy(0=No, 1=Yes); Hbp= Hypertension (0=No, 1=Yes); Db= Diabetes (0=No, 1=Yes); PSS- Summed Score of the Perceived Stress Scale; Ins= Private Insurance (0=No, 1=Yes); MC= Medicaid (0=No, 1=Yes); Spy= Self-Pay (0=No, 1=Yes); #Ch= Number of Children Under Care (1=1,2≥2); Rel= Relationship Status (0=Single, 1= Married/with Partner). Aim 2 Assess the mediation (indirect) effect of maternal cortisol on the direct association of maternal stress indicators and milk immune components (antibodies, cytokines, and chemokines) from AA mothers of term infants. 79 As illustrated in Figure 5, summaries of the direct (C13) and indirect paths through salivary cortisol (A12) (B23) are summarized in Table 28. There were no statistically significant associations of cortisol with milk immune components (B23) after controlling for the correlation of PSS with the component (B23). Given that fact the adjusted associations of PSS with the milk immune components replicated the unadjusted associations seen in Table 26 (IL-8- beta=0.27, p=0.023 and MIP-1α- beta=0.24, p=0.046). Table 28: Direct and Indirect Associations Model A12 B23 C13 PSS-Cortisol Cortisol-Milk PSS-Milk Beta PSS Day 3 Milk Day14 SIgA 0.09 -0.08 0.03 (0.481) (0.511) (0.781) EGF 0.08 -0.06 0.02 (0.505) (0.651) (0.904) IL-10 0.08 -0.11 0.14 (0.505) (0.364) (0.238) IL-4 0.08 -0.15 0.09 (0.505) (0.225) (0.450) IL-6 0.08 -0.03 0.22 (0.505) (0.804) (0.062) IL-8 0.08 -.08 .27 (0.505) (0.524) (0.026) IP-10 0.08 -.19 0.03 (0.505) (0.107) (0.824) MCP-1 0.08 -0.11 -0.02 (0.505) (0.381) (0.897) MIP-1α 0.08 -0.00 0.24 (0.505) (0.979) (0.045) TNF-α 0.08 -0.06 -0.03 (0.505) (0.640) (0.841) Note: Values in cells are beta (p value); N=70. 0.04 (0.748) 0.02 (0.876) 0.15 (0.208) 0.10 (0.395) 0.23 (0.060) 0.27 (0.023) 0.04 (0.721) -0.01 (0.953) 0.24 (0.046) -0.02 (0.871) 80 CHAPTER 5 DISCUSSION Many of the maternal stress indicators in this sample of AA women mirrored those reported of all women in the US. The percentage of mothers that experienced vaginal birth and first time births in this sample were similar to 2010 national data of all women (vaginal births 66% of live births; first time births- 40% of live births) (National Vital Statistics Reports, 2013). The use of antibiotics in this sample was slightly above national data which reports 27.9% of all women receive antibiotics during pregnancy (Centers for Disease Control and Prevention, 2014a). However, the health characteristics such as smoking, hypertension and diabetes of this sample differed from the national health data of AA women. The national incidence of smoking (15.7%) and hypertension (19.2%) in AA women were greater than those self-reported in this sample, whereas diabetes (5.1%) among AA women was less than the reported percentage in this sample (Centers for Disease Control and Prevention, 2014b). Those mothers with Medicaid in this sample were reflective of all mothers with Medicaid (69%) in the state of Louisiana in 2010 (U S Department of Health and Hospitals, 2010). The median values of salivary cortisol of AA women in this study were higher than those reported by Hampson and colleagues (2013) among women < 14 days post-partum (race/ethnicity not reported) (4.61± .03 ng/mL [95%CI=4.60,4.62]); however the timing of collections in this study used the cortisol awakening response (CAR-awake, 30 minutes post awake, 60 minutes post awake) while Hampson and colleagues used noon ± 2 hours (Hampson, Phillips, Soares, & Steiner, 2013). 81 The only stress indicator that changed over time (Day 3, 9, and 14) was self-perceived stress. Overall, the women in this study reported less perceived stress (PSS scores) across all study days than previously published PSS scores of women 4-6 weeks post-delivery (race/ethnicity not reported) (Mean= 21.3-27.7 [95%CI= 19.2, 29.8]). However, the PSS scores in this study did fall within the reported PSS score ranges of AAs in two cohorts from 2006 (N=99, Mean=16.44 [95%CI=12.8, 20.1]), and 2009 (N=99, Mean=15.68 [95%CI=11.3, 20.1) (Cohen & Janicki-Deverts, 2012; Groer et al., 2005; Groer, 2005; Groer, Davis, & Steele, 2004). The internal reliability of the PSS item responses across all days also fell within previously published literature (Cohen, Kamarck, & Mermelstein, 1983; Nast, Bolten, Meinlschmidt, & Helhammer, 2013). The milk immune component values changed over time post-delivery as expected. Typically, the levels of immune components are higher in colostrum, then decrease as milk transitions to mature milk 7-10 days post-delivery (Agarwal et al., 2011). All of the immune components in this study decreased from Day 3- Day 14 except EGF which steadily increased. This finding differs from previous literature that described a decrease in this immune component over the first four weeks post-delivery (Castellote et al., 2011; Kumral et al., 2009). There is a potential benefit of this finding if the increase in EGF is also found in future research for EGF promotes intestinal function and integrity which is essential for healthy infant growth and development. This study also adds to the literature by including chemokines (IP-10, MCP-1, MIP-1α) in the analyses for not much is yet known about these immune components. Over the past four decades, numerous studies have described associations of maternal stressors with milk immune components from mothers of term and preterm infants (Böttcher et al., 2008; Cruz et al., 1982; Ermis et al., 2009; Hawkes et al., 2002; Groer et al., 2004, 2005, 82 2009; Marek et al., 2009; O’Connor et al., 1998; Prokesova at al., 2006; Rigotti et al., 2006; Takahata et al., 2003; Thibeau & D’Apolito, 2012; Zanardo et al., 2007). This study adds to that body of knowledge by including maternal stressors that have not been previously reported in milk immune research such as diabetes, hypertension, antibiotics, number of children under care, and relationship status. The data suggests that the maternal stressors captured in this study were associated with levels of milk immune components during the first 14 days post-delivery. Due to the descriptive design, no causality can be implied. However, the shared variance among the associations was frequently below 10% thus requiring caution in interpreting these results. In stress immune research, long-term stress is associated with an overall decrease in proinflammatory immune responses, whereas short term stress is associated with an increased proinflammatory immune response (Elenkov, 2004; Herbert & Cohen, 1993; Segerstrom & Miller, 2004). The maternal stressors in this sample were associated with variations in pro-inflammatory and anti-inflammatory milk immune components, and an increase in milk antibodies. Figure 7 illustrates these relationships: the bolded arrows represent significant relationships among maternal stressors with milk immune components on Day 3; the dashed arrows represent significant relationships on Day 9; and the dotted arrows represent significant relationships over time from Day 3- Day 14. All of the maternal stress indicators except for age, smoking, and relationship status were associated with levels of at least one of the milk immune components. Epidermal growth factor (EGF) had the most numerous significant relationships across time whereas there were no significant relationships observed for IP-10. It is important to explore these finding for the relationships of maternal stress and milk immune protective components could potentially impact infant outcomes. 83 Antibody SIgA Physical Maternal Age Previous Pregnancy Smoking Proinflammatory IL-4 IL-6 Antibiotics Hypertension Diabetes IL-8 Environmental Socioeconomic Status Number of Children Under Care Relationship Status TNF-α Cortisol MCP-1 MIP-1α IP-10 Psychological Perceived Stress Antiinflammatory EGF IL-10 Figure 7: Matrix of Significant Relationships of Maternal Stressors with Milk Immune Components Note: Significant relationships were p values ≤ 0.050; Bolded arrows= simultaneous correlations on Day 3; Dash arrows= simultaneous correlations on Day 9; Dotted line arrows=cross-lagged correlations from Day 3-Day 14. 84 Changes in Milk Antibodies The antibodies in milk serve to instruct the newborn immune system to recognize and destroy pathogens as well as recognize healthy bacteria in the gut that are necessary for digestion (Brandtzaeg, 2003; 2010). The levels of milk antibodies such as SIgA are quite varied among women across the first 14 days post-delivery partially due to the mucosal associated lymphoid tissue pathway (MALT) (Brandtzaeg, 2003; 2010). The MALT pathway (appendix in large intestine, Peyers’s patches, tonsils and adenoids) is stimulated when a mother’s gastrointestinal/respiratory mucosal linings encounter pathogens in the environment (Brandtzaeg, 2003, 2010). This stimulates an immune response in the mother to increase milk antibodies such as SIgA (Brandtzaeg, 2003; 2010). Only one maternal stressor, the environmental stressor of Medicaid status, was positively correlated with the milk antibody SIgA and this relationship was observed only on Day 3 (see Figure 8). Medicaid status is a measurement of lower socioeconomic status and is associated with negative maternal and infant outcomes (Marinda, Maxson, & Edwards, 2009; Ruiz & Avant, 2005; Elenkov, 2004). Medicaid status can be equated with poor living conditions which would logically increase the milk SIgA through the activation of the MALT pathway (Brandtzaeg, 2003, 2010). This relationship has previously been reported by Groer et al., in 2004 where women of low income status had three times the levels of SIgA than women with higher income at 4-6 weeks post-delivery. Although the levels of SIgA were not associated with any physical or psychological maternal stressors in this study, previous literature has reported decreased milk SIgA older women and increased milk SIgA in mothers with infections (Groer et al., 2004; 2005). That only one maternal stressor was associated with milk SIgA in this study could be a positive finding, meaning that the milk antibodies are not necessarily influenced by 85 maternal stress in the first 14 days post-delivery but further research is needed to clarify these findings. Environmental Antibody ↓Socioeconomic Status ↑SIgA Figure 8: Significant Relationships of Maternal Stressors with Milk Antibodies Note: Bolded arrow= simultaneous correlations on Day 3. Changes in Pro-inflammatory Milk Immune Components The role of pro-inflammatory immune components in milk is to assist/instruct the naïve newborn immune system to mount a response to a pathogen (Field, 2005; Garofalo, 2010). Cytokines including chemokines are the messengers of the immune response, thus the C/C in milk direct other milk immune components as well as infant intestinal cells on the immunerelated mechanisms to destroy a pathogen (Field, 2005; Garofalo, 2010; Goldman, 2007). Although, there is known variations in the levels of milk pro-inflammatory C/C among women, it is not clear how much of the observed variations are associated with individual maternal characteristics/stressors (Agarwal, 2011; Thibeau & D'Apolito, 2012). In this sample, the levels of the pro-inflammatory C/C observed (IL-4, IL-6, IL-8, TNF-α, MIP-1α, MCP-1) were associated with maternal physical stressors (number of previous pregnancies and diabetes), psychological stressors (perceived stress), and environmental stressors (number of children under care) (see Figure 9). The relevance of many of these observations to milk immune protective properties is not yet known. 86 Proinflammatory ↑IL-4 Physical Environmental ↑Number of Children Under Care ↓IL-6 ↑Diabetes ↑Previous Pregnancy ↑IL-8 ↓TNF-α ↓MCP-1 ↓MIP-1α Psychological ↑Perceived Stress ↑ MIP-1α Figure 9: Significant Relationships of Maternal Stressors with Milk Pro-inflammatory Immune Components Note: Bolded arrows= simultaneous correlations on Day 3, Dash arrows= simultaneous correlations on Day 9, Dotted line arrow=correlations from Day 3-Day 14. In the literature, maternal physical stressors such as the number of pregnancies and diabetes were associated with negative maternal infant outcomes such as preterm labor, large infant size for gestational age, risk factors contributing to delivery complications, and delayed milk production (Chida & Hammer, 2008; Finkelstein et al., 2013; Schwarz et al., 2010; Wendland et al., 2012). Diabetes is considered an immune mediated disease, thus the underlying inflammatory process holds potential to alter the pro-inflammatory C/C levels in breastmilk (Chida & Hamer, 2008). Women with diabetes in this sample had greater levels of milk IL-4 on Day 3 (see Figure 9) which has not been previously reported. There is one study that reported an increase of serum IL-4, IL-6, and IL-8 levels in overweight women with pre-diabetes (N=21) compared to matched controls (N=20), and a meta-analysis (N=19,709) reporting increased levels of serum IL-6 among diabetics (Lucas et al., 2013; Wang et al., 2013). Thus it could be plausible that in addition to seeing an increase in pro-inflammatory C/C in the blood among 87 women with diabetes there is also an increase in milk IL-4 especially in the early days of lactation (Day 3) where the tight junctions in the mammary epithelium may allow passage of serum C/C into milk. Further research would be needed to look at this association more closely especially since milk IL-4 is able to increase the production of milk antibodies which are needed for infant health and protection (Agarwal, 2011). One or more previous pregnancies was associated with decreased levels of milk TNF-α on Day 9 and MCP-1 on Day 3 and Day 9 (see Figure 9) which has not been previously reported. One or more pregnancies has been associated with negative maternal and infant outcomes (Lanier & Jonson-Reid, 2014). The number of pregnancies, particularly later in life has been attributed to oxidative stress in animals but there is controversy surrounding the conclusion of these studies (Speakman & Garratt, 2013). Oxidative stress releases toxic by-products that overtime may suppress immune function (Speakman & Garratt, 2013). In milk research, oxidative stress was suggested as the mechanism by which decreased milk TNF-α was observed among women who smoke (n=21) (Ermis, 2009). This relationship was not supported in this study. The decreased milk TNF-α observed on Day 9 in this study more than likely reflects the oxidative stress of the healing process of maternal tissues post-delivery. Previous research by Groer & Shelton (2009) reported a negative correlation of previous pregnancies with milk IL-10, an anti-inflammatory cytokine. This relationship was also not supported in this study. Further research is warranted to explore the inverse relationship of previous pregnancies and proinflammatory cytokines such as milk TNF-α which regulate immune function within the infant intestinal cells (Field, 2005). Perceived stress, the psychological stressor captured in this study, was associated with decreased levels of milk TNF-α and MIP-1α on Day 3 and increased levels of IL-8 on Day 14 88 (see Figure 9). No previous research has reported these relationships in milk. Theoretically, acute perceived stress as measured in this study would be associated with an increase in proinflammatory cytokines (Elenkov, 2004; Segerstrom & Miller, 2004). Recent research examining serum cytokine associations with perceived stress in pregnant women reported correlations with stress and depression. Depression was correlated with decreased levels of serum TNF-α but the immune regulatory system during pregnancy is complex limiting comparisons to this sample of women post-delivery (Shelton, Schminkey, & Groer , 2014). The bi-directional relationship of perceived stress with milk pro-inflammatory C/C in this study warrants further research for the implications of perceived stress altering the pro-inflammatory C/C in milk would have profound effects on infant health. The environmental stressor of the number of children under mothers’ care was inversely associated with MCP-1 on Day 3 and IL-6 and TNF-α on Day 9 (see Figure 9) which has not been previously reported. The increased number of children under mothers’ care could be considered similar to caregiver stress which is strongly correlated with the increased incidence of diseases of inflammation where pro-inflammation is predominant (Lovell & Wetherell, 2011; Miller, Cohen, and Richey, 2002). In this study, the opposite was observed. One plausible explanation could be that immediately post-delivery many women receive an increased level of social support to welcome the newborn. This increased support may have buffered the proinflammatory response to caregiver stress temporarily but more research is warranted to determine if these findings are generalizable. The overall observation of decreased pro-inflammatory milk immune component in association with physical, psychological and environmental stressors measured in this study makes an important contribution to science in that many of these stressors have not been 89 measured before in milk research and some of the findings contradict stress immune theory. Questions remain as to why both increased and decreased pro-inflammatory milk immune components were observed in relation to maternal stressors. Future research exploring the relationships among maternal stressors with serum and milk C/C in a larger sample would clarify whether milk pro-inflammatory immune components are associated with maternal stressors. Any changes in milk pro-inflammatory milk immune components would be relevant to infant health and important to understand. Changes in Anti-inflammatory Milk Immune Components The role of anti-inflammatory milk immune components in milk is to protect infant tissue injury from an immature exaggerated pro-inflammatory immune response (Field, 2005; Garofalo, 2005). The two anti-inflammatory milk immune components measured in this study, EGF and IL-10, were associated with the physical and psychological stressors but not the environmental stressors (see Figure 10). Both milk EGF and IL-10 function to improve the infant intestinal wall integrity which not only aids in developing the infant immature immune system but also prevents tissue damage from infant gastritis and/or necrotizing enterocolitis; the latter disease has a profound impact on infant morbidity and mortality (Agarwal, 2011; Chatterton, Nguyen, Bering, & Sangild, 2013; Field, 2005; Fituch, Palkowetz, Goldman, Schanler, 2004; Nair, Warner, & Warner, 2008). Preliminary studies using EGF supplements administered to infants with necrotizing enterocolitis report intestinal repair (Chatterton et al, 2013; Nair et al., 2008). Therefore it is important to understand if maternal stress is associated with alterations in the levels of either of these important anti-inflammatory immune components. 90 Physical Antiinflammatory Psychological ↑Antibiotics ↑Hypertension ↑Diabetes ↓EGF ↑Perceived Stress ↑EGF ↑Cortisol ↓IL-10 Figure 10: Significant Relationships of Maternal Stressors with Milk Anti- Inflammatory Immune Components Note: Bolded arrows= simultaneous correlations on Day 3, Dash arrows= simultaneous correlations on Day 9, Dotted line arrow=cross-lagged correlations from Day 3-Day 14. The physical stressor infection as measured by the self report of receiving antibiotics during pregnancy was associated with decreased levels of EGF on Day 3 and Day 9 and decreased change in the levels of IL-10 from Day 3-Day 14 (see Figure 10). Although the use of antibiotics was higher in this sample than the national average usage during pregnancy, there was a measurement error in that the timing and frequency of the antibiotic usage was not part of data collections (Centers for Disease Control and Prevention, 2014a). Thus, the quantity of antibiotics received is not fully known in this sample. Antibiotics have both anti-microbial and antiinflammatory effects which are difficult to distinguish in relationship to the body’s immune response (Al- Banna et al., 2013). In a comprehensive literature review, the authors report that the toxins released when bacteria are destroyed from the anti-microbial actions of antibiotics there is an anti-inflammatory immune response stimulated (Al- Banna et al., 2013). This response can exhaust the release of anti-inflammatory cytokines such as IL-10 if the level of toxin by-products outweighs the anti-inflammatory immune response within the host (Al-Banna et al., 2013). This type of immune response would occur in extreme infections where the bacteria have proliferated exponentially and thus the antibiotics administered would be related to a 91 massive toxin release from destroyed bacteria (Al-Banna et al., 2013). The mothers in this sample did not likely experience infections of this magnitude for they delivered at full term with no pregnancy complications. Thus the decreased change in the levels of milk IL-10 from Day 3Day 14 in this study could be related to the increased release of anti-inflammatory milk cytokines if the antibiotics were administered close to the time of delivery but since the timing of antibiotics in not known, no conclusions can be made at this time. Likewise, the same holds true for the decrease in levels of milk EGF observed on Days 3 and 9. There is no prior report in the literature of these relationships therefore it is important that future research continues to explore the relationship of maternal antibiotic usage and the levels of pro-inflammatory C/C in milk. The physical stressor hypertension is an immune mediated disease and is associated with negative maternal and infant outcomes as well as delayed milk production (Alevizos et al., 2014; Bramham et al., 2014; Calgani & Elenkov, 2006; Hurst, 2007). However, the role of serum EGF in hypertension is related to the increased vasoconstriction of the arterioles within the kidney and altered sodium absorption (Staruschenko, Palygin, Ilatovskaya, & Pavlov, 2013). The relationship of maternal hypertension with increased levels of milk EGF was not likely related to the role of EGF in hypertension but more related to the inflammatory processes of hypertension which would increase the need for anti-inflammatory cytokines. No previous milk research has explored this relationship. However, the low incidence of hypertension is this sample (n= 6) limits any generalizations of this finding but does indicate that future research is needed to further explore this relationship and the relevance to infant health. The physical stressor diabetes was associated with decreased levels of EGF on Day 3 in this sample (see Figure 10) and has not been previously reported. In the literature, the absence of EGF receptors has been linked to reduced regeneration of pancreatic cells in animals and the 92 administration of EGF has been used to treat tissue damage related to diabetes (Tiaka, Papana, Manolakis, & Georgiadis, 2012). The women in this sample had diabetes prior to and during pregnancy but what was not captured was how their diabetes was being managed. In addition, the incidence of diabetes in this sample was low (n=6) which limits any conclusions. Future research is needed to explore this relationship with larger samples of diabetic women to determine if there is a relationship among women with diabetes and decreased milk EGF. Salivary cortisol is the biomarker of stress which reflects the physical response to all of the maternal stressors (physical, psychological and environmental); however, no one particular maternal stressor was significantly associated with salivary cortisol (see Tables 22, 25, and 28). The only milk component that was associated with salivary cortisol was EGF on Day 9, where decreased levels were observed (see Figure 10 and Table 22). This is the first such observation reported in the literature. In previous milk research conducted by Groer and colleagues (2004, 2005), there were no statistically significant associations between serum cortisol and milk cytokines. It could be debated that the measurement of salivary cortisol on Day 9 post-delivery did not provide a sufficient enough wash out time period for the elevated levels of maternal serum cortisol associated with delivery (O’Keane et al., 2011). The cortisol levels in this sample were higher compared previous literature (Hampson et al., 2013). Serum cortisol is associated with decreased levels of serum pro-inflammatory C/C but this also was not observed in this study (Elenkov, 2004). Further research is needed to determine if these findings can be replicated. Finally, decreased levels of milk EGF was observed among women reporting increased perceived stress (PSS) on Day 3 post-delivery (see Figure 7). This is the first report of this relationship in the literature and there is no theoretical basis for this observation. More important to note, is that in this study milk EGF was influenced by more maternal stressors than any other 93 immune component and that influence extended through Day 9 post-delivery. This is a clinically significant finding that warrants future research given the fact that milk EGF is needed to promote the intestinal wall integrity of vulnerable infants experiencing gastritis or necrotizing enterocolitis and that supplemental oral administration of EGF has improved intestinal integrity in infants (Chatterton et al., 2013; Fituch et al., 2004; Nair et al., 2008). Cortisol as Mediator of Milk Immune Components In PNI theory, neurotransmitters such as cortisol are released during the activation of the HPA axis as a result of chronic stress (Elenkov, 2004, Segerstrom & Miller, 2004). Circulating cortisol influences the balance of the pro-inflammatory and the anti-inflammatory immune response. In the Post-Delivery Human Milk Model (see Figure 2), it was proposed that cortisol would mediate the direct associations of maternal stress indicators with milk immune components. The path of mediation proposed by Barron and Kinney (1986) is illustrated in Figure 11, the proposed Post-Delivery Human Milk Model variables are included in parentheses, and data from the mediation model in this study are reported next to the pathways. r = 0.08, p = 0.505 a Independent Variable (PSS Day 3) Mediator (Salivary Cortisol Day 9) b IL-8 (r = -0.08, 0.524) MIP-1α (r=-0.00, p 0.979 Outcome Variable (Milk Immune Components) c IL-8 (r = 0.27, p = 0.023) MCP-1α (r = 0.24, p = 0.024 Figure 11: Mediation Model Note: Dashed arrows= non-significant correlations; Solid arrows- significant correlations. 94 Assumptions for the mediating variable should include: (1) path a where the variations of the independent variable (maternal PSS) should be associated with variations in the mediator (cortisol); (2) path b where the variations in the mediator (cortisol) should be associated with variations in the outcome variable (milk immune components); and (3) when controlling for paths a and b, a stronger significant association should not be present on path c (Barron & Kinney, 1986). In this study, the independent variable (maternal PSS) was not significantly associated (p=0.481, 0.505) with the mediator cortisol (path a), and the associations of the independent variable of maternal PSS with the outcome variable of milk immune components (path c) were stronger than associations of the mediator cortisol with the outcome variable of milk immune components (path b) which were not significant (p=0.023, 0.024) (see Table 28 and Figure 11). One explanation of why cortisol was not a mediator in this model could be based on the theory that the majority of milk immune components arise from the mammary gland and milk cells instead of being transferred from maternal serum (Agarwal et al., 2011; Garofalo & Goldman, 1998). Results from this study provide supportive evidence that the majority of milk immune components (antibodies, cytokines, chemokines) arise from the mammary gland and milk cells as evidenced by the lack of significant associations of cortisol with milk immune components. This is an important finding for there is little evidence regarding the origins of milk immune cells but further research is needed to explore whether these findings are reliable and valid in larger more diverse samples of mothers of term infants. Another explanation could be that the mothers in this sample reported lower PSS scores and lower cortisol than mothers in previous research on lactating women (Groer et al., 2004). The timing of collections could be one factor; in this study salivary cortisol was collected on Day 95 9 post-delivery whereas in the study by Groer (2004) serum cortisol was collected 4-6 weeks post-delivery. The later collection time period may better reflect the chronic care-giver stress and possibly the influence of returning to work or dealing financial constraints from not –working while on medical leave post-delivery. Conclusions Many of the relationships explored in this study are the first reported in the literature. There were significant relationships in nine out of the ten milk immune components measured with maternal stressors during the first 14 days post-delivery. Many of the milk immune component levels were not in the direction that would improve the immune protection of the infant. These findings suggest that the complexity of the variations in milk immune components reported in the literature to date may be related to maternal stressors not measured within those studies. As this study illustrates, physical, psychological and environmental stressors can influence the immune components of milk among healthy women delivering term infants. This information points to numerous questions yet to be explored. Strengths and Limitations There are two important strengths to this study that warrant discussion; the longitudinal collections, and the population studied. By collecting milk over time, the findings of this study contributed to the knowledge of the natural variations in milk immune components and the directions of those variations could have clinical applications to infant health. Most noted, was the significant increase in the levels of milk EGF (see Table 20) even though maternal physical and psychological stressors were associated with lower milk EGF levels on Day 3 and 9 (see 96 Tables 21 and 22). The infant intestinal cell integrity is improved with milk EGF so this vital immune component is essential to infant health, particularly preterm infants. Knowing that even with maternal stress, the milk EGF levels continue to increase over time is a very positive finding. This information could be used to educate women that their milk protects their infant in many different circumstances and conditions. Regarding the population studied, this is the largest sample of milk collected from AA women reported in the literature to date. The levels of the milk immune components captured in this study fell within the existing published literature which largely represents White Caucasian women in the US, Europe, and Eastern Europe. The findings of this study suggest that race is not likely associated with the known variations in milk immune components but rather the context of the mother’s individual situation (physical, psychological and environmental characteristics) may be more important. Whether supportive interventions to decrease any negative characteristics in the mother’s individual situation will be positively associated with milk immune components is not yet known. Limitations of this study include the relatively small sample size, field collections of saliva and milk, and inconsistent measurements of some of the maternal stress variables. The few women meeting the inclusion criteria of breastfeeding initiation (38%) reflects the very low breastfeeding initiation rates of AA women here in Louisiana (Centers for Disease Control and Prevention, 2012a). The low breastfeeding duration rates among AA women in Louisiana were also reflected in this study sample. This attrition rate coupled with the lack of sufficient saliva and milk samples for analysis limited the number of complete data sets. Adequate field collections of the biological samples of saliva and milk were dependent on the adherence to collection and storage instructions. Although follow-up phone calls were 97 conducted by the study team to remind the participants of collection times and procedures, not all participants answered their phones. Reminders of instructions and contact information were left on voicemails but many voicemail boxes were full. Some mothers called back for clarification. Even though many samples were not sufficient for analysis, the reported values fell within existing literature. Confounding measurements of study variables decreased the validity of certain maternal stress indicators. For instance, the socioeconomic status choices listed were overlapping. In Louisiana, women eligible for Medicaid support are also eligible for lower cost private insurance adjunct policies so many of the participants in this sample checked both Medicaid and private insurance for socioeconomic status. The status of private insurance was blended and not completely reflective of socioeconomic status as intended. Another variable with confounding measurement was antibiotics received during pregnancy because there was no time period captured, thus no delineation when treatment with antibiotics occurred. Finally, the self-report of hypertension and diabetes were confounded with the fact that medications used to treat/control these conditions were not captured. To improve these limitations, the clarification on when the antibiotics were received, and the medications used for hypertension and diabetes would need to be collected. Providing home visits to assist with the collection, storage, and transportation of biological samples would likely increase the number of samples sufficient for analysis but home visits can be dangerous in this area of Louisiana. A safer alternative would be to capture samples on the days of clinic appointments for both the infant and the mother. The lessons learned in this study will be used in the design of future research of mothers of preterm infants. 98 Implications While this study represents a beginning foundation of maternal stressors and milk immune components, it is a spring board for numerous future research questions. To determine if these findings are replicable, future studies should include larger sample sizes of women of diverse race/ethnicities across numerous geographic locations to explore the context of the maternal situations. Inclusion of serum as well as milk immune biomarkers and cortisol measurements pre and post-delivery would broaden the existing evidence of the immense variation of milk immune components and perhaps give insight to whether this variation is more sensitive to the maternal physical, psychological or environmental characteristics. Exploration of a weighted stress score for women post-delivery using the stress variables in this study would be beneficial to assess if there is an allostatic load adaptive stress response to the accumulated chronic stressors. Whether or not the allostatic load stress response is associated with levels of milk immune components would be important to explore. Targeted community interventions to improve maternal health holds potential to improve breastmilk immune protection and thus improve infant morbidity and mortality among vulnerable populations. Inclusion of mothers of preterm infants would be an important population to assess. Mothers of preterm infants are subject to more stress related to their birth experience, the underlying medical conditions that precipitate preterm delivery, and the emotional adjustments to the hospitalization of their preterm infant. Preterm infant mortality and survival are directly associated with the consumption of breastmilk, thus it would be important to explore whether milk immune components such as EGF were truly sensitive to maternal stressors that are particularly important to preterm infant morbidity and mortality. 99 Exploration of the role of the MALT pathway in relation to the amount of antibodies present in breastmilk would also be relevant to explore. A randomized control trial using skin to skin care as the intervention for mothers of hospitalized preterm infants to assess maternal stress and the MALT pathway immune response in milk would increase our knowledge of how the mothers’ immune system continues to interact with the environment to protect the infant. A factor analysis of the milk immune components at multiple time points post-delivery using a large sample of women in several different geographic locations would explore the covariation of these immune cells and how the immune cells influence function among other milk immune cells. This would lead to better understanding of how milk immunity is not stagnant but responsive to maternal situations. Lastly, in future research, it would be beneficial to include coping and social support measurements to explore whether the maternal perception of stress is buffered by coping and does this influence milk immune components and infant outcomes. An inter-disciplinary approach to design this research should include breastfeeding mothers themselves who could broaden the scope and depth of the contextual measurements of the experiences of these women. Due to the preliminary nature of these findings, there are no educational or clinical practice change recommendations at this time; however, the results will be disseminated in peerreviewed journals such as Biological Research in Nursing, Journal of Human Lactation, Journal of Perinatology, and Breastfeeding Medicine. Dissemination of the findings will enrich the existing science and point to new directions yet to be explored. Future research should continue to discover the mechanisms by which breastmilk immune protection evolves over time. 100 The decision to breastfeed will remain a personal one, but the science of milk immune protection should be made available to all women, especially those of AA descent, so they can make an informed decision about the initiation and duration of breastfeeding their infant. 101 Appendix A- Study Flyer There is a research study being conducted by Shelley Thibeau who is a graduate student at the Vanderbilt University School of Nursing. The purpose of the study is to explore the immune protection of breastmilk from African American women who deliver /term infants as well as the possible stress post- delivering a term infant. You are being asked to participate in the study because your milk is very important. Your milk contains not only nutrition to help your infant grow but many immune components that protect your infant against illness. If you agree to participate in the study, you will be asked to 1. Provide a small sample of your milk (about one teaspoon) on Days 3, 9, and 14 postdelivery 2. Provide three saliva samples on Day 9 3. Complete a short mothers survey about your pregnancy 4. Complete 3 short surveys about yourself and any feelings of stress on each day of collection. The surveys should take about 10-15 minutes to complete. You will be provided with all the supplies you need to complete the surveys (paper, pen, envelopes), as well as supplies to collect and transfer the breastmilk. You will also be provided with a milk transport bag complete with ice-pack to bring your samples back to Shelley Thibeau at Ochsner Medical Center where they then will be shipped to a lab for analysis. The milk transport bag and ice-pack are yours to keep. Are you interested in being a part of this study? If yes, can you give us your contact information so that the study investigators may contact you to discuss the study and answer any of your questions? Thank You! If Yes: Phone number and/or room number to contact you _____________________ If No: Thank you for your time 102 Appendix B: Consent 103 104 105 106 Appendix C: Mothers’ Survey Please answer the following: 1. What is your current age? _______ Circle all that apply: 2. American Indian or Alaska Native Asian Black or African American Native Hawaiian or Other Pacific Islander White 3. Number of previous pregnancies: _______ 4. Number of previous preterm deliveries: _____ 5. Number of living children under your care: _____ 6. Did you have high blood pressure with this pregnancy? 7. Do you still have high blood pressure post-delivery? 8. Did you have diabetes with this pregnancy? 9. Do you still have diabetes post-delivery? 10. Did you have asthma during this pregnancy? 11. Do you still have asthma post-delivery? 12. Did you receive steroids during this pregnancy? 13. Do you smoke? 14. Were you given antibiotics during this pregnancy? 15. What is your current relationship status? __ Single __ Married __ In a relationship with a partner Yes 16. Circle all of the following methods of payment apply to you: __ Private insurance __ Medicaid __ Self-pay 107 No Appendix D: Perceived Stress Scale Questions Never 1. In the last few days, how often have you been upset because of something that happened unexpectedly? 2. In the last few days, how often have you felt that you were unable to control the important things in your life? 3. In the last few days, how often have you felt nervous and “stressed”? 4. In the last few days, how often have you dealt successfully with day to day problems and annoyances? 5. In the last few days, how often have you felt that you were effectively coping with important changes that were occurring in your life? 6. In the last few days, how often have you felt confident about your ability to handle your personal problems? 7. In the last few days, how often have you felt that things were going your way? 8. In the last few days, how often have you found that you could not cope with all the things that you had to do? 9. In the last few days, how often have you been able to control irritations in your life? 108 Almost Never Sometimes Fairly Often Very Often 10. In the last few days, how often have you felt that you were on top of things? 11. In the last few days, how often have you been angered because of things that happened that were outside of your control? 12. In the last few days, how often have you found yourself thinking about things that you have to accomplish? 13. In the last few days, how often have you been able to control the way you spend your time? 14. In the last few days, how often have you felt difficulties were piling up so high that you could not overcome them? 109 Appendix E: Maternal- Infant Data Collection Sheet Study ID___________________ 1. Gender: Date enrolled__________________ Male ____ Female ____ 2. Birth Weight: _________ grams 3. Gestational Age:________ weeks 4. Length of Stay: __________days 5. Infant Demise if applicable: __________Day Post-Delivery 6. Maternal HbA1c if mother is diabetic: _________Use last recorded in medical record. 7. Maternal blood pressure: ____________Use last recorded in medical record post-delivery. 8. Volume human milk feedings per day 9. Day 3: _____________ Number of times infant breastfed or breast pumped 10. Day 9: _____________ Number of times infant breastfed or breast pumped 11. Day 14: ____________ Number of times infant breastfed or breast pumped 110 Appendix F: Salivary Collection Instructions Please do the following on Day 9 post-delivery: 1. Do not eat or drink anything 30 minutes prior to saliva collection 2. Upon awakening on Day 9 post-delivery a. Wash hands and rinse mouth out with cold water. b. Obtain study container for cortisol labeled with study ID/day of collection. 3. Follow the directions provided below for collection a. Remove the top cap of the tube to expose the round sponge. b. Do not remove the holder that the sponge is sitting in. c. Place the sponge directly into your mouth by tipping the tube so the sponge falls into your mouth. Do not touch the sponge with your fingers. d. Keep the sponge in your mouth. Very gently chew and roll the sponge around in your mouth for 2 minutes. Spit the sponge back into the tube. Do not touch the sponge with your fingers. e. Replace the cap. Make sure cap is on tightly. f. Place pre-labeled study tube in refrigerator. 4. Repeat steps 1-3, 30 minutes after the first collection on Day9. 5. Repeat steps 1-3, 60 minutes after the first collection on Day9. *** If at any time you are having trouble getting enough saliva- chew one piece of sugarless gum for 10 minutes to make more saliva. Remove gum from mouth before collecting saliva. Transporting study containers to Shelley Thibeau at Ochsner Medical Center: 1. You may use the milk transport bag to bring the frozen saliva containers along with your milk. 2. Study containers of saliva should be packed in the provided milk transport bag with frozen ice-packs to keep the saliva cold. 3. DO NOT USE ICE CUBES (WET ICE) TO TRANSPORT FROZEN SAMPLES. A clean towel can be used to fill any extra space between containers. For any questions please call: Shelley Thibeau: 504.616.5557 111 Appendix G: General Instruction Sheet for Mother Participants Please do the following when you first get home: 1. When you get home please take out the ice pack within the Medela Human Milk transfer bag and place it in your freezer. 2. At your earliest convenience please fill out the Mothers’ Survey (should take less than 5 minutes), place in designated envelope. Please do the following every day: 1. Shower daily. 2. Wear a clean bra each day and wash daily in warm soapy water. 3. Change wet or moist breast pads frequently. Moist pads can promote growth of germs. 4. Wash your hands thoroughly with soap and water for 15 seconds before pumping or handling your milk. 5. If you will be using an electronic pump, assemble the pump collection kit and have ready the sterile milk container. Place these items on a clean surface next to the breast pump. 6. Each time after you have finished pumping using the electronic pump, take apart all of the parts of the breast pump collection kit. Be sure to remove the yellow valve from the breast shield and separate the white membrane from the yellow valve. Rinse all of these parts with cool water then wash with warm soapy water. Rinse off the soapy water with cool water and air dry on a clean towel covered with a clean cloth. All parts may also be washed after each use in the top rack of a dishwasher. 7. Once each day, sterilize all of the parts of the breast pump collection kit. This can be done by boiling the kit parts for 10 minutes or by using a Quick Clean Micro-Steam Bag made by Medela, Inc in the microwave. 8. Notify your baby’s nurse or doctor if you become ill or need to take any medication, even over-thecounter medicines. On Day 3________ please do the following: 1. At the first or second feeding of the morning, hand express or pump your breasts using an electric pump. Pour 1 teaspoon (5 mL) into the study container with study label Day 3. Store milk sample in the freezer. 2. Fill out the Perceived Stress Scale (should take about 5 minutes). On Day 9________please do the following: 1. At the first or second feeding of the morning, hand express or pump both breasts using an electric pump. Pour 1 teaspoon (5 mL) into the study container with study label Day 9. Store milk sample in the freezer. 2. Fill out the Perceived Stress Scale (should take about 5 minutes). 3. Collect saliva upon awakening, 30 minutes and 60 minutes after awakening using the Salivary Collection Instruction Sheet. Store saliva samples in a refrigerator On Day 14__________ please do the following: 1. At the first or second feeding of the morning, hand express or pump both breasts using an electric pump. Pour 1 teaspoon (5 mL) into study container with study label Day 14. Store milk sample in the freezer. 2. Fill out the Perceived Stress Scale (should take about 5 minutes). ***All of the milk and saliva samples and surveys can be delivered to Shelley Thibeau at Ochsner Medical Center. You will receive a $25.00 gift card when all three milk and saliva samples as well as surveys are received. If you have any questions please contact Shelley Thibeau: 504.616.5557 or [email protected] or [email protected] . 112 Appendix H: Training Manual for Study-Staff 1. Study staff must complete the CITI course on Human Participant Protection in accordance with their respective institutions prior to data collection. 2. Study staff must agree to the following: a. Be available during their normal work hours to address any of the mothers/staff questions/concerns related to the study. b. Be available during their normal work hours to consent participants. c. Assist the PI with data collection the Maternal Infant Data Collection Sheet d. Be available for weekly conference calls with the PI to summarize participant enrollment, any problems obtaining data and/or collection of milk samples and surveys. 3. The PI will provide each study site coordinator with the following: a. 24/7 contact information b. Participant packets to include: i. The general instruction sheet with the milk collection, storage, and handling instructions for three small milk collection containers with study ID labels, three salivette kit and instructions for salivary cortisol collection , one paper copy of the Mothers’ Survey, three copies of the Perceived Stress Scale, all mothers will receive four envelopes with study ID labels, one pen, a milk transport bag with icepack, and microwave sterilization kit for pumping supplies 4. Algorithm for study participants Mother seen on routine lactation visit and consented to study by study site coordinator/PI Mother receives research packet with supplies for survey completion and sample collection Day3 MTI will complete the Mothers Survey, the PSS, and collect and store milk sample Day 9 MTI will complete the PSS. Collect and store saliva and milk sample Day 14 MTI will complete the PSS and collect and store milk sample All mothers will transport saliva and milk samples using milk transport bag and deliver to Shelley Thibeau at Ochsner Medical Center 113 REFERENCES Adam, E., & Kumari, M. (2009). Assessing salivary cortisol in large-scale epidemiological research. Psychoneuroendocrinology, 34, 1423-1436. Ader, R., Cohen, N., & Felten, D. (1995). Psychoneuroimmunology: Interactions between the nervous system and the immune system. Lancet, 345, 99-103. Agarwal, S., Karmaus, W., Davis, S., & Gangur, V. (2011). Immune markers in breast milk and fetal and maternal body fluids: A systematic review of perinatal concentrations. Journal of Human Lactation, 27(2), 171-186. Al-Banna, N., Pavlovic, D., Grundling, M., Zhou, J., Kelly, M., Whynot, S., Hung, O., Johnston, B., Issekutz, T., Kern, H., Cereny, V., & Lehmann, C. (2013). Impact of antibiotics on the microcirculation in local and systematic inflammation. Clinical Hemorheology and Microcirculation, 53, 155-169. Alevizos, M., Karagkouni, A., Panagiotidou, S., Vasiadi, M., & Theoharides, T. (2014). Stress triggers coronary mast cells leading to cardiac events. Annals of Allergy Asthma Immunology, 112, 309-316. Amoudruz, P., Holmlund, U., Schollin, J., Sverremark-Ekstrom, Montgomery, S. (2009). Maternal country of birth and previous pregnancies are assoicated with breastmilk characteristics. Pediatric Allergy & Immunology, 20, 19-29. Apaydin, K., Ermis, B., Arasli, M., Tekin, I., Ankarali, H. (2012). Cytokines in human milk and late-onset breast milk jaundice. Pediatrics International, 54, 801-805. Araújo, E., Gonçalves, A., Cornetta, M., Cunhan, H., Cardoso, M., Morais, S., & Giraldo, P. (2005). Evaluation of the secretory Immunoglobulin A levels in the colostrum and milk 114 of mothers of term and pre-term newborns. The Brazilian Journal of Infectious Diseases, 9(5), 357-362. Arifeen, S., Black, R., Antelman,G., Baqui,A., Caulfield, L., Becker, S. (2001). Exclusive breastfeeding reduces acute respiratory infection and diarrhea deaths among infants in Dhaka slums. Pediatrics, 108(4), e67-e75. Baron, R., & Kenny, D. (1986). The moderator-mediator variable distinction in social psychological research: Conceptual, strategic, and statistical considerations. Journal of Personality and Social Psychology, 51(6), 1173-1182. Bartick, M., & Reinhold, A. (2010). The burden of suboptimal breastfeeding in the United States Pediatrics, 125, 1048-1056. Beckie, T. (2012). A systematic review of allostatic load, health, and health disparities. Biological Research for Nursing, 14(4), 311-346. Beijers, R., Jansen, J., Riksen-Walraven, M., & de Weerth, C. (2010). Maternal prenatal anxiety and stress predict infant illnesses and health outcomes. Pediatrics, 126(2), e401-e409. Bisquera, J., Cooper, T., Berseth, C. (2002). Impact of necrotizing enterocolitis on length of stay and hospital charges in very low birth weight infants. Pediatrics, 109(3), 423-428. Borysenko, M. (1987). Psychoenuroimmunology. Annals of Behavioral Medicine, 9, 3-10. Böttcher, M., Abrahamsson, T., Fredriksson, M., Jakobsson, T., & Björkstén, B. (2008). Cytokine, chemokine and secretory IgA levels in human milk in relation to atopic disease and IgA production in infants. Pediatric Allergy & Immunology, 14(1), 35-41. Bramham, K., Parnell, B., Nelson-Piercy, C., Seed, P., Poston, L., & Chappell, L. (2014). Chronic hypertension and pregnancy outcomes: Systematic review and meta-analysis. British Medical Journal. doi: 10.1136/bmj.g2301 115 Brandtzaeg, P. (2003). Mucosal immunity: Integration between mother and the breastfed infant. Vaccine, 21, 3382-3388. Brandtzaeg, P. (2010). The mucosal immune system and its integration with the mammary glands. The Journal of Pediatrics, 156(2), s8-s16. Bryant Borders, A., Grobman,W., Amsden,L., & Holl, J. (2007). Chronic stress and low birth weight neonates ina low-income population of women. Obstetrics and Gynecology, 109(2), 331-338. Calgani, E., & Elenkov, I. (2006). Stress, cytokines, and disease susceptibility. Annals of New York Academy of Sciences, 1069, 62-76. Callaghan, W., Rasmussen, S., Jamieson, D., Ventura, S., Farr, S., Sulton, P., Matthews, T., Hamilton, B., Shealy, K., Brantley, D. & Posner, S. (2007). Health concerns of women and infants in times of natural disasters: lessons learned from hurricane Katrina. Maternal Child Health Journal, 11, 307-311. Carolan, M., & Frankowska, D. (2011). Advanced maternal age and adverse perinatal outcomes: A review of the evidence. Midwifery, 27, 793-801. Castellote, C., Casilas, R., Ramirez-Santana, C., Perez-Cano, F., Castell, M., Moretones, G., Lopez-Sabater, M., Franch, A. (2011). Premature delivery influences the immunological composition of colostrum and transitional and mature human milk. The Journal of Nutrition. doi: 10.3945/jn.110.133652, Centers for Disease Control and Prevention. (2010). Hypertension, High Serum Cholesterol, and Diabetes: Racial and Ethnic Prevalence Differences in US Adults, 1999-2006 Retrieved from http://www.cdc.gov/nchs/data/databriefs/db36.htm . 116 Centers for Disease Control and Prevention. (2012a). Breastfeeding Report Card 2012, United States: Outcome Indicators Retrieved from http://www.cdc.gov/breastfeeding/data/reportcard2.htm . Centers for Disease Control and Prevention. (2012b). Childhood Obesity Facts Prevalence of Childhood Obesity in the United States, 2011-2012. Retrieved from http://www.cdc.gov/obesity/data/childhood.html . Centers for Disease Control and Prevention. (2012c). Health, United States, 2012 Retrieved from http://www.cdc.gov/nchs/data/hus/hus12.pdf#068 . Centers for Disease Control and Prevention. (2013a). Infant Mortality Statistics From the 2009 Period Linked Birth/Infant Death Data Set. National Vital Statistics Report Retrieved from http://www.cdc.gov/nchs/data/nvsr/nvsr61/nvsr61_08.pdf . Centers for Disease Control and Prevention. (2013b). Summary Health Statistics for U.S. Children: National Health Interview Survey, 2012. Retrieved from http://www.cdc.gov/nchs/data/series/sr_10/sr10_258.pdf . Centers for Disease Control and Prevention. (2014a). Medication Usage During Pregnancy. Retreived from http://www.cdc.gov/pregnancy/meds/treatingfortwo/data.html . Centers for Disease Control and Prevention. (2014b). MMWR- Core state preconception health indicators- Pregnancy risk assessment monitoring system and behavioral risk factor surveillance system, 2009. Centers for Disease Control and Prevention. (2014c). Prevalence estimates of gestational diabetes mellitus in the US, Pregnancy risk assessment monitoring system (PRAMS), 2007-2010. Retrieved from http://www.cdc.gov/pcd/issues/2014/13_0415.htm . 117 Chantry, C., Dewey, K., Peerson, J., Wagner, E., & Nommsen-Rivers, L. (2014). In-hospital formula use increases early breastfeeding cessation among first-time mothers intending to exclusively breastfeed. Journal of Pediatrics, 164(6), 1339-1345. Chatterton, D., Nguyen D., Bering, S., & Sangild, P. (2013). Anit-inflammatory mechanisms of bioactive milk proteins in the intestines of newborns. The International Journal of Biochemistry and Cell Biology, 45, 1730-1747. Chida, Y., & Hamer, M. (2008). An association of adverse psychosocial factors with diabetes mellitus: a meta-analytic review of longitudinal cohort studies. Diabetologia, 51, 21682178. Child Trends Data Bank. (2014). Births to unmarried women: Indicators on children and youth (pp. 1-13). Ciardelli, L., Gardofoli, M., Avanzini, A., De Silvestri, A., Gasparoni, A., Sabatino, G., Stronati, M. (2007). Escherichia coli specific secretory IgA and cytokines in human milk from mothers of different ethnic groups resident in northern Italy. International Journal of Immunopathology and Pharmocology, 20(2), 335-340. Cohen, F., Kamarck, T., & Mermelstein, R. (1983). A Global Measure of Perceived Stress. Journal of Health and Social Behavior, 24, 385-396. Cohen, S., & Janicki-Deverts, D. (2012). Who's stressed? Distributions of pyschological stress in the Unites States in probablity samples from 1983, 2006, 2009. Journal of Applied Social Psychology, 42(6), 1320-1334. Cohen, S., Doyle, W., & Baum, A. (2006). Socioeconomic status is associated with stress hormones. Psychosomatic Medicine, 68, 414-420. 118 Cruz, J., Carlsson, B., Garcia, B., Gebre-Medhin, M.,Hofvander, Y., Urrutia, J., Hanson, L. (1982). Studies on human milk III. Secretory IgA quantity and antibody levels against Escherichia coli in colostrum and milk from underprivileged and priviliged mothers. Pediatric Research, 16, 272-276. Curtin, N., Mills, K., Connor, T. (2009). Psychological stress increases expression of IL-10 and it homolog IL-19 via B-adrenoceptor activiation: Reversal by the anxiolytic chlordiazepoxide. Brain, Behavior, and Immunity, 23, 371-379. Davis, S., Gebreab, S., Quarells, R., & Gibbons, G. (2014). Social determinants of cardiovascular health among black and white women residing in Stroke Belt and Buckle regions of the South. Ethnic Diversity, 24(2), 133-143. Elenkov, I. (2004). Glucorticoids and the Th1/Th2 Balance. Annals of New York Academy of Sciences, 1024, 138-146. Elenkov, I., & Chrousos, G. (2002). Stress hormones, proinflammatory and antiinflammatory cytokines and autoimmunity. Annals of New York Academy of Sciences, 966, 290-303. Erbağci, A., Çekmen, M., Balat, Ö., Balat, A., Aksoy, F., Tarakçioğlu, M. (2005). Persistency of high proinflammatory cytokine levels from colostrum to mature milk in preeclampsia. Clinical Biochemistry, 38, 712-716. Ermis, B., Yildrim, A., Tastekin, A, & Ors, R. (2009). Influence of smoking on human milk tumor necorsis factor-α, and interlukin-1β, and soluble vascular cell adhesion molecule-1 levels at postpartum seventh day. Pediatrics International, 51, 821-824. Fekedulegn, D., Andrew, M., Burchfiel, D., Violanti, J., Hartley, T., Charles, L., & Miller, D. (2007). Area under the curve and other summary indicators of the repeated waking cortisol measurements. Psychosomatic Medicine, 69, 651-659. 119 Field, C. (2005). The immunological components of human milk and their effect on immune development in infants. Recent Advances in Nutritional Sciences, 135, 1-4. Finkelstein, S., Keely, E., Feig, D., Tu, X., Yasseen, A. (2013). Breastfeeding in women with diabetes: lower rates desptie greater rewards. A population-based study. Diabetic Medicine, 30, 1094-1101. Fituch, C., Palkowetz, K., Goldman, A., Schanler, R. (2004). Concentrations of IL-10 in preterm human milk and in milk from mothers of infants with necrotizing enterocolitis. Acta Paediatrics, 93, 1496-1500. Garofalo, R. (2010). Cytokines in human milk. The Journal of Pediatrics, 156(2), s36-s40. Garofalo, R., & Goldman, A. (1998). Cytokines, chemokines, and colon-stimulating factors in human milk. Biology of the Neonate, 74(2), 134-142. Giesbrecht, G., Campbell, T., Letourneau, N., Kooistra, L., Kaplan, B. (2012). Psychological distress and salivary cortisol covary within persons during pregnancy. Psychoneuroendocrinology, 37, 270-279. Glaser, R., & Kiecolt-Glaser, J. (2005). Stress-induced immune dysfunction: Implications for health. Science and Society, 4, 243-250. Goldman, A. (2007). The immune system in human milk and the developing infant. Breastfeeding Medicine, 2(4), 195-204. Granger, D., Willoughby, B., Kivlighan, K., Hibel, L., Fortunato, C., Wiegand, L., & Family Life Project Investigators (2007). Individual differences in salivary cortisol and alphaamylase in mothers and their infants: relation to tobacco smoke exposure. Developmental Psychobiology, 49(7), 692-701. 120 Groer , M, Davis, M., Casey, K., Short, B., Smith, K., & Groer , S. (2005). Neuroendocrine & immune relaitonships in postpartum fatigue. Maternal Child Nuriing, 30(2), 133-138. Groer , M. (2005). Differences between exclusive breastfeeders, formula feeders, and controls: A study of stress, mood, and endocrine variables. Biological Research for Nursing, 7(2), 106-117. Groer , M., & Beckstead, J. (2011). Multidimensional Scaling of Multiplex Data: Human Milk Cytokines [raw data]. Biological Research for Nursing, 13(3), 289-296. Groer , M., & Davis, M. (2006). Cytokines, infections, stress, and dysphoric moods in breastfeeders and formula feeders. Journal of Obstetric, Gynecological and Neonatal Nursing, 35(5), 599-607. Groer , M., & Shelton, M. (2009). Exercise is associated with elevated proinflammatory cytokines in human milk. Journal of Obstetric, Gynecological and Neonatal Nursing, 38, 35-41. Groer , M., Davis, M., & Steele, K. (2004). Associations between human milk sIgA and maternal immune, infectious, endocrine, and stress variables. Journal of Human Lactation, 20(2), 153-158. Groer , M., Humenick, S., Hill, P. (1994). Characterizations and psychoneuroimmunologic implications of secretory Immunoglobulin A and cortisol in preterm and term breastmilk. Journal of Perinatal, Neonatal Nursing, 7(4), 42-51. Hampson, E., Phillips, S., Soares, C., & Steiner, M. (2013). Steroid concentrations in antepartrum and postpartum saliva: normative values in women and correlations with serum. Biology of Sex Differences, 4(7). 121 Harville, E., Savitz, D., Dole, N., Herring, A., & Thorp, J. (2009). Stress questionaires and stress biomarkers during pregnancy. Journal of Women's Health, 18(9), 1425-1433). Hawkes, J., Bryan, D., Makrides, M., Neumann, M., Gibson, R. (2002). A randomized trial of supplementation with docosahexaenoic acid-rich tunal oil and its effects on the human milk cytokines interleukin 1ß, interleukin 6, and tumor necrosis factor α 1-3. . American Society for Clinical Nutrition, 75, 754-760. Heinrichs, M., Meinschmidt, G., Neuman, I., Wagner, S., Kirschbaum, C., Ehlert, U. & Hellhammer, D. (2001). Effects of suckling on hypothalmic-pituitary-adrenal axis responses to psychosocial stress in postpartum lactating women. Journal of Clinical Endocrinology & Metabolism, 86(10), 4798-4804. Heinrichs, M., Neumann, I., & Ehlert, U. (2002). Lactation and stress: Protective effects of breastfeeding in humans. Stress, 5(3), 195-203. Herbert, T., & Cohen, S. (1993). Stress and immunity in humans: A meta-analytic review. Psychosomatic Medicine, 55, 364-379. Hicken, M., Lee, H., Morenoff, J., House, J. & Williams, D. (2014). Racial/ethnic disparities in hypertension prevalence: reconsidering the role of chronic stress. American Journal of Public Health, 104(1), 117-123. Holmlund, U., Amoudrouz, P., Johansson, M., Haileselassie, Y., Ongoiba, A., Kayentao, K., Traoré, B., Doumbo, S., Schollin, J., Doumbo, O., Montgomery, S. & SverremarkEkström. (2010). Maternal country of origin, breast milk characteristics and potential influences on immunity in offspring. the Journal of Translational Immunology, 162, 500509. 122 Hung, C. (2007). The psychosocial consequences for primiparas and multiparas. Kaohsiung Journal Medical Science, 23, 352-360. Hurst, N. (2007). Recognizing and treating delayed or failed lactogenesis II. Journal of Midwifery & Womens Health, 52(6), 588-593. Ip, S., Chyng, M., Raman, G., Chew, P., Magula, N., Devine, D., Litt, M., Trikalinos, T., & Lau, J. (2007). Breastfeeding and Maternal and Infant Health Outcomes in Developed Countries. In U.S. Department of Health and Human Services (Ed.), Evidence Report/Technology Assessment Number 153. Rockville, Maryland: Agency for Healthcare Research and Quality. Janeway, C., Travers, P., Walport, M. & Shlomchik, M. (2005). ImmunoBiology: The Immune System in Health and Disease. New York: Garland Science Publishing. Jevitt, C., Groer , M., Crist, N., Gonzales, L., & Wagner, V. (2012). Postpartum stressors: A content analysis. Issues in Mental Health Nursing, 33, 309-318. Kaiser Family Foundation. (2010). Demographics and ecomonmy: State health facts Retrieved from http://www.statehealthfacts.org/profilecat.jsp?rgn=20&cat=1 Kawano, A., Emori, Y., & Miyagawa, S. (2009). Association between stress-related substances in saliva and immune substances in breast milk in puerperae. Biological Research for Nursing, 10(4), 350-355. Kenny, L., Lavendar, T., McNamee, R., O'Neill, S., Mills, T., & Khashan, A. (2013). Advanced maternal age and adverse pregnancy outcomes: Evidence from a large contemporary cohort. PLOS One, 8(2), e56583. 123 Kiekolt-Glaser, J., Preacher, K., MacCallum, R., Atkinson, C., Malarkey, W., & Glaser, R. (2003). Chronic stress and age-related increases in the proinflammaotry cytokine IL-6. Proceedings of the National Academy of Sciences, 100(105), 9090-9095. Kirschbaum, C., & Hellhammer, D. (2000). Salivary Cortisol Encyclopedia of Stress (Vol. 3): Academic Press. Kumral, A., Ozkan, H., Duman, N., Yesilrimal, D., Islekel, H. & Ozalp, Y. (2009). Breast milk jaundice correlates with high levels of epidermal growth factor. Pediatric Research, 66(2), 218-222. Kuster, P, & Merkle, C. (2004). Caregiving stress, immune function, and health: Implications for research with parents of medically fragile children. Comprehensive Pediatric Nursing, 27, 257-276. Kverka, M., Burianova, J., Lodinova-Zadnikova, R., Kocourkova, I., Cinoa, J., Tuckova, L. &Tlaskalove-Hogenova, H. (2007). Cytokine profiling in human colostrum and milk by protein array. Clincial Chemistry, 53(5), 955-962. Labbock, M.L., Clark, D. & Goldman, A. (2004). Breastfeeding: maintaning and irreplaceable immunological resource. Nature Reviews Immunology, 4(7), 565-572. Lanier, P., & Jonson-Reid, M. (2014). Comparing primiparous and multiparous mothers in a nurse home visiting prevention program. Birth Issues in Perinatal Care. doi: 10.1111/birt.12120 Laopaiboon, M., Lumbiganon, P. Intarut, N., Mori, R., Ganchimeg, T. Vogel, J., Souza, J. Gulmezoglu, A. (2014). Advanced maternal age and pregnancy outcomes: a multicountry assessment. BJOG An International Journal of Obstetrics and Gynaecology, 121(Supp1), 49-56. 124 Lars, H. (2004). Immunobiology of Human Milk. Amarillo, Texas: Pharmasoft Publishing. Lawrence, R., & Pane, C. (2007). Human Breast Milk: Current concepts of immunology and infectious diseases. . Current Problems in Pediatric Adolescent Health Care(37), 7-36. Lazarus, R., & Folkman, S. (1984). Stress, appraisal and coping. New York: Springer. Leroyer, A., Bedu, A. Lombrail, P., Desplanques, L., Diakies, B., Bingen, E. Aujard, Y., Brodin, M. (1997). Prolongation of hospital stay and extra costs due to hospital-acquired infection in a neonatal unit. Journal of Hospital Infection, 35, 37-45. Letson, G., Rosenberg, K., & Wu, L. (2002). Association between smoking during pregnancy and breastfeedng at about 2 weeks of age. Journal of Human Lactation, 18(4), 368-372. Leung, D., Lam, T., & Chan, S. (2010). Three versions of perceived stress scale: validation in a sample of Chinese, cardiac patients who smoke. British Medical Community Public Health, 10(1), 513 epub ahead of print. Lovell, B., & Wetherell, M. (2011). The cost of caregiving: endocrine and immune implications in elderly and non elderly caregivers. Neuroscience and Biobehavioral Reviews, 35, 1342-1352. Ludington-Hoe, S. M., McDonald, P. E., & Satyshur, R. (2002). Breastfeeding in AfricanAmerican women. Journal of the National Black Nurses Association, 13(1), 56-64. Lyon, B. (2000). Stress, coping, and health. In Virginia Rice (Ed.), Handbook of Stress, Coping, and Health: Implications for Nursing Research, Theory, and Practice (pp. 3-21). Thousand Oaks, CA: Sage. Malgady, R., & Krebs, D. (1986). Understanding correlation coefficients and regression. Physical Therapy, 66(1), 110-120. 125 March of Dimes. (2009). Premature Birth Facts Retrieved from http://www.marchofdimes.com/professionals/14332_1157.asp#head2 . March of Dimes. (2010). Peristats Retrieved from http://marchofdimes.com/peristats/. March of Dimes. (2012). March of Dimes Peristats Retrieved from http://www.marchofdimes.com/Peristats/ViewSubtopic.aspx?reg=99&top=14&stop=125 &lev=1&slev=1&obj=3 . March of Dimes. (2014). Smoking, Alcohol, and Drugs Retrieved from http://www.marchofdimes.com/pregnancy/smoking-duringpregnancy.aspx?gclid=CKCBjoO4xb8CFSwS7AodhDYAcw . Marek, A., Zagierski, M., Liberek, A., Aleksandrowicz, E., Korson, M., Krsykowski, G., Kaminska, B., & Szlagatys-Sidorkiewicz, A. (2009). TGF-B1, IL-10,and IL-4 in colostrum of allergic and nonallergic mothers. Acta Biochimica Polonica, 56(3), 411-414. Marinda, M., Maxson, P., & Edwards, S. (2009). Environmental contribution to disparities in pregnancy outcomes. Epidemiologic Reviews, 31(1), 67-83. Markus, A., Adres, E., West, K., Garro, N., & Pellegrini, C. (2013). Medicaid covered cirths, 2008 through 2010, in the context of the implementation of health reform. Womens Health Issues, 23(5), e273-e280. Mehta, R., & Petrova, A. (2011). Very preterm gestation and breastmilk cytokine content during the first month of lactation. Breastfeeding Medicine, 6(1), 21-24. Meki, A., Saleem, T., Al-Ghazali, M., & Sayed, A. (2003). Interleukins 6, 8 and 10 and tumor necrosis factor- alpah and its soluble receptor 1 in human milk at different periods of lactation. Nutrition Research, 23, 845-855. 126 Miller, G., Cohen, S., & Ritchey, K. (2002). Chronic psychological stress and the regulation of pro-inflammatory cytokines: A glucocorticoid-resistance model. Health Psychology, 21(6), 531-541. Mimura, C., & Griffiths, P. (2004). A Japanese version of the perceived stress scale: translation and preliminary test. International Japanese Nursing Studies, 2004(41), 4. Montagne, P., Cuillière, M., Molé, C., Béné, M., Faure, G. (1999). Immunological and nutritional composition of human milk in relation to prematurity and mother's parity during the first 12 weeks of lactation. Journal of Pediatric Gastroenterology & Nutrition, 29(1), 75-80. Morgan, J., & Roberts, S. (2013). Maternal sepsis. Obstetric and Gynecology Clinics of North America, 40, 69-87. Mund, M., Louwen, F., Klingelheofer, D., & Gerber, A. (2013). Smoking and pregnancy- A review on the first major environmental risk factor of the unborn. International Journal of Environmental Research on Public Health, 10, 6485-6499. Murgas Torazza, R., & Neu, J. (2011). The developing intestinal microbiome and its relationship to health and disease in the neonate. Journal of Perinatology, 31, s29-s34. Nair, R., Warner, B. B., & Warner, B. W. (2008). Role of epidermal growth factor and other growth factors in the prevention of necrotizing enterocolitis. Seminars in Perinatology, 32, 107-113. Nast, I., Bolten, M., Meinlschmidt, G., Hellhammer, D. (2013). How to measure prenatal stress? A systematic review of psychometric instruments to assess psychosocial stress during pregnancy. Paedeatric and Perinatal Epidemiology, 27(3113-322). 127 National Diabetes Information Clearinghouse. (2011). National Diabetes Statistics. Retrieved from http://diabetes.niddk.nih.gov/dm/pubs/statistics/#ddY20 . National Vital Statistics Reports. (2013). Births: Final Data for 2012. In J. Martin, Hamilton, B., Osterman, M., Curtin, S. and Mathews, T. (Ed.), (Vol. 62): Division of Vital Statistics. Newburg, D. (2005). Innate immunity and human milk. The Journal of Nutrition, 135, 13081312. Nicholson, N. (2008). Measurement of Cortisol. In & Linda C. Gallo Linda J. Luecken (Ed.), Handbook of Physiological Research Methods in Health Psychology. Thousand Oaks, CA: Sage Publications. O'Keane, V., Lightman, S., Patrick, K., Marsh, M., Papadoulus, A., Pawlby, S., Seneviratne, G., Taylor, A., & Moore, R. (2011). Changes in the maternal hypothalamic-pituitary-adrenal axis during the early puerperium may be related to the postpartum ‘blues’. Journal of Neuroendocrinology, 23, 1149-1155. O’Connor, M., Schmidt, W., Carroll-Pankhurst, C., & Olness, K. (1998). Relaxation training and breast milk secretory IgA. Archives of Pediatric Adolescent Medicine, 152, 1065-1070. Odom, E., Li, R., Scanlon, K., Perrine, C. & Grummer-Strawn, L. (2013). Reasons for earlier than desired cessation of breastfeeding. Pediatrics, 131(3), e726-e732. Office on Women's Health, US Department of Health and Human Services. (2013). Minority Women's Health Retrieved from http://womenshealth.gov/minority-health/africanamericans/pregnancy.html . Ogawa, J., Sasahara, A., Yoshida, T., Sira, M., Futatani, T., Kanegane, H. & Miyawaki, T. (2004). Role of transforming growth factor-h in breast milk for initiation of IgA production in newborn infants. Early Human Development, 77, 67-75. 128 Prokešová, L., Lodinová-Žádnı´ková, R., Žižka J, Kocourková, I., Novotná, O., Petrásková, P., Šterzl, I. (2006). Cytokine levels in healthy and allergic mothers and their children during the first year of life. Pediatric Allergy and Immunology, 17, 175-183. Ramirez, & Hernandez, R. (2007). Factor structure of the perceived stress scale in a sample from Mexico. Spanish Journal of Psychology, 10(1), 199-206. Rice, V. (2000). Theories of stress and relationship to health. In Virginia Hill Rice (Ed.), Handbook of Stress, Coping, and Health. Implications for Nursing Research, Theory, and Practice. Thousand Oaks: Sage. Richter, J., Bittner, A., Petrowski, K., Junge-Hoffmeister, J., Bergmann, S., Joraschky P., & Weidner, K. (2012). Effects of an early intervention on perceived stress and diurnal cortisol in pregnant women with elevates stress, anxiety, and depressive symptomatology. Journal of Psychosomatic Obstetrics and Gynecology, 33(4), 162-170. Rigotti, E., Piancentini, G., Mess, R., Pigozzi, R., Boner, A. & Peroni, D. (2006). Transforming growth factor-b1 and interleukin-10 in breast milk and development of atopic diseases in infants. Clinical and Experimental Allergy, 36, 614-618. Rodriguez, N., Miracle, D., & Meier, P. (2005). Sharing the science on human milk feedings with mother of very-low-birth-weight infants. Journal of Obstetric, Gynecological and Neonatal Nursing, 34, 109-119. Ruiz, R., & Avant, K. (2005). Effects of maternal prenatal stress on infant outcomes. Advances in Nursing Science, 28(4), 345-355. Sakamoto, S., Hayashi, T., Hayashi, K., Murai, F., Hori, M., Kimoto, K., & Murakami, K. (2007). Pre-germinated brown rice could enhance maternal mental health and immunity during lactation. European Journal of Nutrition, 46, 391-396. 129 Sappenfield, E., Jamieson, D. & Kourtis, A. (2013). Pregnancy and susceptibiltiy to infectious diseases. Infectious Diseases in Obstetrics and Gynelcology. Schwarz, E., Brown., J., Creasman, J., Stuebe, A., McClure, C., Van Den Eeden, S., & Thom, D. (2010). Lactation and maternal risk of type-2 diabetes: A population based study. American Journal of Medicine, 123(9), 863e861-e866. Segerstrom, S., & Miller, G. (2004). Psychological stress and the human immune system: A meta-analytic study of 30 years of inquiry. Psychological Bulletin, 130(4), 601-630. Seyle, H. (1976). The Stress of Life. New York: McGraw-Hill. Shaker-Berbari, L. (2013). Breastfeeding in Emergencies. Nutrition Program- World Breastfeeding Week Retrieved from http://www.who.int/nutrition/topics/seminar_6Aug2013_ShakerBerbari_presentation.pdf ?ua=1 . Sharp, L., Kimmel, L., Kee, R., Saltoun, C., & Chang, C. (2007). Assessing the perceived stress scale fro African Amercian adults with asthma and low literacy. Journal of Asthma, 44(4), 311-316. Shelton, M., Schminkey, D., & Groer , M. (2014). Relationships among prenatal depression, plasma cortisol, and inflammatory cytokines. Biological Research for Nursing. doi: 10.1177/1099800414543821 Speakman, J., & Garratt, M. (2013). Oxidative stress as a cost of reproduction: Beyond the simplistic trade-off model. Bioessays, 36, 93-106. Spencer, B., & Grassly, J. (2013). African American women and breastfeeding: An integrative literature review. Health Care for Women International, 34(7), 607-625. 130 Staruschenko, A., Palygin, O., Ilatovskaya, D., & Pavlov, T. (2013). Epidermal growth factors in the kidney and relationship to hypertension. American Journal of Physiology Renal Phsiology, 305(1), F12-F20. Takahata, Y., Takada, H., Nomura, A., Nakayama, H., K Ohshima, K. & and Hara, T. (2003). Detection of interferon-y-inducible chemokines in human milk. Acta Paediatrics, 92, 659-665. The Henry J. Kaiser Family Foundation. (2013). What is Medicaid's impact on access to care, health outcomes and quality of care. Setting the record straight on the evidence. . The World Health Organization. (2007). Infant and Young Child Feeding, Model chapter for textbooks for medical students and allied health professionals. Thibeau, S. & D'Apolito, K. (2012). Review of the relationships between maternal characteristics and preterm breastmilk immune components. Biological Research for Nursing, 14(2), 207-216. Thibeau, S., & D'Apolito, K. (2011). Feasibility study on collection, storage and analysis of preterm breastmilk immune components. Abstract in The Ochsner Journal, 11(2), 167205. Thompson, J., Roberts, C., Currie, M., Ellwood, D. (2002). Prevalence and persistence of health problems after childbirth: Association with parity and method of birth. BIRTH, 29(2), 8394. Tiaka, E., Papana, N., Manolakis, A., & Georgiadis, G. (2012). Epidermal growth factor in the treatment of diabetic foot ulcers: An update. Perspectives in Vascular Surgery and Enovasculat Therapy, 24(1), 37-44. 131 Trègoat, V., Montagne, P., Bènè, M., & Faure, G. (2001). Increases of IgA Milk Concentrations Correlate With IgA2 Increment. Journal of Clinical Laboratory Analysis, 15, 55-58. Tu, M., Lupien, S., & Walker, C. (2006a). Diurnal salivary cortisol levels in postpartum mothers as a function of infant feeding choice and parity. Psychoneuroendocrinology, 31, 812824. Tu, M., Lupien, S., & Walker, C. (2006b). Multiparity reveals the blunting effect of breastfeeding on physiological reactivity to psychological stress. Journal of Neuroendocrinology, 18, 494-503. U S Department of Health and Hospitals. (2010). Healthy People 2020. Leading indicators: Increase the proportion of mothers who breastfed their infants Retrieved from http://www.healthypeople.gov/2020/topicsobjectives2020/objectiveslist.aspx?topicId=26. United States Census Bureau. (2013). Profile America Facts: Mothers Day 2013. Retrieved from http://www.census.gov/newsroom/releases/archives/facts_for_features_special_editions/c b12-ff08.html . Urizar, G., & Munoz, R. (2011). Impact of a prenatal cognitive-behavioral stress managment intervention on salivary cortisol levels in low income mothers. Psychoneuroendocrinology, 36(10), 1480-1494. Vanderbilt University. (2014). Research Electronic Data Capture REDCap. Retrieved from https://redcap.vanderbilt.edu/ . Vogl, S., Worda, C., Egarter, C., Bieglmayer, C., Szekeres, T., Huber, J., & Husslein, P. (2006). Mode of delivery is associated with maternal and fetal endocrine stress response. British Journal of Obstetrics and Gynocology, 113, 441-445. 132 Wall, Ginna. (2007). Outcomes of Breastfeeding Versus Formula Retrieved http://www.llli.org/docs/Outcomes_of_breastfeeding_June_2007.pdf. Wallace, M., & Harville, E. (2012). Allostatic load and birth outcomes among white and black women in New Orleans. Maternal Child Health Journal, 17, 1025-1029. Wendland, E., Torloni, M., Falavigna, M., Trujillo, J., Dode, M., Campos, M., Duncan, B., & Schmidt, M. (2012). Gestational diabetes and pregnancy outcomes- a sytematic review of the World Helath Organization (WHO) and the International Association of Diabetes in Pregnancy Study Groups (IADPSG) diagnostic criteria. BMC Pregnancy and Childbirth, 12(23). doi: http://www.biomedcentral.com/1471-2393/12/23. Wilson, B., Gance-Cleveland, B. & Locus, T. (2011). Ethnicity and newborn outcomes: The case of African American women. Journal of Nursing Scholarship, 43(4), 359-367. World Health Organization. (2002). Infant and young child nutrition; Global strategy on infant and young child feeding. FIFTY-FIFTH WORLD HEALTH ASSEMBLY A55/15 Provisional agenda item 13.10. http://apps.who.int/gb/archive/pdf_files/WHA55/ea5515.pdf?ua=1 . Wright, R., Visness, C., Clatroni, A., Grayson, M., Gold, D., Sandel, M., Lee-Parritz, A., Wood, R., Kattan, M., Bloomberg, G., Burger, M., Toglias, A., Witter, F., Sperline, R., Sadovsky, Y., Bern, J. (2009). Prenatal maternal stress and cord blood innate and adaptive cytokine responses in an inner city cohort. American Journal of Respiratory Critical Care Medicine 182, 25-33. Yilmaz, H., Saygili-Yilmaz, E. & Gunesacar, R. (2007). Interleukin-10 and -12 in human milk at 3 stages of lactation: A longitudinal study. Advances in Therapy, 24(3), 603-610. 133 Zahwa, H., Yorty, J. & Bonneau, R. (2008). Elevated maternal corticosterone during lactation hinders the neonatal adaptive immune response to herpes simplex virus (HSV) infection. Brain, Behavior, and Immunity, 22, 339-353. Zanardo, V., Golin, R., Amato, M., Trevisanuto, D., Favaro, F., Faggian, D & Plebani, M. (2007). Cytokines in human colostrum and neonatal jaundice. Pediatric Research, 62(2), 191-194. 134


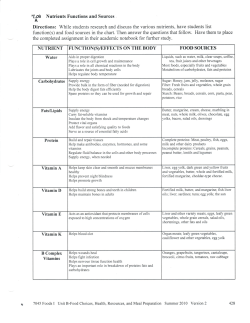
© Copyright 2026