
Glucocorticoids, 11β-hydroxysteroid dehydrogenase type 1 and the
Glucocorticoids, 11β-‐hydroxysteroid Dehydrogenase Type 1 and the Aged Phenotype By Dr Zaki K. Hassan-‐Smith A thesis submitted to the University of Birmingham for the degree of DOCTOR OF PHILOSOPHY (PhD) IN MEDICINE School of Clinical and Experimental Medicine College of Medical and Dental Sciences University of Birmingham January 2014 University of Birmingham Research Archive e-theses repository This unpublished thesis/dissertation is copyright of the author and/or third parties. The intellectual property rights of the author or third parties in respect of this work are as defined by The Copyright Designs and Patents Act 1988 or as modified by any successor legislation. Any use made of information contained in this thesis/dissertation must be in accordance with that legislation and must be properly acknowledged. Further distribution or reproduction in any format is prohibited without the permission of the copyright holder. Abstract Cushing’s syndrome is characterised by changes in body composition and cardiovascular disease risk profiles that have similarities to the aged phenotype. 11β-‐hydroxysteroid dehydrogenase type 1 (11β-‐HSD1) converts inactive glucocorticoids (GCs) to their active form (cortisone to cortisol in humans). There is growing evidence that 11β-‐HSD1 expression/activity increases with age in key target tissues including adipose tissue, bone, and skin. This thesis encompasses a series of novel studies investigating the role of GCs and their pre-‐ receptor metabolism in determining the ageing phenotype, with a central focus on skeletal muscle. We show that although cure of Cushing’s disease results in rapid improvements in clinical parameters, excess mortality may persist. We show in-‐vitro evidence of regulation of proteolytic genes by 11β-‐HSD1. We show that 11β-‐HSD1 knockout mice are protected from muscle weakness due to GCs and ageing. We recruited healthy subjects (n=135, aged 20-‐80 years) who underwent in-‐ depth phenotyping, along with muscle biopsies (analysed by gene expression array) and urine steroid metabolite analysis. Skeletal muscle 11β-‐HSD1 expression increased with age in women and this change may be driven by the menopause. The therapeutic potential of selective inhibitors of 11β-‐HSD1 in ameliorating the adverse metabolic and body composition profile associated with ageing and the menopause remains to be determined. Furthermore we highlight future directions in investigating potential therapeutic targets related to GC-‐signalling in muscle atrophy due to sarcopenia and other aetiologies such as critical illness. ii For Ghaniah and Levizah iii Acknowledgements I extend my sincere thanks to Professor Paul Stewart for his expert supervision. I am extremely grateful for his clear guidance, mentorship and inspirational leadership during my time as a fellow. I would also like to express my appreciation for his drive and determination to achieve our research goals, and for supporting me in my development as a clinical researcher. I also express my deepest gratitude to Dr Gareth Lavery for supervising this thesis and for his help, suggestions and useful discussions. I would like to warmly thank Professors Jeremy Tomlinson and Wiebke Arlt for their support, mentorship and practical guidance. I thank all members of the ‘Stewart’ research group and the wider Centre for Endocrinology, Diabetes and Metabolism at the University of Birmingham for their help. Special mention goes to Dr Stuart Morgan who I would like to thank for teaching me many of the laboratory methods included in this thesis, and for collaborating with me on the animal studies. I would thank Beverly Hughes for her technical support with regards urine steroid analysis. In addition I would like to mention Dr Laura Gathercole, Dr Iwona Bujalska, Dr Dean Larner, Phil Guest and Carol Kenny. My heartfelt thanks go to the human ageing study volunteers, without whom the research would not be possible. I would also like to thank all those who helped with recruitment of these volunteers including Professor Janet Lord, numerous local community-‐based groups, staff in the press office, social media and alumni departments of the University of Birmingham, and the communications team at Queen Elizabeth Hospital Birmingham. I extend my gratitude to the nurses at the iv Wellcome Trust Clinical Research Facility, in particular Trish Brady, Pamela Jones and Claire Brown for their support in running the study. I would like to thank Dr Peter Nightingale for discussions regarding statistical analysis, Dr Nicola Crabtree for support with body composition data, and Dr Chris Shaw for initial advice on the percutaneous muscle biopsy technique. I also extend my appreciation to the clinical colleagues who provided advice on the study of Cushing’s disease outcomes outlined in chapter 3 including Dr Mark Sherlock, Dr John Ayuk and Dr Andy Toogood, along with Dr Raoul Reulen who provided statistical support. I would like to thank my family and friends for their support over this period. Finally, above all this thesis is dedicated to my wife, Ghaniah who has been with me throughout this journey providing support, advice and understanding, and my daughter, Levizah who arrived in time for the write up. v Table of Contents Chapter 1 – General Introduction…………………………………….………………….1 1.1. Corticosteroid Secretion and Action………………………………..…………………2 1.1.1 Adrenal Glands……………………………………………………………………..………………2 1.1.2 Steroidogenesis……………………………………………………………………..….................3 1.1.3 The Hypothalamic Pituitary Adrenal (HPA) Axis……………………….…………...5 1.1.4 The Glucocorticoid Receptor (GR)…………………………………………..……………..7 1.1.5 Effects of Glucocorticoids (GCs)…………………………………………………….………8 1.1.6 The Renin-‐Angiotensin-‐Aldosterone Axis………………………………………..……..9 1.2. Regulation of Glucocorticoid Action………………………………………..............11 1.2.1. Corticosteroid Binding Globulin……………………………………………..……………12 1.2.2. Glucocorticoid Metabolism…………………………………………………….…………...12 1.3. Cushing’s Syndrome………………………………………………………….……………...13 1.4. Pre-‐Receptor Glucocorticoid Regulation………………………….……………...16 1.4.1. 11Beta-‐hydroxysteroid Dehydrogenase: Types 1 and 2.……………………….16 1.4.2 Regulation of 11β-‐HSD1 by GH-‐IGF-‐I……………….…………………….…………….19 1.4.3 Regulation of 11β-‐HSD1 by Pro-‐Inflammatory Cytokines……….…………….20 1.4.4 11β-‐HSD1 Expression and Activity in Skeletal Muscle……………..……………20 1.4.5 Transgenic Models used to investigate 11β-‐HSD1 Function………..………...22 1.4.6 Human Genetic Mutations in 11β-‐HSD1 and 2 and H6PDH……..……….23 1.4.6.1 HSD11B1: Cortisone Reductase Deficiency (CRD) and H6PDH: Apparent Cortisone Reductase Deficiency (ACRD)……………………..…..23 1.4.6.2 HSD11B2: Apparent Mineralocorticoid Excess (AME)…………...…..…...25 1.4.7 Selective 11β-‐HSD1 Inhibitors………………………………………………………….…26 1.5 Skeletal Muscle…………………………………………………………………………..……..27 1.5.1 Skeletal Muscle Physiology and Structure………………………………….………...27 1.5.2 Glucocorticoid-‐Induced Myopathy………………………………………….…………...30 1.5.2.1 Clinical Features of GC-‐Induced Myopathy…………………………….……….32 1.5.2.2 Investigations for GC-‐Induced Myopathy……………………………..…………33 1.5.2.3 Molecular Mechanisms of GC-‐Induced Myopathy………………..…………..34 1.5.2.4 GC-‐Induced Myopathy and the Ubiquitin-‐Proteosome-‐System (UPS)………………...………………………………………………………………..………...34 1.5.2.5 GC-‐Induced Myopathy and Forkhead Box Transcription Factors (FOXOs)…………………………................................................………………..…………36 1.5.2.6 GC-‐Induced Myopathy and IGF-‐I/PI3K/Akt Signalling……….……………37 1.5.2.7 GC-‐Induced Myopathy and Insulin Signalling………………………..………...38 1.5.2.8 GC-‐Induced Myopathy and Mammalian Target of Rapamycin (mTOR)…………………….…………………………………..………………………………39 1.5.2.9 GC-‐Induced Myopathy and Glycogen Synthase Kinase Beta (GSK-‐3β)……………………………………………………………………………………....39 1.5.2.10 GC-‐Induced Myopathy, P300 and CCAAT/Enhancer Binding Factor (C/EBP)………………………………………………………………………………………..40 1.5.2.11 GC-‐Induced Myopathy and Myostatin…………………………………..……….41 1.5.2.12 GC-‐Induced Myopathy and Apoptosis…………………………………..……….42 1.5.2.13 GC-‐Induced Myopathy and MicroRNAs……………………………..…………..43 1.5.2.14 Potential Therapies for GC-‐Induced Myopathy…………………..………….45 1.6 Ageing – General Concepts……………………………………………………….………48 1.6.1 The Ageing Population………………………………………………………………..……...48 1.6.2 Theories of Ageing…………………………………………………………………..…………49 1.6.3 The Ageing Phenotype………………………………………………………….……………50 1.7 Ageing and the Endocrine System……………………………………..……………..51 vii 1.7.1 Ageing and the GH-‐IGF-‐I Axis……………………………...………………………………51 1.7.1.1 GH Treatment in Elderly Subjects without Pituitary Disease..…….......52 1.7.1.2 The Paradox of GH-‐IGF-‐I and Ageing……………………………………..………53 1.7.2 Ageing and the Hypothalamic Pituitary Adrenal (HPA) Axis…………..……55 1.7.2.1 Age-‐Related Changes in Mean 24-‐hour Cortisol Secretion and Diurnal Variation……………………………………………………..............................56 1.7.2.2 Age-‐Related Changes in Morning Cortisol Levels……………………...........57 1.7.2.3 Age-‐Related Changes in ACTH………………………………………………….……57 1.7.2.4 Age-‐Related Changes in Cortisol Binding Globulin (CBG)……….……….58 1.7.2.5 Age-‐Related Changes in Dynamic Tests of the HPA-‐axis………….………58 1.7.2.6 Heritability of Age-‐Related HPA changes……………………………………….59 1.7.2.7 Sexual Dimorphism in Age-‐Related HPA-‐Axis Changes……….…..………60 1.7.2.8 Relationship between Cortisol Concentration/Secretion and Age-‐ Associated Chronic Disease…………………………..………………………………60 1.7.2.9 Circulating Cortisol, Cognitive Decline and Dementia………..……………61 1.7.2.10 Circulating Cortisol and Osteoporosis……………………………………..….....62 1.7.2.11 Circulating Cortisol and the Metabolic Syndrome………………….……….63 1.7.2.12 Ageing and DHEA…………………………………………………………………..……..63 1.7.2.13 Summary of Ageing and the HPA Axis…………………………………..….........65 1.7.3 11β-‐HSD and Ageing…………………………………………………………………...………65 1.7.3.1 Ageing, 11β-‐HSD1 and the Brain………………………………………...…………66 1.7.3.2 Ageing, 11β-‐HSD1 and Bone………………………………………………………….66 1.7.3.3 Ageing, 11β-‐HSD1 and Skin.………………………………………………………….67 1.7.3.4 Ageing, 11β-‐HSD1 and Fat…………………………………………….………………68 1.7.3.5 Ageing 11β-‐HSD2 and the Kidney………………………………………………….68 viii 1.7.3.6 Ageing, 11β-‐HSD1 and Skeletal Muscle…………………………...……………..69 1.8 Sarcopenia.………………………………………………….………………………...………….69 1.8.1 Prevalence of Sarcopenia…………………………………………………………………….70 1.8.2 Association of Sarcopenia with Functional Impairment……………………......73 1.8.3 Association of Sarcopenia with Chronic Disease…………………………..………74 1.8.4 Association of Sarcopenia with Mortality…………………………………...……......74 1.8.5 Sarcopenia vs. Dynapenia…………………………………………………………………....75 1.8.6 Sarcopenic Obesity……………………………………………………………………..………76 1.8.7 Consensus Statements for Sarcopenia Diagnosis……………………...…………..77 1.8.8 Potential Mechanisms of Skeletal Muscle Ageing……………………...…………..78 1.8.8.1 Ageing and Muscle Protein Turnover…………………………………...………..79 1.8.8.2 Skeletal Muscle Ageing and Chronic Inflammation………………………....79 1.8.8.3 Skeletal Muscle Ageing and Oxidative Stress………………………………….81 1.8.8.4 Skeletal Muscle Ageing and Satellite Cells…………………………...………....82 1.8.8.5 Skeletal Muscle Ageing and Denervation………………………………...……..82 1.8.8.6 Skeletal Muscle Ageing and Gene Expression Array Studies…………....83 1.8.9 Potential Therapies for Sarcopenia………………………………………..…….……....86 1.8.9.1 Exercise Interventions in Sarcopenia……………………………………...……..86 1.8.9.2 Future Perspectives for Sarcopenia Therapy………………………………….87 1.9 Summary…………………………………………………….…………………………………….87 1.10 Hypotheses…………………………………………………….……………………………...….88 1.11 Thesis Aims………………………………………………….…………………………………...89 Chapter 2 – General Methods………………………………………………………….......90 2.1 C2C12 Cell Culture……………………………………………….…………………………...91 ix 2.1.1 C2C12 Cell Line………………………………………………….…………………………......91 2.1.2 Proliferation………………………………………………….…………………………………91 2.1.3 Differentiation………………………………………………….………………………………92 2.1.4 Freezing down of cells………………………………………………….…………………...92 2.2 RNA Extraction………………………………………………………………………………...92 2.2.1 Principles……………………………………………….………………………………………...92 2.2.2 Method……………………………………………….……………………………………………93 2.3 Reverse Transcription (RT) Reaction…………………………………………….94 2.3.1 Method………………………………………………….…………………………………………94 2.4 Conventional Polymerase Chain Reaction (PCR) ……………………….......95 2.4.1 Method……………………………………………….…………………………………………....95 2.5 Relative Quantitative (Real-‐time) PCR…………………………………………....95 2.5.1 Method………………………………………………….………………………………….…......95 2.6 Microfluidic Gene Expression Analysis……………………………………...……96 2.6.1 Method……………………………………………….…………………………………..…….....97 2.7 Statistical Analysis……….………………………………………………...……………….98 3 Chapter 3 – Long-‐term Outcomes in Patients with Cushing’s Disease treated with Transsphenoidal Surgery…………….………………99 3.1 Introduction……………………………………………….…………………….……………100 3.2 Hypothesis……………………………………………….………………………..…………...101 3.3 Study Aims……………………………………………….…………………………..………...101 3.4 Subjects and Methods……………………………………………….………….………...102 3.4.1 Subjects and Data Collection……………………………………………….….……….102 3.4.2 Diagnostic Criteria……………………………………………….…………………..……..103 3.4.3 Baseline Clinical Features ……………………………………………….………..……104 x 3.4.4 Surgical Approach……………………………………………….……………………..…...105 3.4.5 Biochemical Outcomes: Definitions…………………………………………….…...105 3.4.6 Statistical Analysis of Mortality………………………………………………….……105 3.4.7 Ethical Opinion……………………………………………….………………………….…..106 3.5 Results……………………………………………….……………………………………….…..106 3.5.1 Treatment Outcome following Transsphenoidal Surgery…………............106 3.5.2 Resolution of Clinical Features following Transsphenoidal Surgery…..107 3.5.2.1 Hypertension…………………………………………….…………………………….…107 3.5.2.2 Body Mass Index (BMI) ……………………………………………….……….…….107 3.5.3 General Post-‐Operative Complications……………………………………….……108 3.5.4 Endocrine Complications…………………………………………….……………..……108 3.5.5 Mortality Following Transsphenoidal Surgery………………………..………..109 3.5.6 Prognostic Indicators…………………………………………….………………..………110 3.6 Discussion…………………………………………….…………………………………..…….110 Chapter 4 – Characterisation of the Effects of Pre-‐Receptor Glucocorticoid Regulation on Muscle Atrophy Gene Expression in Skeletal Myotubes…………………………………………….……………………….…….119 4.1 Introduction…………………………………………….……………………………….…….120 4.2 Hypothesis…………………………………………….…………………………….………….122 4.3 Research Strategy and Aims………………………………………………...…………122 4.4 Methods……………………………………………….……………………………….………...123 4.4.1 C2C12 Cell Culture……………………………………………….………………..………..123 4.4.2 Cell Culture Treatments…………………………………………….…………….……...124 4.4.2.1 Dexamethasone…………………………………………….……………………..……..124 xi 4.4.2.2 Murine Glucocorticoids…………………………………………….………….……..124 4.4.2.3 RU486 (Mifepristone)(GR Antagonist) ………………………..………………124 4.4.2.4 LJ2(PF-‐877423)(Selective 11β-‐HSD1 Inhibitor)…………….……............125 4.4.3 RNA Extraction and RT-‐PCR……………………………………………...…………….125 4.4.4 Relative Quantitative (Real-‐time) PCR………………………………..……………125 4.5 Results…………………………………………….………………………………….…………..126 4.5.1 Expression of genes involved in muscle atrophy following treatment with active synthetic GC (dexamethasone) and a GR antagonist (RU486) ……………………………………………….……………..………..126 4.5.2 The impact of treatment with inactive murine GC (11-‐DHC) and a selective 11β-‐HSD1 inhibitor (LJ2) on muscle atrophy gene expression………………………………..……….127 4.5.3 The impact of GC treatment, GR blockade and selective 11β-‐HSD1 inhibition on HSD11B1 gene expression…………………..……...128 4.5.4 Dose and time course relationships between active GC treatments (CORT) and HSD11B1 and MAFbx/Atrogin1 gene expression……………………………………………….………………………..……129 4.5.5 The impact of TNF-‐α and synthetic GC (DEX) treatments on HSD11B1 and muscle atrophy gene expression…….…...130 4.5.6 Impact of insulin and DEX treatment on HSD11B1 and muscle atrophy gene expression…………………………………………..…...132 4.6. Discussion…………………………………………….……………………………………..….133 Chapter 5 – The Impact of Global 11β-‐HSD1 knock out on Muscle Phenotype and Gene Expression in Aged and Glucocorticoid Treated Mice…………………………………………………………………………………..……...137 5.1 Introduction…………………………………………….……………………………….…….138 5.2 Hypotheses………………………………………………………………………………..……139 5.3 Research Strategy and Aims…………………………………………….………..……139 xii 5.4 Materials and Methods…………………………………………….…………………..…140 5.4.1 Animal Protocols…………………………………………….………………………….…140 5.4.2 5.5 Urine Steroid Analysis by Gas Chromatography /Mass Spectrometry…………………………………………….……………….………142 Results……………………………………………….…………………………………….……..143 5.5.1 In-‐Vivo Studies of Ageing in Wildtype & 11β-‐HSD1 Knockout Mice…...143 5.5.1.1 Urinary GC/MS characterisation of corticosteroid metabolites across age in 11β-‐HSD1 KO and WT mice…………………..………….…….143 5.5.1.2 Characterisation of serum CORT and adrenal gland weights across age in 11β-‐HSD1 KO and WT mice……………………....144 5.5.1.3 Skeletal muscle gene expression array analysis of WT and 11β-‐HSD1 KO mice across age……………………..……………….………144 5.5.1.4 The impact of global 11β-‐HSD1 KO on muscle phenotype (grip strength and muscle tissue weights) across age…………….…….148 5.5.2 Treatment of C57BL/6 WT and 11β-‐HSD1 KO mice with supraphysiological doses of GC……………………………….…..…...150 5.5.2.1 Characterisation of serum GC levels and adrenal gland weights…....150 5.5.2.2 Skeletal muscle mRNA expression of atrophy genes in GC-‐ treated mice……………………………………….……………………………..............151 5.5.2.3 Impact of 11β-‐HSD1 KO on muscle phenotype (grip strength and muscle weights) of GC-‐treated mice…………………..………………….154 5.6. Discussion…………………………………………….……………………………………..….156 Chapter 6 – Global Activity and Local Skeletal Muscle Expression of 11β-‐HSD1 Across Human Ageing……………………………………….………..163 6.1 Introduction…………………………………………….…………………………….……….164 6.2 Hypotheses…………………………………………….……………………………….………169 6.3 Research Strategy and Aims ……………………………………………….….……...169 6.4 Methods……………………………………………………………………………………..…...170 xiii 6.4.1 Human Study Protocol………………………………………...….……………………..….170 6.4.1.1 Initial Observations…………………………………………….…………………........171 6.4.1.2 24-‐hour Urine Collection…………………………………………….…….…………171 6.4.1.3 Urine Steroid Profiling by Gas Chromatography /Mass Spectrometry…………………………………………….……………..……….171 6.4.1.4 Dual-‐Energy X-‐Ray Absorptiometry (DEXA) Scan…………………..……..173 6.4.1.5 Strength Testing…………………………………………….……………………..……..173 6.4.1.6 Fasting Bloods…………………………………………….…………………………..…..174 6.4.1.7 Vastus Lateralis Muscle Biopsy……………………………………………..……..175 6.4.1.8 Microfluidic Gene Expression Array………………………………………..……176 6.4.1.9 Ethical Approval…………………………………………….………………….………..176 6.5 Results…………………………………………….…………………………………….………..177 6.5.1 Subject Characteristics…………………………………………….…………….………...177 6.5.2 Baseline Observations Across Human Ageing Cohort………………..…….....177 6.5.3 Serum Biochemistry Across Human Ageing Cohort…………………….……..179 6.5.4 Body Composition Analysis Across Human Ageing in Female Subjects.. ………………………….………………….…………………………………….…….184 6.5.5 Body Composition Analysis Across Human Ageing in Male Subjects…….…………………………………………….………………………………….……186 6.5.6 Strength Testing Parameters Across Human Ageing in Female Subjects.. ……………………………………………….……………………………………..….188 6.5.7 Strength Testing Parameters Across Human Ageing in Male Subjects………………………………………………….…………………………………….….189 6.5.8 Steroid Metabolite Excretion Across Human Ageing in Female Subjects.. ……………………………………………….……………………………………..….192 6.5.9 Steroid Metabolite Excretion Across Human Ageing in Male Subjects…….…………………………………………….……………………………….………193 6.5.10 Skeletal Muscle Gene Expression Across Human Ageing in Female Subjects…………………………………………….………………………….…….194 xiv 6.5.11 Skeletal Muscle Gene Expression Across Human Ageing in Male Subjects. ……………………………………………….……………………………………..…..197 6.5.12 Correlations between Strength Testing/Body Composition Parameters and Gene Expression in Skeletal Muscle of Female Subjects.. ………………………………………………………………………………...……….199 6.5.13 Correlations between Strength Testing/Body Composition Parameters and Gene Expression in Skeletal Muscle of Male Subjects…………………………………………….…………………………………….……….200 6.5.14 Correlations for Skeletal Muscle 11β-‐HSD1 Expression and Urinary Steroid Markers of GC Metabolism vs. Anthropometric, Body Composition, Strength Testing and Serum Biochemistry Data in Female Subjects…….…………………………………………….………………..………201 6.5.15 Correlations for Skeletal Muscle 11β-‐HSD1 Expression and Urinary Steroid Markers of GC Metabolism vs. Anthropometric, Body Composition, Strength Testing and Serum Biochemistry Data in Male Subjects…………………………………………….………………………….……...203 6.5.16 Correlations between Fat Mass and Total F Metabolites in Women and Men…………………………………………….………………………………………..……205 6.5.17 Correlation between Strength and 11β-‐HSD1 Gene Expression in Skeletal Muscle…………………………………………….……………………………….….206 6.5.18 Correlations between Serum Gonadotrophin Levels and Skeletal Muscle 11β-‐HSD1 Gene Expression………………………………………………..….206 6.5.19 Comparisons of Patient Characteristics, Serum Biochemistry, Skeletal Muscle Gene Expression and Urinary Steroid Metabolites between Pre-‐ and Post-‐Menopausal Women……………………………………...207 6.5.20 Skeletal Muscle Gene Expression According to Menopausal Status.......209 6.5.21 Comparisons of Patient Characteristics, Skeletal Muscle Gene Expression and Urine Steroid Metabolites between Genders……………...209 6.5.22 Comparisons of Patient Characteristics, Skeletal Muscle Gene Expression and Urine Steroid Metabolites According to Total Fat Mass Levels in Female Subjects…………………………………………………...210 6.5.23 Comparisons of Patient Characteristics, Skeletal Muscle Gene Expression and Urine Steroid Metabolites According to Total Fat Mass Levels in Male Subjects…………………………………………….……..…..211 6.6. Discussion…………………………………………….………………………………..……….213 xv Chapter 7 – Final Conclusions and Future Directions…………..…….229 7.1. Final Conclusions…………………………………………….……………………….…….230 7.2. Future Directions…………………………………………….……………………….…….234 References.......................................................................................................................................238 Supplementary Data…………………………………………….……………………………….…..282 Publications and Conference Proceedings…………………………………………….…303 Paper Published in JCEM xvi List of Figures Chapter 1 Figure 1-‐1.……………………………………………………………………………………………………..4 Major Pathways of Steroidogenesis in Humans Figure 1-‐2.……………………………………………………………………………………………………..6 The Hypothalamic Pituitary Adrenal (HPA) axis Figure 1-‐3..............................................................................................................................................7 Activation of GR by Glucocorticoids (GCs) Figure 1-‐4.………………………………………………………………………………….........................11 The Renin-‐Angiotensin Axis and the Regulation of Adrenal Aldosterone Secretion Figure 1-‐5.…………………………………………………………………………………………….……..12 Metabolism of Cortisol Figure 1-‐6.…………………………………………………………………………………………………...17 Schematic diagram demonstrating pre-‐receptor GC-‐regulation by 11β-‐HSD1 Figure 1-‐7.………………………………………………………………………………………….………..24 Representations of HSD11B1 and H6PDH genes with mutations identified to date, associated with Cortisone Reductase Deficiency (CRD) and Apparent Cortisone Reductase Deficiency (ACRD) respectively Figure 1-‐8.……………………………………………………………………………………….…………..26 Summary of published mutations in HSD11B2 Figure 1-‐9.…………………………………………………………………………………………...………28 Skeletal muscle structure Figure 1-‐10.…………………………………………………………………………………………………31 Integrated Pathway of GC-‐Induced Myopathy Chapter 2 Figure 2-‐1..…………………………………………………………………………………….…………….98 Representative Amplification plot following Real-‐time PCR protocol on Biomark™ HD Reader Chapter 3 Figure 3-‐1.………………..………………………………………………………………………………..103 xvii Study Flowsheet and Treatment Outcome Groups Chapter 4 Figure 4-‐1…………………………………………………………………………………………………..123 Differentiation of C2C12 myoblasts Figure 4-‐2………………………………………………………………………………………………….127 mRNA expression of muscle atrophy genes in C2C12s following treatment with DEX alone and in combination with the GR antagonist, RU486 Figure 4-‐3………………………………………………………………………………………………….128 mRNA expression of genes involved in muscle atrophy in C2C12s following treatment with 11-‐DHC (A) alone or in combination with the selective inhibitor of 11β-‐HSD1, LJ2 (100nm) Figure 4-‐4…………………………………………………………………………….……………………128 mRNA expression of HSD11B1 in C2C12s following treatment with 11-‐DHC (A) alone or in combination with the selective inhibitor of 11β-‐HSD1, LJ2 (100nm) Figure 4-‐5…………………………………………………………………………………………………129 Time Course CORT (B, 250nm): mRNA expression of HSD11B1 and MAFbx/Atrogin1 in C2C12s Figure 4-‐6…………………………………………………………………………………………………130 Dose Response CORT in C2C12s Figure 4-‐7………………………………………………………………………………………………….131 mRNA expression of HSD11B1 and Glutamine Synthetase following DEX and TNF-‐α treatments in C2C12s Chapter 5 Figure 5-‐1……………………………………………………………………………………………….…143 Urinary steroid analysis confirmed increased % of corticosteroids as metabolites of A in both young and old 11β-‐HSD1 KO C57BL/6 mice compared to age-‐matched WT controls Figure 5-‐2………………………………………………………………………….………………………144 Serum morning CORTs and adrenal tissue weights in WT and 11β-‐HSD1 with age. xviii Figure 5-‐3.........................................................................................................................................147 Skeletal muscle gene expression of MuRF1, Myostatin, and GADD45a with age in WT and 11β-‐HSD1 KO mice. Figure 5-‐4…………………………………………………………………………….……………………148 Skeletal muscle gene expression of PSMD11, eif4bp, CHARNB and NCAM1 with age in WT mice. Figure 5.5………………………………………………………………………………………………….149 Grip Strength in Young and Old WT and 11β-‐HSD1 KO C57BL/6 mice. Figure 5-‐6…………………………………………………………………………………………………149 Tissue weights of Quadriceps Tibialis anterior in young and old, WT and 11β-‐HSD1 KO mice. Figure 5-‐7…………………………………………………………………………………………………150 Serum CORT, and left adrenal weights in WT and 11β-‐HSD1 KO mice treated with CORT, 11DHC or vehicle via drinking water for 5 weeks. Figure 5-‐8………………………………………………………………………………………………….152 GC treatment resulted in upregulation of genes involved in muscle atrophy including MuRF1, MAFbx/Atrogin-‐1, myostatin and FOXO1, and these changes were attenuated in 11DHC treated 11β-‐HSD1 KO mice. Figure 5-‐9………………………………………………………………………………………………….153 Impact of GC-‐treatment on expression of age-‐regulated genes in skeletal muscle. Figure 5-‐10………………………………………………………………………………………………..155 Grip-‐strength was reduced in CORT and 11DHC treated WT C57BL/6 mice, whereas 11β-‐HSD1 KOs were protected from these effects Figure 5-‐11………………………………………………………………………………………………..155 Quadriceps and tibialis anterior muscle bed weights were reduced in CORT and 11DHC treated WT mice, whereas 11β-‐HSD1 KO mice were protected from these effects Chapter 6 Figure 6-‐1…………………………………………………………………………………………………181 Serum hormone levels for female ageing study participants xix Figure 6-‐2…………………………………………………………………………………………………183 Serum hormone levels for male ageing study participants Figure 6-‐3…………………………………………………………………………………………………185 DEXA body composition analysis in female ageing study participants Figure 6-‐4…………………………………………………………………………………………………187 DEXA body composition analysis in male ageing study participants Figure 6-‐5…………………………………………………………………………………………………189 Strength testing by jump-‐plate mechanography in female ageing study participants Figure 6-‐6…………………………………………………………………………………………………191 Strength testing by jump-‐plate mechanography in male ageing study participants Figure 6-‐7…………………………………………………………………………………………………196 Human skeletal muscle (vastus lateralis biopsy) gene expression in female subjects aged under 50 years vs. those aged >50, as analysed by microfluidic array Figure 6-‐8………………………………………………………………………………………………….198 Human skeletal muscle (vastus lateralis biopsy) gene expression in male subjects aged under 50 years vs. those aged >50, as analysed by microfluidic array Figure 6-‐9………………………………………………………………………………………………….205 Correlations between body fat determined by DEXA scan and urinary total F metabolites as measured by GC/MS Figure 6-‐10………………………………………………………………………………………………..206 Correlation between grip strength and skeletal muscle HSD11B1 mRNA expression in women Figure 6-‐11………………………………………………………………………………………………..207 Correlations between serum gonadotrophin levels and skeletal muscle HSD11B1 mRNA expression Figure 6-‐12………………………………………………………………………………………………..209 Skeletal Muscle HSD11B1 gene (mRNA) expression by menopausal status xx Supplementary Figures: Supplementary Figure S5.1……………………………………………………………………….300 Response to glucose tolerance test (GTT) and area under the curve (AUC) in C57BL/6 mice Supplementary Figure S5.2……………………………………………………………………….301 Fasting insulins, glucose tolerance, and area under the curve for C57BL/6 WT and 11β-‐HSD1 KO mice treated with CORT, 11DHC, or vehicle via drinking water for 5 weeks Supplementary figure S6.1………………………………………………………………………..302 Correlations between serum androgen levels and markers of global 11β-‐HSD1 activity as measured by urine GC/MS analysis in men List of Tables Chapter 1 Table 1-‐1……………………………………………………………………………………………………….8 Some of the Diverse Actions of GCs on Numerous Organs and Systems Table 1-‐2……………………………………………………………………………………………………..15 Clinical Features of Cushing’s Syndrome Table 1-‐3……………………………………………………………………………………………………..29 Characteristics of Major Skeletal Muscle Fibre Types Table 1-‐4……………………………………………………………………………………………………..44 Summary of the Effects of Glucocorticoids on Targets involved in Muscle Atrophy Table 1-‐5……………………………………………………………………………………………………..55 Summary of Changes in Measured Parameters of the HPA-‐axis Table 1-‐6……………………………………………………………………………………………………..72 Summary of Studies Examining Prevalence of Sarcopenia in Community-‐Dwelling Individuals Table 1-‐7……………………………………………………………………………………………………..78 Putative Mechanisms of Skeletal Muscle Ageing xxi Chapter 2 Table 2-‐1……………………………………………………………………………………………………..94 Reverse Transcriptase Reaction Volumes Table 2-‐2……………………………………………………………………………………………………..95 Conventional PCR Reaction Volumes Table 2-‐3………………………………………………………………………………..……………………96 Real-‐Time PCR Reaction Volumes Chapter 3 Table 3-‐1...........................................................................................................................................104 Diagnostic Tests and Proportion of Cases with Positive Results Table 3-‐2………………………………………………………………………..………………………….108 Resolution of Body Mass Index and Blood Pressure following Transsphenoidal Surgery (TSS) Table 3-‐3………………………………………………………………………..………………………….109 Pituitary function and ACTH status at final follow Up according to Cushing’s outcome group Table 3-‐4…………………………………………………………………………………..……………….110 Mortality by Cushing’s Disease Outcome Group Table 3-‐5……………………………………………………………………..…………………………….115 Comparison of Studies Examining Remission Rates and Mortality for Cushing’s Disease Patients Post-‐ -‐Transsphenoidal Surgery (TSS) Chapter 4 Table 4-‐1……………………………………………………………………………………………………131 mRNA expression of genes involved in muscle metabolism, atrophy and differentiation measured using Real-‐time PCR, following treatment with DEX, TNF-‐α alone and in combination Table 4-‐2……………………………………………………………………………………………………132 mRNA expression of genes involved in muscle atrophy and differentiation measured using Real-‐time PCR, following treatment with DEX and Insulin alone and in combination xxii Chapter 5 Table 5.1i…………………………………………………………………………………………………..145 Skeletal muscle gene expression profile in young and old WT and 11β-‐HSD1 KO mice Table 5.1ii………………………………………………………………………………………..………..146 Skeletal muscle gene expression profile in young and old WT and 11β-‐HSD1 KO mice Table 5-‐2………………………………………………………………………………………….………..154 Expression of genes regulated by age or 11β-‐HSD1 in skeletal muscle assessed by Real-‐time PCR in GC-‐treated mouse study samples Chapter 6 Table 6-‐1...........................................................................................................................................178 Observational data from female ageing study participants Table 6-‐2………………………………………………………………………………….………………..178 Observational data from male ageing study participants Table 6-‐3……………………………………………………………………………………..…………….180 Serum biochemistry results for female ageing study subjects Table 6-‐4...........................................................................................................................................182 Serum biochemistry results for male ageing study subjects Table 6-‐5………………………………………………………………………………………..………….184 DEXA body composition analysis from female subjects in ageing study Table 6-‐6…………………………………………………………………………………….……………..186 DEXA body composition analysis from male subjects in ageing study Table 6-‐7……………………………………………………………………..…………………………….188 Strength testing by grip strength dynamometry and jump-‐plate mechanography in female ageing study subjects xxiii Table 6-‐8…………………………………………………………………………………………….……..190 Strength testing by grip strength dynamometry and jump-‐plate mechanography in male ageing study subjects Table 6-‐9……………………………………………………………………………………………..…….193 Urine steroid analysis of GC-‐metabolism markers by GC/MS in female ageing study subjects Table 6-‐10…………………………………………………………………………………......…………..194 Urine steroid analysis GC-‐metabolism markers by GC/MS in male ageing study subjects Table 6-‐11…………………………………………………………………………………………………195 Human skeletal muscle (vastus lateralis biopsy) gene expression in female subjects aged <50 years vs. those aged >50, as analysed by microfluidic array Table 6-‐12……………………………………………………………………………………………..…..197 Human skeletal muscle (vastus lateralis biopsy) gene expression in male subjects aged <50 years vs. those aged >50, analysed by microfluidic array Table 6-‐13…………………………………………………………………………………..……………..199 Bivariate analyses of strength testing and DEXA body composition parameters vs. skeletal muscle gene expression in female ageing study subjects Table 6-‐14…………………………………………………………………………..……………………..200 Bivariate analyses of strength testing and DEXA body composition parameters vs. skeletal muscle gene expression in male ageing study subjects Table 6-‐15…………………………………………………………………………………………………202 Bivariate correlations for skeletal muscle 11β-‐HSD1 expression, urinary steroid analysis markers (GC/MS) vs. anthropometric variables, body composition (DEXA), strength testing, jumping mechanography (Leonardo Ground Force Plate), serum biochemistry and mRNA expression data (microfluidic array) in female ageing study participants Table 6-‐16……………………………………………………………………………………..…………..204 Bivariate correlations for skeletal muscle 11β-‐HSD1 expression, urinary steroid analysis markers (GC/MS) vs. anthropometric variables, body composition (DEXA), strength testing, jumping mechanography (Leonardo xxiv Ground Force Plate), serum biochemistry and mRNA expression data (microfluidic array) in male ageing study subjects Table 6-‐17………………………………………………………………………….………...……………208 Subject characteristics according to menopausal status (as determined by absence of menstrual periods and serum FSH levels >25IU/L) Table 6-‐18………………………………………………………………………………..………………..210 Sexual dimorphism of subject characteristics including general demographics, anthropometry, body composition, skeletal muscle gene expression and urine steroid GC/MS data Table 6-‐19…………………………………………………………………………………………………211 Subject characteristics in female ageing study subjects as divided into 2 groups depending on total fat mass Table 6-‐20………………………………………………………………………………..………………..212 Subject characteristics in male ageing study subjects as divided into 2 groups depending on total fat mass Supplementary Tables: Supplementary table S6.1.......................................................................................................283 Ethnicities of female ageing study subjects by age group Supplementary table S6.2…………………………………………………………..……………..283 Ethnicities of male ageing study subjects by age group Supplementary table S6.3.......................................................................................................284 Subject characteristics in age-‐matched female study subjects as divided by ethnicity (South Asian vs. Caucasian) Supplementary table S6.4…………………………………………………………..……………..285 Subject characteristics in age-‐matched male study subjects as divided by ethnicity (Asian vs. Caucasian) Supplementary Table S6.5…………………………………………………..……………………286 Urine Steroid Analysis by GC/MS in female ageing study subjects Supplementary Table S6.6.....................................................................................................287 xxv Urine Steroid Ratios as analysed by GC/MS for female ageing study subjects Supplementary Table S6.7……………………………………………………………..…………288 Urine Steroid Analysis by GC/MS in male ageing study subjects Supplementary Table S6.8………………………………………………………………………..289 Urine Steroid Ratios as analysed by GC/MS for male ageing study subjects Supplementary table S6.9 (part I of III)……………………………..……………………..290 Human skeletal muscle (vastus lateralis biopsy) gene expression in female subjects aged <50 vs. those >50 years, as analysed by microfluidic array Supplementary table S6.9 (part II of III)…………………………………………..………291 Human skeletal muscle (vastus lateralis biopsy) gene expression in female subjects aged <50 vs. those >50 years, as analysed by microfluidic array Supplementary table S6.9 (part III of III)……………………………………………….…292 Human skeletal muscle (vastus lateralis biopsy) gene expression in female subjects aged <50 vs. those >50 years, as analysed by microfluidic array Supplementary table S6.10 (part I of III)………………………………………………….293 Human skeletal muscle (vastus lateralis biopsy) gene expression in male subjects aged <50 vs. those >50 years, as analysed by microfluidic array Supplementary table S6.10 (part II of III)………………………………………………...294 Human skeletal muscle (vastus lateralis biopsy) gene expression in male subjects aged <50 vs. those >50 years, as analysed by microfluidic array Supplementary table S6.10 (part III of III)………………………………………….……295 Human skeletal muscle (vastus lateralis biopsy) gene expression in male subjects aged <50 vs. those >50 years, as analysed by microfluidic array Supplementary table S6.11……………………………………………………………………….296 Subject characteristics in female ageing study subjects as divided into 2 groups depending on maximum grip strength Supplementary table S6.12…………………………………………………………….…………297 Subject characteristics in male ageing study subjects as divided into 2 groups depending xxvi on maximum grip strength Supplementary table S6.13………………………………………………………….……………298 Subject characteristics in female ageing study subjects as divided into 2 groups depending on BMI Supplementary table S6.14……………………………………………………………………….299 Subject characteristics in male ageing study subjects as divided into 2 groups depending on BMI xxvii Abbreviations 4EBP1 Eukaryotic translation initiation factor 4E binding protein 1 11β-‐HSD1 11 beta-‐hydroxysteroid dehydrogenase type 1 11β-‐HSD2 11-‐beta-‐hydroxysteroid dehydrogenase type 2 11-‐DHC 11-‐dehydrocorticosterone 11-‐dehydrocorticosterone ACACA Acetyl-‐CoA Carboxylase ACE Angiotensin Converting Enzyme ACh Acetyl ACOX1 Acyl-‐CoA Oxidase 1 ACRD Apparent Cortisone Reductase Deficiency ACTH Adrenocorticotrophic hormone ACVR2B Activin A Receptor Type IIB AME V-‐AKT Murine Thymoma Viral Oncogene Homlog 1 (Alias PKB) Apparent Mineralocorticoid Excess AMPK 5’ Adenosine Monophosphate-‐Activated Protein Kinase ANOVA One-‐Way Analysis of Variance AP-‐1 Activated Protein-‐1 ApoE Apolipoprotein E AR Androgen Receptor ATP Adenosine Triphosphate ATF-‐4 Activating Transcription Factor 4 AU Arbitrary Units A AKT xxviii AUC Area Under Curve AVP Arginine Vasopressin Corticosterone BMC Bone Mineral Content BMD Bone Mineral Density BMI Body Mass Index BP Blood Pressure BSA Bovine Serum Albumin CBG Cortisol Binding Globulin CD Cushing’s Disease CD36 Cluster of Differentiation 36 CDKN1A Cyclin-‐Dependent Kinase Inhibitor 1A C/EBP CCAAT-‐Enhancer-‐Binding Proteins CHRNA1 Cholinergic Receptor Nicotinic Alpha 1 CHRNB Cholinergic Receptor Nicotinic Beta CORT Cortisol CPAP Continuous Positive Airways Pressure CPM Counts Per Minute CRD Cortisone Reductase Deficiency CRH Corticotropin-‐Releasing Hormone CRP C-‐Reactive Protein CRYAB Crystallin Alpha B CSF Cerebrospinal Fluid B xxix Ct Cycle Threshold CYCS Cytochrome C, Somatic DBP Diastolic Blood Pressure DDIT DNA-‐Damage-‐Inducible Transcript DEX Dexamethasone DEXA Dual-‐Energy X-‐Ray Absorptiometry DHEA Dehydroepiandrosterone DHEAS Dehydroepiandrosterone Sulphate DMEM Dulbecco’s Modified Eagle Medium dNTP Deoxyribonucleotide Triphosphate DOC Deoxycorticosterone E Cortisone ECG Electrocardiogram eiF2b1 Eukaryotic Translation Initiation Factor 2B, subunit 1 alpha eiF4e Eukaryotic Translation Initiation Factor 4E eiF4bp Eukaryotic Translation Initiation Factor 4B eiF6 Eukaryotic Translation Initiation Factor 6 EMG Electromyelography ENaC Epithelial Sodium Channel ER Endoplasmic Reticulum Cortisol FOXOs Forkhead Box Transcription Factors F xxx FCS Foetal Calf Serum Fmax Maximum Force FSH Follicle Stimulating Hormone FRET Fluorescence Resonance Energy Transfer G-‐6-‐P Glucose-‐6-‐Phosphate GADD45a Growth Arrest and DNA-‐Damage-‐Inducible Alpha GC Glucocorticoid GC/MS Gas Chromatography Mass Spectrometry GCs Glucocorticoids GH Growth Hormone GHR Growth Hormone Receptor GHRH Growth-‐Hormone-‐Releasing-‐Hormone GLUL Glutamate-‐Ammonia Ligase Glut Synth Glutamate Synthetase GR Glucocorticoid Receptor GRE Glucocorticoid Responsive Elements GSK-‐3β Glycogen Synthase Kinase-‐3beta GTT Glucose Tolerance Test H6PDH Hexose-‐6-‐phosphate dehydrogenase HDAC Histone Deacetylase HDDST High Dose Dexamethasone Suppression Test HDL-‐C High Density Lipoprotein Cholesterol HIF-‐1a Hypoxia Inducible Factor 1 xxxi HOMA-‐IR Homeostatic Model Assessment Insulin Resistance HPA Hypothalamic-‐Pituitary-‐Adrenal HRP Horseradish Peroxidase HSD11B1 Gene Name: Hydroxysteroid (11-‐Beta) Dehydrogenase 1 HSD11B2 Gene Name: Hydroxysteroid (11-‐Beta) Dehydrogenase 2 HSL Hormone-‐Sensitive Lipase HSP Heat Shock Protein Integrated Fluidic Circuit IGF-‐I Insulin-‐like Growth Factor-‐I IL-‐1β Interleukin-‐1-‐beta IL-‐6 Interleukin-‐6 INSR Insulin-‐Receptor IPSS Inferior Petrosal Sinus Sampling IRS-‐1 Insulin Receptor Substrate 1 IRS-‐2 Insulin Receptor Substrate 2 LDL-‐C Low density lipoprotein cholesterol LFTs Liver Function Tests LH Luteinising Hormone LJ2 Selective 11β-‐HSD1 inhibitor (Pfizer, CA, USA) LPL Lipoprotein Lipase LVH Left Ventricular Hypertrophy IFC MAFbx/Atrogin1 Muscle Atrophy F-‐box Protein (F-‐Box Protein 32) xxxii MAPK Mitogen-‐Activated Protein Kinase MHC Myosin Heavy Chain miRNA Micro-‐RNA MIPEP Mitochondrial Intermediate Peptidase MMI Muscle Mass Index MR Mineralocorticoid Receptor MRI Magnetic Resonance Imaging mRNA Messenger Ribonucleic Acid MSTN Myostatin mTOR Mechanistic Target of Rapamycin MuRF1 Muscle-‐Specific RING Finger Protein 1 (TRIM63) MYCL1 V-‐Myc Avian Myelocytomatosis Viral Oncogene Lung Carcinoma Derived Homolog MYH1 Myosin Heavy Chain 1 (IIx/D) MYH2 Myosin Heavy Chain 2 (IIa) MYH4 Myosin Heavy Chain 4 (IIb) MyoD Myogenic Differentiation 1 NAD Nicotinamide Adenine Dinucleotide NADP Nicotinamide Adenine Dinucleotide Phosphate NCAM Neural Cell Adhesion Molecule NF-‐κB Nuclear Factor Kappa B NHS National Health Service xxxiii P300 E1A Binding Protein PCR Polymerase Chain Reaction PDK4 Pyruvate Dehydrogenase Kinase Isozyme 4 PER2 Period Circadian Clock 2 PI3K Phosphoinositide-‐3-‐Kinase PKB Protein Kinase B (AKT) Pmax Maximum Power POMC Pro-‐opiomelanocortin PPAR Peroxisome Proliferator-‐Activated Receptor PPIB Peptidylpropyl Isomerase B (cyclophilin B) PPP3R2 Protein Phosphatase 3, Regulatory Subunit B PRT Progressive Resistance Training PSMA Proteasome Subunit Alpha PSMC Proteasome 26S Subunit ATPase PSMD Proteasome 26S Subunit non-‐ATPase PVDF Polyvinylidene Diflorise QUAD Quadriceps Muscle qPCR Quantitative Polymerase Chain Reaction REDD1 Regulated in DNA Damage and Development RelA V-‐Rel Reticuloendotheliosis Viral Oncogene Homolog A RNA Ribonucleic Acid RT Reverse Transcriptase RTPCR Reverse Transcriptase Polymerase Chain Reaction xxxiv RU486 Roussel-‐Uclaf 38486th compound (Mifeprisone) RXRB Retinoid X Receptor-‐beta S2LJ Standing-‐2-‐Legged-‐Jump S6K1 Ribosomal Protein S6 Kinase 1 SBP Systolic Blood Pressure SDS-‐PAGE Sodium Dodecyl Sulphate Polyacrylamide Gel Electrophoresis SHBG Sex Hormone Binding Globulin SIRT Sirtuin SLC2A4 Solute Carrier Family 2, Member 4 (GLUT4) SMI Skeletal Mass Index SMR Standardized Mortality Ratio SOD1 Superoxide Dismutase 1 SREBF1 Sterol Regulatory Element Binding Transcription Factor 1 StAR Steroidogenic Acute Regulatory Protein TGFB1 Transforming Growth Factor, Beta 1 THA Tetrahydrodehydocorticosterone THB Tetrahydrocorticosterone THE Tetrahydrocortisone THF Tetrahydrocortisol TNF-‐α Tumour Necrosis Factor-‐Alpha TRIM54 Tripartite Motif Containing 54 (MURF3) TRIM63 Tripartite Motif Containing 54 (MURF1) TSA Trichostatin A xxxv TSH Thyroid Stimulating Hormone U+Es Urea and Electrolytes UFC Urinary Free Cortisol UPS Ubiquitin-‐Proteasome System USP19 Ubiquitin Specific Peptidase 19 VEGF Vascular Endothelial Growth Factor VEH Vehicle Vmax Maximum Velocity Wildtype WT xxxvi Chapter 1 – General Introduction 1 1.1 Corticosteroid Secretion and Action 1.1.1. Adrenal Glands Bartholomeo Eustachius was the first to characterise adrenal gland anatomy in 1563. However it was almost 300 years before a Thomas Addison, at Guy’s Hospital, ascribed them a pathological role in the disease that was to take his name. He detailed a syndrome of “anaemia, general languor and debility, remarkable feebleness of the heart’s action, irritability of the stomach and a peculiar change in colour of the skin” in patients with disease of the “supra-‐renal capsules” (Addison, 1855, Pearce, 2004). Outlook for these patients was grim, with survival of most patients measured in months. Addison’s contemporary Brown-‐Sequard, confirmed that functioning adrenals were essential for life, by performing bilateral adrenalectomies in a range of species. Osler tried unsuccessfully to treat a young patient with adrenal insufficiency with orally administered adrenal extract (DeGroot and Jameson, 2006). In the late 1940s, whilst working at the Mayo Clinic, Kendall and Hench obtained a supply of “compound E” (cortisone) and found it to be an effective treatment for rheumatoid arthritis and other inflammatory arthritides (Hench, 1949, Kater et al., 2007). At Harvard, Thorn and Forsham were pioneers in using cortisone to treat Adrenal Insufficiency reporting dramatic improvements in mortality from 80% at 2 years to 50% at 7 years in their initial cohort (Thorn et al., 1949). Since Addison’s original description, the physiological roles of individual adrenal hormones in the stress response, carbohydrate metabolism, water and electrolyte balance have been elucidated along with their pathological effects in excess (Gathercole et al., 2013). Anatomically the two adrenals are pyramidal structures with dimensions of up to 3.0 x 6.0 x 1.0cm, each is surrounded by an 2 outer capsule, and is located superiorly to the kidney. They are divided into the functionally distinct outer cortex, which produces corticosteroids and a sympathetically innervated inner medulla, which produces catecholamines (Wilson and Williams, 1998). The cortex is derived from the coelomic (body cavity) epithelium and begins to develop from the 6 week of gestation. The medulla is ectodermal in origin, with neural crest cells migrating to the centre of this coelomic tissue. During gestation, the cortex develops into 2 layers, the outer zona glomerulosa and the inner zona fasiculata, with a deeper third layer, the zona reticularis not appearing until the third year of life (Hubbard et al., 2009). In the mature adrenal these zones have distinct functional roles, the zona glomerulosa, fasiculata, and reticularis producing mineralocorticoids, glucocorticoids and androgens respectively (Arlt and Stewart, 2005). According to Wilson and Williams (1998), arterial blood supply is obtained from branches of the aorta, inferior phrenic, renal and occasionally intercostal arteries, and left internal spermatic or ovarian arteries. Venous return from the right and left adrenal veins usually flows to the inferior vena cava and left renal vein, respectively. 1.1.2. Steroidogenesis Cholesterol is the common precursor for all adrenal steroids, which have the cyclopentanoperhydrophenthanthrene structure (3 cyclohexane rings; 1 cyclopentane ring) (Arlt and Stewart, 2005). Diversity of function is obtained by chemical modifications to this common structure with attachment of hydroxyl, ketone or other groups. Cholesterol is derived from circulating low-‐density lipoprotein cholesterol (LDL-‐C) by a receptor-‐mediated pathway (DeGroot and Jameson, 2006). Hydrolysis of intracytoplasmic vesicles containing LDL-‐C occurs 3 leading to release of cholesterol. Steroidogenesis has been reviewed in depth by Arlt and Stewart (2005) and the main pathways are outlined in figure 1-‐1. The rate-‐limiting step of steroid biosynthesis takes place in all adrenal zones and involves transport of cholesterol to the internal mitochondrial membrane by steroidogenic acute regulatory protein (StAR). Figure 1-‐1: Major Pathways of Steroidogenesis in Humans. Steroids are listed in boxes; enzyme activities are outside boxes. Cholesterol is the common precursor for all downstream steroids including progestogens, mineralocorticoids, glucocorticoids, androgens and oestrogens. StAR initiates the rate-‐limiting step of corticosteroid biosynthesis. Figure represents pathways outlined by Arlt and Stewart (2005). Cytochrome P450scc is responsible for cleavage of cholesterol to generate pregnenolone (Arlt and Stewart, 2005). Zonal enzyme expression confers ability to generate steroid type, with P450c18 exclusively expressed in the zona glomerulosa, P450c17 17α-‐hydroxylase activity predominating in the zona fasiculata and 17,20-‐lyase in the zona reticularis, determined by concentration of cytochrome b5 (Arlt and Stewart, 2005), resulting in generation of 4 mineralocorticoids, glucocorticoids and adrenal androgens respectively. Pathway flux is regulated by the effects of hormones on the adrenal cortex, primarily angiotensin II, which stimulates aldosterone production and ACTH, which results in cortisol secretion. DHEA production is stimulated by ACTH, however there is also input from a range of other factors including prolactin, sex steroids, and cytokines (Glasow et al., 1996, Herrman et al., 2002, Lobo et al., 1982). 1.1.3. The Hypothalamic Pituitary Adrenal (HPA) Axis In humans cortisol is the principal GC. Its biosynthesis and secretion are regulated by the HPA-‐axis (as shown in Figure 1-‐2). The system is modified centrally by stress factors including trauma, hypoglycaemia, hypoxia and painful stimuli (DeGroot and Jameson, 2006). Activity is pulsatile and follows a circadian rhythm with early morning peaks and nocturnal nadirs, set by the hypothalamus. Corticotropin-‐releasing hormone (CRH) and arginine vasopressin (AVP) are secreted by the paraventricular nucleus into hypophyseal portal veins to stimulate adrenocorticotrophic hormone (ACTH) release by anterior pituitary corticotrophs. CRH acts via membrane bound receptors coupled to adenylate cyclase, whilst AVP is thought to exert its action via phosphoinositide-‐pathway-‐ mediated increases in sensitivity to CRH (DeGroot and Jameson, 2006). ACTH is produced in the anterior pituitary by post-‐translational processing of Pro-‐ opiomelanocortin (POMC), which is also the precursor of peptides including melanocyte-‐stimulating hormones and β-‐endorphin (Wilson and Williams, 1998). 5 Figure 1-‐2: The hypothalamic pituitary adrenal (HPA) axis. CRH = corticotropin releasing hormone, ACTH = adrenocorticotrophic hormone. ACTH promotes adrenal steroidogenesis, acting via the melanocortin-‐2 receptor activation of adenylate cyclase, with downstream effects on cholesterol conversion to pregnenolone and up-‐regulation of adrenal steroidogenic enzymes. Cortisol regulates its own secretion via negative feedback by acting through pituitary and hypothalamic GR receptors. MR is co-‐expressed in the hippocampus with GR and may also modulate this process (Jacobson, 2005). Pro-‐ inflammatory cytokines have direct stimulatory effects on HPA-‐axis function providing a link between inflammation and modulation of the endocrine stress response (DeGroot and Jameson, 2006). They stimulate CRH secretion from the hypothalamus, and have also been shown to have effects at the pituitary and adrenal (Spangelo et al., 1989, Salas et al., 1990). 6 1.1.4. Glucocorticoid Receptor (GR) The GR is a nuclear receptor, which is associated with two heat-‐shock-‐protein-‐90 (HSP90) molecules in the absence of GCs (Mendel et al, 1986). Ligand binding triggers a series of events including GR phosphorylation, release from bound proteins, translocation to the nucleus, with trans-‐activation and trans-‐repression of target genes via glucocorticoid responsive elements (GREs), as represented in figure 1-‐3 (DeGroot and Jameson, 2006). Figure 1-‐3: Activation of GR by Glucocorticoids (GCs). 1. In the absence of GC ligand, GR forms part of a multi-‐unit complex with 2 molecules of heat shock protein 90 (HSP90) and other proteins. 2. After binding GC this complex dissociates and GR is phosphorylated. 3. Nuclear translocation occurs allowing regulation of target gene expression. 7 1.1.5. Effects of Glucocorticoids (GCs) GCs are essential for life and have a multitude of effects in a variety of tissues (see table 1-‐1). Tissue Effect Liver éGluconeogenesis êGlycogenolysis éDe novo lipogenesis Muscle êGlucose Uptake éProtein catabolism êProtein Synthesis Adipose Lipolysis (é with fasting) Lipogenesis (ê with fasting, é in fed state) Lipid uptake (é in fed state) Dyslipidaemia & Central Fat Distribution Chronically Bone Inhibition of Osteoblasts êIntestinal Calcium absorption éRenal Calcium loss Skin Dermal thinning Disorganisation of collagen deposition Brain Hippocampal atrophy Pancreas êInsulin production Renal/Cardiovascular system éEndothelial Permeability Activation of MR éFree water clearance éVascular reactivity to pressors Eyes éIntraocular pressure Immune System Anti-‐inflammatory and immunosuppressive effects: Repression of NF-‐κB, AP-‐1 signalling Suppression of Pro-‐inflammatory T-‐cells Stimulation of Regulatory T-‐cells Inhibition of monocyte proliferation & differentiation éLymphocyte Apoptosis, êNeutrophil Apoptosis Table 1-‐1: Some of the Diverse Actions of Glucocorticoids on Numerous Organs and Systems 8 GCs are integral to the stress response, via modulation of metabolism, inflammation, and vascular reactivity. Broadly speaking these diverse effects are dependent on tissue-‐specific differences in the expression of cell machinery. In addition GC effects are modulated at the tissue level by metabolism expression of 11β-‐HSDs and the GR. GCs are one of the most commonly used therapeutic agents and are utilised for their immunosuppressive properties in a wide array of inflammatory diseases, and are also used in oncology and transplantation medicine. These effects are mediated via up-‐regulation of anti-‐inflammatory proteins (including IL-‐1RA and IL-‐10), inhibition of pro-‐inflammatory mediators, via effects on NF-‐κB, AP1, and STAT signalling, and activation of apoptotic pathways involving immune cells (Zen et al., 2011). GCs have complex effects on metabolic pathways, which are dependent on nutritional status. Stimulation of hepatic gluconeogenesis, reduced glucose uptake and increased adipose lipolysis, occurs during fasting to mobilise glucose and fatty acids, conversely GCs work with insulin in the fed state to stimulate lipogenesis and lipid uptake, which underlies the central obesity observed in GC excess (Gathercole et al., 2013). The contribution of GCs to protein catabolism and muscle atrophy is discussed elsewhere in this thesis. Adrenal insufficiency is characterised by hypotension whilst hypertension is a central feature of Cushing’s. GCs have direct effects on the heart and vasculature, and serve a permissive role for hormones such as catecholamines to determine vascular reactivity (Mangos et al., 2006). 9 1.1.6. The Renin-‐Angiotensin-‐Aldosterone Axis Aldosterone is the body’s principal mineralocorticoid, acting to regulate sodium, potassium and water balance. It acts via the mineralocorticoid receptor, which is widely expressed, but has major effects in the kidney related to reabsorption of sodium via the epithelial sodium channel (ENaC) and other regulatory proteins (Funder, 2005). Aldosterone is produced in the adrenal zona glomerulosa under renin-‐angiotensin system regulation (shown in Figure 1-‐4), with further modulation by factors such as ACTH, catecholamines and somatostatin (Wilson and Williams, 1998). In summary, the juxtaglomerular apparatus, in response to reduced renal perfusion pressure, produces renin. Angiotensinogen is synthesized in the liver and subsequently cleaved by renin, yielding angiotensin I. This in turn is cleaved by Angiotensin Converting Enzyme (ACE) and angiotensin II is formed, with the pulmonary vasculature the major site of conversion. Angiotensin II stimulates aldosterone synthesis, vasoconstriction, and arginine vasopressin (AVP) release from the posterior pituitary. 10 Figure 1-‐4: The Renin-‐Angiotensin Axis and the Regulation of Adrenal Aldosterone Secretion Aldosterone promotes sodium reabsorption by the distal nephron, via mineralocorticoid receptor mediated effects (Wilson and Williams, 1998). Aldosterone mediated increases in plasma volume are a determinant of mean arterial blood pressure (BP), with dysregulation of this system implicated in the pathogenesis of hypertension. 1.2. Regulation of Glucocorticoid Action In addition to the HPA-‐axis, GC-‐action is regulated at the circulatory and peripheral tissue levels by protein binding and pre-‐receptor glucocorticoid metabolism. 11 1.2.1. Corticosteroid Binding Globulin This area has been extensively reviewed previously, and a brief overview is presented here (Wilson and Williams, 1998). Cortisol in the circulation is mainly protein bound (<95%), predominantly to corticosteroid binding globulin (CBG) (≈90%), and the remainder to albumin (≈7%) or other proteins. CBG has high affinity for cortisol, but a low capacity, with a binding capacity of approximately 690 nmol/L. An important clinical consideration is that CBG levels are increased by factors such as old age, pregnancy and oestrogen administration, and reduced by liver disease, polycystic ovary syndrome, critical illness and protein losing enteropathies (Wilson and Williams, 1998). In these states, there may be a discrepancy between the total measured cortisol and the biologically active free levels (Dhillo et al., 2002). 1.2.2. Glucocorticoid Metabolism Below is a summary of the process of cortisol metabolism and clearance as reviewed by Tomlinson et al (2004). Approximately 15mg of cortisol is produced per day, with a circulating half-‐life of between 70-‐120 minutes. Cortisol is metabolised hepatically with cortisone following a similar pathway (Figure 1-‐5). The C-‐4 double bond is reduced to yield dihydrocortisol or dihydrocortisone metabolites, this is followed by 3α-‐hydroxysteroid dehydrogenase (3α-‐HSD) activity, which yields tetrahydrocortisol (THF) or tetrahydrocortisone (THE) metabolites. 20α-‐ or 20β-‐HSD mediated reduction of cortisol and cortisone metabolites result in formation of α-‐ or β-‐ cortols and cortolones respectively. 12 Figure 1-‐5: Metabolism of Cortisol. Cortisone and cortisol are interconverted by 11β-‐HSD1 and 2. Subsequent metabolism is similar for both steroids. 1.3. Cushing’s Syndrome Cushing’s syndrome encompasses biochemical hypercortisolaemia and the clinical features that develop with longer-‐term exposure. Exogenous Cushing’s is the commonest cause and develops as a result of administration of supraphysiological doses of GCs. Endogenous Cushing’s is a rare condition, with the incidence estimated to be between 0.7 to 2.4 per million/year (Newell-‐Price et al., 2006). Clinical phenotype varies in severity, but classically may involve central obesity, proximal myopathy, osteoporosis, skin changes (thin skin, bruising, striae), depression, menstrual irregularities, hypertension and insulin resistance (See Table 1-‐2). Diagnostic challenges include confirmation of hypercortisolaemia, exclusion of so-‐called pseudo-‐Cushing’s states and 13 confirmation of underlying aetiology. Diagnosis is often challenging and is limited by performance of tests currently available. First-‐line tests as listed in the Endocrine Society’s Clinical Practice Guidelines include urinary free cortisol (UFC), late night salivary cortisol, and 1mg dexamethasone suppression test (DST)(Nieman et al., 2008). Once hypercortisolaemia is confirmed, serum levels are used to discriminate whether the condition is ACTH dependent. Radiological imaging including CT of the adrenal glands is the mainstay for further investigation of ACTH independent disease. ACTH dependent disease usually involves further biochemical tests and MRI pituitary imaging to distinguish whether the source of secretion is pituitary (known as Cushing’s Disease (CD)) or ectopic (Nieman et al., 2008). Median survival of untreated Cushing’s in the original series was 4.6-‐years illustrating that early diagnosis and effective treatment is essential (Cushing, 1932). Previous series of CD patients post-‐ transsphenoidal surgery suggest that excess mortality risk normalizes with biochemical ‘cure’, however these studies may be under-‐powered or of insufficient duration of follow up to identify persisting risk (Sherlock et al., 2010). Indeed, studies assessing resolution of clinical features have shown reductions in adipose tissue mass, and BMI post-‐cure but no increase in absolute muscle mass (Lonn et al., 1994, Geer et al., 2012). Furthemore, osteoporosis usually requires long-‐term use of bisphosphonates, and there is evidence for persisting cardiovascular risk, and impaired quality of life (Colao et al., 1999, Pivonello et al., 2007). Optimal treatment should involve life-‐long follow up and normalization of cardiovascular disease risk, other morbidities and prevention of treatment induced adverse events, in addition to achieving biochemical ‘cure’. Treatment options depend upon the aetiology and include transsphenoidal 14 hypophysectomy for pituitary disease, with second line options including medical therapies, radiotherapy and adrenalectomy. Medical therapies are generally adjunctive in nature, and are used in situations including stabilization of hypercortisolaemic patients prior to definitive treatment, during acute illness, or whilst awaiting the effects of radiotherapy (Tritos and Biller, 2012). Currently available medical therapies include inhibitors of steroidogenesis, GR inhibitors and centrally acting agents, unfortunately although they provide additional treatment options they are limited by side effect profiles and efficacy (Tritos and Biller, 2012). Clinical Features Proportion Facial Plethora 95% Rounded Face 90% Decreased Libido 90% Skin Thinning 85% Decreased Linear Growth 70-‐80% Menstrual Irregularity 80% Hypertension 75% Hirsuitism 75% Depression/emotional lability 70% Easy Bruising 65% Glucose Intolerance 60% Weakness 60% Osteopenia or fracture 50% Nephrolithiasis 50% Table 1-‐2: Clinical Features of Cushing’s syndrome (Data reproduced from Newell-‐Price et al, 2006) 15 An important aside is the case of a 20-‐year-‐old woman with a clear biochemical diagnosis of CD and evidence of a defect in 11β-‐HSD1 activity. The patient had repeatedly elevated UFCs, failure of low-‐dose dexamethasone suppression, loss of circadian cortisol secretion, suppression with high dose dexamethasone, and a marked ACTH response to CRH), in the absence of a cushingoid phenotype. Surgery revealed a corticotroph adenoma, and post-‐operative cortisol was undetectable. On starting replacement cortisone acetate it became evident that reduction to cortisol was impaired, whilst cortisol clearance was elevated (Tomlinson et al., 2002). New medical therapies for Cushing’s are drastically needed, and the scope for use of selective 11β-‐HSD inhibitors should be explored. 1.4. Pre-‐Receptor Glucocorticoid Metabolism 1.4.1. 11 Beta-‐Hydroxysteroid Dehydrogenase: Types 1 and 2 There are 2 isozymes of 11beta-‐hydroxysteroid dehydrogenase (11β-‐HSD), which regulate GC action at a local tissue level by inter-‐converting GCs between their active and inactive forms (Tomlinson et al., 2004). The enzymes have distinct tissue specific expressions, co-‐factor requirements and enzyme kinetics that confer their different biological functions. The type 1 isozyme (11β-‐HSD1) amplifies local tissue GC by replacing the C11-‐keto group of cortisone (in mice, 11-‐dehydrocorticosterone) with a C11-‐hydroxyl group to form cortisol (in mice, corticosterone)(Tomlinson et al., 2004). The type 2 isozyme (11β-‐HSD2) protects the MR from activation by cortisol (Draper and Stewart, 2005). 11β-‐ HSD1 is widely expressed in liver, fat, brain, skeletal muscle, bone, heart, eye, 16 skin, gonad, placenta and lymphoid tissue (Tomlinson et al., 2004). It functions primarily as an oxo-‐reductase in intact tissues, however this activity is lost in favour of dehydrogenase activity when disruption of cells occurs. This is thought to reflect the critical importance of presence of NADPH as co-‐factor, generated by H6PDH using NADP and G-‐6-‐P as substrate, in the lumen of the endoplasmic reticulum (See Figure 1-‐6) (Draper et al., 2003). Figure 1-‐6: Schematic diagram demonstrating Pre-‐receptor Glucocorticoid Regulation by 11β-‐HSD1: 11β-‐HSD1 catalyses the reduction of cortisone to cortisol in the Endoplasmic Reticulum (ER) in the presence of co-‐factor, NADPH generated by H6PDH. Glucose-‐6-‐phosphate (G6P) is transferred from the cytosol for oxidation to 6-‐phosphogluconate (6PG) (Redrawn and adapted from Gathercole et al, 2013). The affinity of 11β-‐HSD1 for cortisone is higher (Km=0.3μM) than for cortisol (Km=2.1μM) (Stewart and Whorwood, 1994). Monder and White’s research groups cloned the gene encoding 11β-‐HSD1 in the late 1980s (Agarwal et al., 1989). It has been designated HSD11B1 and is located on chromosome 1, consisting of 6 exons and 5 introns, covering 30kb (Draper et al., 2002, 17 Tomlinson et al., 2004). Pre-‐receptor GC dysregulation has been implicated in the pathogenesis of a range of disease states including obesity, non-‐alcoholic fatty liver disease, insulin resistance, osteoporosis, inflammatory arthritis, dementia and idiopathic intracranial hypertension (Gathercole et al., 2013). 11β-‐ HSD2 was identified as a distinct isoform when it emerged that the HSD11B1 gene was normal in patients with “Apparent Mineralocorticoid Excess” (AME), and furthermore that it was absent from the kidney. A series of studies identified that the kidney expressed a high affinity NAD dependent isoform and its function in to protecting the MR from activation by GCs and role in AME was proposed (Stewart et al., 1994). A human in-‐vivo study showed that liquorice inhibits cortisol-‐cortisone 11β-‐HSD activity in the kidney providing an explanation for its mineralocorticoid action (Stewart et al., 1987). Cortisol and aldosterone bind the MR with similar affinities in vitro. 11β-‐HSD2 is attached to the ER, with the catalytic domain residing in the cytosol. It inactivates cortisol by conversion to cortisone, thus allowing aldosterone to act as the primary ligand (Edwards et al., 1988). This results in activation of the epithelial sodium channel and the sodium chloride co-‐transporter, and increased sodium reabsorption via the basolateral Na+/K+ ATPase. 11β-‐HSD2 is also present in other tissues with abundant MR expression such as the large intestine, and salivary glands. Placental 11β-‐HSD2 acts to protect the foetus from GC exposure in normal pregnancies, whilst there is evidence that reduced expression may be involved in the pathogenesis of intrauterine growth retardation, and foetal programming for metabolic disease (McTernan et al., 2001, Asztalos, 2012). 18 1.4.2. Regulation of 11β-‐HSD1 by GH-‐IGF-‐I A number of in-‐vitro and in-‐vivo studies have been carried out to investigate regulation of 11β-‐HSD1, and some of the identified regulatory factors change in their abundance across the lifespan in humans. Endocrine regulation features prominently, in cell culture studies with increased expression in response to GCs and downregulation in response to IGF-‐I (Gathercole et al., 2013). Moore et al (1999) showed that GH/IGF-‐I status correlated with markers of 11β-‐HSD1 activity in studies of acromegalic patients pre-‐ and post-‐ transsphenoidal surgery and post-‐ withdrawal of medical therapy (Sandostatin-‐LAR). Urine steroid profiles showed an inverse relationship between GH, IGF-‐I and THF+5αTHF/THE ratios. Subsequently IGF-‐I was shown to be responsible in studies of 11β-‐HSD1 expression/activity in cell culture and transgenic mice (Tomlinson et al., 2004, Huang et al., 2010). This relationship was also seen in a study of hypopituitary patients on stable doses of hydrocortisone, who were administered increasing doses of GH replacement (Toogood et al., 2000a). These findings were confirmed in clinical studies of hypopituitary patients and obese subjects (Beentjes et al., 2001, Tomlinson et al., 2003, Swords et al., 2003, Paulsen et al., 2006). These data have important clinical ramifications including the theoretical risk of precipitation of adrenal crises in partially ACTH deficient patients commencing GH. Additionally the phenotypic features of hypopituitarism may be secondary to increased 11β-‐HSD1 activity, and that beneficial effects of GH-‐IGF-‐I in hypopituitarism may be partly mediated via modulation of 11β-‐HSD1. Finally GH-‐IGF-‐I secretion falls with age and we may hypothesise that this may drive increases in 11β-‐HSD1 expression and activity contributing to adverse body composition and metabolic profiles (Stewart et al., 2001). 19 1.4.3. Regulation of 11β-‐HSD1 by Pro-‐Inflammatory Cytokines The HPA-‐axis is activated during inflammation and in recent years evidence has grown that GC action may also be amplified under these conditions via upregulation of 11β-‐HSD1 expression/activity, with potential implications for ageing. Treatment of pre-‐adipocytes, adipocytes, osteoblasts, aortic and bronchial smooth muscle cells, myoblasts and fibroblasts with TNF-‐α or IL-‐1β result in increased 11β-‐HSD1 expression (Tomlinson et al., 2001, Tomlinson et al., 2004). Co-‐treatment of stromal cells with TNF-‐α/IL-‐1β and GCs results in a synergistic increase in 11β-‐HSD1 expression (Kaur et al., 2010). A subsequent study found that TNF-‐α/IL-‐1β induction of 11β-‐HSD1 occurred via a NF-‐κB dependent mechanism (Ahasan et al., 2012). In vivo studies have confirmed that 11β-‐HSD1 expression is increased in inflammatory diseases such as ulcerative colitis and rheumatoid arthritis (Zbankova et al., 2007, Hardy et al., 2008). Interestingly salicylates, which are well known for anti-‐inflammatory use, also have insulin sensitising effects, and down-‐regulate adipose 11β-‐HSD1 expression in mice and humans (Nixon et al., 2012). In summary pre-‐receptor GC metabolism appears to play a prominent role in inflammation and this may be a compensatory mechanism, which results in adverse long-‐term outcomes (Cooper and Stewart, 2009). 1.4.4. 11β-‐HSD1 Expression and Activity in Skeletal Muscle Elucidating the 11β-‐HSD1’s role in ageing muscle is central to this thesis. Whorwood et al (2001) were the first to characterise expression of 11β-‐HSD1 in human skeletal myoblasts, observing regulation of enzyme activity by GCs. Subsequently Jang et al (2006) showed that 11β-‐HSD1 was expressed in vastus 20 lateralis biopsy samples from 11 non-‐diabetic community dwelling volunteers. Expression was similar between different muscle fibre types. In this study, muscle mRNA expression was 100-‐fold lower than in liver specimens, whilst mean conversion of cortisone to cortisol was 17.7%/200mg tissue/24 hours. Liver mRNA expression of 11β-‐HSD1 is 65-‐fold greater than that of mouse quadriceps (18.4 AU in liver, 0.29 AU quadriceps), although oxo-‐reductase activity was only 2.5-‐fold greater, comparable to adipose tissue (≈250pmol/g/hr in liver, 120pmol/g/hr in quadriceps)(Morgan et al., 2009). This compares to 5-‐ 10 fmol/mg/hr seen in human skin (Tiganescu et al., 2011). In view of the role of GCs in inducing insulin resistance and the primacy of skeletal muscle as a site of glucose disposal, there has been much interest in the contribution of local muscle GC generation to the pathogenesis of type II diabetes. 11β-‐HSD1 expression was increased in muscle from a rodent diabetes model (Zhang et al., 2009) and in primary human myotubes from obese type II diabetics (Abdallah et al., 2005). Furthermore, there have been reports of positive associations between myoblast 11β-‐HSD1 expression and insulin resistance, BMI and blood pressure (Whorwood et al., 2002). One study found that although muscle expression of 11β-‐HSD types -‐1, -‐2 and H6PDH were similar between patients with diabetes and controls, explants from diabetics had lower oxo-‐reductase and higher dehydrogenase activities (Jang et al., 2007). Conversely, Inder et al (2011) found that 11β-‐HSD1 oxo-‐reductase activity was not correlated with markers of obesity or insulin resistance in a study of 20 non-‐diabetic subjects. Inhibition of 11β-‐HSD1 results in attenuation of cortisone-‐induced reductions in glucose uptake in human myotubes (Abdallah et al., 2005, Salehzadeh et al., 2009). Selective 11β-‐HSD1 inhibition has insulin sensitizing effects via decreased IRS-‐1 21 serine 307 phosphorylation, and increased Akt/PKB Threonine 308 phosphorylation in skeletal muscle (Morgan et al., 2009). The effects of pre-‐ receptor GC metabolism in skeletal muscle in other physiological and pathological states have received less attention. However, studies have shown that 11β-‐HSD1 plays a dynamic role in response to stress, with increased muscle expression in post-‐surgery and increased global activity following acute exercise, it has been suggested that this is driven by stimulation by myokines (Jang et al., 2009, Dovio et al., 2010). Recently, 11β-‐HSD1 was shown to regulate GC-‐driven protein degradation and associated changes in E3 ubiquitin ligase expression in human primary myoblasts and the C2C12 murine myotube cell line (Biedasek et al., 2011), leading to suggestions that selective 11β-‐HSD1 inhibitors may be of therapetic use in muscle wasting. 1.4.5. Transgenic Models used to investigate 11β-‐HSD1 Function Since the end of the last century, our knowledge of the metabolic consequences of pre-‐receptor glucocorticoid regulation has increased exponentially through a series of studies in transgenic mice. This started with Kotelevtsev et al (1997) who generated a transgenic 11β-‐HSD1 knockout mouse, and observed a beneficial metabolic phenotype with resistance to stress and obesity induced hyperglycaemia, an inability to generate CORT from 11-‐DHC and compensatory adrenal hyperplasia. These mice have resistance to obesity, a favourable fat distribution with accumulation in epididymal rather than visceral fat depots in spite of increased caloric intake, improved lipid, hepatic insulin sensitivity, and glucose tolerance profiles (Morton et al., 2001, Morton et al., 2004). Mice with liver-‐specific disruption of 11β-‐HSD1 on the other hand, did not have significant 22 improvements in fat mass, body weight, or lipid profiles, were able to generate cortisol to 40% of control, and had increased adrenal weights in keeping with HPA-‐axis activation. Both extra-‐hepatic 11β-‐HSD1 and HPA-‐axis compensation appear to make important contributions to metabolic phenotype (Lavery et al., 2012). Mice with adipose specific enzyme overexpression (aP2-‐HSD1 mice) develop visceral fat accumulation associated with hyperphagia, dyslipidaemia characterised by raised free fatty acids and triglycerides, fatty liver, insulin and leptin resistance (Masuzaki et al., 2001). In follow up experiments these mice were shown to have arterial hypertension, in association with renin-‐angiotensin-‐ aldosterone system activation and salt-‐sensitivity (Masuzaki et al., 2003). Mice with hepatic overexpression of 11β-‐HSD1 (apoE-‐HSD1) (x2-‐5-‐fold increased activity) have mild insulin resistance, fatty liver and dyslipidaemia (Paterson et al., 2004). Some of these models have been utilized to ascertain the contribution of pre-‐receptor GC-‐regulation in a range of areas including inflammation, immunity, angiogenesis, bone turnover and cerebral function (McSweeney et al., 2010, Coutinho et al., 2012, Gathercole et al., 2013). Research into other aspects of ageing including sarcopenia is awaited. 1.4.6. Human Genetic Mutations in 11β-‐HSD1 and 2 1.4.6.1 HSD11B1: Cortisone Reductase Deficiency (CRD) and H6PDH: Apparent Cortisone Reductase Deficiency (ACRD) CRD and ACRD are caused by mutations in the HSD11B1 and H6PDH genes respectively (see figure 1-‐7) (Draper et al., 2003, Lawson et al., 2011). 11 cases have been described in the literature, with patients presenting with symptoms of hyperandrogenism, and investigations revealing urinary steroid metabolite 23 ratios consistent with low 11β-‐HSD1 oxo-‐reductase activity (low THF+5α-‐ THF/THE ratios), failure of cortisol generation on cortisone challenge and evidence of HPA-‐axis activation with adrenal hyperplasia, elevated plasma cortisone levels, and increased cortisol clearance (Phillipov et al., 1996, Jamieson et al., 1999, Biason-‐Lauber et al., 2000, Lavery et al., 2008, Lawson et al., 2011). The HPA-‐axis is activated to compensate for impaired active GC generation and reduced GR activation. ACTH secretion drives excess adrenal androgen production, and adrenal hyperplasia. These conditions highlight hyperandrogenism as a theoretical pitfall of selective 11β-‐HSD1 inhibition, furthermore the muscle and broader ageing phenotypes would be of great interest, to delineate the contribution of 11β-‐HSD1 across the human lifespan. Figure 1-‐7: Representations of HSD11B1 and H6PDH genes with mutations identified to date, associated with Cortisone Reductase Deficiency (CRD) and Apparent Cortisone Reductase Deficiency (ACRD) respectively. Diagram is not to scale. Adapted from Gathercole et al (2013). 24 1.4.6.2. HSD11B2: Apparent Mineralocorticoid Excess (AME) AME arises because of mutations in the HSD11B2 gene leading to enzyme deficiency (Stewart et al., 1996). Over 100 cases have been reported in the literature, with the condition typically characterised by presentation in early childhood in association with hypertension, hypokalaemic alkalosis, suppression of renin activity, aldosterone and deoxycorticosterone (Hassan-‐Smith and Stewart, 2011). The condition may be complicated by failure to thrive, rhabdomyolysis, kidney and cardiovascular disease. If untreated, the prognosis is poor and is associated with increased mortality. Urinary steroid metabolite ratios are characterised by high THF+5α-‐THF/THE ratios. Over 40 different mutations have been reported to date in kindreds in Europe, America, Asia and the Middle East (Ulick et al., 1979, New, 1994, Wilson et al., 1995, Ferrari et al., 1996, Kitanaka et al., 1996, Kitanaka et al., 1997, Li et al., 1997, Dave-‐Sharma et al., 1998, Lavery et al., 2003, Carvajal et al., 2003, Morineau et al., 2006, Coeli et al., 2008, Al-‐Harbi and Al-‐Shaikh, 2012, Parvez and Sayed, 2013)(See figure 1-‐8). Treatment involves correction of hypokalaemia and hypertension as an initial aim, with suppression of endogenous cortisol secretion by dexamethasone suppression in the long-‐term (Hassan-‐Smith and Stewart, 2011). There is a paucity of data on body composition, metabolic syndrome phenotype and long-‐ term outcomes in AME. 25 HSD11B2 Figure 1-‐8: Summary of published mutations in HSD11B2. Over 40 HSD11B2 gene mutations have been reported in association with Apparent Mineralocorticoid Excess. Located at 16q22, the gene is 6.2kb long and spans 5 exons. Diagram is not to scale Adapted from Hassan-‐Smith et al, 2011. 1.4.7. Selective 11β-‐HSD1 Inhibitors Naturally occurring inhibitors of 11β-‐HSD enzymes have long been recognized including glycyrrhetinic acid, which is derived from liquorice, flavanone, bile acids and progesterone metabolites (Gathercole et al., 2013). Proof-‐of-‐concept studies have highlighted a potential role of modulation of pre-‐receptor glucocorticoid metabolism in metabolic disease states. The non-‐selective 11β-‐ HSD-‐inhibitor carbenoxolone was shown to reduce serum cholesterol, glucose production rates and to limit the availability of active GCs to adipose tissue in healthy volunteers (Andrews et al., 2003). Pharmaceutical companies sought to develop compounds targeted to the type 1 isoform due to the limitations of hypertension seen in non-‐selective agents. These compounds were shown to have lipid and glucose lowering actions in animal studies (Gathercole et al., 26 2013). Initial human studies have demonstrated safety, efficacy and isoform selectivity of compounds developed by Pfizer (PF-‐00915275), Merck (MK-‐0736 -‐ 0916) and Incyte (INCB13739) (Courtney et al., 2008, Rosenstock et al., 2010, Shah et al., 2011, Feig et al., 2011). However, effects on metabolic syndrome parameters are modest at best (HbA1c reductions 0.3-‐0.6%, fasting glucose up to 24mg/dL, HOMA-‐IR up to 24% and LDL-‐cholesterol 6.3-‐10.4%). HPA-‐axis activation at the doses used appears to be mild with increases in serum ACTH and adrenal androgen levels within the normal reference ranges (Feig et al., 2011, Rosenstock et al., 2010). The strength of the case for the use of selective 11β-‐HSD1 inhibitors in the metabolic syndrome remains to be seen, and exploitation of these agents in alternative clinical scenarios should also be assessed. In particular, studies of effects on muscle turnover, strength, metabolism and other aspects of ageing would be of great interest. 1.5. Skeletal Muscle 1.5.1. Skeletal Muscle Physiology and Structure On average 40% of the human body is composed of skeletal muscle, which has both contractile and metabolic functions. Muscles are composed of thousands of fibres, which range from 10-‐100μm in diameter and from a few millimetres to several centimetres in length (See Figure 1-‐9)(Ropper et al., 2005). Muscle fibres are multinucleated and are surrounded by an inner membrane or sarcolemma, and an outer basement membrane. Muscle fibres contain many myofibrils, which are composed of myofilaments, and proteins including actin, myosin, tropomyosin, troponin, titin and nebulin. Branches of motorneurones originating from anterior horn cells or cranial nerve nuclei innervate muscle fibres, which 27 themselves receive projections from upper motorneurones under control of the motor cortex. Acetylcholine (ACh) is released by motorneurones at the synaptic cleft where it diffuses to bind sarcolemmal receptors. Figure 1-‐9: Skeletal Muscle Structure: At the ultrastructural level myofibrils are made up of sarcomeres arranged in series, which themselves are composed of actin and myosin filaments. The Z disc forms the limit of each sarcomere. The I band flanks the Z disc where actin is present. Overlap of actin and myosin filaments occurs in the A band. ATP dependent overlapping of actin and myosin drives muscle contraction (Squire, 1997). Action potentials are generated down T tubules liberating Ca2+ from the sarcoplasmic reticulum. Ca2+ associates with troponin and induces a conformational change, removing the inhibitory action of tropomyosin and revealing active sites of actin. Myosin cross-‐bridges are made with actin at a different location on the filament allowing shortening of the filament via an ATP dependent process (Ropper et al., 2005). Skeletal muscle demonstrates plasticity in its properties according to its environment. Factors including 28 resistance and endurance exercise, disuse, denervation, and nutritional status have dramatic effects on muscle bulk, contractile function, structure, and fibre-‐ type expression (Matsakas and Patel, 2009). The predominant muscle fibres are type I, (oxidative, slow twitch) and type II (a/b/x)(glycolytic, fast twitch). Fibre properties are determined by factors including, myosin heavy chain (MHC) expression, and myoglobulin and mitochondrial and capillary densities (See Table 1-‐3)(Bottinelli and Reggiani, 2000). I IIa IIx IIb Contraction Time Slow Moderately fast Fast Very Fast Motor Unit Size Small Medium Large Very Large Fatigue Resistance High Moderate Moderate Low Duration of Use Hours <30 min <5 min <1 min Power Produced Low Medium High Very High Mitochondrial Density High High Medium Low Capillary Density High Intermediate Low Low Oxidative Capacity High High Intermediate Low Glycolytic Capacity Low High High High Triglyceride Creatine Creatine Creatine Phosphate, Phosphate, Phosphate, glycogen glycogen glycogen MYH2 MYH1 MYH4 Fibre-‐Type Primary Energy Source Myosin Heavy Chain MYH7 Table 1-‐3: Characteristics of Major Skeletal Muscle Fibre Types. Adapted from Morgan et al (2010). 29 1.5.2. Glucocorticoid-‐Induced Myopathy Harvey Cushing described muscle weakness as a feature in his seminal case series. In cases of Cushing’s syndrome weakness has a prevalence of 60%, and proximal myopathy specifically is a key discriminatory diagnostic feature (Newell-‐Price et al., 2006). Data from large community cohorts estimate that between 0.5-‐0.9% of the UK population use oral GCs, with this figure rising to 2.5% between the ages of 70-‐79 years (Walsh et al., 1996, van Staa et al., 2000). GC-‐induced myopathy is associated with atrophy, reduced strength and insulin resistance. GCs also mediate muscle atrophy under conditions of starvation (Wing and Goldberg, 1993), sepsis (Tiao et al., 1996, Smith et al., 2010) and metabolic acidosis (May et al., 1986). These studies used either adrenalectomy or GR antagonists to demonstrate that GCs are required for development of skeletal muscle atrophy. Atrophy may impact upon existing disease specific functional limitations as in cases of respiratory muscle weakness in asthmatics (Akkoca et al., 1999), and in reduced muscle power in inflammatory rheumatological disease (Rothstein et al., 1983). Reduced muscle bulk is associated with reduced survival in conditions including renal failure and COPD (Swallow et al., 2007, Kalantar-‐Zadeh et al., 2010). To summarise, in-‐vitro cell culture systems, transgenic mouse models, and experimental medical approaches in human subjects have been utilized to advance our understanding of mechanisms involved in GC-‐induced myopathy. GCs appear to shift the equilibrium of protein turnover away from protein synthesis and towards breakdown (See Figure 1-‐10). It is clear that this is an active process associated with a complex interplay of anabolic and catabolic mediators, regulated by growth regulators (myostatin and IGF-‐I), transcription factors (FOXO and GSK3-‐ 30 Figure 1-‐10: Integrated pathway of Glucocorticoid Induced Myopathy: 1. GCs promote muscle atrophy and impair protein synthesis by via GR effects on gene transcription, and directly. GCs stimulate atrophy pathways leading to ubiquitin proteasome system activation and antagonize IGF-‐ I/PI3K/Akt signaling, mTOR and amino acid transport. Symbols: + indicates stimulation, -‐ indicates inhibition. Red boxes indicate proteolytic mediators. IGF-‐I = insulin-‐like growth factor 1, PI3K = phosphatidylinositol-‐3-‐kinase, Akt = protein kinase B, GSK3β = glycogen synthase kinase 3 beta, FOXOs = forkhead transcription factors, MAFbx A.K.A F-‐box protein 32 or atrogin-‐1, UPS = ubiquitin proteosomal system, mTOR = mammalian target of rapamycin, ER = endoplasmic reticulum, GR = glucocorticoid receptor. β). A central pathway appears to involve upregulation of E3-‐ubiquitin ligases with resulting increases in ubiquitination and proteasomal activity. The contribution of alternative proteolytic systems (lysosomal and calcium-‐ dependent) has yet to be fully characterized. Protein synthesis is also reduced by inhibition of IGF-‐I and downstream signaling and at the level of mRNA translation via inhibition of translational initiation factors, and ribosomal function. New perspectives are emerging with research focusing on the role of insulin resistance and post-‐translational regulation. Delineation of the pathways involved is vital in order to develop rational therapies. To date there are no licensed pharmacological treatments for muscle atrophy due to GC excess, or for 31 muscle atrophy conditions where GC-‐signaling is required. Pre-‐clinical and early phase human studies have investigated interventions including exercise, anabolic hormone treatment, and nutritional supplementation. 1.5.2.1. Clinical Features of GC-‐Induced Myopathy GC myopathy presents with proximal muscle weakness that is pronounced in the legs vs. arms co-‐existing with endogenous disease or exogenous steroid treatment. Other systemic features of GC excess are likely to be present. All GCs can induce muscle atrophy, however historically it was noted to be a more prominent feature of fluorinated steroids, such as dexamethasone and triamcinolone (Askari et al., 1976). Muscle weakness usually takes weeks to develop, although acute presentations have been reported (Rothstein et al., 1983). Body composition changes, characterized by declines in muscle and bone, and expansion of fat mass, are seen by 2 months treatment duration (Natsui et al., 2006). Respiratory muscle weakness has been reported as the primary feature in a case of endogenous Cushing’s (Blanco et al., 2001). Cranial nerve innervated muscles are spared. Paradoxically in the early stages of GC treatment, there may be an increase in force generation secondary to actions on corticospinal excitability (Minetto et al., 2010). GCs play a role in the pathogenesis of critical illness myopathy along with neuromuscular blocking agents, and pro-‐inflammatory cytokines. Dose response relationships between total GC, neuromuscular blocking agents and onset of myopathy have been observed (Shee, 1990). Critical care myopathy manifests as a spectrum from prolonged ventilatory weaning through to generalized 32 weakness (Lacomis et al., 1996). Long-‐term prognosis is variable with the majority of cases achieving full recovery, and almost one third being left with disability (Latronico et al., 2005). GCs also have profound effects on cardiac muscle, characterized by fibrosis and structural damage, with Cushing’s associated with a reversible cardiomyopathy (Yiu et al., 2012). Furthermore, GCs affect gene expression in smooth muscle, which may contribute to improvements in airway responsiveness observed when used in asthma (Yick et al., 2013). 1.5.2.2. Investigations for GC-‐Induced Myopathy Serum CK, and myoglobulin are frequently reduced or normal (Khaleeli et al., 1983a, Minetto et al., 2010). Although in the critical care setting increases have been reported, which may be due to factors such as mechanical ventilation, immobility or trauma (Douglass et al., 1992). Human histological findings are characterized by reduced myofibre cross-‐sectional area and preferential loss of type II fibres, myofilament fragmentation, darkly stained nuclei, enlarged mitochondria, and a reduction in glycogen content (Golding et al., 1961, Pleasure et al., 1970, Khaleeli et al., 1983b, Danon and Schliselfeld, 2007). Histological features reported in rodent, dog and equine models include preferential type IIB fibre atrophy, necrosis and heterogenous sizes of fibres, aggregation of mitochondria, and intramuscular fat accumulation (Braund et al., 1980, Dekhuijzen et al., 1995, Aleman et al., 2006). Conventional Needle Electromyelography (EMG) reveals a so-‐called myopathic pattern as characterized by reduced mean potential amplitude and duration (Yates, 1963, Khaleeli et al., 1983b, Golding et al., 1961). Needle EMG may be normal as it 33 preferentially studies type I fibres (Minetto et al., 2010). Surface EMG is more sensitive and cases show reduced muscle fibre conduction velocity, a marker of sarcolemmal excitability, and myoelectric manifestations of fatigue seen in cases (Minetto et al., 2011). EMG is useful in excluding alternative diagnoses such as inflammatory myopathy, which may be associated with fibrillation potentials. 1.5.2.3. Molecular Mechanisms of GC-‐Induced Myopathy Stable isotope studies in humans have shown that GC myopathy is associated with reduced global and “fractional mixed muscle protein synthesis” rates (Pacy and Halliday, 1989). Animal studies have confirmed both reduced MHC synthesis, along with elevated myofibrillar degradation, with MHC IIB markedly affected by dexamethasone treatment (Seene et al., 2003). GCs act via the GR, which is complexed to heat shock proteins (HSP) in the basal state but in the presence of hormone, translocates to the nucleus to alter gene transcription by binding to Glucocorticoid Response Elements (GREs). Overexpression of heat shock proteins, have been shown to protect against muscle atrophy (Senf et al., 2008). Presence of GR is a requirement for GC induced inhibition of Akt via dephosphorylation (Zhao et al., 2009). 1.5.2.4. GC-‐Induced Myopathy and the Ubiquitin-‐Proteasome-‐System (UPS) A number of studies have illustrated that the UPS is central to muscle atrophy signaling (Lecker et al., 2004, Schakman et al., 2008). It involves a series of 3 enzyme groups, E1 ligases, that activate ubiquitin, E2 ligases that act as carrier proteins and E3 ligases, that include MAFbx/Atrogin1 and MuRF1, which target 34 specific proteins for ubiquitination, including components of the sarcomere and proteins involved in apoptosis (Rajan and Mitch, 2008). MAFbx/Atrogin1 and MuRF1 are increased in muscle atrophy of different aetiologies including cancer cachexia, diabetes mellitus and renal failure, making up a “universal atrophy pathway” (Bodine et al., 2001, Lecker et al., 2004). Furthermore, mice with targeted deletion of these genes were protected from muscle atrophy due to denervation and disuse (Labeit et al., 2010). Dexamethasone treatment results in atrophy of murine myotubes and upregulation of MAFbx/Atrogin-‐1 and MuRF1 (Stitt et al., 2004). Both E3-‐ubiquitin ligases physically interact with myofibrillar proteins prior to degradation (Clarke et al., 2007, Lokireddy et al., 2012). MuRF1 directly interacts with myosin heavy chains prior to degradation, and absence of this gene protects mice against GC induced atrophy (Clarke et al., 2007). Interestingly MAFbx/Atrogin1 and MuRF1 do not function similarly in all models, as mice with deletion of the latter are protected against atrophy during 14 days dexamethasone treatment, whereas MAFbx/Atrogin1 knock out mice are not (Baehr et al., 2011). Amino acids and their metabolites such as beta-‐ hydroxy beta methylbutyric acid negatively regulate the UPS in a dose-‐ dependent manner and attenuate its activation by GCs and resulting muscle atrophy (Sadiq et al., 2007, Yamamoto et al., 2010, Aversa et al., 2012). Ubiquitinated myofibrillar proteins are cleaved by caspase-‐3 prior to 20S proteasomal processing (Du et al., 2004, Dirks-‐Naylor and Griffiths, 2009). GCs have been shown to have effects at all levels of this system (Combaret et al., 2004). Alternative proteolytic systems (autophagic/lysosomal (cathepsin), and calcium dependent (calpain)) may also be involved in GC-‐mediated myopathy 35 although full characterization is awaited (Komamura et al., 2003, Hong and Forsberg, 1995, Dardevet et al., 1995). 1.5.2.5. GC-‐Induced Myopathy and Forkhead Box Transcription Factors (FOXOs) GCs activate FOXOs by dephosphorylation, with downstream upregulation of atrogenes by promoter binding events. A recent study identified 3 GREs in the FOXO3a promoter and demonstrated GCs regulation at the mRNA transcriptional level (Lutzner et al., 2012). In vitro and in vivo models show that GC induced muscle atrophy is attenuated when FOXO is inhibited by dominant negative constructs and siRNAs (Sandri et al., 2004). Progressive increases in muscle mRNA expression of FOXO1 and FOXO3a, but not FOXO4, were observed over 1 week in rodent GC time-‐course experiments. FOXOs regulate MAFbx/Atrogin1 and MuRF1 expression by binding their promoters. In addition a highly conserved GRE is located 200bp upstream from the transcription initiation point of the MuRF1 gene allowing GR and FOXO1 act synergistically to activate gene expression (Waddell et al., 2008). A GRE for MAFbx has not been identified, with GC action thought to occur principally via FOXO. In low energy states AMP-‐ activated protein kinase (AMPK) acts synergistically with GCs to induce FOXO3a expression (Lutzner et al., 2012). Separate studies showed that AMPK activation upregulates ubiquitin ligase expression in murine cell culture and animal models (Krawiec et al., 2007, Lim et al., 2010). Peroxisome proliferator-‐activated receptor β/δ (PPARβ/δ) inhibition results in attenuation of dexamethasone induced FOXO-‐1 activation, MuRF1 expression, and atrophy in cell culture and animal models leading to this being suggested as a putative therapeutic target 36 (Castillero et al., 2013). In vitro and in vivo data show that testosterone treatment attenuates dexamethasone induced muscle atrophy, proteolysis and increased MAFbx expression (Zhao et al., 2008). This is likely to occur via a FOXO/Akt dependent mechanism (Jones et al., 2010). 1.5.2.6. GC-‐Induced Myopathy and IGF-‐I/PI3K/Akt Signaling IGF-‐I is an anabolic hormone, which has an antagonistic relationship with GCs. GCs reduce total IGF-‐I levels in serum, and gene expression levels in liver and muscle (Gayan-‐Ramirez et al., 1999). Treatment of murine myotubes with IGF-‐I induces hypertrophy, and dominantly inhibits dexamethasone induced proteolysis and MuRF1 and MAFbx up-‐regulation, via a PI3K-‐dependent mechanism (Stitt et al., 2004). IGF-‐1 receptor binding, results in IRS-‐1 phosphorylation with downstream activation of signalling pathways including PI3K/Akt. In-‐vivo rat experiments confirm that IGF-‐I prevents GC-‐induced muscle atrophy, partly via suppression of mRNA expression of ubiquitin, ubiquitin conjugating enzymes and proteasome subunits (Kanda et al., 1999, Chrysis and Underwood, 1999, Chrysis et al., 2002). Over-‐expression of IGF-‐I in muscle by electroporation in rats is also associated with protection against GC-‐ mediated muscle wasting (Schakman et al., 2005). Akt inhibits FOXO transcription factors by both phosphorylation and by suppressing mRNA expression (Sandri et al., 2004). Experiments with constitutively active FOXO1 and FOXO3a demonstrate that inactivation of FOXOs are required for IGF-‐I to have its anti-‐catabolic effects (Stitt et al., 2004, Sandri et al., 2004). IGF-‐I rapidly inhibits MAFbx/atrogin-‐1, whereas effects on MuRF1 are slower (Sacheck et al., 2004). GCs increase free ubiquitin expression (UbC) in muscle cells and tissue, 37 via transcriptional regulation of Sp1 and effects on MEK signalling (Marinovic et al., 2002). 1.5.2.7. GC-‐Induced Myopathy and Insulin Signalling Disease states such as critical illness (Dhar and Castillo, 2011), trauma (Bonizzoli et al., 2012), chronic kidney disease (Bailey, 2013) and type 2 diabetes mellitus (Andersen, 2012) are characterized by atrophy and insulin resistance of skeletal muscle. GCs interfere with insulin signalling at many levels of the pathway, via direct effects and via altered protein and lipid metabolism. Insulin acts via its receptor, resulting in activation of IRS-‐1 and downstream signalling pathways including PI3K/Akt. Whether insulin resistance contributes to muscle atrophy observed in presence of GCs is of great interest. Animal and human studies have revealed that reduced insulin levels are associated with UPS activation and increased muscle proteolysis (Price et al., 1996). GCs were shown to induce resistance to the anti-‐proteolytic effects of insulin in a human study utilizing leucine stable isotope and insulin clamp techniques (Zimmerman et al., 1989). Db/db mice had muscle atrophy and increased Caspase-‐3 expression and proteasomal activity. IRS-‐1 was phosphorylated at serine 307, with resulting low levels of PI3K activity and Akt phosphorylation. In the basal state these mice are known to have increased circulating GC levels. Treatment with rosiglitazone attenuated all of the above effects (Wang et al., 2006). In the same series of experiments, using muscle specific GR and insulin receptor KO mice, it was demonstrated that both reduced insulin signaling and GR activation are required for muscle proteolysis to occur (Hu et al., 2009). A study utilizing microarray analysis and chromatin immunoprecipitation sequencing in a murine myotube 38 cell line, identified 173 GR regulated genes, 8 of which are known to be involved in IGF-‐1 or insulin signaling pathways. One of these genes, the regulatory subunit of PI3K, p85α, was shown to regulate muscle atrophy and its absence reduced GC induced inhibition of Akt and p70 S6K, and serine 307 phosphorylation of IRS-‐1 (Kuo et al., 2012). 1.5.2.8. GC-‐Induced Myopathy and Mammalian Target of Rapamycin (mTOR) mTOR promotes protein synthesis and inhibits GR-‐mediated atrophy. It activates eukaryotic translation initiation factor 4E binding protein 1 (4E-‐BP1), and ribosomal protein p70 S6 kinase 1 by phosphorylation (Shah et al., 2000, Schakman et al., 2008, Shimizu et al., 2011). Conversely GR binds the gene promoter of muscle ‘Regulated in DNA damage and development’ gene (REDD1), which increases its expression and results in inhibition and dephosphorylation of mTOR (Kumari et al., 2011). 1.5.2.9. GC-‐Induced Myopathy and Glycogen Synthase Kinase Beta (GSK-‐3β) Akt inactivates GSK-‐3β by phosphorylating serine 9, which attenuates inhibition of eukaryotic inhibitory initiation factor 2B and promotes protein synthesis (Welsh et al., 1998, Verhees et al., 2011). Experiments in rodent myotubes show that IGF-‐I acts partly via inhibition of GSK-‐3β (Vyas et al., 2002, Li et al., 2005). Inhibition of GSK-‐3β in vitro attenuates GC induced MAFbx/Atrogin1 and MuRF1 expression and proteolysis, with sparing of myosin heavy and light chains (Evenson et al., 2005, Schakman et al., 2008, Verhees et al., 2011). 39 1.5.2.10. GC-‐Induced Myopathy, P300 and CCAAT/Enhancer Binding Factor (C/EBP) GCs increase muscle mRNA and protein expression of the nuclear co-‐factor, p300 (Yang et al., 2005). Treatment of rat myotubes with GCs induces the acetyl transferase activity of p300 and reduces expression of histone deacetylases 3 and 6 (HDAC3, HDAC6), conditions that promote hyperacetylation. Inhibition of histone deacetylases with trichostatin A (TSA) results in protein degradation. These findings suggest that GC induced proteolysis is partly regulated by acetylation (Yang et al., 2007). Recent work has identified other p300 acetylation targets that have important roles in muscle atrophy including its homologue the histone acetyl transferase CREB-‐binding protein (C/EBP), as well as FOXO1, FOXO3a and components of NF-‐kappa B (Perrot and Rechler, 2005, Chamberlain et al., 2012). Deacetylation of FOXO1 by SIRT1 is associated with inhibition of activity (Motta et al., 2004). C/EBPβ inhibition attenuates dexamethasone induced protein degradation and associated increases in MAFbx/Atrogin1 and MuRF1 in rat myoblasts (Gonnella et al., 2011). Similarly, inhibition of p300 and C/EBP in murine myotubes by Cited2 resulted in attenuation of dexamethasone induced muscle atrophy and ubiquitin ligase up regulation (Tobimatsu et al., 2009). Recently a series of in vivo rat experiments confirmed these findings, with dexamethasone treatment resulting in increased expression of p300, MAFbx/Atrogin1 whilst downregulating HDAC3 and HDAC6. Interestingly sepsis produced a similar pattern, and use of the GR antagonist RU486 attenuated these effects indicative of a GC-‐dependent pathway (Alamdari et al., 2010). Inhibition of the histone deacetylase SIRT1, by the polyphenol resveratrol, resulted in attenuation of FOXO1 acetylation, ubiquitin ligase expression and proteolysis 40 (Alamdari et al., 2012). The translational potential of modulation of atrophy associated protein acetylases remains to be determined. 1.5.2.11. GC-‐Induced Myopathy and Myostatin Myostatin (growth and differentiation factor 8) is a muscle-‐specific negative growth regulator. It has a highly conserved gene sequence across species, inactivating mutations result in marked muscle hypertrophy/hyperplasia as exemplified by “Belgian Blue”, “Piedmontese” and “Marchigiana” cows, the “Bully Whippet” and transgenic mouse models (McPherron et al., 1997, McPherron and Lee, 1997, Kambadur et al., 1997, Marchitelli et al., 2003, Mosher et al., 2007). Furthermore Schuelke et al (2004) reported a fascinating case of a child with evidence of an inactivating mutation, with a muscular appearance who was “able to hold two 3kg dumbbells in horizontal suspension”. Conversely systemic overexpression causes marked muscle atrophy (Zimmers et al., 2002). An in depth review of myostatin signaling in muscle atrophy is provided by Elkina et al (2011), in summary it acts via the Activin Receptor Type IIB/ALK4/5 heterodimer resulting in phosphorylation of SMAD2 and SMAD3 with effects on gene transcription. Downstream targets of SMAD signalling under inhibitory control include MyoD and myogenin (Langley et al., 2002), which are involved in myogenesis. GCs also suppress satellite cell regeneration by a myostatin dependent pathway (Dong et al., 2013). Myostatin acts to antagonize IGF-‐I effects by inhibition of Akt phosphorylation associated with activation of the UPS (Elkina et al., 2011). MAPK activation and downstream effects may also be involved. In a recent study, MAFbx/Atrogin1 accounted for 80% of myofibrillar protein loss with the remainder due to MuRF1 (Lokireddy et al., 2011). Absence 41 of atrogin1 in primary muscle cultures attenuated the atrophic effects of myostatin treatment. Myostatin treatment increased the number of interactions between MAFbx/Atrogin1 and sarcomeric proteins (Lokireddy et al., 2012). Myostatin gene KO mice had preservation of body weight during dexamethasone treatment (1mg/kg/day) over 10 days. They were spared from muscle atrophy, with preserved tibialis anterior, and gastrocnemius tissue weights at both 1mg/kg/day for 10 days and 5mg/kg/day for 4 days. Reductions in soleus muscle weight in dexamethasone treated wildtype mice failed to reach significance. Reductions in muscle fibre cross sectional area were also attenuated in KO animals. Myofibrillar protein contents were greater in KO animals. Absence of myostatin was associated with attenuation of proteolytic gene induction (FOXO3a, MAFbx/Atrogin1, MuRF-‐I and cathepsin-‐L) and reduced proteasomal activity. Absence of myostatin did not affect the decrease in IGF-‐I expression seen with dexamethasone treatment. However both saline and dexamethasone treated KOs had increased IGF-‐II expression (Gilson et al., 2007). 1.5.2.12. GC-‐Induced Myopathy and Apoptosis Pathways of GC-‐induced apoptosis have been elucidated using studies of immune cells, with a paucity of studies in skeletal muscle. GC-‐induced mitochondrial dysfunction, reactive oxygen species (ROS) generation and apoptosis were demonstrated in a human sarcoma cell line (Oshima et al., 2004). Fas-‐mediated signaling, ceramides and proteolytic systems are currently being investigated as alternative mediators of GC-‐induced apoptosis (Dirks-‐Naylor and Griffiths, 2009). In cell cultures experiments using L6 myotubes, IGF-‐I/PI3K/Akt signaling 42 protected against stress-‐induced apoptosis, while dexamethasone treatment inhibited this, resulting in increased caspase-‐3 activity and reduced cell viability (Singleton et al., 2000). An in-‐vivo study identified myofibre necrosis in the presence of proteins involved in apoptosis such as p53, Fas antigen, and caspase-‐ 8 in the muscles of rats treated with GCs in contrast to controls (Lee et al., 2001, Lee et al., 2005). 1.5.2.13. GC-‐Induced Myopathy and MicroRNAs MicroRNAs appear to be involved in the regulation of skeletal muscle growth and development (Chen et al., 2006). They regulate gene transcription by binding untranslated regions on mRNA to reduce translation or by reducing mRNA stability. MicroRNAs miR-‐1, miR-‐133, miR-‐206, and miR-‐125 act to suppress IGF-‐ I/PI3K/Akt signaling in muscle, whereas miR-‐23a and miR-‐486 increase activity of this pathway (Wang, 2013). MiR-‐1 is increased during dexamethasone induced skeletal muscle atrophy via a myostatin dependent mechanism. Furthermore transgenic mice with myostatin deletion also had attenuation of dexamethasone induced miR-‐1 expression (Wang, 2013). Furthermore myostatin appeared to increase GR nuclear translocation thus facilitating binding to a GRE in the miR1 promoter (Wang, 2013). Use of a miR-‐1 inhibitor resulted in hypertrophy of myotubes, and attenuation of GC induced E3-‐ubiquitin ligase expression and atrophy. HSP70 was identified as a target of miR-‐1, with inhibition associated with muscle atrophy with expected changes in gene expression and protein phosphorylation (Kukreti et al., 2013). Another study suggested that GC induced myostatin expression was regulated by miR-‐27 via binding to elements in its 3’-‐untranslated region. miR-‐27 was more highly 43 expressed in fast twitch muscle fibres, in a manner similar to myostatin. miR-‐27 was found to have effects on mRNA stability of the myostatin gene (Allen and Loh, 2011). The effects of GCs on targets involved in muscle atrophy are outlined in table 1-‐4. Target Effect of GCs Ubiquitin Proteasomal System Components é MAFbx/Atrogin1 é MuRF1 Alternative Proteasomal Systems é Cathepsins é Calpains Reference Stitt et al (2004) Clarke et al (2007) Komamura et al (2003) Hong et al (1995) Dardevet et al (1995) Fareed et al (2006) Transcription Factors FOXOs é Lutzner et al (2012) Sandri et al (2004) Growth Regulators IGF-‐I ê Myostatin é Gayan-‐Ramirez et (1999) Dong et al (2013) Ma et al (2001) Ma et al (2003) Gilson et al (2007) Nuclear Co-‐factors P300 é Alamdari et al (2010) Yang et al (2005) ê ê Yang et al (2005, 2007) Histone Deacetylases HDAC3 HDAC6 Cell growth regulators mTOR MicroRNAs mi-‐27 mi-‐R1 Inhibited via REDD1 dependent dephosphorylation é é al Kumari et al (2011) Allen and Loh (2011) Kukreti et al (2013) Table 1-‐4: Summary of the Effects of Glucocorticoids on Targets involved in Muscle Atrophy (é = increased gene expression; ê = reduced gene expression). 44 1.5.2.14. Potential Therapies for GC-‐Induced Myopathy In myopathy secondary to exogenous GCs, the primary approach should be to reduce exposure to the minimum effective dose where possible. Where appropriate switching to a non-‐fluorinated GC may be useful (Robinson and Robinson, 1959). The development of dissociated glucocorticoids, with the aim of maintaining trans-‐repressive effects on inflammatory pathways from adverse effects from trans-‐activation has been the focus of much research, however to date this class has not made it to market (Catley, 2007). In endogenous Cushing’s long-‐term cure characterized by normalization of glucocorticoid levels, is the primary aim of therapy. Khaleeli et al (1983a) found that overall and type II fibre area and force per unit increased in CD patients following successful pituitary surgery, however a more recent study found that although there were reductions in body fat mass at 6 months post-‐op, no increase in muscle mass was observed (Pirlich et al., 2002). From the discussion of pathways involved in GC induced myopathy and related muscle atrophy states outlined above, putative targets for the development of new treatments include myostatin, p300, SIRT1 and GSK-‐3β inhibitors, insulin sensitizers, modulators of IGF-‐I/PI3K/Akt signaling and nutritional supplements. Exercise in GC-‐Induced Myopathy: At present exercise is the most promising therapy to prevent muscle atrophy in GC treated patients. An early in vivo study showed that exercise prevented 25-‐50% of weight loss induced by cortisone acetate (Hickson and Davis, 1981). Rats undergoing a four sessions per week resistance exercise programme for 6 weeks were protected against triamcinolone acetonide induced atrophy and loss of power measured at the 45 gastrocnemius muscle, and loss of fast-‐twitch muscle fibres (Gardiner et al., 1980). Muscle atrophy was associated with the degree of muscle recruitment with greater muscle atrophy and lower rates of increase in the recruitment marker citrate synthase in the gastrocnemius compared to the plantaris muscle (Czerwinski et al., 1987). Mild exercise was shown to have an effect in preventing hydrocortisone (10mg/kg/day) induced muscle atrophy in Wistar rats, as measured by type I fibre cross-‐sectional area in soleus, and type IIa fibres in extensor digotorum longus muscles (Nakago et al., 1999). Recent studies of exercise interventions during GC-‐treatment have shown improvements in insulin sensitivity along with prevention of muscle atrophy (Barel et al., 2010, Nicastro et al., 2012). Similar effects are seen in humans with 50 days of isokinetic training improving mid-‐thigh muscle areas, mid thigh fat/muscle ratios and mean peak torque and total work output in patients treated with prednisone (Horber et al., 1985). Another study assigned 14 male post heart transplant patients with GC-‐induced myopathy to an exercise training or control group for 6 months. At follow up, mean lean mass was reduced below pre-‐transplant levels in the control group (-‐7.0%), while it was increased in the exercise-‐trained group (+3.9%) and muscle strength was x4-‐6-‐fold greater in the exercise-‐trained group vs. controls (Braith et al., 1998). Anabolic Hormone Administration in GC-‐Induced Myopathy: Further to the work on prevention of muscle atrophy by anabolic hormone administration or over-‐ expression outlined in the sections above, several human studies have investigated the effects GH, IGF-‐I and androgens administration on GC-‐induced myopathy by utilizing stable isotope and nitrogen balance techniques to estimate 46 protein turnover, body composition and muscle strength measures. GH and IGF-‐I have been found to induce a positive protein balance in healthy volunteers treated with oral prednisolone (Horber and Haymond, 1990, Mauras and Beaufrere, 1995). Clinical studies have assessed the benefits of therapy with GH alone or in combination with androgens. Ragnarsson et al (2013) studied 12 men (mean age 74 years, range 64-‐85) on long-‐term prednisolone treatment (mean 9.3 years, range 1.5-‐20) for polymyalgia rheumatica. GH, testosterone or combination treatments were administered for 2-‐weeks, with 2 week washout, in a cross-‐over design. Lean mass increased with GH and combination treatment, but not with testosterone alone. Appendicular skeletal muscle mass increased following all 3 treatment periods, with the greatest increase with combination therapy. Extracellular water also increased with combination therapy. Fasting glucose increased in the combination group, but did not breach thresholds for diagnosis of impaired fasting glucose. The study was limited by the short treatment period, the lack of a placebo group and absence of strength test data. Burt et al (Burt et al., 2008) studied 6 elderly patients on long-‐term GC therapy (mean prednisone dose 8.3mg/day). In a dose optimization study GH treatment was administered for 2 weeks at 0.8mg/day increasing to 1.6mg/day for 2 weeks. GH treatment at both doses was associated with protein anabolism, however the higher dose was associated with fasting hyperglycaemia in a third of subjects. In a follow on study of 10 elderly women (mean age 71 years) on long-‐term GCs (mean dose 5.4mg/day) addition of DHEA (50mg/day) to GH had no additional effects on protein turnover. A randomized placebo control study of testosterone 20mmg and nandrolone decanoate 200mg was carried out in 51 men aged over 20 years (mean 60.3) given GCs for 1-‐year. Both treatments 47 resulted in increased lean mass and muscle strength and reduced fat mass although the greatest changes were seen with nandrolone (Crawford et al., 2003). However long-‐term safety concerns remain a major hurdle. 1.6. Ageing – General Concepts 1.6.1. The Ageing Population The population of industrialized nations is ageing. According to a Government’s Actuary Department Report for Parliament (2010) “a boy born in the UK in 1981 could expect to live to 84 years, while a child born today has a life expectancy of 89 years”. Furthermore the median age of the UK population increased from 35.4 to 39.7 years over the period from 1985 to 2010 and is projected to rise further to 42.2 years by 2035 (Office for National Statistics, Report (2012)). The largest increases have been in those aged over 85, rising from 0.7 million in 1985 to 1.4 million in 2010, expected to reach 3.5 million by 2035. In the US there were 37.3 million people aged over 65 in 2006, and the figure is expected to double by 2050 (FORUM Report (2008, Manini and Clark, 2012). In the EU, over 65s made up 17.1 million of the population in 1998, with a projected rise to 25.4 million in 2035 and 30 million in 2060 (Sakuma and Yamaguchi, 2013, Eurostat, 2008). Healthy life expectancy has lagged behind increases in longevity however, with a gap between overall life expectancy and disability free life expectancy of 9.2 years for women aged 65 and 7.4 years for men (Office for National Statistics Report (2012)). Changing birth rate patterns also play a role in population ageing, with the post-‐war baby boomer generation now between middle age and retirement, and fertility rates remaining under replacement levels for the past 3 decades (Office for National Statistics Report (2012)). This has economic 48 implications for society, with the Department of Work and Pensions stating that those over working age consume 65% (£100 billion) of benefit expenditure, and the Department of Health stating that this group accounts for double the NHS costs of non-‐retired households (Government’s Actuary Department Report for UK Parliament, 2010). There is a need for interventions to increase healthy lifespan and on this background, ageing has been identified as a key research challenge by funding agencies in the UK, with ‘Living a long and healthy life’ a central theme of the Medical Research Council’s strategic plan (2009), and ‘Investigating development, ageing and chronic disease’ stated as one of the Wellcome Trust’s 5 major research challenges (2010). Population ageing represents a profound challenge and opportunity for translational medicine. 1.6.2. Theories of Ageing The process of ageing has become synonymous with decline, in physiological function and in development of chronic disease. Many theories have been proposed over the years, which can be broadly divided into those that state that it is an innate programmed process, or those that state that it is the consequence of the accumulation of molecular, cell and tissue damage over time (Jin, 2010). In evolutionary terms, ageing has been seen as the consequence of selection of traits that provided an advantage in reaching reproductive age, which have adverse effects in later life. Studies in small short-‐lived organisms such as yeast, worms and flies have identified pathways, which if altered result in dramatic alterations in longevity (Heemels, 2010). These pathways involve stress and nutrient response genes including mTOR, AMPK, sirtuins, IGF-‐I and FOXOs. Mouse models of human longevity involving GH-‐IGF-‐I signalling are discussed 49 elsewhere in this thesis. Other prominent targets in ageing include chronic inflammation, increased oxidative stress, mitochondrial dysfunction, telomere shortening and subsequent macromolecular damage (Kenyon, 2010). Rare syndromes of accelerated ageing have been studied to provide insights into normal ageing. Werner and Hutchinson-‐Gilford progeroid syndromes are due to single gene mutations, which result in altered DNA metabolism and nuclear function (Cox and Faragher, 2007). Other studies have taken a cross-‐sectional approach with comparisons between individuals of different age groups. Centenarians have been used to identify factors that may predispose to successful ageing. Many questions remain unanswered however, and the search for the nature of the initiating event, viable therapeutic targets in humans, and a unifying theory of ageing is ongoing. 1.6.3. The Ageing Phenotype Ageing is characterized by declining physiological functions in multiple systems, and tissues. There is a marked inter-‐individual variation in phenotype with age with regards to co-‐morbidities and physical functioning. Frailty is defined as “a clinical syndrome of adverse ageing”, which is defined by the decreased physiological reserve and diminished resistance to stress (Clegg et al., 2013). Fried et al (2004) used “unintentional weight loss, self-‐reported exhaustion, reduced grip strength, walking speed and physical activity” as diagnostic criteria for frailty and found that it was an independent predictor of a variety of adverse outcomes including falls, functional decline, hospital admission and death. A recent systematic review reported weighted average prevalence rates of 9.9% for frailty and 44.2% for pre-‐frailty, taking into account 21 community-‐based 50 studies (n=61500)(Clegg et al., 2013). Adverse ageing is underpinned by dysfunction of the immune, endocrine, central nervous, and musculoskeletal systems. Important age-‐related clinical presentations such as falls, incontinence, dementia and delirium, are clinical syndromes of multi-‐factorial aetiology. Increased visceral fat, reduced lean mass, and bone mineral density and development of alochronic conditions (hypertension, type 2 diabetes and cardiovascular disease) are central to the ageing phenotype. 1.7. Ageing and the Endocrine System Across human ageing there are marked changes in regulation and secretion of hormones including oestrogen (menopause), testosterone (andropause), GH/IGF-‐I (somatopause), thyroid hormone, cortisol, and DHEA (adrenopause) (Chahal and Drake, 2007). Whether modulation of these changes could be of therapeutic benefit has been the focus of much research interest. 1.7.1. Ageing and the GH-‐IGF-‐I Axis GH levels are low during childhood, and increase up to 3-‐fold during puberty, associated with marked increases in somatic growth, coinciding with the attainment of reproductive maturity (Sherlock and Toogood, 2007). A plateau is reached in early adulthood, and levels decline in middle and old age by 14% per decade, a phenomenon that has been labelled the ‘somatopause’ (Rudman et al., 1981, Shibasaki et al., 1984, Ho et al., 1987, Iranmanesh et al., 1991). IGF-‐I levels in the elderly are 50% of those seen in young adulthood (Veldhuis et al., 2005). GHRH and arginine stimulation studies suggest that GH reserve is retained with ageing and that regulation of release, possibly via sensitivity to somatostatin is 51 partly responsible for changes observed (Sherlock and Toogood, 2007, Lang et al., 1987, Ghigo et al., 1990). BMI is inversely correlated with GH, and weight loss in obese individuals attenuates these effects (Rudman et al., 1981, Rasmussen et al., 1995, Fowke et al., 2010). Exercise has been shown to induce GH release (Libardi et al., 2013). Sleep studies have revealed that patients with GH deficiency have abnormalities in sleep architecture including increases in slow wave sleep, and that GH administration in GHD reverses these abnormalities and increases REM sleep (Morselli et al., 2013, Van Cauter et al., 1998). Furthermore lean mass and IGF-‐I are increased in response to continuous positive airway pressure (CPAP) in men with obstructive sleep apnoea (Munzer et al., 2010). Dietary factors may play a role, as ageing may be associated with reduced energy intake, and evidence that fasting reduces IGF-‐I levels (Clemmons and Underwood, 1991). 1.7.1.1. GH Treatment in Elderly Subjects without Pituitary Disease Growth Hormone Deficiency is characterized by increased fat mass, reduced lean and bone mass, with adverse effects on quality of life measures (Bengtsson et al., 1993). GH-‐replacement in elderly subjects has been investigated in a number of studies. Rudman et al (1990) carried out the first such study in 21 healthy men (aged 61-‐81 years). Increases in lean mass (+8.8%), and mean lumbar vertebral bone mineral density (+1.6%), and skin thickness (+7.1%) were observed in the treatment group at 6 months. A reduction in fat mass (-‐8.8%) was also observed. Similar results were found in post-‐menopausal women (n=13 cases), along with reported increases in bone markers (Holloway et al., 1994). This study shares limitations with many subsequent studies with limited follow up of 6 months 52 duration and an absence of muscle strength measures. Where muscle strength has been measured improvements have been mild at best with Welle et al (1996) reporting a 14 (+/-‐5%) increase at 3 months, and Hennessey et al (2001) reporting an additional absolute increase of 7.8% over exercise alone over 6 months. There are concerns that observed increases in lean mass may be partly attributed to GH induced sodium and water retention. Cohn et al (1993) noted a high incidence of adverse events including carpal tunnel syndrome (16%, 10/62), gynaecomastia (6%, 4/62) and hyperglycaemia (5%, 3/62) in GH treated patients. A recent large study (n=131) showed increases in measures of insulin resistance, with an improved plasma lipid profile in healthy elderly patients on GH (Munzer et al., 2009). Overall occurrence of adverse effects was between 38-‐80% in subsequent studies (Sherlock and Toogood, 2007). In summary the studies showed only mild or modest effects on body composition and are limited by side effect profiles (including carpal tunnel syndrome, insulin resistance). Furthermore many of the earlier studies used higher doses of GH, which may explain their effects and the short duration of follow up of most studies (<1 year) means that long-‐term safety concerns have not been addressed. 1.7.1.2. The Paradox of GH-‐IGF-‐I and Ageing The observation that caloric restriction resulted in increased longevity of rodents was made 80 years ago (McCay and Crowell, 1934). Furthermore, hypophysectomised rats were found to have a reduction in age-‐associated collagen changes in tail tendons (Olsen and Everitt, 1965). There is now overwhelming evidence from studies in yeast, worms, flies, and mammals that 53 impairment of insulin and IGF-‐I signaling results in reduced features of ageing and increased lifespan. Transgenic mice with impaired GH-‐IGF-‐I signaling include Ames (prop-‐1 mutant), which have impaired differentiation of pituitary gland cell subtypes and reduced body size, Snell (pit-‐1 mutant) where the defect is downstream of prop-‐1 and mice are phenotypically similar, Laron (GHR/BP knock-‐out), IGF-‐1R heterozygote knock-‐out, and Little (GHRH-‐R mutant). All have prolonged lifespans (extensions 21-‐68%) and reduced body size (Brown-‐ Borg, 2009). Proposed mechanisms of protection include, resistance to cell stress, attenuation of pro-‐neoplastic anti-‐apoptotic proliferative pathways, and improved insulin sensitivity (Bartke, 2011). The picture in humans is less clear-‐ cut, with both GH excess in acromegaly, and GH deficiency in pituitary disease, associated with excess mortality (Holdaway et al., 2008, Besson et al., 2003). Laron syndrome (GH resistance) is characterized by short-‐stature, obesity, increased lipids, and insulin resistance. Data from 135 Laron Dwarves from an Ecuadorian cohort and 65 from an Israeli cohort have been reported. 22 deaths in childhood were reported in the Ecuadorian cohort, whilst only one was reported in the Israeli cohort, with the oldest known individuals reaching their late 70s. Although full-‐standardized mortality ratio data are not available a survival advantage seems unlikely (Laron, 2008). The reason for the discrepancy between GH-‐IGF-‐I effects on longevity between mice and humans has not been confirmed. However a recent review on the subject (Bartke, 2011), speculates that it may be that most laboratory mice die from cancer, from which IGF-‐I suppression provides protection, an effect diminished in humans where other causes of death are also prevalent. Alternatively it could be explained by the pleiotrophic gene theory whereby increased IGF-‐I signaling provides a survival 54 advantage in mice in early life by promoting promoting growth, and achievement of reproductive potential, at the expense of susceptibility to ageing and cancer in later life. This is less prominent in humans who have a longer lifespan and a prolonged dependency during childhood to allow development of higher functions. 1.7.2. Ageing and the Hypothalamic Pituitary Adrenal (HPA) Axis Many studies have assessed age-‐related changes in the HPA-‐axis with variability in results, however in recent years some broad themes have emerged which are summarized below (See Table 1-‐5). Biochemical Parameter Mean 24 hr Cortisol (urine) Serum Morning Cortisol Change with Age é _ é Diurnal Variation (serum) ACTH CBG CRH-‐test Dexamethasone Suppression Test Short Synacthen Test Stress Response Earlier Acrophase êAmplitude é _ _ êresponse épeak êresponse (low dose) Prolonged time to normalisation References Dodt et al 1994, Van Cauter et al 1996 Giordano et al 2001, Belanger et al 1994, Barrett-‐Connor et al 2000, Ferrari et al 2001 Zhao et al 2003 Sherman et al 1985, Van Coevordan et al 1991 Magri et al 1997 Bergendahl et al 2000 Pavlov et al 1986, Greenspan et al 1993, Waltman et al 1991 Wilkinson et al 1997, Wilkinson et al 2001, Magri et al 1997 Parker et al 2000 Giordano et al 2001 Transtadottir et al 2004 Table 1-‐5: Summary of Changes in Measured Parameters of the HPA-‐axis. (-‐ = No change) 55 1.7.2.1. Age-‐Related Changes in Mean 24-‐hour Cortisol Secretion and Diurnal Variation Some studies carried out in the 1980s and 1990s did not show differences in mean cortisol levels with age, but did identify a characteristic diurnal profile of cortisol secretion. Sherman et al (1985) had negative results for differences in mean 24 hour cortisol levels in 34 healthy subjects (aged 18-‐75 years), but did demonstrate earlier timing of cortisol acrophase (time point of peak amplitude of rhythm), peak and nadir were seen with age, although this may be related to the earlier time of usual bedtime reported by this age group. Similarly Van Coevorden et al (1991) found that although mean cortisol levels in the elderly were normal, the amplitude of the diurnal variation was decreased in a study of 8 young (20-‐27 years) and 8 elderly (67-‐84 years) healthy men. In contrast Dodt et al (1994) observed HPA-‐axis activation with age (increased mean cortisol and ACTH levels between 2300-‐0300h). Furthermore there was an association between these changes and reduced periods of slow wave and rapid eye movement sleep. Van Cauter et al (1996) corroborated the main findings here in a re-‐analysis of 177 plasma cortisol profiles from 90 healthy subjects aged between 18-‐83 years. Mean cortisol levels were increased by 20-‐50% from the age of 20 to 80 years. There was a blunting of the normal diurnal variation of cortisol secretion with age and overnight cortisol levels gradually increased. There were also gender specific differences, with pre-‐menopausal women having slightly lower mean cortisol levels than age matched men and older women exhibiting an increase in morning acrophase that was absent in men. A follow up prospective study of 24-‐hour serum profiles in healthy men (n=149, aged 16-‐83 years) revealed that the increase mean cortisol levels at 3nmol/L/decade, 56 (p<0.001) over the age of 50. The authors speculated that this may be due to reduced REM sleep, however this did not reach statistical significance as an independent variable (Van Cauter et al., 2000). Deuschle et al (1997) found that mean plasma cortisol levels were increased across age in a study of 33 healthy subjects. 1.7.2.2. Age-‐Related Changes in Morning Cortisol Levels There is a similar variability in data on morning cortisol levels, with some groups finding no differences with age (Giordano et al., 2001, Ferrari et al., 2001a), and others demonstrating increases of between 20-‐30% from middle to old age (Belanger et al., 1994, Laughlin and Barrett-‐Connor, 2000). Zhao et al (Zhao et al., 2003) showed that morning cortisol levels increased with age across a group of male and female subjects (n=145 aged 31-‐110) (p<0.0001). Furthermore those age over 80 had increased cortisol levels vs. those in their 60s or 70s. 1.7.2.3. Age-‐Related Changes in ACTH Magri et al (1997) found increased ACTH levels with age, but no differences in ACTH diurnal profile between healthy young (n=22), healthy old (n=52) and elderly patients diagnosed with dementia (n=35). ACTH spikiness, a measure of pulsatility of secretion, increases with age, particularly in women (p=0.046). The proportion of pulsatile ACTH secretion correlated with 24-‐hour mean cortisol concentrations (p=0.009), and irregularity of cortisol increased with age (Veldhuis et al., 2009). 57 1.7.2.4. Age-‐Related Changes in Cortisol Binding Globulin (CBG) CBG levels appear to change across the lifespan, with low levels during foetal gestation, and increases in the pre-‐pubertal phase and reductions with old age. Furthermore, dramatic reductions have been reported in elderly subjects with Alzheimer’s disease (Ferrari et al., 2001b, Meaney et al., 1995). 1.7.2.5. Age-‐Related Changes in Dynamic Tests of the HPA-‐Axis Dynamic testing reveals evidence of altered neuroendocrine functioning with ageing, with regards sensitivity of the hypothalamus and pituitary to feedback from circulating GCs, and sensitivity of the pituitary to stimulation by CRH. Ageing and the CRH-‐test: Several studies have found no differences in responses to ovine CRH testing with increasing age in men (Pavlov et al., 1986, Greenspan et al., 1993, Waltman et al., 1991). However Greenspan et al (1993) observed increases in basal, peak, and 5-‐hour nadir cortisols following ovine CRH administration in women. Ageing and Suppression of the HPA-‐Axis by Exogenous GCs: Sensitivity of both the ACTH and cortisol suppressive response to exogenous GCs is delayed and reduced in elderly subjects, irrespective of the time of sampling (Wilkinson et al., 1997, Wilkinson et al., 2001, Magri et al., 1997). Furthermore the effect was most marked in dementia patients (Magri et al., 1997). This is indicative of impaired negative feedback with ageing and dementia. Ageing and HPA-‐Axis Stress Response: High intensity exercise is a model of stress resulting in ACTH release. A study of 31 women found that normalization of serum ACTH following exercise was delayed in older women, and aerobic fitness attenuated this effect. These subjects also had higher cortisol levels during 58 recovery suggestive of enhanced adrenal sensitivity. This study indicates an important role of physical fitness in preventing age-‐associated alterations in the HPA-‐axis such as blunted negative feedback and reduced adrenal sensitivity (Traustadottir et al., 2004). Conversely, Kudielka et al (2004) examined the HPA-‐ axis response to the “Trier social stress” test in 31 children, 41 young adults and 30 elderly adults. The test elicited increases in ACTH and cortisol levels in all groups. Ageing was associated with a reduction in ACTH response in men, but not women, and increased cortisol levels in both genders. Ageing and the Short Synacthen Test: Evidence from most studies investigating adrenal cortisol reserve suggests that it is preserved with age (Ferrari et al., 2001b). An increased cortisol response to standard synacthen test was observed in one study (Parker et al., 2000) and conversely adrenal sensitivity to very low dose (0.06μg) ACTH stimulation was reduced in healthy elderly (n=8, 63-‐75 years) compared to young subjects (n=12, 22-‐34 years) in another study (Giordano et al., 2001). 1.7.2.6. Heritability of Age-‐Related HPA changes If HPA-‐axis dysfunction contributes to chronic disease states associated with ageing, there is a question as to whether certain individuals are protected against this phenotype by virtue of a beneficial pattern of cortisol secretion. Noordam et al (2012) tried to address this by studying the offspring of nonagenarians. They found that cases (n=149) had reduced HPA-‐axis activity (diurnal salivary cortisol), but no change in response to dexamethasone suppression compared to controls (n=154). 59 1.7.2.7. Sexual Dimorphism in Age-‐Related HPA-‐Axis Changes There is evidence of sexual dimorphism in HPA-‐axis functioning, with some reports of higher cortisol levels in elderly women vs. men (Greenspan et al., 1993, Seeman et al., 2001, Keenan et al., 2009). Differential efficacy and potency of ACTH, between women and men, has been proposed as a potential underlying mechanism (Keenan et al., 2009). Animal studies have demonstrated that oestrogens increase whilst testosterone decreases cortisol secretion (Viau, 2002). Levels of sex steroids including oestrogens were positively correlated with cortisol levels in a sub-‐set analysis of the “Seattle Midlife Women’s Health Study” (n=132)(Woods et al., 2009). In addition, short-‐term testosterone administration attenuated CRH-‐stimulated cortisol levels in healthy young men with experimentally induced hypogonadism in one study (Rubinow et al., 2005). 1.7.2.8. Relationship between Cortisol Concentration/Secretion and Age-‐Associated Chronic Disease A series of epidemiological and observational cohort studies have demonstrated a link between elevations in circulating cortisol levels and adverse body composition changes, and chronic disease states that are themselves associated with ageing. These conditions include dementia, osteoporosis and aspects of the metabolic syndrome. Subsequently there has been interest in whether aspects of the HPA-‐axis may be used as a biomarker for disease, or whether its modulation may have translational potential. A summary of the data from these studies is outlined below, followed by a discussion of the studies that have assessed how different measurements of HPA-‐axis function alter with increasing age. 60 1.7.2.9. Circulating Cortisol, Cognitive Decline and Dementia Cognitive decline is seen as a key feature of the ageing process that may result in increased dependency with inherent social care and health service costs. There has been much focus on the contribution of HPA-‐axis dysfunction to the spectrum of cognitive decline leading to dementia (Yau and Seckl, 2012). This reasoning is supported by observations from animal and human neuropathological studies that hippocampal atrophy is both a prominent feature of dementia and may be induced by GC excess and chronic stress (Yau and Seckl, 2012, Landfield et al., 1978, Sousa et al., 1998, Magarinos and McEwen, 1995). Furthermore the hippocampus is involved in modulation of the HPA-‐axis via inhibitory control with high expression of GR (Ferrari et al., 2001b). Lupien et al (1994) found that the slope of increase in cortisol levels over 4 years follow up in 19 healthy elderly volunteers, was associated with development of cognitive deficits in memory and selective attention, parameters that involve the hippocampal and limbic system. A recent study appeared to support this association, and highlighted a possible area of sexual dimorphism in the interplay between the HPA-‐axis and cognition with the observations that increased morning cortisol was associated with reduced cognitive performance, (visuo-‐spatial performance in men and verbal fluency in women) in a study of 197 elderly subjects living in the community. Data from Greendale et al (2000) supported these findings in 136 post-‐menopausal women living in Southern California over 2 years follow up. Mean and nadir cortisol levels were associated negatively with the mini-‐mental state examination in a study of 22 healthy young subject and 52 healthy old and 35 elderly patients with dementia (Magri et al., 1997). An analysis of 189 subjects enrolled in the Rotterdam Study (mean follow 61 up 1.9 years), found that impaired cortisol suppression to dexamethasone was associated with cognitive decline (Kalmijn et al., 1998). Strawski RS et al (2011) found that higher cognitive function scores were associated with a ‘healthier’ overall cortisol diurnal profile, characterized by a steep increase and high morning peak and lower evening and nocturnal nadir, in a study of 1500 subjects (aged 33-‐84 years). In summary although increases in morning cortisol, reduced sensitivity to GC negative feedback and altered diurnal rhythms have been associated with cognitive decline, an overarching temporal relationship has not yet been established. 1.7.2.10. Circulating Cortisol and Osteoporosis Osteoporosis is a highly prevalent condition in later life resulting in fractures, reduced mobility and associated morbidities. It is also a key feature of Cushing’s syndrome, and osteoporosis from exogenous GC treatment, is the commonest iatrogenic cause and is a particular risk to the elderly population (Vestergaard et al., 2002, Newell-‐Price et al., 2006). Increased 11β-‐HSD1 activity with age was proposed as a mechanism of increased sensitivity to GCs (Cooper et al., 2002). Interestingly, bone loss is greater in adrenal vs. pituitary Cushing’s and this may be due to higher adrenal androgens in the latter (Minetto et al., 2004). However inhibition of osteoblast function and reduced bone formation is thought to be the main mechanism underlying GC-‐induced osteoporosis, with secondary effects from stimulation of parathyroid hormone, and reduced gut absorption, and increased renal excretion of calcium (Wilson and Williams, 1998). The role of physiological changes in the HPA-‐axis in humans and effects on bone density has been investigated by a few studies. Serum cortisol is negatively correlated with 62 proximal and lumbar bone mineral density (Dennison et al., 1999). Greendale et al (1999) found that increased urinary free cortisol levels were associated with incident fractures in a cohort study of 684 elderly subjects (aged 70-‐70 years) over follow up from 1988 to 1995. 1.7.2.11. Circulating Cortisol and the Metabolic Syndrome There is an increased prevalence of components of the metabolic syndrome with age. Phillips et al (1998) observed correlations between measures of impaired glucose tolerance/insulin resistance and plasma cortisol in a UK-‐study of 370 men elderly men. A Korean study reported that late night salivary cortisol levels were increased in association with the metabolic syndrome, and that levels were positively associated with insulin resistance, fasting blood glucose, and waist circumference (Jang et al., 2012). Another study demonstrated a positive association between 24-‐hour cortisol production rate and percentage body at and BMI, but showed no change in circulating free levels due to increases in clearance (Purnell et al., 2004). However no significant correlations were observed in a larger study (n=726 age 48-‐89 years) (DeSantis et al., 2011). 1.7.2.12. Ageing and DHEA The adrenal zona reticularis atrophies from young adulthood onwards in association with a reduction in the biosynthesis and secretion of DHEA and its sulphated form DHEAS at a rate of “1-‐2% per year” (Ferrari et al., 2001b). Adrenal androgens appear to counteract many of the adverse effects of chronic cortisol exposure, and have pleiotropic effects on muscle growth, insulin resistance, central nervous and immune systems (Chahal and Drake, 2007, 63 Valenti, 2004). The past 2 decades have seen much research interest in using DHEA as an anti-‐ageing therapy, and this is discussed elsewhere in this thesis. A number of studies have identified increases in the cortisol:DHEAS ratio with age, and it is now established as a research tool to characterize adrenal ageing (Laughlin and Barrett-‐Connor, 2000, Ferrari et al., 2001a, Giordano et al., 2001, Chehab et al., 2007). Increased cortisol:DHEAS ratios are seen in dementia patients (Ferrari et al., 2001a). Carvalhaes-‐Neto et al (2003) compared markers of HPA-‐axis function, between an independent community dwelling elderly cohort and a frail institutionalized elderly cohort. Diurnal levels of serum cortisol and DHEAS were similar through the day between the two cohorts, as were cortisol levels following ACTH stimulation. However the frail group had increased serum morning cortisol:DHEAS ratios, and reduced cortisol suppression in response to dexamethasone. Furthermore cortisol levels post-‐ dexamethasone correlated positively with markers of cognitive and functional impairment. Heaney et al (2012) found that salivary cortisol (12 hour day-‐ profile) was positively correlated with age in a cohort of independent adults aged between 65-‐86 years (n=36). A study comparing 30 pre-‐menopausal (aged 20-‐25 years) with 35 post-‐menopausal (aged 55-‐68 years) healthy women found that while both basal and post-‐dexamethasone serum cortisol levels were similar between groups, basal serum levels of DHEA, DHEAS, and androstenedione were lower in the post-‐menopausal group. Cortisol response to ACTH was greater, whereas DHEA response was lower in the post-‐menopausal group (Parker et al., 2000). Ahn et al (Ahn et al., 2007) reported lower serum cortisol levels in subjects aged over 40 years vs. those in their 20s. No change was seen in salivary 64 cortisol levels (p=0.69). Serum and salivary DHEA levels also decreased with age with each decade over the age of 40 (p<0.001). 1.7.2.13. Summary of Ageing and the HPA-‐Axis There are clear associations between increased cortisol exposure and age-‐ related chronic disease states, however the mechanisms and drivers of this have not been fully delineated. Changes in HPA-‐axis activity occur with age, which are broadly characterized by mild increases in mean cortisol secretion, an increase in the nocturnal nadir, and reduced amplitude of the diurnal variation. Dynamic testing reveals evidence of reduced negative feedback response to GCs, and largely preserved adrenal response to ACTH. There is an increase in cortisol:DHEA ratios with ageing, which is largely driven by age-‐related falls in DHEA after the age of 30. 1.7.3. 11β-‐HSD and Ageing The phenotypic similarities between aspects of Cushing’s syndrome and ageing, including obesity, muscle atrophy, osteoporosis, skin thinning, hypertension, and insulin resistance has led to interest in the contribution of chronic GC exposure to age-‐related disease. As outlined above, there are associations between levels of circulating GCs and some chronic diseases, so it seems logical that this may extend to increased local tissue GC generation. In addition, these conditions affect tissues where 11β-‐HSD1 is expressed and functionally active, providing a potential therapeutic target with the advent of selective inhibitors. 65 1.7.3.1. Ageing, 11β-‐HSD1 and the Brain It is well established that chronic GC exposure is associated with hippocampal atrophy, cognitive impairments and dementia (Landfield et al., 1978, MacLullich et al., 2005). Aged rodents, who perform poorly in water maze tests, have significantly higher CORT levels than those who perform well (Issa et al., 1990). Hippocampal and parietal 11β-‐HSD1 expression is upregulated with age in mice and correlates with water maze performance (Holmes et al., 2010). 11β-‐HSD1 global knockout mice have attenuation of age-‐associated cognitive impairments (Yau et al., 2001). Furthermore, mice with targeted forebrain overexpression of 11β-‐HSD1 exhibit accelerated cognitive decline (Holmes et al., 2010). In humans 11β-‐HSD1 activity predicts imaging parameters of hippocampal and cerebral atrophy, and declines in processing speed over 6-‐years follow up in elderly men (n=41, age range 65-‐70 years)(MacLullich et al., 2012). Proof-‐of-‐concept interventional studies have yielded promising initial results with use of carbenoxolone found to be associated with improvements in verbal fluency in healthy elderly men (n=10, age range 55-‐75 years, 100mg tds 4 weeks duration) and verbal memory in type II diabetics (age range 52-‐72 years, 6 weeks duration) independently of changes in glycaemic control, lipid profile and circulating GC levels (Sandeep et al., 2004). 1.7.3.2. Ageing, 11β-‐HSD1 and Bone Pre-‐receptor GC metabolism in bone is of interest clinically in view of the highly prevalent problems of age and GC-‐induced osteoporosis. Studies within our department showed that 11β-‐HSD1 is expressed in human osteoblasts and osteoclasts, and that dehydrogenase and oxo-‐reductase activity is present in 66 fresh bone tissue. Carbenoxolone administration (300mg/day for 7 days) results in reductions in bone resorption markers (Cooper et al., 2000). 11β-‐HSD1 oxo-‐ reductase activities of human osteoblast primary cultures were positively correlated with donor age (Cooper et al., 2002). Transgenic mice with osteocyte and osteoblast specific overexpression of 11β-‐HSD2 were protected from age-‐ associated effects on cell apoptosis, bone formation, bone angiogenesis, vascular volume and interstitial fluid (Weinstein et al., 2010). 1.7.3.3. Ageing, 11β-‐HSD1 and Skin Ageing is associated with declining skin integrity characterised by thinning and impaired wound healing. Recent studies within our group have shown that 11β-‐ HSD1 is expressed and functionally active in human epidermal keratinocytes, dermal fibroblasts and mouse hair follicle root sheaths. Interestingly, age of donor is associated with increased 11β-‐HSD1 activity in human skin explants and primary cultures of human dermal fibroblasts. Photo-‐exposure is also associated with increased enzyme activity (Tiganescu et al., 2011). 11β-‐HSD1 knockout mice have improved collagen density and attenuation of age-‐associated collagen structural derangements. Wildtype mice treated with selective 11β-‐ HSD1 inhibitors and knockout mice both had improved wound healing (Tiganescu et al., 2013). Skin is a promising target for the use of 11β-‐HSD1 inhibitors, with potential applications in ageing, wound healing, and drug-‐ induced Cushing’s. 67 1.7.3.4. Ageing, 11β-‐HSD1 and Fat As outlined elsewhere in this thesis, ageing is associated with increasing fat mass, and shifting patterns of fat distribution to that associated with elevated cardiovascular risk. Some recent studies have focused on changes in expression of 11β-‐HSD1 in fat with age. HSD11B1 gene expression correlated positively with age in childhood in omental but not subcutaneous adipose biopsies during abdominal surgery (n=54, age 0.17-‐16.0 years, BMI 12.5-‐28.3kg/m(2))(Li et al., 2007). This observation was independent of gender or BMI. Andersson et al (2009) observed an up-‐regulation in HSD11B1 gene expression in subcutaneous adipose tissue of post-‐menopausal women. Cortisol generation from oral cortisone challenge was also increased following the menopause (n=46). These results were supported in a study of 19 premenopausal and 23 postmenopausal women, who also found close associations in expression levels of 11β-‐HSD1 and oestrogen receptor β (McInnes et al., 2012). 1.7.3.5. Ageing, 11β-‐HSD2 and the Kidney Hypertension is highly prevalent with age and is a dominant risk factor for vascular disease. Campino et al (2013) found evidence for a reduction in 11β-‐ HSD2 activity with an increasing serum cortisol to cortisone ratio with age in a study of 196 healthy normotensive subjects. Previous studies in rats failed to show significant alterations in 11β-‐HSD2 activity across the lifespan (Audige et al., 2002). 11β-‐HSD2 activity has been implicated in the pathogenesis of age-‐ associated hypertension, although it is possible that the observed changes represent a compensatory response to increasing HPA-‐axis or 11β-‐HSD1 activity. 68 1.7.3.6. Ageing, 11β-‐HSD1 and Skeletal Muscle Changes in 11β-‐HSD1 expression/activity in muscle with age have not been investigated to date, however as outlined previously it has been shown to be expressed and functionally active (Jang et al., 2006). This area is the central focus of this thesis as it is hoped that we will reveal information on therapeutic targets in the treatment of conditions related to skeletal muscle ageing. Studies utilising transgenic mouse models to assess functional outcomes of 11β-‐HSD1 modulation on skeletal muscle ageing and muscle atrophy pathways, along with human studies characterising expression and activity across age are required in addition to clinical studies of selective inhibitors in sarcopenia. 1.8. Sarcopenia Irwin Rosenberg coined the term sarcopenia meaning 'poverty of flesh' to focus attention on a neglected area of great clinical importance (Rosenberg, 1989). The past 2 decades have seen much attention on this phenomenon and its associations with adverse effects on metabolic and physical function. The reductions in muscle mass are marked, with estimates between 15-‐42% between 20-‐80 years, and 1-‐2%/year beyond the age of 50 (Doran et al., 2009, Baumgartner et al., 1998, Lindle et al., 1997). Reductions in muscle strength are more more prominent with increasing age at “1.5%/year after the age of 50” and 3%/year after the age of 60 (von Haehling et al., 2010, Abellan van Kan, 2009). Longitudinal studies have shown that skeletal muscle ageing is characterized by declining muscle quality (as defined by force/unit), and reduced shortening velocity (Delmonico et al., 2009, Mitchell et al., 2012, D'Antona et al., 2003). This is partly explained by reductions in fibre number (25% reduction from mean age 69 30-‐72 years), preferential loss of fast-‐twitch fibres, and presence of immature and mixed MHC isoforms (Lexell et al., 1983, D'Antona et al., 2003), furthermore intramuscular lipid accumulation could also contribute. 1.8.1. Prevalence of Sarcopenia Baumgartner et al (1998) used appendicular muscle mass (kg)/height(2)(m2) as a relative measure of muscle mass (muscle mass index (MMI)), and defined sarcopenia as <2 standard deviations below the young adult mean (aged 18-‐40 years). This method was used to control for the correlation between height and muscle mass, although the diagnostic threshold itself was an arbitrary decision and was not based on risk of adverse outcome. A sub-‐group (n=199) of patients with DEXA data available from the New Mexico Elder Health Survey was used to devise an equation for predicting appendicular muscle mass extrapolated to the group as a whole (n=883, mean age 74 years). Prevalences were 13-‐24% in those <70 years, increasing to 18-‐33% at 70-‐74 years, 26-‐36% at 75-‐80 years and 43-‐ 60% in the over 80s. This was the first report of an association between sarcopenia and functional impairment in a population-‐based cohort. Sarcopenia was associated with odds ratios of 3.66 for 3 disabilities or more in men and 4.08 in women. Since then several studies have reported sarcopenia prevalence in a variety of settings, patients groups, analytical techniques (including DEXA and bioimpedence) and diagnostic thresholds, outlined in table 1-‐6. Due to their heterogeneity it is difficult to draw clear conclusions from comparisons, however there are some patterns that have emerged. Sarcopenia is highly prevalent in those over the age of 65, with subsequent studies reporting prevalences of 14-‐ 27% (men), and 1-‐33% (women) in community studies. There is a further 70 increase in prevalence in octogenarians at 16-‐52% in men and 13-‐43% in women. As would be expected it is even more common in nursing home residents (70-‐98% in men, 21-‐44% women), in keeping with the functional impairments and disabilities seen in these populations (Bahat et al., 2010, Masanes et al., 2012, Landi et al., 2012a). Baumgartner et al (1998), reported that sarcopenia was more common in Hispanics. Other studies have reported prevalences of 4-‐27% (men), and 21-‐23% (women) in North America, 3-‐13% (men) and 1-‐33% (women) in Europe and 8-‐24% (men) and 5-‐19% (women) in South East Asia, conclusions here are limited by heterogeneity of studies. A recent study demonstrated a remarkably low prevalence of sarcopenia in Finnish women aged between 70-‐80 years (0.9-‐2.7%)(Patil et al., 2013). Criteria and cut-‐off points also determine prevalence, with most studies using the MMI and more than 2 SD below the young adult mean, and some studies using skeletal mass index (SMI) calculated by appendicular muscle mass*100/weight. Tichet et al (2008) found that estimates of sarcopenia frequency were higher using SMI (12.5% men and 23.6% women) than MMI (3.6% and 2.8% respectively n=218 age range 60-‐78 years). 71 Authors, year Baumgartner et al (1998) Age (years) <70 70-‐74 75-‐80 >80 Prevalence (%) (m) 16.9 (Hispanic) 13.5 (Non-‐ Hispanic) 18.3 (Hispanic) 19.8 (Non-‐ Hispanic) 36.4 (Hispanic) 26.7 (Non-‐ Hispanic) 57.6 (Hispanic) 52.6 (Non-‐ Hispanic) Prevalence (%) (f) 24.1 (Hispanic) 23.1 (Non-‐ Hispanic) 35.1 (Hispanic) 33.3 (Non-‐ Hispanic) 35.3 (Hispanic) 35.9 (Non-‐ Hispanic) 60.0 (Hispanic) 43.2 (Non-‐ Hispanic) N 883 Janssen et al (2002) >60 >1 SD: 45.0 >2 SD: 7.0 <1 SD: 59.0 <2 SD: 10.0 4504 Iannuzzi-‐Sucich et al (2002) 64-‐92 (m) 64-‐93 (f) 27.0 23.0 142 (m) 195 (f) Castillo et al (2003) 70-‐75 >85 4.0 16.0 3.0 13.0 694 (m) 1006 (f) Rolland et al (2003) >70 N/A 9.5 1458 Newman et al (2003) 70-‐79 11.5 21.0 2984 Chien et al (2008) >65 24.0 19 302 Tichet et al (2008) 60-‐78 3.6 (MMI) 12.5 (SMI) 2.8 (MMI) 23.6 (SMI) 112 (m) 106 (f) Masanes et al (2012) 73.9 (mean m) 74.9 (mean f) 10.0 33.0 110 (m) 90 (f) Landi et al (2012) >80 Men and women combined 25.4 N/A 260 Patil et al (2013) 70-‐80 N/A 0.9 (IWG criteria) 2.7 (EWGSOP criteria) 409 Patel et al (2013) 73 (mean, sub-‐ cohort) 67 (mean, total group) 6.8 (sub-‐cohort) 4.6 (total group) 7.9 763 (sub-‐cohort) 1022 (total group) Cheng et al (2013) >70 13.2 4.8 1766 (m) 1778 (f) Tanimoto et al (2013) >65 7.8 10.2 743 Table 1-‐6: Summary of Studies Examining Prevalence of Sarcopenia in Community-‐Dwelling Individuals. (m=male, f=female). 72 1.8.2. Association of Sarcopenia with Functional Impairment Janssen et al (2002) confirmed previous findings (Baumgartner et al., 1998) of an association between sarcopenia and functional impairment by reporting a “2-‐ fold increase in risk of functional impairment in men and a 3-‐fold increase in women over 60”, in the presence of sarcopenia, using data from the “National Health and Nutrition Examination Survey (NHANES III)”. This association has been reproducible in many studies, with outcome measures including gait speed, overall physical function scores and self-‐reported health scores (Patil et al., 2013, Patel et al., 2013). Chien MY et al (Chien et al., 2010) found that cardiopulmonary fitness may account for this, in a study of 275 Taiwanese elderly subjects (aged >65 years), where the 3-‐fold increase in disability in those with sarcopenia was attenuated when controlling for cardiopulmonary fitness. Tanimoto et al (2012) found an association between sarcopenia and “higher-‐level functional capacity”, as measured by the “Tokyo Metropolitan Institute of Gerontology Index of Competence (TMIG-‐IC)”, over the age of 65 years, in a community dwelling Japanese cohort (n=1158). It is intuitive therefore, that sarcopenia is a predictor of future decline, and this was confirmed by Guralnik et al (1995) using data from physical performance tests in 1122 community-‐dwelling subjects aged over 71 years, over 4 years follow up. On this theme, Taekema et al (2010) found that lower handgrip was associated with reduced social, psychological and functional health scores and was a predictor of cognitive and functional decline while Tanimoto et al (2013) found that 37% and 19% of sarcopenic men and women (n=743) developed dependency in activities of daily living after 2 year’s of follow up. Furthermore sarcopenia is a risk factor for falls, as evidenced by the “Rancho Bernardo study” (Castillo et al., 2003) where community-‐dwelling men with 73 sarcopenia had double the incidence in the year prior to screening (n=694). Landi et al (2012b) found that 18 out of 66 (27.3%) subjects with sarcopenia suffered falls over 2 years of follow up compared to and 19/194 (9.8%) with normal muscle mass (p<0.001). 1.8.3. Association of Sarcopenia with Chronic Disease Sarcopenia has been found to be associated with a range of chronic disease states, although at present the directions of causation are yet to be established. Type II diabetes mellitus, and the continuum of glucose intolerance is significantly associated with weak grip strength and poor physical function (Sayer et al., 2005). Sarcopenia was an independent risk factor for cardiovascular disease using data from subjects aged over 65 in the “Korea National Health and Nutrition Examination Survey (KNHANES)” (Chin et al., 2013). Osteoporosis was associated with a “2-‐fold” excess sarcopenia risk in a recent Japanese population based study (20.4% vs. 10.8%, n=2400, age range 40-‐88 years)(Miyakoshi et al., 2013). Sarcopenia is distinct from cachexia, which includes muscle wasting in the presence of a range of diseases including cancer and inflammatory disorders, but also involves loss of fat, with weight loss exceeding 5% of body weight with acute onset, and is combined with symptoms such as fatigue and biochemical abnormalities (Evans et al., 2008). 1.8.4. Association of Sarcopenia with Mortality Landi et al (2013) made the link between sarcopenia and excess mortality in subjects aged between 80-‐85 (n=197). There were deaths in 29 of 43 (67%) subjects with sarcopenia over 7 years follow up, vs. 63 of 154 (41%) with normal 74 muscle mass (p<0.001, Hazard ratio: 2.32 CI: 1.01-‐5.43). A similar risk for mortality was observed in a study of elderly subjects with sarcopenia living in Mexico City (n=346, mean age 78.5 years)(Arango-‐Lopera et al., 2013). Increases in mortality were also seen in hospital inpatients and nursing home residents with sarcopenia compared to those with normal muscle mass (Gariballa and Alessa, 2013, Kimyagarov et al., 2012). 1.8.5. Sarcopenia vs. Dynapenia Clark and co-‐workers (2008) proposed the term “dynapenia” meaning “poverty of strength” to describe the phenomenon of reduced muscle strength with age and to make the distinction from changes in muscle mass. The central reason for this was growing evidence that strength is more closely linked with adverse ageing outcomes than muscle bulk (Newman et al., 2006, Gale et al., 2007, Cesari et al., 2009). There is a clear variability in the relationship between strength and muscle mass, with the latter accounting for only 6-‐8% of variability of force of knee extension (Delmonico et al., 2009). Manini and Clark (2012) proposed a dynapenia diagnostic protocol which involves screening people aged over 60 years for risk factors and proceeding to knee extension strength assessment in high risk cases, or grip strength if low risk. Use of electromyelographic, motor unit and nerve conduction studies, serological and endocrine tests is proposed to exclude secondary causes. However there is a paucity of evidence behind this diagnostic approach, specifically there does not seem to be any consideration of the clinical presentation prior to committing to potentially invasive tests, or for the health economic and logistical constraints. Furthermore the maxim that diagnostic tests should be reserved for cases which will change the management 75 of a patient for the better in an important one, and the currently there is an absence of accepted interventions. In summary, age-‐related muscle weakness appears to have important associations with functional status, chronic disease and mortality. Further research to delineate the mechanisms underlying this is much needed and it is imperative that any clinical decision making tools are evidence based and rational, with a sound economic case behind them. 1.8.6. Sarcopenic Obesity Whilst ageing is associated with reduced lean mass, BMI is often maintained by increasing body fat, leading to so-‐called ‘sarcopenic obesity’. This clinical entity is linked to excess risk of disability vs. lean sarcopenic or obese non-‐sarcopenic subjects (Baumgartner et al., 2004). It is also associated with an excess risk of metabolic syndrome (3-‐fold) over obese subjects (2-‐fold). Prevalence ranges between 3.4-‐94.0% in over 60s as a result of diagnostic criteria and heterogeneity of sampling (Kim et al., 2009, Sakuma and Yamaguchi, 2013). SMI is more sensitive to detection of sarcopenic obesity than MMI (Kim et al., 2009). Accumulation of visceral fat with age promotes cardiovascular disease. In recent years, fat infiltration into muscle has been recognised to contribute to insulin resistance, and impaired functional status (Visser et al., 2002a). Pro-‐ inflammatory cytokine production by adipose tissue is a proposed mechanism of reduced muscle function and development of insulin resistance and cardiovascular disease associated with sarcopenic obesity (Schrager et al., 2007). 76 1.8.7. Consensus Statements for Sarcopenia Diagnosis In recent years, several expert panels have convened to decide upon diagnostic criteria for sarcopenia. There is some broad agreement between these groups that diagnosis should include assessment of functional status and strength in addition to muscle bulk. “The European Working Group on Sarcopenia (EWGSOP)” decided the diagnosis should be considered in all adults over the age of 65. A timed walking speed of less than 0.8 m/s is used as a screening test for functional impairment, with those with a positive result being referred for DEXA assessment of muscle mass, and grip strength assessment if negative. Normal grip strength excludes sarcopenia, whereas a low reading results in DEXA analysis. EWGSOP also propose the use of the terms ‘Primary’ and ‘Secondary’ (to reduced activity, disease or inadequate nutrition) sarcopenia, which may be a useful distinction clinically. The International Working Group (IWG) agreed that the diagnosis should be considered in patients with evidence of functional impairment. The suggested protocol suggests formal assessment of muscle mass by DEXA, in patients who are bedridden, unable to stand independently from sitting, or with a “gait speed <1 m/s”. Thresholds for sarcopenia were set at “≤7.23 kg/m(2) in men and ≤5.67 kg/m(2)” in women using appendicular muscle mass/height(2) (Fielding et al., 2011). “The Society of Sarcopenia, Cachexia and Wasting Disorders Consensus Conference” advocated universal screening of elderly patients for sarcopenia. Criteria for diagnosis includes evidence of reduced muscle mass as defined by the MMI, 2SD or more below the ethnicity-‐ matched young adult mean, combined with a walking speed of <1 m/s or <400m during a 6 minute walk (Morley et al., 2011) with identifiable secondary pathologies would preclude a diagnosis of sarcopenia. 77 1.8.8. Potential Mechanisms of Skeletal Muscle Ageing On current evidence, sarcopenia is widely believed to be a multifactorial syndrome, involving reductions in anabolic hormones, chronic inflammation, cell stress, mitochondrial dysfunction, denervation, disuse and nutritional factors, with resulting effects on myofibrillar protein synthesis and degradation (see Table 1-‐7). Putative Mechanism Reference Increased Proteolysis Welle et al (2003), Giresi et al (2005) Reduced Protein Synthesis Balagopal et al (1997) Reduced Growth Hormone/IGF-‐I Sakuma and Yamaguchi (2012) Chronic Inflammation Jo et al (2012) Denervation Jang et al (2011) Mitochondrial dysfunction Marzetti et al (2013) Oxidative Stress Jozsi et al (2000) Satellite cell dysfunction Barberi et al (2013), Sajko et al (2004) Insulin Resistance Guillet et al (2005), Workeneh and Bajaj (2013b) Disuse Vandenburgh et al (1999), Wall et al (2013) Malnutrition Morley et al (2001) Table 1-‐7: Putative Mechanisms of Skeletal Muscle Ageing. 78 1.8.8.1. Ageing and Muscle Protein Turnover It is understood that the reduction in skeletal muscle mass seen with age is underpinned by reductions in protein synthesis and elevations in degradation. Balagopal et al (1997b) observed declining MHC synthesis rates in a cross-‐ sectional muscle biopsy study (n=24, aged 20-‐92 years). Studies investigating function of proteolytic systems however have provided variability in results with some studies demonstrating increases in expression of MuRF1, MAFbx/Atrogin1 and the 26S proteasome in aged rat muscle (Clavel et al., 2006, Altun et al., 2010) and others observing downregulation of components of the UPS (Edstrom et al., 2006). Other intermediaries known to effect protein turnover such as FOXOs and myostatin also have variable results across age in different animal and human studies (Kawada et al., 2001, Baumann et al., 2003, Welle et al., 2002, Raue et al., 2006, Sandri et al., 2013). 1.8.8.2. Skeletal Muscle Ageing and Chronic Inflammation Across the human lifespan marked changes in the immune system are observed, with an attenuated immune response, labelled ‘immune senescence’ and development of low-‐grade systemic inflammation, known as ‘inflamm-‐ageing’ (Butcher and Lord, 2004). ‘Inflamm-‐ageing’ is defined by an exaggerated response to cell stressors causing damage at a molecular and tissue level (Franceschi and Bonafe, 2003). Cytokines are secreted by a variety of sources over the ageing process, including immune cells, and those in peripheral tissues including adipose, and muscle, which are known as adipokines and myokines respectively (Keller et al., 2003, Cevenini et al., 2010). Local TNF-‐α levels are increased with age in muscle (Greiwe et al., 2001) whilst higher systemic levels 79 of TNF-‐α and IL-‐6 were found to be associated with reduced muscle mass and strength in baseline data from the “Health Ageing and Body Composition study” (n=3075, age range 70-‐79 years)(Visser et al., 2002). TNF-‐α and IL-‐6 were also associated with excess mortality in participants in the “Framingham Heart Study” (n=525, baseline age range 72-‐92 years, follow up 4 years) (Roubenoff et al., 2003). Numerous subsequent studies have been carried out that outline associations between TNF-‐α, IL-‐6 and CRP and measures of reduced strength and muscle mass, poor physical function, gait speed and functional capacity (Brinkley et al., 2009, Schaap et al., 2009, Verghese et al., 2011, Cappola et al., 2003, Penninx et al., 2004). A recent review found that IL-‐6, which increases 2-‐4-‐ fold with age, had the most robust relationship with chronic disease status, functional capacity and mortality (Singh and Newman, 2011). Pro-‐inflammatory cytokines promote muscle atrophy in cachectic states. Mice over-‐expressing IL-‐6 or given exogenous TNF-‐α have reduced muscle mass secondary to proteolysis (Llovera et al., 1993, Tsujinaka et al., 1996). In healthy individuals cytokines are secreted in response to tissue injury, where they are linked to the tissue regeneration, although this relationship appears to breakdown with age. There is evidence that chronic inflammation impairs satellite cell function and muscle regenerative capacity (Degens, 2010). Muscle trauma results in release of inflammatory cytokines, macrophage migration, and neutrophil action resulting in reactive oxygen species release. TNF-‐α has pleiotropic effects, signalling via various pathways, with NF-‐κB signalling important in muscle atrophy (Bhatnagar et al., 2010). The “canonical” pathway of NF-‐κB is activated with skeletal muscle ageing, and inhibition prevents muscle wasting by promoting satellite cell activation (Hunter and Kandarian, 2004, Bar-‐Shai et al., 2005, 80 Mourkioti et al., 2006). Muscle atrophy and reduced strength results from activation of the UPS and apoptotic pathways (Degens, 2010, Whitman et al., 2005). Exercise may modulate pro-‐inflammatory cytokine levels across age although the data on this are not uniform (Greiwe et al., 2001, Nicklas et al., 2008, de Gonzalo-‐Calvo et al., 2012, Beavers et al., 2010). 1.8.8.3. Skeletal Muscle Ageing and Oxidative Stress Reactive oxygen species are generated by mitochondria as a consequence of aerobic metabolism and have been shown to accumulate with increasing age. Their effects are counteracted by anti-‐oxidant defence mechanisms, and it is theorized that imbalance in this redox system may account for changes in senescent muscle. Mitochondrial DNA is susceptible to oxidative damage and may result in mitochondrial dysfunction. It has been proposed that this may develop into a “vicious cycle of mitochondrial damage” giving rise to increased oxidative damage (Doria et al., 2012). Muscle fibres with mitochondrial-‐electron-‐ transport chain abnormalities increase from x5-‐fold between the 5th and 9th decades in association with mitochondrial DNA deletion mutations (Bua et al., 2006). Senescent mitochondria become enlarged, rounded and develop vacuoles (Peterson et al., 2012). Skeletal muscle is highly active in aerobic metabolism, so is particularly vulnerable to the effects of reactive oxygen species on mitochondrial DNA and cellular proteins (Doria et al., 2012). Oxidative protein damage (protein carbonyl levels) are negatively correlated with reduced grip strength in old-‐age (Howard et al., 2007, Dayhoff-‐Brannigan et al., 2008). 81 1.8.8.4. Skeletal Muscle Ageing and Satellite Cells Satellite cells are responsible for regeneration of adult skeletal muscle following trauma. When activated, these undifferentiated cells fuse together to form new fibres. Cross-‐sectional studies using muscle biopsies and post-‐mortem specimens have shown that satellite cell numbers decline with age in humans (Kadi et al., 2004, Sajko et al., 2004). There is evidence that a fibre-‐type specific reduction in satellite cell number underlies the age-‐related decline in type II fibres (Verdijk et al., 2007). Carlson and Faulkner (1989) showed that the environment of muscle cells was important in determining regenerative capacity in experiments involving grafting muscle from young or old donors into young or old hosts. Old muscle grafted into young hosts was no different from those of young muscle grafted into the same hosts and young muscle grafted into old hosts had no difference in regenerative capacity compared to old muscle. 1.8.8.5. Skeletal Muscle Ageing and Denervation Ageing is characterized by denervation of skeletal fibres by loss of spinal motorneurones, with resulting increases in the size of motor units. Spinal motorneurone number is reduced by a quarter between the age of 20 and 90 (Tomlinson and Irving, 1977). Adaptive mechanisms such as axonal sprouting result in a denervation-‐renervation cycle, and over time this capacity is diminished. In addition, there are reductions in axonal conduction, partly due to demyelination (McNeil et al., 2005, Aagaard et al., 2010). Degeneration of the neuromuscular junction is also a well-‐established feature of senescence (Chai et al., 2011). Some authors have proposed that sarcopenia is a consequence of denervation, noting that several known aetiological factors including reduced 82 anabolic hormones, increasing cell stress, mitochondrial dysfunction, malnutrition, disuse and chronic inflammation have adverse effects on motorneurones as well as muscle (Kwan, 2013). Recent studies in aged rats have shown that myofibres expressing the denervation marker, sodium channel isoform Nav1.5, are smaller, have higher expression of ubiquitin ligases MAFbx/Atrogin1 and MuRF1, and higher co-‐expression of MHC isoforms than Nav1.5 negative fibres, suggesting that denervation may be the primary driver of muscle features of muscle senescence (Rowan et al., 2012). Whether sarcopenia is driven by a primary event at the level of motorneurones, neuromuscular junction or muscle itself remains to be established. 1.8.8.6. Skeletal Muscle Ageing and Gene Expression Array Studies The advent of DNA microarray technology led to numerous studies investigating gene expression in ageing muscle. Lee et al (1999) observed a gene expression profile indicative of cell stress and declining metabolic and biosynthetic function in aged mouse muscle, by utilizing high-‐density oligonucleotide arrays containing 6347 probe sets, with these changes attenuated by caloric restriction. Mitochondrial gene suppression was the predominant feature of skeletal muscle ageing in a rat model. Genes involved in the function of the neuromuscular junction, proteolysis and inflammation were altered in a recent animal study (Ibebunjo et al., 2013). Welle and colleagues (2000) compared pooled samples from human vastus lateralis biopsies in young (age 21-‐24 years) compared to older (age 66-‐77 year) subjects and observed changes in MHC, mitochondrial, and glucose metabolism genes with increasing age. Jozsi et al (2000) performed gene expression analyses of pooled mRNA extracts from vastus lateralis muscle 83 biopsies in young (n=11, age range 20-‐30) and older (n=12, age range 62-‐75 years) men. At baseline, muscle from older men was found to express genes characteristic of stress response (including heat shock proteins) with reduction of genes involved in DNA repair. After an exercise intervention muscle from younger men also had increased expression of genes involved in the stress response (heat shock proteins, MAP kinases, VEGF and IL-‐1β), effects that were absent in older men. The authors suggested that this provided evidence of an impaired inflammatory response that may impact on muscle regeneration and hypertrophy with age. Roth et al (2002) identified 50 genes that changed with age (>1.7-‐fold), involved in structural, metabolic and gene regulatory functions in a study of untrained individuals. Welle et al (2003) performed a more comprehensive gene expression analysis, comparing vastus lateralis biopsies from young (n=8, age range 21-‐27 years) and older (n=8, age range 67-‐75 years) men using 44000 probe sets with adequate signals on 18000. Genes involved in energy metabolism and mitochondrial function tended to be downregulated with age. Up-‐regulation of genes encoding UPS components, RNA binding and ribonuclear proteins and evidence of increased heterogeneity of transcripts was seen with age. Giresi et al (2005) attempted to identify a “molecular signature of ageing”, defined as the “minimum set of genes that can be used to distinguish old from young muscle” using Affymetrix GeneChip analysis of young (n=10, 19-‐25 years) vs. old (n=12, 70-‐80 years) vastus lateralis biopsy samples from healthy but sedentary male volunteers. The bioinformatics method employed excluded genes that exhibit high intra-‐group variability. Using approximately 22000 probe-‐sets, 45 genes were identified whose expression was most discriminatory between groups, expression of 27 was increased and 18 reduced with age. The 84 authors proposed that this might be of translational use in assessing effectiveness of future therapeutic interventions in ageing muscle. Genes up-‐ regulated in the signature are involved in resistance to cell stress, RNA processing, and include a number of transcription factors and co-‐regulators. Of particular interest in the signature are GC-‐regulated genes such as FOXO3a and C/EBP. Also of note from an endocrine perspective, is the increased expression of retinoid X receptor-‐beta (RXRB) a nuclear receptor, which dimerises with receptors for vitamin D, thyroid hormone and peroxisome proliferators to mediate responses. Similarly the “circadian period-‐2 (PER2)” gene, which is involved in maintenance of circadian rhythms relating to sleep and metabolism, is increased. A study using muscle biopsies from 81 individuals identified an age-‐related gene expression profile characterized by increases in genes involved in “cell growth, complement activation, the ribosome”, and reductions in genes involved in “chloride transport and the mitochondrial electron transport chain”, interestingly these changes were also found in diverse tissues such as brain and kidney (Zahn et al., 2006). A recent study has examined microRNA (miRNA) changes with age in muscle biopsy samples from young (n=36, mean age 31 years) and elderly (n=17, mean age 73) subjects. Expression of 18 miRNAs changed with age, including genes involved in cell cycle regulation. In support of this expression of cell cycle regulator genes (mRNA) declined with age (Drummond et al., 2011). There have been recent advances in high throughput proteomic analysis of skeletal muscle allowing global profiling of peptides and proteins. These studies have demonstrated the switch to slow twitch aerobic fibres, reductions in heat shock proteins, alterations in phosphoproteins involved in mitochondrial metabolism and the cytoskeleton (Doran et al., 2009). 85 1.8.9. Potential Therapies for Sarcopenia 1.8.9.1. Exercise Interventions in Sarcopenia Disuse has been proposed as a contributor to sarcopenia of age, with healthy elderly subjects experiencing a 3-‐fold increase in muscle loss observed during bed rest compared to young individuals (Paddon-‐Jones and Rasmussen, 2009). Disuse stimulates pathways that are active in muscle atrophy of other aetiologies, involving UPS, myostatin and NF-‐κB signaling (Chopard et al., 2009). Exercise interventions have been assessed as therapeutic strategies to combat sarcopenia. Fiatarone et al (1994) found that high intensity resistance training over 10 weeks in 100 frail nursing home residents resulted in increases in strength, walking speed, stair climbing power and cross-‐sectional thigh-‐muscle area compared to a group receiving no exercise intervention. A Cochrane review (Liu and Latham, 2009) of the effects of progressive resistance training (PRT) in elderly people assessed 121 RCTs (n=6700), and found evidence of large increases in muscle strength, modest to large effects on getting out of a chair, and modest improvements in gait speed. Adverse events were poorly recorded, but appeared to be rare. Peterson et al (2011) performed a meta-‐analysis of 49 studies (n=1328) and found that resistance exercise is effective at increasing lean body mass in elderly individuals, although this effect reduced with increasing age. Some studies have studied gene expression changes following exercise intervention in elderly subjects. There is evidence that baseline expression of myogenic genes is increased with age at baseline, and that there is further upregulation in response to resistance exercise (Raue U et al J Appl Physiol 2006). Expression of E3-‐ubiquitin ligases are increased in response to exercise (Raue et al., 2007). Melov et al (2007) observed increases in strength 86 along with attenuation of age-‐associated changes in mitochondrial gene expression following a 6 months of resistance training. However some studies have shown that elderly muscle is resistant to exercise induced gene expression changes (Dennis et al., 2008). Exercise appears to be of benefit with ageing, however further research is required to refine the intervention to ensure compliance, provide optimum benefits on strength, and functional abilities whilst reducing adverse events. 1.8.9.2. Future Perspectives for Sarcopenia Therapy Phase II trials are being carried for novel compounds to treat and prevent sarcopenia and consensus criteria for outcomes in such studies are being decided (Chumlea et al., 2011, Papanicolaou et al., 2013). Clinical trials to date have focused on diet, exercise, anabolic and hormone supplementation. Potential therapeutic targets relate to our increased knowledge of pathways regulating sarcopenia with potential for modulation of inflammatory pathways, the UPS, myostatin, and pre-‐receptor glucocorticoid metabolism (Landi et al., 2013a, Landi et al., 2013b). 1.9. Summary Endogenous Cushing’s syndrome is associated with an early death when untreated, although studies to date report normalization of survival when biochemical ‘cure’ is achieved. Unfortunately however, there is evidence of persisting cardiovascular disease risk on long-‐term follow up, even in ‘cured’ patients. There are similarities between the body composition (central obesity, muscle atrophy, osteoporosis, skin thinning) and chronic disease (Type 2 87 Diabetes, Hypertension and CVD) phenotypes of Cushing’s and ageing. In particular GC-‐induced myopathy and age-‐related sarcopenia appear to share some common mechanistic pathways. Sarcopenia is associated with falls, functional decline, and increased mortality, and currently has no effective treatment. Previous studies have demonstrated that 11β-‐HSD1 expression/activity, which yields cortisol from cortisone, is increased with age in tissues including bone, brain and skin and may contribute to the aged phenotype. Expression/activity of 11β-‐HSD1 has been demonstrated in skeletal muscle, but has not been assessed with human ageing. In addition transgenic mice with global 11β-‐HSD1 KO are protected from an adverse metabolic profiles associated with stress and obesity, however their aged muscle phenotype has not been assessed. The advent of selective 11β-‐HSD1 inhibitors provides a novel potential therapeutic avenue for age-‐related diseases including sarcopenia. 1.10. Hypotheses 1. Cushing’s disease is associated with persisting excess mortality, body composition and cardiovascular disease risk profiles in spite of biochemical cure (Chapter 3). 2. GC myopathy is associated with similar gene expression changes to age related sarcopenia in mice (Chapter 5). 3. Modulation of pre-‐receptor GC metabolism by selective inhibition (in vitro) or transgenic knockout (mouse in-‐vivo) of 11β-‐HSD1 results in attenuation of muscle atrophy gene changes and protection against age-‐ related sarcopenia (Chapters 4 and 5). 4. 11β-‐HSD1 skeletal muscle gene expression and global enzyme activity are 88 increased with age in humans and are correlated with adverse phenotypic features of ageing such as (sarcopenia, dynapenia, fat mass, adverse metabolic profile markers) (Chapter 5 and 6). 1.11. Thesis Aims 1. To assess whether mortality persists in a clinical cohort of Cushing’s disease patients following surgical treatment, and whether clinical features such as obesity or hypertension resolve over follow up (Chapter 3). 2. To identify genes involved in GC-‐induced muscle atrophy using a cell culture model, and to assess the role of inhibition of 11β-‐HSD1 (Chapter 4). 3. To identify GC-‐induced atrophy genes in wild-‐type mice and to investigate whether these genes also change with age (Chapter 5). 4. To confirm expression of 11β-‐HSD1 in skeletal muscle. In particular, to assess the role of 11β-‐HSD1 gene knockout on muscle strength and size, along with atrophy gene profiles (Chapter 5). 5. To perform a comprehensive assessment of 11β-‐HSD1 skeletal muscle gene expression and global enzyme activity and relationships with strength and body composition in a cross-‐sectional human ageing study (Chapter 6). 89 Chapter 2 – General Methods 90 2.1. C2C12 Cell Culture 2.1.1. C2C12 Cell Line C2C12 myotubes were used to study mechanisms of GC-‐mediated skeletal muscle wasting and the role of 11β-‐HSD1. The C2 line of cells originated from the thigh muscles of young C3H mice, following an experimentally induced crush injury. Cultures were prepared 70 hours following injury, with selective serial passage of myoblasts (Yaffe and Saxel, 1977). The cell line has been used previously within the group to study 11β-‐HSD1 and subsequently developed protocols have been adhered to (Morgan et al., 2009). 2.1.2. Proliferation Frozen cells (Catalogue No: 91031101) were obtained from “European Collection of Cell Cultures (ECACC)” (Salisbury, UK). Cells were cultured in 12ml high glucose Dulbecco’s modified eagle medium (DMEM) (D5671) (Sigma-‐Aldrich, Dorset, UK) supplemented with 10% Foetal Calf Serum (FCS) in 75cm2 TC flasks (Greiner Bio-‐One, Frickenhausen, Germany), at 37°C in a humidified atmosphere with 5% CO2. At 70% confluence cells were split by agitating the flask after addition of 2ml Trypsin-‐EDTA solution (Sigma, Dorset, UK), and placed in fresh flasks. Proliferation media was changed every 2 days at 37°C. For experiments, cells were split as above at 1:4 dilution, with 1ml/well transferred into 12-‐well TC plates and incubated until 70% confluent (Greiner Bio-‐One, Frickenhausen, Germany). 91 2.1.3. Differentiation Cells were differentiated at 70% confluence using DMEM supplemented with 5% Horse Serum. Prior to this proliferation media was removed and wells were washed with serum free DMEM warmed to 37°C. Differentiation media was changed every 2 days, by 7 days cells had fully differentiated into myotubes as confirmed morphologically. 2.1.4. Freezing Down Cells Cells grown in 75cm2 TC flasks were trypsinised, as above when they reached 70% confluence. They were re-‐suspended in 10ml of proliferation media and centrifuged at 1000g for 10 minutes. Proliferation medium was aspirated and the pellet was re-‐suspended in 3ml FCS supplemented with 10% DMSO. The cell suspension was aliquoted into 1.5ml cryovials, which were placed in a “Cryo Freezing container” (Nalgene, Hereford, UK) containing isopropanol and frozen at a rate of 1°C per minute. The cells were kept in liquid nitrogen for long-‐term storage. 2.2. RNA Extraction 2.2.1. Principles The one-‐step protocol described by Chomcynski and Sacchi (1987) was used to extract RNA from cultured cell monolayers, mouse tissue explants, and human biopsy specimens. This method uses TRI-‐reagent® (Sigma-‐Aldrich, Dorset, UK), which is a mono-‐phasic solution containing phenol and guanidine thiocyanate, which rapidly inhibits RNAase activity. Cell monolayers were lysed and tissue specimens homogenized in TRI-‐reagent®. The resulting homogenate was then 92 separated into aqueous and organic phases using chloroform and centrifugation and RNA was precipitated using isopropanol. 2.2.2. Method Culture medium was removed from cell monolayers, which were then washed in PBS prior to incubation for 5 minutes with 1ml TRI-‐reagent® per well. Cells were removed from the surface of wells and lysed using the tip of a P1000 pipette. Approximately 20mg of tissue explants and biopsy specimens were taken and homogenised in 1ml of TRI-‐reagent® in a cell culture hood. All lysates were transferred to 1.5mL eppendorf tubes and 200μl of chloroform was added. Tubes were shaken vigorously for 20 seconds and incubated at room temperature for 30 minutes. Samples were centrifuged at 12000G for 15 minutes at 4°C. The clear aqueous phase was transferred to a fresh, labelled eppendorf tube and 200μl isopropanol was added. Tubes were inverted and incubated at room temperature for 15 minutes prior to being centrifuged at 12000G for 30 minutes at 4°C. The supernatant was removed with care was taken not to disrupt the pellet, which was washed twice in 70% ethanol and centrifuged. Ethanol was fully aspirated and the RNA was re-‐suspended in 30μl nuclease free water. RNA was quantified using a NanoDrop ND-‐1000 UV Spectrophotometer (Thermofisher, Surrey, UK). 1.5μl of RNA solution was analysed at 260 and 280nm to determine the level of protein contamination, and only samples with OD260/OD280 ratios of between 1.8-‐2.0 used. 1 OD260 was taken as equalling 40μg of RNA. RNA integrity was determined by agarose gel (1%) electrophoresis with 0.15μg/ml ethidium bromide allowing visualisation under ultraviolet light. 2 93 clear bands corresponding to 28S and 18S rRNA are observed when RNA is non-‐ degraded. 2.3. Reverse Transcription (RT) Reaction 2.3.1. Method This method was performed using the high capacity RT kit from Applied Biosystems (Warrington, UK). The x2 RT mastermix was made up in an eppendorf using the reagents in the proportions shown in Table 2-‐1. Reagent Volume per sample (µl) 10x RT buffer MgCl2 (25nM) dNTPs (10mM) Random Hexamers RNAase inhibitor Multiscribe Reverse Transcriptase Volume (RNA + Nuclease Free water) Final Reaction Volume 2.0 4.4 4.0 1.0 0.4 1.2 7.0 20 Table 2-‐1: Reverse Transcriptase Reaction Volumes 1μg of RNA was diluted with nuclease free water to a volume of 7μl and added to 13μl of x2 RT Mastermix in a PCR tube to give a final volume of 20μl. The reaction tubes were placed in a thermal cycler (Applied Biosystems, Warrington, UK) for incubation at 25°C for 10 minutes (denaturation/annealing stage), 48°C for 30 minutes (transcription) and 95°C for 5 minutes (inactivation). 94 2.4. Conventional Polymerase Chain Reaction (PCR) 2.4.1. Method Conventional PCR was performed using a kit from Promega (Southampton, UK). A mastermix was made up in an eppendorf in the proportions shown in table 2-‐ 2. Reagent 5x PCR buffer MgCl2 dNTP Forward primer Reverse primer Taq polymerase Nuclease Free Water cDNA Final Reaction Volume Volume (µl) 4 1.6 0.5 1.0 1.0 0.1 10.8 1 20 Table 2-‐2: Conventional PCR Reaction Volumes Each 20µl reaction mixture was made up in a PCR tube, and placed in a thermal cycler (Applied Biosystems, Warrington, UK) set at 95°C for 5 minutes (initiation), followed by 20 cycles at 94°C for 30 seconds (denaturation), 60°C for 30 seconds (annealing) and 72°C for 30 seconds (elongation), and a final 72°C stage for 7 minutes (final elongation). 2.5. Relative Quantitative (Real Time) PCR 2.5.1. Method This was performed using Applied Biosystems reagents and expression assays (Applied Biosystems, Warrington, UK). 18s rRNA was used as a house keeping gene for singleplex analysis. Reactions were performed in duplicate using 96-‐ 95 well plates (Applied Biosystems, Warrington, UK). Reaction mixtures for 18S and target genes were made up in the proportions as shown in Table 2-‐3. For 18S VIC labelled probes were used, whilst FAM labels were used for target genes. Plates were sealed with a clear adhesive film and analysed on a 7500 Real-‐time PCR machine (Applied Biosystems, Warrington, UK). Data were expressed as Ct and ΔCt values as outlined previously, and arbitrary units (AU) [AU = 1000x(2-‐ ΔCt)] and fold-‐change [fold-‐change = 2-‐ΔΔCt] values were calculated. 2x Taqman® Universal PCR Mastermix Primers and Probes Water cDNA sample Final Reaction Volume Volume (µl) 5 0.5 3.5 1 (100ng) 10 Table 2-‐3: Real-‐time PCR Reaction Volumes 2.6. Microfluidic Gene Expression Analysis The Biomark™ system (Fluidigm, San Francisco, California, US) was used to perform a high-‐throughput targeted gene expression array of up to 92 genes using Real-‐time PCR technology available in-‐house. The system uses a single use dynamic array integrated fluidic circuit (IFC), which allows analysis of 96 samples using 96 assays, in up to 9216 separate reactions by utilizing an automated network of channels and valves. An IFC Controller is used to prime and load the dynamic array IFC, and the Biomark™ HD Reader is used to perform Real-‐time PCR. Manufacturers protocols were adhered to. Genes were selected following an extensive literature review and covered a range of functions (including glucocorticoid metabolism/signalling, anabolic hormone signalling, 96 negative growth regulation, proteolysis, protein synthesis, cell cycle regulation, DNA repair, apoptosis, inflammation, and mitochondrial function and energy metabolism). 2.6.1. Method Specific target amplification was performed using 2.5µl 2x Taqman® PreAmp mastermix (Applied Biosystems, Warrington, UK), 1.25µl of pooled Taqman® gene expression assay mix (1µl/assay combined with 4µl x1 TE buffer (Fluidigm, San Francisco, California, US), 0.2x final assay concentration) and 1.25µl cDNA, making a final volume of 5µl. The reactions were mixed by vortexing and brief centrifugation before being placed in a thermal cycler (Applied Biosystems, Warrington, UK) programmed to heat to 95°C for 10 minutes, followed by 14 cycles of 95°C for 15 seconds and 60°C for 4 minutes. Samples were then diluted 1:5 with 20µl of 1x TE buffer (Fluidigm, San Francisco, California, US). Sample mixtures were prepared in a 96 well PCR plate with 2.7µl of pre-‐amplified cDNA, 3µl of Taqman® Universal PCR Mastermix (2x) (Applied Biosystems, Warrington, UK), and 0.3µl of GE loading reagent (Fluidigm, San Francisco, California, US). Assays were also prepared in a 96 well PCR plate with 3µl of 20x Taqman® Gene Expression Assay (Applied Biosystems, Warrington, UK) and 3µl of 2x Assay Loading Reagent, making a final concentration of 9µM for primers and 2µM for probes. The Dynamic Array IFC was then injected with control line fluid from a pre-‐filled syringe (Fluidigm, San Francisco, California, US) and primed using the IFC Controller. 97 5µl of each sample and assay were pipetted into their respective inlets on the IFC, which was then returned to the IFC controller where the Load script was ran. The IFC was then loaded onto the Biomark™ HD Reader (Fluidigm, San Francisco, California, US) for Real-‐time PCR and analysis. ΔCt values were generated as described using 3 housekeeping genes (18S, Cyclophilin B, and HPRT)(Representative plot shown in Figure 2-‐1). Figure 2-‐1: Representative Amplification plot following Real-‐time PCR protocol on Biomark™ HD Reader. 2.7. Statistical Analysis Prism for Mac Version 5.0 (La Jolla, California, US) was used to perform statistical analysis. For PCR data, statistical tests were performed on ∆Ct values only. Comparisons between multiple treatments, doses or times were analysed using one-‐way analysis of variance (ANOVA). If normality tests failed, non-‐ parametric tests were used. Continuous data were expressed as means and standard deviations (or standard errors) if normally distributed and medians and interquartile ranges if non-‐parametrically distributed. The threshold for statistical significance was set at P<0.05. 98 Chapter 3 – Long-‐term Outcomes in Patients with Cushing’s Disease treated with Transsphenoidal Surgery 99 3.1. Introduction Harvey Cushing reported a grave prognosis (4.6 year median survival) in the original case series describing his eponymous syndrome (1932). The condition is underpinned by an adverse metabolic profile (dyslipidaemia, insulin resistance and hypertension) and dramatic changes in body composition (muscle atrophy, osteoporosis and central obesity)(Fernandez-‐Rodriguez et al., 2009). The past 80 years have seen great improvements in the prognosis of Cushing’s disease (CD), largely due to effective therapies such as transsphenoidal surgery (TSS) (Sherlock et al., 2010). Historically wide variations in post-‐TSS remission rates were seen between centres (between 10-‐100%), with the best results occurring in specialized centres with dedicated surgeons (Burch, 1983). Modern surgical series have suggested that biochemical remission of hypercortisolaemia normalizes mortality to that of the background population, whilst active disease is associated with ongoing excess risk of between x3-‐5-‐fold (Swearingen et al., 1999, Pikkarainen et al., 1999, Hammer et al., 2004). Conversely since the turn of the century, evidence has mounted that clinical features including skeletal muscle atrophy, osteoporosis, truncal obesity, health-‐related quality of life and cardiovascular risk markers continue to manifest after biochemical cure of CD (Colao et al., 1999, Pirlich et al., 2002, Faggiano et al., 2003, Lindsay et al., 2006, Barahona et al., 2009b, Barahona et al., 2009a, Geer et al., 2012). In this context we assessed long-‐term outcomes of CD following TSS in a large cohort of patients managed in our centre (Queen Elizabeth Hospital Birmingham) over 2 decades, with surgery performed by Mr Alan Johnson and endocrine management led by Professor Paul Stewart. 100 3.2. Hypothesis Our central hypothesis is that although biochemical cure of CD dramatically improves clinical features and mortality, long-‐term effects persist. 3.3. Study Aims Studying outcomes and mortality in this large cohort of patients provides an opportunity to improve the post-‐surgical management of this rare condition. In addition it enables us to study Cushing’s disease as a paradigm for the ageing process by assessing the long-‐term effects of excess GC exposure, on body composition (obesity, osteoporosis), and adverse metabolic parameters (insulin resistance, hypertension, dyslipidaemia). Our aims were: 1. To assess surgical performance by determining initial remission, long-‐ term cure and complication rates. 2. To assess mortality in the group overall, as well as in long-‐term cure, recurrent and persistent disease subgroups. 3. To assess the effects of disease remission on resolution of clinical features including blood pressure (BP) and body mass index (BMI). 4. To assess prevalence of clinical features at diagnosis that, have links to the ageing phenotype including myopathy, osteoporosis, obesity, diabetes mellitus, dyslipidaemia and hypertension. 101 3.4. Subjects and Methods 3.4.1. Subjects and Data Collection All patients with CD (n=80) who underwent TSS at our centre as first-‐line therapy (Queen Elizabeth Hospital Birmingham) between 1988-‐2009 were identified from surgical lists of our dedicated surgeon. Median age at diagnosis was 40 years (IQR 31-‐50), with women outnumbering men 3.7 to 1. Median post-‐surgical follow up was 5 years (IQR 2-‐10) for clinical data and 11 years (IQR 5-‐16) for mortality. Microscopic TSS (n=58) was routine until 2005, when the endoscopic approach was introduced (n=14). Case notes and full clinical follow up data were obtained in 72 patients, where notes were unavailable (n=8) patients were included in a National Health Service (NHS) electronic-‐registry search for mortality only (see Figure 3-‐1). Clinicians responsible were contacted to obtain most recent clinical information in patients whose follow up was carried out in other units (n=14). Mortality status as of 29th November 2010 was recorded following registry searches and death certificates were obtained to establish causes of death. 102 Figure 3-‐1: Study Flowsheet and Treatment Outcome Groups. Review of surgical lists identified 80 patients with CD treated by TSS. Information on clinical features, test results and outcomes were recorded using a standardized proforma. Patients were assigned to outcome groups according to biochemical criteria. (Adapted from Hassan-‐Smith et al (2012)) 3.4.2. Diagnostic Criteria CD was diagnosed in the Endocrinology Department of Queen Elizabeth Hospital Birmingham using standardized local protocols. Biochemical tests used included Urinary Free Cortisol (UFC), serum ACTH and diurnal cortisol measurements; low and high dose dexamethasone suppression tests, and the CRH-‐test (See Table 3-‐1). Pituitary Computerized Tomography (CT) was superseded by Magnetic Resonance Imaging (MRI) in 1992 (CT n=16, MRI n=56). Films were reported by Specialist Neuroradiologists, and reviewed by both Surgeons and Endocrinologists in a joint clinic and from 2008, a multidisciplinary team meeting. Where results were discordant inferior Petrosal Sinus Sampling (IPSS) was performed prior to first TSS (n=13). 103 Test Screening Tests 24 hour UFC Overnight DST (1mg) LDDST (2mg/48h) Midnight Serum Cortisol Differential Diagnostic Tests HDDST (4mg/48h) CRH-‐test IPSS MRI Proportion of Cases with Positive Results Definition of Positive Result 100% 93% 100% 100% >350nmol/24h Serum Cortisol >50nmol/L Serum Cortisol >50nmol/L >50nmol/L 40% 77% 100% (13/13 completed) Serum Cortisol <50nmol/L >50% increase in serum ACTH Central-‐to-‐peripheral gradient = 2:1 unstimulated; and = 3:1 stimulated Evidence of pituitary adenoma 76% Table 3-‐1: Diagnostic Tests and Proportion of Cases with Positive Results 3.4.3. Baseline Clinical Features Baseline outpatient clinic tests were assessed to characterize the cohort, however baseline clinical features were not systematically recorded, so this data is not presented. Electrocardiogram (ECGs) abnormalities were common (22% of patients), consisting of left ventricular hypertrophy and ischaemic changes. DEXA bone densitometry analysis revealed evidence of osteopenia in 33% of assessed cases and osteoporosis in 22%, compared to 33% who had previously been given a clinical diagnosis of osteoporosis. Unfortunately due to the retrospective nature of the study full body composition analysis data was unavailable. Hypokalaemia was present in 6% of cases and in association with increased UFC levels. 104 3.4.4. Surgical Approach The primary surgical aim was complete adenoma resection with preservation of normal tissue. When a suspected adenoma was identified at surgery, it was resected with a thin rim of neighbouring tissue to ensure clear histological margins. Pre-‐operative MRI was used to lateralize tumor and guide the initial site of surgical exploration. If a surgical target was absent from MRI, full pituitary exploration was carried out, with the suspected adenoma removed if identified. If search for adenoma was unsuccessful, approximately 70-‐90% of the gland was resected. 3.4.5. Biochemical Outcomes: Definitions Patients were categorized into ‘Initial Remission’ or ‘Persistent Disease’ groups as defined by a biochemical definition of outcome following TSS. A post-‐ operative morning cortisol level of <50nmol/L (measured up to 6 weeks post-‐ operatively) defined initial remission, with failure of this defining persistent disease. Patients achieving initial remission were further categorized into long-‐ term outcome groups of ‘Cure’, ‘Recurrent Disease. Patients were defined as ‘cured’ if they attained resolution of hypercortisolism with a single surgery that lasted throughout subsequent follow up, requiring no further treatment. Recurrent disease was defined biochemically by raised UFC or failure of dexamethasone suppression following initial remission. 3.4.6. Statistical Analysis of Mortality Mortality was expressed using standardized mortality ratios (SMR) calculated as the ratio of observed to expected deaths (Breslow and Day, 1987). Estimates of expected deaths were derived by multiplying age, calendar year, and sex 105 stratum-‐specific mortality for the background population of England & Wales by the corresponding person-‐years at risk among the Cushing’s disease cohort. Overall survival by clinical follow-‐up was estimated by Kaplan-‐Meier curves. A multivariable Cox regression model with attained age as the time metric was utilised to derive hazard ratios (HRs) for sex and age (analysis refers to diagnosis and follow up age <40 year vs. >=40 years). P<0.05 was taken as the threshold for statistical significance. Statistical advice was provided by Dr. Raoul Reulen Senior Lecturer in the School of Health and Population Sciences at the University of Birmingham. 3.4.7. Ethical Opinion This study involved no intervention or alteration in individual patient management and was entirely retrospective. For these reasons it was registered and approved by the University Hospitals Birmingham Clinical Audit Department. 3.5. Results 3.5.1. Treatment Outcome following Transsphenoidal Surgery Initial remission was achieved in sixty of the 72 patients (83%) with full clinical details available (See Figure 3-‐1). Fifty-‐two out of 72 patients (72%) achieved ‘Cure’, twelve (17%) had ‘Persistent disease’, and eight (11%) had ‘Recurrent disease’. Median time to disease recurrence was 2 years (IQR 1-‐3 years). There was no difference in ‘initial remission’ numbers in those who underwent TSS between 1988-‐1999 and 2000-‐2009 (27 out of 34 = 79%, 33 out of 38 = 87% respectively p = 0.53, using Fisher’s exact test). All cases undergoing endoscopic 106 TSS achieved cure, however the median follow up period was only 25 months (IQR 18-‐39). Second-‐line therapies for active disease included repeat TSS (n=16), bilateral adrenalectomy (n=9), and radiotherapy (RT) (n=8). Taking into account all treatments, only one patient in the group as a whole had active disease at final follow up, with all others achieving remission. 3.5.2. Resolution of Clinical Features following Transsphenoidal Surgery 3.5.2.1. Hypertension Fifty-‐six of 72 patients (78%) had arterial hypertension at baseline, and of these thirty-‐seven had been prescribed anti-‐hypertensives. Eleven (30%) of these patients reduced their medications within the 6 post-‐operative weeks and twelve patients of 37 (32%) discontinued their anti-‐hypertensives. Median systolic and diastolic blood pressures declined from diagnosis to 6 weeks post-‐ operatively to final follow up. There was no difference between blood pressure at 6 weeks and final follow up (see table 3-‐2). 3.5.2.2. Body Mass Index (BMI) Median BMI for the overall group was in the obese range (30.4 kg/m2 (IQR 26.6-‐ 35.0)) at baseline. This value declined significantly 6 weeks following surgery and this was sustained at the final clinic visit (see table 3-‐2). 107 BMI (kg/m2) SBP (mmHg) DBP (mmHg) Diagnosis 30 (27-‐35) 150 (130-‐162) 90 (80-‐100) 6 weeks post-‐TSS 29 (27-‐34) 124 (110-‐150) 80 (76-‐90) Final Follow up 130 (116-‐140) 82 (76-‐86) 27 (23-‐32) Table 3-‐2: Resolution of Body Mass Index and Blood Pressure following Transsphenoidal Surgery (TSS). Medians and Interquartile Ranges (IQRs) shown. Reductions in body mass index (BMI) (P=0.006 and P=0.0004), systolic blood pressure (SBP) (Both P<0.0001) and diastolic blood pressure (DBP) (Both P<0.0001) were seen at 6 weeks and at final follow up. Adapted from Hassan-‐ Smith et al (2012). 3.5.3. General Post-‐Operative Complications Common complications of surgery included transient diabetes insipidus (DI) (35%), CSF leak (11%), whilst meningitis (n=3), sinusitis (n=2), septal perforation (n=1) and blocked lacrimal ducts (n=1) were also reported. Recorded complication rates did not differ between Endoscopic and Microscopic approaches. 3.5.4. Endocrine Complications Although there were limited data on pre-‐operative hypopituitarism, frequencies of 11% (4 out of 38) for TSH deficiency and 17% (7 out of 41) for gonadotrophin deficiency were recorded. Post-‐operatively all patients were prescribed hydrocortisone replacement (median dose 30mg/day, IQR 30-‐30mg for cured and persistent/recurrent disease groups, p=0.98) with patients having reassessment of the HPA-‐axis on an outpatient basis. Of the patients achieving cure (n=52), HPA axis recovery was observed in 23 (44%) patients over the follow up period. Overall 16% of patients achieved the optimal surgical outcome of cure at 1st surgery with intact endocrine function, although the largest 108 outcome group (53%) was made up of those cured at the expense of hypopituitarism (See Table 3-‐3a). Results for ACTH status by group followed a similar pattern (See Table 3-‐3b). a) Disease Outcome Cure Persistent/Recurrent b) Disease Outcome Cure Persistent/Recurrent Pituitary Function Deficient Intact 16% 3% 53% 28% ACTH Status Deficient Intact 21% 12% 48% 19% Tables 3-‐3: (a) Pituitary Function and (b) ACTH Status, at final follow up according to Cushing’s Outcome Group. 16% of patients achieved the most favourable outcome of normal pituitary function and cure of Cushing’s, compared to 53% with cure and hypopituitarism, 3% Persistent/Recurrent Disease and normal pituitary function and 28% with Persistent/Recurrent Disease and hypopituitarism. Results for ACTH status were 20% (Cure/ACTH intact), 48% (Cure/ACTH deficiency), 11% (Persistent/Recurrent Disease/ ACTH intact), and 19% (Persistent/Recurrent Disease/ ACTH deficient). Differences between groups were non-‐significant (P=0.58, P=0.32 respectively) 3.5.5. Mortality Following Transsphenoidal Surgery Thirteen deaths occurred over follow up (median duration, 11 years), five in the ‘Cure’ group, two with ‘Recurrent disease’ group, two with ‘Persistent disease’ and four with NHS registry data available only. Causes of mortality according to death certificates included “CV disease” (n=8), “malignancy” (n=3), “infective disease” (n=1) and “Cushing’s” itself (n=1). SMR for the group as a whole was 3.17 (95% CI, 1.70-‐5.43; 13 observed deaths vs. to 4.10 expected)(see Table 3-‐4). When patients were divided into Cushing’s outcome groups, SMR for ‘cured’ patients was 2.47 (95% CI: 0.80-‐5.77), compared to 4.12 (95% CI: 1.12-‐10.54) for Recurrent/Persistent disease. Kaplan Meier Analysis was performed for the 109 total group and treatment outcome groups, and revealed a trend towards earlier death for those with persistent/recurrent disease vs. cured patients however this did not reach statistical significance. Median age at death was 57 years (IQR 57-‐64), with an increased risk of death for women (relative risk (RR) = 4.5 (95% CI 0.58-‐34.54)). Observed Deaths Overall 13 Persistent /Recurrent 4 Disease Cure 5 Expected SMR Deaths 4.10 3.17 95% CI P value 1.70-‐5.43 <0.001 0.97 4.12 1.12-‐10.54 0.34 2.02 2.47 0.80-‐5.77 0.03 Table 3-‐4: Mortality by Cushing’s Disease Outcome Group. The overall standardized mortality ratio (SMR) was 3.17, calculated according to the 13 observed deaths compared to 4.10 as would be expected in the background population. There was no difference in age between the cure and persistent/recurrent disease groups, median age 41 years (IQR 29-‐51) vs 39 years (IQR 32-‐50) respectively, p=0.96. Adapted from Hassan-‐Smith et al (2012) 3.5.6. Prognostic Indicators Logistic regression analysis, with models adjusted for age at diagnosis, gender, and age at final follow up, was used to identify prognostic indicators of cure. Factors assessed included ACTH positive histology (odds ratio (OR): 4.4 for cure, 95% CI: 1.3-‐15.3, p=0.015), pre-‐operative UFC <1000nmol/24 hours (OR: 3.6, 95% CI: 0.9-‐14.1, p=0.05), systolic blood pressure (OR: 1.0, 95% CI: 0.3-‐3.3 N/S) surgical target on MRI (OR: 1.9, 95% CI: 0.5-‐7.6, N/S). 3.6. Discussion With 80 subjects, this is currently the largest UK study examining long-‐term outcomes and mortality in CD following TSS. In addition the follow up duration for mortality is only surpassed by one study, which included historical data from 110 as far back as 1960 (Clayton et al., 2011). Having a relatively large cohort of subjects with a rare disease, operated on by a single surgeon with standardized Endocrine care, provides a valuable opportunity to add to our knowledge of the long-‐term effects of endogenous GC excess and impact on patient care. Our treatment outcomes compare favourably with those reported in the literature from world leading specialist centres, with ‘Initial Remission’ ‘Persistent Disease’, and ‘Recurrent Disease’ rates of 83%, 17% and 13% respectively. These compare to rates of between 65-‐90%, 10-‐24%, and 5-‐22%, respectively in the literature (Lindholm et al., 2001, Yap et al., 2002, Hammer et al., 2004, Atkinson et al., 2005, Dekkers et al., 2007, Clayton et al., 2011). Median time to recurrence was also within the range reported by previous studies (20 and 84 months) (Pereira et al., 2003, Esposito et al., 2006). Our cure rates following 1st surgery (72%) are at the top end of those previously described (56-‐72%). It should also be noted that although patients were categorized into “Cure”, “Persistent” and “Recurrent Disease” groups for analysis, almost all (98%) were in disease remission at final follow up. Whilst our initial remission and long-‐term cure rates are favourable, the optimal outcome of CD therapy also involves preservation of pituitary function, and this was achieved in 16% of patients at first surgery. Our rates of TSH (33%), LH/FSH (29%), and GH deficiencies (29%) over follow up, are comparable to an earlier report from a specialist centre in the Netherlands (TSH 32%, LH/FSH 30%, GH 32%) (Dekkers et al., 2007). However our rates of hypopituitarism of any degree (71%) and ACTH deficiency in particular (57%) are in the upper end of the range 111 described in the literature (37-‐59%) (Rees et al., 2002, Dekkers et al., 2007). We could speculate that this is secondary a number of factors such as aggressive pursuit of cure, prolonged use of GC treatment, improved recognition of GH deficiency compared to historical series or limited clinical follow up (Cavagnini et al., 2008). This study demonstrates significant increases in TSH and LH/FSH deficiencies in those with recurrent and persistent disease, suggesting that the aggressive approach taken in these patients may play a role. Surgical complications were comparable to those reported in the literature with transient DI and post-‐operative CSF leak the most prevalent (transient DI 6-‐58%, CSF leak 2-‐13%) (Prevedello et al., 2008). The classical clinical phenotype of CD involves altered body composition consisting of sarcopenia, osteoporosis, thinning of the skin, fatty liver and visceral obesity; major morbidity and mortality resulting from CV disease (Souverein et al., 2004, Clayton et al., 2011). The elevated cardiovascular disease risk seen in CD, is largely mediated by arterial hypertension and features of the metabolic syndrome. This area was recently reviewed by Pimenta et al (2012), who also highlighted the potential effects of mineralocorticoid receptor activation in GC excess in mediating renal and cardiac damage. Interestingly in our study hypokalaemia was present at a frequency of 6%, which is indicative of the state of apparent mineralocorticoid excess induced by saturation of 11β-‐ HSD2, which is commonly seen with the high cortisol production rates of ectopic ACTH secretion (Stewart et al., 1995). Mineralocorticoid receptor activation, and pre-‐receptor GC regulation provide targets that may prove to be of benefit in reducing cardiovascular risk in Cushing’s. 112 As outlined in the introduction, despite biochemical cure of CD resulting in marked improvements in clinical features, there is growing evidence of persisting abnormalities. However much of this data is limited by small sample sizes and durations of follow up, so evidence from larger studies is much needed. We were able to extract information retrospectively on resolution of BMI and hypertension between base line, 6 weeks post-‐operatively and at final follow up. It was striking that improvements in blood pressure, were both rapid in onset and sustained long-‐term. In addition a more gradual reduction in median BMI was observed, from the obese range to the middle of the overweight range by final follow up. A raised BMI post CD cure, may contribute to the persisting excess CV risk as observed by Colao et al (1999). Patients who were biochemically cured of CD for 5 years were found to have increased prevalence of obesity, hypertension, insulin resistance, dyslipidaemia and atherosclerosis compared to the background population. Furthermore increased CV risk was highly correlated with insulin resistance and waist-‐hip-‐ratio, a measure of central obesity. In recent years, several studies have investigated body composition changes and CV disease risk during following effective treatment of Cushing’s, and have provided evidence of a legacy effect in the aftermath of disease. Geer et al (2012) showed that CD remission resulted in reductions in all fat depots, and a further decline in skeletal muscle mass 6 months after stopping GC replacement. Pirlich et al (2002) performed a prospective study of Cushing’s at baseline and 6 months post-‐operatively, with similar results. Potential mechanisms for the lack of improvement in skeletal muscle following CD cure include excessive GC replacement, with Geer et al reporting an inverse relationship between duration of exposure and skeletal muscle mass, loss of 113 anabolic drive due to GH or LH/FSH deficiencies, or reduced levels of activity. Barahona et al (2009a), followed up women for a mean of 11 years and found that those that were oestrogen deficient (due to menopause or gonadotrophin deficiency) had higher total and truncal body fat post remission of Cushing’s, compared women with pre-‐menopausal levels. Absence of oestrogen appears to have a profound effect on visceral fat deposition following cure of Cushing’s, although the mechanism of this has not been confirmed. Barahona et al (2009a) hypothesized that GC induced ‘hyperactivation’ of 11β-‐HSD1 in omental tissue stimulated differentiation of pre-‐adipocytes to adipocytes during active disease resulting in increased fat deposits that persist after cure. It is interesting to speculate that post-‐menopausal visceral obesity after cure of Cushing’s may be caused by an absence of the suppressive effects of oestrogen on 11β-‐HSD1 expression and activity, for which there is some evidence (Andersson et al., 2010, Yamatani et al., 2012). A finding that may be linked in our study is that female gender is linked to excess mortality (RR = 4.5) and visceral obesity in oestrogen deficient Cushing’s patients is a promising candidate mechanism. In addition, there are established gender differences in CD (Sherlock et al., 2010), including a female preponderance as seen in our study with a 3.7 to 1 ratio, this may be explained by oestrogen responsiveness of corticotroph adenomatous tissue (Chaidarun et al., 1998). Mortality is clearly increased in CD (Etxabe and Vazquez, 1994, Pikkarainen et al., 1999, Dekkers et al., 2007). The uncertainty relates to whether there is any long-‐term excess risk following effective biochemical cure using modern treatments. Several surgical series suggest that remission of hypercortisolism 114 results in normalization of mortality rates (Swearingen et al., 1999, Lindholm et al., 2001, Hammer et al., 2004), whilst active disease is associated with reduced survival, providing an evidence base for the aggressive pursuit of cure (Sherlock et al., 2010). As CD is a rare condition, conclusions are drawn from studies with limited sample sizes and subsequent deaths with durations of surveillance of under a decade (see Table 3-‐5). We report an excess mortality rate of >3-‐fold overall with a trend towards reduced ratios in patients achieving cure compared to those with recurrent or persistent disease, although this difference does not reach statistical significance. With an SMR of 2.47 (95% CI: 0.80-‐5.77), there may be an ongoing excess mortality even after cure of CD. First Author, N year (Ref) Period Initial of TSS Remission (%) Follow up No of SMR (months) deaths cure SMR Overall persistent/ SMR Recurrent disease N/A N/A 3.80 (2.5-‐ 17.9) N/A N/A 0.98 (0.44-‐ 2.2) N/A N/A 2.67 (0.89-‐ 5.2) 0.31 5.1 1.70 (0.7-‐ 3.5) 1.18 2.8 1.42 (N/S) (0.95-‐ 2.1) 1.8 4.38 2.39 (N/S) (1.2-‐3.9) Extabe 1994 49 88 56 5/49 Swearingen 1999 161 90 96 6/159 Pikkarainen 1999 63 34 84 6/43 Lindholm 2001 73 66 96 7/73 Hammer 2004 289 82 132 25/28 9 Dekkers 2007 74 80 120 12/74 Clayton 2011 60 90 180 13/60 3.3 16 4.80 (2.8-‐8.3) This Study 80 1975-‐ 1992 (17 y) 1978-‐ 1996 (18 y) 1981-‐ 1994 (13y) 1985-‐ 1995 (10 y) 1975-‐ 1998 (23 y) 1977-‐ 2005 (28 y) 1960-‐ 2009 (49 y) 1988-‐ 2009 (21 y) 83 132 13/80 2.47 4.12 3.17 (1.7-‐ 5.3) Table 3-‐5: Comparison of Studies Examining Remission Rates and Mortality for Cushing’s Disease Patients Post-‐Transsphenoidal Surgery (TSS). SMR = Standardized Mortality Ratio, N/A = Not Available, N/S = Non-‐significant. Adapted from Hassan-‐Smith et al (2012). 115 Data from Clayton et al (2011), which also had a long duration of follow up (median 15 years) support these findings with a SMRs overall of 4.8 (95% CI: 2.8-‐8.3), 13.8 (95% CI: 7.2-‐36.5) for CV disease, and 3.3 (95% CI: 1.7-‐6.7) in remission. Our cohort appeared to receive high quality specialist care as evidenced by the favourable remission and cure rates, along with evidence of improvements in blood pressure and BMI. However there was evidence of end-‐ organ cardiovascular effects including LVH by voltage criteria and myocardial ischaemia on ECG. Excess mortality could be iatrogenic in nature, stemming from treatment-‐induced hypopituitarism or non-‐physiological glucocorticoid replacement, however this study was not designed to assess this. In order to address these issues, large population based studies of mortality are required, coordinated nationally or internationally. Furthermore, long-‐term prospective studies of the cardiovascular effects of CD, involving detailed body composition and risk factor analysis, along with sampling of clinical tissues, are required in order to develop future treatment targets. Identification of prognostic factors for disease remission, such as ACTH positive histology and pre-‐operative UFC level as seen in this study, are important for patient counseling and risk stratification. Previously identified prognostic factors include age at diagnosis, presence of hypertension and diabetes (Clayton et al., 2011), post-‐operative serum cortisol (Esposito et al., 2006, Martino et al., 2007) and ACTH (Flitsch et al., 2003), ACTH response to CRH stimulation (Nishizawa et al., 1999), post-‐operative metyrapone (Alwani et al., 2010), desmopressin test (Losa et al., 2009), and low dose dexamethasone suppression (McCance et al., 1993), identification of adenoma intra-‐operatively, and positive histology as seen 116 in this study (Acebes et al., 2007, Martino et al., 2007). With regards the latter however, it is important to note that 60% of those with negative histology still achieved cure without need for revision (Pouratian et al., 2007). Our data are at odds with a recent study that appeared to suggest that positive pre-‐operative MRI findings were associated with a increased chance of achieving disease remission (Ciric et al., 2011), but in line with an earlier report (Salenave et al., 2004). In summary, this study comprises the UK’s largest cohort study of CD outcomes and mortality. Following preparation of this chapter the analyses outlined here have been published (Hassan-‐Smith et al., 2012). The centre’s initial remission and cure rates are similar to those seen in leading specialist centres internationally and highlight the importance of dedicated surgical and endocrine expertise and experience in the management of CD. Our results suggest that in spite of improvements in BMI and blood pressure post-‐operatively, there remains excess mortality after effective treatment of CD. Long-‐term management must be improved by aggressive risk factor reduction, prevention of iatrogenic illness, and generation of novel medical therapies. Prospective studies of CD with assessment of full body composition analysis, strength testing, protein turnover, 11β-‐HSD1 activity and skeletal muscle gene expression before and after treatment would provide insights into disease mechanisms and may highlight potential therapeutic targets. Furthermore centres should be encouraged to report their data on CD outcomes in order to generate sufficient statistical power for an effective meta-‐analysis. The effects of physiological replacement of hydrocortisone, reversal of oestrogen deficiency and use of 11β-‐ 117 HSD1 selective inhibitors should be investigated as strategies to prevent persisting visceral obesity, cardiovascular risk and mortality following biochemical control of CD. With regards the broader theme of this thesis involving the possible role of chronic GC exposure across the life span contributing to adverse features of the ageing phenotype, this study provides some useful insights. Our data on clinical features at diagnosis are reminiscent of an aged phenotype with muscle weakness, osteoporosis, obesity, dyslipidaemia, insulin resistance, hypertension and cardiovascular disease well represented. Furthermore the intriguing finding that female sex is associated with raised risk of mortality in CD indicates an important interplay between gender specific factors and GC exposure. This investigation serves to outline the effects of long-‐ term GC exposure, whose contribution to the ageing process via pre-‐receptor metabolism is investigated in subsequent chapters. 118 Chapter 4 – Characterisation of the Effects of Pre-‐Receptor Glucocorticoid Regulation on Muscle Atrophy Gene Expression in Skeletal Myotubes 119 4.1. Introduction Since Harvey Cushing’s seminal case series skeletal muscle atrophy (and proximal myopathy in particular) has become recognized as a key discriminatory feature of hypercortisolism. The dramatic effects of GCs on skeletal muscle, and current knowledge of molecular mechanisms involved was described in detail in chapter 1. To summarise, in addition to effects on carbohydrate and lipid metabolism, GCs act to reduce protein synthesis and promote myofibrillar degradation via activation of the major proteolytic systems. The UPS appears to be central in muscle atrophy caused by a range of aetiologies including GC excess (Lecker et al., 2004, Schakman et al., 2008). This is mediated by E3 ubiquitin ligases MAFbx/Atrogin1 and MuRF1, and transcription factors including FOXO1 and FOXO3a (Schakman et al., 2008). Inhibition of protein synthesis appears to be mediated largely via effects on IGF-‐I/Akt/PI3K and mTOR signaling. In addition, the negative growth factor myostatin is critical to GC-‐mediated atrophy in mice (Gilson et al., 2007). These genes, which are expressed in C2C12 myotubes, form the central atrophy targets that will be studied in this chapter. The clinical significance of GC signaling in muscle atrophy extends beyond the rare condition of endogenous Cushing’s Syndrome, to populations treated with exogenous steroids (Up to 1% total population and 2.5% of those aged 70-‐79 years) (Walsh et al., 1996, van Staa et al., 2000), to those with a range of acute and chronic diseases and potentially those with age-‐associated sarcopenia (in range of 5-‐30% of those aged >65 years)(Morley et al., 2001). Muscle atrophy is linked to disability, and reduced survival and currently has no effective pharmacological therapy (Baumgartner et al., 1998, Swallow et al., 2007, Kalantar-‐Zadeh et al., 2010). Selective 11β-‐HSD1 inhibition is a potential novel 120 therapeutic target in the treatment of muscle atrophy and other features of ageing. GCs are important mediators of muscle atrophy in a number of pathological states including starvation, sepsis and metabolic acidosis (Wing and Goldberg, 1993, Tiao et al., 1996, Smith et al., 2010, May et al., 1986). Furthermore 11β-‐HSD1 appears to be involved in the ageing process in a range of tissues including bone, brain and skin (Cooper et al., 2002, Seckl and Walker., 2004, Tiganescu et al., 2011). Whilst in recent years, knowledge of GC-‐regulated atrophy pathways has increased there is a paucity of data on their modulation by 11β-‐HSD1 inhibitors. Furthermore, muscle atrophy may represent a novel therapeutic use for selective inhibitors of 11β-‐HSD1, in view of their modest effects on metabolic syndrome parameters to date (Rosenstock et al., 2010, Feig et al., 2011, Gathercole et al., 2013). There is a need to identify potential regulators of 11β-‐HSD1 in skeletal muscle to provide insights into the mechanism of any age-‐associated changes in expression. So-‐called ‘Inflamm-‐Ageing’ has been proposed as the driver of age associated declines in physical function, and development of chronic disease (Cevenini et al., 2013). As outlined in chapter 1, population-‐based studies have revealed increased cytokines including TNF-‐α in the elderly (Visser et al., 2002, Roubenoff et al., 2003). Furthermore, TNF-‐α regulates 11β-‐HSD1 expression in many cell and tissue types including those of hepatic, adipose, bone, and smooth muscle origin (Tomlinson et al., 2004). Finally it has been hypothesized that insulin resistance may affect protein turnover in addition to well-‐characterized effects on glucose metabolism (Guillet and Boirie, 2005, Dhar and Castillo, 2011, Bailey, 2013). 121 4.2. Hypothesis Two hypotheses will be tested. Firstly that glucocorticoid exposure results in up-‐ regulation of genes involved in muscle atrophy in skeletal myotubes and selective inhibition of 11β-‐HSD1 attenuates these changes. Secondly, that TNF-‐α and insulin influence muscle atrophy pathways and 11β-‐HSD1 in skeletal myotubes. 4.3. Research Strategy and Aims Day 8 differentiated C2C12 skeletal myotubes were utilized to assess the effects of GCs and 11β-‐HSD1 on muscle atrophy gene expression, to inform our subsequent in vivo studies of skeletal muscle ageing in mice and humans. The following specific areas were covered: 1. To assess the impact of high dose synthetic GC, and GR blockade on expression of genes with anabolic and catabolic functions in skeletal muscle. 2. To assess the effects of inactive murine GC (11-‐dehydrocorticosterone (11DHC)) on expression of the above genes, and the impact of selective inhibition of 11β-‐HSD1 on these changes. 3. To establish dose and time course relationships between active murine GC treatments and HSD11B1 and muscle atrophy/ protein synthesis gene expression. 4. To assess impact of potential age-‐associated regulators of 11β-‐HSD1 (TNF-‐α and insulin) on muscle atrophy/protein synthesis gene expression. 122 4.4. Methods 4.4.1. C2C12 cell culture Previous data from within our group showed that 11β-‐HSD1 is present and functionally active in C2C12 murine myotubes, with oxo-‐reductase activity increasing across differentiation (Morgan et al., 2009, Sherlock, 2011). On this background, day 8 differentiated myotubes were used to investigate the effects of pre-‐receptor GC regulation on muscle atrophy gene expression. C2C12 myoblasts were seeded onto 12-‐well plates in proliferation media (DMEM with 10% FCS). When ~70% confluence was reached, media was changed to DMEM with 5% horse serum and cells were differentiated for 8 days (see figure 4-‐1). Before experimental treatments cells were washed and incubated in serum free media for 4 hours. Figure 4-‐1: Differentiation of C2C12 Myoblasts: C2C12 myoblasts at day 0 and following 8 days incubation with DMEM supplemented with 5% horse serum when fully differentiated into myotubes. 123 4.4.2. Cell Culture Treatments 4.4.2.1. Dexamethasone Dexamethasone is a synthetic GC, which is generated by addition of a 16α-‐methyl group to Δ1-‐fludrocortisone. It has a hydroxyl group at carbon-‐11, and does not require further activation for biological action (Wilson and Williams, 1998). It has ~30-‐times the GC potency of hydrocortisone but lacks mineralocorticoid activity. It is used therapeutically for a wide range of indications including inflammatory, autoimmune and malignant diseases. For experimental use, cells were treated with 1μM dexamethasone and incubated for 16 hours, conditions previously shown to increase 11β-‐HSD1 activity and protein degradation (Biedasek et al, 2011). 4.4.2.2. Murine Glucocorticoids Cells were treated with the inactive murine GC, 11-‐dehydrocorticosterone (11DHC; Kendall’s Compound A) and active corticosterone (CORT; Kendall’s compound B). Dose response and time course experiments were carried out with CORT, whilst 11DHC treatment (250nm; 16 hours incubation) was carried out in a series of experiments investigating the effects of selective inhibition of 11β-‐ HSD1. 4.4.2.3. RU486 (Mifepristone) (GR Antagonist) RU486 is a glucocorticoid receptor (GR) antagonist that also blocks the progesterone receptor, which has medical uses in the management of Cushing’s and pregnancy termination (Fleseriu et al., 2012). It competes with GCs to bind GR, preventing activation and nuclear translocation. In experiments using 124 RU486, C2C12 myotubes were treated with 10μM for 16 hours. Short-‐term treatment was used due to previous reports that long-‐term use interferes with myotube proliferation (Sherlock, 2011). 4.4.2.4. LJ2 (PF-‐877423) (Selective 11β-‐HSD1 Inhibitor) LJ2 (Pfizer Global R&D, La Jolla, California, US) was shown to be a potent and highly selective reversible and competitive inhibitor of the type 1 isozyme of 11β-‐HSD, in studies using human adipocyte primary cultures in addition to human and murine cell lines (Bujalska et al., 2008, Cheng et al., 2010). 100nm LJ2 inhibits both oxo-‐reductase and dehydrogenase activities of 11β-‐HSD1 whilst having no effect on 11β-‐HSD2. In experiments using LJ2, differentiated C2C12 myotubes were treated with 100nm for 16 hours incubation. 4.4.3. RNA Extraction and RT-‐PCR RNA was extracted from myotubes using Tri-‐reagent®, as described in the general introduction. In summary, concentration was determined at OD260 using a NanoDrop ND-‐1000 UV spectrophotometer (Thermofisher, Surrey, UK). 1μg of RNA was used for generation of cDNA using the high capacity RT kit from Applied Biosystems (Warrington, UK). 4.4.4. Relative Quantitative (Real-‐time) PCR Target gene expression was determined using Applied Biosystem “assay on demands” and related reagents (Applied Biosystems, Warrington, UK) with samples loaded in duplicate analysed relative to 18S on a 7500 Real-‐time PCR 125 machine (Applied Biosystems, Warrington, UK). Data were expressed as Ct and ΔCt values as outlined previously, and arbitrary units (AU) [AU = 1000x(2-‐ΔCt)]. 4.5. Results 4.5.1. Expression of genes involved in muscle atrophy following treatment with active synthetic glucocorticoid (dexamethasone) and a GR antagonist (RU486) The effects of high dose synthetic GC on ‘atrogenes’ (genes involved in muscle atrophy), MAFbx/Atrogin1, and myostatin was examined by treatment with 1μM dexamethasone (DEX). The rationale of this experiment was to provide evidence of GC-‐regulation of muscle atrophy genes that can be further investigated in subsequent experiments using selective inhibitors of 11β-‐HSD1. DEX treatment resulted in up-‐regulation of MAFbx/Atrogin1 (2.25±1.38 vs. 8.09±1.42AU, p<0.01) and myostatin (0.005±0.001 vs. 0.013±0.002AU, p<0.05). However GR Antagonism with co-‐treatment of RU486 and dexamethasone resulted in down-‐ regulation of MAFbx/Atrogin1 (0.013±0.002 vs. 0.003±0.001AU, p<0.01), and myostatin (0.013±0.002 vs. 0.003±0.001AU, p<0.01) compared to DEX (see figure 4-‐2). No significant changes in gene expression were observed with treatment of cells with RU486 alone. 126 Figure 4-‐2: mRNA expression of muscle atrophy genes in C2C12s following treatment with DEX alone and with the GR Antagonist, RU486. Experiments performed in differentiated murine myotubes (C2C12s) analysed by real-‐time PCR following treatment with dexamethasone (DEX) (1μM/16 hours) alone and in combination with the GR antagonist, RU486 (10μM). Data are expressed as mean of n=7 experiments in arbitrary units (AU) ± Standard Error (S.E.). Overall, P=0.004 for MAFbx/Atrogin1, P=0.009 for myostatin, (N/S = non-‐significant, **p<0.01 vs. control, §p<0.05 vs. DEX γp<0.05 vs. control) (DEX = dexamethasone, CTRL = control). 4.5.2. The impact of treatment with inactive murine glucocorticoid (11-‐dehydrocorticosterone) and a selective 11β-‐HSD1 inhibitor (LJ2) on muscle atrophy gene expression The effects of pre-‐receptor GC metabolism on muscle atrophy pathways was assessed by treating cells with inactive GC (A, 250nm) and the selective 11β-‐ HSD1 inhibitor, LJ2 (100nm). Treatment with A resulted in up-‐regulation of MAFbx/Atrogin1 only (7.7±1.4 vs. 20.4±2.5AU, p<0.01), with a non-‐significant trend towards up-‐regulation seen with myostatin (18.4±0.1 vs. 17.5±0.1, p=N/S)(see figure 4-‐3). Treatment with LJ2 resulted in attenuation of A induced up-‐regulation of MAFbx/Atrogin1 (20.4±2.5AU vs. 9.13±0.5AU, p<0.05), and no changes seen with myostatin (17.5±0.1 vs. 18.5±0.6AU, p=N/S). Treatment of cells with LJ2 alone was without effect. 127 Figure 4-‐3: mRNA expression of genes involved in muscle atrophy in C2C12s following treatment with 11-‐DHC(A) alone and with the selective inhibitor of 11β-‐HSD1, LJ2. Experiments performed in differentiated C2C12 myotubes, analysed by real-‐time PCR after treatment with 11-‐dehydrocorticosterone (A)(250nm/16 hours) alone or in combination with the selective inhibitor of 11β-‐HSD1, LJ2 (100nm). Data are expressed as the mean of n=4 experiments, in arbitrary units (AU) ± S.E. (Overall, P=0.003 for MAFbx/Atrogin1 and P=0.17 for Myostatin; **p<0.01 vs. CTRL (control), §p<0.05 vs. A). 4.5.3. The impact of glucocorticoid treatment, GR blockade and selective 11β-‐HSD1 inhibition on HSD11B1 gene expression There was a trend towards up-‐regulation of HSD11B1 expression with treatment with A (250nm/16 hours) (10.7±1.4 vs. 15.9±1.5AU, p=0.06) and co-‐treatment with LJ2 (100nm) resulted in reduced expression in comparison to A alone (15.9±1.5 vs. 8.2±2.1AU, p<0.05). HSD11B1 Figure 4-‐4: mRNA expression of the HSD11B1 gene in C2C12s following treatment with 11-‐ DHC(A) alone and with the selective inhibitor of 11β-‐HSD1, LJ2. Experiments were performed in differentiated C2C12 myotubes analysed by real-‐time PCR following treatment with 11-‐ dehydrocortisone (A)(250nm/16 hours) alone or in combination with LJ2 (100nm); (n=4 experiments) §P<0.05 vs. A, P=0.06 CTRL vs. A, Overall P=0.06. 128 4.5.4. Dose and time course relationships between active glucocorticoid treatments (corticosterone) and HSD11B1 and MAFbx/Atrogin1 gene expression Treatment with the active murine GC, corticosterone (B)(250nm) resulted in up-‐ regulation of HSD11B1 and MAFbx/Atrogin1 at 48 hours incubation (4.3 ± 1.2 vs. 56.1 ± 9.5AU, p<0.001 and (3.4±0.4 vs. 157.2±54.4AU, p<0.01 respectively)(see figure 4-‐5). At other time points there was a trend towards increasing expression of HSD11B1 (Control vs. 12h (4.3±1.2 vs. 9.8±1.9AU p=N/S, vs. 24h, 13.1±3.6AU, p=N/S) also seen with MAFbx/Atrogin (Control vs. B 12h, 3.4±0.4 vs. 4.8±1.3AU, p=N/S and vs. 24h, 19.7±9.5AU, p=N/S), that did not reach significance. Figure 4-‐5: Time Course Corticosterone (B, 250nm): mRNA expression of HSD11B1 and MAFbx/Atrogin1 in day 8 differentiated C2C12 myotubes, is increased in response to 48 hours incubation with B (250nm), earlier time points did not reach statistical significance. Data are expressed as the mean and S.E. of n=4 experiments. §§§P<0.001 vs. CTRL, and **P<0.01 vs. CTRL. Overall P-‐values P=0.0005 for HSD11B1 and P=0.0009 for MAFbx/Atrogin1. CTRL = control, B= Corticosterone. MAFbx/Atrogin1 expression was upregulated in a dose dependent manner with corticosterone (B) treatment over 24 hours, in C2C12 differentiated myotubes (control vs. 250nm, 2.2±0.4 vs. 23.2±11.5AU, P<0.05; control vs. 1μm, 2.2±0.4 vs. 62.5±30.5AU P<0.01)(see figure 4-‐6). Although there was a trend towards increasing HSD11B1 with increasing doses of B, this did not reach statistical 129 significance (control vs. B 250nm, 5.5 ± 0.9 vs. 9.4 ± 3.5AU, p=N/S; control vs. B 1μm, 5.48 ± 0.9 vs. 21.5 ± 10.8AU, P=0.09). Figure 4-‐6: Dose Response Corticosterone (B, 250nm): mRNA expression of HSD11B1 and MAFbx/Atrogin1 in day 8 differentiated skeletal myotubes treated with B for 24 hours. There was a trend towards increased expression of HSD11B1 with increasing doses of B, however this did not reach statistical significance (CTRL vs. B 1μm P=0.09; Overall P=0.17). However MAFbx/Atrogin1 expression increased in a dose dependent manner (*P<0.05 vs. CTRL; §§P<0.01 vs. CTRL, Overall P=0.001). CTRL = Control, B = corticosterone. 4.5.5. The impact of TNF-‐α and synthetic glucocorticoid (dexamethasone) treatments on HSD11B1 and muscle atrophy gene expression Potential age-‐associated regulators of HSD11B1 were investigated to establish whether they had an effect on muscle atrophy gene expression. In the first of these experiments TNF-‐α was found to have no effect on HSD11B1 expression alone, however it was found to have a synergistic effect with DEX (1μm/16 hours incubation) (Control vs. DEX 9.4±1.3 vs. 10.7±3.4AU p=N/S; Control vs. DEX+TNF 9.4±1.3 vs. 24.6±8.2AU, p<0.05) (See table 4-‐1 and figure 4-‐7a). DEX and TNF did not alter gene expression of other genes involved in muscle atrophy or protein synthesis, such as FOXO1, MuRF1, myostatin, myogenin and mTOR (see table 4-‐ 1). Dramatic up-‐regulation of the known GC responsive gene, glutamine synthetase was observed in response to DEX alone and in combination with TNF-‐ α (Control vs. DEX 4.6 ± 1.3 vs. 18.6 ± 1.9AU, p<0.0001; Control vs. DEX+TNF 4.6 ± 1.3 vs. 15.2 ± 2.5AU p<0.0001) (see table 4-‐1 and figure 4-‐7b). 130 mRNA expression (Arbitrary Units ± SE) Gene Control Dex TNF-‐α Dex+TNF-‐α P-‐value HSD11B1 9.4 ± 1.3 10.7 ± 3.4 7.8 ± 3.7 24.6 ± 8.2 P=0.04 Glutamine Synthetase 8.0 ± 0.4 6.0 ± 0.2 8.9 ± 0.3 6.2 ± 0.3 P<0.0001 FOXO1 9.7 ± 0.3 11.1 ± 1.3 9.7 ± 0.5 9.6 ± 0.5 P=0.45 MuRF1 9.0 ± 0.7 9.1 ± 0.8 8.5 ± 0.3 7.6 ± 0.2 P=0.32 Myostatin 17.2 ± 0.3 17.1 ± 0.9 13.0 ± 4.3 16.8 ± 1.4 P=0.60 Myogenin 4.3 ± 0.3 4.1 ± 0.3 3.9 ± 0.4 3.5 ± 0.5 P=0.54 mTOR 9.3 ± 0.4 10.6 ± 1.2 9.4 ± 0.3 9.3 ± 0.2 P=0.71 Table 4-‐1: mRNA expression of genes involved in muscle metabolism, atrophy and differentiation following treatment with DEX, TNF-‐α alone and in combination. Experiments were performed in differentiated C2C12 myotubes, gene expression was measured using real-‐time PCR, following treatment with dexamethasone (DEX)(1μM/16 hours), Tumour Necrosis Factor-‐ alpha (TNF-‐α)(10μg/mL). Data are expressed as mean delta CT values (±S.E) of n=7 experiments. Overall p-‐value from one-‐way anova is shown in the right column. Figure 4-‐7: mRNA expression of HSD11B1 and gluatamine synthetase following DEX and TNF-‐α treatments in C2C12s. Experiments were performed in differentiated C2C12, following treatment with dexamethasone (DEX)(1μM/16 hours), Tumour Necrosis Factor-‐alpha (TNF-‐ α)(10μg/mL) alone or in combination; §P<0.05 vs. control (CTRL); b) of the Glutamine Synthetase gene, ****P<0.0001 vs. CTRL and §§§§P<0.0001 vs. TNF-‐α. Expression was measured using real-‐time PCR, and data are expressed as mean values of n=7 experiments in arbitrary units (AU) ± S.E. 131 4.5.6. Impact of insulin and dexamethasone treatment on HSD11B1 and muscle atrophy gene expression GC exposure induces insulin resistance, which can be reduced by inhibition of 11β-‐HSD1 (Morgan et al., 2009). Whether insulin signaling plays a role in the pathogenesis of GC and age-‐associated muscle atrophy is of interest. In a preliminary experiment, differentiated C2C12 myotubes were treated with high dose DEX (1μm/16 hours) alone, and in combination with insulin (12nM). DEX increased expression of MAFbx/Atrogin1, whilst co-‐treatment with insulin attenuated this change (Control vs. DEX 4.51 ± 0.67 vs. 4.39 ± 0.56AU, p=N/S) (see table 4-‐2). No increase in HSD11B1 expression was seen with DEX treatment at 16 hours, however co-‐treatment with insulin down-‐regulated expression. Other genes involved in protein synthesis and muscle atrophy were unchanged (see table 4-‐2). mRNA expression (delta CT ± S.E.) Gene Control Dex Dex + Insulin P-‐value HSD11B1 MAFbx/Atrogin1 FOXO1 Myostatin Myogenin 7.9 ± 0.2 7.9 ± 0.2 9.0 ± 0.2 P=0.0019 9.1 ± 0.5 7.1 ± 0.3 9.5 ± 0.4 P=0.0015 10.2 ± 0.3 10.3 ± 0.3 11.1 ± 0.6 P=0.32 17.7 ± 0.3 16.6 ± 0.4 16.9 ± 0.6 P=0.28 5.2 ± 0.4 5.1 ± 0.4 5.9 ± 0.3 P=0.23 Table 4-‐2: mRNA expression of genes involved in muscle atrophy and differentiation measured using Real-‐time PCR, following treatment with DEX and Insulin alone and in combination. Experiments were performed using differentiated C2C12 myotubes with gene expression measured using real-‐time PCR. Treatments: dexamethasone (DEX)(1μM/24 hours) and Insulin (12nM) alone and in combination. Data are expressed as mean delta CT values (±S.E) of n=7 experiments. Overall P-‐values from one-‐way anova test are shown in right column. 132 4.6. Discussion This chapter outlines novel data on the effects of selective 11β-‐HSD1 inhibitors on skeletal muscle atrophy pathways. 11β-‐HSD1 is expressed and functionally active in skeletal muscle and although previous work has focused largely on its metabolic effects there is evidence for a role in regulation of the ubiquitin proteosome system (Whorwood et al., 2001, Jang et al., 2006, Morgan et al., 2009, Biedasek et al., 2011). Furthermore, the results reported in this chapter add to this, by examining the effects of pre-‐receptor GC regulation on expression of targets including myostatin, FOXOs and myogenin. Finally, the effects of TNF-‐α and insulin, which are known regulators of 11β-‐HSD1, on key genes involved protein synthesis and degradation was assessed. In keeping with previous studies, we have shown that MAFbx/Atrogin1 and myostatin gene expression are upregulated in response to high dose synthetic GC. The muscle specific ubiquitin ligase, MAFbx/Atrogin1 is central to the common gene programme that characterizes skeletal muscle atrophy caused by range of aetiologies (Lecker et al., 2004). Studies of skeletal myotubes and animal models have shown that GCs regulate myostatin gene transcription via a GR dependent mechanism (Ma et al., 2001, Ma et al., 2003). Furthermore, a transgenic model revealed that myostatin was required for development of dexamethasone induced muscle atrophy (Gilson et al., 2007). We showed that dexamethasone induced changes were attenuated by treatment with RU486, consistent with a GR dependent pathway. FOXO mRNA expression did not change with dexamethasone treatment and it is possible that this is due to post-‐ translational regulation. Myogenin mRNA expression was also unaffected, in 133 contrast to a previous report, which also used day 8 differentiated C2C12 myotubes (Nishimura et al., 2008), the reason for this is unclear. We also showed that pre-‐receptor GC regulation plays a role in proteolysis with the observation that MAFbx/Atrogin1 expression is increased in response to treatment with the inactive murine GC, 11-‐dehydrocorticosterone (A). This is consistent with reports from previous studies (Biedasek et al., 2011), although the observation that treatment with a selective 11β-‐HSD1 inhibitor attenuates this change is novel. This is an important finding as it confirms that the attenuation of protein degradation seen in response to the non-‐selective 11β-‐ HSD, carbenoxolone is due to a specific effect on the type 1 isozyme (Biedasek et al., 2011). It is possible that this study was underpowered to detect more subtle changes in MuRF1 and myostatin in response to A and that regulation of FOXO may be post-‐translational. Our studies of GC regulation of HSD11B1 revealed that expression was increased with 48 hours exposure to the active murine GC, corticosterone (B) at a dose of 250nm. There was a trend towards a dose dependent relationship between HSD11B1 expression and B treatment that did not reach significance (P=0.09, 1μm/24 hour incubation). Dose dependent upregulation of HSD11B1 mRNA and oxo-‐reductase activity, was described in the paper that first characterized its expression and function in skeletal muscle (Whorwood et al., 2001). Furthermore, we report a trend towards increased HSD11B1 expression with the inactive murine GC 11-‐dehydrocorticosterone (A), and a significant reduction in expression with treatment with the selective inhibitor of 11β-‐HSD1, LJ2. 134 TNF-‐α has been shown to increase HSD11B1 expression in a range of tissues and cell lines including rat glomerular cells, MG63 osteosarcoma cells, human preadipocytes and adipocytes, osteoblasts, aortic and bronchial smooth muscle cells (Tomlinson et al., 2004). We have demonstrated that although they have no effect in isolation, dexamethasone and TNF-‐α, have a synergistic effect on increasing HSD11B1 expression in skeletal myotubes, which is consistent with previous reports in synovial fibroblasts, primary osteoblasts and undifferentiated C2C12 myoblasts (Cooper and Stewart, 2009, Kaur et al., 2010, Ahasan et al., 2012). It should be noted that the TNF-‐α dose used (10μg/mL) is supraphysiological, so observing the effects of lower doses may be a more accurate model of ageing. These observations potentially implicate local tissue GC generation in scenarios characterized by increased TNF-‐α levels, such as the increased muscle atrophy seen in the GC treated elderly or those with inflammatory disease (Dardevet et al., 1995, Touno et al., 1996, Seene and Kaasik, 2012). In these scenarios, it is possible that TNF-‐α may be secreted by immune cells to increase systemic levels, and locally by immune infiltration and myofibre response to tissue damage (Collins and Grounds, 2001). Our initial data showing that HSD11B1 and MAFbx/Atrogin1 expression are suppressed in response to insulin, is consistent with its known pro-‐anabolic effects (Workeneh and Bajaj, 2013a). Previous studies have examined the role of 11β-‐HSD1 in insulin resistance but have focused on metabolic effects. These studies have shown evidence of increased skeletal muscle 11β-‐HSD1 expression in skeletal muscle from a rat model of diabetes (Zhang et al., 2009), and in myotubes isolated from diabetics (Abdallah et al., 2005). However another human study did not support these findings (Jang et al., 2007). Our group 135 uncovered phosphorylation of serine residue 307 of IRS1 as a mechanism of GC induced insulin resistance, and demonstrated attenuation of this effect with the use of a selective 11β-‐HSD1 inhibitor (Morgan et al., 2009). Other groups have confirmed the insulin sensitizing effects of 11β-‐HSD1 on skeletal muscle with regards glucose uptake, but no previous investigations have been made on genes involved in anabolic/catabolic pathways (Abdallah et al., 2005, Salehzadeh et al., 2009). Whether insulin resistance, induced by GCs, or pro-‐inflammatory cytokines plays a role in the sarcopenia of ageing remains to be seen (Katsuki et al., 1998). In summary the main contribution of this chapter is to provide evidence of the role of modulation of 11β-‐HSD1 in skeletal muscle atrophy, via selective inhibition on the key ubiquitin proteasome system mediator, MAFbx/Atrogin1. This is of potential translational importance, as it opens up a new potential therapeutic application in muscle atrophy for selective inhibitors of 11β-‐HSD1, that have been developed by industry for the treatment of diabetes, which to date they have had only modest success. Muscle atrophy secondary to side effects of therapeutic GCs, skeletal muscle ageing, and aetiologies where GCs have been found to play a role (sepsis and metabolic acidosis) are obvious initial targets (Tiao et al., 1996b, Smith et al., 2010, May et al., 1986). Other potential areas for further investigation include as a medical therapy for Cushing’s Syndrome, where current treatments are limited (Tritos and Biller, 2012). This study provides a background to the novel and detailed in-‐vivo studies examining the impact of 11β-‐HSD1 global gene knockout on age-‐associated skeletal muscle atrophy, and the cross-‐sectional study of human ageing presented in subsequent chapters. 136 Chapter 5 – The Impact of Global 11β-‐ HSD1 knock out on Muscle Phenotype and Gene Expression in Aged and Glucocorticoid Treated Mice 137 5.1 Introduction Cushing’s syndrome is characterised by an adverse body composition profile, consisting of visceral obesity, hepatic steatosis, muscle atrophy and osteoporosis, along with development of hypertension, insulin resistance, dyslipidaemia and excess cardiovascular disease risk. Conversion of cortisone in humans, and 11dehydrocorticosterone (11DHC), in mice to their active 11-‐hydroxylated forms (cortisol and corticosterone, respectively) by the oxo-‐reductase activity of 11β-‐HSD1, results in amplification of GC action at the local tissue level. Pre-‐ receptor GC metabolism has been shown to play a role in obesity and metabolic disease (Gathercole et al., 2013). To date, animal models have shown that the global 11β-‐HSD1 KO is associated with a beneficial metabolic phenotype, characterised by reduced visceral adiposity, hepatic steatosis, and improved glucose tolerance, insulin sensitivity, and lipid profile (Kotelevtsev et al., 1997). Conversely, overexpression of 11β-‐HSD1 in adipose tissue of transgenic mice has adverse metabolic effects (Masuzaki et al., 2001, Masuzaki et al., 2003). Absence of 11β-‐HSD1 also has beneficial effects on age-‐related features including skin structure (Tiganescu et al., 2013) and wound healing, and cognitive function (Yau et al., 2007). 11β-‐HSD1 is expressed and functionally active in skeletal muscle, however to date, most published work has focused on its effects on metabolic parameters and not muscle contractile function (Jang et al., 2006, Morgan et al., 2009). A recent cell culture study has examined effects of non-‐ selective 11β-‐HSD1 inhibition on expression of proteolytic genes including MAFbx/Atrogin1 and MuRF1, however to date no published work has examined the effects in vivo (Biedasek et al., 2011). Sarcopenia appears to be determined by a complex network of signaling pathways, with mechanisms including 138 reduced anabolic hormones, insulin resistance, chronic inflammation, nutrition, disuse, denervation, satellite cell function and oxidative stress potentially driving the condition (See table 1-‐7), underlying the need for in-‐vivo studies. Whether local tissue regeneration contributes to age-‐associated sarcopenia is a question of great importance, as this condition has no effective treatment and would provide a potential therapeutic target, for recently developed selective 11β-‐ HSD1 inhibitors. By outlining the clinical importance of GC excess on factors such as body mass and mortality, and detailing evidence of modulation of proteolytic gene expression by selective 11β-‐HSD1 inhibitors, in vitro, the previous chapters in this thesis have set the scene for a detailed in vivo assessment of the impact of 11β-‐HSD1 gene deletion on GC-‐ and age-‐induced myopathy. 5.2 Hypotheses Our central hypothesis is that local tissue GC generation contributes to age-‐ associated myopathy, resulting in activation of a GC-‐regulated gene atrophy programme. Furthermore, absence of 11β-‐HSD1 results in attenuation of these gene expression changes with resulting protection from muscle weakness and atrophy. 5.3 Research Strategy and Aims In this chapter, animal models developed in-‐house (global 11βHSD1 knock out mice: GC-‐excess and aged colonies), are utilized to probe our hypothesis. Firstly the phenotypes of young and old WT and 11β-‐HSD1 KO C57BL/6 mice were characterized with glucose metabolism, muscle strength and tissue weights. A targeted microfluidic gene expression array was performed to provide an insight 139 into the pathways that are most robustly regulated by age and modulation of pre-‐receptor GC metabolism. Subsequently these targets were assessed in muscle samples from WT and 11β-‐HSD1 KO C57BL/6 mice that had been treated with active and inactive GCs in drinking water, and had undergone similar phenotyping. The purpose of this was to identify whether myopathy of ageing and GC-‐excess share common gene expression changes. 5.4 Materials and Methods 5.4.1. Animal Protocols General: Procedures were performed in line with the UK Animals (Scientific Procedures) Act, 1986. These experiments were carried out in collaboration with Dr Stuart Morgan who took a central role in managing the colony. Mice were housed in standard conditions with a 12h:12h light-‐dark cycle. The 11β-‐HSD1 KO mouse was generated in-‐house by Dr Gareth Lavery as described previously (Semjonous et al., 2011). Ageing Model: Young (≈12 weeks of age) and old (22-‐24 months) C57BL/6 mice on high fat diet (58% kcal fat -‐ Research Diets – D12331) with ad libitum access to water were compared. High fat diet was originally chosen in order to ‘stress’ the potential metabolic phenotype of the animals. Muscle Phenotyping: Grip-‐strength was assessed using a digital grip-‐strength meter (Linton Instrumentation, Norfolk, UK). This allows measurement of peak grip strength, whereby animals are suspended by the base of the tail, whilst grasping a metal grid. Each mouse underwent 4 repeat readings before results were averaged and normalised to body weight. Animals were culled by cervical 140 dislocation and tissues dissected out, muscles were weighed before being snap frozen in liquid nitrogen. Measurement of serum corticosterone levels: This was analysed using an immunoassay kit (Cambridge Biosciences, Cambridge, UK). Glucose Tolerance Testing: Insulin resistance is known to contribute to dysregulation of muscle protein metabolism. The impact of study group/genotype on glucose metabolism was quantified by glucose tolerance testing. This was performed by fasting mice 5 hours before blood glucose was assessed from tail vein nicks at using a glucometer at 0, 15, 30, 60, 90 and 120 minutes following intraperitoneal glucose injection (2 g/kg). A blood sample was taken from tail vein nicks at baseline for analysis using the Ultra Sensitive Mouse Insulin ELISA kit (Crystal Chem, Inc., Downers Grove, IL). GCs Excess Model: At 6 weeks of age, male 11β-‐HSD1 KO mice and WT controls on a C57BL/6 background, with ad libitum access to drinking water supplemented with CORT (100μg/mL, 0.66% ethanol), 11DHC (100μg/mL, 0.66% ethanol) or vehicle (0.66% ethanol) for 5 weeks, which was refreshed twice weekly. Animals were fed control diet (11% kcal fat – Research Diets – D12328). Glucose tolerance was assessed during week 4 and muscle phenotyping was also performed in the week prior to culling as described above. 141 5.4.2. Urine Steroid Analysis by Gas Chromatography/Mass Spectrometry Beverley Hughes carried this out in-‐house using a well-‐established method as previously described (Shackleton, 1993, Lavery et al., 2006). Urine was collected from young and old mice on to filter paper from 5 animals from each experimental group. A Hewlett Packard 5970 mass spectometer and 15m fused silica capillary column, 0.25mmID, 0.25μm film thickness (J and B Scientific, Folsom, CA, US) was used. Metabolites were identified according to their mass spectra, and quantified relative to peak areas of internal standards. Data are expressed as % of metabolites of 11DHC (containing an 11-‐oxo group) with the remainder being metabolites of CORT (containing an 11-‐hydroxyl group). For a full description see general methods section. 142 5.5. Results 5.5.1. In-‐Vivo Studies of Ageing in Wildtype and 11β-‐HSD1 Knockout Mice 5.5.1.1. Urinary GC/MS characterization of corticosteroid metabolites across age in 11β-‐HSD1 knockout and wildtype mice The percentage of urinary corticosteroids that were metabolites of 11-‐ dehydrocorticosterone (11DHC or A) on GC/MS analysis was used as a surrogate measure of global 11β-‐HSD1 activity in vivo. Young and old 11β-‐HSD1 KO mice had increased %A metabolites compared to age-‐matched WT mice (Young 11β-‐ HSD1 KO: 24.2 ± 1.5% vs. Young WT: 8.0 ± 1.1%, p<0.01 and Old 11β-‐HSD1 KO: 25.0 ± 5.3% vs. Old WT: 5.4 ± 0.4%, p<0.01 respectively), consistent with lack of 11β-‐HSD1 activity (Figure 5-‐1). Aged WT mice had reduced %A metabolites compared to young controls. Figure 5-‐1: Urinary steroid analysis confirmed increased % of corticosteroids as metabolites of A in both young and old 11β-‐HSD1 KO C57BL/6 mice compared to age-‐matched WT controls, (n=8). Mean and S.E. are shown. A = 11-‐dehydrocorticosterone (11DHC). **P<0.01 and *P<0.05 vs. young WT; §§p<0.01 vs. old WT (n=6-‐7 per group). WT = wildtype, KO = 11β-‐HSD1 knockout mice. 143 5.5.1.2. Characterisation of serum corticosterone and adrenal gland weights across age in 11β-‐HSD1 knockout and wildtype mice: Morning serum corticosterone levels were increased in 11β-‐HSD1 KO mice compared to age matched controls, and levels were increased with age in WT mice. Adrenal gland weights of young and old 11β-‐HSD1 KO mice were increased compared to age matched WT controls (Figure 5-‐2). This is indicative of compensatory HPA-‐axis activation in the 11β-‐HSD1 KO mice. There were no differences with age between WT or 11β-‐HSD1 KO mice. Figure 5-‐2: Serum morning CORTs and adrenal tissue weights in WT and 11β-‐HSD1 KO mice. A) Serum Corticosterone measured in the morning was increased in old 11β-‐HSD1 KO mice compared to aged-‐matched WT mice. Serum corticosterone was increased in Aged WT mice compared to young WT mice. *P<0.05 compared to aged matched WT mice, §§P<0.01 compared to young WT mice. B) Adrenal tissue weights were increased in young and old 11β-‐HSD1 KO mice on C57BL/6 background compared to age-‐matched wildtype control mice. Mean and S.E. are shown. *P<0.05 compared to age-‐matched control group (n=6 per group). WT = wildtype, KO = 11β-‐HSD1 knockout mice. 5.5.1.3. Skeletal muscle gene expression array analysis of wildtype and 11β-‐HSD1 knockout mice across age mRNA expression of 88 target genes in skeletal muscle (quadriceps) was analysed in a gene expression array using a microfluidic chip (Table 5.1i and ii). Central focus was placed on identifying genes that were differentially regulated with age, and were modulated by 11β-‐HSD1 background. 144 Gene Expression (AU ± S.E.) Young Old Gene WT KO WT KO Overall P-value mTOR 415 ± 62 292 ± 30 426 ± 43 307 ± 45 0.12 DDIT 26 ± 4 19 ± 4 21 ± 3 20 ± 2 0.41 p300 141 ± 15 115 ± 13 141 ± 21 120 ± 13 0.56 788 ± 100 772 ± 101 1190 ± 92 818 ± 132 0.06 1510 ± 181 1243 ± 163 2585 ± 642 1489 ± 173 0.03 MuRF1 978 ± 87 892 ± 96 1684 ± 148§§ 898 ± 46ΦΦ 0.0002 Cathepsin-L 520 ± 45 339 ± 32 457 ± 112 438 ± 42 0.10 Calpain-1 422 ± 26 351 ± 24 385 ± 62 297 ± 31 0.046 Calpain-2 317 ± 35 217 ± 19 357 ± 37 267 ± 28 360 ± 36 332 ± 52 1208 ± 157§§§§ 756 ± 57Φ 0.02 <0.000 1 1189 ± 122 829 ± 102 1339 ± 172 985 ± 74 0.03 0.16 GSK3β MAFbx/ Atrogin1 GADD45a USP19 ATF-4 785 ± 77 561 ± 64 812 ± 113 658 ± 82 Caspase-3 1.2 ± 0.3 1.1 ± 0.2 0.5 ± 0.1 1.0 ± 0.2 0.31 eiF4bp 649 ± 87 508 ± 41 1059 ± 127§ 834 ± 102 0.003 75 ± 13 52 ± 6 72 ± 13 61 ± 11 0.64 FOXO1 170 ± 20 141 ± 13 192 ± 16 162 ± 18 0.27 FOXO3a 307 ± 37 236 ± 17 370 ± 51 327 ± 30 0.046 MYH1 16617 ± 4446 7408 ± 1491 15376 ± 3470 12058 ± 2070 0.10 MYH2 5462 ± 1283 2183 ± 894 1223 ± 632 1684 ± 625 0.08 MYH4 eiF4e 260226 ± 21327 249550 ± 28280 345095 ± 80764 266677 ± 24652 0.71 PSMA2 497 ± 43 376 ± 44 576 ± 66 499 ± 39 0.03 PSMD1 1256 ± 132 1035 ± 107 1578 ± 181 1146 ± 104 0.06 PSMD2 2022 ± 161 1481 ± 144 2551 ± 222 1968 ± 166 0.005 PSMD3 515 ± 46 384 ± 37 627 ± 61 464 ± 28 0.01 PSMD4 320 ± 24 241 ± 22 368 ± 32 254 ± 24 0.007 PSMD11 2241 ± 252 1957 ± 213 3469 ± 302§ 2450 ± 304 0.008 PSMD6 977 ± 65 764 ± 87 1095 ± 133 830 ± 79 0.06 PSMD7 1460 ± 133 1183 ± 125 1928 ± 267 1525 ± 97 0.03 937 ± 84 735 ± 66 1181 ± 149 994 ± 90 0.03 PSMC1 78 ± 11 53 ± 7 85 ± 10 67 ± 9 0.08 PSMC2 1967 ± 204 1503 ± 180 2431 ± 303 1626 ± 239 0.046 PSMD12 PSMC4 319 ± 27 242 ± 27 383 ± 28 327 ± 26 0.01 PSMC5 1294 ± 132 947 ± 100 1577 ± 217 1305 ± 144 0.04 PSMC6 796 ± 65 651 ± 65 948 ± 115 780 ± 58 0.08 S6K1 146 ± 16 109 ± 12 153 ± 31 112 ± 14 0.25 SIRT1 103 ± 13 73 ± 9 118 ± 16 94 ± 8 0.09 SIRT3 94 ± 13 58 ± 7 84 ± 12 73 ± 11 0.11 WRN 57 ± 22 38 ± 4 59 ± 9 41 ± 4 0.09 716 ± 67 753 ± 138 1610 ± 250§§ 731 ± 60ΦΦ 0.0009 SMAD2 82 ± 10 56 ± 4 74 ± 10 67 ± 6 0.13 SMAD3 55 ± 5 51 ± 4 53 ± 6 47 ± 3 0.73 SMAD4 1006 ± 112 842 ± 72 803 ± 172 504 ± 66 0.002 0.09 Myostatin SMAD7 16 ± 3 11 ± 1 21 ± 4 18 ± 2 ACVR2b 166 ± 9 142 ± 11 119 ± 22 114 ± 10 0.03 239 ± 23 180 ± 20 148 ± 27§ 115 ± 16 0.0007 Calveolin3 Table 5.1i: Skeletal muscle gene expression profile in young and old WT and 11β-‐HSD1 KO mice. Overall P-‐value from 1-‐way ANOVA is shown. Full details in Table 5.1ii 145 Gene Expression (AU ± S.E.) Young Old Gene WT KO WT KO Overall P-value RelA 127 ± 19 88 ± 9 152 ± 16 131 ± 14 0.07 Rely 3.3 ± 0.3 2.8 ± 0.4 4.4 ± 0.4 3.2 ± 0.5 0.047 TNF-α 3.5 ± 0.9 3.0 ± 0.4 4.3 ± 0.8 5.1 ± 0.6 0.24 IL-6 3.2 ± 0.5 2.7 ± 0.6 3.3 ± 0.3 7.3 ± 2.9 0.52 IL-1β 0.6 ± 0.2 0.3 ± 0.1* 1.4 ± 0.6 1.9 ± 0.6 0.01 6925 ± 1042 5106 ± 775 9024 ± 916 8951 ± 896 0.01 225 ± 24 161 ±18 279 ± 35 265 ± 30 0.016 Galactin1 NF-κB1 NF-κB2 44 ± 6 32 ± 4 74 ± 11 60 ± 9 0.003 MIPEP 611 ± 80 501 ± 53 568 ± 86 504 ± 41 0.73 0.11 ACOX1 1124 ± 173 745 ± 85 1137 ± 154 1077 ± 90 877704 ± 157651 764282 ± 94044 1036283 ± 144736 763812 ± 147177 0.51 ATP5f1 171 ± 17 153 ± 12 138 ± 27 91 ± 13 0.005 ATP5h 4410 ± 706 2954 ± 481 3695 ± 528 2606 ± 373 0.10 ATP5k 271 ± 36 183 ± 30 248 ± 32 187 ± 23 0.12 ATP5s 162 ± 24 122 ± 14 168 ± 24 141 ± 16 0.48 ATPsg2 280 ± 24 189 ± 20 267 ± 45 213 ± 35 0.09 Cox10 169 ± 26 114 ± 16 155 ± 23 123 ± 12 0.24 0.37 ATP8 69 ± 9 47 ± 5 64 ± 11 59 ± 9 NCAM2 0.5 ± 0.1 0.4 ± 0.1 0.4 ± 0.1 0.6 ± 0.1 0.95 NCAM1 14 ± 2 13 ± 2 27 ± 4§ 20 ± 3 0.013 CHARNA1 53 ± 5 57 ± 8 110 ± 16 94 ± 18 0.013 CHARNB 130 ± 12 114 ± 13 254 ± 22§§§ 218 ± 32 <0.0001 INSR 214 ± 25 154 ± 17 221 ± 28 174 ± 17 0.14 IRS-1 778 ± 72 809 ± 125 117 ± 231 1058 ± 145 0.41 AKT1 453 ± 51 303 ± 27 580 ± 56 475 ± 58 0.005 PI3K(p85) 766 ± 159 490 ± 60 712 ± 85 557 ± 56 0.31 Pi3K(p110) 297 ± 39 249 ± 26 350 ± 74 210 ± 19 0.14 89 ± 15 65 ± 8 122 ± 13 25 ± 10 0.047 72.6 ± 17.4 0.1 ± 0.0**** 63.9 ± 12.9 0.2 ± 0.1ΦΦΦΦ <0.0001 Cytochrome C AMPKa 11β-HSD1 H6PDH 132 ± 17 99 ± 15 179 ± 36 124 ± 17 0.16 Glut Synth 227 ± 30 176 ± 28 257 ± 44 320 ± 30 0.04 HSP90aa 288 ± 51 200 ± 27 380 ± 31 282 ± 25 0.03 HSP90b 316 ± 40 222 ± 23 380 ± 47 264 ± 22 0.03 GR 608 ± 67 468 ± 56 684 ± 113 530 ± 49 0.26 11726 ± 267 1418 ± 163 1766 ± 393 1428 ± 131 0.85 IGF-1 392 ± 77 303 ± 57 407 ± 69 413 ± 56 0.54 HIF-1a 610 ± 99 449 ± 52 669 ± 85 589 ± 62 0.26 RXRb 186 ± 18 144 ± 17 183 ± 38 143 ± 13 0.27 eif6 197 ± 25 139 ± 20 235 ± 25 157 ± 23 0.04 GHR Eif2b1 853 ± 77 689 ± 62 889 ± 96 783 ± 78 0.25 PDK4 10584 ± 1946 6248 ± 1024 13046 ± 2023 14140 ± 7473 0.24 Irisin 425 ± 102 227 ± 55 352 ± 154 255 ± 49 0.44 Table 5.1ii: Skeletal muscle (quadriceps) gene expression in WT and 11β-‐HSD1KO C57BL/6 mice across age. Analysed by Fluidigm dynamic array. MuRF1, GADD45a, eif4bp, PSMD11, myostatin, NCAM1, and CHARNB were upregulated with age in WT mice. Calveolin3 was downregulated with age in WT mice. Age associated changes in MuRF1, GADD45a and myostatin were attenuated with 11β-‐HSD1 KO. Data expressed as A.U. with means and S.E.s. *P<0.05, ****p<0.0001 vs. young WT, §p<0.05, §§p<0.01, §§§p<0.001, §§§§p<0.0001 vs. young WT, Φp<0.05, 146 ΦΦp<0.01 and ΦΦΦΦp<0.0001 vs. old WT. WT = wildtype and KO = 11β-‐HSD1 knock out mice. Overall p-‐value from 1-‐way ANOVA is tabulated (n=7-‐9 per group). The impact of 11β-‐HSD knockout on age-‐regulated genes in skeletal muscle: Three genes (MuRF1, myostatin and GADD45a) of the 88 studied had age-‐ associated increases in expression that were attenuated with 11β-‐HSD1 KO (Figure 5-‐3). Figure 5-‐3: Skeletal muscle gene expression of MuRF1, Myostatin and GADD45a with age in WT and 11β-‐HSD1 KO mice. Quadriceps gene expression of (A) MuRF1, (B) Myostatin, and (C) was GADD45a increased with age in WT mice on a C57BL/6 background. An effect that was completely attenuated in Old 11β-‐HSD1 KO mice for MuRF1 and Myostatin, and partially attenuated for GADD45a. §§P<0.01 vs. Young WT, §§§§p<0.0001 vs. Young WT, Φp<0.05 vs. Old WT, and ΦΦp<0.01 vs. Old WT. Means and S.E. are shown (n = 7-‐9 per group) WT = wildtype, KO = 11β-‐HSD1 knock out mice. Expression of four other genes (PSMD11, eif4bp, CHARNB, NCAM1) was upregulated with age, however there was no statistically significant attenuation of these changes in 11β-‐HSD1 KO mice (Figure 5-‐4). 147 Figure 5-‐4: Skeletal muscle gene expression of PSMD11, eif4bp, CHARNB and NCAM1 with age in WT mice. Quadriceps gene expression of these 4 increased with age in WT mice on a C57BL/6 background. There was a trend towards attenuation of this effect in 11β-‐HSD1 KO mice that did not reach statistical significance. §P<0.05 vs. young WT and §§§p<0.001. Means and S.E.s are shown (n=7-‐9 per group) WT = wildtype, KO = 11β-‐HSD1 knock out mice. 5.5.1.4. The impact of global 11β-‐HSD1 knockout on muscle phenotype (grip strength and muscle tissue weights) across age Grip strength was reduced with age in WT mice (Old WT: 3.86 ± 0.80 vs. Young WT: 4.98 ± 0.67 per g bodyweight, p<0.05), whereas strength was preserved in 11β-‐HSD1 KO mice (Old WT: 3.86 ± 0.80 vs. Old KO: 4.44 ± 0.78 per g 148 bodyweight, p<0.05)(Figure 5-‐5). Quadriceps and tibialis anterior muscle weights were reduced with age in both WT and 11β-‐HSD1 KO mice (Figure 5-‐6). Figure 5-‐5: Grip Strength in Young and Old WT and 11β-‐HSD1 KO C57BL/6 mice. *P<0.05 vs. young WT; §P<0.05 vs. Old WT (N = 7-‐8 per group). Means and S.E.s are shown. WT = wildtype, KO = 11β-‐HSD1 knockout mice. Figure 5-‐6: Tissue weights of A) Quadriceps B) Tibialis anterior in young and old, wildtype and 11β-‐HSD1 KO mice on C57BL/6 background. Mean and S.E.s are shown. *P<0.05 vs. young genotype matched mice (n=6-‐8 per group). WT = wildtype, KO = 11β-‐HSD1 KO mice. 149 5.5.2. Treatment of C57BL/6 wildtype and 11β-‐HSD1 knockout mice with supraphysiological doses of glucocorticoids A mouse model was used to investigate the effects of exogenous glucocorticoid treatment on the skeletal muscle genes, which were differentially expressed in the preceding ageing experiments. 5.5.2.1. Characterisation of serum GC levels and adrenal gland weights WT mice treated with CORT and 11DHC had elevated serum CORT levels (2.1-‐ fold [CORT], p<0.001; 1.7-‐fold, p<0.01). Serum CORT was also raised in 11β-‐ HSD1 KO mice following CORT (but not 11DHC) treatment (2.1-‐fold, p<0.001) (Figure 5-‐7). Serum CORT levels were increased in WT and 11β-‐HSD1 KO mice following CORT and 11DHC treatment (Figure 5-‐7a). The dose of CORT administered in this study was effective at inducing adrenal atrophy in both WT (0.15-‐fold, p<0.001) and 11β-‐HSD1 KO (0.17-‐fold, p<0.001) mice, consistent with suppression of endogenous GC production (Figure 5-‐7b). 11DHC also induced adrenal atrophy in WT mice (0.15-‐fold, p<0.001) whilst 11β-‐HSD1 KO animals were protected (Figure 5-‐7b). Figure 5-‐7: Serum CORT and left adrenal weights in WT and 11β-‐HSD1 KO mice treated with GCs in drinking water or control. C57BL/6 wildtype and 11β-‐HSD1 knockout mice on a C57BL/6 background were treated with CORT (100μg/mL, 0.66% ethanol), 11DHC (100μg/mL, 0.66% ethanol) or vehicle (0.66% ethanol) for 5 weeks (n=7-‐9).**P<0.01, ***p<0.001 vs. WT vehicle; $$$p<0.001 vs. KO vehicle. CORT = corticosterone, 11DHC = 11-‐dehydrocorticosterone. 150 5.5.2.2. Skeletal muscle mRNA expression of atrophy genes in GC treated mice Expression of an array of genes known to be involved in muscle atrophy was increased GC-‐treated WT mice including: the E3 ubiquitin ligases, MuRF1 (vehicle-‐treated WT: 0.33 ± 0.03 vs. CORT-‐treated WT: 1.41 ± 0.28 and 11DHC-‐ treated WT: 0.95 ± 0.16AU, p<0.01) and MAFbx/atrogin1 (vehicle-‐treated WT: 0.40 ± 0.04 vs. CORT-‐treated WT: 1.25 ± 0.22 and 11DHC treated WT: 0.90 ± 0.13AU, p<0.01), the negative growth factor, myostatin (vehicle treated WT: 0.20 vs. 0.02 vs. CORT-‐treated WT mice: 0.63 ± 0.11 and 11DHC-‐treated WT: 0.55 ± 0.13AU, p<0.01) and the transcription factor, FOXO1 (vehicle-‐treated WT: 0.03 ± 0.00 vs. CORT-‐treated WT: 0.08 ± 0.02 and 11DHC-‐treated WT: 0.07 ± 0.01AU, p<0.01)(See Figure 5-‐8). 11β-‐HSD1 KO mice had attenuation of 11DHC-‐mediated atrophy gene expression changes (MuRF1; vehicle-‐treated KO: 0.29 ± 0.07 vs. CORT-‐treated KO: 0.71 ± 0.16, p<0.05 and 11DHC-‐treated KO: 0.32 ± 0.08AU, MAFbx/atrogin1; vehicle-‐treated KO: 0.29 ± 0.07 vs. CORT-‐treated KO: 0.63 ± 0.19, p<0.05 and 11DHC-‐treated KO: 0.29 ± 0.05AU, myostatin; vehicle-‐treated KO: 0.18 ± 0.03 vs. CORT treated KO: 0.41 ± 0.04, p<0.01 and 11DHC treated KO: 0.20 ± 0.03AU and FOXO1; vehicle-‐treated KO: 0.03 ± 0.01 vs. CORT-‐treated KO: 0.05 ± 0.00 and 11DHC-‐treated KO: 0.02 ± 0.00AU) (Figure 5-‐8). 151 Figure 5-‐8: GC treatment resulted in upregulation of genes involved in muscle atrophy (quadriceps) including MuRF1 (A), MAFbx/Atrogin-‐1 (B), myostatin (C) and FOXO1 (D), and these changes were attenuated in 11DHC treated 11β-‐HSD1 KO C57BL/6 mice (n=7-‐9 in each group) (**p<0.01 vs. WT vehicle; ∅p<0.05, ∅∅p<0.01 vs. WT CORT). Expression of other age-‐regulated genes in skeletal muscle of glucocorticoid-‐ treated wildtype and 11β-‐HSD1 knock out mice: Genes that were differentially expressed with age in the mRNA expression array were analysed by conventional real-‐time PCR in skeletal muscle samples (quadriceps) from GC-‐ treated mouse experiments, in order to assess if regulated by GCs. Of the 6 genes assessed, 4 were confirmed to be GC-‐regulated, in vivo (eif4bp CHARNB, NCAM1 and GADD45a. This induction was attenuated in 11DHC-‐treated 11β-‐HSD1 KO mice (Table 5-‐2 and Figure 5-‐9). 152 Figure 5-‐9: Impact of GC-‐treatment on expression of age-‐regulated genes in skeletal muscle. (A) GADD45a expression was upregulated in CORT and 11DHC-‐treated WT mice, and CORT-‐treated but not 11DHC-‐treated 11β-‐HSD1 KO mice. (B) Eif4bp and (C) CHARNB expression was increased by both CORT and 11DHC-‐treatment in WT mice but not 11β-‐HSD1 KO mice. (D) NCAM1 expression was increased in WT mice by CORT treatment but not 11DHC treatment. *P<0.05, **p<0.01, ****p<0.0001 vs. vehicle-‐treated WT and Øp<0.05 vs. vehicle-‐treated 11β-‐HSD1 KO mice. Data are shown as means and S.E.s. 153 Gene Expression (AU ± S.E.) Wildtype Gene Eif4bp Vehicle 0.14 ± 0.01 CHARNB 0.03 ± 0.00 NCAM1 0.01± 0.00 GADD45a 0.10 ± 0.01 PSMD11 0.44 ± 0.04 Calveolin3 0.05 ± 0.00 CORT 11β-‐HSD1 KO 11DHC Vehicle CORT 11DHC Overall P-‐value 0.48 ± 0.10 0.43 ± 0.08 0.16 ± 0.04 0.34 ± 0.05 0.14 ± 0.01 <0.0001 0.07 ± 0.01 0.05 ± 0.00 0.03 ± 0.00 0.04 ± 0.01 0.02 ± 0.00 <0.0001 0.03 ± 0.01 0.01 ± 0.00 0.01 ± 0.00 0.01 ± 0.00 0.00 ± 0.00 0.0002 0.30 ± 0.06 0.29 ± 0.09 0.09 ± 0.02 0.28 ± 0.06 0.08 ± 0.02 0.001 0.55 ± 0.07 0.51 ± 0.05 0.39 ± 0.08 0.53 ± 0.09 0.40 ± 0.04 0.27 0.05 ± 0.01 0.05 ± 0.00 0.06 ± 0.02 0.07 ± 0.01 0.05 ± 0.01 0.35 Table 5-‐2: Gene expression of genes regulated by age or 11β-‐HSD1 in the ageing study in skeletal muscle was assessed by real-‐time PCR in glucocorticoid treated mouse study samples (quadriceps). Data are expressed as mean and S.E. of A.U. Statistical analysis was performed on mean dCT values using 1-‐way anova. Statistically significant differences in gene expression between groups were seen in Eif4bp, CHARNB, NCAM1 and GADD45a genes. 5.5.2.3. Impact of 11β-‐HSD1 KO on muscle phenotype (grip strength and muscle weights) of GC-‐treated mice: GC treated WT mice had reduced grip-‐strength (Figure 5-‐10). These changes were paralleled by reductions in type IIb fibre rich muscle beds (for quadriceps vehicle-‐ treated WT: 0.15 ± 0.01 vs. CORT-‐treated WT: 0.07 ± 0.01 and 11DHC-‐ treated WT 0.09 ± 0.01g, p<0.05 and for tibialis anterior vehicle-‐ treated WT 0.04 ± 0.01 vs. CORT-‐treated WT 0.02 ± 0.01 and 11DHC-‐treated WT 0.03 ± 0.00g, p<0.05)(Figure 5-‐11). Conversely, GC-‐treated 11β-‐HSD1 KO mice had preserved grip-‐strength, and those treated with 11DHC were protected from muscle atrophy (for quadriceps vehicle treated 11β-‐HSD1 KO: 0.18 ± 0.01g vs. CORT-‐ treated 11β-‐HSD1 KO: 0.15 ± 0.02g, p<0.05 and 11DHC-‐treated 11β-‐HSD1 KO: 154 0.20 ± 0.01g p=N/S, and for tibialis anterior vehicle-‐treated 11β-‐HSD1 KO: 0.04 ± 0.01g vs. CORT-‐treated 11β-‐HSD1 KO: 0.04 ± 0.01g and 11DHC-‐treated 11β-‐ HSD1 KO: 0.05 ± 0.01g)(Figure 5-‐11). Figure 5-‐10: Grip-‐strength was reduced in CORT and 11DHC treated WT C57BL/6 mice, whereas 11β-‐HSD1 KO C57BL/6 mice were protected from these effects (n=7-‐9 in each group) (***p<0.001 vs. WT vehicle) Figure 5-‐11: Quadriceps (A) and tibialis anterior muscle bed weight (B) were reduced in CORT and 11DHC treated WT C57BL/6 mice, whereas 11β-‐HSD1 KO C57BL/6 mice were protected from these effects (n=7-‐9 in each group) (*p<0.05 vs. WT vehicle; ∅p<0.05, vs. WT CORT). 155 5.6 Discussion In summary we have identified a set of gene expression changes in skeletal muscle that are common to both GC excess and ageing and parallel changes in muscle function. Absence of 11β-‐HSD1 attenuates these changes and results in protection from muscle weakness, implicating local GC generation in the development of muscle atrophy and indicating a potential therapeutic role for selective 11β-‐HSD1 inhibitors. This study represents the first in-‐vivo assessment of the impact of 11β-‐HSD1 on skeletal muscle function with age and GC-‐excess. Previous studies have revealed the beneficial metabolic effects of global 11β-‐HSD1 KO, characterized by favourable fat distribution, and lipid profiles, resistance to hyperglycaemia, absent oxo-‐reductase activity and compensatory adrenal hyperplasia (Kotelevtsev et al., 1997, Morton et al., 2001) and the adverse effects of overexpression of the gene (Masuzaki et al., 2001, Masuzaki et al., 2003). Recently, studies of liver-‐specific 11β-‐HSD1 KO mice, demonstrated a lack of metabolic abnormilities, normal urine steroid markers of 11β-‐HSD1 activity and ability to generate cortisol to 40% of control, suggesting that extra-‐hepatic sites make a more significant contribution to global GC generation than was previously accepted (Lavery et al., 2012). Our initial characterization studies confirmed that %A metabolites were increased in 11β-‐HSD1 KO mice, consistent with absence of oxo-‐reductase activity, as seen in previous reports (Abrahams et al., 2012). Serum CORT was increased with both age and absence of 11β-‐HSD1, in-‐keeping with HPA-‐axis 156 activation. It is striking therefore, that we demonstrate functional effects (improved strength) and attenuation of glucocorticoid sensitive gene expression changes in the 11β-‐HSD1 KO, indicating that absence of local tissue GC amplification overrides the effects of increased circulating CORT levels. As outlined in chapter 1, some animal and human studies have demonstrated modest increases in circulating GCs over with advancing age (Belanger et al., 1994, Barrett-‐Connor, 1997, Ferrari et al., 2001b, Zhao et al., 2003), whilst others have shown shown changes in diurnal variation (Sherman et al., 1985, van Coevorden et al., 1991)(Table 1-‐5). Increased serum CORT in global 11β-‐HSD1 KO mice, is thought to reflect a compensatory HPA-‐Axis activation in response to reduced local generation of active GC (Harris et al., 2001). Adrenal glands of 11β-‐ HSD1 KO mice were enlarged, which is also consistent with HPA-‐axis activation although there were no changes in adrenal weights with age in WT mice. 11β-‐HSD1 KO mice had preservation of muscle strength with age when compared to WT animals. There was however no preservation of muscle bulk with age in knockout animals. Our study of skeletal muscle gene expression consisted of an array of 88 target genes. Of these, 3 genes (MuRF1, MSTN, GADD45a) increased with age in WT mice, with these changes attenuated in 11β-‐ HSD1 KO mice, which appear to underpin the preserved muscle strength. Interestingly 4 genes, which have not been previously investigated with respect to pre-‐receptor GC regulation (PSMD11, eif4bp, CHARNB, NCAM1) increase with age although effects of 11β-‐HSD1 KO did not reach statistical significance. Furthermore, GADD45a, eif4bp, CHARNB, NCAM1, in addition to MuRF1 and 157 myostatin, were found to be GC inducible, supportive of an important effect of chronic GC exposure in skeletal muscle ageing. MuRF1, is an E3-‐ubiquitin ligase, which is known to be involved in muscle atrophy associated with a range of conditions. Upregulation of MuRF1 with age has been demonstrated in other rodent models (Altun et al., 2010). It is interesting that MuRF1 but not MAFbx1, was elevated with age and GC treatment in this study, as previous data has shown that MuRF1 KO but not MAFbx/Atrogin1 KO mice are protected against DEX-‐induced myopathy (Baehr et al., 2011). Myostatin is a “negative regulator” of muscle growth, which has been the focus of much recent study. Myostatin KO mice are protected from GC-‐ induced myopathy and maintain double-‐muscle phenotype with ageing compared to controls (Gilson et al., 2007, Morissette et al., 2009). Most intriguing is GADD45a, a small myonuclear protein, which is a regulator of the cell cycle, cell stress response, and is also involved in muscle atrophy (Ebert et al., 2012). It is required for muscle wasting secondary to of different aetiologies including disuse, denervation and fasting (Bongers et al., 2013). It was upregulated in previous skeletal muscle ageing array studies (Welle et al., 2004). It has been suggested that the protein acts as a “convergence point” for upstream regulators of muscle atrophy, and in common with E3-‐ubiquitin ligases, and myostatin it is inducible by FOXO1 (Schakman et al., 2013). In this context our data suggest that GADD45a may also be important in myopathies of ageing and GC-‐excess. We could speculate that a pathway exists by which, 11β-‐HSD1 modulates GR activation and subsequent induction of FOXO1 and myostatin thus promoting activity of MuRF1 and MAFbx/Atrogin1 and the ubiquitin-‐proteosomal-‐system. 158 Eif4bp is known to have a role in the regulation of muscle protein synthesis via eiF4E binding (Shah et al., 2000b). The roles and significance of the other genes that were upregulated with age (PSMD11, NCAM1, and CHARNB) in muscle atrophy are less well characterized. PSMD11 is a proteosomal subunit that is involved in cell senescence (Chondrogianni et al., 2003, Vilchez et al., 2012). NCAM1 is a molecule involved in cell-‐to-‐cell interactions and is important for maintenance of the neuromuscular junction. However it has not previously been investigated with respect to sarcopenia or GC-‐induced muscle atrophy (Chipman et al., 2010). CHRNB1 encodes the b1 subunit of the nicotinic acetylcholine receptor, which sits on the post-‐synaptic side of the neuromuscular junction. Whether these changes represent deleterious or protective compensatory effects remains to be seen. GC-‐treated WT mice shared common changes in skeletal muscle gene expression with old WT mice (MuRF1, Myostatin, GADD45a, eiF4bp, CHARNB and NCAM1), and these changes were attenuated in 11-‐DHC treated 11β-‐HSD1 KO animals. Knockout mice on 11-‐DHC also had preserved grip strength and muscle tissue weights compared to WT animals. It is interesting however that CORT-‐treated 11β-‐HSD1 KO mice had a much lower magnitude of induction of key atrophy genes including MuRF1, MAFbx/Atrogin1, Myostatin and FOXO1, compared to WT mice, in spite of similar circulating CORT levels. We could speculate that this may be due to loss of the ‘feed-‐forward’ action of CORT on 11β-‐HSD1, and inability to reactivate 11DHC, that has been inactivated by 11β-‐HSD2. 159 We have found that 11β-‐HSD1 KO mice are protected from GC-‐mediated myopathy, exhibiting preservation of grip strength and muscle tissue weights. This is a novel observation, with previous studies providing only cell culture evidence for a role of 11β-‐HSD1 in regulating genes involved in muscle proteolysis in cell culture models (E3 ubiquitin ligases: MAFbx/Atrogin1 and MuRF1)(Biedasek et al., 2011). We have developed this work by examining a larger number of key atrophy genes using our in vivo model, demonstrating the importance of the GC mediated increases in FOXO1, and myostatin with downstream effects on ubiquitin ligases. We also confirm previous reports of GCs potentiating 11-‐HSD1 oxo-‐reductase activity in ex-‐vivo muscle samples allowing local amplification. We have demonstrated that our model of GC-‐excess using CORT-‐supplemented drinking water was effective with elevated serum CORT levels in WT treated animals that are comparable to those seen in previous studies (Kotelevtsev et al., 1997). Treatment induced insulin resistance, glucose intolerance and muscle atrophy and weakness in accordance with a ‘Cushing’s’ phenotype. Adrenal gland weights suggested evidence of suppression of HPA axis in GC treated WT mice, and a lack of effect in 11DHC-‐treated KO mice. Compensatory HPA-‐axis activation in 11β-‐HSD1 KO mice as manifested by adrenal enlargement as seen in this study, has been noted previously (Kotelevtsev et al., 1997). Adrenal enlargement in this study is comparable to that described previously from our group (≈45% enlargement). This parallels the situation seen in patients with CRD/ACRD secondary to mutations in the 11β-‐HSD1 and H6PDH genes 160 respectively (Phillipov et al., 1996, Jamieson et al., 1999, Biason-‐Lauber et al., 2000, Lavery et al., 2008, Lawson et al., 2011) GCs induce insulin resistance, however the mechanisms for this are not fully elucidated, with effects on glucose and lipid metabolism in tissues including liver, skeletal muscle, and adipose tissue (Gathercole et al., 2013). We observed that 11DHC-‐treated 11β-‐HSD1 KO mice were protected from insulin resistance and glucose intolerance, in keeping with previous studies using high fat diet and stress (Supplementary Figure S.5.2) (Kotelevtsev et al., 1997, Morton et al., 2001). Furthermore aged 11β-‐HSD1 KO mice had reduced serum insulin levels and area under the curve results for glucose on GTTs compared to age-‐match WT animals (Supplementary Figure S.5.1.). It is possible that effects of improved insulin sensitivity on protein metabolism in 11β-‐HSD1 KO mice may contribute to the preservation of muscle strength with ageing and GC-‐excess. Further characterization of muscle phenotype in aged mice would be useful and measures of speed, endurance and ex-‐vivo strength, along with histological examination of cross-‐sectional area, morphology and fibre-‐type distribution could be considered. Future work could also include investigation of whether dietary manipulation (use of control or ‘western’ diets) would affect outcomes. Animal studies have inherent limitations, with variability between backgrounds, and species, meaning that there is a need for human studies of the effects of 11β-‐ HSD1 on muscle phenotype with ageing and GC-‐treatment. 161 To conclude, we have demonstrated that 11β-‐HSD1 modulates skeletal muscle gene expression changes that are common to ageing and GC-‐excess, in association with improved muscle function. Absence of 11β-‐HSD1 is associated with markers of HPA-‐axis activation, and improved glucose tolerance. Whether there is a place for selective inhibitors of 11β-‐HSD1 in the treatment of muscle atrophy remains to be seen. However putative target conditions could include ageing, medical management of Cushing’s/exogenous GC-‐excess, and other myopathies in which GCs have been implicated in the pathogenesis (critical illness, sepsis and metabolic acidosis)(May et al., 1986, Tiao et al., 1996a). Human observational and proof of concept studies are required to progress towards effective therapies. 162 Chapter 6 – Global Activity and Local Skeletal Muscle Expression of 11β-‐HSD1 Across Human Ageing 163 6.1. Introduction The preceding chapters have illustrated that GC metabolism plays a role in the regulation of skeletal muscle atrophy pathways in cell culture and in animal studies. The central focus this chapter is to investigate whether changes in global activity and skeletal muscle gene expression of 11β-‐HSD1 occur across human ageing, thus providing an insight into a potential novel therapeutic target to improve healthy lifespan. Ageing is associated with a myriad of physiological changes, characterised by alterations in body composition (sarcopenia, central obesity, osteoporosis), development of metabolic dysfunction (insulin resistance) and chronic disease states (cardiovascular disease, hypertension)(Barzilai et al., 2012). Skeletal muscle has dual roles, as a contractile tissue determining locomotor function and as a metabolic tissue important in the endocrine system, making it an important target in the prevention of adverse ageing. As outlined in Chapter 1, age-‐associated declines in various hormonal axes are well characterised and underpin the ‘menopause’, ‘andropause’, ‘adrenopause’, and ‘somatopause’. Studies assessing the effectiveness of hormonal replacement of these axes in preventing features of the ageing phenotype have had mixed results, and are limited by efficacy or long-‐ term safety concerns (Chahal and Drake, 2007). Circulating cortisol levels are maintained under negative feedback regulation via the HPA-‐axis. Local glucocorticoid exposure is also regulated at the pre-‐receptor level by the 11β-‐HSD enzymes, which interconvert “inactive” cortisone and “active” cortisol, with the type 1 isoform acting primarily as an oxo-‐reductase. Many studies have investigated changes in HPA-‐axis function with age, and these 164 were reviewed in-‐depth in Chapter 1. To summarise, HPA-‐axis activation and increases in mean 24-‐hour cortisol secretion, of between 20-‐50% over the adult lifespan were seen in some studies (Dodt et al., 1994, Van Cauter et al., 1996). Alterations in diurnal variation of cortisol secretion, characterized by an earlier acrophase and reduced amplitude (Sherman et al., 1985, van Coevorden et al., 1991), increases in serum morning cortisol (20-‐30% over adult lifespan) (Belanger et al., 1994, Giordano et al., 2001, Ferrari et al., 2001a, Zhao et al., 2003), reduced sensitivity to dexamethasone suppression (Wilkinson et al., 1997, Magri et al., 1997), and delayed normalization of cortisol following stress (Traustadottir et al., 2004) have all been reported with increasing age. Activation of the HPA-‐axis has been associated with morbidity including dementia and the metabolic syndrome (Magri et al., 1997, Lupien et al., 1994, Phillips et al., 1998, Jang et al., 2012). Pre-‐receptor GC metabolism by 11β-‐HSD1 has been implicated in the pathogenesis of the metabolic syndrome and a range of conditions including osteoporosis, inflammatory arthritis and glaucoma (Gathercole et al., 2013). Recently studies have indicated that 11β-‐HSD1 expression/activity is elevated in key tissues with ageing and may be implicated in the development of associated disease states. Our group found a positive correlation between 11β-‐HSD1 oxo-‐ reductase activity and donor age in primary cultures of human osteoblasts (n=18, r=0.58, p<0.01) implicating local tissue GC amplification in the pathogenesis of age-‐associated osteoporosis and GC sensitivity (Cooper et al., 2002). Furthermore the non-‐selective 11β-‐HSD-‐inhibitor carbenoxolone reduced bone resorption markers in healthy volunteers (Cooper et al., 2000). A recent 165 study suggests that local tissue 11β-‐HSD1 has a putative role in the pathogenesis of post-‐menopausal metabolic dysfunction (Andersson et al., 2009). In this study of 23 pre-‐menopausal and 23 post-‐menopausal women, there was evidence of global increases in 11β-‐HSD1 activity, subcutaneous gene expression and hepatic 1st pass metabolism of cortisone in the latter group. The authors concluded that enhanced local tissue generation of active GCs may underpin adverse metabolic features seen after the menopause including central obesity, insulin resistance and dyslipidaemia. This is of particular clinical interest in view of the controversies surrounding the risk benefit profile of conventional Hormone Replacement Therapy (HRT) post-‐menopausally, with a recent Cochrane systematic review of 13 trials (n=38171 patients) showing no difference in myocardial infarctions, cardiovascular disease death, and all cause mortality and increased risk of stroke, venous thromboembolism and pulmonary embolism, with treatment (Main et al., 2013). Concerns over long-‐term safety risks of HRT also limit its use in prevention of osteoporosis and sarcopenia (Maltais et al., 2009, de Villiers and Stevenson, 2012). On this background there is a need for alternative preventative therapies for co-‐morbidities associated with the menopause. Gender-‐specific differences in HPA-‐Axis function cortisol metabolism have been described in a number of studies. Animal studies indicate that 11β-‐HSD1 expression/activity is increased in males vs. females. There is evidence that this may be regulated by a suppressive effect of oestrogen on gene expression. However sex-‐specific patterns of GH-‐secretion have also been implicated with continuous secretion suppressing hepatic 11β-‐HSD1 expression in females in 166 contrast to the pulsatile secretion seen in males, which has no effect (Low et al., 1994, Albiston et al., 1995, Liu et al., 1997). Sexual dimorphism in cortisol metabolism is also apparent in human studies of hypopituitary patients (n=44)(Weaver et al., 1998) and healthy elderly subjects (n=22) (Toogood et al., 2000b). However the factors that regulate the observed differences in enzyme activity have not been fully elucidated with GH status, insulin resistance and fat mass implicated. Although 11β-‐HSD1 has been shown to be present and functionally active in human vastus lateralis samples, and several studies have investigated its relationship with insulin resistance and physiological stress, its role in skeletal muscle ageing has not been assessed (Jang et al., 2006, Jang et al., 2007, Morgan et al., 2009, Salehzadeh et al., 2009, Jang et al., 2009, Dovio et al., 2010). Biedasek et al (2011) were the first to publish on the link between 11β-‐HSD1 and muscle atrophy by demonstrating increased protein degradation and E3-‐ubiquitin ligase expression in primary human myoblasts treated with cortisone, and attenuation of this effect in response to pre-‐treatment with the non-‐selective 11β-‐HSD inhibitor, carbenoxolone. The in-‐vitro work outlined in chapter 4 of this thesis, has confirmed these findings by using a selective 11β-‐HSD1 inhibitor. Furthermore, the novel in vivo mouse studies outlined in chapter 5 have confirmed that skeletal muscle ageing is associated with activation of key GC regulated genes, and that these changes are attenuated in both GC-‐treated and aged 11β-‐HSD1 KO mice on high-‐fat diet in combination with preserved muscle strength. An assessment of skeletal muscle gene expression changes seen with ageing in humans is important in order to provide a rationale for potential future 167 studies using selective 11β-‐HSD1 inhibitors in sarcopenia. Furthermore, to date no definitive assessment of pre-‐receptor GC metabolism has been made in both genders, across the age spectrum. The studies that have been completed tend to be small, with recruitment of subjects limited to one sex and extremes of age. Also many studies rely on tissue-‐banked samples, and have absent or insufficient assessment of important baseline characteristics including serum biochemistry, body composition, and strength testing parameters. On this background, the study outlined in this chapter represents the most in depth assessment of global activity and the first assessment local skeletal muscle 11β-‐HSD1 expression across human ageing in both genders. In addition, detailed phenotyping has been carried out to enable assessment of relationships between 11β-‐HSD1 expression/activity with body composition markers, hormone levels and cardiovascular risk factors. In addition our gene expression array study of skeletal muscle ageing contributes to previous data, which is reliant on smaller subject cohorts, in restricted age groups and pooled samples (Welle et al., 2000, Jozsi et al., 2000, Welle et al., 2003, Giresi et al., 2005). Finally these studies will provide an invaluable resource to be interrogated in future studies of mechanisms of skeletal muscle ageing, and their functional and metabolic consequences and will provide gender and age-‐specific normative data of urine steroid profiles that could help future clinical practice (Deutschbein et al., 2011). 168 6.2. Hypotheses Our central hypothesis is that local tissue 11β-‐HSD1 expression and global activity is upregulated with age in humans and that this contributes to adverse phenotypic features in affected tissues. The central focus of this chapter is skeletal muscle where we hypothesize that local tissue GC generation contributes to muscle weakness and sarcopenia of ageing. 6.3. Research Strategy and Aims Healthy human volunteers of both genders, aged between 20-‐80 years were recruited to the study. They attended the Wellcome Trust Clinical Research Facility at the Queen Elizabeth Hospital, Birmingham where they underwent assessment of anthropometric variables, body composition, and strength testing, along with collection of serum for biochemical analysis, 24-‐hour urine collection for GC/MS and muscle biopsies for gene expression analysis. Our Aims are listed below: a) To determine whether there are age-‐associated changes in skeletal muscle 11β-‐HSD1 expression. b) To determine whether there are age-‐associated changes in global activity of 11β-‐HSD1. c) To determine which genes are involved in skeletal muscle ageing using a focused array approach. d) To determine age-‐associated changes in global corticosteroid secretion and metabolism using GC/MS analysis of 24-‐hour urine collections. 169 e) To establish whether there are significant correlations between 11β-‐ HSD1 expression/activity and phenotypic features (demographic information, body composition, strength, metabolic profile and hormone levels). 6.4. Methods 6.4.1. Human Study Protocol 135 healthy volunteers were recruited to take part in a study designed to investigate the role of 11β-‐HSD1 expression and activity in normal human ageing. Volunteers were of both sexes, aged between 20-‐80 years. Inclusion criteria were BMI between 20-‐30kg/m2. Female subjects were in the follicular phase of the menstrual cycle, or if post-‐menopausal were not on hormone replacement therapy. Subjects prescribed aspirin were asked to discontinue treatment 3 days prior to muscle biopsy. Exclusion criteria included pregnancy, significant past medical history including diabetes mellitus, ischaemic heart disease, cerebrovascular disease, severe respiratory disease, and epilepsy. Other exclusion criteria were glucocorticoid therapy in the past 12 months, use of drugs known to effect GH release, and use of oral anticoagulants. Procedures were carried out over a day visit to the Wellcome Trust Clinical Research Facility at the Queen Elizabeth Hospital Birmingham, University Hospitals Birmingham NHS Foundation Trust. Patients arrived fasted at 0845h having collected a 24-‐ hour urine sample. 170 6.4.1.1. Initial Observations Research nurses measured height and weight of subjects on arrival. Three blood pressure measurements were recorded using an automatic sphygmomanometer with the subject seated. 6.4.1.2. 24-‐hour Urine Collection Volunteers performed this during a convenient 24-‐hour period in the week prior to the Wellcome Trust Clinical Research Facility visit. Volunteers were advised to empty their bladder into the toilet normally on waking on the morning that the collection is started with the time being noted. All urine produced over the subsequent 24 hours was collected into a plain 3-‐litre collection bottle. On receipt of the sample total urine volume was collected and an aliquot of 30ml was transferred to a universal container and stored at -‐80°C pending analysis. 6.4.1.3. Urine Steroid Profiling by Gas Chromatography/Mass Spectrometry Beverly Hughes performed GC/MS analysis in-‐house using a method described previously (Shackleton, 1986, Shackleton, 1993). The protocol involves hydrolysis, extraction and derivatisation stages prior to injection into the GC/MS. 1ml of urine was transferred from the universal container to a glass tube. Free steroids were extracted using C18 Sep pak cartridges. The Sep pak cartridge was washed in 4ml methanol followed by 4ml-‐distilled water. The sample was added to the Sep pak cartridge, applied one drop at a time. The tube was then washed in 4ml-‐distilled water. The sample was then eluted into a clean glass tube with 4ml methanol. The methanol was evaporated under nitrogen at 55°C. Hydrolysis mix 171 was made up (3ml 0.1M acetate buffer (20ml 1M acetic acid+30ml 1MNa acetate+450mldH2O–pH4.8-‐5), 10mg ascorbate (Sigma), 10mg sulphatase (Sigma, Dorset, UK)). 3ml of the mix was added to each tube and was heated at 55°C for 3h. The tubes were then allowed to cool to room temperature. The Sep pak cartridge was washed in 4ml methanol then in the same volume of distilled water. The sample was added to the column, washed in 4ml-‐distilled water and eluted into a clean glass tube containing 4ml methanol. 100μl of internal standard (stigmasterol and cholesterol butyrate) was added to each sample using a glass syringe. Methanol was evaporated under nitrogen at 55°C. 3 drops of 2% methoxyamine-‐pyridine as added to tubes, which were then vortexed. Tubes were heated at 55°C for 1h. 50µl TMSi was added to each sample, which was then vortexed. Tubes were heated to 120oC in an oven overnight. 2ml cyclohexane was added to each sample, and tubes were vortexed. 2ml of distilled water was then added and samples were vortexed. The top layer was transferred to a clean glass tube and evaporated under nitrogen at 55°C. 350µl of cyclohexane was added to sample, which was vortexed and transferred to injection vials. Samples were injected into GC/MS (Hewlett Packard 5970) and 15m fused silica capillary columns with an external standard to allow calibration of the run. Individual metabolites were quantified by calculating relative peak areas by comparison of peak area of sample to corresponding peak in the standard. Diagnostic ratios were then calculated, and high THF+5αTHF/THE, cortols/cortolones, and 11OH-‐androsterone+11OH-‐etiocholanolone/11-‐ oxoetiocholanolone ratios are accepted markers of global 11β-‐HSD1 oxo-‐ reductase activity, assuming normal 11β-‐HSD2 activity indicated by urinary F/E (UFF/UFE) ratios. The coefficient of variance (inter and intra-‐assay) was <10%. 172 6.4.1.4. Dual-‐Energy X-‐ray Absorptiometry (DEXA) Scan DEXA scanning (DPX Lunar Corp, Madison, WI, USA) was used to assess full body composition and bone mineral density. 6.4.1.5. Strength Testing Jumping mechanography using Leonardo Force Plate System: This method utilises forces measured by ground reaction force plates (Novotec, Pforzheim, Germany), over the course of a range of movements, including speed tests (single two leg jump, chair rising test, heel rise test), and force tests (multiple one leg jump, and multiple two leg hop). Maximum forces (Fmax), velocity (Vmax), power output (Pmax), and height of jump were calculated. Volunteers performed the tests as described below. Single two-‐legged jump: Volunteers were asked to perform one jump as high as possible bending their legs before the jump and using their arms to aid them. They were asked to stand still and upright following the jump. This test was repeated a total of 3 times. Outcome parameters were Fmax/BW, Pmax/BW, Vmax and jump height, which have precision values (Veilleux and Rauch, 2010) of, 13.1%, 3.4%, 2.3% & 5.0%, respectively. Chair rising test: This was used to provide a measure of muscle power in those who were unable to jump. The volunteer was asked to sit on a bench with their arms crossed holding their shoulders. They were then asked to stand up straight and sit down as quickly as possible for a total of 5 repetitions. Outcome parameters were Fmax/BW, Pmax/BW & Vmax, which have precision values of, 7.9%, 15.6%, & 10.5%, respectively. Heel-‐Rise Test: This test is useful in volunteers that are unable to perform the 2 previously mentioned tests. They were asked to stand on tiptoes with straight knees, for 5 repetitions. Outcome parameters were Fmax/BW, 173 Pmax/BW & Vmax, and have precision values of, 3.7%, 13.5%, & 10.5%, respectively. Multiple one-‐leg jumps: The volunteer was asked to hop rhythmically with stiff knees. The outcome parameter was Fmax/BW, and precision was 4.2%. Multiple two-‐leg hops: The volunteer was asked to hop on both forefeet as high as possible with stiff knees. Again the output parameter was Fmax/BW, and precision was 5.4%. Hand-‐held dynamometry: The testing procedure involved the use of a grip strength dynamometer (Takei Instruments, Niigata City, Japan). 3 maximal contractions on either side were obtained with 15 seconds rest. Peak absolute strength in kg and relative handgrip strength (kg force per kg bodyweight) were recorded. 6.4.1.6. Fasting Bloods In the fasted state, a 20G intravenous cannula was inserted peripherally, and baseline bloods were taken for analysis. Samples were analysed using clinical assays at the University Hospital Birmingham NHS Foundation Trust laboratories. Assay details (Types of Assay in brackets; Manufactured by Roche Diagnostics Limited, West Sussex, UK, unless otherwise stated): total cholesterol (enzymatic colourmetric), HDL (homogenous enzymatic colourmetric), glucose (enzymatic reference method with hexokinase), CRP (particle enhanced immunoturbidimetric assay), Na+, K+ (ion-‐selective electrode), Urea (kinetic test with urease and glutamate dehydrogenase), creatinine (kinetic colourmetric assay (Jaffe Method)), cortisol, TSH, FT4 (chemiluminescence immunoassay, Advia Centaur, Bayer Diagnostics, Newbury, UK), DHEAS, SHBG and GH (Immulite Immunoassay Siemens AG, Erlangen, Germany). 174 6.4.1.7. Vastus Lateralis Muscle Biopsy I performed all biopsy procedures in this study. A percutaneous Bergstrom technique was used, which has advantages over open biopsy of having lower complication rates, quicker healing, and reduced scarring (Bergstrom, 1975). Suction was used in order to increase sample yield (Evans et al., 1982). This technique has been widely adopted by researchers investigating skeletal muscle metabolism and physiology (Tarnopolsky et al., 2011). The procedure was carried out under sterile conditions. The tip of a 8 French gauge (2.7mm) suction catheter (SP Services, Donnington UK) was cut at an oblique angle and inserted into the end of the trochar which was then inserted into the Bergstom biopsy needle. An area of skin measuring approximately 15cm in diameter, overlying the lateral aspect of the right thigh was cleaned with iodine solution. A sterile drape (Ref 1020 40x40cm, adhesive area 10x12cm, aperture circle 6cm) (3M, St. Paul, Minnesota, USA) was applied. 1-‐2ml of 1% lignocaine solution was infiltrated into the skin via a 23G (0.6mm) needle connected to a 10ml syringe. Subsequently between 2-‐6ml were infiltrated to subcutaneous tissue down to the muscle fascia, using a 21G (0.8mm) needle. A 5mm linear stab incision was made in the skin and subcutaneous tissue midway up the thigh. The biopsy needle was inserted through this incision, and advanced into the muscle, indicated by loss of resistance when passing through the fascia. The trochar was retracted to open the cutting window. The research nurse assisting then applied suction by connecting a 50ml syringe to the end of the catheter. The trochar was then advanced to its previous position, closing the cutting window. The trochar was rotated 360°. The needle was then removed and the sample was inspected. If the sample was inadequate the above procedure was repeated. Samples were 175 placed in labelled cryovials and transferred immediately to liquid nitrogen. Long-‐term storage occurred at -‐80°C. Pressure was applied for 5 minutes, using sterile gauze to obtain wound haemostasis. The wound was closed using steri-‐ strips in a ‘star formation’. It was covered with sterile gauze and a dressing and pressure bandage were applied. Subjects stayed in bed for 30-‐60 minutes post-‐ procedure. Aftercare advice to remove the pressure bandage at 6 hours, and keep the wound dry for 2 days post-‐procedure was given. 6.4.1.8. Microfluidic Gene Expression Array See chapter 2 for full method. Target genes had functions in atrophy, proteolysis, protein synthesis, fibre-‐type switching, apoptosis, GC metabolism, endocrine signalling, inflammation, cell stress response and mitochondrial biogenesis. 6.4.1.9. Ethical Approval Ethical approval was obtained by the Coventry and Warwickshire Research Ethics Committee (REC Reference Number 07/H1211/168). The protocol was approved by the Scientific Committee, of the Welcome Trust Clinical Research Facility, at Queen Elizabeth Hospital Birmingham. The study commenced in October 2010 and was completed in March 2013. Volunteers were recruited from e-‐mails, website postings, and notices placed at the University of Birmingham, University Hospitals Birmingham NHS Foundation Trust, and in the local community. They were given full written information on the study, and gave written informed consent. After study completion they received travel expenses and clinically relevant results were passed on to General Practitioners. 176 6.5. Results 6.5.1. Subject Characteristics 135 patients were recruited in total (77 women and 58 men) with an age distribution as shown in tables 6-‐1 and 6-‐2. Care should be taken when interpreting results in sub-‐group analyses (i.e. age groups and gender) due to loss of statistical power. Ethnic backgrounds of female subjects were as follows: 84% Caucasian, 14% Asian and 2% African-‐Caribbean. Male subjects were also 84% Caucasian, 14% Asian and 2% Mixed Race. A full breakdown of ethnicities by age and sex are shown in supplementary tables S6.1 and S6.2. An analysis of urine steroid markers of global 11β-‐HSD1 activity and skeletal muscle gene expression revealed no differences between Caucasians and Asians (supplementary tables S6.3 and S6.4). Medical conditions of subjects included hypertension (n=17), dyslipidaemia (n=12), asthma (not on steroids)(n=10), previous fractures (n=7), benign prostatic hypertrophy (n=5) and osteoarthritis (n=6). 17 subjects prescribed anti-‐hypertensives and 12 prescribed statins were included in the study. Three volunteers treated with finasteride or dutasteride were excluded from the study. 6.5.2. Baseline Observations Across Human Ageing Cohort As illustrated in Table 6-‐1, systolic blood pressure was increased in those aged 60-‐70 and over 70 years vs. those in the youngest age group, in women (142 and 141 mmHg vs. 113 mmHg, p-‐values <0.001 and <0.05 respectively). In addition middle-‐aged women had increased BMIs compared to the young women (26 kg/m2 in 40-‐50 and 50-‐60 year age groups vs. 21 kg/m2 in 20-‐30 year age group, 177 p<0.001 and p<0.05, respectively). In men, no significant differences in blood pressure or BMI were seen between groups (see table 6-‐2). Age Group (years): 20-‐30 30-‐40 40-‐50 50-‐60 60-‐70 >70 N 15 12 15 12 16 7 SBP (mmHg) 113 119 119 118 142*** 141* (110-‐121) (110-‐123) (113-‐128) (112-‐126) (133-‐151) (127-‐157) DBP (mmHg) 77 69 74 71 84 70 (61-‐82) (67-‐81) (71-‐82) (63-‐79) (68-‐88) (67-‐89) BMI (Kg/m2) 21 23 26*** 26** 24 24 (21-‐24) (21-‐25) (25-‐29) (25-‐27) (23-‐27) (22-‐26) Table 6-‐1: Observational data from female ageing study participants (n=77). SBP values were increase in 60-‐70 and >70 year age groups compared to those aged 20-‐30 years. BMI values for 40-‐ 50 and 50-‐60 year age groups were increased compared to the 20-‐30 year age group. Statistically significant differences from the 20-‐30 year age-‐group as derived from Dunn’s multiple comparison test are highlighted in bold *p<0.05, **p<0.01 and ***p<0.001. Overall p-‐values from Kruskal-‐Wallis analysis were as follows: SBP: p<0.0001, DBP: p=0.51 and BMI: p=0.0005. Data are expressed as medians and interquartile ranges (IQRs). SBP = systolic blood pressure, DBP = diastolic blood pressure and BMI = body mass index. Age Group (years) N SBP (mmHg) DBP (mmHg) BMI (Kg/m2) 20-‐30 30-‐40 40-‐50 50-‐60 60-‐70 >70 13 9 10 4 13 9 136 (128-‐147) 148 (122-‐160) 130 (122-‐139) 77 (71-‐81) 24 (24-‐25) 123 (121-‐128) 125 146 (124-‐129) (142-‐150) 77 (71-‐87) 83 (75-‐88) 89 (85-‐93) 81 (72-‐91) 83 (76-‐88) 22 (21-‐25) 28 (27-‐28) 26 (25-‐27) 27 (24-‐31) 25 (25-‐27) Table 6-‐2: Observational data from male ageing study participants (n=58). Overall p-‐values from Kruskal-‐Wallis analysis were as follows: SBP: p=0.05, DBP: p=0.53 and BMI: p=0.01. However, there were no statistically significant differences from the 20-‐30 year age group as derived from Dunn’s multiple comparison test. Data are expressed as medians and interquartile ranges (IQRs). 178 6.5.3. Serum Biochemistry Across Human Ageing Cohort Baseline serum biochemical test results for women and men, by age group are summarized in tables 6-‐3 and 6-‐4, respectively. Lower levels of serum IGF-‐I and DHEAS were observed in the older age groups in both sexes (IGF-‐I: women, 60-‐ 70 years = 11.9 nmol/L, >70 years = 11.6 nmol/L vs. 20-‐30 years = 26.8 nmol/L p<0.001; indicative of the so-‐called somatopause and andropause. DHEAS: women, 60-‐70 years = 1.4 nmol/L, >70 years 2.0 nmol/L vs. 20-‐30 years = 4.5 nmol/L, p-‐values <0.001 and <0.01, respectively; men IGF-‐I, 60-‐70 years = 17.1 nmol/L, >70 years = 15.9 nmol/L, vs. 20-‐30 years = 26.7 nmol/L, p-‐values <0.01; men DHEAS 60-‐70 years = 2.5 nmol/L and >70 years = 2.8 nmol/L vs. 20-‐30 years = 8.8 nmol/L, p-‐values <0.001), indicative of the normal somatopause and andropause. Elevations in LH and FSH levels were also seen in women in keeping with the menopause (LH: 50-‐60 years = 41.2 IU/L, 60-‐70 years = 30.8 IU/L vs. 20-‐30 years = 7.4 IU/L, p-‐values <0.001; FSH: 50-‐60 years = 61.3 IU/L, 60-‐70 years = 73.2 IU/L, >70 years = 54.3 IU/L vs. 20-‐30 years = 4.6 IU/L, p-‐ values <0.001). There appeared to be a trend towards reduced 9am cortisol levels with increasing age, with statistically significant differences seen in the 40-‐ 50 and 60-‐70 year age groups (9am cortisol 40-‐50 years = 217 nmol/L, 60-‐70 years = 209 nmol/L vs. 20-‐30 years = 496 nmol/L, p-‐values <0.01). No significant differences in 9am cortisol were observed in men. Statistically significant changes for women and men are illustrated in Figures 6-‐1 and 6-‐2, respectively. 179 Age Group (years): N Fasting Glucose (mmol/L) Total Cholesterol (mmol/L) HDL-‐C (mmol/L) 9am Cortisol (nmol/L) SHBG (nmol/L) IGF-‐I (nmol/L) FSH (IU/L) LH (IU/L) Testosterone (nmol/L) DHEAS (nmol/L) Serum Biochemistry: Female Study Subjects 20-‐30 30-‐40 40-‐50 50-‐60 60-‐70 >70 15 12 15 12 16 7 4.5 (4.3-‐4.8) 4.5 (4.3-‐4.7) 4.5 (4.3-‐4.8) 4.8 (4.5-‐5.1) 4.9 (4.6-‐5.1) 4.9 (4.8-‐5.5) 3.9 (3.8-‐4.5) 4.6 (3.7-‐4.8) 4.8 (4.7-‐5.1) 5.7 (5.4-‐5.8) 5.6 (4.5-‐6.5) 5.6 (5.0-‐5.9) 1.6 (1.2-‐1.8) 1.5 (1.4-‐1.6) 1.6 (1.4-‐1.8) 1.8 (1.4-‐2.2) 2.0 (1.8-‐2.1) 1.8 (1.7-‐1.9) 496 (315-‐670) 218 (167-‐446) 217** (179-‐254) 273 (211-‐352) 209** (178-‐245) 212 (163-‐301) 58.5 (41.4-‐77.4) 79.7 (49.1-‐205.3) 56.2 (29.8-‐66.1) 61.9 (38.9-‐71.8) 70.0 (56.2-‐85.1) 76.1 (45.7-‐96.1) 26.8 (23.4-‐33.7) 22.7 (16.7-‐24.6) 20.9 (16.6-‐24.0) 19.3 (15.6-‐23.4) 11.9*** (11.1-‐13.8) 11.6*** (9.5-‐14.0) 4.6 (2.2-‐5.2) 5.0 (3.3-‐9.1) 7.7 (4.7-‐12.3) 61.3*** (57.8-‐ 102.0) 73.2*** (65.9-‐82.4) 54.3*** (38.3-‐60.7) 7.4 (4.7-‐9.2) 2.3 (1.4-‐5.4) 6.8 (4.1-‐10.6) 41.2*** (31.4-‐45.4) 30.8*** (23.7-‐39.7) 25.9 (17.5-‐28.4) 1.0 (0.6-‐1.1) 0.7 (0.5-‐0.9) 0.7 (0.5-‐0.8) 0.7 (0.5-‐0.9) 0.5 (0.3-‐0.7) 0.5* (0.4-‐0.7) 4.5 (3.6-‐5.8) 3.0 (2.5-‐4.7) 3.0 (2.3-‐3.4) 3.0 (1.7-‐3.7) 1.4*** (0.7-‐2.1) 2.0** (1.1-‐2.3) Table 6-‐3: Serum biochemistry results for female ageing study subjects (n=77). Statistically significant differences from the 20-‐30 year age-‐group as derived from Dunn’s multiple comparison test are highlighted in bold *p<0.05, **p<0.01 and ***p<0.001. Data are expressed as medians and interquartile ranges. 180 Figure 6-‐1: Serum hormone levels for female ageing study subjects (n=77). There were increases in A) LH and B) FSH in older age groups and reductions in C) 9am cortisol, D) IGF-‐I, E) DHEAS and F) Testosterone in older age groups. *P<0.05, **P<0.01 & ***P<0.001 vs. 20-‐30 years age-‐group; γP<0.05, γγP<0.01 and γγγP<0.001 vs. 30-‐40 years age-‐group; ΦP<0.05 and ΦΦP<0.01 vs. 40-‐50 years age-‐group and ΩP<0.05 vs. 50-‐60 years age-‐group. Overall p-‐values from Kruskal-‐ Wallis tests: a), b), d) and e) P<0.0001; c) P<0.001 and f) P=0.05. Medians and Interquartile ranges (IQRs) shown. 181 Serum Biochemistry: Male Ageing Study Subjects Age Group (years) 20-‐30 30-‐40 40-‐50 50-‐60 60-‐70 >70 N 13 9 10 4 13 9 Fasting Glucose 5.0 5.0 4.7 5.1 5.1 5.1 (mmol/L) (4.4-‐5.1) (4.8-‐5.3) (4.6-‐5.1) (4.9-‐5.3) (4.8-‐5.6) (4.9-‐5.5) 4.2 4.5 5.1 5.0 5.4 4.2 Total Cholesterol (3.8-‐4.7) (4.1-‐4.9) (4.3-‐5.7) (4.8-‐5.0) (5.0-‐6.3) (3.8-‐4.3) (mmol/L) HDL-‐C 1.3 1.4 1.3 1.3 1.5 1.4 (mmol/L) (1.1-‐1.5) (1.2-‐1.4) (1.1-‐1.3) (1.2-‐1.4) (1.4-‐1.6) (1.2-‐1.6) 9am Cortisol 362 367 256 309 282 261 (nmol/L) (278-‐500) (290-‐452) (204-‐300) (217-‐365) (188-‐359) (226-‐342) SHBG 23.4 28.8 34.8 41.2 42.9 51.1 (nmol/L) (17.6-‐33.3) (25.6-‐32.3) (29.1-‐39.7) (35.6-‐42.5) (32.5-‐67.5) (32.6-‐59.7) IGF-‐I 26.7 20.5 19.4 19.2 17.1** 15.9** (nmol/L) (23.7-‐37.8) (19.8-‐23.7) (16.2-‐23.2) (17.5-‐21.1) (15.3-‐18.6) (12.6-‐17.3) FSH 3.0 3.8 4.9 3.9 4.7 5.8* (IU/L) (1.7-‐3.6) (2.2-‐5.0) (3.0-‐7.5) (3.0-‐6.5) (4.0-‐6.5) (3.9-‐7.1) LH 4.1 3.3 3.5 3.4 4.4 7.1 (IU/L) (2.8-‐5.0) (2.3-‐4.0) (2.3-‐4.0) (3.0-‐4.5) (2.7-‐5.2) (5.0-‐7.5) Testosterone 18.3 14.6 16.9 12.2 15.2 14.7 (nmol/L) (14.8-‐20.3) (11.4-‐18.3) (12.5-‐17.8) (11.3-‐14.5) (11.5-‐20.0) (13.0-‐17.8) DHEAS 8.8 7.6 5.6 4.7 2.5*** 2.8*** (nmol/L) (7.5-‐9.9) (7.4-‐9.8) (4.9-‐7.0) (3.6-‐5.4) (2.2-‐3.7) (2.3-‐3.0) Table 6-‐4: Serum biochemistry results for male ageing study subjects (n=58). Statistically significant differences from the 20-‐30 year age-‐group as derived from Dunn’s multiple comparison test are highlighted in bold *p<0.05, **p<0.01 and ***p<0.001. Data are expressed as medians and interquartile ranges (IQRs). 182 Figure 6-‐2: Serum hormone levels for male ageing study subjects (n=58). There were increases in a) LH and b) FSH levels in the oldest age group and reductions in d) IGF-‐I and e) DHEAS in the oldest 2 age-‐groups. There were no significant differences between groups for c) 9am cortisol or f) testosterone. *P<0.05, **P<0.01 and ***P<0.001 vs. 20-‐30 year age-‐group; γP<0.05, and γγγP<0.001 vs. 30-‐40 year age-‐group. Overall p-‐values from Kruskal-‐Wallis tests: a) and b) P<0.05, c) P=0.05, d) P<0.001, e) P<0.0001 and f) P=0.46. Median and interquartile ranges (IQRs) shown. 183 6.5.4. Body Composition Analysis Across Human Ageing in Females Table 6-‐5 and figure 6-‐3 summarise the DEXA body composition analysis findings observed in female ageing study subjects. Fat mass and body fat % were higher in middle and older age groups in women (total fat mass, 40-‐50 years = 23.9kg, IQR 20.2-‐27.4, 50-‐60 years = 24.8kg, IQR 24.0-‐26.7 vs. 20-‐30 years = 16.1kg, IQR 14.1-‐18.2 p-‐values <0.05 and <0.001 respectively; body fat % 50-‐60 years = 36.8kg, IQR 35.5-‐38.1, 60-‐70 years = 35.0kg, IQR 31.7-‐37.8 vs. 20-‐30 years 27.5kg, IQR 25.3-‐31.1, p-‐values <0.01 and <0.05, respectively). In addition women aged 60-‐70 years had lower bone mineral content and density compared those in the youngest age group (BMC: 60-‐70 years = 1.8kg, IQR 1.7-‐1.9 vs. 20-‐30 years 2.0kg, IQR 1.9-‐2.1, p<0.01; BMD: 60-‐70 years =1.0g/cm2, IQR 0.9-‐1.0 vs. 20-‐ 30 years = 1.1g/cm2, IQR 1.0-‐1.2, p<0.01). Age Group (years) N Total Lean Mass (kg) Total Fat Mass (kg) Body Fat (%) BMC (kg) BMD (g/cm2) Body Composition Analysis (DEXA): Female Ageing Study Subjects (Medians and IQRs) 20-‐30 30-‐40 40-‐50 50-‐60 60-‐70 >70 15 12 15 12 16 7 37.8 (36.2-‐42.7) 42.2 (39.8-‐44.4) 41.3 (39.9-‐43.0) 39.9 (36.3-‐41.9) 40.4 (37.4-‐42.7) 16.1 (14.1-‐18.2) 18.3 (14.4-‐20.6) 43.3 (39.4-‐45.5) 23.9* (20.2-‐27.4) 21.2 (19.2-‐24.2) 21.3 (19.6-‐22.7) 27.5 (25.3-‐31.1) 2.0 (1.9-‐2.1) 1.1 (1.0-‐1.2) 28.2 (25.2-‐31.7) 34.7 (31.2-‐37.7) 24.8*** (24.0-‐26.7) 36.8** (35.5-‐38.1) 35.0* (31.7-‐37.8) 33.9 (32.2-‐34.5) 2.3 (1.9-‐2.4) 2.2 (2.0-‐2.3) 2.0 (2.0-‐2.1) 1.8** (1.7-‐1.9) 2.0 (1.9-‐2.2) 1.1 (1.0-‐1.2) 1.1 (1.1-‐1.2) 1.1 (1.0-‐1.1) 1.0** (0.9-‐1.0) 1.1 (1.0-‐1.1) Table 6-‐5: DEXA body composition analysis from female subjects in ageing study (n=77). Statistically significant differences from the 20-‐30 year age-‐group as derived from Dunn’s multiple comparison test are highlighted in bold *p<0.05, **p<0.01 and ***p<0.001. Data are expressed as medians and interquartile ranges (IQRs). BMC = bone mineral content and BMD = bone mineral density. 184 Figure 6-‐3: DEXA body composition analysis in female ageing study subjects (n=77). There were no differences between age groups in a) Total Lean Mass, however there was evidence of reduced BMD (b) in the 60-‐70 year age-‐group and increased total fat mass (c) in the ‘middle-‐aged’ groups and d) % body fat in the middle and older-‐age groups. *P<0.05, **P<0.01 and ***P<0.001 vs. 20-‐30 year age-‐group; γP<0.05 and γγP<0.01 vs. 30-‐40 year age-‐group; ΦP<0.05 vs. 40-‐50 year age group. Overall P-‐values from Kruskal-‐Wallis tests: a) P=0.34, b) P<0.01, c) and d) P<0.001. Medians and interquartile ranges (IQRs) shown. BMC = bone mineral content and BMD = Bone mineral density. 185 6.5.5. Body Composition Analysis Across Human Ageing in Male Subjects No statistically significant differences in body composition parameters were seen with age in men (see table 6-‐6 and figure 6-‐4). Body Composition Analysis (DEXA): Male Ageing Study Subjects (Medians and IQRs) Age Group (years): 20-‐30 30-‐40 40-‐50 50-‐60 60-‐70 >70 N Total Lean Mass (kg) 13 9 10 4 13 9 Total Fat Mass (g) Body Fat (%) BMC (kg) BMD (g/cm2) 59.0 51.2 68.1 60.7 58.3 52.1 (57.4-‐61.0) (48.1-‐58.0) (61.3-‐74.1) (61.3-‐74.1) (54.8-‐66.3) (50.8-‐54.3) 15.2 13.7 17.5 17.5 20.2 16.2 (13.1-‐16.4) (11.5-‐20.8) (14.1-‐20.3) (15.7-‐18.5) (15.3-‐25.3) (14.0-‐17.9) 19.7 21.8 19.7 22.1 24.2 22.3 (17.0-‐21.2) (18.0-‐22.3) (14.8-‐22.6) (20.7-‐23.2) (22.5-‐24.7) (21.7-‐24.6) 2.6 (2.5-‐2.8) 2.4 (2.3-‐2.5) 2.7 (2.6-‐3.1) 2.5 (2.4-‐2.7) 2.7 (2.5-‐3.0) 2.5 (2.4-‐2.6) 1.2 (1.1-‐1.2) 1.1 (1.1-‐1.2) 1.2 (1.1-‐1.2) 1.2 (1.1-‐1.2) 1.2 (1.1-‐1.2) 1.2 (1.1-‐1.2) Table 6-‐6: DEXA body composition analysis from male subjects in ageing study (n=58). There were no statistically significant differences between groups using Kruskal-‐Wallis analysis with Dunn’s multiple comparison tests. Data are expressed as medians and interquartile ranges (IQRs). BMC = bone mineral content and BMD = bone mineral density. 186 Figure 6-‐4: DEXA body composition analysis in male ageing study subjects (n=58). There were no statistically significant differences between age groups in a) total lean mass (b) total bone mineral density c) total fat mass d) % body fat, using Kruskal-‐Wallis analysis in conjunction with Dunn’s multiple comparison tests. Overall p-‐values from Kruskal-‐Wallis tests: a) P=0.05, b) P=0.30, c) P=0.34 and d) P=0.12. Medians and interquartile ranges (IQRs) shown. BMD = bone mineral density. 187 6.5.6. Strength Testing Parameters Across Human Ageing in Female Subjects The results of strength testing analysis derived from grip strength dynamometry and jump-‐plate mechanography for women are presented in table 6-‐7 and figure 6-‐5. An age-‐associated reduction in many strength test parameters is apparent, with lower standing 2-‐legged jump (S2LJ) maximal power (Pmax), and velocity (Vmax), jump height and chair rise Pmax compared to the youngest group (S2LJ Pmax (w/kg): 60-‐70 years = 26.0, IQR 22.8-‐28.4, >70 years = 25.8, IQR 25.2-‐28.2 vs. 20-‐30 years = 39.0, IQR 32.2-‐43.9, p-‐values <0.001 and <0.01, respectively; S2LJ Vmax (m/s): 60-‐70 years = 1.7, IQR 1.5-‐1.8, >70 years 1.8, IQR 1.7-‐1.9 vs. 20-‐30 years = 2.2, IQR 2.0-‐2.4, p-‐values <0.001 and <0.05, respectively). Age Group (years) N Grip Strength (kg) S2LJ Pmax (w/kg) S2LJ Vmax (m/s) S2LJ Height (cm) Chair Rise Pmax (w/kg) Heel Rise Pmax (w/kg) Strength Testing Analysis: Female Ageing Study Subjects (Medians and IQRs) 20-‐30 30-‐40 40-‐50 50-‐60 60-‐70 >70 15 12 15 12 16 7 26.0 (20.5-‐30.7) 27.0 (25.7-‐27.8) 29.5 28.0 (25.6-‐33.3) (25.3-‐29.4) 29.3 27.9 (27.1-‐30.6) (26.5-‐29.0) 39.0 34.8 (32.2-‐43.9) (33.2-‐38.8) 33.2 30.6 26.0*** 25.8** (28.6-‐35.9) (29.2-‐31.5) (22.8-‐28.4) (25.2-‐28.2) 2.2 (2.0-‐2.4) 34 (29-‐40) 10.4 (8.6-‐11.0) 4.5 (4.1-‐5.2) 2.0 (2.0-‐2.1) 1.9 (1.8-‐1.9) 1.8 (1.8-‐1.9) 1.7*** (1.5-‐1.8) 1.8* (1.7-‐1.9) 30 (29-‐34) 25 (23-‐28) 26 (23-‐28) 24** (20-‐27) 25 (23-‐27) 10.5 (8.9-‐11.4) 9.7 (8.4-‐10.6) 9.4 (8.0-‐10.0) 7.6* (6.8-‐8.6) 7.7 (7.4-‐9.7) 5.5 (3.7-‐6.5) 5.5 (3.7-‐5.8) 4.6 (3.7-‐5.2) 3.8 (3.4-‐4.1) 3.8 (3.2-‐4.3) Table 6-‐7: Strength testing by grip strength dynamometry and jump-‐plate mechanography in female ageing study subjects (n=77). Statistically significant differences from the 20-‐30 year age group are highlighted in bold. *P<0.05, **p<0.01 and ***p<0.001. Data are expressed as medians and interquartile ranges (IQRs). S2LJ = standing 2-‐legged jump, Vmax = maximal velocity, Pmax = maximal power. 188 Figure 6-‐5: Strength testing by jump-‐plate mechanography in female ageing study subjects (n=77). Values of a) S2LJ Pmax, b) S2LJ Vmax were reduced in the 60-‐70 and >70 year old age groups compared to the 20-‐30 and 30-‐40 year age groups. Values of c) S2LJ Jump height and d) chair rise Pmax were reduced in the 60-‐70 year age group compared to the 20-‐30 and 30-‐40 year age groups. *P<0.05, **P<0.01 and ***P<0.001 vs. 20-‐30 year age group; γP<0.05, γγP<0.01 and γγγP<0.001 vs. 30-‐40 year age group. Overall p-‐values from Kruskal-‐Wallis tests: a), b) P<0.0001, c) P<0.001 and d) P<0.05. Medians and interquartile ranges (IQRs) shown. S2LJ = standing 2-‐legged jump. 6.5.7. Strength Testing Parameters Across Human Ageing in Male Subjects The strength testing characteristics of male study volunteers divided by age group are summarized in table 6-‐8 and figure 6-‐6. The results followed a similar pattern to that seen in women, with reductions in several jump-‐plate 189 mechanography values in the oldest groups (S2LJ Pmax (w/kg): 60-‐70 years = 34.7, IQR 31.9-‐26.5, >70 years = 33.7, IQR 30.5-‐37.1 vs. 20-‐30 years = 52.2, IQR 47.9-‐55.0, p-‐values <0.001 and <0.01, respectively; S2LJ Vmax (m/s): 60-‐70 years = 2.0, IQR 1.9-‐2.2, >70 years = 1.8, IQR 1.7-‐2.0 vs. 20-‐30 years = 2.7, IQR 2.4-‐2.8, p-‐values <0.01 and <0.001, respectively; S2LJ Height (cm): 60-‐70 years = 32, IQR 26-‐34, >70 years = 27, IQR 23-‐29 vs. 20-‐30 years 46, IQR 42-‐50, p-‐values <0.01 and <0.001, respectively; chair rise Pmax (w/kg): 60-‐70 years = 9.9, IQR 8.7-‐10.9, >70 years = 9.8, IQR 9.1-‐10.5 vs. 20-‐30 years = 15.1, IQR 12.0-‐15.4, p-‐ values <0.01). Age Group (years) N Grip Strength (kg) S2LJ Pmax (w/kg) S2LJ Vmax (m/s) S2LJ Height (cm) Chair Rise Pmax (w/kg) Heel Rise Pmax (w/kg) Strength Testing Analysis: Male Ageing Study Subjects (Medians and IQRs) 20-‐30 30-‐40 40-‐50 50-‐60 60-‐70 >70 9 10 4 13 9 46.2 (42.9-‐51.2) 37.7 (34.5-‐38.5) 13 44.9 (41.0-‐50.6) 42.2 52.2 39.4 (40.3-‐46.6) (48.5-‐61.7) (37.7-‐44.0) 52.2 (47.9-‐55.0) 45.5 41.9 37.4 34.7*** 33.7** (45.4-‐50.9) (38.2-‐47.6) (37.1-‐40.3) (31.9-‐26.5) (30.5-‐37.1) 2.7 (2.4-‐2.8) 2.6 (2.5-‐2.8) 2.3 (2.1-‐2.6) 2.3 (2.3-‐2.4) 2.0** (1.9-‐2.2) 1.8*** (1.7-‐2.0) 46 (42-‐50) 15.1 (12.0-‐15.4) 5.9 (4.3-‐6.1) 45 (43-‐52) 37 (29-‐45) 40 (40-‐41) 32** (26-‐34) 27*** (23-‐29) 10.6 (9.8-‐10.9) 9.9** (8.7-‐10.9) 9.8** (9.1-‐10.5) 4.5 (3.8-‐5.4) 4.1 (3.2-‐4.9) 4.3 (3.6-‐3.8) 12.9 13.4 (12.1-‐13.6) (10.0-‐14.2) 5.1 (4.2-‐6.0) 6.1 (4.8-‐7.1) Table 6-‐8: Strength testing by grip strength dynamometry and jump-‐plate mechanography in male ageing study subjects (n=58). Statistically significant differences from the 20-‐30 year age-‐ group are highlighted in bold *p<0.05, **p<0.01 and ***p<0.001. Data are expressed as medians and interquartile ranges (IQR). S2LJ = standing 2-‐legged jump, Vmax = maximal velocity, Pmax = maximal power. 190 Figure 6-‐6: Strength testing by jump-‐plate mechanography in male ageing study subjects (n=58). Values of a) S2LJ Pmax, b) S2LJ Vmax and c) S2LJ Jump height were reduced in the 60-‐70 and >70 year old age groups compared to the 20-‐30 and 30-‐40 year age groups. Values of d) chair rise Pmax were reduced in the 60-‐70 and >70 year age groups compared to the 20-‐30 year age group only. **P<0.01 and ***P<0.001 vs. 20-‐30 year age group; γP<0.05 and γγP<0.01 vs. 30-‐40 year age group. Overall P-‐values from Kruskal-‐Wallis tests: a) b) and c) P<0.0001 and d) P<0.001. Medians and interquartile ranges (IQRs) shown. S2LJ = standing 2-‐legged jump. 191 6.5.8. Steroid Metabolite Excretion Across Human Ageing in Female Subjects In order to assess whether there were any age associated differences in 24-‐hour cortisol secretion or global activity of cortisone/cortisol metabolizing enzymes we assessed steroid metabolite excretion levels using gas chromatography/mass spectrometry analysis of 24-‐hour urine samples provided at baseline (n=77). (THF+5αTHF)/THE ratios were used as a measure of global 11β-‐HSD1 activity, along with cortols/cortolones. In addition 11β-‐HSD2 activity was assessed by F/E ratios and 5α-‐reductase activities were estimated using THF/5αTHF ratios. Differences between age groups were assessed using Kruskal-‐Wallis testing and Dunn’s post-‐test correction. The results for female subjects are summarized in table 6-‐9, the only significant finding being an increased (THF+5αTHF)/THE ratio, indicative of higher 11β-‐HSD1 activity, in the oldest age group (>70 years = 0.94, IQR 0.87-‐1.02 vs. 20-‐30 years = 0.77, IQR 0.69-‐0.87, overall p=0.02). Full urine steroid analysis results for women are summarized in supplementary tables S6.5 and S6.6, with the most marked changes being age-‐associated reductions in androgen excretion rates. 192 Urine Steroid Analysis (GC/MS): Female Ageing Study Subjects (Medians and IQRs) Age Group (years) N (THF+5αTHF)/ THE cortols/ cortolones Total F metabolites (μg/24h) F/E THF/5αTHF 20-‐30 30-‐40 40-‐50 50-‐60 60-‐70 >70 15 12 15 12 16 7 0.77 (0.69-‐0.87) 0.91 (0.86-‐1.14) 0.89 (0.83-‐1.14) 0.80 (0.66-‐0.88) 0.69 (0.05-‐0.84) 0.94 (0.87-‐ 1.02) 0.02 0.42 (0.37-‐0.51) 0.41 (0.37-‐0.48) 0.42 (0.36-‐0.54) 0.46 (0.30-‐0.50) 0.36 (0.31-‐0.44) 0.42 (0.37-‐0.53) 0.62 7151 (6096-‐ 7424) 0.38 5413 5565 6562 (3432-‐7250) (4298-‐6687) (5261-‐7792) 4665 4846 (4117-‐7929) (4573-‐6637) Overall P-‐value 0.75 (0.61-‐0.92) 0.63 (0.50-‐0.70) 0.58 (0.52-‐0.62) 0.56 (0.51-‐0.70) 0.62 (0.53-‐0.66) 0.70 (0.62-‐0.76) 0.14 1.57 (0.79-‐2.41) 1.33 (1.10-‐1.65) 1.35 (1.14-‐1.59) 1.48 (1.25-‐1.73) 1.90 (1.42-‐2.79) 1.16 (0.90-‐1.33) 0.24 Table 6-‐9: Urine steroid analysis of markers of glucocorticoid metabolism by GC/MS in female ageing study subjects (n=77). Overall p-‐values from Kruskal-‐Wallis testing are shown in the right-‐sided column. P-‐values <0.05 were used to indicate significant differences in (THF+5αTHF)/THE between age groups. However, according to Dunn’s multiple comparison tests there were no differences between groups. Data are expressed as medians and interquartile ranges (IQRs). 6.5.9. Steroid Metabolite Excretion Across Human Ageing in Male Subjects Urine steroid metabolite ratios of markers of global activity of cortisone/cortisol metabolizing enzymes across age, derived from gas chromatography/mass spectrometry analysis of 24 hour urine samples are summarized in table 6-‐10 (n=58). No statistically significant differences between age groups were seen in these ratios. Full details of all steroid metabolites analysed in men are 193 summarized by age group in supplementary tables S6.7 and S6.8, with the most striking differences seen in reduced androgen levels. Urine Steroid Analysis (GC/MS): Male Ageing Study Subjects (Medians and IQRs) 20-‐30 13 Age Group (years) N 30-‐40 9 (THF+5aTHF)/THE 0.98 0.91 (0.76-‐1.04) (0.80-‐1.11) cortols/ 0.39 0.37 cortolones (0.36-‐0.47) (0.34-‐0.50) Total F metabolites 10979 8904 (μg/24h) (6571-‐15828) (5878-‐13317) F/E 0.73 0.70 (0.64-‐0.74) (0.59-‐0.84) THF/5a THF 0.93 1.06 (0.74-‐1.03) (0.59-‐1.24) 40-‐50 50-‐60 10 60-‐70 4 >70 13 9 0.85 (0.81-‐1.28) 1.20 (1.04-‐1.39) 0.95 (0.85-‐1.03) 0.51 (0.40-‐0.57) 0.42 (0.37-‐0.48) 0.42 (0.37-‐0.50) 8118 10192 9611 (7151-‐10803) (9008-‐10914) (8061-‐12223) 0.67 (0.64-‐0.74) 0.70 (0.57-‐0.78) 0.65 (0.56-‐0.76) 0.92 (0.76-‐1.37) 0.82 (0.72-‐0.91) 1.49 (1.10-‐1.83) 1.03 (0.94-‐ 1.15) 0.39 (0.34-‐ 0.46) 8216 (7551-‐ 9873) 0.71 (0.57-‐ 0.84) 1.09 (1.05-‐ 1.63) Table 6-‐10: Urine steroid analysis of markers of glucocorticoid metabolism by GC/MS in male ageing study subjects (n=58). Overall p-‐values from Kruskal-‐Wallis analysis are shown in the right-‐sided column. There were no significant differences between age groups. Data are expressed as medians and interquartile ranges (IQRs). 6.5.10. Skeletal Muscle Gene Expression Across Human Ageing in Female Subjects In order to assess changes in local gene expression, real-‐time PCR based microfluidic gene expression arrays were performed on vastus lateralis muscle biopsies from human study subjects. Samples from 55 women were assessed with subjects divided into 2 groups for statistical analysis. An arbitrary cut-‐off of 50 years was used to divide the groups. This age was selected as it took into 194 Overall P-‐value 0.64 0.79 0.88 0.81 0.13 account the major physiological changes seen following the menopause and it allowed sufficient statistical power. Results for all 92 target genes analysed by age group are summarised in supplementary tables S6.9, parts I-‐III. Delta CT values, normalised to reference gene expression (18S) are shown and lower numbers are indicative of increased gene expression. Of these 92 genes, statistically significant changes in expression were observed in 6, with these results summarised in table 6-‐11. These genes were 11β-‐HSD1, hypoxia inducible factor 1, alpha subunit (HIF-‐1a), growth arrest and DNA-‐damage-‐ inducible alpha (GADD45a), the proteasomal subunit alpha 2 (PSMA2) and 26S subunit, non-‐ATPase 4 (PSMD4), and skeletal muscle myosin heavy chain 4 (MYH4). Human Skeletal Muscle Gene Expression: Female Ageing Study Subjects Age Group (years) <50 (N=23) >50 (N=22) Delta CT Delta CT Fold-‐Change Gene (Medians and IQRs) (Medians and IQRs) P-‐Value 11β-‐HSD1 16.81 (16.47-‐17.55) 15.90 (15.21-‐16.39) 2.26 0.0007 HIF-‐1a 13.61 (13.43-‐14.54) 13.21 (12.65-‐13.73) 1.43 0.02 GADD45a 17.92 (17.53-‐18.26) 17.14 (16.45-‐17.77) 1.83 0.005 PSMA2 13.91 (13.56-‐14.87) 13.09 (12.60-‐13.80) 1.90 0.004 PSMD4 18.10 (17.45-‐18.59) 17.07 (16.12-‐18.13) 2.00 0.006 MYH4 18.24 (17.40-‐18.85) 17.28 (16.69-‐18.17) 2.00 <0.05 Table 6-‐11: Human skeletal muscle (vastus lateralis) gene expression in female subjects aged <50 year vs. those aged >50, as analysed by microfluidic array (n=55). Statistically significant differences between age groups were seen in 6 genes of the 92 analysed. Data for all genes analysed are shown in supplementary tables. Median and inter-‐quartile ranges (IQRs) for delta CT values are shown. HIF1a = hypoxia inducible factor 1, alpha subunit, GADD45a = growth arrest and DNA-‐damage-‐inducible alpha, PSMA2 & PSMD4 = proteasomal subunit alpha 2 and 26S subunit, non-‐ATPase 4, MYH = myosin heavy chain 4. 195 Figure 6-‐7: Human skeletal muscle (vastus lateralis) gene expression in female subjects aged <50 years vs. those aged >50, as analysed by microfluidic array (n=55). Of the 92 genes analysed, the 6, which showed significant differences between age groups are shown. Data for all genes analysed are shown in supplementary tables. Means and S.E.s for arbitrary unit values are shown. *P<0.05, **P<0.01, ***P<0.001. HIF1a = hypoxia inducible factor 1, alpha subunit, GADD45a = growth arrest and DNA-‐damage-‐inducible alpha, PSMA2 & PSMD4 = proteasomal subunit alpha 2 and 26S subunit, non-‐ATPase 4, MYH = myosin heavy chain 4. 196 6.5.11. Skeletal Muscle Gene Expression Across Human Ageing in Male Subjects Age-‐associated changes in skeletal muscle gene expression changes were also analysed in men, with subjects divided into 2 groups according to age. Statistically significant changes were seen in 8 of the 92 genes analysed (see supplementary tables S6.10: parts I-‐III for details of all genes and table 6-‐12 and figure 6-‐8 for details of significant changes only). Genes with significant changes were hexose-‐6-‐phosphate-‐dehydrogenase (H6PDH), heat shock protein 90kDa beta 1 (HSP90B1), growth arrest and DNA-‐damage-‐inducible alpha (GADD45a), cyclin-‐dependent kinase inhibitor 1A (CDKN1A), sirtuin 3 (SIRT3), SMAD family member 3 (SMAD3), v-‐rel reticuloendotheliosis viral oncogene homolog A (relA) and proteasomal 26S subunit, non-‐ATPase 4 (PSMD4). Human Skeletal Muscle Gene Expression: Male Ageing Study Subjects Age Group (Years) <50 (N=17) >50 (N=7) Delta CT Delta CT Fold-‐ Gene (Medians and IQRs) (Medians and IQRs) Change P-‐Value H6PDH 13.45 (13.27-‐13.92) 12.82 (12.59-‐13.12) 1.66 0.002 HSP90B1 12.32 (11.89-‐12.65) 11.91 (11.55-‐12.26) 1.47 0.04 GADD45a 17.43 (16.70-‐18.24) 16.58 (16.30-‐16.79) 1.83 0.04 CDKN1A 18.66 (18.20-‐19.58) 17.99 (16.11-‐18.52) 2.30 0.04 SIRT3 16.85 (15.85-‐17.07) 16.09 (15.66-‐16.47) 1.43 0.04 SMAD3 10.85 (10.55-‐11.23) 10.38 (9.83-‐10.62) 1.58 0.01 relA 16.93 (16.54-‐17.44) 15.94 (15.47-‐16.67) 1.82 0.01 PSMD4 17.76 (17.40-‐18.10) 16.87 (16.45-‐17.66) 1.55 0.04 Table 6-‐12: Human skeletal muscle (vastus lateralis) gene expression in male subjects aged <50 years vs. those >50, analysed by microfluidic array (n=24). Significant differences between age groups were seen in the 8 genes shown (of 92 analysed). Medians and IQRs for delta CT values are shown. H6PDH=hexose-‐6-‐phosphate-‐dehydrogenase, HSP90B1=heat shock protein 90kDa beta1, GADD45a=growth arrest DNA-‐damage-‐inducible alpha, CDKN1A=cyclin-‐dependent kinase inhibitor 1A, SIRT3=sirtuin 3, SMAD3=SMAD family member 3, relA=v-‐rel reticuloendotheliosis viral oncogene homolog A (relA), PSMD4=proteasomal 26S subunit, non-‐ATPase 4. 197 Figure 6-‐8: Human skeletal muscle (vastus lateralis) gene expression in male subjects aged <50 years vs. those aged >50, as analysed by microfluidic array (n=24). Of the 90 genes analysed, the 8, which showed statistically significant differences between age groups are shown. Data for all genes analysed are shown in supplementary tables. Median and inter-‐quartile ranges for Arbitrary Unit (AU) values are shown. *P<0.05, **P<0.01, ***P<0.001. 198 6.5.12. Correlations between Strength Testing/Body Composition Parameters and Gene Expression in Skeletal Muscle of Female Subjects In order to establish links between target gene expression values and functional outcomes, correlations between these values and results from strength testing and DEXA body composition analysis were tested using Spearman analysis. The correlation coefficients for women are summarized in table 6-‐13. Interestingly in line with our hypothesis, skeletal muscle 11β-‐HSD1 expression had a significant negative association with results from grip strength dynamometry. No significant correlations were seen with other strength parameters however. In addition skeletal muscle 11β-‐HSD1 had a significant positive correlation with total fat mass values. There were also significant negative correlations between S2LJ Pmax values and expression of several genes including GADD45a, HIF-‐1a, PSMA2 and CDKN1A consistent with roles in reduced muscle strength. Female Subjects (n=55) Strength Test/DEXA: Correlation Coefficients (r) (Spearman) between Strength Testing Parameters and Expression of Genes in Skeletal Muscle Grip Strength (kg) Skeletal Muscle Gene Expression: 11β-‐HSD1 H6PDH MuRF1 MAFbx Myostatin GADD45a HSP90B1 HIF-‐1a PSMA2 PSMD4 CDKN1A SIRT3 SMAD3 RelA MYH4 -‐0.37* 0.12 0.24 0.14 0.20 -‐0.16 -‐0.10 0.08 -‐0.13 -‐0.09 0.04 0.20 0.23 0.03 0.20 S2LJ Pmax (w/kg) S2LJ Vmax (m/s) S2LJ Height (cm) Lean Mass (Kg) Fat Mass (Kg) -‐0.33 0.09 0.15 0.13 0.25 -‐0.41* -‐0.22 -‐0.44* -‐0.42* -‐0.34 -‐0.41* 0.20 0.21 0.30 0.15 -‐0.13 0.31 0.30 0.32 0.32 -‐0.30 0.03 -‐0.33 -‐0.29 -‐0.29 -‐0.36* 0.26 0.32 0.25 0.32 -‐0.10 0.41* 0.33 0.34 0.31 -‐0.27 0.04 -‐0.31 -‐0.18 -‐0.22 -‐0.28 0.30 0.33 0.25 0.40* -‐0.17 0.00 0.15 0.05 0.09 -‐0.12 -‐0.13 0.11 0.06 0.06 -‐0.15 0.12 0.15 -‐0.13 0.14 0.32* -‐0.22 -‐0.25 -‐0.23 -‐0.22 0.16 0.09 0.29 0.19 0.21 0.06 -‐0.15 -‐0.16 -‐0.36* -‐0.16 Table 6-‐13: Bivariate analyses of strength testing and DEXA body composition parameters vs. skeletal muscle gene expression in female ageing study subjects (n=55). Data are correlation coefficients (r) derived by Spearman analysis. *P<0.05. S2LJ = standing 2-‐legged jump, Vmax = maximal velocity, Pmax = maximal power. 199 6.5.13. Correlations between Strength Testing/Body Composition Parameters and Gene Expression in Skeletal Muscle of Male Subjects Correlation coefficients between strength testing/DEXA body composition parameters vs. skeletal muscle gene expression values are shown in table 6-‐14. The results regarding 11β-‐HSD1 expression and grip strength contrast with those seen in women with a significant positive correlation observed. Negative correlations were observed between S2LJ Pmax and GADD45a, and CDKN1A, consistent with results in women. In addition negative correlations were observed between S2LJ Pmax and HSP90B1 and relA. Male Subjects (N=24) Strength Test/DEXA: Correlation Coefficients (r) (Spearman) between Strength Testing Parameters and Expression of Genes in Skeletal Muscle Grip Strength (kg) Skeletal Muscle Gene Expression 11β-‐HSD1 0.46* H6PDH -‐0.04 MuRF1 0.42 MAFbx1 0.30 Myostatin -‐0.23 GADD45a 0.03 HSP90B1 0.09 HIF-‐1a 0.28 PSMA2 -‐0.17 PSMD4 0.05 CDKN1A -‐0.38 SIRT3 -‐0.17 SMAD3 -‐0.03 RelA -‐0.06 MYH4 0.28 S2LJ Pmax (w/kg) S2LJ Vmax (m/s) S2LJ Height (cm) Lean Mass (Kg) Fat Mass (Kg) -‐0.27 -‐0.37 0.10 0.30 -‐0.29 -‐0.57* -‐0.53* -‐0.15 -‐0.16 -‐0.20 -‐0.83**** -‐0.27 -‐0.31 -‐0.63** -‐0.12 -‐0.24 -‐0.09 0.19 0.23 -‐0.09 -‐0.47 -‐0.27 -‐0.16 0.09 0.06 -‐0.71** -‐0.15 -‐0.26 -‐0.54* -‐0.06 -‐0.29 -‐0.13 0.03 0.24 -‐0.06 -‐0.41 -‐0.31 -‐0.19 0.13 0.07 -‐0.73*** -‐0.15 -‐0.25 -‐0.59 -‐0.00 0.06 -‐0.21 0.20 0.25 -‐0.10 0.01 0.09 0.27 0.03 0.05 0.00 -‐0.21 0.07 -‐0.22 0.42 -‐0.04 0.12 0.01 0.42 0.08 0.31 0.31 0.08 0.38 0.28 0.40 -‐0.15 0.71 0.14 0.21 Table 6-‐14: Bivariate analyses of strength testing and DEXA body composition parameters vs. skeletal muscle gene expression in male ageing study subjects (n=24). Target genes were found to be associated with ageing or GC administration in cell culture, in vivo mouse and human experiments. Data are correlation coefficients (r) derived by Spearman analysis. *P<0.05. . S2LJ = standing 2-‐legged jump, Vmax = maximal velocity, Pmax = maximal power. 200 6.5.14. Correlations for Skeletal Muscle 11β-‐HSD1 Expression and Urinary Steroid Markers of GC Metabolism vs. Anthropometric, Body Composition, Strength Testing and Serum Biochemistry Data in Female Subjects In order to investigate whether global activity of 11β-‐HSD types 1 and 2 may play a role in sarcopenia, obesity, osteoporosis and adverse metabolic profiles, Spearman correlations between urine steroid ratios and anthropometric variables, and data from DEXA analysis, strength testing, jump-‐plate mechanography, and serum biochemistry values were calculated. The results for women are summarized in table 6-‐15. Interesting results here include the significant positive correlations observed between total F metabolites and both total fat mass and % body fat, in addition to the positive correlation seen between skeletal muscle 11β-‐HSD1 gene expression and % body fat. Some surprising and not entirely consistent results were seen with regards bone mineral content/density, with positive correlations observed with urinary markers of global 11β-‐HSD1 activity and negative correlations with skeletal muscle 11β-‐HSD1 gene expression. Although there was a negative correlation between 11β-‐HSD1 gene expression and grip strength, no relationship was observed with urine steroid ratios. In addition no significant results correlations were observed between jump-‐plate mechanography values and markers of 11β-‐ HSD1 expression or global activity. Serum gonadotrophin values were positively correlated with skeletal muscle 11β-‐HSD1 expression, in keeping with the observed post-‐menopausal changes. Interestingly gene expression was also negatively correlated with serum IGF-‐I levels consistent with a suppressive role of the anabolic hormone. Finally skeletal muscle 11β-‐HSD1 expression correlated positively with serum total cholesterol levels. 201 Female Subjects Correlation Coefficients (r)(Spearman) Skeletal Muscle 11β-‐HSD1 expression Anthropometric Variables BMI 0.19 SBP 0.09 DBP 0.25 Body Composition Data (DEXA) Total Fat Mass 0.24 % Body Fat 0.33* Total Lean Mass -‐0.23 Bone Mineral -‐0.49** Content Bone Mineral -‐0.43** Density Strength Testing Grip Strength -‐0.37* Jumping Mechanography S2LJ Pmax -‐0.26 S2LJ Vmax -‐0.11 S2LJ Efficiency 0.28 S2LJ Jump -‐0.11 Height Chair Rise Pmax 0.05 Serum Biochemistry Fasting Glucose 0.23 Total 0.49** Cholesterol HDL Cholesterol 0.10 IGF-‐I -‐0.38* Urine Steroid Analysis Results (by GC/MS) (THF+5aTHF)/THE Cortols/ Cortolones Total F Metabolites F/E -‐0.00 -‐0.05 -‐0.02 0.04 -‐0.13 -‐0.01 -‐0.05 -‐0.20 -‐0.13 0.02 0.02 -‐0.02 0.16 0.09 0.23 0.29* -‐0.04 -‐0.02 -‐0.03 0.27* 0.35** 0.29* 0.19 0.04 -‐0.22 -‐0.21 -‐0.09 -‐0.01 0.24* 0.25* -‐0.06 0.04 0.23 -‐0.02 0.19 -‐0.07 0.01 0.01 -‐0.23 -‐0.04 0.23 0.17 0.13 0.11 -‐0.20 -‐0.17 -‐0.19 -‐0.14 -‐0.05 0.01 0.16 0.05 0.08 -‐0.08 0.07 -‐0.06 0.03 0.09 0.09 0.03 0.13 -‐0.04 0.13 0.08 -‐0.01 0.15 -‐0.18 0.21 0.11 -‐0.02 -‐0.02 -‐ 0.26* 0.17 0.20 -‐0.11 0.09 -‐0.06 -‐0.16 LH 0.50*** -‐0.01 -‐0.09 0.10 FSH 0.56*** -‐0.12 -‐0.01 -‐0.12 Testosterone -‐0.03 0.09 0.12 0.23 SHBG -‐0.14 -‐0.19 -‐0.24* -‐0.16 9am Cortisol -‐0.28 0.14 0.23 -‐0.07 DHEAS -‐0.19 0.10 0.18 0.05 Skeletal Muscle mRNA Expression data 11β-‐HSD1 N/A -‐0.02 -‐0.30 0.17 0.04 Table 6-‐15: Bivariate correlations for skeletal muscle 11β-‐HSD1 expression, urinary steroid analysis markers (GC/MS) vs. anthropometric variables, body composition (DEXA), strength testing, jumping mechanography (Leonardo Ground Force Plate), serum biochemistry and mRNA expression data (microfluidic array) in female ageing study participants (n=77 for all analyses except those involving gene expression when n=55). (THF+5αTHF)/THE = tetra-‐ hydrocortisol+5α-‐tetrahydrocortisol)/tetrahydrocortisone. F/E = cortisol/cortisone. Data are correlation coefficients (Spearman correlations). *P<0.05, **P<0.01 and ***P<0.001. 202 6.5.15. Correlations for Skeletal Muscle 11β-‐HSD1 Expression and Urinary Steroid Markers of GC Metabolism vs. Anthropometric, Body Composition, Strength Testing and Serum Biochemistry Data in Male Subjects Correlations between urine steroid ratios and anthropometric variables, and data from DEXA analysis, strength testing, jump-‐plate mechanography, and serum biochemistry values for men are summarized in table 6-‐16. As seen in women, significant positive correlations were observed between total F metabolites and total fat mass and % body fat. However positive correlations were also seen between total F metabolites and BMI, total lean mass and bone mineral content, which may be a function of fat mass and these variables are interrelated. Finally negative correlations were observed between serum androgens (testosterone and DHEAS) and urinary markers of global 11β-‐HSD1 activity (see supplementary figure S6.1). 203 Male Subjects Correlation Coefficients (r) (Spearman) Skeletal Muscle 11β-‐HSD1 expression Anthropometric Variables BMI SBP DBP Body Composition Data Total Fat Mass % Body Fat Total Lean Mass Bone Mineral Content Bone Mineral Density Strength Testing Grip Strength Jumping Mechanography S2LJ Pmax S2LJ Vmax S2LJ Efficiency S2LJ Jump Height Chair Rise Pmax Serum Biochemistry Fasting Glucose Total Cholesterol HDL Cholesterol IGF-‐I LH FSH Testosterone SHBG 9am Cortisol DHEAS Skeletal Muscle mRNA Expression data 11β-‐HSD1 Urine Steroid Analysis Results (by GC/MS) (THF+5aTHF)/ THE Cortols/ Cortolones Total F Metabolites F/E -‐0.03 0.02 -‐0.01 0.19 -‐0.03 0.05 -‐0.14 -‐0.06 0.08 *0.28 -‐0.08 *-‐0.29 -‐0.08 -‐0.06 -‐0.24 -‐0.06 -‐0.02 -‐0.04 -‐0.06 0.22 0.19 0.13 -‐0.05 -‐0.15 -‐0.09 -‐0.08 -‐0.01 ***0.48 *0.30 **0.40 *0.31 0.02 -‐0.06 -‐0.05 -‐0.01 0.09 -‐0.06 0.03 0.05 -‐0.15 0.35 -‐0.19 -‐0.17 0.01 0.00 -‐0.38 -‐0.35 -‐0.04 -‐0.37 -‐0.22 -‐0.19 -‐0.15 -‐0.07 -‐0.11 -‐0.04 -‐0.16 -‐0.14 -‐0.19 -‐0.12 -‐0.02 0.13 0.12 -‐0.06 0.19 0.04 0.07 0.03 -‐0.13 0.04 0.06 -‐0.27 -‐0.16 -‐0.07 -‐0.28 0.18 0.34 0.26 0.35 -‐0.40 -‐0.18 0.00 -‐0.02 -‐0.14 -‐0.06 -‐0.24 -‐0.13 **-‐0.38 0.08 0.03 *-‐0.31 -‐0.17 -‐0.14 -‐0.08 -‐0.02 -‐0.09 -‐0.063 *-‐0.32 0.13 0.16 -‐0.07 -‐0.01 0.09 -‐0.22 0.15 -‐0.08 -‐0.18 -‐0.11 -‐0.1 -‐0.273 0.12 0.05 0.07 -‐0.19 0.08 0.08 0.05 0.11 -‐0.15 -‐0.18 0.22 N/A -‐0.12 0.10 0.19 0.19 Table 6-‐16: Bivariate correlations for skeletal muscle 11β-‐HSD1 expression, urinary steroid analysis markers (GC/MS) vs. anthropometric variables, body composition (DEXA), strength testing, jumping mechanography (Leonardo Ground Force Plate), serum biochemistry and mRNA expression data (microfluidic array) in male ageing study participants (n=58 for all analyses with the exception of those involving gene expression data when n=24). (THF+5αTHF)/THE = tetra-‐hydrocortisol+5α-‐tetrahydrocortisol)/tetrahydrocortisone. F/E = cortisol/cortisone. Data are correlation coefficients (Spearman correlations). *P<0.05, **P<0.01 and ***P<0.001. 204 6.5.16. Correlations between Fat Mass and Total F Metabolites in Women and Men The positive correlations between measures of fat mass and total F metabolites described above in tables 6-‐15 and 6-‐16 in women and men respectively are presented in below in figure 6-‐9. Figure 6-‐9: Correlations between body fat determined by DEXA scan and urinary total F metabolites as measured by GC/MS. Total F metabolites were positively correlated with a), c) total fat mass and b), d), body fat % in women and men respectively. Full line = linear regression. F = cortisol. R-‐values represent correlation coefficients derived from Spearman Analysis. N=77 for Female study participants and n=58 for male study participants. 205 6.5.17. Correlations between Strength and 11β-‐HSD1 Gene Expression in Skeletal Muscle The significant negative correlation between grip strength dynamometry values and skeletal muscle 11β-‐HSD1 gene expression in women, described in table 6-‐ 15 is presented in figure 6-‐10. Of note when subjects were into 2 groups with grip strength values above and below the median value, there were no differences seen in urine steroid markers of 11β-‐HSD1 in either sex as shown in supplementary tables S6.11 and S6.12. Figure 6-‐10: Correlation between grip strength and skeletal muscle HSD11B1 mRNA expression in women (n=77). These parameters were negatively correlated. Full-‐line = linear regression. R-‐values represent correlation coefficients derived from Spearman Analysis 6.5.18. Correlations between Serum Gonadotrophin Levels and Skeletal Muscle 11β-‐HSD1 Gene Expression The positive correlations between serum LH/FSH levels and skeletal muscle 11β-‐HSD1-‐gene expression shown in table 6-‐15 are presented in figure 6-‐11. 206 Figure 6-‐11: Correlations between serum gonadotrophin levels and skeletal muscle HSD11B1 mRNA expression (n=55). a) FSH and b) LH were positively correlated with skeletal muscle HSD11B1 gene expression in women. Full line = linear regression. R-‐values represent correlation coefficients derived from Spearman Analysis. 6.5.19. Comparisons of Patient Characteristics, Serum Biochemistry, Skeletal Muscle Gene Expression and Urinary Steroid Metabolites between Pre-‐ and Post-‐Menopausal Women In view of the observations that skeletal muscle 11β-‐HSD1 gene expression was increased in women over 50 years of age compared to younger women, and the positive correlation between gene expression and serum gonadotrophin levels, the group was divided according to menopausal status (defined as the absence of periods for 6 months in combination with a serum FSH level of >25 IU/L) and comparisons were made between patient characteristics, body composition, serum biochemistry, skeletal muscle gene expression and urine steroid analysis results using Mann-‐Whitney tests (as presented in table 6-‐17). These analyses revealed that skeletal muscle 11β-‐HSD1 gene expression was increased in post-‐ menopausal women. Body composition analysis showed that post-‐menopausal women had slightly increased BMIs (25.1kg/m2, IQR 23.0-‐27.1 vs. 23.7kg/m2, IQR 21.1-‐25.8, p=0.03), and total fat mass results (23.2kg, IQR 20.2-‐25.0 vs. 20.0, IQR 20.0kg, IQR 14.8-‐23.6, p=0.004) and reduced bone mineral content/density 207 (BMC 19.4kg, IQR 17.2-‐21.1 vs. 21.2, IQR 19.3-‐22.9, p=0.01; BMD 1.0, IQR 1.0-‐1.1 vs. 1.1, IQR 1.0-‐1.2, p=0.006). Serum biochemistry revealed lower levels of IGF-‐I, DHEAS and testosterone and increased fasting glucose and cholesterol levels in post-‐menopausal women. No statistically significant differences in urine markers of 11β-‐HSD type 1 and 2 and 5α-‐reductase enzyme activities between groups. Subject Characteristics by Menopausal Status (Medians and IQRs) Patient Characteristics Age (years) BMI (kg/m2) Fat Mass (kg) Lean Mass (kg) Bone Mineral Content (kg) Bone Mineral Density (g/cm2) Serum biochemistry IGF-‐I (nmol/L) DHEAS (nmol/L) Testosterone (nmol/L) SHBG (nmol/L) 9am Cortisol (nmol/L) Fasting Glucose (nmol/L) Fasting Total Cholesterol (nmol/L) Skeletal Muscle mRNA Expression 11β-‐HSD1 (AU) H6PDH (AU) Urine Steroid GC/MS Analysis (THF+5αTHF/THE) (Cortols/Cortolones) Total F Metabolites (μg/24h) F/E THF/5αTHF Pre-‐menopausal Post-‐menopausal P-‐value 34 (25-‐45) 23.7 (21.1-‐25.8) 20.0 (14.8-‐23.6) 41.5 (36.2-‐45.1) 21.2 (19.3-‐22.9) 1.1 (1.0-‐1.2) 63 (56-‐68) 25.1 (23.0-‐27.1) 23.2 (20.2-‐25.0) 40.9 (37.9-‐43.8) 19.4 (17.2-‐21.1) 1.0 (1.0-‐1.1) <0.0001 0.03 0.004 0.81 0.01 0.006 23.0 (19.1-‐25.2) 3.3 (2.3-‐4.8) 0.7 (0.6-‐1.0) 62.3 (44.4-‐75.8) 259.5 (193.3-‐ 496.3) 4.5 (4.3-‐4.7) 4.7 (3.8-‐4.9) 13.4 (11.6-‐15.8) 2.0 (0.9-‐3.1) 0.6 (0.4-‐0.8) 67.4 (45.6-‐84.6) 219.5 (176.5-‐ 289.8) 4.9 (4.7-‐5.2) 5.6 (5.2-‐6.1) <0.0001 <0.0001 0.009 0.50 0.15 0.009 (0.005-‐ 0.011) 0.07 (0.03-‐0.11) 0.015 (0.011-‐ 0.024) 0.06 (0.04-‐0.15) 0.003 0.87 (0.75-‐1.11) 0.42 (0.36-‐0.51) 6092 (3966-‐7523) 0.62 (0.52-‐0.72) 1.44 (1.05-‐1.83) 0.81 (0.65-‐0.92) 0.40 (0.30-‐0.47) 6114 (4587-‐7898) 0.62 (0.52-‐0.73) 1.45 (1.16-‐2.25) 0.06 0.19 0.61 0.74 0.62 <0.0001 <0.0001 0.74 Table 6-‐17: Subject characteristics according to menopausal status (as determined by absence of menstrual periods and serum FSH levels >25IU/L) (n=77 for all analyses apart from those involving gene expression when n=55). Characteristics include general demographics, anthropometry, body composition, serum biochemistry, skeletal muscle gene expression and urine steroid GC/MS data. P-‐values shown are from Mann Whitney tests with statistically significant results highlighted in bold. 208 6.5.20. Skeletal Muscle 11β-‐HSD1 Expression According to Menopausal Status The upregulation in skeletal muscle 11β-‐HSD1 (known as HSD11B1) gene expression seen in post-‐menopausal women, described above in table 6-‐17 is also presented in figure 6-‐12. Figure 6-‐12: Skeletal Muscle HSD11B1 gene (mRNA) expression by menopausal status (n=55). Menopausal status was determined by absence of menstrual periods and serum FSH levels >25IU/L. Skeletal muscle HSD11B1 expression was determined in vastus lateralis biopsy samples using real-‐time PCR based microfluidic gene expression array. **P=0.003 as determined by Mann Whitney test. 6.5.21. Comparisons of Patient Characteristics, Skeletal Muscle Gene Expression and Urine Steroid Metabolites between Genders In view of the increased skeletal muscle 11β-‐HSD1 expression in post-‐ menopausal women, men and women were compared to assess whether differences exist that would be consistent with regulation by sex hormones (see 209 table 6-‐18). No differences in skeletal muscle gene expression of 11β-‐HSD1 or H6PDH were observed between sexes. However there was evidence of increased global activity of 11β-‐HSD1 with higher (THF+5αTHF)/THE ratios and total F metabolites seen in men. In addition THF/5αTHF ratios were lower in men compared to women consistent with increased 5α-‐reductase activity. The groups were well matched with regards to age and BMI, although as expected men had lower total fat mass and higher total lean mass values than women. Sexual Dimorphism in Subject Characteristics (Medians + IQRs) Women Men Patient Characteristics 48 (32-‐63) 47 (30-‐65) Age (years) 2 24.5 (22.3-‐26.6) 25.1 (22.9-‐27.3) BMI (kg/m ) 21.1 (16.8-‐24.8) 16.5 (13.3-‐21.0) Total Fat Mass (kg) 41.1 (37.0-‐43.8) 57.9 (52.9-‐63.7) Total Lean Mass (kg) Skeletal Muscle mRNA Expression 0.01 (0.01-‐0.02) 0.01 (0.01-‐0.02) 11β-‐HSD1 (AU) 0.07 ( 0.04-‐0.12) 0.10 (0.08-‐0.12) H6PDH (AU) Urine Steroid GC/MS Analysis 0.85 (0.68-‐1.00) 0.98 (0.78-‐1.18) (THF+5αTHF)/THE 0.42 (0.33-‐0.51) 0.42 (0.36-‐0.51) (Cortols/Cortolones) Total F Metabolites (μg/24h) 5844 (4515-‐7523) 9180 (6973-‐12246) 0.62 (0.52-‐0.72) 0.70 (0.59-‐0.78) F/E 1.46 (1.14-‐2.10) 1.04 (0.82-‐1.36) THF/5αTHF P-‐value 0.87 0.15 <0.0001 <0.0001 0.41 0.06 0.01 0.62 <0.0001 0.05 <0.0001 Table 6-‐18: Sexual dimorphism of subject characteristics including general demographics, anthropometry, body composition, skeletal muscle gene expression and urine steroid GC/MS data (For women n=77, except in gene expression analyses when n=55, for men n=58, except analyses involving gene expression when n=24). P-‐values are from Mann Whitney tests with statistically significant results highlighted in bold. 6.5.22. Comparisons of Patient Characteristics, Skeletal Muscle Gene Expression and Urine Steroid Metabolites according to Total Fat Mass Levels in Female Subjects In view of the observed correlations between measures of fat mass and skeletal muscle 11β-‐HSD1 gene expression and urine total F metabolite excretion seen in women (shown in table 6-‐15 and figure 6-‐9) we compared subject characteristics, gene expression and steroid metabolites in subjects whose fat 210 mass was below the median compared to those with values above the median, using Mann-‐Whitney analysis (see table 6-‐19). The higher fat mass group had increased total F metabolite values (6818μg/24h, IQR 4842-‐8077 vs. 4955, IQR 4005-‐6531, p=0.007), and lower serum IGF-‐I, DHEAS and testosterone levels. Female Subjects Subject Characteristics by Total Fat Mass (DEXA analysis) (Medians and IQRs) Below Median Fat Mass (20.87kg) Patient Characteristics Age (years) 37 (26-‐55) Serum biochemistry IGF-‐I 23.3 (19.6-‐26.8) DHEAS 3.3 (2.5-‐4.6) Testosterone 0.7 (0.6-‐1.0) SHBG 61.6 (43.4-‐74.6) 9am Cortisol 265.0 (203.50-‐434.50) Skeletal Muscle mRNA Expression 11β-‐HSD1 (AU) 0.01 (0.00-‐0.01) H6PDH (AU) 0.09 (0.03-‐0.11) Urine Steroid GC/MS Analysis (THF+5αTHF/THE) 0.79 (0.65-‐0.92) (Cortols/Cortolones) 0.41 (0.34-‐0.46) Total F Metabolites 4955 (4005-‐6531) (μg/24h) F/E 0.65 (0.57-‐0.82) THF/5αTHF 1.53 (1.17-‐2.39) Above Median Fat Mass (20.87kg) P-‐value 53 (47-‐64) 0.0005 14.5 (11.8-‐18.9) <0.0001 2.1 (1.0-‐3.3) 0.0002 0.6 (0.4-‐0.9) 0.02 67.4 (45.6-‐80.8) 0.48 215.00 (183.30-‐292.80) 0.10 0.01 (0.01-‐0.02) 0.05 (0.03-‐0.11) 0.11 1.00 0.89 (0.77-‐1.07) 0.42 (0.32-‐0.54) 6817 (4842-‐8077) 0.05 0.64 0.007 0.60 (0.51-‐0.69) 1.32 (1.07-‐1.72) 0.07 0.11 Table 6-‐19: Subject characteristics in female ageing study participants as divided into 2 groups depending on total fat mass (below and above median total fat mass measure of 20.87kg)(n=77, except in analyses involving gene expression when n=55). Characteristics include general demographics, anthropometry, body composition, skeletal muscle gene expression and urine steroid GC/MS data. P-‐values are from Mann-‐Whitney tests, significant results highlighted in bold. 6.5.23. Comparisons of Patient Characteristics, Skeletal Muscle Gene Expression and Urine Steroid Metabolites according to Total Fat Mass Levels in Male Subjects The male subjects followed a similar pattern with the higher fat mass group also having increased total F metabolites (10671μg/24h, IQR 8866-‐13317 vs. 7453, IQR 5755-‐10090), lower serum DHEAS and testosterone levels (illustrated in table 6-‐20). Similar analyses were performed using a group divided according to 211 median BMI with no differences in urine steroid markers of 11β-‐HSD1 activity observed (supplementary tables S6.13 and S6.14). Male Subjects Subject Characteristics by Total Body Fat (DEXA analysis) (Medians and IQRs) Below Median Fat Mass (14.79 kg) Patient Characteristics Age (years) 38 (27-‐63) Serum biochemistry IGF-‐I 20.6 (16.1-‐26.3) DHEAS 7.4 (2.9-‐9.5) Testosterone 17.4 (13.3-‐20.1) SHBG 34.1 (25.4-‐44.5) 9am Cortisol 311 (258-‐410) Skeletal Muscle mRNA Expression 11β-‐HSD1 (AU) 0.01 (0.01-‐0.02) H6PDH (AU) 0.10 (0.08-‐0.11) Urine Steroid GC/MS Analysis (THF+5αTHF/THE) 0.95 (0.81-‐1.03) (Cortols/Cortolones) 0.46 (0.37-‐0.53) Total F Metabolites 7453 (5755-‐10090) (μg/24h) F/E 0.69 (0.60-‐0.77) THF/5αTHF 1.06 (0.86-‐1.35) Above Median Fat Mass (14.79 kg) P-‐value 57 (42-‐65) 0.02 18.1 (15.9-‐22.9) 4.7 (2.8-‐5.8) 13.8 (11.4-‐17.4) 32.8 (27.0-‐44.5) 276 (219-‐364) 0.23 0.03 0.04 0.97 0.11 0.01 (0.01-‐0.02) 0.09 (0.06-‐0.16) 0.88 0.88 1.06 (0.80-‐1.22) 0.38 (0.33-‐0.50) 10671 (8866-‐13317) 0.18 0.10 0.003 0.70 (0.58-‐0.79) 1.04 (0.67-‐1.49) 0.97 0.73 Table 6-‐20: Subject characteristics in male ageing study participants as divided into 2 groups depending on total fat mass (below and above median total fat mass measure of 20.87kg)(n=58, except in analyses involving gene expression when n=24). Characteristics include general demographics, anthropometry, body composition, skeletal muscle gene expression and urine steroid GC/MS data. P-‐values shown are from Mann Whitney tests with statistically significant results highlighted in bold. 212 6.6. Discussion The work outlined in this chapter, represents the largest study assessing cortisol secretion and metabolism and local skeletal muscle 11β-‐HSD1 gene expression across human ageing. A particular strength of the study is the favourable recruitment of healthy volunteers, which at 135 is much higher than other studies that have investigated tissue specific effects of 11β-‐HSD1 in adipose (n=46), skin (n=40) and bone (n=18)(Andersson et al., 2009, Tiganescu et al., 2013, Cooper et al., 2002). In addition our recruitment has included both male and female subjects distributed across the age range allowing us to probe potential sexual dimorphism and changes across the human lifespan. Our cohort have been extensively phenotyped by undergoing assessment of anthropometric data, body composition analysis by DEXA, grip strength dynamometry, jump-‐ plate mechanography, serum biochemistry, vastus lateralis muscle biopsy and urine steroid analysis of 24 hour collections. Finally analysis of this cohort with a focused gene expression array of 92 target genes covering a range of functions validates and builds upon early exploratory studies that used a whole transcriptome approach in small numbers of subjects (Welle et al., 2003, Welle et al., 2004, Giresi et al., 2005). This work contributes to our knowledge of age-‐ associated changes in steroid metabolism and skeletal muscle gene expression in humans with potential consequences in generating therapeutic targets for related diseases. Furthermore it has allowed us to generate a valuable bank of tissues that will form the basis of further studies in this area. There are some general caveats that should be taken into account when interpreting the data relating to inherent limitations in the study design. The first among these is the cross-‐sectional nature of the study, which is open to potential bias. For example 213 in aiming to recruit a ‘healthy’ elderly cohort, by excluding those with obesity and other medical conditions in order to reduce interindividual variation, it is possible that this cohort is not a typical control. For example our cohort over 70 years, was community-‐dwelling and largely independent, as well as being motivated to give their time to volunteer to enrol in a university-‐based research study so those with frailty and poor functional status were unrepresented. Furthermore structured information on exercise capabilities was not collected at baseline. The data outlining baseline subject characteristics provide a useful summary when interpreting the gene expression and biochemical changes observed. It is clear from this data that expected age associated characteristics in serum biochemistry, including declines in hormones such as IGF-‐I, testosterone and DHEA are represented across our cohort along with reductions in strength testing parameters. A reduction in lean mass was not observed across age in our cohort however, increases in body fat in middle age were observed in women, so any conclusions drawn should be related to dynapenia or inherent skeletal muscle ageing as opposed to sarcopenia. This study attempts to provide an insight into the changes in gene expression and steroid metabolism across age in a cohort without major co-‐morbidity, so the results should not be extrapolated to apply to specific patient groups with conditions such as cancer, inflammatory disease or severe muscle wasting. A pragmatic approach was taken with recruitment of subjects with highly prevalent conditions however, and as a result some individuals with hypertension, hypercholesterolaemia and hypothyroidism on stable replacement were included. Three subjects with benign prostatic hypertrophy treated with finasteride or dutasteride were excluded from study 214 analysis. Ethnicities of individuals were well matched between genders, however there was a less diverse ethnic mix in older individuals. It should be noted that no differences in 11β-‐HSD1 skeletal muscle gene expression or global activity were observed between age and BMI matched Caucasians and South Asian participants. Overall size of the subject cohort and the detailed phenotypic data available should act to minimize the effects of the above factors. Finally, the sample size of men whose muscle biopsies were analysed was lower than that of women (n=24 vs. n=55), so it is possible that observations in this group did not reach significance due to lack of statistical power. Our primary interest was whether 11β-‐HSD1 gene expression and subsequent pre-‐receptor GC metabolism play a role in the ageing process in humans. More specifically this study attempted to address whether changes in urinary steroid markers of global enzyme activity or skeletal muscle gene expression was altered with age. From this perspective the most striking finding was that expression of skeletal muscle 11β-‐HSD1 was elevated in older compared to younger women, which is consistent with our central hypothesis. Furthermore, 11β-‐HSD1 was one of only 6 genes whose expression changed significantly with age, of the 92 targets analysed. Although this is a novel finding in human skeletal muscle, it is consistent with previous data showing age-‐dependent increases in 11β-‐HSD1 gene expression in other human tissues including adipose tissue, skin, and bone (Andersson et al., 2009, Cooper et al., 2002, Tiganescu et al., 2013). In our study however, there was no such elevation in 11β-‐HSD1 skeletal muscle expression in men, leading us to question whether sexual dimorphism in pre-‐ receptor glucocorticoid metabolism exists. There was, however evidence of 215 increased skeletal muscle expression of H6PDH, which acts to provide co-‐factor (NADPH) for 11β-‐HSD1 oxo-‐reductase activity (Lavery et al., 2006). Both of these observations are in keeping with a potential increase in 11β-‐HSD1 activity with age in both genders, however further analyses would need to be carried out to confirm this. With respect to age-‐associated changes in urinary steroid markers of cortisol metabolism, the only statistically significant difference observed was an increase in (THF+5aTHF)/THE ratio in the oldest female group, indicative of increased global 11β-‐HSD1 activity. This conforms with the findings of Andersson et al (2009) who found evidence of both increased global and hepatic 11β-‐HSD1 activity and subcutaneous adipose tissue gene expression in post-‐menopausal women. However our findings regarding (THF+5aTHF)/THE should be interpreted with caution, as a progressive increase in the ratio was not seen over the full range of age groups. Furthermore related parameters including cortols/cortolones and total F metabolites were unaffected by age. Once again, there were no changes indicative of altered cortisol metabolism observed in men. On this background, if we accept the finding that skeletal muscle 11β-‐HSD1 expression is increased with age in women, the potential regulators of this change and its pathophysiological consequences need to be established. To this end, we investigated associations between markers of 11β-‐HSD1 expression/activity with phenotypic data. This analysis should be treated as an exploratory exercise, and is not designed to confirm causality. There is the question of whether this change is driven by a post-‐menopausal factor rather than by the ageing process in a broader sense, and this study is limited in its 216 ability to answer this. The data regarding a potential link between 11β-‐HSD1 and menopausal status is of particular interest as up to the fifth decade men have an increased cardiovascular risk compared to women. Following the menopause women exhibit a sharp increase in cardiovascular risk, underpinned by the development of an adverse lipid and body composition profile (Barrett-‐Connor, 1997, Colombel and Charbonnel, 1997, Collins, 2008, Yamatani et al., 2013). Although oestrogen levels decline after the menopause, unfortunately a recent meta-‐analysis revealed conventional hormone replacement therapy to be ineffective in reducing this risk in such women (Main et al., 2013). Furthermore, prevalence of osteoporosis and sarcopenia are also closely associated with the menopause (Joseph et al., 2005). Whether tissue specific increases in 11β-‐HSD1 contribute to altered cardiovascular disease risk and other co-‐morbidities is an important question and further studies of the impact of selective 11β-‐HSD1 inhibitors in this cohort should be carried out to address this. Several previous studies have attempted to identify potential regulators of 11β-‐ HSD1 including glucocorticoids, growth factors, and pro-‐inflammatory cytokines (Tomlinson et al., 2004). A review of our correlations between markers of 11β-‐ HSD1 skeletal muscle expression/global activity and other phenotypic variables highlights some potential regulators. Levels of serum gonadotrophins (LH and FSH), which are increased following the menopause, are positively correlated with skeletal muscle 11β-‐HSD1 expression. Oestrogens are obvious candidate regulators of 11β-‐HSD1 in skeletal muscle, although previous studies have only investigated their effects in adipose tissue. Experiments performed on ovarectomised rats showed that oestradiol suppressed 11β-‐HSD1 activity and 217 expression in liver and visceral adipose tissue, whilst it had no effect in subcutaneous tissue, with the authors suggesting that this may partly explain the differences in fat deposition observed post-‐menopausally (Andersson et al., 2010). A recent study of post-‐menopausal women reported a positive correlation between oestrogen receptor-‐beta and 11β-‐HSD1-‐gene expression in adipose tissue (McInnes et al., 2012). Furthermore, Yamatani et al (2013), found that both cortisol/cortisone ratios and 11β-‐HSD1 gene expression levels were increased post-‐menopausally in visceral but not subcutaneous adipose tissue. This study also reported a positive correlation between oestrone/oestradiol and cortisol/cortisone ratios in visceral fat. In our study we also observed a positive correlation between measures of body fat and 11β-‐HSD1 gene expression and total F metabolites. It is possible that increases in body fat mass could be driving the post-‐menopausal increase in 11β-‐HSD1 gene expression. Previous reports of the relationship between fat and 11β-‐HSD1 activity/expression have been mixed. Engeli et al (2004) found that subcutaneous adipose tissue 11β-‐HSD1 expression correlated positively with waist circumference and HOMA-‐IR in a study of 70 post-‐menopausal women. Desbriere et al (2006) were the first to show an increase in 11β-‐HSD1 expression in visceral adipose tissue samples from obese subjects. Koska et al (2006) showed that 11β-‐HSD1 expression in subcutaneous tissue correlated positively with both BMI and measures of insulin resistance. Paulsen et al (2007) observed higher 11β-‐HSD1 expression in both fat depots in obese compared to lean subjects. In addition they reported higher 11β-‐HSD1 expression in lean men compared to lean women. Studies from Andersson et al (2009), Svendsen et al (2009) and Munoz et al (2009) supported the above findings. 11β-‐HSD1 expression in subcutaneous tissue appears to 218 decrease with significant weight loss following bariatric surgery (Simonyte et al., 2010, Leyvraz et al., 2012). However these relationships have not been reproducible in every study (Toogood et al., 2000b, Tomlinson et al., 2002b). It has been postulated that reduced 11β-‐HSD1 activity is a protective adaptation to the “adverse metabolic consequences of obesity” (Tomlinson et al., 2004b). Furthermore weight loss was associated with increased 11β-‐HSD1 expression in adipose tissue and activity indicated by serum cortisol/cortisone ratios (Tomlinson et al., 2004a). It has also been suggested that clearance of cortisol metabolites by 5-‐alpha reductase activity is important in protecting from the adverse metabolic consequences of obesity. In support of this Baudrand et al (2011) observed increased 5-‐alpha and 5-‐beta-‐reductase hepatic gene expression in samples taken from morbidly obese patients during bariatric surgery. Alberti et al (2007) found that visceral adipose 11β-‐HSD1 expression was unchanged in those with metabolic syndrome features, whereas in subcutaneous adipose it was increased. Michalaki et al (2012) found that 11β-‐ HSD1 expression in subcutaneous tissue was unchanged in an obese group with features of metabolic syndrome, whereas visceral fat expression was increased in this group. It is important to note however that our results are taken from healthy subjects with non-‐obese BMIs, so the dynamics of any relationship between 11β-‐HSD1 activity and fat mass may be different in obese cohorts or those with overt metabolic disease. There are marked differences in body composition between genders with men having increased lean mass, and reduced fat mass compared to women in our cohort. We report evidence of sexual dimorphism in cortisol metabolism, with 219 higher total F metabolites, (THF+5αTHF)/THE ratios and lower THF/5αTHF ratios in men compared to women, indicative of higher global 11β-‐HSD1 and 5α-‐ reductase activities. These findings provide circumstantial support for negative regulation of 11β-‐HSD1 by a pre-‐menopausal female factor, with oestrogen appearing to be likely candidate. However the findings regarding the sexual dimorphism of 11β-‐HSD1 activity are consistent with a previous study of 22 elderly subjects (Toogood et al., 2000b), so it may be that there is a legacy effect of pre-‐menopausal oestrogens that lasts across the lifespan. Interestingly we found that testosterone and DHEAS were negatively correlated with urine steroid markers of 11β-‐HSD1 activity in men indicating that secretion of these hormones in men cannot explain the observed sexual dimorphism. Adrenal androgens are known to have anti-‐GC effects, and there is evidence that they inhibit 11β-‐HSD1 oxo-‐reductase activity in differentiated human adipocytes and skeletal myoblasts (Whorwood et al., 2001, Apostolova et al., 2005, McNelis et al., 2013). If sex steroids do not regulate the age-‐associated increase in 11β-‐HSD1 expression in skeletal muscle, IGF-‐I via the ‘somatopause’ is a credible alternative. Indeed we observed a significant negative correlation between serum IGF-‐I levels and 11β-‐HSD1 gene expression and this finding is backed up by evidence from a number of in vitro cell culture and clinical studies, which were reviewed in depth by Tomlinson et al (2004). Of particular relevance here is the observation that treating primary human myoblasts with IGF-‐I and serum downregulates 11β-‐HSD1 expression (Whorwood et al (2001). Of interest also are results from patient groups, which reported effects of GH status on measures 220 of global 11β-‐HSD1 activity. Acromegalic patients have reduced cortisol/cortisone metabolite ratios in active disease, and these ratios normalize with effective biochemical control of GH hypersecretion. Patients with hypopituitarism and GH-‐deficiency on hydrocortisone have increased cortisol/cortisone metabolite ratios, which are normalized with effective GH-‐ replacement (Moore et al., 1999, Toogood et al., 2000a, Stewart et al., 2001, Frajese et al., 2004). There are also some candidate regulators of 11β-‐HSD1 that we were unable to assess in the study. Potential candidates include impaired insulin signaling, and systemic inflammation. Prevalence of insulin resistance increases with age, and in a preliminary experiment we showed that insulin suppresses 11β-‐HSD1 expression in murine skeletal myotubes. Levels of pro-‐inflammatory cytokines increase with age, and a number of cell culture experiments including our own have demonstrated that these can increase 11β-‐HSD1 expression (Tomlinson et al., 2001, Ahasan et al., 2012). Correlations between markers of 11β-‐HSD1 skeletal muscle expression and global activity are also useful in highlighting potential pathological effects, with negative correlations observed between gene expression and bone mineral density, grip strength and total cholesterol. In men, the results were contradictory, with skeletal muscle 11β-‐HSD1 expression positively correlated with grip strength, and a trend towards negative correlation with jump-‐plate measures of maximum power and velocity. Although 11β-‐HSD1 has been shown to be expressed and functionally active within skeletal muscle, and some 221 investigations of its effects on genes involved in insulin resistance and proteolysis, no previous study has investigated its associations with age or other factors in humans (Jang et al., 2006, Jang et al., 2007, Jang et al., 2009, Morgan et al., 2009, Salehzadeh et al., 2009, Dovio et al., 2010, Biedasek et al., 2011). The observations above are consistent with a role in osteoporosis, muscle weakness and dyslipidaemia, but it should be stressed that the analyses are only hypothesis generating and further in depth studies would be required to assess whether this is the case. Furthermore, we can only speculate as to the causality of the observed relationships between 11β-‐HSD1 and variables such as fat, bone and lean mass. Moving on to our skeletal muscle gene expression data, particular considerations here are that the 92 target genes have been pre-‐selected by us to cover a range of biological functions including energy metabolism, hormonal signaling, response to cell stress, DNA repair, cell cycle regulation, inflammation, nuclear function, protein synthesis, muscle contractile function, proteolysis, and apoptosis, so a degree of bias is inherent in the design. A benefit of this approach is that it enables us to assess the effects on specific candidate pathways that have been highlighted in previous studies, as opposed to a transcriptomic approach, which may be useful for generating new hypotheses. There is a complexity in interpreting our gene expression data however, in that any changes may be contributory to adverse ageing phenotype, or compensatory and protective, or even epiphenomena that are neutral. Where possible knowledge of the previous literature on candidate gene functions has been used to propose possible roles in our cohort. Furthermore some genes may in fact be regulated at the translational 222 or post-‐translational levels meaning that mRNA data is of limited use. In women, of the 92 target genes analysed, statistically significant changes in expression were observed in 6 (11β-‐HSD1, hypoxia inducible factor 1, alpha subunit (HIF-‐1α), growth arrest and DNA-‐damage-‐inducible alpha (GADD45a), the proteasomal subunit alpha 2 (PSMA2) and 26S subunit, non-‐ATPase 4 (PSMD4), and skeletal muscle myosin heavy chain 4 (MYH4)). In men significant changes were observed in 8 genes (hexose-‐6-‐phosphate-‐dehydrogenase (H6PDH), heat shock protein 90kDa beta 1 (HSP90B1), growth arrest and DNA-‐ damage-‐inducible alpha (GADD45a), cyclin-‐dependent kinase inhibitor 1A (CDKN1A), sirtuin 3 (SIRT3), SMAD family member 3 (SMAD3), v-‐rel reticuloendotheliosis viral oncogene homolog A (relA) and proteasomal 26S subunit, non-‐ATPase 4 (PSMD4)). Aside from the changes in genes involved in pre-‐receptor GC metabolism, a striking feature here is the representation of genes encoding proteins that are involved in the response to cell stress, with functions in cell cycle regulation, DNA repair, or immune signalling (including GADD45a, HIF-‐1α, CDKN1A, SIRT3 and relA). Interestingly, some well-‐ characterised atrophy genes (MAFbx/Atrogin1, MuRF1 and myostatin) did not change in our cohort. Of note these genes were well represented in our own mouse studies of ageing (genes differentially regulated MAFbx/Atrogin1, MuRF1, GADD45a, PSMD11, MSTN, Calv 3, NCAM1, CHARNB) and GC excess (genes differentially regulated MAFbx/Atrogin1, MuRF1, GADD45a, MSTN, FOXO1, Eif4bp, CHARNB, NCAM1), outlined in chapter 5. We can speculate as to the possible explanations for this which include, that an alternative pathway involving cell stress response is a prominent pathway in human skeletal muscle 223 ageing, or that compensatory mechanisms preventing UPS activation are at play during ‘healthy ageing’, as opposed to studies looking at acute muscle atrophy, or that our aged cohort do not have a severe enough muscle phenotype for the UPS to be activated. GADD45a appears to have a robust relationship with both age and GC signalling. In our experiments involving mice with exogenous GC excess outlined in chapter 5, skeletal muscle GADD45a gene expression was increased vs. control mice. Furthermore, this change was attenuated in 11β-‐HSD1 KO mice administered with 11DHC. Gene expression was also increased in aged WT mice, and this change was partially attenuated in aged 11β-‐HSD1 KO mice. This age-‐ related increase in skeletal muscle expression is also apparent in humans, and we could hypothesise, that in women local tissue GC amplification via 11β-‐HSD1 could contribute to this. Along with assessing the effects on muscle function, it would be interesting to investigate the effects of selective 11β-‐HSD1 inhibition on skeletal muscle GADD45a expression in humans. The gene is involved in response to cell stress, by promoting DNA repair or determining senescence by regulating the cell cycle or death by activating apoptosis (Saha et al., 2010, Salvador et al., 2013). It can be activated by p53 dependent and independent mechanisms involving FOXO transcription factors (Smith et al., 1994, Furukawa-‐ Hibi et al., 2002, Chiba et al., 2009). Importantly both of these pathways are regulated by GCs. Several studies have shown that GADD45a is involved in muscle atrophy of different aetiologies including human and mouse skeletal muscle ageing (Welle et al., 2003, Welle et al., 2004, Edwards et al., 2007, Swindell, 2009), acute quadriplegic myopathy (Di Giovanni et al., 2004) and critical illness in pigs (Banduseela et al., 2009). Recent studies have demonstrated that GADD45a plays a critical role in regulating pathways of 224 muscle atrophy due to denervation and fasting (Bongers et al., 2013, Ebert et al., 2010). In addition it has been shown to increase transcription of some genes that changed significant with age in our study, including CDKN1a and HSP90B1 (Ebert et al., 2012). Also of relevance to our findings is the observation that GADD45a induces type II muscle fibre atrophy by a mechanism independent of MAFbx/Atrogin1 and MuRF1, which supports the idea of a distinct pathway of skeletal muscle ageing in humans. Interestingly cross-‐talk between p53 and GC signalling is well documented, with evidence of a loop whereby GCs are capable of activating p53, whilst p53 is able to bind and inhibit the GR (Sengupta and Wasylyk, 2004, Zhang et al., 2006, Poulsen et al., 2013). The relationship between p53 and GADD45a is also a two-‐way affair whereby GADD45a stimulates p53 via p38 MAPK signalling and p53 is able to regulate GADD45a (Salvador et al., 2013). Furthermore GCs induce senescence in both tendon cells and osteoblasts via a p53 dependent mechanism (Poulsen et al., 2013). It is possible that this pathway is involved in skeletal muscle atrophy secondary to GCs and ageing, and that selective 11β-‐HSD1 would result in antagonism of this signalling. It is interesting to speculate that age-‐associated muscle atrophy may be the price to pay for the tumour suppressing function of p53, resulting in adverse effects by inducing apoptosis or cell senescence (Hasty and Christy, 2013). CDKN1A was upregulated with age and like GADD45a it also functions as a cell cycle regulator, involved in DNA repair and apoptosis (Giovannini et al., 2004, Swindell, 2009). Swindell et al (2009) also noted that its expression was increased with age in an array study of mouse muscle. A meta-‐analysis of muscle 225 atrophy gene profiles confirmed that this gene was increased. It interacts with the TGF-‐beta pathway and other proteins such as SMAD3, which was also increased in our study (Calura et al., 2008). HIF-‐1α was also increased with age in our study. HIF-‐1 is a transcription factor and acts as a “master regulator” of the cell response to hypoxia. Interestingly it also has links with pre-‐receptor GC metabolism and p53 signalling (Goda et al., 2003). HIF-‐1 has been shown to have an antagonistic relationship with 11β-‐HSD1, as it negatively regulates 11β-‐HSD1 expression in adipose tissue in cultures and transgenic mice (Lee et al., 2013). We observed increases in both HIF-‐1α and 11β-‐HSD1 in combination with age in skeletal muscle, and it is interesting to note that expression of both genes are regulated by components of NF-‐κB signalling and we could speculate that this may be the underlying mechanism (Gorlach and Bonello, 2008, Ahasan et al., 2012). SIRT3 was increased in muscle biopsies from men in our study. It is one of the sirtuins, which are NAD+ dependent acetylase, that regulate growth arrest and apoptosis in response to cell stress. It acts as a metabolic sensor and is upregulated during fasting and exercise and downregulated during nutrient excess (Jing et al., 2011, Green and Hirschey, 2013). Effects on lifespan and ageing have been extensively studied in invertebrate and rodent studies. Interestingly it is associated with slow twitch type I fibres, which may explain its increase with age in our study where there was evidence of loss of type II fast twitch fibres. HSP90B1 was increased with age in our study. Heat shock proteins are nuclear chaperones that respond to endoplasmic reticulum stress as a protective mechanism (Murshid et al., 2013). They have been shown to modulate apoptosis 226 and inhibit NF-‐κB and FOXO transcription factor activities in animal models (McArdle et al., 2004, Chung and Ng, 2006, Senf et al., 2008). There is evidence that GCs antagonize the protective effects of heat shock proteins in skeletal muscle via a microRNA1 dependent mechanism, contributing to muscle atrophy (Kukreti et al., 2013). Age-‐associated increases have been observed in a murine array study (Swindell, 2009). Some age-‐associated gene expression changes in our study that were expected include upregulation of relA, proteosomal subunits (PSMA2 and PSMD4) and SMAD3. RelA is also known as p65, and is a component of the NF-‐κB pathway, which is well known to be involved in skeletal muscle atrophy (Yamaki et al., 2012, Jackman et al., 2013). TNF-‐α/IL-‐1β caused increased expression of 11β-‐HSD1 in mesenchymal stromal cells via a relA dependent mechanism (Ahasan et al., 2012). Increased expression of proteasomal subunits with age is consistent with the expected increase in muscle proteolysis (Combaret et al., 2009). GC induced regulation of proteosomal subunits has been observed previously in animal experiments (Combaret et al., 2004). SMAD3 is part of the TGF-‐β signalling pathway, and is also downstream of myostatin following activation of the activin IIB receptor (Zhu et al., 2004). Although upregulation is consistent with increased myostatin signalling, there is also evidence that SMADs are also regulated at the post-‐translational level (Dalbo et al., 2011). Summary and Conclusions To summarise our gene expression data, we have observed age-‐related changes in genes encoding proteins with important functions in pre-‐receptor GC metabolism (11β-‐HSD1 and H6PDH) in addition to those involved in cell stress 227 response, involving regulatory functions in cell cycle, and apoptosis (including GADD45a, HIF-‐1α, CDKN1A, HSP90B1 and SIRT3) and those involved in proteolysis (PSMA2 and PSMD4). Changes in classical ‘atrogenes’ were under-‐ represented and this may indicate that an alternative signalling pathway has a more prominent role in human skeletal muscle ageing. There is cross-‐talk between GC signalling and the pathways that the other genes are involved with, so that further investigation of the effects of modulation of this signalling in ageing is warranted. It is possible that the observed age-‐related increase in skeletal muscle 11β-‐HSD1 expression may be driven by the menopause, rather than by a broader factor involved with ageing. Consistent with this is the increased global activity of 11β-‐HSD1 observed in men. However there is also evidence of other potential regulatory factors, with correlations noted between markers of 11β-‐HSD1 expression/activity and factors including IGF-‐I, DHEAS, testosterone, and fat mass. Furthermore our analyses highlight correlations between 11β-‐HSD1 expression/activity and factors including bone mass, grip strength and total cholesterol that warrant further investigations to ascertain their pathophysiological significance. Going forward, an exciting area with translational potential is the assessment of the effectiveness of selective inhibition of 11β-‐HSD1 on the adverse consequences of the menopause, with regards metabolic and body composition profile, which is pertinent in view of the controversies surrounding the use of long-‐term HRT. Finally this study has highlighted potential targets for further investigation at a basic science level with respect to the interactions between GR signaling and cell cycle regulators that may represent important mediators of skeletal muscle ageing and atrophy. 228 Chapter 7 – Final Conclusions and Future Directions 229 7.1. Final Conclusions We have used a range of models to investigate the effects of GC exposure over the lifespan and its regulation at the pre-‐receptor level. These include a retrospective single centre study of Cushing’s disease (CD) outcomes and mortality, in-‐vitro studies of the effects of selective inhibition of 11β-‐HSD1 on expression of muscle atrophy genes, in-‐vivo mouse studies examining the functional effects of 11β-‐HSD1 on muscle phenotype with age and GC-‐excess, and a large human study examining global 11β-‐HSD1 activity and skeletal muscle gene expression with age. Long-‐term outcomes in patients with Cushing’s disease treated with transsphenoidal surgery Our study of outcomes in Cushing’s disease post-‐transsphenoidal surgery highlighted the long-‐term effects of excess GC exposure, on body composition (obesity, osteoporosis, myopathy), and adverse metabolic parameters (insulin resistance, hypertension, dyslipidaemia). Disease remission resulted in resolution of clinical features, with rapid and sustained improvements in BMI and BP over follow up. There was a 3-‐fold excess mortality in the group as a whole (SMR 3.17, 95% CI 1.70-‐5.43), whilst for recurrent/persistent disease the SMR was 4.12 (95% CI 1.12-‐10.54) and for patients cured by first surgery it was 2.47 (95% CI 0.90-‐5.77). Other studies have provided evidence of a legacy effect during remission of Cushing’s with persistence of cardiovascular risk factors and body composition changes over long-‐term follow up (Colao et al., 1999, Barahona et al., 2009). It was striking that female gender was linked to excess mortality in our study (RR = 4.5), and in light of our findings outlined in Chapter 6, and those of Barahona et al (2009) and Andersson et al (2009) it is interesting 230 to speculate that sexual dimorphism in 11β-‐HSD1 expression may contribute to this. Currently we are collaborating with other centres (including Stoke-‐on-‐ Trent) to combine our data and extend the duration of follow up in order to assess whether any excess mortality risk persists following disease remission, and identify prognostic factors. Characterisation of the effects of pre-‐receptor glucocorticoid regulation on muscle atrophy gene expression in skeletal myotubes The central contribution of this chapter was to provide evidence of regulation of the key ubiquitin proteasome system mediator, MAFbx/Atrogin1 by 11β-‐HSD1, as evidenced by experiments using a selective 11β-‐HSD1 inhibitor. This is of translational importance, as it opens up a new potential therapeutic application in muscle atrophy for selective inhibitors of 11β-‐HSD1, that have been developed by industry for the treatment of components of the metabolic syndrome. In-‐vivo studies were required in order to assess the role of 11β-‐HSD1 with ageing. The impact of global 11β-‐HSD1 knockout on muscle phenotype and gene expression in aged and glucocorticoid treated mice This study was the first in-‐vivo assessment of the impact of 11β-‐HSD1 on skeletal muscle function with age and GC-‐excess. We identified a set of skeletal muscle gene expression changes common to GC excess and ageing that parallel changes in muscle function. Absence of 11β-‐HSD1 attenuates these changes and was associated with preserved muscle strength. We performed a gene expression array of 88 target genes in a mouse ageing study. Of these, 3 genes (MuRF1, MSTN, GADD45a) increased with age in WT mice, changes that were attenuated in 11β-‐HSD1 KO mice, which appeared to underpin the preserved muscle 231 strength. Interestingly 4 genes, which have not been previously investigated with respect to pre-‐receptor GC regulation (PSMD11, eif4bp, CHARNB, NCAM1) increase with age although effects of 11β-‐HSD1 KO did not reach statistical significance. Furthermore, GADD45a, eif4bp, CHARNB, NCAM1, MuRF1 and myostatin, were found to be GC inducible, supportive of an important effect of chronic GC exposure in skeletal muscle ageing. Absence of 11β-‐HSD1 was also associated with markers of HPA-‐axis activation, and improved glucose tolerance. Global activity and local skeletal muscle expression of 11β-‐HSD1 across human ageing This chapter represents the largest study assessing cortisol secretion and metabolism and local skeletal muscle 11β-‐HSD1 gene expression across human ageing. We recruited 135 healthy subjects of both genders aged between 20-‐80 years providing us with insights into sexual dimorphism and changes across the human lifespan. The cohort was extensively phenotyped by anthropometric assessment, body composition analysis by DEXA, grip strength dynamometry, jump-‐plate mechanography, serum biochemistry, vastus lateralis muscle biopsy and urine steroid analysis of 24-‐hour collections. A muscle gene expression array of 92 target genes covering a range of functions was also completed. The most striking finding was that skeletal muscle 11β-‐HSD1 gene expression was increased in older compared to younger women, consistent with our central hypothesis. Furthermore, of the 92 targets analysed, 11β-‐HSD1 was one of only 6 genes whose expression changed significantly with age. This is consistent with previous data showing age-‐dependent increases in 11β-‐HSD1 gene expression in other human tissues including adipose tissue, skin, and bone (Cooper et al., 2002, 232 Andersson et al., 2009, Tiganescu et al., 2013). However, there was no such increase in 11β-‐HSD1 skeletal muscle expression in men, leading us to question whether sexual dimorphism in pre-‐receptor glucocorticoid metabolism exists. There was evidence of increased skeletal muscle expression of H6PDH and assessment of 11β-‐HSD1 activity is now required in order to confirm local functional effects. With respect to age-‐associated changes in urinary steroid markers of cortisol metabolism, the only statistically significant difference observed was an increase in (THF+5aTHF)/THE ratio in the oldest female group, indicative of increased global 11β-‐HSD1 activity. This is consistent with the findings of Andersson et al (2009) who found evidence of both increased global and hepatic 11β-‐HSD1 activity and subcutaneous adipose tissue gene expression in post-‐menopausal women. However our findings regarding (THF+5aTHF)/THE, should be interpreted with caution, as a progressive increase in the ratio was not seen over the full range of age groups. We observed evidence of sexual dimorphism in cortisol metabolism, with higher global 11β-‐HSD1 and 5α-‐reductase activities in women. These findings provide circumstantial support for negative regulation of 11β-‐HSD1 by a pre-‐menopausal female factor such as oestrogen, which has been reported to inhibit 11β-‐HSD1. The analysis of correlations identified other potential regulatory factors of 11β-‐ HSD1 expression/activity including IGF-‐I, DHEAS, testosterone, and fat mass. Furthermore our analyses highlight correlations between 11β-‐HSD1 233 expression/activity and pathological factors including bone mass, grip strength and total cholesterol. Skeletal muscle gene expression array revealed that targets involved in cell stress response, cell cycle, and apoptosis (including GADD45a, HIF-‐1α, CDKN1A, HSP90B1 and SIRT3) were well represented along with those involved in proteolysis (PSMA2 and PSMD4). Changes in classical ‘atrogenes’ were under-‐ represented and this may indicate that an alternative signalling pathway has a more prominent role in human skeletal muscle ageing. 7.2. Future Directions Muscle atrophy and Pre-‐Receptor GC-‐metabolism The in-‐vivo studies of ageing and GC-‐excess demonstrate that 11β-‐HSD1 regulates expression of muscle atrophy genes and modulates function. Target genes that were increased are involved in growth regulation, proteolysis and cell stress. Furthermore we have shown that skeletal muscle 11β-‐HSD1 expression increases with age in women, and have highlighted potential regulators of this change. These findings set the scene for translational studies investigating the role of 11β-‐HSD1 in muscle atrophy. Potential areas for investigation are listed below: Ageing and Sarcopenia: i) In-‐vitro studies of the regulation of 11β-‐HSD1, and its relationship with cell cycle regulators including GADD45a, in human primary cultures. Optimisation of functional proteolysis assays for use in these studies. 234 ii) In-‐vivo mouse studies of transgenic animals with muscle specific knockoutof 11β-‐HSD1 and GR. Optimisation of an array of strength testing techniques for use in these studies, to test endurance, speed, and ex-‐vivo strength. iii) Analysis of existing human ageing study samples to investigate the relationship between factors such as oestrogens, insulin, pro-‐ inflammatory cytokines and vitamin D with 11β-‐HSD1 and muscle function. Analysis of serum samples from these subjects to determine prednisolone generation following oral administration of prednisone, as a marker of hepatic first-‐pass metabolism. In addition, more detailed analyses of the relationship of 11β-‐HSD1 and body composition will be performed, with a particular focus on visceral obesity. Tissue banked samples and associated phenotypic data represent a significant resource for use in potential future studies of sarcopenia using novel targets or additional technologies including transcriptomics, proteomics, metabolomics and microRNA analysis. iv) Proof-‐of-‐concept studies to assess the effect of selective inhibition of 11β-‐HSD1 on muscle protein turnover and muscle atrophy gene expression in healthy volunteers. v) Interventional clinical studies of selective 11β-‐HSD1 in sarcopenic patients from community or nursing home cohorts. Outcome measures would include physical performance battery scores, grip strength, jump-‐plate mechanography and body composition analysis measures. 235 Related Areas for Investigation: i) The menopause: this is clinically important due to the adverse body composition and metabolic profile that develops post-‐menopausally and the limitations of current conventional hormone replacement therapy (HRT)(Burger et al., 2012). These studies could include in-‐ vitro (regulation of 11β-‐HSD1 by oestrogens), in-‐vivo (ovarectomised mice) and human clinical studies in a post-‐menopausal cohort. ii) Medical therapies for Cushing’s: our studies of GC-‐excess illustrate that 11β-‐HSD1 KO mice are protected from key side effects, including muscle atrophy, reduced strength and impaired glucose tolerance. These results suggest that the therapeutic potential of selective inhibition of 11β-‐HSD1 as a medical treatment for Cushing’s syndrome and a adjunctive therapy to prevent adverse effects of exogenous GCs, warrants further attention. Interventional clinical studies should be considered, with end-‐points involving reduction of clinical signs of hypercortisolism (BMI, body composition parameters, blood pressure and insulin resistance), with the absence of serum/urine cortisol as a useful biomarker. iii) Critical illness and myopathy: Muscle atrophy and weakness are highly prevalent in patients admitted to critical care, where they may impact rehabilitation and result in long-‐term functional limitations (Herridge et al., 2011, Puthucheary et al., 2013). Critical illness is frequently underpinned by conditions, which are known to result in muscle atrophy via GC-‐dependent mechanisms including metabolic acidosis (May et al., 1986) and sepsis (Tiao et al., 1996, Smith et al., 236 2010). Furthermore a recent study revealed that critical illness is characterized by raised circulating cortisol levels and reduced clearance via suppression of metabolising enzymes (Boonen et al., 2013). An initial observational study involving assessment of muscle expression of 11β-‐HSD1 in critical illness, should be considered. A future interventional study could investigate the impact of 11β-‐HSD1 inhibition in patients admitted to critical care, on outcome measures including muscle protein synthesis, proteolysis, atrophy gene expression, muscle mass, length of stay and mortality. A novel intervention for this condition has the potential to make considerable impact, in view of its prevalence, economic costs and lack of currently available treatment. 237 References AAGAARD, P., SUETTA, C., CASEROTTI, P., MAGNUSSON, S. P. & KJAER, M. 2010. Role of the nervous system in sarcopenia and muscle atrophy with aging: strength training as a countermeasure. Scand J Med Sci Sports, 20, 49-‐64. ABDALLAH, B. M., BECK-‐NIELSEN, H. & GASTER, M. 2005. Increased expression of 11beta-‐hydroxysteroid dehydrogenase type 1 in type 2 diabetic myotubes. Eur J Clin Invest, 35, 627-‐34. ABELLAN VAN KAN, G. 2009. Epidemiology and consequences of sarcopenia. J Nutr Health Aging, 13(8), 708-‐12 ABRAHAMS, L., SEMJONOUS, N.M., GUEST, P., ZIELINSKA, A., HUGHES, B., LAVERY, G.G., STEWART, P.M. 2012. Biomarkers of hypothalamic-‐ pituitary-‐adrenal axis activity in mice lacking 11beta-‐HSD1 and H6PDH. J Endocrinol, 214(3), 367-‐72. ACEBES, J. J., MARTINO, J., MASUET, C., MONTANYA, E. & SOLER, J. 2007. Early post-‐operative ACTH and cortisol as predictors of remission in Cushing's disease. Acta Neurochir (Wien), 149, 471-‐7; discussion 477-‐9. ADDISON, T. 1855. On the constitutional and local effects of disease of the supra-‐ renal capsules. Samuel Righley. AGARWAL, A. K., MONDER, C., ECKSTEIN, B. & WHITE, P. C. 1989. Cloning and expression of rat cDNA encoding corticosteroid 11 beta-‐dehydrogenase. J Biol Chem, 264, 18939-‐43. AHASAN, M. M., HARDY, R., JONES, C., KAUR, K., NANUS, D., JUAREZ, M., MORGAN, S. A., HASSAN-‐SMITH, Z., BENEZECH, C., CAAMANO, J. H., HEWISON, M., LAVERY, G., RABBITT, E. H., CLARK, A. R., FILER, A., BUCKLEY, C. D., RAZA, K., STEWART, P. M. & COOPER, M. S. 2012. Inflammatory regulation of glucocorticoid metabolism in mesenchymal stromal cells. Arthritis Rheum, 64, 2404-‐13. AHN, R. S., LEE, Y. J., CHOI, J. Y., KWON, H. B. & CHUN, S. I. 2007. Salivary cortisol and DHEA levels in the Korean population: age-‐related differences, diurnal rhythm, and correlations with serum levels. Yonsei Med J, 48, 379-‐ 88. AKKOCA, O., MUNGAN, D., KARABIYIKOGLU, G. & MISIRLIGIL, Z. 1999. Inhaled and systemic corticosteroid therapies: Do they contribute to inspiratory muscle weakness in asthma? Respiration, 66, 332-‐7. AL-‐HARBI, T. & AL-‐SHAIKH, A. 2012. Apparent mineralocorticoid excess syndrome: report of one family with three affected children. J Pediatr Endocrinol Metab, 25, 1083-‐8. ALAMDARI, N., SMITH, I. J., AVERSA, Z. & HASSELGREN, P. O. 2010. Sepsis and glucocorticoids upregulate p300 and downregulate HDAC6 expression and activity in skeletal muscle. Am J Physiol Regul Integr Comp Physiol, 299, R509-‐20. ALAMDARI, N., AVERSA, Z., CASTILLERO, E., GURAV, A., PETKOVA, V., TIZIO, S., HASSELGREN, P.O. 2012. Reservatrol prevents dexamethasone-‐induced expression of the muscle atrophy-‐related ubiquitin ligases atrogin-‐1 and MuRF1 in cultured myotubes through a SIRT1-‐dependent mechanism. Biochem Biophys Res Commun, 417(1), 528-‐33. ALBERTI, L., GIROLA, A., GILARDINI, L., CONTI, A., CATTALDO, S., MICHELETTO, G., INVITTI, C. 2007. Type 2 diabetes and metabolic syndrome are 238 associated with increased expression of 11beta-‐hydroxysteroid dehydrogenase 1 obese subjects. Int J Obes (Lond), 31(12), 1826-‐31. ALBISTON, A. L., SMITH, R. E., KROZOWSKI, Z. S. 1995. Sex-‐ and tissue-‐ specific regulation of 11 beta-‐hydroxysteroid dehydrogenase mRNA. Mol Cell Endocrinol, 109 (2), 183-‐8. ALEMAN, M., WATSON, J. L., WILLIAMS, D. C., LECOUTEUR, R. A., NIETO, J. E. & SHELTON, G. D. 2006. Myopathy in horses with pituitary pars intermedia dysfunction (Cushing's disease). Neuromuscul Disord, 16, 737-‐44. ALLEN, D. L., LOH, A. S. 2011. Posttranscriptional mechanisms involving microRNA-‐27a and b contribute to fast-‐specific and glucocorticoid-‐ mediated myostatin expression in skeletal muscle. Am J Physiol Cell Physiol, 300 (1), C124-‐37. ALTUN, M., BESCHE, H. C., OVERKLEEFT, H. S., PICCIRILLO, R., EDELMANN, M. J., KESSLER, B. M., GOLDBERG, A. L., ULFHAKE, B. 2010. Muscle wasting in aged, sarcopenic rats is associated with enhanced activity of the ubiquitin proteasome pathway. J Biol Chem, 285 (51), 39597-‐608. ALWANI, R. A., DE HERDER, W. W., VAN AKEN, M. O., VAN DEN BERGE, J. H., DELWEL, E. J., DALLENGA, A. H., DE JONG, F. H., LAMBERTS, S. W., VAN DER LELY, A. J. & FEELDERS, R. A. 2010. Biochemical predictors of outcome of pituitary surgery for Cushing's disease. Neuroendocrinology, 91, 169-‐78. ANDERSEN, H. 2012. Motor dysfunction in diabetes. Diabetes Metab Res Rev, 28 Suppl 1, 89-‐92. ANDERSSON, T., SODERSTROM, I., SIMONYTE, K. & OLSSON, T. 2010. Estrogen reduces 11beta-‐hydroxysteroid dehydrogenase type 1 in liver and visceral, but not subcutaneous, adipose tissue in rats. Obesity (Silver Spring), 18, 470-‐5. ANDREWS, R. C., ROOYACKERS, O. & WALKER, B. R. 2003. Effects of the 11 beta-‐ hydroxysteroid dehydrogenase inhibitor carbenoxolone on insulin sensitivity in men with type 2 diabetes. J Clin Endocrinol Metab, 88, 285-‐ 91. APOSTOLOVA, G., SCHWEIZER, R. A., BALAZS, Z., KOSTADINOVA, R. M., ODERMATT, A. 2005. Dehydroepiandrosterone inhibits the amplification of glucocorticoid action in adipose tissue. Am J Physiol Endocrinol Metab, 288 (5), E957-‐64. ARANGO-‐LOPERA, V. E., ARROYO, P., GUTIERREZ-‐ROBLEDO, L. M., PEREZ-‐ ZEPEDA, M. U., CESARI, M. 2013. Mortality as an adverse outcome of sarcopenia. J Nutr Health Aging. 17 (3), 259-‐62. ARLT, W. & STEWART, P. M. 2005. Adrenal corticosteroid biosynthesis, metabolism, and action. Endocrinol Metab Clin North Am, 34, 293-‐313, viii. ASKARI, A., VIGNOS, P. J., JR. & MOSKOWITZ, R. W. 1976. Steroid myopathy in connective tissue disease. Am J Med, 61, 485-‐92. ASZTALOS, E. 2012. Antenatal corticosteroids: a risk factor for the development of chronic disease. J Nutr Metab, 2012, 930591. ATKINSON, A. B., KENNEDY, A., WIGGAM, M. I., MCCANCE, D. R. & SHERIDAN, B. 2005. Long-‐term remission rates after pituitary surgery for Cushing's disease: the need for long-‐term surveillance. Clin Endocrinol (Oxf), 63, 549-‐59. 239 AUDIGE, A., DICK, B., FREY, B. M., FREY, F. J., CORMAN, B. & VOGT, B. 2002. Glucocorticoids and 11 beta-‐hydroxysteroid dehydrogenase type 2 gene expression in the aging kidney. Eur J Clin Invest, 32, 411-‐20. AVERSA, Z., ALAMDARI, N., CASTILLERO, E., MUSCARITOLI, M., ROSSI FANELLI, F. & HASSELGREN, P. O. 2012. beta-‐Hydroxy-‐beta-‐methylbutyrate (HMB) prevents dexamethasone-‐induced myotube atrophy. Biochem Biophys Res Commun, 423, 739-‐43. BAEHR, L. M., FURLOW, J. D., BODINE, S. C. 2011. Muscle sparing in muscle RING finger 1 null mice: response to synthetic glucocorticoids. J Physiol, 589, 4759-‐76. BAHAT, G., SAKA, B., TUFAN, F., AKIN, S., SIVRIKAYA, S., YUCEL, N., ERTEN, N., KARAN, M. A. 2010. Prevalence of sarcopenia and its association with functional and nutritional status among male residents in a nursing home in Turkey. Aging Male, 13, 211-‐14. BAILEY, J. L. 2013. Insulin resistance and muscle metabolism in chronic kidney disease. ISRN Endocrinol, 2013, 329606. BALAGOPAL, P., LJUNGQVIST, O. & NAIR, K. S. 1997. Skeletal muscle myosin heavy-‐chain synthesis rate in healthy humans. Am J Physiol, 272, E45-‐50. BANDUSEELA, V. C., OCHALA, J., CHEN, Y. W., GORANSSON, H., NORMAN, H., RADELL, P., ERIKSSON, L. I., HOFFMAN, E. P., LARSSON, L. 2009. Gene Expression and muscle fiber function in a porcine ICU model. Physiol Genomics, 39, 141-‐59. BAR-‐SHAI, M., CARMELI, E. & REZNICK, A. Z. 2005. The role of NF-‐kappaB in protein breakdown in immobilization, aging, and exercise: from basic processes to promotion of health. Ann N Y Acad Sci, 1057, 431-‐47. BARAHONA, M. J., SUCUNZA, N., RESMINI, E., FERNANDEZ-‐REAL, J. M., RICART, W., MORENO-‐NAVARRETE, J. M., PUIG, T., FARRERONS, J. & WEBB, S. M. 2009a. Persistent body fat mass and inflammatory marker increases after long-‐term cure of Cushing's syndrome. J Clin Endocrinol Metab, 94, 3365-‐ 71. BARAHONA, M. J., SUCUNZA, N., RESMINI, E., FERNANDEZ-‐REAL, J. M., RICART, W., MORENO-‐NAVARRETE, J. M., PUIG, T., WAGNER, A. M., RODRIGUEZ-‐ ESPINOSA, J., FARRERONS, J. & WEBB, S. M. 2009b. Deleterious effects of glucocorticoid replacement on bone in women after long-‐term remission of Cushing's syndrome. J Bone Miner Res, 24, 1841-‐6. BARBERI, L., SCICCHITANO, B. M., DE ROSSI, M., BIGOT, A., DUGUEZ, S., WIELGOSIK, A., STEWART, C., MCPHEE, J., CONTE, M., NARICI, M., FRANCESCHI, C., MOULY, V., BUTLER-‐BROWNE, G. & MUSARO, A. 2013. Age-‐dependent alteration in muscle regeneration: the critical role of tissue niche. Biogerontology, 14, 273-‐92. BAREL, M., PEREZ, O. A., GLOZZET V. A., RAFACHO, A., BOSQUEIRO, J. R., DO AMARAL, S. L. Exercise training prevents hyperinsulinemia, muscular glycogen loss and muscle atrophy induced by dexamethasone treatment. Eur J Appl Physiol, 108, 999-‐1007. BAR-‐SHAI, M., CARMELL, E., REZNICK, A. Z. 2005. The role of NF-‐kappaB in protein breakdown in immobilization, aging and exercise: from basic processes to promotion of health. Ann N Y Acad Sci, 1057, 431-‐47. 240 BARRETT-‐CONNOR, E. 1997. Sex differences in coronary heart disease. Why are women so superior? The 1995 Ancel Keys Lecture. Circulation, 95, 252-‐ 64. BARTKE, A. 2011. Growth hormone, insulin and aging: the benefits of endocrine defects. Exp Gerontol, 46, 108-‐11. BARZILAI, N., GUARENTE, L., KIRKWOOD, T. B., PARTRIDGE, L., RANDO, T. A. & SLAGBOOM, P. E. 2012. The place of genetics in ageing research. Nat Rev Genet, 13, 589-‐94. BAUDRAND, R., DOMINGUEZ, J. M., CARVAJAL, C. A., RIQUELME, A., CAMPINO, C., MACCHIAVELLO, S., BOZINOVIC, M., MORALES, M., PIZARRO, M., SOLIS, N., ESCALONA, A., BOZA, C., ARRESE, M. & FARDELLA, C. E. 2011. Overexpression of hepatic 5alpha-‐reductase and 11beta-‐hydroxysteroid dehydrogenase type 1 in visceral adipose tissue is associated with hyperinsulinemia in morbidly obese patients. Metabolism, 60, 1775-‐80. BAUMANN, A. P., IBEBUNJO, C., GRASSER, W. A. & PARALKAR, V. M. 2003. Myostatin expression in age and denervation-‐induced skeletal muscle atrophy. J Musculoskelet Neuronal Interact, 3, 8-‐16. BAUMGARTNER, R. N., KOEHLER, K. M., GALLAGHER, D., ROMERO, L., HEYMSFIELD, S. B., ROSS, R. R., GARRY, P. J. & LINDEMAN, R. D. 1998. Epidemiology of sarcopenia among the elderly in New Mexico. Am J Epidemiol, 147, 755-‐63. BAUMGARTNER, R. N., WAYNE, S. J., WATERS, D. L., JANSSEN, I., GALLAGHER, D. & MORLEY, J. E. 2004. Sarcopenic obesity predicts instrumental activities of daily living disability in the elderly. Obes Res, 12, 1995-‐2004. BEAVERS, K. M., BRINKLEY, T. E. & NICKLAS, B. J. 2010. Effect of exercise training on chronic inflammation. Clin Chim Acta, 411, 785-‐93. BEENTJES, J. A., KERSTENS, M. N. & DULLAART, R. P. 2001. Effects of growth hormone replacement on cortisol metabolism in hypopituitary patients treated with cortisone acetate. Scand J Clin Lab Invest, 61, 277-‐86. BELANGER, A., CANDAS, B., DUPONT, A., CUSAN, L., DIAMOND, P., GOMEZ, J. L. & LABRIE, F. 1994. Changes in serum concentrations of conjugated and unconjugated steroids in 40-‐ to 80-‐year-‐old men. J Clin Endocrinol Metab, 79, 1086-‐90. BENGTSSON, B. A., EDEN, S., LONN, L., KVIST, H., STOKLAND, A., LINDSTEDT, G., BOSAEUS, I., TOLLI, J., SJOSTROM, L. & ISAKSSON, O. G. 1993. Treatment of adults with growth hormone (GH) deficiency with recombinant human GH. J Clin Endocrinol Metab, 76, 309-‐17. BERGSTROM, J. 1975. Percutaneous needle biopsy of skeletal muscle in physiological and clinical research. Scand J Clin Lab Invest, 35, 609-‐16. BESSON, A., SALEMI, S., GALLATI, S., JENAL, A., HORN, R., MULLIS, P. S. & MULLIS, P. E. 2003. Reduced longevity in untreated patients with isolated growth hormone deficiency. J Clin Endocrinol Metab, 88, 3664-‐7. BHATNAGAR, S., PANGULURI, S. K., GUPTA, S. K., DAHIYA, S., LUNDY, R. F. & KUMAR, A. 2010. Tumor necrosis factor-‐alpha regulates distinct molecular pathways and gene networks in cultured skeletal muscle cells. PLoS One, 5, e13262. BIASON-‐LAUBER, A., SUTER, S. L., SHACKLETON, C. H. & ZACHMANN, M. 2000. Apparent cortisone reductase deficiency: a rare cause of hyperandrogenemia and hypercortisolism. Horm Res, 53, 260-‐6. 241 BIEDASEK, K., ANDRES, J., MAI, K., ADAMS, S., SPULER, S., FIELITZ, J. & SPRANGER, J. 2011. Skeletal muscle 11beta-‐HSD1 controls glucocorticoid-‐ induced proteolysis and expression of E3 ubiquitin ligases atrogin-‐1 and MuRF-‐1. PLoS One, 6, e16674. BLANCO, C., MARAZUELA, M., FLORES, J. & ALVAREZ, J. 2001. Severe respiratory failure secondary to Cushing's myopathy. J Endocrinol Invest, 24, 618-‐21. BODINE, S. C., LATRES, E., BAUMHUETER, S., LAI, V. K., NUNEZ, L., CLARKE, B. A., POUEYMIROU, W. T., PANARO, F. J., NA, E., DHARMARAJAN, K., PAN, Z. Q., VALENZUELA, D. M., DECHIARA, T. M., STITT, T. N., YANCOPOULOS, G. D. & GLASS, D. J. 2001. Identification of ubiquitin ligases required for skeletal muscle atrophy. Science, 294, 1704-‐8. BONGERS, K. S., FOX, D. K., EBERT, S. M., KUNKEL, S. D., DYLE, M. C., BULLARD, S. A., DIERDORFF, J. M. & ADAMS, C. M. 2013. Skeletal muscle denervation causes skeletal muscle atrophy through a pathway that involves both Gadd45a and HDAC4. Am J Physiol Endocrinol Metab, 305, E907-‐15. BONIZZOLI, M., ZAGLI, G., LAZZERI, C., DEGL'INNOCENTI, S., GENSINI, G. & PERIS, A. 2012. Early insulin resistance in severe trauma without head injury as outcome predictor? A prospective, monocentric pilot study. Scand J Trauma Resusc Emerg Med, 20, 69. BOONEN E., VERVENNE H., MEERSSEMAN P., ANDREW R., MORTIER L., DECLERCQ P.E., VANWIJNGAERDEN Y.M., SPRIET I., WOUTERS P.J., VANDER PERRE S., LANGOUCHE L., VANHOREBEEK I., WALKER B.R., VAN DEN BERGE G. 2013. Reduced cortisol metabolism during critical illness. N Eng J Med, 16, 1477-‐88. BOTTINELLI, R. & REGGIANI, C. 2000. Human skeletal muscle fibres: molecular and functional diversity. Prog Biophys Mol Biol, 73, 195-‐262. BRAITH, R. W., WELSCH, M. A., MILLS, R. M., JR., KELLER, J. W. & POLLOCK, M. L. 1998. Resistance exercise prevents glucocorticoid-‐induced myopathy in heart transplant recipients. Med Sci Sports Exerc, 30, 483-‐9. BRAUND, K. G., DILLON, A. R. & MIKEAL, R. L. 1980. Experimental investigation of glucocorticoid-‐induced myopathy in the dog. Exp Neurol, 68, 50-‐71. BRESLOW, N. E. & DAY, N. E. 1987. Statistical methods in cancer research. Volume II-‐-‐The design and analysis of cohort studies. IARC Sci Publ, 1-‐406. BRINKLEY, T. E., LENG, X., MILLER, M. E., KITZMAN, D. W., PAHOR, M., BERRY, M. J., MARSH, A. P., KRITCHEVSKY, S. B. & NICKLAS, B. J. 2009. Chronic inflammation is associated with low physical function in older adults across multiple comorbidities. J Gerontol A Biol Sci Med Sci, 64, 455-‐61. BROWN-‐BORG, H. M. 2009. Hormonal control of aging in rodents: the somatotropic axis. Mol Cell Endocrinol, 299, 64-‐71. BUA, E., JOHNSON, J., HERBST, A., DELONG, B., MCKENZIE, D., SALAMAT, S. & AIKEN, J. M. 2006. Mitochondrial DNA-‐deletion mutations accumulate intracellularly to detrimental levels in aged human skeletal muscle fibers. Am J Hum Genet, 79, 469-‐80. BUJALSKA, I. J., GATHERCOLE, L. L., TOMLINSON, J. W., DARIMONT, C., ERMOLIEFF, J., FANJUL, A. N., REJTO, P. A. & STEWART, P. M. 2008. A novel selective 11beta-‐hydroxysteroid dehydrogenase type 1 inhibitor prevents human adipogenesis. J Endocrinol, 197, 297-‐307. BURCH, W. 1983. A survey of results with transsphenoidal surgery in Cushing's disease. N Engl J Med, 308, 103-‐4. 242 BURGER, H. G., MACLENNAN, A. H., HUANG, K. E. & CASTELO-‐BRANCO, C. 2012. Evidence-‐based assessment of the impact of the WHI on women's health. Climacteric, 15, 281-‐7. BURT, M. G., JOHANNSSON, G., UMPLEBY, A. M., CHISHOLM, D. J. & HO, K. K. 2008. Impact of growth hormone and dehydroepiandrosterone on protein metabolism in glucocorticoid-‐treated patients. J Clin Endocrinol Metab, 93, 688-‐95. BUTCHER, S. K. & LORD, J. M. 2004. Stress responses and innate immunity: aging as a contributory factor. Aging Cell, 3, 151-‐60. CALURA, E., CAGNIN, S., RAFFAELLO, A., LAVEDER, P., LANFRANCHI, G. & ROMUALDI, C. 2008. Meta-‐analysis of expression signatures of muscle atrophy: gene interaction networks in early and late stages. BMC Genomics, 9, 630. CAPPOLA, A. R., XUE, Q. L., FERRUCCI, L., GURALNIK, J. M., VOLPATO, S. & FRIED, L. P. 2003. Insulin-‐like growth factor I and interleukin-‐6 contribute synergistically to disability and mortality in older women. J Clin Endocrinol Metab, 88, 2019-‐25. CARLSON, B. M. & FAULKNER, J. A. 1989. Muscle transplantation between young and old rats: age of host determines recovery. Am J Physiol, 256, C1262-‐6. CARVAJAL, C. A., GONZALEZ, A. A., ROMERO, D. G., GONZALEZ, A., MOSSO, L. M., LAGOS, E. T., HEVIA MDEL, P., ROSATI, M. P., PEREZ-‐ACLE, T. O., GOMEZ-‐ SANCHEZ, C. E., MONTERO, J. A. & FARDELLA, C. E. 2003. Two homozygous mutations in the 11 beta-‐hydroxysteroid dehydrogenase type 2 gene in a case of apparent mineralocorticoid excess. J Clin Endocrinol Metab, 88, 2501-‐7. CARVALHAES-‐NETO, N., HUAYLLAS, M. K., RAMOS, L. R., CENDOROGLO, M. S. & KATER, C. E. 2003. Cortisol, DHEAS and aging: resistance to cortisol suppression in frail institutionalized elderly. J Endocrinol Invest, 26, 17-‐ 22. CASTILLERO, E., ALAMDARI, N., AVERSA, Z., GURAV, A. & HASSELGREN, P. O. 2013. PPARbeta/delta regulates glucocorticoid-‐ and sepsis-‐induced FOXO1 activation and muscle wasting. PLoS One, 8, e59726. CASTILLO, E. M., GOODMAN-‐GRUEN, D., KRITZ-‐SILVERSTEIN, D., MORTON, D. J., WINGARD, D. L. & BARRETT-‐CONNOR, E. 2003. Sarcopenia in elderly men and women: the Rancho Bernardo study. Am J Prev Med, 25, 226-‐31. CATLEY, M. 2007. Dissociated steroids. ScientificWorldJournal, 7, 421-‐30. CAVAGNINI, F., SCACCHI, M. & PECORI GIRALDI, F. 2008. Hypopituitarism in Cushing's disease. J Endocrinol Invest, 31, 44-‐7. CESARI, M., PAHOR, M., LAURETANI, F., ZAMBONI, V., BANDINELLI, S., BERNABEI, R., GURALNIK, J. M. & FERRUCCI, L. 2009. Skeletal muscle and mortality results from the InCHIANTI Study. J Gerontol A Biol Sci Med Sci, 64, 377-‐84. CEVENINI, E., CARUSO, C., CANDORE, G., CAPRI, M., NUZZO, D., DURO, G., RIZZO, C., COLONNA-‐ROMANO, G., LIO, D., DI CARLO, D., PALMAS, M.G., SCURTI, M., PINI, E., FRANCESCHI, C., VASTO, S. 2010. Age-‐related inflammation: the contribution of different organs, tissues and systems. How to face it for therapeutic approaches. Curr Pharm Des, 6, 609-‐18. CEVENINI, E., MONTI, D. & FRANCESCHI, C. 2013. Inflamm-‐ageing. Curr Opin Clin Nutr Metab Care, 16, 14-‐20. 243 CHAHAL, H. S. & DRAKE, W. M. 2007. The endocrine system and ageing. J Pathol, 211, 173-‐80. CHAI, R. J., VUKOVIC, J., DUNLOP, S., GROUNDS, M. D. & SHAVLAKADZE, T. 2011. Striking denervation of neuromuscular junctions without lumbar motoneuron loss in geriatric mouse muscle. PLoS One, 6, e28090. CHAIDARUN, S. S., SWEARINGEN, B. & ALEXANDER, J. M. 1998. Differential expression of estrogen receptor-‐beta (ER beta) in human pituitary tumors: functional interactions with ER alpha and a tumor-‐specific splice variant. J Clin Endocrinol Metab, 83, 3308-‐15. CHAMBERLAIN, W., GONNELLA, P., ALAMDARI, N., AVERSA, Z. & HASSELGREN, P. O. 2012. Multiple muscle wasting-‐related transcription factors are acetylated in dexamethasone-‐treated muscle cells. Biochem Cell Biol, 90, 200-‐8. CHEHAB, O., OUERTANI, M., CHAIEB, K., HAOUALA, F. & MAHDOUANI, K. 2007. Hormonal status of cortisol and dehydroepiandrosterone sulfate in an elderly Tunisian population. C R Biol, 330, 755-‐63. CHEN, J. F., MANDEL, E. M., THOMSON, J. M., WU, Q., CALLIS, T. E., HAMMOND, S. M., CONLON, F. L. & WANG, D. Z. 2006. The role of microRNA-‐1 and microRNA-‐133 in skeletal muscle proliferation and differentiation. Nat Genet, 38, 228-‐33. CHENG, H., HOFFMAN, J., LE, P., NAIR, S. K., CRIPPS, S., MATTHEWS, J., SMITH, C., YANG, M., KUPCHINSKY, S., DRESS, K., EDWARDS, M., COLE, B., WALTERS, E., LOH, C., ERMOLIEFF, J., FANJUL, A., BHAT, G. B., HERRERA, J., PAULY, T., HOSEA, N., PADERES, G. & REJTO, P. 2010. The development and SAR of pyrrolidine carboxamide 11beta-‐HSD1 inhibitors. Bioorg Med Chem Lett, 20, 2897-‐902. CHENG, Q., ZHU, X., ZHANG, X., LI, H., DU, Y., HONG, W., XUE, S. & ZHU, H. 2013. A cross-‐sectional study of loss of muscle mass corresponding to sarcopenia in healthy Chinese men and women: reference values, prevalence, and association with bone mass. J Bone Miner Metab. CHIBA, T., KAMEI, Y., SHIMIZU, T., SHIRASAWA, T., KATSUMATA, A., SHIRAISHI, L., SUGITA, S., OGAWA, Y., MIURA, S. & EZAKI, O. 2009. Overexpression of FOXO1 in skeletal muscle does not alter longevity in mice. Mech Ageing Dev, 130, 420-‐8. CHIEN, M. Y., HUANG, T. Y. & WU, Y. T. 2008. Prevalence of sarcopenia estimated using a bioelectrical impedance analysis prediction equation in community-‐dwelling elderly people in Taiwan. J Am Geriatr Soc, 56, 1710-‐ 5. CHIEN, M. Y., KUO, H. K. & WU, Y. T. 2010. Sarcopenia, cardiopulmonary fitness, and physical disability in community-‐dwelling elderly people. Phys Ther, 90, 1277-‐87. CHIN, S. O., RHEE, S. Y., CHON, S., HWANG, Y. C., JEONG, I. K., OH, S., AHN, K. J., CHUNG, H. Y., WOO, J. T., KIM, S. W., KIM, J. W., KIM, Y. S. & AHN, H. Y. 2013. Sarcopenia is independently associated with cardiovascular disease in older Korean adults: the Korea National Health and Nutrition Examination Survey (KNHANES) from 2009. PLoS One, 8, e60119. CHIPMAN, P. H., FRANZ, C. K., NELSON, A., SCHACHNER, M. & RAFUSE, V. F. 2010. Neural cell adhesion molecule is required for stability of reinnervated neuromuscular junctions. Eur J Neurosci, 31, 238-‐49. 244 CHOMCZYNSKI, P. & SACCHI, N. 1987. Single-‐step method of RNA isolation by acid guanidinium thiocyanate-‐phenol-‐chloroform extraction. Anal Biochem, 162, 156-‐9. CHONDROGIANNI, N., STRATFORD, F. L., TROUGAKOS, I. P., FRIGUET, B., RIVETT, A. J. & GONOS, E. S. 2003. Central role of the proteasome in senescence and survival of human fibroblasts: induction of a senescence-‐like phenotype upon its inhibition and resistance to stress upon its activation. J Biol Chem, 278, 28026-‐37. CHOPARD, A., HILLOCK, S. & JASMIN, B. J. 2009. Molecular events and signalling pathways involved in skeletal muscle disuse-‐induced atrophy and the impact of countermeasures. J Cell Mol Med, 13, 3032-‐50. CHRYSIS, D. & UNDERWOOD, L. E. 1999. Regulation of components of the ubiquitin system by insulin-‐like growth factor I and growth hormone in skeletal muscle of rats made catabolic with dexamethasone. Endocrinology, 140, 5635-‐41. CHRYSIS, D., ZHANG, J. & UNDERWOOD, L. E. 2002. Divergent regulation of proteasomes by insulin-‐like growth factor I and growth hormone in skeletal muscle of rats made catabolic with dexamethasone. Growth Horm IGF Res, 12, 434-‐41. CHUMLEA, W. C., CESARI, M., EVANS, W. J., FERRUCCI, L., FIELDING, R. A., PAHOR, M., STUDENSKI, S. & VELLAS, B. 2011. Sarcopenia: designing phase IIB trials. J Nutr Health Aging, 15, 450-‐5. CHUNG, L. & NG, Y. C. 2006. Age-‐related alterations in expression of apoptosis regulatory proteins and heat shock proteins in rat skeletal muscle. Biochim Biophys Acta, 1762, 103-‐9. CIRIC, I., ZHAO, J. C., DU, H., FINDLING, J. W., MOLITCH, M. E., WEISS, R. E., REFETOFF, S., KERR, W. D. & MEYER, J. 2011. Transsphenoidal Surgery for Cushing's Disease: Experience with 136 Patients. Neurosurgery. CLARK, B. C. & MANINI, T. M. 2008. Sarcopenia =/= dynapenia. J Gerontol A Biol Sci Med Sci, 63, 829-‐34. CLARKE, B. A., DRUJAN, D., WILLIS, M. S., MURPHY, L. O., CORPINA, R. A., BUROVA, E., RAKHILIN, S. V., STITT, T. N., PATTERSON, C., LATRES, E. & GLASS, D. J. 2007. The E3 Ligase MuRF1 degrades myosin heavy chain protein in dexamethasone-‐treated skeletal muscle. Cell Metab, 6, 376-‐85. CLAVEL, S., COLDEFY, A. S., KURKDJIAN, E., SALLES, J., MARGARITIS, I. & DERIJARD, B. 2006. Atrophy-‐related ubiquitin ligases, atrogin-‐1 and MuRF1 are up-‐regulated in aged rat Tibialis Anterior muscle. Mech Ageing Dev, 127, 794-‐801. CLAYTON, R. N., RASKAUSKIENE, D., REULEN, R. C. & JONES, P. W. 2011. Mortality and morbidity in Cushing's disease over 50 years in Stoke-‐on-‐ Trent, UK: audit and meta-‐analysis of literature. J Clin Endocrinol Metab, 96, 632-‐42. CLEGG, A., YOUNG, J., ILIFFE, S., RIKKERT, M. O. & ROCKWOOD, K. 2013. Frailty in elderly people. Lancet, 381, 752-‐62. CLEMMONS, D. R. & UNDERWOOD, L. E. 1991. Nutritional regulation of IGF-‐I and IGF binding proteins. Annu Rev Nutr, 11, 393-‐412. COELI, F. B., FERRAZ, L. F., LEMOS-‐MARINI, S. H., RIGATTO, S. Z., BELANGERO, V. M. & DE-‐MELLO, M. P. 2008. Apparent mineralocorticoid excess syndrome 245 in a Brazilian boy caused by the homozygous missense mutation p.R186C in the HSD11B2 gene. Arq Bras Endocrinol Metabol, 52, 1277-‐81. COHN, L., FELLER, A. G., DRAPER, M. W., RUDMAN, I. W. & RUDMAN, D. 1993. Carpal tunnel syndrome and gynaecomastia during growth hormone treatment of elderly men with low circulating IGF-‐I concentrations. Clin Endocrinol (Oxf), 39, 417-‐25. COLAO, A., PIVONELLO, R., SPIEZIA, S., FAGGIANO, A., FERONE, D., FILIPPELLA, M., MARZULLO, P., CERBONE, G., SICILIANI, M. & LOMBARDI, G. 1999. Persistence of increased cardiovascular risk in patients with Cushing's disease after five years of successful cure. J Clin Endocrinol Metab, 84, 2664-‐72. COLLINS, P. 2008. HDL-‐C in post-‐menopausal women: An important therapeutic target. Int J Cardiol, 124, 275-‐82. COLLINS, R. A. & GROUNDS, M. D. 2001. The role of tumor necrosis factor-‐alpha (TNF-‐alpha) in skeletal muscle regeneration. Studies in TNF-‐alpha(-‐/-‐) and TNF-‐alpha(-‐/-‐)/LT-‐alpha(-‐/-‐) mice. J Histochem Cytochem, 49, 989-‐ 1001. COLOMBEL, A. & CHARBONNEL, B. 1997. Weight gain and cardiovascular risk factors in the post-‐menopausal women. Hum Reprod, 12 Suppl 1, 134-‐45. COMBARET, L., DARDEVET, D., BECHET, D., TAILLANDIER, D., MOSONI, L. & ATTAIX, D. 2009. Skeletal muscle proteolysis in aging. Curr Opin Clin Nutr Metab Care, 12, 37-‐41. COMBARET, L., TAILLANDIER, D., DARDEVET, D., BECHET, D., RALLIERE, C., CLAUSTRE, A., GRIZARD, J. & ATTAIX, D. 2004. Glucocorticoids regulate mRNA levels for subunits of the 19 S regulatory complex of the 26 S proteasome in fast-‐twitch skeletal muscles. Biochem J, 378, 239-‐46. COOPER, M. S., RABBITT, E. H., GODDARD, P. E., BARTLETT, W. A., HEWISON, M. & STEWART, P. M. 2002. Osteoblastic 11beta-‐hydroxysteroid dehydrogenase type 1 activity increases with age and glucocorticoid exposure. J Bone Miner Res, 17, 979-‐86. COOPER, M. S. & STEWART, P. M. 2009. 11Beta-‐hydroxysteroid dehydrogenase type 1 and its role in the hypothalamus-‐pituitary-‐adrenal axis, metabolic syndrome, and inflammation. J Clin Endocrinol Metab, 94, 4645-‐54. COOPER, M. S., WALKER, E. A., BLAND, R., FRASER, W. D., HEWISON, M. & STEWART, P. M. 2000. Expression and functional consequences of 11beta-‐ hydroxysteroid dehydrogenase activity in human bone. Bone, 27, 375-‐81. COURTNEY, R., STEWART, P. M., TOH, M., NDONGO, M. N., CALLE, R. A. & HIRSHBERG, B. 2008. Modulation of 11beta-‐hydroxysteroid dehydrogenase (11betaHSD) activity biomarkers and pharmacokinetics of PF-‐00915275, a selective 11betaHSD1 inhibitor. J Clin Endocrinol Metab, 93, 550-‐6. COUTINHO, A. E., GRAY, M., BROWNSTEIN, D. G., SALTER, D. M., SAWATZKY, D. A., CLAY, S., GILMOUR, J. S., SECKL, J. R., SAVILL, J. S. & CHAPMAN, K. E. 2012. 11beta-‐Hydroxysteroid dehydrogenase type 1, but not type 2, deficiency worsens acute inflammation and experimental arthritis in mice. Endocrinology, 153, 234-‐40. COX, L. S. & FARAGHER, R. G. 2007. From old organisms to new molecules: integrative biology and therapeutic targets in accelerated human ageing. Cell Mol Life Sci, 64, 2620-‐41. 246 CRAWFORD, B. A., LIU, P. Y., KEAN, M. T., BLEASEL, J. F. & HANDELSMAN, D. J. 2003. Randomized placebo-‐controlled trial of androgen effects on muscle and bone in men requiring long-‐term systemic glucocorticoid treatment. J Clin Endocrinol Metab, 88, 3167-‐76. CUSHING, H. 1932. The basophil adenomas of the pituitary body and their clinical manifestations (pituitary basophilism). Bull John Hopkins, 50, 137. CZERWINSKI, S. M., KUROWSKI, T. G., O'NEILL, T. M. & HICKSON, R. C. 1987. Initiating regular exercise protects against muscle atrophy from glucocorticoids. J Appl Physiol (1985), 63, 1504-‐10. DALBO, V. J., ROBERTS, M. D., SUNDERLAND, K. L., POOLE, C. N., STOUT, J. R., BECK, T. W., BEMBEN, M. & KERKSICK, C. M. 2011. Acute loading and aging effects on myostatin pathway biomarkers in human skeletal muscle after three sequential bouts of resistance exercise. J Gerontol A Biol Sci Med Sci, 66, 855-‐65. DANON, M. J. & SCHLISELFELD, L. H. 2007. Study of skeletal muscle glycogenolysis and glycolysis in chronic steroid myopathy, non-‐steroid histochemical type-‐2 fiber atrophy, and denervation. Clin Biochem, 40, 46-‐ 51. D'ANTONA, G., PELLEGRINO, M. A., ADAMI, R., ROSSI, R., CARLIZZI, C. N., CANEPARI, M., SALTIN, B. & BOTTINELLI, R. 2003. The effect of ageing and immobilization on structure and function of human skeletal muscle fibres. J Physiol, 552, 499-‐511. DARDEVET, D., SORNET, C., TAILLANDIER, D., SAVARY, I., ATTAIX, D. & GRIZARD, J. 1995. Sensitivity and protein turnover response to glucocorticoids are different in skeletal muscle from adult and old rats. Lack of regulation of the ubiquitin-‐proteasome proteolytic pathway in aging. J Clin Invest, 96, 2113-‐9. DAVE-‐SHARMA, S., WILSON, R. C., HARBISON, M. D., NEWFIELD, R., AZAR, M. R., KROZOWSKI, Z. S., FUNDER, J. W., SHACKLETON, C. H., BRADLOW, H. L., WEI, J. Q., HERTECANT, J., MORAN, A., NEIBERGER, R. E., BALFE, J. W., FATTAH, A., DANEMAN, D., AKKURT, H. I., DE SANTIS, C. & NEW, M. I. 1998. Examination of genotype and phenotype relationships in 14 patients with apparent mineralocorticoid excess. J Clin Endocrinol Metab, 83, 2244-‐54. DAYHOFF-‐BRANNIGAN, M., FERRUCCI, L., SUN, K., FRIED, L. P., WALSTON, J., VARADHAN, R., GURALNIK, J. M. & SEMBA, R. D. 2008. Oxidative protein damage is associated with elevated serum interleukin-‐6 levels among older moderately to severely disabled women living in the community. J Gerontol A Biol Sci Med Sci, 63, 179-‐83. DE GONZALO-‐CALVO, D., FERNANDEZ-‐GARCIA, B., DE LUXAN-‐DELGADO, B., RODRIGUEZ-‐GONZALEZ, S., GARCIA-‐MACIA, M., SUAREZ, F. M., SOLANO, J. J., RODRIGUEZ-‐COLUNGA, M. J. & COTO-‐MONTES, A. 2012. Long-‐term training induces a healthy inflammatory and endocrine emergent biomarker profile in elderly men. Age (Dordr), 34, 761-‐71. DEGENS, H. 2010. The role of systemic inflammation in age-‐related muscle weakness and wasting. Scand J Med Sci Sports, 20, 28-‐38. DEGROOT, L. J. & JAMESON, J. L. 2006. Endocrinology, Philadelphia, Elsevier Saunders. 247 DEKHUIJZEN, P. N., GAYAN-‐RAMIREZ, G., BISSCHOP, A., DE BOCK, V., DOM, R. & DECRAMER, M. 1995. Corticosteroid treatment and nutritional deprivation cause a different pattern of atrophy in rat diaphragm. J Appl Physiol, 78, 629-‐37. DEKKERS, O. M., BIERMASZ, N. R., PEREIRA, A. M., ROELFSEMA, F., VAN AKEN, M. O., VOORMOLEN, J. H. & ROMIJN, J. A. 2007. Mortality in patients treated for Cushing's disease is increased, compared with patients treated for nonfunctioning pituitary macroadenoma. J Clin Endocrinol Metab, 92, 976-‐ 81. DELMONICO, M. J., HARRIS, T. B., VISSER, M., PARK, S. W., CONROY, M. B., VELASQUEZ-‐MIEYER, P., BOUDREAU, R., MANINI, T. M., NEVITT, M., NEWMAN, A. B. & GOODPASTER, B. H. 2009. Longitudinal study of muscle strength, quality, and adipose tissue infiltration. Am J Clin Nutr, 90, 1579-‐ 85. DENNIS, R. A., PRZYBYLA, B., GURLEY, C., KORTEBEIN, P. M., SIMPSON, P., SULLIVAN, D. H. & PETERSON, C. A. 2008. Aging alters gene expression of growth and remodeling factors in human skeletal muscle both at rest and in response to acute resistance exercise. Physiol Genomics, 32, 393-‐400. DENNISON, E., HINDMARSH, P., FALL, C., KELLINGRAY, S., BARKER, D., PHILLIPS, D. & COOPER, C. 1999. Profiles of endogenous circulating cortisol and bone mineral density in healthy elderly men. J Clin Endocrinol Metab, 84, 3058-‐63. DESANTIS, A. S., DIEZROUX, A. V., HAJAT, A., GOLDEN, S. H., JENNY, N. S., SANCHEZ, B. N., SHEA, S. & SEEMAN, T. E. 2011. Associations of salivary cortisol levels with metabolic syndrome and its components: the multi-‐ ethnic study of atherosclerosis. J Clin Endocrinol Metab, 96, 3483-‐92. DESBRIERE, R., VUAROQUEAUX, V., ACHARD, V., BOULLU-‐CIOCCA, S., LABUHN, M., DUTOUR, A. & GRINO, M. 2006. 11beta-‐hydroxysteroid dehydrogenase type 1 mRNA is increased in both visceral and subcutaneous adipose tissue of obese patients. Obesity (Silver Spring), 14, 794-‐8. DEUSCHLE, M., GOTTHARDT, U., SCHWEIGER, U., WEBER, B., KORNER, A., SCHMIDER, J., STANDHARDT, H., LAMMERS, C. H. & HEUSER, I. 1997. With aging in humans the activity of the hypothalamus-‐pituitary-‐adrenal system increases and its diurnal amplitude flattens. Life Sci, 61, 2239-‐46. DEUTSCHBEIN, T., BROECKER-‐PREUSS, M., HARTMANN, M. F., ALTHOFF, R., WUDY, S. A., MANN, K. & PETERSENN, S. 2011. Measurement of urinary free cortisol by current immunoassays: need for sex-‐dependent reference ranges to define hypercortisolism. Horm Metab Res, 43, 714-‐9. DE VILLIERS, T. J. & STEVENSON, J. C. 2012. The WHI: the effect of hormone replacement therapy on fracture prevention. Climacteric, 15, 263-‐6. DHAR, A. & CASTILLO, L. 2011. Insulin resistance in critical illness. Curr Opin Pediatr, 23, 269-‐74. DHILLO, W.S., KONG, W.M., LE ROUX, C.W., ALAGHBAND-‐ZADEH, J., JONES, J., CARTER, G., MENDOZA, N., MEERAN, K., O'SHEA, D. 2002. Cortisol-‐binding globulin is important in the interpretation of dynamic tests of the hypothalamic-‐pituitary-‐adrenal axis. Eur J Endocrinol, 146, 231-‐5. DI GIOVANNI, S., MOLON, A., BROCCOLINI, A., MELCON, G., MIRABELLA, M., HOFFMAN, E. P. & SERVIDEI, S. 2004. Constitutive activation of MAPK cascade in acute quadriplegic myopathy. Ann Neurol, 55, 195-‐206. 248 DIRKS-‐NAYLOR, A. J. & GRIFFITHS, C. L. 2009. Glucocorticoid-‐induced apoptosis and cellular mechanisms of myopathy. J Steroid Biochem Mol Biol, 117, 1-‐ 7. DODT, C., THEINE, K. J., UTHGENANNT, D., BORN, J. & FEHM, H. L. 1994. Basal secretory activity of the hypothalamo-‐pituitary-‐adrenocortical axis is enhanced in healthy elderly. An assessment during undisturbed night-‐ time sleep. Eur J Endocrinol, 131, 443-‐50. DONG, Y., PAN, J. S. & ZHANG, L. 2013. Myostatin suppression of Akirin1 mediates glucocorticoid-‐induced satellite cell dysfunction. PLoS One, 8, e58554. DORAN, P., DONOGHUE, P., O'CONNELL, K., GANNON, J. & OHLENDIECK, K. 2009. Proteomics of skeletal muscle aging. Proteomics, 9, 989-‐1003. DORIA, E., BUONOCORE, D., FOCARELLI, A. & MARZATICO, F. 2012. Relationship between human aging muscle and oxidative system pathway. Oxid Med Cell Longev, 2012, 830257. DOUGLASS, J. A., TUXEN, D. V., HORNE, M., SCHEINKESTEL, C. D., WEINMANN, M., CZARNY, D. & BOWES, G. 1992. Myopathy in severe asthma. Am Rev Respir Dis, 146, 517-‐9. DOVIO, A., ROVEDA, E., SCIOLLA, C., MONTARULI, A., RAFFAELLI, A., SABA, A., CALOGIURI, G., DE FRANCIA, S., BORRIONE, P., SALVADORI, P., CARANDENTE, F. & ANGELI, A. 2010. Intense physical exercise increases systemic 11beta-‐hydroxysteroid dehydrogenase type 1 activity in healthy adult subjects. Eur J Appl Physiol, 108, 681-‐7. DRAPER, N., ECHWALD, S. M., LAVERY, G. G., WALKER, E. A., FRASER, R., DAVIES, E., SORENSEN, T. I., ASTRUP, A., ADAMSKI, J., HEWISON, M., CONNELL, J. M., PEDERSEN, O. & STEWART, P. M. 2002. Association studies between microsatellite markers within the gene encoding human 11beta-‐ hydroxysteroid dehydrogenase type 1 and body mass index, waist to hip ratio, and glucocorticoid metabolism. J Clin Endocrinol Metab, 87, 4984-‐ 90. DRAPER, N. & STEWART, P. M. 2005. 11beta-‐hydroxysteroid dehydrogenase and the pre-‐receptor regulation of corticosteroid hormone action. J Endocrinol, 186, 251-‐71. DRAPER, N., WALKER, E. A., BUJALSKA, I. J., TOMLINSON, J. W., CHALDER, S. M., ARLT, W., LAVERY, G. G., BEDENDO, O., RAY, D. W., LAING, I., MALUNOWICZ, E., WHITE, P. C., HEWISON, M., MASON, P. J., CONNELL, J. M., SHACKLETON, C. H. & STEWART, P. M. 2003. Mutations in the genes encoding 11beta-‐hydroxysteroid dehydrogenase type 1 and hexose-‐6-‐ phosphate dehydrogenase interact to cause cortisone reductase deficiency. Nat Genet, 34, 434-‐9. DRUMMOND, M. J., MCCARTHY, J. J., SINHA, M., SPRATT, H. M., VOLPI, E., ESSER, K. A. & RASMUSSEN, B. B. 2011. Aging and microRNA expression in human skeletal muscle: a microarray and bioinformatics analysis. Physiol Genomics, 43, 595-‐603. DU, J., WANG, X., MIERELES, C., BAILEY, J. L., DEBIGARE, R., ZHENG, B., PRICE, S. R. & MITCH, W. E. 2004. Activation of caspase-‐3 is an initial step triggering accelerated muscle proteolysis in catabolic conditions. J Clin Invest, 113, 115-‐23. 249 EBERT, S. M., DYLE, M. C., KUNKEL, S. D., BULLARD, S. A., BONGERS, K. S., FOX, D. K., DIERDORFF, J. M., FOSTER, E. D. & ADAMS, C. M. 2012. Stress-‐induced skeletal muscle Gadd45a expression reprograms myonuclei and causes muscle atrophy. J Biol Chem, 287, 27290-‐301. EBERT, S. M., MONTEYS, A. M., FOX, D. K., BONGERS, K. S., SHIELDS, B. E., MALMBERG, S. E., DAVIDSON, B. L., SUNEJA, M. & ADAMS, C. M. 2010. The transcription factor ATF4 promotes skeletal myofiber atrophy during fasting. Mol Endocrinol, 24, 790-‐9. EDSTROM, E., ALTUN, M., HAGGLUND, M. & ULFHAKE, B. 2006. Atrogin-‐ 1/MAFbx and MuRF1 are downregulated in aging-‐related loss of skeletal muscle. J Gerontol A Biol Sci Med Sci, 61, 663-‐74. EDWARDS, C. R., STEWART, P. M., BURT, D., BRETT, L., MCINTYRE, M. A., SUTANTO, W. S., DE KLOET, E. R. & MONDER, C. 1988. Localisation of 11 beta-‐hydroxysteroid dehydrogenase-‐-‐tissue specific protector of the mineralocorticoid receptor. Lancet, 2, 986-‐9. EDWARDS, M. G., ANDERSON, R. M., YUAN, M., KENDZIORSKI, C. M., WEINDRUCH, R. & PROLLA, T. A. 2007. Gene expression profiling of aging reveals activation of a p53-‐mediated transcriptional program. BMC Genomics, 8, 80. ELKINA, Y., VON HAEHLING, S., ANKER, S. D. & SPRINGER, J. 2011. The role of myostatin in muscle wasting: an overview. J Cachexia Sarcopenia Muscle, 2, 143-‐151. ENGELI, S., BOHNKE, J., FELDPAUSCH, M., GORZELNIAK, K., HEINTZE, U., JANKE, J., LUFT, F. C. & SHARMA, A. M. 2004. Regulation of 11beta-‐HSD genes in human adipose tissue: influence of central obesity and weight loss. Obes Res, 12, 9-‐17. ESPOSITO, F., DUSICK, J. R., COHAN, P., MOFTAKHAR, P., MCARTHUR, D., WANG, C., SWERDLOFF, R. S. & KELLY, D. F. 2006. Clinical review: Early morning cortisol levels as a predictor of remission after transsphenoidal surgery for Cushing's disease. J Clin Endocrinol Metab, 91, 7-‐13. ETXABE, J. & VAZQUEZ, J. A. 1994. Morbidity and mortality in Cushing's disease: an epidemiological approach. Clin Endocrinol (Oxf), 40, 479-‐84. EUROSTAT 2008. The Statistical Office of the European Communities Report 'Ageing Characterises the Demographic Perspectives of the European Societies'. Available from: http://europa.eu/rapid/press-‐release_STAT-‐ 08-‐119_en.htm. EVANS, W. J., MORLEY, J. E., ARGILES, J., BALES, C., BARACOS, V., GUTTRIDGE, D., JATOI, A., KALANTAR-‐ZADEH, K., LOCHS, H., MANTOVANI, G., MARKS, D., MITCH, W. E., MUSCARITOLI, M., NAJAND, A., PONIKOWSKI, P., ROSSI FANELLI, F., SCHAMBELAN, M., SCHOLS, A., SCHUSTER, M., THOMAS, D., WOLFE, R. & ANKER, S. D. 2008. Cachexia: a new definition. Clin Nutr, 27, 793-‐9. EVANS, W. J., PHINNEY, S. D. & YOUNG, V. R. 1982. Suction applied to a muscle biopsy maximizes sample size. Med Sci Sports Exerc, 14, 101-‐2. EVENSON, A. R., FAREED, M. U., MENCONI, M. J., MITCHELL, J. C. & HASSELGREN, P. O. 2005. GSK-‐3beta inhibitors reduce protein degradation in muscles from septic rats and in dexamethasone-‐treated myotubes. Int J Biochem Cell Biol, 37, 2226-‐38. 250 FAGGIANO, A., PIVONELLO, R., SPIEZIA, S., DE MARTINO, M. C., FILIPPELLA, M., DI SOMMA, C., LOMBARDI, G. & COLAO, A. 2003. Cardiovascular risk factors and common carotid artery caliber and stiffness in patients with Cushing's disease during active disease and 1 year after disease remission. J Clin Endocrinol Metab, 88, 2527-‐33. FAREED, M. U., EVENSON, A. R., WEI, W., MENCONI, M., POYLIN, V., PETKOVA, V., PIGNOL, B. & HASSELGREN, P. O. 2006. Treatment of rats with calpain inhibitors prevents sepsis-‐induced muscle proteolysis independent of atrogin-‐1/MAFbx and MuRF1 expression. Am J Physiol Regul Integr Comp Physiol, 290, R1589-‐97. FEIG, P. U., SHAH, S., HERMANOWSKI-‐VOSATKA, A., PLOTKIN, D., SPRINGER, M. S., DONAHUE, S., THACH, C., KLEIN, E. J., LAI, E. & KAUFMAN, K. D. 2011. Effects of an 11beta-‐hydroxysteroid dehydrogenase type 1 inhibitor, MK-‐ 0916, in patients with type 2 diabetes mellitus and metabolic syndrome. Diabetes Obes Metab, 13, 498-‐504. FERNANDEZ-‐RODRIGUEZ, E., STEWART, P. M. & COOPER, M. S. 2009. The pituitary-‐adrenal axis and body composition. Pituitary, 12, 105-‐15. FERRARI, E., CASAROTTI, D., MUZZONI, B., ALBERTELLI, N., CRAVELLO, L., FIORAVANTI, M., SOLERTE, S. B. & MAGRI, F. 2001a. Age-‐related changes of the adrenal secretory pattern: possible role in pathological brain aging. Brain Res Brain Res Rev, 37, 294-‐300. FERRARI, E., CRAVELLO, L., MUZZONI, B., CASAROTTI, D., PALTRO, M., SOLERTE, S. B., FIORAVANTI, M., CUZZONI, G., PONTIGGIA, B. & MAGRI, F. 2001b. Age-‐related changes of the hypothalamic-‐pituitary-‐adrenal axis: pathophysiological correlates. Eur J Endocrinol, 144, 319-‐29. FERRARI, P., OBEYESEKERE, V. R., LI, K., ANDREWS, R. K. & KROZOWSKI, Z. S. 1996. The 11 beta-‐hydroxysteroid dehydrogenase type II enzyme: biochemical consequences of the congenital R337C mutation. Steroids, 61, 197-‐200. FIATARONE, M. A., O'NEILL, E. F., RYAN, N. D., CLEMENTS, K. M., SOLARES, G. R., NELSON, M. E., ROBERTS, S. B., KEHAYIAS, J. J., LIPSITZ, L. A. & EVANS, W. J. 1994. Exercise training and nutritional supplementation for physical frailty in very elderly people. N Engl J Med, 330, 1769-‐75. FIELDING, R. A., VELLAS, B., EVANS, W. J., BHASIN, S., MORLEY, J. E., NEWMAN, A. B., ABELLAN VAN KAN, G., ANDRIEU, S., BAUER, J., BREUILLE, D., CEDERHOLM, T., CHANDLER, J., DE MEYNARD, C., DONINI, L., HARRIS, T., KANNT, A., KEIME GUIBERT, F., ONDER, G., PAPANICOLAOU, D., ROLLAND, Y., ROOKS, D., SIEBER, C., SOUHAMI, E., VERLAAN, S. & ZAMBONI, M. 2011. Sarcopenia: an undiagnosed condition in older adults. Current consensus definition: prevalence, etiology, and consequences. International working group on sarcopenia. J Am Med Dir Assoc, 12, 249-‐ 56. FLESERIU, M., BILLER, B. M., FINDLING, J. W., MOLITCH, M. E., SCHTEINGART, D. E. & GROSS, C. 2012. Mifepristone, a glucocorticoid receptor antagonist, produces clinical and metabolic benefits in patients with Cushing's syndrome. J Clin Endocrinol Metab, 97, 2039-‐49. FLITSCH, J., KNAPPE, U. J. & LUDECKE, D. K. 2003. The use of postoperative ACTH levels as a marker for successful transsphenoidal microsurgery in Cushing's disease. Zentralbl Neurochir, 64, 6-‐11. 251 FEDERAL INTERAGENCY FORUM ON AGING RELATED STATISTICS REPORT (FORUM) 2008. Older Americans: Key Indicators of Well-‐Being. Available from: http://www.agingstats.gov/Main_Site/Data/2008_Documents/OA_2008. pdf FOWKE, J. H., MATTHEWS, C. E., YU, H., CAI, Q., COHEN, S., BUCHOWSKI, M. S., ZHENG, W. & BLOT, W. J. 2010. Racial differences in the association between body mass index and serum IGF1, IGF2, and IGFBP3. Endocr Relat Cancer, 17, 51-‐60. FRAJESE, G. V., TAYLOR, N. F., JENKINS, P. J., BESSER, G. M. & MONSON, J. P. 2004. Modulation of cortisol metabolism during treatment of acromegaly is independent of body composition and insulin sensitivity. Horm Res, 61, 246-‐51. FRANCESCHI, C. & BONAFE, M. 2003. Centenarians as a model for healthy aging. Biochem Soc Trans, 31, 457-‐61. FRIED, L. P., FERRUCCI, L., DARER, J., WILLIAMSON, J. D. & ANDERSON, G. 2004. Untangling the concepts of disability, frailty, and comorbidity: implications for improved targeting and care. J Gerontol A Biol Sci Med Sci, 59, 255-‐63. FUNDER, J. W. 2005. Mineralocorticoid receptors: distribution and activation. Heart Fail Rev, 10, 15-‐22. FURUKAWA-‐HIBI, Y., YOSHIDA-‐ARAKI, K., OHTA, T., IKEDA, K. & MOTOYAMA, N. 2002. FOXO forkhead transcription factors induce G(2)-‐M checkpoint in response to oxidative stress. J Biol Chem, 277, 26729-‐32. GALE, C. R., MARTYN, C. N., COOPER, C. & SAYER, A. A. 2007. Grip strength, body composition, and mortality. Int J Epidemiol, 36, 228-‐35. GARDINER, P. F., HIBL, B., SIMPSON, D. R., ROY, R. & EDGERTON, V. R. 1980. Effects of a mild weight-‐lifting program on the progress of glucocorticoid-‐ induced atrophy in rat hindlimb muscles. Pflugers Arch, 385, 147-‐53. GARIBALLA, S. & ALESSA, A. 2013. Sarcopenia: prevalence and prognostic significance in hospitalized patients. Clin Nutr, 32, 772-‐6. GATHERCOLE, L. L., LAVERY, G. G., MORGAN, S. A., COOPER, M. S., SINCLAIR, A. J., TOMLINSON, J. W. & STEWART, P. M. 2013. 11beta-‐hydroxysteroid dehydrogenase 1: translational and therapeutic aspects. Endocr Rev, 34, 525-‐55. GAYAN-‐RAMIREZ, G., VANDERHOYDONC, F., VERHOEVEN, G. & DECRAMER, M. 1999. Acute treatment with corticosteroids decreases IGF-‐1 and IGF-‐2 expression in the rat diaphragm and gastrocnemius. Am J Respir Crit Care Med, 159, 283-‐9. GEER, E. B., SHEN, W., STROHMAYER, E., POST, K. D. & FREDA, P. U. 2012. Body composition and cardiovascular risk markers after remission of Cushing's disease: a prospective study using whole-‐body MRI. J Clin Endocrinol Metab, 97, 1702-‐11. GILSON, H., SCHAKMAN, O., COMBARET, L., LAUSE, P., GROBET, L., ATTAIX, D., KETELSLEGERS, J. M. & THISSEN, J. P. 2007. Myostatin gene deletion prevents glucocorticoid-‐induced muscle atrophy. Endocrinology, 148, 452-‐60. GIORDANO, R., DI VITO, L., LANFRANCO, F., BROGLIO, F., BENSO, A., GIANOTTI, L., GROTTOLI, S., GHIGO, E. & ARVAT, E. 2001. Elderly subjects show 252 severe impairment of dehydroepiandrosterone sulphate and reduced sensitivity of cortisol and aldosterone response to the stimulatory effect of ACTH(1-‐24). Clin Endocrinol (Oxf), 55, 259-‐65. GIOVANNINI, C., CHIECO, P., BERTACCINI, A., GRAMANTIERI, L., LACCHINI, M. & MARTORANA, G. 2004. Checkpoint effectors CDKN1A and Gadd45 correlate with oxidative DNA damage in human prostate carcinoma. Anticancer Res, 24, 3955-‐60. GIRESI, P. G., STEVENSON, E. J., THEILHABER, J., KONCAREVIC, A., PARKINGTON, J., FIELDING, R. A. & KANDARIAN, S. C. 2005. Identification of a molecular signature of sarcopenia. Physiol Genomics, 21, 253-‐63. GLASOW, A., BREIDERT, M., HAIDAN, A., ANDEREGG, U., KELLY, P.A., BORNSTEIN, S.R. Functional aspects of the effect of prolactin (PRL) on adrenal steroidogenesis and distribution of the PRL receptor in the human adrenal gland. J Clin Endocrinol Metab. 8, 3103-‐11. GODA, N., RYAN, H. E., KHADIVI, B., MCNULTY, W., RICKERT, R. C. & JOHNSON, R. S. 2003. Hypoxia-‐inducible factor 1alpha is essential for cell cycle arrest during hypoxia. Mol Cell Biol, 23, 359-‐69. GOLDING, D. N., MURRAY, S. M., PEARCE, G. W. & THOMPSON, M. 1961. Corticosteroid myopathy. Ann Phys Med, 6, 171-‐7. GONNELLA, P., ALAMDARI, N., TIZIO, S., AVERSA, Z., PETKOVA, V. & HASSELGREN, P. O. 2011. C/EBPbeta regulates dexamethasone-‐induced muscle cell atrophy and expression of atrogin-‐1 and MuRF1. J Cell Biochem, 112, 1737-‐48. GORLACH, A. & BONELLO, S. 2008. The cross-‐talk between NF-‐kappaB and HIF-‐ 1: further evidence for a significant liaison. Biochem J, 412, e17-‐9. GOVERNMENT'S ACTUARY DEPARTMENT REPORT FOR UK PARLIAMENT 2010. The Ageing Population. Available from: http://www.parliament.uk/business/publications/research/key-‐issues-‐ for-‐the-‐new-‐parliament/value-‐for-‐money-‐in-‐public-‐services/the-‐ageing-‐ population/. GREEN, M. F. & HIRSCHEY, M. D. 2013. SIRT3 weighs heavily in the metabolic balance: a new role for SIRT3 in metabolic syndrome. J Gerontol A Biol Sci Med Sci, 68, 105-‐7. GREENDALE, G. A., KRITZ-‐SILVERSTEIN, D., SEEMAN, T. & BARRETT-‐CONNOR, E. 2000. Higher basal cortisol predicts verbal memory loss in postmenopausal women: Rancho Bernardo Study. J Am Geriatr Soc, 48, 1655-‐8. GREENDALE, G. A., UNGER, J. B., ROWE, J. W. & SEEMAN, T. E. 1999. The relation between cortisol excretion and fractures in healthy older people: results from the MacArthur studies-‐Mac. J Am Geriatr Soc, 47, 799-‐803. GREENSPAN, S. L., ROWE, J. W., MAITLAND, L. A., MCALOON-‐DYKE, M. & ELAHI, D. 1993. The pituitary-‐adrenal glucocorticoid response is altered by gender and disease. J Gerontol, 48, M72-‐7. GREIWE, J. S., CHENG, B., RUBIN, D. C., YARASHESKI, K. E. & SEMENKOVICH, C. F. 2001. Resistance exercise decreases skeletal muscle tumor necrosis factor alpha in frail elderly humans. FASEB J, 15, 475-‐82. GUILLET, C. & BOIRIE, Y. 2005. Insulin resistance: a contributing factor to age-‐ related muscle mass loss? Diabetes Metab, 31 Spec No 2, 5S20-‐5S26. 253 GURALNIK, J. M., FERRUCCI, L., SIMONSICK, E. M., SALIVE, M. E. & WALLACE, R. B. 1995. Lower-‐extremity function in persons over the age of 70 years as a predictor of subsequent disability. N Engl J Med, 332, 556-‐61. HAMMER, G. D., TYRRELL, J. B., LAMBORN, K. R., APPLEBURY, C. B., HANNEGAN, E. T., BELL, S., RAHL, R., LU, A. & WILSON, C. B. 2004. Transsphenoidal microsurgery for Cushing's disease: initial outcome and long-‐term results. J Clin Endocrinol Metab, 89, 6348-‐57. HARDY, R.S., RABBITT, E.H., FILER, A., EMERY, P., HEWISON, M., STEWART, P.M., GITTOES, N., BUCKLEY, C.D., RAZA, K., COOPER, M.S. Local and systemic glucocorticoid metabolism in inflammatory arthritis. 2008. Annals of the Rheumatic Diseases, 67, 1204-‐10. HARRIS, H. J., KOTELEVTSEV, Y., MULLINS, J. J., SECKL, J. R. & HOLMES, M. C. 2001. Intracellular regeneration of glucocorticoids by 11beta-‐ hydroxysteroid dehydrogenase (11beta-‐HSD)-‐1 plays a key role in regulation of the hypothalamic-‐pituitary-‐adrenal axis: analysis of 11beta-‐ HSD-‐1-‐deficient mice. Endocrinology, 142, 114-‐20. HASSAN-‐SMITH, Z. & STEWART, P. M. 2011. Inherited forms of mineralocorticoid hypertension. Curr Opin Endocrinol Diabetes Obes. HASSAN-‐SMITH, Z. K., SHERLOCK, M., REULEN, R. C., ARLT, W., AYUK, J., TOOGOOD, A. A., COOPER, M. S., JOHNSON, A. P. & STEWART, P. M. 2012. Outcome of Cushing's disease following transsphenoidal surgery in a single center over 20 years. J Clin Endocrinol Metab, 97, 1194-‐201. HASTY, P. & CHRISTY, B. A. 2013. p53 as an intervention target for cancer and aging. Pathobiol Aging Age Relat Dis, 3. HEANEY, J. L., PHILLIPS, A. C. & CARROLL, D. 2012. Ageing, physical function, and the diurnal rhythms of cortisol and dehydroepiandrosterone. Psychoneuroendocrinology, 37, 341-‐9. HEEMELS, M. T. 2010. Ageing. Nature, 464, 503. HENCH, P. S. 1949. Potential Reversibility of Rheumatoid Arthritis. Ann Rheum Dis, 8, 90-‐6. HERRMAN, M., SCHOLMERICH, J., STRAUB, R.H. 2002. Influence of cytokines and growth factors on distinct steroidogenic enzymes in vitro: a short tabular data collection. Ann N Y Acad Sci, 966, 166-‐86. HICKSON, R. C. & DAVIS, J. R. 1981. Partial prevention of glucocorticoid-‐induced muscle atrophy by endurance training. Am J Physiol, 241, E226-‐32. HIRANI, V., NAGANATHAN, V., CUMMING, R. G., BLYTH, F., LE COUTEUR, D. G., HANDELSMAN, D. J., WAITE, L. M. & SEIBEL, M. J. 2013. Associations between frailty and serum 25-‐hydroxyvitamin D and 1,25-‐ dihydroxyvitamin D concentrations in older Australian men: the Concord Health and Ageing in Men Project. J Gerontol A Biol Sci Med Sci, 68, 1112-‐ 21. HOLLOWAY, L., BUTTERFIELD, G., HINTZ, R. L., GESUNDHEIT, N. & MARCUS, R. 1994. Effects of recombinant human growth hormone on metabolic indices, body composition, and bone turnover in healthy elderly women. J Clin Endocrinol Metab, 79, 470-‐9. HOLMES, M. C., CARTER, R. N., NOBLE, J., CHITNIS, S., DUTIA, A., PATERSON, J. M., MULLINS, J. J., SECKL, J. R. & YAU, J. L. 2010. 11beta-‐hydroxysteroid dehydrogenase type 1 expression is increased in the aged mouse 254 hippocampus and parietal cortex and causes memory impairments. J Neurosci, 30, 6916-‐20. HONG, D. H. & FORSBERG, N. E. 1995. Effects of dexamethasone on protein degradation and protease gene expression in rat L8 myotube cultures. Mol Cell Endocrinol, 108, 199-‐209. HORBER, F. F. & HAYMOND, M. W. 1990. Human growth hormone prevents the protein catabolic side effects of prednisone in humans. J Clin Invest, 86, 265-‐72. HORBER, F. F., SCHEIDEGGER, J. R., GRUNIG, B. E. & FREY, F. J. 1985. Thigh muscle mass and function in patients treated with glucocorticoids. Eur J Clin Invest, 15, 302-‐7. HOUSTON, D. K., NEIBERG, R. H., TOOZE, J. A., HAUSMAN, D. B., JOHNSON, M. A., CAULEY, J. A., BAUER, D. C., SHEA, M. K., SCHWARTZ, G. G., WILLIAMSON, J. D., HARRIS, T. B. & KRITCHEVSKY, S. B. 2013. Low 25-‐hydroxyvitamin D predicts the onset of mobility limitation and disability in community-‐ dwelling older adults: the Health ABC Study. J Gerontol A Biol Sci Med Sci, 68, 181-‐7. HOUSTON, D. K., NICKLAS, B. J., DING, J., HARRIS, T. B., TYLAVSKY, F. A., NEWMAN, A. B., LEE, J. S., SAHYOUN, N. R., VISSER, M. & KRITCHEVSKY, S. B. 2008. Dietary protein intake is associated with lean mass change in older, community-‐dwelling adults: the Health, Aging, and Body Composition (Health ABC) Study. Am J Clin Nutr, 87, 150-‐5. HOWARD, C., FERRUCCI, L., SUN, K., FRIED, L. P., WALSTON, J., VARADHAN, R., GURALNIK, J. M. & SEMBA, R. D. 2007. Oxidative protein damage is associated with poor grip strength among older women living in the community. J Appl Physiol (1985), 103, 17-‐20. HU, Z., WANG, H., LEE, I. H., DU, J. & MITCH, W. E. 2009. Endogenous glucocorticoids and impaired insulin signaling are both required to stimulate muscle wasting under pathophysiological conditions in mice. J Clin Invest, 119, 3059-‐69. HUANG, Y., LI, X., LIN, H., CHU, Y., CHEN, B., LIAN, Q. & GE, R. S. 2010. Regulation of 11beta-‐hydroxysteroid dehydrogenase 1 and 2 by IGF-‐1 in mice. Biochem Biophys Res Commun, 391, 1752-‐6. HUBBARD, J. G. H., INABNET, W. B. & LO, C.-‐Y. 2009. Endocrine surgery : principles and practice, London, Springer. HUNTER, R. B. & KANDARIAN, S. C. 2004. Disruption of either the Nfkb1 or the Bcl3 gene inhibits skeletal muscle atrophy. J Clin Invest, 114, 1504-‐11. IANNUZZI-‐SUCICH, M., PRESTWOOD, K. M. & KENNY, A. M. 2002. Prevalence of sarcopenia and predictors of skeletal muscle mass in healthy, older men and women. J Gerontol A Biol Sci Med Sci, 57, M772-‐7. IBEBUNJO, C., CHICK, J. M., KENDALL, T., EASH, J. K., LI, C., ZHANG, Y., VICKERS, C., WU, Z., CLARKE, B. A., SHI, J., CRUZ, J., FOURNIER, B., BRACHAT, S., GUTZWILLER, S., MA, Q., MARKOVITS, J., BROOME, M., STEINKRAUSS, M., SKUBA, E., GALARNEAU, J. R., GYGI, S. P. & GLASS, D. J. 2013. Genomic and proteomic profiling reveals reduced mitochondrial function and disruption of the neuromuscular junction driving rat sarcopenia. Mol Cell Biol, 33, 194-‐212. 255 INDER, W. J., OBEYESEKERE, V. R., ALFORD, F. P. & JANG, C. 2011. Skeletal muscle 11betaHSD1 activity of nondiabetic subjects is unaltered in central obesity-‐associated insulin resistance. Horm Metab Res, 43, 257-‐60. ISSA, A. M., ROWE, W., GAUTHIER, S. & MEANEY, M. J. 1990. Hypothalamic-‐ pituitary-‐adrenal activity in aged, cognitively impaired and cognitively unimpaired rats. J Neurosci, 10, 3247-‐54. JACKMAN, R. W., CORNWELL, E. W., WU, C. L. & KANDARIAN, S. C. 2013. Nuclear factor-‐kappaB signalling and transcriptional regulation in skeletal muscle atrophy. Exp Physiol, 98, 19-‐24. JACOBSON, L. 2005. Hypothalamic-‐pituitary-‐adrenocortical axis regulation. Endocrinol Metab Clin North Am, 34, 271-‐92, vii. JAMIESON, A., WALLACE, A. M., ANDREW, R., NUNEZ, B. S., WALKER, B. R., FRASER, R., WHITE, P. C. & CONNELL, J. M. 1999. Apparent cortisone reductase deficiency: a functional defect in 11beta-‐hydroxysteroid dehydrogenase type 1. J Clin Endocrinol Metab, 84, 3570-‐4. JANG, C., OBEYESEKERE, V. R., DILLEY, R. J., ALFORD, F. P. & INDER, W. J. 2006. 11Beta hydroxysteroid dehydrogenase type 1 is expressed and is biologically active in human skeletal muscle. Clin Endocrinol (Oxf), 65, 800-‐5. JANG, C., OBEYESEKERE, V. R., DILLEY, R. J., KROZOWSKI, Z., INDER, W. J. & ALFORD, F. P. 2007. Altered activity of 11beta-‐hydroxysteroid dehydrogenase types 1 and 2 in skeletal muscle confers metabolic protection in subjects with type 2 diabetes. J Clin Endocrinol Metab, 92, 3314-‐20. JANG, Y. C. & VAN REMMEN, H. 2011. Age-‐associated alterations of the neuromuscular junction. Exp Gerontol, 46, 193-‐8. JANG, Y. M., LEE, E. J., KIM, D. L., KIM, S. K. & SONG, K. H. 2012. The Association between Midnight Salivary Cortisol and Metabolic Syndrome in Korean Adults. Diabetes Metab J, 36, 245-‐50. JANSSEN, I., HEYMSFIELD, S. B. & ROSS, R. 2002. Low relative skeletal muscle mass (sarcopenia) in older persons is associated with functional impairment and physical disability. J Am Geriatr Soc, 50, 889-‐96. JANSSEN, I., SHEPARD, D. S., KATZMARZYK, P. T. & ROUBENOFF, R. 2004. The healthcare costs of sarcopenia in the United States. J Am Geriatr Soc, 52, 80-‐5. JING, E., EMANUELLI, B., HIRSCHEY, M. D., BOUCHER, J., LEE, K. Y., LOMBARD, D., VERDIN, E. M. & KAHN, C. R. 2011. Sirtuin-‐3 (Sirt3) regulates skeletal muscle metabolism and insulin signaling via altered mitochondrial oxidation and reactive oxygen species production. Proc Natl Acad Sci U S A, 108, 14608-‐13. JIN, K. 2010. Modern Biological Theories of Aging. Aging Dis, 1, 72-‐74. JO, E., LEE, S. R., PARK, B. S. & KIM, J. S. 2012. Potential mechanisms underlying the role of chronic inflammation in age-‐related muscle wasting. Aging Clin Exp Res, 24, 412-‐22. JONES, A., HWANG, D. J., NARAYANAN, R., MILLER, D. D. & DALTON, J. T. 2010. Effects of a novel selective androgen receptor modulator on dexamethasone-‐induced and hypogonadism-‐induced muscle atrophy. Endocrinology, 151, 3706-‐19. 256 JOSEPH, C., KENNY, A. M., TAXEL, P., LORENZO, J. A., DUQUE, G. & KUCHEL, G. A. 2005. Role of endocrine-‐immune dysregulation in osteoporosis, sarcopenia, frailty and fracture risk. Mol Aspects Med, 26, 181-‐201. JOZSI, A. C., DUPONT-‐VERSTEEGDEN, E. E., TAYLOR-‐JONES, J. M., EVANS, W. J., TRAPPE, T. A., CAMPBELL, W. W. & PETERSON, C. A. 2000. Aged human muscle demonstrates an altered gene expression profile consistent with an impaired response to exercise. Mech Ageing Dev, 120, 45-‐56. KADI, F., CHARIFI, N., DENIS, C. & LEXELL, J. 2004. Satellite cells and myonuclei in young and elderly women and men. Muscle Nerve, 29, 120-‐7. KALANTAR-‐ZADEH, K., STREJA, E., KOVESDY, C. P., OREOPOULOS, A., NOORI, N., JING, J., NISSENSON, A. R., KRISHNAN, M., KOPPLE, J. D., MEHROTRA, R. & ANKER, S. D. 2010. The obesity paradox and mortality associated with surrogates of body size and muscle mass in patients receiving hemodialysis. Mayo Clin Proc, 85, 991-‐1001. KALMIJN, S., LAUNER, L. J., STOLK, R. P., DE JONG, F. H., POLS, H. A., HOFMAN, A., BRETELER, M. M. & LAMBERTS, S. W. 1998. A prospective study on cortisol, dehydroepiandrosterone sulfate, and cognitive function in the elderly. J Clin Endocrinol Metab, 83, 3487-‐92. KAMBADUR, R., SHARMA, M., SMITH, T. P. & BASS, J. J. 1997. Mutations in myostatin (GDF8) in double-‐muscled Belgian Blue and Piedmontese cattle. Genome Res, 7, 910-‐6. KANDA, F., TAKATANI, K., OKUDA, S., MATSUSHITA, T. & CHIHARA, K. 1999. Preventive effects of insulinlike growth factor-‐I on steroid-‐induced muscle atrophy. Muscle Nerve, 22, 213-‐7. KATER, C. E., VILAR, L. & NEWELL-‐PRICE, J. 2007. Harvey Cushing and Philip Hench: pituitary basophilism meets cortisone excess. Arq Bras Endocrinol Metabol, 51, 1182-‐4. KATSUKI, A., SUMIDA, Y., MURASHIMA, S., MURATA, K., TAKARADA, Y., ITO, K., FUJII, M., TSUCHIHASHI, K., GOTO, H., NAKATANI, K. & YANO, Y. 1998. Serum levels of tumor necrosis factor-‐alpha are increased in obese patients with noninsulin-‐dependent diabetes mellitus. J Clin Endocrinol Metab, 83, 859-‐62. KAUR, K., HARDY, R., AHASAN, M. M., EIJKEN, M., VAN LEEUWEN, J. P., FILER, A., THOMAS, A. M., RAZA, K., BUCKLEY, C. D., STEWART, P. M., RABBITT, E. H., HEWISON, M. & COOPER, M. S. 2010. Synergistic induction of local glucocorticoid generation by inflammatory cytokines and glucocorticoids: implications for inflammation associated bone loss. Ann Rheum Dis, 69, 1185-‐90. KAWADA, S., TACHI, C. & ISHII, N. 2001. Content and localization of myostatin in mouse skeletal muscles during aging, mechanical unloading and reloading. J Muscle Res Cell Motil, 22, 627-‐33. KEENAN, D. M., ROELFSEMA, F., CARROLL, B. J., IRANMANESH, A. & VELDHUIS, J. D. 2009. Sex defines the age dependence of endogenous ACTH-‐cortisol dose responsiveness. Am J Physiol Regul Integr Comp Physiol, 297, R515-‐ 23. KELLER, P., KELLER, C., CAREY, A.L., JAUFFRED, S., FISCHER, C.P., STEENSBERG, A., PEDERSEN, B.K. 2003. Interleukin-‐6 production by contracting human skeletal muscle: autocrine regulation by IL-‐6. Biochem Biophys Res Commun, 2, 550-‐4. 257 KENYON, C. J. 2010. The genetics of ageing. Nature, 464, 504-‐12. KHALEELI, A. A., BETTERIDGE, D. J., EDWARDS, R. H., ROUND, J. M. & ROSS, E. J. 1983a. Effect of treatment of Cushing's syndrome on skeletal muscle structure and function. Clin Endocrinol (Oxf), 19, 547-‐56. KHALEELI, A. A., EDWARDS, R. H., GOHIL, K., MCPHAIL, G., RENNIE, M. J., ROUND, J. & ROSS, E. J. 1983b. Corticosteroid myopathy: a clinical and pathological study. Clin Endocrinol (Oxf), 18, 155-‐66. KIM, T. N., YANG, S. J., YOO, H. J., LIM, K. I., KANG, H. J., SONG, W., SEO, J. A., KIM, S. G., KIM, N. H., BAIK, S. H., CHOI, D. S. & CHOI, K. M. 2009. Prevalence of sarcopenia and sarcopenic obesity in Korean adults: the Korean sarcopenic obesity study. Int J Obes (Lond), 33, 885-‐92. KIMYAGAROV, S., KLID, R., FLEISSIG, Y., KOPEL, B., ARAD, M. & ADUNSKY, A. 2012. Skeletal muscle mass abnormalities are associated with survival rates of institutionalized elderly nursing home residents. J Nutr Health Aging, 16, 432-‐6. KITANAKA, S., KATSUMATA, N., TANAE, A., HIBI, I., TAKEYAMA, K., FUSE, H., KATO, S. & TANAKA, T. 1997. A new compound heterozygous mutation in the 11 beta-‐hydroxysteroid dehydrogenase type 2 gene in a case of apparent mineralocorticoid excess. J Clin Endocrinol Metab, 82, 4054-‐8. KITANAKA, S., TANAE, A. & HIBI, I. 1996. Apparent mineralocorticoid excess due to 11 beta-‐hydroxysteroid dehydrogenase deficiency: a possible cause of intrauterine growth retardation. Clin Endocrinol (Oxf), 44, 353-‐9. KOMAMURA, K., SHIROTANI-‐IKEJIMA, H., TATSUMI, R., TSUJITA-‐KURODA, Y., KITAKAZE, M., MIYATAKE, K., SUNAGAWA, K. & MIYATA, T. 2003. Differential gene expression in the rat skeletal and heart muscle in glucocorticoid-‐induced myopathy: analysis by microarray. Cardiovasc Drugs Ther, 17, 303-‐10. KOSKA, J., DE COURTEN, B., WAKE, D. J., NAIR, S., WALKER, B. R., BUNT, J. C., PERMANA, P. A., LINDSAY, R. S. & TATARANNI, P. A. 2006. 11beta-‐ hydroxysteroid dehydrogenase type 1 in adipose tissue and prospective changes in body weight and insulin resistance. Obesity (Silver Spring), 14, 1515-‐22. KOTELEVTSEV, Y., HOLMES, M. C., BURCHELL, A., HOUSTON, P. M., SCHMOLL, D., JAMIESON, P., BEST, R., BROWN, R., EDWARDS, C. R., SECKL, J. R. & MULLINS, J. J. 1997. 11beta-‐hydroxysteroid dehydrogenase type 1 knockout mice show attenuated glucocorticoid-‐inducible responses and resist hyperglycemia on obesity or stress. Proc Natl Acad Sci U S A, 94, 14924-‐9. KRAWIEC, B. J., NYSTROM, G. J., FROST, R. A., JEFFERSON, L. S. & LANG, C. H. 2007. AMP-‐activated protein kinase agonists increase mRNA content of the muscle-‐specific ubiquitin ligases MAFbx and MuRF1 in C2C12 cells. Am J Physiol Endocrinol Metab, 292, E1555-‐67. KUDIELKA, B. M., BUSKE-‐KIRSCHBAUM, A., HELLHAMMER, D. H. & KIRSCHBAUM, C. 2004. HPA axis responses to laboratory psychosocial stress in healthy elderly adults, younger adults, and children: impact of age and gender. Psychoneuroendocrinology, 29, 83-‐98. KUKRETI, H., AMUTHAVALLI, K., HARIKUMAR, A., SATHIYAMOORTHY, S., FENG, P. Z., ANANTHARAJ, R., TAN, S. L., LOKIREDDY, S., BONALA, S., SRIRAM, S., MCFARLANE, C., KAMBADUR, R. & SHARMA, M. 2013. Muscle-‐specific 258 microRNA1 (miR1) targets heat shock protein 70 (HSP70) during dexamethasone-‐mediated atrophy. J Biol Chem, 288, 6663-‐78. KUMARI, R., WILLING, L. B., JEFFERSON, L. S., SIMPSON, I. A. & KIMBALL, S. R. 2011. REDD1 (regulated in development and DNA damage response 1) expression in skeletal muscle as a surrogate biomarker of the efficiency of glucocorticoid receptor blockade. Biochem Biophys Res Commun, 412, 644-‐7. KUO, T., LEW, M. J., MAYBA, O., HARRIS, C. A., SPEED, T. P. & WANG, J. C. 2012. Genome-‐wide analysis of glucocorticoid receptor-‐binding sites in myotubes identifies gene networks modulating insulin signaling. Proc Natl Acad Sci U S A, 109, 11160-‐5. KWAN, P. 2013. Sarcopenia, a neurogenic syndrome? J Aging Res, 2013, 791679. LABEIT, S., KOHL, C. H., WITT, C. C., LABEIT, D., JUNG, J. & GRANZIER, H. 2010. Modulation of muscle atrophy, fatigue and MLC phosphorylation by MuRF1 as indicated by hindlimb suspension studies on MuRF1-‐KO mice. J Biomed Biotechnol, 2010, 693741. LACOMIS, D., GIULIANI, M. J., VAN COTT, A. & KRAMER, D. J. 1996. Acute myopathy of intensive care: clinical, electromyographic, and pathological aspects. Ann Neurol, 40, 645-‐54. LANDFIELD, P. W., WAYMIRE, J. C. & LYNCH, G. 1978. Hippocampal aging and adrenocorticoids: quantitative correlations. Science, 202, 1098-‐102. LANDI, F., LIPEROTI, R., FUSCO, D., MASTROPAOLO, S., QUATTROCIOCCHI, D., PROIA, A., RUSSO, A., BERNABEI, R. & ONDER, G. 2012. Prevalence and risk factors of sarcopenia among nursing home older residents. J Gerontol A Biol Sci Med Sci, 67, 48-‐55. LANDI, F., MARZETTI, E., LIPEROTI, R., PAHOR, M., RUSSO, A., MARTONE, A. M., COLLOCA, G., CAPOLUONGO, E. & BERNABEI, R. 2013a. Nonsteroidal anti-‐ inflammatory drug (NSAID) use and sarcopenia in older people: results from the ilSIRENTE study. J Am Med Dir Assoc, 14, 626 e9-‐13. LANDI, F., ONDER, G. & BERNABEI, R. 2013b. Sarcopenia and diabetes: two sides of the same coin. J Am Med Dir Assoc, 14, 540-‐1. LANGLEY, B., THOMAS, M., BISHOP, A., SHARMA, M., GILMOUR, S. & KAMBADUR, R. 2002. Myostatin inhibits myoblast differentiation by down-‐regulating MyoD expression. J Biol Chem, 277, 49831-‐40. LARON, Z. 2008. The GH-‐IGF1 axis and longevity. The paradigm of IGF1 deficiency. Hormones (Athens), 7, 24-‐7. LATRONICO, N., PELI, E. & BOTTERI, M. 2005. Critical illness myopathy and neuropathy. Curr Opin Crit Care, 11, 126-‐32. LAUGHLIN, G. A. & BARRETT-‐CONNOR, E. 2000. Sexual dimorphism in the influence of advanced aging on adrenal hormone levels: the Rancho Bernardo Study. J Clin Endocrinol Metab, 85, 3561-‐8. LAVERY, G. G., RONCONI, V., DRAPER, N., RABBITT, E. H., LYONS, V., CHAPMAN, K. E., WALKER, E. A., MCTERNAN, C. L., GIACCHETTI, G., MANTERO, F., SECKL, J. R., EDWARDS, C. R., CONNELL, J. M., HEWISON, M. & STEWART, P. M. 2003. Late-‐onset apparent mineralocorticoid excess caused by novel compound heterozygous mutations in the HSD11B2 gene. Hypertension, 42, 123-‐9. LAVERY, G. G., WALKER, E. A., DRAPER, N., JEYASURIA, P., MARCOS, J., SHACKLETON, C. H., PARKER, K. L., WHITE, P. C. & STEWART, P. M. 2006. 259 Hexose-‐6-‐phosphate dehydrogenase knock-‐out mice lack 11 beta-‐ hydroxysteroid dehydrogenase type 1-‐mediated glucocorticoid generation. J Biol Chem, 281, 6546-‐51. LAVERY, G. G., WALKER, E. A., TIGANESCU, A., RIDE, J. P., SHACKLETON, C. H., TOMLINSON, J. W., CONNELL, J. M., RAY, D. W., BIASON-‐LAUBER, A., MALUNOWICZ, E. M., ARLT, W. & STEWART, P. M. 2008. Steroid biomarkers and genetic studies reveal inactivating mutations in hexose-‐6-‐ phosphate dehydrogenase in patients with cortisone reductase deficiency. J Clin Endocrinol Metab, 93, 3827-‐32. LAVERY, G. G., ZIELINSKA, A. E., GATHERCOLE, L. L., HUGHES, B., SEMJONOUS, N., GUEST, P., SAQIB, K., SHERLOCK, M., REYNOLDS, G., MORGAN, S. A., TOMLINSON, J. W., WALKER, E. A., RABBITT, E. H. & STEWART, P. M. 2012. Lack of significant metabolic abnormalities in mice with liver-‐ specific disruption of 11beta-‐hydroxysteroid dehydrogenase type 1. Endocrinology, 153, 3236-‐48. LAWSON, A. J., WALKER, E. A., LAVERY, G. G., BUJALSKA, I. J., HUGHES, B., ARLT, W., STEWART, P. M. & RIDE, J. P. 2011. Cortisone-‐reductase deficiency associated with heterozygous mutations in 11beta-‐hydroxysteroid dehydrogenase type 1. Proc Natl Acad Sci U S A, 108, 4111-‐6. LECKER, S. H., JAGOE, R. T., GILBERT, A., GOMES, M., BARACOS, V., BAILEY, J., PRICE, S. R., MITCH, W. E. & GOLDBERG, A. L. 2004. Multiple types of skeletal muscle atrophy involve a common program of changes in gene expression. FASEB J, 18, 39-‐51. LEE, C. K., KLOPP, R. G., WEINDRUCH, R. & PROLLA, T. A. 1999. Gene expression profile of aging and its retardation by caloric restriction. Science, 285, 1390-‐3. LEE, M. C., LEE, J. S., LEE, M. J., LEE, J. H. & KIM, H. I. 2001. Fas mediates apoptosis in steroid-‐induced myopathy of rats. Neuropathol Appl Neurobiol, 27, 396-‐ 402. LEE, S. E., KIM, J. M., JEONG, M. K., ZOUBOULIS, C. C. & LEE, S. H. 2013. 11beta-‐ hydroxysteroid dehydrogenase type 1 is expressed in human sebaceous glands and regulates glucocorticoid-‐induced lipid synthesis and toll-‐like receptor 2 expression in SZ95 sebocytes. Br J Dermatol, 168, 47-‐55. LEE, M. C., WEE, G. R. & KIM, J. H. 2005. Apoptosis of skeletal muscle on steroid-‐ induced myopathy in rats. J Nutr, 135, 1806S-‐1808S. LEXELL, J., DOWNHAM, D. & SJOSTROM, M. 1983. Distribution of different fibre types in human skeletal muscles. A statistical and computational model for the study of fibre type grouping and early diagnosis of skeletal muscle fibre denervation and reinnervation. J Neurol Sci, 61, 301-‐14. LEYVRAZ, C., VERDUMO, C., SUTER, M., PAROZ, A., CALMES, J. M., MARQUES-‐ VIDAL, P. M. & GIUSTI, V. 2012. Changes in gene expression profile in human subcutaneous adipose tissue during significant weight loss. Obes Facts, 5, 440-‐51. LI, B. G., HASSELGREN, P. O. & FANG, C. H. 2005. Insulin-‐like growth factor-‐I inhibits dexamethasone-‐induced proteolysis in cultured L6 myotubes through PI3K/Akt/GSK-‐3beta and PI3K/Akt/mTOR-‐dependent mechanisms. Int J Biochem Cell Biol, 37, 2207-‐16. 260 LI, A., LI, K. X., MARUI, S., KROZOWSKI, Z. S., BATISTA, M. C., WHORWOOD, C. B., ARNHOLD, I. J., SHACKLETON, C. H., MENDONCA, B. B. & STEWART, P. M. 1997. Apparent mineralocorticoid excess in a Brazilian kindred: hypertension in the heterozygote state. J Hypertens, 15, 1397-‐402. LI, X., LINDQUIST, S., CHEN, R., MYRNAS, T., ANGSTEN, G., OLSSON, T. & HERNELL, O. 2007. Depot-‐specific messenger RNA expression of 11 beta-‐ hydroxysteroid dehydrogenase type 1 and leptin in adipose tissue of children and adults. Int J Obes (Lond), 31, 820-‐8. LIBARDI, C. A., NOGUEIRA, F. R., VECHIN, F. C., CONCEICAO, M. S., BONGANHA, V. & CHACON-‐MIKAHIL, M. P. 2013. Acute hormonal responses following different velocities of eccentric exercise. Clin Physiol Funct Imaging, 33, 450-‐4. LIM, C. T., KOLA, B. & KORBONITS, M. 2010. AMPK as a mediator of hormonal signalling. J Mol Endocrinol, 44, 87-‐97. LINDHOLM, J., JUUL, S., JORGENSEN, J. O., ASTRUP, J., BJERRE, P., FELDT-‐ RASMUSSEN, U., HAGEN, C., JORGENSEN, J., KOSTELJANETZ, M., KRISTENSEN, L., LAURBERG, P., SCHMIDT, K. & WEEKE, J. 2001. Incidence and late prognosis of cushing's syndrome: a population-‐based study. J Clin Endocrinol Metab, 86, 117-‐23. LINDLE, R. S., METTER, E. J., LYNCH, N. A., FLEG, J. L., FOZARD, J. L., TOBIN, J., ROY, T. A. & HURLEY, B. F. 1997. Age and gender comparisons of muscle strength in 654 women and men aged 20-‐93 yr. J Appl Physiol (1985), 83, 1581-‐7. LINDSAY, J. R., NANSEL, T., BAID, S., GUMOWSKI, J. & NIEMAN, L. K. 2006. Long-‐ term impaired quality of life in Cushing's syndrome despite initial improvement after surgical remission. J Clin Endocrinol Metab, 91, 447-‐ 53. LIU, C. J. & LATHAM, N. K. 2009. Progressive resistance strength training for improving physical function in older adults. Cochrane Database Syst Rev, CD002759. LIU, Y. J., NAKAGAWA, Y., TOYA, K. & OZEKI, T. 1997. Sex-‐specific effects of growth hormone on hepatic 11beta-‐hydroxysteroid dehydrogenase activity and gene expression in hypothyroid rats. Life Sci, 61, 325-‐34. LLOVERA, M., LOPEZ-‐SORIANO, F. J. & ARGILES, J. M. 1993. Effects of tumor necrosis factor-‐alpha on muscle-‐protein turnover in female Wistar rats. J Natl Cancer Inst, 85, 1334-‐9. LOBO, R.A., GOEBELSMANN, U., BRENNER, P.F., MISHELL, D.R. 1982. The effects of estrogen on adrenal androgens in oophorectomized women. Am J Obstet Gynecol, 142, 471-‐478. LOKIREDDY, S., MOULY, V., BUTLER-‐BROWNE, G., GLUCKMAN, P. D., SHARMA, M., KAMBADUR, R. & MCFARLANE, C. 2011. Myostatin promotes the wasting of human myoblast cultures through promoting ubiquitin-‐ proteasome pathway-‐mediated loss of sarcomeric proteins. Am J Physiol Cell Physiol, 301, C1316-‐24. LOKIREDDY, S., WIJESOMA, I. W., SZE, S. K., MCFARLANE, C., KAMBADUR, R. & SHARMA, M. 2012. Identification of atrogin-‐1-‐targeted proteins during the myostatin-‐induced skeletal muscle wasting. Am J Physiol Cell Physiol, 303, C512-‐29. 261 LONN, L., KVIST, H., ERNEST, I. & SJOSTROM, L. 1994. Changes in body composition and adipose tissue distribution after treatment of women with Cushing's syndrome. Metabolism, 43, 1517-‐22. LOSA, M., BIANCHI, R., BARZAGHI, R., GIOVANELLI, M. & MORTINI, P. 2009. Persistent adrenocorticotropin response to desmopressin in the early postoperative period predicts recurrence of Cushing's disease. J Clin Endocrinol Metab, 94, 3322-‐8. LOW, S. C., CHAPMAN, K. E., EDWARDS, C. R., WELLS, T., ROBINSON, I. C. & SECKL, J. R. 1994. Sexual dimorphism of hepatic 11 beta-‐hydroxysteroid dehydrogenase in the rat: the role of growth hormone patterns. J Endocrinol, 143, 541-‐8. LOWRY, O. H., ROSEBROUGH, N. J., FARR, A. L. & RANDALL, R. J. 1951. Protein measurement with the Folin phenol reagent. J Biol Chem, 193, 265-‐75. LUPIEN, S., LECOURS, A. R., LUSSIER, I., SCHWARTZ, G., NAIR, N. P. & MEANEY, M. J. 1994. Basal cortisol levels and cognitive deficits in human aging. J Neurosci, 14, 2893-‐903. LUTZNER, N., DE-‐CASTRO ARCE, J. & ROSL, F. 2012. Gene expression of the tumour suppressor LKB1 is mediated by Sp1, NF-‐Y and FOXO transcription factors. PLoS One, 7, e32590. MA, K., MALLIDIS, C., ARTAZA, J., TAYLOR, W., GONZALEZ-‐CADAVID, N. & BHASIN, S. 2001. Characterization of 5'-‐regulatory region of human myostatin gene: regulation by dexamethasone in vitro. Am J Physiol Endocrinol Metab, 281, E1128-‐36. MA, K., MALLIDIS, C., BHASIN, S., MAHABADI, V., ARTAZA, J., GONZALEZ-‐ CADAVID, N., ARIAS, J. & SALEHIAN, B. 2003. Glucocorticoid-‐induced skeletal muscle atrophy is associated with upregulation of myostatin gene expression. Am J Physiol Endocrinol Metab, 285, E363-‐71. MACLULLICH, A. M., DEARY, I. J., STARR, J. M., FERGUSON, K. J., WARDLAW, J. M. & SECKL, J. R. 2005. Plasma cortisol levels, brain volumes and cognition in healthy elderly men. Psychoneuroendocrinology, 30, 505-‐15. MAGRI, F., LOCATELLI, M., BALZA, G., MOLLA, G., CUZZONI, G., FIORAVANTI, M., SOLERTE, S. B. & FERRARI, E. 1997. Changes in endocrine circadian rhythms as markers of physiological and pathological brain aging. Chronobiol Int, 14, 385-‐96. MAIN, C., KNIGHT, B., MOXHAM, T., GABRIEL SANCHEZ, R., SANCHEZ GOMEZ, L. M., ROQUE I FIGULS, M. & BONFILL COSP, X. 2013. Hormone therapy for preventing cardiovascular disease in post-‐menopausal women. Cochrane Database Syst Rev, 4, CD002229. MALTAIS, M. L., DESROCHES, J. & DIONNE, I. J. 2009. Changes in muscle mass and strength after menopause. J Musculoskelet Neuronal Interact, 9, 186-‐97. MANINI, T. M. & CLARK, B. C. 2012. Dynapenia and aging: an update. J Gerontol A Biol Sci Med Sci, 67, 28-‐40. MARCHITELLI, C., SAVARESE, M. C., CRISA, A., NARDONE, A., MARSAN, P. A. & VALENTINI, A. 2003. Double muscling in Marchigiana beef breed is caused by a stop codon in the third exon of myostatin gene. Mamm Genome, 14, 392-‐5. MARINOVIC, A. C., ZHENG, B., MITCH, W. E. & PRICE, S. R. 2002. Ubiquitin (UbC) expression in muscle cells is increased by glucocorticoids through a mechanism involving Sp1 and MEK1. J Biol Chem, 277, 16673-‐81. 262 MARTINO, J., ACEBES, J. J., MONTANYA, E., MASUET, C. & BRELL, M. 2007. [Analysis of early prognostic factors for risk of treatment failure in Cushing's disease treated by trans-‐sphenoidal pituitary surgery]. Med Clin (Barc), 128, 330-‐2. MARZETTI, E., CALVANI, R., CESARI, M., BUFORD, T. W., LORENZI, M., BEHNKE, B. J. & LEEUWENBURGH, C. 2013. Mitochondrial dysfunction and sarcopenia of aging: from signaling pathways to clinical trials. Int J Biochem Cell Biol, 45, 2288-‐301. MASANES, F., CULLA, A., NAVARRO-‐GONZALEZ, M., NAVARRO-‐LOPEZ, M., SACANELLA, E., TORRES, B. & LOPEZ-‐SOTO, A. 2012. Prevalence of sarcopenia in healthy community-‐dwelling elderly in an urban area of Barcelona (Spain). J Nutr Health Aging, 16, 184-‐7. MASUZAKI, H., PATERSON, J., SHINYAMA, H., MORTON, N. M., MULLINS, J. J., SECKL, J. R. & FLIER, J. S. 2001. A transgenic model of visceral obesity and the metabolic syndrome. Science, 294, 2166-‐70. MASUZAKI, H., YAMAMOTO, H., KENYON, C. J., ELMQUIST, J. K., MORTON, N. M., PATERSON, J. M., SHINYAMA, H., SHARP, M. G., FLEMING, S., MULLINS, J. J., SECKL, J. R. & FLIER, J. S. 2003. Transgenic amplification of glucocorticoid action in adipose tissue causes high blood pressure in mice. J Clin Invest, 112, 83-‐90. MATSAKAS, A. & PATEL, K. 2009. Skeletal muscle fibre plasticity in response to selected environmental and physiological stimuli. Histol Histopathol, 24, 611-‐29. MAURAS, N. & BEAUFRERE, B. 1995. Recombinant human insulin-‐like growth factor-‐I enhances whole body protein anabolism and significantly diminishes the protein catabolic effects of prednisone in humans without a diabetogenic effect. J Clin Endocrinol Metab, 80, 869-‐74. MANGOS, G.J., WALKER, B.R., WILLIAMSON, P.A., WHITWORTH, J.A., KELLY, J.J. 2006. Effect of synthetic corticosteroids on vascular reactivity in the human forearm. Clin Exp Hypertens, 8, 707-‐18. MAY, R. C., KELLY, R. A. & MITCH, W. E. 1986. Metabolic acidosis stimulates protein degradation in rat muscle by a glucocorticoid-‐dependent mechanism. J Clin Invest, 77, 614-‐21. MCARDLE, A., DILLMANN, W. H., MESTRIL, R., FAULKNER, J. A. & JACKSON, M. J. 2004. Overexpression of HSP70 in mouse skeletal muscle protects against muscle damage and age-‐related muscle dysfunction. FASEB J, 18, 355-‐7. MCCANCE, D. R., GORDON, D. S., FANNIN, T. F., HADDEN, D. R., KENNEDY, L., SHERIDAN, B. & ATKINSON, A. B. 1993. Assessment of endocrine function after transsphenoidal surgery for Cushing's disease. Clin Endocrinol (Oxf), 38, 79-‐86. MCCAY, C.M., CROWELL, M.F. 1934. Prolonging the life span. The Scientific Monthly, 5, 405-‐414. MCINNES, K. J., ANDERSSON, T. C., SIMONYTE, K., SODERSTROM, I., MATTSSON, C., SECKL, J. R. & OLSSON, T. 2012. Association of 11beta-‐hydroxysteroid dehydrogenase type I expression and activity with estrogen receptor beta in adipose tissue from postmenopausal women. Menopause, 19, 1347-‐52. MCNEIL, C. J., DOHERTY, T. J., STASHUK, D. W. & RICE, C. L. 2005. Motor unit number estimates in the tibialis anterior muscle of young, old, and very old men. Muscle Nerve, 31, 461-‐7. 263 MCPHERRON, A. C., LAWLER, A. M. & LEE, S. J. 1997. Regulation of skeletal muscle mass in mice by a new TGF-‐beta superfamily member. Nature, 387, 83-‐90. MCPHERRON, A. C. & LEE, S. J. 1997. Double muscling in cattle due to mutations in the myostatin gene. Proc Natl Acad Sci U S A, 94, 12457-‐61. MCSWEENEY, S. J., HADOKE, P. W., KOZAK, A. M., SMALL, G. R., KHALED, H., WALKER, B. R. & GRAY, G. A. 2010. Improved heart function follows enhanced inflammatory cell recruitment and angiogenesis in 11betaHSD1-‐deficient mice post-‐MI. Cardiovasc Res, 88, 159-‐67. MCTERNAN, C. L., DRAPER, N., NICHOLSON, H., CHALDER, S. M., DRIVER, P., HEWISON, M., KILBY, M. D. & STEWART, P. M. 2001. Reduced placental 11beta-‐hydroxysteroid dehydrogenase type 2 mRNA levels in human pregnancies complicated by intrauterine growth restriction: an analysis of possible mechanisms. J Clin Endocrinol Metab, 86, 4979-‐83. MEANEY, M. J., O'DONNELL, D., ROWE, W., TANNENBAUM, B., STEVERMAN, A., WALKER, M., NAIR, N. P. & LUPIEN, S. 1995. Individual differences in hypothalamic-‐pituitary-‐adrenal activity in later life and hippocampal aging. Exp Gerontol, 30, 229-‐51. MEDICAL RESEARCH COUNCIL 2009. Research Changes Lives -‐ Medical Research Council Strategic Plan 2009-‐2014. Available from: http://www.mrc.ac.uk/Utilities/Documentrecord/index.htm?d=MRC006 090. MELOV, S., TARNOPOLSKY, M. A., BECKMAN, K., FELKEY, K. & HUBBARD, A. 2007. Resistance exercise reverses aging in human skeletal muscle. PLoS One, 2, e465. MENDEL, D.B., BODWELL, J.E., GAMETCHU, B., HARRISON, R.W., MUNCK, A. 1986. Molybdate-‐stabilized nonactivated glucocorticoid-‐receptor complexes contain a 90-‐kDa non-‐steroid-‐binding phosphoprotein that is lost on activation. J Biol Chem, 261,3758–3763 MICHALAKI, M., KYRIAZOPOULOU, V., ANTONACOPOULOU, A., KOIKA, V., NIKOLAOU, M., TSOUKAS, A., KALFARENTZOS, F., VAGENAKIS, A. G., VOUKELATOU, G. & PAPAVASSILIOU, A. G. 2012. The expression of omental 11beta-‐HSD1 is not increased in severely obese women with metabolic syndrome. Obes Facts, 5, 104-‐11. MILNE, A. C., POTTER, J., VIVANTI, A. & AVENELL, A. 2009. Protein and energy supplementation in elderly people at risk from malnutrition. Cochrane Database Syst Rev, CD003288. MINETTO, M. A., BOTTER, A., LANFRANCO, F., BALDI, M., GHIGO, E. & ARVAT, E. 2010. Muscle fiber conduction slowing and decreased levels of circulating muscle proteins after short-‐term dexamethasone administration in healthy subjects. J Clin Endocrinol Metab, 95, 1663-‐71. MINETTO, M. A., LANFRANCO, F., BOTTER, A., MOTTA, G., MENGOZZI, G., GIORDANO, R., PICU, A., GHIGO, E. & ARVAT, E. 2011. Do muscle fiber conduction slowing and decreased levels of circulating muscle proteins represent sensitive markers of steroid myopathy? A pilot study in Cushing's disease. Eur J Endocrinol, 164, 985-‐93. 264 MINETTO, M., REIMONDO, G., OSELLA, G., VENTURA, M., ANGELI, A. & TERZOLO, M. 2004. Bone loss is more severe in primary adrenal than in pituitary-‐ dependent Cushing's syndrome. Osteoporos Int, 15, 855-‐61. MITCHELL, W. K., WILLIAMS, J., ATHERTON, P., LARVIN, M., LUND, J. & NARICI, M. 2012. Sarcopenia, dynapenia, and the impact of advancing age on human skeletal muscle size and strength; a quantitative review. Front Physiol, 3, 260. MIYAKOSHI, N., HONGO, M., MIZUTANI, Y. & SHIMADA, Y. 2013. Prevalence of sarcopenia in Japanese women with osteopenia and osteoporosis. J Bone Miner Metab, 31, 556-‐61. MOORE, J. S., MONSON, J. P., KALTSAS, G., PUTIGNANO, P., WOOD, P. J., SHEPPARD, M. C., BESSER, G. M., TAYLOR, N. F. & STEWART, P. M. 1999. Modulation of 11beta-‐hydroxysteroid dehydrogenase isozymes by growth hormone and insulin-‐like growth factor: in vivo and in vitro studies. J Clin Endocrinol Metab, 84, 4172-‐7. MORGAN, S. A. 2010. The Impact of Glucocorticoids upon the Insulin Sensitivity of Skeletal Muscle PhD thesis submitted to University of Birmingham. MORGAN, S. A., SHERLOCK, M., GATHERCOLE, L. L., LAVERY, G. G., LENAGHAN, C., BUJALSKA, I. J., LABER, D., YU, A., CONVEY, G., MAYERS, R., HEGYI, K., SETHI, J. K., STEWART, P. M., SMITH, D. M. & TOMLINSON, J. W. 2009. 11beta-‐hydroxysteroid dehydrogenase type 1 regulates glucocorticoid-‐ induced insulin resistance in skeletal muscle. Diabetes, 58, 2506-‐15. MORINEAU, G., SULMONT, V., SALOMON, R., FIQUET-‐KEMPF, B., JEUNEMAITRE, X., NICOD, J. & FERRARI, P. 2006. Apparent mineralocorticoid excess: report of six new cases and extensive personal experience. J Am Soc Nephrol, 17, 3176-‐84. MORISSETTE, M. R., STRICKER, J. C., ROSENBERG, M. A., BURANASOMBATI, C., LEVITAN, E. B., MITTLEMAN, M. A. & ROSENZWEIG, A. 2009. Effects of myostatin deletion in aging mice. Aging Cell, 8, 573-‐83. MORLEY, J. E. 2001. Anorexia, sarcopenia, and aging. Nutrition, 17, 660-‐3. MORLEY, J. E., ABBATECOLA, A. M., ARGILES, J. M., BARACOS, V., BAUER, J., BHASIN, S., CEDERHOLM, T., COATS, A. J., CUMMINGS, S. R., EVANS, W. J., FEARON, K., FERRUCCI, L., FIELDING, R. A., GURALNIK, J. M., HARRIS, T. B., INUI, A., KALANTAR-‐ZADEH, K., KIRWAN, B. A., MANTOVANI, G., MUSCARITOLI, M., NEWMAN, A. B., ROSSI-‐FANELLI, F., ROSANO, G. M., ROUBENOFF, R., SCHAMBELAN, M., SOKOL, G. H., STORER, T. W., VELLAS, B., VON HAEHLING, S., YEH, S. S. & ANKER, S. D. 2011. Sarcopenia with limited mobility: an international consensus. J Am Med Dir Assoc, 12, 403-‐ 9. MORLEY, J. E., BAUMGARTNER, R. N., ROUBENOFF, R., MAYER, J. & NAIR, K. S. 2001. Sarcopenia. J Lab Clin Med, 137, 231-‐43. MORTON, N. M., HOLMES, M. C., FIEVET, C., STAELS, B., TAILLEUX, A., MULLINS, J. J. & SECKL, J. R. 2001. Improved lipid and lipoprotein profile, hepatic insulin sensitivity, and glucose tolerance in 11beta-‐hydroxysteroid dehydrogenase type 1 null mice. J Biol Chem, 276, 41293-‐300. MORTON, N. M., PATERSON, J. M., MASUZAKI, H., HOLMES, M. C., STAELS, B., FIEVET, C., WALKER, B. R., FLIER, J. S., MULLINS, J. J. & SECKL, J. R. 2004. Novel adipose tissue-‐mediated resistance to diet-‐induced visceral obesity 265 in 11 beta-‐hydroxysteroid dehydrogenase type 1-‐deficient mice. Diabetes, 53, 931-‐8. MORSELLI, L. L., NEDELTCHEVA, A., LEPROULT, R., SPIEGEL, K., MARTINO, E., LEGROS, J. J., WEISS, R. E., MOCKEL, J., VAN CAUTER, E. & COPINSCHI, G. 2013. Impact of GH replacement therapy on sleep in adult patients with GH deficiency of pituitary origin. Eur J Endocrinol, 168, 763-‐70. MOSHER, D. S., QUIGNON, P., BUSTAMANTE, C. D., SUTTER, N. B., MELLERSH, C. S., PARKER, H. G. & OSTRANDER, E. A. 2007. A mutation in the myostatin gene increases muscle mass and enhances racing performance in heterozygote dogs. PLoS Genet, 3, e79. MOTTA, M. C., DIVECHA, N., LEMIEUX, M., KAMEL, C., CHEN, D., GU, W., BULTSMA, Y., MCBURNEY, M. & GUARENTE, L. 2004. Mammalian SIRT1 represses forkhead transcription factors. Cell, 116, 551-‐63. MOURKIOTI, F., KRATSIOS, P., LUEDDE, T., SONG, Y. H., DELAFONTAINE, P., ADAMI, R., PARENTE, V., BOTTINELLI, R., PASPARAKIS, M. & ROSENTHAL, N. 2006. Targeted ablation of IKK2 improves skeletal muscle strength, maintains mass, and promotes regeneration. J Clin Invest, 116, 2945-‐54. MUNOZ, R., CARVAJAL, C., ESCALONA, A., BOZA, C., PEREZ, G., IBANEZ, L. & FARDELLA, C. 2009. 11beta-‐hydroxysteroid dehydrogenase type 1 is overexpressed in subcutaneous adipose tissue of morbidly obese patients. Obes Surg, 19, 764-‐70. MUNZER, T., HARMAN, S. M., SORKIN, J. D. & BLACKMAN, M. R. 2009. Growth hormone and sex steroid effects on serum glucose, insulin, and lipid concentrations in healthy older women and men. J Clin Endocrinol Metab, 94, 3833-‐41. MUNZER, T., HEGGLIN, A., STANNEK, T., SCHOCH, O. D., KORTE, W., BUCHE, D., SCHMID, C. & HURNY, C. 2010. Effects of long-‐term continuous positive airway pressure on body composition and IGF1. Eur J Endocrinol, 162, 695-‐704. MURSHID, A., EGUCHI, T. & CALDERWOOD, S. K. 2013. Stress proteins in aging and life span. Int J Hyperthermia, 29, 442-‐7. NAKAGO, K., SENDA, M., TOUNO, M., TAKAHARA, Y. & INOUE, H. 1999. Influence of exercise on muscle fibers in rats with steroid myopathy. Acta Med Okayama, 53, 265-‐70. NATSUI, K., TANAKA, K., SUDA, M., YASODA, A., SAKUMA, Y., OZASA, A., OZAKI, S. & NAKAO, K. 2006. High-‐dose glucocorticoid treatment induces rapid loss of trabecular bone mineral density and lean body mass. Osteoporos Int, 17, 105-‐8. NEW, M. I. 1994. The prismatic case of apparent mineralocorticoid excess. J Clin Endocrinol Metab, 79, 1-‐3. NEWELL-‐PRICE, J., BERTAGNA, X., GROSSMAN, A. B. & NIEMAN, L. K. 2006. Cushing's syndrome. Lancet, 367, 1605-‐17. NEWMAN, A. B., KUPELIAN, V., VISSER, M., SIMONSICK, E., GOODPASTER, B., NEVITT, M., KRITCHEVSKY, S. B., TYLAVSKY, F. A., RUBIN, S. M. & HARRIS, T. B. 2003. Sarcopenia: alternative definitions and associations with lower extremity function. J Am Geriatr Soc, 51, 1602-‐9. NEWMAN, A. B., KUPELIAN, V., VISSER, M., SIMONSICK, E. M., GOODPASTER, B. H., KRITCHEVSKY, S. B., TYLAVSKY, F. A., RUBIN, S. M. & HARRIS, T. B. 2006. Strength, but not muscle mass, is associated with mortality in the 266 health, aging and body composition study cohort. J Gerontol A Biol Sci Med Sci, 61, 72-‐7. NICKLAS, B. J., HSU, F. C., BRINKLEY, T. J., CHURCH, T., GOODPASTER, B. H., KRITCHEVSKY, S. B. & PAHOR, M. 2008. Exercise training and plasma C-‐ reactive protein and interleukin-‐6 in elderly people. J Am Geriatr Soc, 56, 2045-‐52. NIEMAN, L. K., BILLER, B. M., FINDLING, J. W., NEWELL-‐PRICE, J., SAVAGE, M. O., STEWART, P. M. & MONTORI, V. M. 2008. The diagnosis of Cushing's syndrome: an Endocrine Society Clinical Practice Guideline. J Clin Endocrinol Metab, 93, 1526-‐40. NISHIMURA, M., MIKURA, M., HIRASAKA, K., OKUMURA, Y., NIKAWA, T., KAWANO, Y., NAKAYAMA, M. & IKEDA, M. 2008. Effects of dimethyl sulphoxide and dexamethasone on mRNA expression of myogenesis-‐ and muscle proteolytic system-‐related genes in mouse myoblastic C2C12 cells. J Biochem, 144, 717-‐24. NISHIZAWA, S., OKI, Y., OHTA, S., YOKOTA, N., YOKOYAMA, T. & UEMURA, K. 1999. What can predict postoperative "endocrinological cure" in Cushing's disease? Neurosurgery, 45, 239-‐44. NOORDAM, R., JANSEN, S. W., AKINTOLA, A. A., OEI, N. Y., MAIER, A. B., PIJL, H., SLAGBOOM, P. E., WESTENDORP, R. G., VAN DER GROND, J., DE CRAEN, A. J. & VAN HEEMST, D. 2012. Familial longevity is marked by lower diurnal salivary cortisol levels: the Leiden Longevity Study. PLoS One, 7, e31166. OLSEN, G. G. & EVERITT, A. V. 1965. Retardation of the ageing process in collagen fibres from the tail tendon of the old hypophysectomized rat. Nature, 206, 307-‐8. OFFICE FOR NATIONAL STATISTICS (ONS) REPORT 2012. Population Ageing in the UK, its Constituent Countries and the European Union. Available from http://www.ons.gov.uk/ons/dcp171776_258607.pdf. OSHIMA, Y., KURODA, Y., KUNISHIGE, M., MATSUMOTO, T. & MITSUI, T. 2004. Oxidative stress-‐associated mitochondrial dysfunction in corticosteroid-‐ treated muscle cells. Muscle Nerve, 30, 49-‐54. PACY, P. J. & HALLIDAY, D. 1989. Muscle protein synthesis in steroid-‐induced proximal myopathy: a case report. Muscle Nerve, 12, 378-‐81. PADDON-‐JONES, D. & RASMUSSEN, B. B. 2009. Dietary protein recommendations and the prevention of sarcopenia. Curr Opin Clin Nutr Metab Care, 12, 86-‐ 90. PAPANICOLAOU, D. A., ATHER, S. N., ZHU, H., ZHOU, Y., LUTKIEWICZ, J., SCOTT, B. B. & CHANDLER, J. 2013. A phase IIA randomized, placebo-‐controlled clinical trial to study the efficacy and safety of the selective androgen receptor modulator (SARM), MK-‐0773 in female participants with sarcopenia. J Nutr Health Aging, 17, 533-‐43. PARKER, C. R., JR., SLAYDEN, S. M., AZZIZ, R., CRABBE, S. L., HINES, G. A., BOOTS, L. R. & BAE, S. 2000. Effects of aging on adrenal function in the human: responsiveness and sensitivity of adrenal androgens and cortisol to adrenocorticotropin in premenopausal and postmenopausal women. J Clin Endocrinol Metab, 85, 48-‐54. PARVEZ, Y. & SAYED, O. E. 2013. Apparent mineralocorticoid excess (AME) syndrome. Indian Pediatr, 50, 416-‐8. 267 PATERSON, J. M., MORTON, N. M., FIEVET, C., KENYON, C. J., HOLMES, M. C., STAELS, B., SECKL, J. R. & MULLINS, J. J. 2004. Metabolic syndrome without obesity: Hepatic overexpression of 11beta-‐hydroxysteroid dehydrogenase type 1 in transgenic mice. Proc Natl Acad Sci U S A, 101, 7088-‐93. PATEL, H. P., SYDDALL, H. E., JAMESON, K., ROBINSON, S., DENISON, H., ROBERTS, H. C., EDWARDS, M., DENNISON, E., COOPER, C. & AIHIE SAYER, A. 2013. Prevalence of sarcopenia in community-‐dwelling older people in the UK using the European Working Group on Sarcopenia in Older People (EWGSOP) definition: findings from the Hertfordshire Cohort Study (HCS). Age Ageing, 42, 378-‐84. PATIL, R., UUSI-‐RASI, K., PASANEN, M., KANNUS, P., KARINKANTA, S. & SIEVANEN, H. 2013. Sarcopenia and osteopenia among 70-‐80-‐year-‐old home-‐dwelling Finnish women: prevalence and association with functional performance. Osteoporos Int, 24, 787-‐96. PAULSEN, S. K., PEDERSEN, S. B., JORGENSEN, J. O., FISKER, S., CHRISTIANSEN, J. S., FLYVBJERG, A. & RICHELSEN, B. 2006. Growth hormone (GH) substitution in GH-‐deficient patients inhibits 11beta-‐hydroxysteroid dehydrogenase type 1 messenger ribonucleic acid expression in adipose tissue. J Clin Endocrinol Metab, 91, 1093-‐8. PAULSEN, S. K., PEDERSEN, S. B., FISKER, S. & RICHELSEN, B. 2007. 11Beta-‐HSD type 1 expression in human adipose tissue: impact of gender, obesity, and fat localization. Obesity (Silver Spring), 15, 1954-‐60. PAVLOV, E. P., HARMAN, S. M., CHROUSOS, G. P., LORIAUX, D. L. & BLACKMAN, M. R. 1986. Responses of plasma adrenocorticotropin, cortisol, and dehydroepiandrosterone to ovine corticotropin-‐releasing hormone in healthy aging men. J Clin Endocrinol Metab, 62, 767-‐72. PEARCE, J. M. 2004. Thomas Addison (1793-‐1860). J R Soc Med, 97, 297-‐300. PENNINX, B. W., KRITCHEVSKY, S. B., NEWMAN, A. B., NICKLAS, B. J., SIMONSICK, E. M., RUBIN, S., NEVITT, M., VISSER, M., HARRIS, T. & PAHOR, M. 2004. Inflammatory markers and incident mobility limitation in the elderly. J Am Geriatr Soc, 52, 1105-‐13. PEREIRA, A. M., VAN AKEN, M. O., VAN DULKEN, H., SCHUTTE, P. J., BIERMASZ, N. R., SMIT, J. W., ROELFSEMA, F. & ROMIJN, J. A. 2003. Long-‐term predictive value of postsurgical cortisol concentrations for cure and risk of recurrence in Cushing's disease. J Clin Endocrinol Metab, 88, 5858-‐64. PERROT, V. & RECHLER, M. M. 2005. The coactivator p300 directly acetylates the forkhead transcription factor Foxo1 and stimulates Foxo1-‐induced transcription. Mol Endocrinol, 19, 2283-‐98. PETERSON, C. M., JOHANNSEN, D. L. & RAVUSSIN, E. 2012. Skeletal muscle mitochondria and aging: a review. J Aging Res, 2012, 194821. PETERSON, M. D., SEN, A. & GORDON, P. M. 2011. Influence of resistance exercise on lean body mass in aging adults: a meta-‐analysis. Med Sci Sports Exerc, 43, 249-‐58. PHILLIPS, D. I., BARKER, D. J., FALL, C. H., SECKL, J. R., WHORWOOD, C. B., WOOD, P. J. & WALKER, B. R. 1998. Elevated plasma cortisol concentrations: a link between low birth weight and the insulin resistance syndrome? J Clin Endocrinol Metab, 83, 757-‐60. 268 PHILLIPOV, G., PALERMO, M. & SHACKLETON, C. H. 1996. Apparent cortisone reductase deficiency: a unique form of hypercortisolism. J Clin Endocrinol Metab, 81, 3855-‐60. PIKKARAINEN, L., SANE, T. & REUNANEN, A. 1999. The survival and well-‐being of patients treated for Cushing's syndrome. J Intern Med, 245, 463-‐8. PIMENTA, E., WOLLEY, M. & STOWASSER, M. 2012. Adverse cardiovascular outcomes of corticosteroid excess. Endocrinology, 153, 5137-‐42. PIRLICH, M., BIERING, H., GERL, H., VENTZ, M., SCHMIDT, B., ERTL, S. & LOCHS, H. 2002. Loss of body cell mass in Cushing's syndrome: effect of treatment. J Clin Endocrinol Metab, 87, 1078-‐84. PIVONELLO, R., DE MARTINO, M. C., DE LEO, M., TAUCHMANOVA, L., FAGGIANO, A., LOMBARDI, G. & COLAO, A. 2007. Cushing's syndrome: aftermath of the cure. Arq Bras Endocrinol Metabol, 51, 1381-‐91. PLEASURE, D. E., WALSH, G. O. & ENGEL, W. K. 1970. Atrophy of skeletal muscle in patients with Cushing's syndrome. Arch Neurol, 22, 118-‐25. POULSEN, R. C., WATTS, A. C., MURPHY, R. J., SNELLING, S. J., CARR, A. J. & HULLEY, P. A. 2013. Glucocorticoids induce senescence in primary human tenocytes by inhibition of sirtuin 1 and activation of the p53/p21 pathway: in vivo and in vitro evidence. Ann Rheum Dis. POURATIAN, N., PREVEDELLO, D. M., JAGANNATHAN, J., LOPES, M. B., VANCE, M. L. & LAWS, E. R., JR. 2007. Outcomes and management of patients with Cushing's disease without pathological confirmation of tumor resection after transsphenoidal surgery. J Clin Endocrinol Metab, 92, 3383-‐8. PREVEDELLO, D. M., POURATIAN, N., SHERMAN, J., JANE, J. A., JR., VANCE, M. L., LOPES, M. B. & LAWS, E. R., JR. 2008. Management of Cushing's disease: outcome in patients with microadenoma detected on pituitary magnetic resonance imaging. J Neurosurg, 109, 751-‐9. PRICE, S. R., BAILEY, J. L., WANG, X., JURKOVITZ, C., ENGLAND, B. K., DING, X., PHILLIPS, L. S. & MITCH, W. E. 1996. Muscle wasting in insulinopenic rats results from activation of the ATP-‐dependent, ubiquitin-‐proteasome proteolytic pathway by a mechanism including gene transcription. J Clin Invest, 98, 1703-‐8. PURNELL, J. Q., BRANDON, D. D., ISABELLE, L. M., LORIAUX, D. L. & SAMUELS, M. H. 2004. Association of 24-‐hour cortisol production rates, cortisol-‐binding globulin, and plasma-‐free cortisol levels with body composition, leptin levels, and aging in adult men and women. J Clin Endocrinol Metab, 89, 281-‐7. RAGNARSSON, O., BURT, M. G., HO, K. K. & JOHANNSSON, G. 2013. Effect of short-‐ term GH and testosterone administration on body composition and glucose homoeostasis in men receiving chronic glucocorticoid therapy. Eur J Endocrinol, 168, 243-‐51. RAJAN, V. & MITCH, W. E. 2008. Ubiquitin, proteasomes and proteolytic mechanisms activated by kidney disease. Biochim Biophys Acta, 1782, 795-‐9. RASMUSSEN, M. H., HVIDBERG, A., JUUL, A., MAIN, K. M., GOTFREDSEN, A., SKAKKEBAEK, N. E., HILSTED, J. & SKAKKEBAE, N. E. 1995. Massive weight loss restores 24-‐hour growth hormone release profiles and serum insulin-‐like growth factor-‐I levels in obese subjects. J Clin Endocrinol Metab, 80, 1407-‐15. 269 REES, D. A., HANNA, F. W., DAVIES, J. S., MILLS, R. G., VAFIDIS, J. & SCANLON, M. F. 2002. Long-‐term follow-‐up results of transsphenoidal surgery for Cushing's disease in a single centre using strict criteria for remission. Clin Endocrinol (Oxf), 56, 541-‐51. RAUE, U., SLIVKA, D., JEMIOLO, B., HOLLON, C. & TRAPPE, S. 2006. Myogenic gene expression at rest and after a bout of resistance exercise in young (18-‐30 yr) and old (80-‐89 yr) women. J Appl Physiol (1985), 101, 53-‐9. RAUE, U., SLIVKA, D., JEMIOLO, B., HOLLON, C. & TRAPPE, S. 2007. Proteolytic gene expression differs at rest and after resistance exercise between young and old women. J Gerontol A Biol Sci Med Sci, 62, 1407-‐12. ROBINSON, C. E. & ROBINSON, H. S. 1959. Triamcinolone in rheumatoid arthritis. Can Med Assoc J, 80, 245-‐7. ROLLAND, Y., LAUWERS-‐CANCES, V., COURNOT, M., NOURHASHEMI, F., REYNISH, W., RIVIERE, D., VELLAS, B. & GRANDJEAN, H. 2003. Sarcopenia, calf circumference, and physical function of elderly women: a cross-‐ sectional study. J Am Geriatr Soc, 51, 1120-‐4. ROPPER, A. H., ADAMS, R. D., VICTOR, M., BROWN, R. H., VICTOR, M. A. & VICTOR'S PRINCIPLES OF, N. 2005. Adams and Victor's principles of neurology, New York, McGraw-‐Hill Medical ; London : McGraw-‐Hill [distributor]. ROSENBERG, I. H. 1989. Summary Comments. American Journal of Clinical Nutrition, 50, 1231-‐3. ROSENSTOCK, J., BANARER, S., FONSECA, V. A., INZUCCHI, S. E., SUN, W., YAO, W., HOLLIS, G., FLORES, R., LEVY, R., WILLIAMS, W. V., SECKL, J. R. & HUBER, R. 2010. The 11-‐beta-‐hydroxysteroid dehydrogenase type 1 inhibitor INCB13739 improves hyperglycemia in patients with type 2 diabetes inadequately controlled by metformin monotherapy. Diabetes Care, 33, 1516-‐22. ROTH, S. M., FERRELL, R. E., PETERS, D. G., METTER, E. J., HURLEY, B. F. & ROGERS, M. A. 2002. Influence of age, sex, and strength training on human muscle gene expression determined by microarray. Physiol Genomics, 10, 181-‐90. ROTHSTEIN, J. M., DELITTO, A., SINACORE, D. R. & ROSE, S. J. 1983. Muscle function in rheumatic disease patients treated with corticosteroids. Muscle Nerve, 6, 128-‐35. ROUBENOFF, R., PARISE, H., PAYETTE, H. A., ABAD, L. W., D'AGOSTINO, R., JACQUES, P. F., WILSON, P. W., DINARELLO, C. A. & HARRIS, T. B. 2003. Cytokines, insulin-‐like growth factor 1, sarcopenia, and mortality in very old community-‐dwelling men and women: the Framingham Heart Study. Am J Med, 115, 429-‐35. ROWAN, S. L., RYGIEL, K., PURVES-‐SMITH, F. M., SOLBAK, N. M., TURNBULL, D. M. & HEPPLE, R. T. 2012. Denervation causes fiber atrophy and myosin heavy chain co-‐expression in senescent skeletal muscle. PLoS One, 7, e29082. RUBINOW, D. R., ROCA, C. A., SCHMIDT, P. J., DANACEAU, M. A., PUTNAM, K., CIZZA, G., CHROUSOS, G. & NIEMAN, L. 2005. Testosterone suppression of CRH-‐stimulated cortisol in men. Neuropsychopharmacology, 30, 1906-‐12. 270 RUDMAN, D., KUTNER, M. H., ROGERS, C. M., LUBIN, M. F., FLEMING, G. A. & BAIN, R. P. 1981. Impaired growth hormone secretion in the adult population: relation to age and adiposity. J Clin Invest, 67, 1361-‐9. SACHECK, J. M., OHTSUKA, A., MCLARY, S. C. & GOLDBERG, A. L. 2004. IGF-‐I stimulates muscle growth by suppressing protein breakdown and expression of atrophy-‐related ubiquitin ligases, atrogin-‐1 and MuRF1. Am J Physiol Endocrinol Metab, 287, E591-‐601. SADIQ, F., HAZLERIGG, D. G. & LOMAX, M. A. 2007. Amino acids and insulin act additively to regulate components of the ubiquitin-‐proteasome pathway in C2C12 myotubes. BMC Mol Biol, 8, 23. SAHA, A., KUZUHARA, T., ECHIGO, N., FUJII, A., SUGANUMA, M. & FUJIKI, H. 2010. Apoptosis of human lung cancer cells by curcumin mediated through up-‐ regulation of "growth arrest and DNA damage inducible genes 45 and 153". Biol Pharm Bull, 33, 1291-‐9. SAJKO, S., KUBINOVA, L., CVETKO, E., KREFT, M., WERNIG, A. & ERZEN, I. 2004. Frequency of M-‐cadherin-‐stained satellite cells declines in human muscles during aging. J Histochem Cytochem, 52, 179-‐85. SAKUMA, K. & YAMAGUCHI, A. 2012. Sarcopenia and age-‐related endocrine function. Int J Endocrinol, 2012, 127362. SAKUMA, K. & YAMAGUCHI, A. 2013. Sarcopenic obesity and endocrinal adaptation with age. Int J Endocrinol, 2013, 204164. SALAS, M.A., EVANS, S.W., LEVELL, M.J., WHICHER, J.T. 1990. Interleukin-‐6 and ACTH act synergistically to stimulare the release of corticosterone from the adrenal glands. Clin Exp Immunol, 3, 470-‐3. SALEHZADEH, F., AL-‐KHALILI, L., KULKARNI, S. S., WANG, M., LONNQVIST, F. & KROOK, A. 2009. Glucocorticoid-‐mediated effects on metabolism are reversed by targeting 11 beta hydroxysteroid dehydrogenase type 1 in human skeletal muscle. Diabetes Metab Res Rev, 25, 250-‐8. SALENAVE, S., GATTA, B., PECHEUR, S., SAN-‐GALLI, F., VISOT, A., LASJAUNIAS, P., ROGER, P., BERGE, J., YOUNG, J., TABARIN, A. & CHANSON, P. 2004. Pituitary magnetic resonance imaging findings do not influence surgical outcome in adrenocorticotropin-‐secreting microadenomas. J Clin Endocrinol Metab, 89, 3371-‐6. SALVADOR, J. M., BROWN-‐CLAY, J. D. & FORNACE, A. J., JR. 2013. Gadd45 in stress signaling, cell cycle control, and apoptosis. Adv Exp Med Biol, 793, 1-‐19. SANDEEP, T. C., YAU, J. L., MACLULLICH, A. M., NOBLE, J., DEARY, I. J., WALKER, B. R. & SECKL, J. R. 2004. 11Beta-‐hydroxysteroid dehydrogenase inhibition improves cognitive function in healthy elderly men and type 2 diabetics. Proc Natl Acad Sci U S A, 101, 6734-‐9. SANDRI, M., BARBERI, L., BIJLSMA, A. Y., BLAAUW, B., DYAR, K. A., MILAN, G., MAMMUCARI, C., MESKERS, C. G., PALLAFACCHINA, G., PAOLI, A., PION, D., ROCERI, M., ROMANELLO, V., SERRANO, A. L., TONIOLO, L., LARSSON, L., MAIER, A. B., MUNOZ-‐CANOVES, P., MUSARO, A., PENDE, M., REGGIANI, C., RIZZUTO, R. & SCHIAFFINO, S. 2013. Signalling pathways regulating muscle mass in ageing skeletal muscle. The role of the IGF1-‐Akt-‐mTOR-‐ FoxO pathway. Biogerontology, 14, 303-‐23. SANDRI, M., SANDRI, C., GILBERT, A., SKURK, C., CALABRIA, E., PICARD, A., WALSH, K., SCHIAFFINO, S., LECKER, S. H. & GOLDBERG, A. L. 2004. Foxo 271 transcription factors induce the atrophy-‐related ubiquitin ligase atrogin-‐1 and cause skeletal muscle atrophy. Cell, 117, 399-‐412. SAYER, A. A., DENNISON, E. M., SYDDALL, H. E., GILBODY, H. J., PHILLIPS, D. I. & COOPER, C. 2005. Type 2 diabetes, muscle strength, and impaired physical function: the tip of the iceberg? Diabetes Care, 28, 2541-‐2. SCHAAP, L. A., PLUIJM, S. M., DEEG, D. J., HARRIS, T. B., KRITCHEVSKY, S. B., NEWMAN, A. B., COLBERT, L. H., PAHOR, M., RUBIN, S. M., TYLAVSKY, F. A. & VISSER, M. 2009. Higher inflammatory marker levels in older persons: associations with 5-‐year change in muscle mass and muscle strength. J Gerontol A Biol Sci Med Sci, 64, 1183-‐9. SCHAKMAN, O., GILSON, H., DE CONINCK, V., LAUSE, P., VERNIERS, J., HAVAUX, X., KETELSLEGERS, J. M. & THISSEN, J. P. 2005. Insulin-‐like growth factor-‐I gene transfer by electroporation prevents skeletal muscle atrophy in glucocorticoid-‐treated rats. Endocrinology, 146, 1789-‐97. SCHAKMAN, O., GILSON, H. & THISSEN, J. P. 2008. Mechanisms of glucocorticoid-‐ induced myopathy. J Endocrinol, 197, 1-‐10. SCHAKMAN, O., KALISTA, S., BARBE, C., LOUMAYE, A. & THISSEN, J. P. 2013. Glucocorticoid-‐induced skeletal muscle atrophy. Int J Biochem Cell Biol, 45, 2163-‐72. SCHRAGER, M. A., METTER, E. J., SIMONSICK, E., BLE, A., BANDINELLI, S., LAURETANI, F. & FERRUCCI, L. 2007. Sarcopenic obesity and inflammation in the InCHIANTI study. J Appl Physiol (1985), 102, 919-‐25. SCHUELKE, M., WAGNER, K. R., STOLZ, L. E., HUBNER, C., RIEBEL, T., KOMEN, W., BRAUN, T., TOBIN, J. F. & LEE, S. J. 2004. Myostatin mutation associated with gross muscle hypertrophy in a child. N Engl J Med, 350, 2682-‐8. SCOTT, D., BLIZZARD, L., FELL, J., DING, C., WINZENBERG, T. & JONES, G. 2010. A prospective study of the associations between 25-‐hydroxy-‐vitamin D, sarcopenia progression and physical activity in older adults. Clin Endocrinol (Oxf), 73, 581-‐7. SECKL, J. R. & WALKER, B. R. 2004. 11beta-‐hydroxysteroid dehydrogenase type 1 as a modulator of glucocorticoid action: from metabolism to memory. Trends Endocrinol Metab, 15, 418-‐24. SEEMAN, T. E., SINGER, B., WILKINSON, C. W. & MCEWEN, B. 2001. Gender differences in age-‐related changes in HPA axis reactivity. Psychoneuroendocrinology, 26, 225-‐40. SEENE, T. & KAASIK, P. 2012. Role of exercise therapy in prevention of decline in aging muscle function: glucocorticoid myopathy and unloading. J Aging Res, 2012, 172492. SEENE, T., KAASIK, P., PEHME, A., ALEV, K. & RISO, E. M. 2003. The effect of glucocorticoids on the myosin heavy chain isoforms' turnover in skeletal muscle. J Steroid Biochem Mol Biol, 86, 201-‐6. SEMJONOUS, N. M., SHERLOCK, M., JEYASURIA, P., PARKER, K. L., WALKER, E. A., STEWART, P. M. & LAVERY, G. G. 2011. Hexose-‐6-‐phosphate dehydrogenase contributes to skeletal muscle homeostasis independent of 11beta-‐hydroxysteroid dehydrogenase type 1. Endocrinology, 152, 93-‐ 102. SENF, S. M., DODD, S. L., MCCLUNG, J. M. & JUDGE, A. R. 2008. Hsp70 overexpression inhibits NF-‐kappaB and Foxo3a transcriptional activities and prevents skeletal muscle atrophy. FASEB J, 22, 3836-‐45. 272 SENGUPTA, S. & WASYLYK, B. 2004. Physiological and pathological consequences of the interactions of the p53 tumor suppressor with the glucocorticoid, androgen, and estrogen receptors. Ann N Y Acad Sci, 1024, 54-‐71. SHAH, O. J., ANTHONY, J. C., KIMBALL, S. R. & JEFFERSON, L. S. 2000. 4E-‐BP1 and S6K1: translational integration sites for nutritional and hormonal information in muscle. Am J Physiol Endocrinol Metab, 279, E715-‐29. SHAH, S., HERMANOWSKI-‐VOSATKA, A., GIBSON, K., RUCK, R. A., JIA, G., ZHANG, J., HWANG, P. M., RYAN, N. W., LANGDON, R. B. & FEIG, P. U. 2011. Efficacy and safety of the selective 11beta-‐HSD-‐1 inhibitors MK-‐0736 and MK-‐ 0916 in overweight and obese patients with hypertension. J Am Soc Hypertens, 5, 166-‐76. SHEE, C. D. 1990. Risk factors for hydrocortisone myopathy in acute severe asthma. Respir Med, 84, 229-‐33. SHERLOCK, M. 2011. PhD Thesis: 'The Regulation of 11beta-‐hydroxysteroid dehydrogenase'. Submitted to University of Birmingham. SHERLOCK, M., AYUK, J., TOMLINSON, J. W., TOOGOOD, A. A., ARAGON-‐ALONSO, A., SHEPPARD, M. C., BATES, A. S. & STEWART, P. M. 2010. Mortality in patients with pituitary disease. Endocr Rev, 31, 301-‐42. SHERLOCK, M. & TOOGOOD, A. A. 2007. Aging and the growth hormone/insulin like growth factor-‐I axis. Pituitary, 10, 189-‐203. SHERMAN, B., WYSHAM, C. & PFOHL, B. 1985. Age-‐related changes in the circadian rhythm of plasma cortisol in man. J Clin Endocrinol Metab, 61, 439-‐43. SHIMIZU, N., YOSHIKAWA, N., ITO, N., MARUYAMA, T., SUZUKI, Y., TAKEDA, S., NAKAE, J., TAGATA, Y., NISHITANI, S., TAKEHANA, K., SANO, M., FUKUDA, K., SUEMATSU, M., MORIMOTO, C. & TANAKA, H. 2011. Crosstalk between glucocorticoid receptor and nutritional sensor mTOR in skeletal muscle. Cell Metab, 13, 170-‐82. SIMONYTE, K., OLSSON, T., NASLUND, I., ANGELHED, J. E., LONN, L., MATTSSON, C. & RASK, E. 2010. Weight loss after gastric bypass surgery in women is followed by a metabolically favorable decrease in 11beta-‐hydroxysteroid dehydrogenase 1 expression in subcutaneous adipose tissue. J Clin Endocrinol Metab, 95, 3527-‐31. SINGH, T. & NEWMAN, A. B. 2011. Inflammatory markers in population studies of aging. Ageing Res Rev, 10, 319-‐29. SINGLETON, J. R., BAKER, B. L. & THORBURN, A. 2000. Dexamethasone inhibits insulin-‐like growth factor signaling and potentiates myoblast apoptosis. Endocrinology, 141, 2945-‐50. SMITH, I. J., ALAMDARI, N., O'NEAL, P., GONNELLA, P., AVERSA, Z. & HASSELGREN, P. O. 2010. Sepsis increases the expression and activity of the transcription factor Forkhead Box O 1 (FOXO1) in skeletal muscle by a glucocorticoid-‐dependent mechanism. Int J Biochem Cell Biol, 42, 701-‐11. SMITH, M. L., CHEN, I. T., ZHAN, Q., BAE, I., CHEN, C. Y., GILMER, T. M., KASTAN, M. B., O'CONNOR, P. M. & FORNACE, A. J., JR. 1994. Interaction of the p53-‐ regulated protein Gadd45 with proliferating cell nuclear antigen. Science, 266, 1376-‐80. SOUVEREIN, P. C., BERARD, A., VAN STAA, T. P., COOPER, C., EGBERTS, A. C., LEUFKENS, H. G. & WALKER, B. R. 2004. Use of oral glucocorticoids and 273 risk of cardiovascular and cerebrovascular disease in a population based case-‐control study. Heart, 90, 859-‐65. SPANGELO B.L., JUDD, A.M., ISAKSON, P.C., MACLEOD, R.M. 1989. Interleukin-‐6 stimulates anterior pituitary hormone release in vitro. Endocrinology, 1, 575-‐7. SQUIRE, J. M. 1997. Architecture and function in the muscle sarcomere. Curr Opin Struct Biol, 7, 247-‐57. STEWART, P. M., KROZOWSKI, Z. S., GUPTA, A., MILFORD, D. V., HOWIE, A. J., SHEPPARD, M. C. & WHORWOOD, C. B. 1996. Hypertension in the syndrome of apparent mineralocorticoid excess due to mutation of the 11 beta-‐hydroxysteroid dehydrogenase type 2 gene. Lancet, 347, 88-‐91. STEWART, P. M., MURRY, B. A. & MASON, J. I. 1994. Human kidney 11 beta-‐ hydroxysteroid dehydrogenase is a high affinity nicotinamide adenine dinucleotide-‐dependent enzyme and differs from the cloned type I isoform. J Clin Endocrinol Metab, 79, 480-‐4. STEWART, P. M., TOOGOOD, A. A. & TOMLINSON, J. W. 2001. Growth hormone, insulin-‐like growth factor-‐I and the cortisol-‐cortisone shuttle. Horm Res, 56 Suppl 1, 1-‐6. STEWART, P. M., WALKER, B. R., HOLDER, G., O'HALLORAN, D. & SHACKLETON, C. H. 1995. 11 beta-‐Hydroxysteroid dehydrogenase activity in Cushing's syndrome: explaining the mineralocorticoid excess state of the ectopic adrenocorticotropin syndrome. J Clin Endocrinol Metab, 80, 3617-‐20. STEWART, P. M., WALLACE, A. M., VALENTINO, R., BURT, D., SHACKLETON, C. H. & EDWARDS, C. R. 1987. Mineralocorticoid activity of liquorice: 11-‐beta-‐ hydroxysteroid dehydrogenase deficiency comes of age. Lancet, 2, 821-‐4. STEWART, P. M. & WHORWOOD, C. B. 1994. 11 beta-‐Hydroxysteroid dehydrogenase activity and corticosteroid hormone action. Steroids, 59, 90-‐5. STITT, T. N., DRUJAN, D., CLARKE, B. A., PANARO, F., TIMOFEYVA, Y., KLINE, W. O., GONZALEZ, M., YANCOPOULOS, G. D. & GLASS, D. J. 2004. The IGF-‐ 1/PI3K/Akt pathway prevents expression of muscle atrophy-‐induced ubiquitin ligases by inhibiting FOXO transcription factors. Mol Cell, 14, 395-‐403. STAWSKI, R. S., ALMEIDA, D. M., LACHMAN, M. E., TUN, P. A., ROSNICK, C. B. & SEEMAN, T. 2011. Associations between cognitive function and naturally occurring daily cortisol during middle adulthood: timing is everything. J Gerontol B Psychol Sci Soc Sci, 66 Suppl 1, i71-‐81. SVENDSEN, P. F., MADSBAD, S., NILAS, L., PAULSEN, S. K. & PEDERSEN, S. B. 2009. Expression of 11beta-‐hydroxysteroid dehydrogenase 1 and 2 in subcutaneous adipose tissue of lean and obese women with and without polycystic ovary syndrome. Int J Obes (Lond), 33, 1249-‐56. SWALLOW, E. B., REYES, D., HOPKINSON, N. S., MAN, W. D., PORCHER, R., CETTI, E. J., MOORE, A. J., MOXHAM, J. & POLKEY, M. I. 2007. Quadriceps strength predicts mortality in patients with moderate to severe chronic obstructive pulmonary disease. Thorax, 62, 115-‐20. SWEARINGEN, B., BILLER, B. M., BARKER, F. G., 2ND, KATZNELSON, L., GRINSPOON, S., KLIBANSKI, A. & ZERVAS, N. T. 1999. Long-‐term mortality after transsphenoidal surgery for Cushing disease. Ann Intern Med, 130, 821-‐4. 274 SWINDELL, W. R. 2009. Genes and gene expression modules associated with caloric restriction and aging in the laboratory mouse. BMC Genomics, 10, 585. SWORDS, F. M., CARROLL, P. V., KISALU, J., WOOD, P. J., TAYLOR, N. F. & MONSON, J. P. 2003. The effects of growth hormone deficiency and replacement on glucocorticoid exposure in hypopituitary patients on cortisone acetate and hydrocortisone replacement. Clin Endocrinol (Oxf), 59, 613-‐20. TAEKEMA, D. G., GUSSEKLOO, J., MAIER, A. B., WESTENDORP, R. G. & DE CRAEN, A. J. 2010. Handgrip strength as a predictor of functional, psychological and social health. A prospective population-‐based study among the oldest old. Age Ageing, 39, 331-‐7. TAJAR, A., LEE, D. M., PYE, S. R., O'CONNELL, M. D., RAVINDRARAJAH, R., GIELEN, E., BOONEN, S., VANDERSCHUEREN, D., PENDLETON, N., FINN, J. D., BARTFAI, G., CASANUEVA, F. F., FORTI, G., GIWERCMAN, A., HAN, T. S., HUHTANIEMI, I. T., KULA, K., LEAN, M. E., PUNAB, M., WU, F. C. & O'NEILL, T. W. 2013. The association of frailty with serum 25-‐hydroxyvitamin D and parathyroid hormone levels in older European men. Age Ageing, 42, 352-‐9. TANIMOTO, Y., WATANABE, M., SUN, W., TANIMOTO, K., SHISHIKURA, K., SUGIURA, Y., KUSABIRAKI, T. & KONO, K. 2013. Association of sarcopenia with functional decline in community-‐dwelling elderly subjects in Japan. Geriatr Gerontol Int, 13, 958-‐63. TARNOPOLSKY, M. A., PEARCE, E., SMITH, K. & LACH, B. 2011. Suction-‐modified Bergstrom muscle biopsy technique: experience with 13,500 procedures. Muscle Nerve, 43, 717-‐25. THORN, G. W., FORSHAM, P. H. & ET AL. 1949. Clinical studies in Addison's disease. Ann N Y Acad Sci, 50, 646-‐56. TIAO, G. M., HUDSON, K., LIEBERMAN, M. A., FISCHER, J. E. & HASSELGREN, P. O. 1996. Identification of altered gene expression in skeletal muscle during sepsis using differential display. J Surg Res, 64, 63-‐7. TICHET, J., VOL, S., GOXE, D., SALLE, A., BERRUT, G. & RITZ, P. 2008. Prevalence of sarcopenia in the French senior population. J Nutr Health Aging, 12, 202-‐ 6. TIGANESCU, A., WALKER, E. A., HARDY, R. S., MAYES, A. E. & STEWART, P. M. 2011. Localization, age-‐ and site-‐dependent expression, and regulation of 11beta-‐hydroxysteroid dehydrogenase type 1 in skin. J Invest Dermatol, 131, 30-‐6. TIGANESCU, A., TAHRANI, A. A., MORGAN, S. A., OTRANTO, M., DESMOULIERE, A., ABRAHAMS, L., HASSAN-‐SMITH, Z., WALKER, E. A., RABBITT, E. H., COOPER, M. S., AMREIN, K., LAVERY, G. G. & STEWART, P. M. 2013. 11beta-‐Hydroxysteroid dehydrogenase blockade prevents age-‐induced skin structure and function defects. J Clin Invest, 123, 3051-‐60. TOBIMATSU, K., NOGUCHI, T., HOSOOKA, T., SAKAI, M., INAGAKI, K., MATSUKI, Y., HIRAMATSU, R. & KASUGA, M. 2009. Overexpression of the transcriptional coregulator Cited2 protects against glucocorticoid-‐ induced atrophy of C2C12 myotubes. Biochem Biophys Res Commun, 378, 399-‐403. TOMLINSON, B. E. & IRVING, D. 1977. The numbers of limb motor neurons in the human lumbosacral cord throughout life. J Neurol Sci, 34, 213-‐9. 275 TOMLINSON, J. W., CRABTREE, N., CLARK, P. M., HOLDER, G., TOOGOOD, A. A., SHACKLETON, C. H. & STEWART, P. M. 2003. Low-‐dose growth hormone inhibits 11 beta-‐hydroxysteroid dehydrogenase type 1 but has no effect upon fat mass in patients with simple obesity. J Clin Endocrinol Metab, 88, 2113-‐8. TOMLINSON, J. W., DRAPER, N., MACKIE, J., JOHNSON, A. P., HOLDER, G., WOOD, P. & STEWART, P. M. 2002. Absence of Cushingoid phenotype in a patient with Cushing's disease due to defective cortisone to cortisol conversion. J Clin Endocrinol Metab, 87, 57-‐62. TOMLINSON, J. W., SINHA, B., BUJALSKA, I., HEWISON, M. & STEWART, P. M. 2002. Expression of 11beta-‐hydroxysteroid dehydrogenase type 1 in adipose tissue is not increased in human obesity. J Clin Endocrinol Metab, 87, 5630-‐5. TOMLINSON, J. W., MOORE, J., COOPER, M. S., BUJALSKA, I., SHAHMANESH, M., BURT, C., STRAIN, A., HEWISON, M. & STEWART, P. M. 2001. Regulation of expression of 11beta-‐hydroxysteroid dehydrogenase type 1 in adipose tissue: tissue-‐specific induction by cytokines. Endocrinology, 142, 1982-‐9. TOMLINSON, J. W., WALKER, E. A., BUJALSKA, I. J., DRAPER, N., LAVERY, G. G., COOPER, M. S., HEWISON, M. & STEWART, P. M. 2004a. 11beta-‐ hydroxysteroid dehydrogenase type 1: a tissue-‐specific regulator of glucocorticoid response. Endocr Rev, 25, 831-‐66. TOOGOOD, A. A., TAYLOR, N. F., SHALET, S. M. & MONSON, J. P. 2000a. Modulation of cortisol metabolism by low-‐dose growth hormone replacement in elderly hypopituitary patients. J Clin Endocrinol Metab, 85, 1727-‐30. TOOGOOD, A. A., TAYLOR, N. F., SHALET, S. M. & MONSON, J. P. 2000b. Sexual dimorphism of cortisol metabolism is maintained in elderly subjects and is not oestrogen dependent. Clin Endocrinol (Oxf), 52, 61-‐6. TOUNO, M., SENDA, M., NAKAGO, K., YOKOYAMA, Y. & INOUE, H. 1996. Muscle fiber changes of the vastus medialis in rheumatoid patients. Acta Med Okayama, 50, 157-‐64. TRAUSTADOTTIR, T., BOSCH, P. R., CANTU, T. & MATT, K. S. 2004. Hypothalamic-‐ pituitary-‐adrenal axis response and recovery from high-‐intensity exercise in women: effects of aging and fitness. J Clin Endocrinol Metab, 89, 3248-‐ 54. TRITOS, N. A. & BILLER, B. M. 2012. Advances in medical therapies for Cushing's syndrome. Discov Med, 13, 171-‐9. TSUJINAKA, T., FUJITA, J., EBISUI, C., YANO, M., KOMINAMI, E., SUZUKI, K., TANAKA, K., KATSUME, A., OHSUGI, Y., SHIOZAKI, H. & MONDEN, M. 1996. Interleukin 6 receptor antibody inhibits muscle atrophy and modulates proteolytic systems in interleukin 6 transgenic mice. J Clin Invest, 97, 244-‐ 9. ULICK, S., LEVINE, L. S., GUNCZLER, P., ZANCONATO, G., RAMIREZ, L. C., RAUH, W., ROSLER, A., BRADLOW, H. L. & NEW, M. I. 1979. A syndrome of apparent mineralocorticoid excess associated with defects in the peripheral metabolism of cortisol. J Clin Endocrinol Metab, 49, 757-‐64. VALENTI, G. 2004. Neuroendocrine hypothesis of aging: the role of corticoadrenal steroids. J Endocrinol Invest, 27, 62-‐3. 276 VAN CAUTER, E., LEPROULT, R. & KUPFER, D. J. 1996. Effects of gender and age on the levels and circadian rhythmicity of plasma cortisol. J Clin Endocrinol Metab, 81, 2468-‐73. VAN CAUTER, E., LEPROULT, R. & PLAT, L. 2000. Age-‐related changes in slow wave sleep and REM sleep and relationship with growth hormone and cortisol levels in healthy men. JAMA, 284, 861-‐8. VAN COEVORDEN, A., MOCKEL, J., LAURENT, E., KERKHOFS, M., L'HERMITE-‐ BALERIAUX, M., DECOSTER, C., NEVE, P. & VAN CAUTER, E. 1991. Neuroendocrine rhythms and sleep in aging men. Am J Physiol, 260, E651-‐ 61. VAN STAA, T. P., LEUFKENS, H. G., ABENHAIM, L., BEGAUD, B., ZHANG, B. & COOPER, C. 2000. Use of oral corticosteroids in the United Kingdom. QJM, 93, 105-‐11. VANDENBURGH, H., CHROMIAK, J., SHANSKY, J., DEL TATTO, M. & LEMAIRE, J. 1999. Space travel directly induces skeletal muscle atrophy. FASEB J, 13, 1031-‐8. VELDHUIS, J. D., IRANMANESH, A. & BOWERS, C. Y. 2005. Joint mechanisms of impaired growth-‐hormone pulse renewal in aging men. J Clin Endocrinol Metab, 90, 4177-‐83. VELDHUIS, J. D., ROELFSEMA, F., IRANMANESH, A., CARROLL, B. J., KEENAN, D. M. & PINCUS, S. M. 2009. Basal, pulsatile, entropic (patterned), and spiky (staccato-‐like) properties of ACTH secretion: impact of age, gender, and body mass index. J Clin Endocrinol Metab, 94, 4045-‐52. VERDIJK, L. B., KOOPMAN, R., SCHAART, G., MEIJER, K., SAVELBERG, H. H. & VAN LOON, L. J. 2007. Satellite cell content is specifically reduced in type II skeletal muscle fibers in the elderly. Am J Physiol Endocrinol Metab, 292, E151-‐7. VERGHESE, J., HOLTZER, R., OH-‐PARK, M., DERBY, C. A., LIPTON, R. B. & WANG, C. 2011. Inflammatory markers and gait speed decline in older adults. J Gerontol A Biol Sci Med Sci, 66, 1083-‐9. VERHEES, K. J., SCHOLS, A. M., KELDERS, M. C., OP DEN KAMP, C. M., VAN DER VELDEN, J. L. & LANGEN, R. C. 2011. Glycogen synthase kinase-‐3beta is required for the induction of skeletal muscle atrophy. Am J Physiol Cell Physiol, 301, C995-‐C1007. VESTERGAARD, P., LINDHOLM, J., JORGENSEN, J. O., HAGEN, C., HOECK, H. C., LAURBERG, P., REJNMARK, L., BRIXEN, K., KRISTENSEN, L. O., FELDT-‐ RASMUSSEN, U. & MOSEKILDE, L. 2002. Increased risk of osteoporotic fractures in patients with Cushing's syndrome. Eur J Endocrinol, 146, 51-‐ 6. VIAU, V. 2002. Functional cross-‐talk between the hypothalamic-‐pituitary-‐ gonadal and -‐adrenal axes. J Neuroendocrinol, 14, 506-‐13. VILCHEZ, D., BOYER, L., MORANTTE, I., LUTZ, M., MERKWIRTH, C., JOYCE, D., SPENCER, B., PAGE, L., MASLIAH, E., BERGGREN, W. T., GAGE, F. H. & DILLIN, A. 2012. Increased proteasome activity in human embryonic stem cells is regulated by PSMD11. Nature, 489, 304-‐8. VISSER, M., PAHOR, M., TAAFFE, D. R., GOODPASTER, B. H., SIMONSICK, E. M., NEWMAN, A. B., NEVITT, M. & HARRIS, T. B. 2002. Relationship of interleukin-‐6 and tumor necrosis factor-‐alpha with muscle mass and 277 muscle strength in elderly men and women: the Health ABC Study. J Gerontol A Biol Sci Med Sci, 57, M326-‐32. VOLPI, E., MITTENDORFER, B., RASMUSSEN, B. B. & WOLFE, R. R. 2000. The response of muscle protein anabolism to combined hyperaminoacidemia and glucose-‐induced hyperinsulinemia is impaired in the elderly. J Clin Endocrinol Metab, 85, 4481-‐90. VON HAEHLING, S., MORLEY, J. E. & ANKER, S. D. 2010. An overview of sarcopenia: facts and numbers on prevalence and clinical impact. J Cachexia Sarcopenia Muscle, 1, 129-‐133. VYAS, D. R., SPANGENBURG, E. E., ABRAHA, T. W., CHILDS, T. E. & BOOTH, F. W. 2002. GSK-‐3beta negatively regulates skeletal myotube hypertrophy. Am J Physiol Cell Physiol, 283, C545-‐51. WADDELL, D. S., BAEHR, L. M., VAN DEN BRANDT, J., JOHNSEN, S. A., REICHARDT, H. M., FURLOW, J. D. & BODINE, S. C. 2008. The glucocorticoid receptor and FOXO1 synergistically activate the skeletal muscle atrophy-‐associated MuRF1 gene. Am J Physiol Endocrinol Metab, 295, E785-‐97. WALL, B. T., DIRKS, M. L. & VAN LOON, L. J. 2013. Skeletal muscle atrophy during short-‐term disuse: Implications for age-‐related sarcopenia. Ageing Res Rev, 12, 898-‐906. WALSH, L. J., WONG, C. A., PRINGLE, M. & TATTERSFIELD, A. E. 1996. Use of oral corticosteroids in the community and the prevention of secondary osteoporosis: a cross sectional study. BMJ, 313, 344-‐6. WALTMAN, C., BLACKMAN, M. R., CHROUSOS, G. P., RIEMANN, C. & HARMAN, S. M. 1991. Spontaneous and glucocorticoid-‐inhibited adrenocorticotropic hormone and cortisol secretion are similar in healthy young and old men. J Clin Endocrinol Metab, 73, 495-‐502. WANG, X., HU, Z., HU, J., DU, J. & MITCH, W. E. 2006. Insulin resistance accelerates muscle protein degradation: Activation of the ubiquitin-‐proteasome pathway by defects in muscle cell signaling. Endocrinology, 147, 4160-‐8. WANG, X. H. 2013. MicroRNA in myogenesis and muscle atrophy. Curr Opin Clin Nutr Metab Care, 16, 258-‐66. WEAVER, J. U., TAYLOR, N. F., MONSON, J. P., WOOD, P. J. & KELLY, W. F. 1998. Sexual dimorphism in 11 beta hydroxysteroid dehydrogenase activity and its relation to fat distribution and insulin sensitivity; a study in hypopituitary subjects. Clin Endocrinol (Oxf), 49, 13-‐20. WEINSTEIN, R. S., WAN, C., LIU, Q., WANG, Y., ALMEIDA, M., O'BRIEN, C. A., THOSTENSON, J., ROBERSON, P. K., BOSKEY, A. L., CLEMENS, T. L. & MANOLAGAS, S. C. 2010. Endogenous glucocorticoids decrease skeletal angiogenesis, vascularity, hydration, and strength in aged mice. Aging Cell, 9, 147-‐61. WELLCOME TRUST 2010. Wellcome Trust Strategic Plan 2010-‐20. Available from: http://www.wellcome.ac.uk/stellent/groups/corporatesite/@policy_com munications/documents/web_document/WTDV027438.pdf. WELLE, S., BHATT, K., SHAH, B. & THORNTON, C. 2002. Insulin-‐like growth factor-‐1 and myostatin mRNA expression in muscle: comparison between 62-‐77 and 21-‐31 yr old men. Exp Gerontol, 37, 833-‐9. 278 WELLE, S., BHATT, K. & THORNTON, C. A. 2000. High-‐abundance mRNAs in human muscle: comparison between young and old. J Appl Physiol (1985), 89, 297-‐304. WELLE, S., BROOKS, A. I., DELEHANTY, J. M., NEEDLER, N., BHATT, K., SHAH, B. & THORNTON, C. A. 2004. Skeletal muscle gene expression profiles in 20-‐29 year old and 65-‐71 year old women. Exp Gerontol, 39, 369-‐77. WELLE, S., BROOKS, A. I., DELEHANTY, J. M., NEEDLER, N. & THORNTON, C. A. 2003. Gene expression profile of aging in human muscle. Physiol Genomics, 14, 149-‐59. WELLE, S., THORNTON, C., STATT, M. & MCHENRY, B. 1996. Growth hormone increases muscle mass and strength but does not rejuvenate myofibrillar protein synthesis in healthy subjects over 60 years old. J Clin Endocrinol Metab, 81, 3239-‐43. WELSH, G. I., MILLER, C. M., LOUGHLIN, A. J., PRICE, N. T. & PROUD, C. G. 1998. Regulation of eukaryotic initiation factor eIF2B: glycogen synthase kinase-‐3 phosphorylates a conserved serine which undergoes dephosphorylation in response to insulin. FEBS Lett, 421, 125-‐30. WHITMAN, S. A., WACKER, M. J., RICHMOND, S. R. & GODARD, M. P. 2005. Contributions of the ubiquitin-‐proteasome pathway and apoptosis to human skeletal muscle wasting with age. Pflugers Arch, 450, 437-‐46. WORLD HEALTH ORGANISATION (WHO) REPORT 2009. Age and Lifecourse. Available from: http://www.who.int/ageing/en/. WHORWOOD, C. B., DONOVAN, S. J., FLANAGAN, D., PHILLIPS, D. I. & BYRNE, C. D. 2002. Increased glucocorticoid receptor expression in human skeletal muscle cells may contribute to the pathogenesis of the metabolic syndrome. Diabetes, 51, 1066-‐75. WHORWOOD, C. B., DONOVAN, S. J., WOOD, P. J. & PHILLIPS, D. I. 2001. Regulation of glucocorticoid receptor alpha and beta isoforms and type I 11beta-‐hydroxysteroid dehydrogenase expression in human skeletal muscle cells: a key role in the pathogenesis of insulin resistance? J Clin Endocrinol Metab, 86, 2296-‐308. WILKINSON, C. W., PESKIND, E. R. & RASKIND, M. A. 1997. Decreased hypothalamic-‐pituitary-‐adrenal axis sensitivity to cortisol feedback inhibition in human aging. Neuroendocrinology, 65, 79-‐90. WILKINSON, C. W., PETRIE, E. C., MURRAY, S. R., COLASURDO, E. A., RASKIND, M. A. & PESKIND, E. R. 2001. Human glucocorticoid feedback inhibition is reduced in older individuals: evening study. J Clin Endocrinol Metab, 86, 545-‐50. WILSON, J. D. & WILLIAMS, R. H. 1998. Williams textbook of endocrinology, Philadelphia ; London, Saunders. WILSON, R. C., KROZOWSKI, Z. S., LI, K., OBEYESEKERE, V. R., RAZZAGHY-‐AZAR, M., HARBISON, M. D., WEI, J. Q., SHACKLETON, C. H., FUNDER, J. W. & NEW, M. I. 1995. A mutation in the HSD11B2 gene in a family with apparent mineralocorticoid excess. J Clin Endocrinol Metab, 80, 2263-‐6. WING, S. S. & GOLDBERG, A. L. 1993. Glucocorticoids activate the ATP-‐ubiquitin-‐ dependent proteolytic system in skeletal muscle during fasting. Am J Physiol, 264, E668-‐76. 279 WOODS, N. F., MITCHELL, E. S. & SMITH-‐DIJULIO, K. 2009. Cortisol levels during the menopausal transition and early postmenopause: observations from the Seattle Midlife Women's Health Study. Menopause, 16, 708-‐18. WORKENEH, B. & BAJAJ, M. 2013. The regulation of muscle protein turnover in diabetes. Int J Biochem Cell Biol. YAFFE, D. & SAXEL, O. 1977. Serial passaging and differentiation of myogenic cells isolated from dystrophic mouse muscle. Nature, 270, 725-‐7. YAMAKI, T., WU, C. L., GUSTIN, M., LIM, J., JACKMAN, R. W. & KANDARIAN, S. C. 2012. Rel A/p65 is required for cytokine-‐induced myotube atrophy. Am J Physiol Cell Physiol, 303, C135-‐42. YAMAMOTO, D., MAKI, T., HERNINGTYAS, E. H., IKESHITA, N., SHIBAHARA, H., SUGIYAMA, Y., NAKANISHI, S., IIDA, K., IGUCHI, G., TAKAHASHI, Y., KAJI, H., CHIHARA, K. & OKIMURA, Y. 2010. Branched-‐chain amino acids protect against dexamethasone-‐induced soleus muscle atrophy in rats. Muscle Nerve, 41, 819-‐27. YAMATANI, H., TAKAHASHI, K., YOSHIDA, T., TAKATA, K. & KURACHI, H. 2012. Association of estrogen with glucocorticoid levels in visceral fat in postmenopausal women. Menopause. YAMATANI, H., TAKAHASHI, K., YOSHIDA, T., TAKATA, K. & KURACHI, H. 2013. Association of estrogen with glucocorticoid levels in visceral fat in postmenopausal women. Menopause, 20, 437-‐42. YANG, H., MENCONI, M. J., WEI, W., PETKOVA, V. & HASSELGREN, P. O. 2005. Dexamethasone upregulates the expression of the nuclear cofactor p300 and its interaction with C/EBPbeta in cultured myotubes. J Cell Biochem, 94, 1058-‐67. YANG, H., WEI, W., MENCONI, M. & HASSELGREN, P. O. 2007. Dexamethasone-‐ induced protein degradation in cultured myotubes is p300/HAT dependent. Am J Physiol Regul Integr Comp Physiol, 292, R337-‐4. YAP, L. B., TURNER, H. E., ADAMS, C. B. & WASS, J. A. 2002. Undetectable postoperative cortisol does not always predict long-‐term remission in Cushing's disease: a single centre audit. Clin Endocrinol (Oxf), 56, 25-‐31. YATES, D. A. 1963. The Estimation of Mean Potential Duration in Endocrine Myopathy. J Neurol Neurosurg Psychiatry, 26, 458-‐61. YAU, J. L., MCNAIR, K. M., NOBLE, J., BROWNSTEIN, D., HIBBERD, C., MORTON, N., MULLINS, J. J., MORRIS, R. G., COBB, S. & SECKL, J. R. 2007. Enhanced hippocampal long-‐term potentiation and spatial learning in aged 11beta-‐ hydroxysteroid dehydrogenase type 1 knock-‐out mice. J Neurosci, 27, 10487-‐96. YAU, J. L., NOBLE, J., KENYON, C. J., HIBBERD, C., KOTELEVTSEV, Y., MULLINS, J. J. & SECKL, J. R. 2001. Lack of tissue glucocorticoid reactivation in 11beta -‐ hydroxysteroid dehydrogenase type 1 knockout mice ameliorates age-‐ related learning impairments. Proc Natl Acad Sci U S A, 98, 4716-‐21. YAU, J. L. & SECKL, J. R. 2012. Local amplification of glucocorticoids in the aging brain and impaired spatial memory. Front Aging Neurosci, 4, 24. YICK, C.Y., ZWINDERMAN, A.H., KUNST, P.W., GRUNBERG, K., MAUAD, T., FLUITER, K., BEL, E.H., LUTTER, R., BAAS, F., STERK, P.J. 2013. Glucocorticoid-‐induced changes in gene expression of airway smooth muscle in patients with asthma. 10, 1076-‐84. 280 YIU, K.H., MARSAN, N.A., DELGADO, V., BIERMASZ, N.R., HOLMAN, E.R., SMIT, J.W.A., FEELDERS, R.A., BAX, J.J., PEREIRA, A.M. 2012. Increased myocardial fibrosis and left ventricular dysfunction in Cushing's syndrome. Eur J Endocrinol, 166, 27-‐34. ZAHN, J. M., SONU, R., VOGEL, H., CRANE, E., MAZAN-‐MAMCZARZ, K., RABKIN, R., DAVIS, R. W., BECKER, K. G., OWEN, A. B. & KIM, S. K. 2006. Transcriptional profiling of aging in human muscle reveals a common aging signature. PLoS Genet, 2, e115. ZBANKOVA, S., BRYNDOVA, J., LEDEN, P., KMENT, M., SVEC, A., PACHA, J. 2007. 11beta-‐hydroxysteroid dehydrogenase 1 and 2 expression in colon from patients with ulcerative colitis. J Gastroenterol Hepatol, 7, 1019-‐23. ZEN, M., CANOVA, M., CAMPANA, C., BETTIO, S., NALOTTO, L., RAMPUDDA, M., RAMONDA, R., IACCARINO, L. & DORIA, A. 2011. The kaleidoscope of glucorticoid effects on immune system. Autoimmun Rev, 10, 305-‐10. ZHANG, L., NIE, L. & MAKI, C. G. 2006. P53 and p73 differ in their ability to inhibit glucocorticoid receptor (GR) transcriptional activity. Mol Cancer, 5, 68. ZHANG, M., LV, X. Y., LI, J., XU, Z. G. & CHEN, L. 2009. Alteration of 11beta-‐ hydroxysteroid dehydrogenase type 1 in skeletal muscle in a rat model of type 2 diabetes. Mol Cell Biochem, 324, 147-‐55. ZHAO, W., PAN, J., WANG, X., WU, Y., BAUMAN, W. A. & CARDOZO, C. P. 2008. Expression of the muscle atrophy factor muscle atrophy F-‐box is suppressed by testosterone. Endocrinology, 149, 5449-‐60. ZHAO, W., QIN, W., PAN, J., WU, Y., BAUMAN, W. A. & CARDOZO, C. 2009. Dependence of dexamethasone-‐induced Akt/FOXO1 signaling, upregulation of MAFbx, and protein catabolism upon the glucocorticoid receptor. Biochem Biophys Res Commun, 378, 668-‐72. ZHAO, Z. Y., LU, F. H., XIE, Y., FU, Y. R., BOGDAN, A. & TOUITOU, Y. 2003. Cortisol secretion in the elderly. Influence of age, sex and cardiovascular disease in a Chinese population. Steroids, 68, 551-‐5. ZHU, X., TOPOUZIS, S., LIANG, L. F. & STOTISH, R. L. 2004. Myostatin signaling through Smad2, Smad3 and Smad4 is regulated by the inhibitory Smad7 by a negative feedback mechanism. Cytokine, 26, 262-‐72. ZIMMERMAN, T., HORBER, F., RODRIGUEZ, N., SCHWENK, W. F. & HAYMOND, M. W. 1989. Contribution of insulin resistance to catabolic effect of prednisone on leucine metabolism in humans. Diabetes, 38, 1238-‐44. ZIMMERS, T. A., DAVIES, M. V., KONIARIS, L. G., HAYNES, P., ESQUELA, A. F., TOMKINSON, K. N., MCPHERRON, A. C., WOLFMAN, N. M. & LEE, S. J. 2002. Induction of cachexia in mice by systemically administered myostatin. Science, 296, 1486-‐8. 281 Supplementary Data 282 Supplementary Tables Ethnicities of Female Ageing Study Subjects Age Group (years): 20-‐30 N 15 Caucasian 7 Asian 7 African-‐Caribbean 0 Mixed-‐Race 1 30-‐40 40-‐50 50-‐60 12 15 8 3 1 60-‐70 >70 12 16 7 15 12 14 7 0 0 2 0 0 0 0 0 0 0 0 0 0 Supplementary table S6.1: Ethnicities of female ageing study participants by age group (n=77). Ethnicities of Male Ageing Study Subjects >70 Age Group (years) 20-‐30 30-‐40 40-‐50 50-‐60 60-‐70 13 9 10 4 13 9 N 10 6 9 3 13 8 Caucasian Asian 2 3 1 1 0 1 African-‐Caribbean 0 0 0 0 0 0 Mixed-‐Race 1 0 0 0 0 0 Supplementary table S6.2: Ethnicities of male ageing study participants by age group (n=58). 283 Female Subjects Patient Characteristics Age (years) BMI (kg/m2) Fat Mass (kg) Lean Mass (kg) Serum biochemistry Subject Characteristics by Ethnicity (Medians and IQRs) South Asian Caucasian P-‐value 25 (22-‐34) 23.6 (20.6-‐26.8) 20.2 (14.2-‐27.6) 36.1 (33.0-‐40.6) 25 (22-‐35) 22.2 (21.3-‐24.3) 17.2 (15.7-‐19.1) 42.7 (40.9-‐46.9) IGF-‐I 24.5 (18.4-‐28.6) 25.8 (20.4-‐33.7) DHEAS 5.0 (3.5-‐7.9) 3.3 (2.7-‐4.5) Testosterone 1.0 (0.5-‐1.2) 0.7 (0.5-‐0.8) SHBG 36.2 (21.3-‐59.8) 70.1 (45.6-‐154.1) 9am Cortisol 344 (166-‐592) 331 (194-‐633) Skeletal Muscle mRNA Expression 11β-‐HSD1 (AU) 0.01 (0.00-‐0.03) 0.01 (0.00-‐0.01) H6PDH (AU) 0.03 (0.02-‐0.06) 0.09 (0.06-‐0.10) Urine Steroid GC/MS Analysis (THF+5αTHF/THE) 0.91 (0.71-‐1.16) 0.92 (0.64-‐1.22) (Cortols/Cortolones) 0.38 (0.37-‐0.51) 0.41 (0.33-‐0.57) Total F Metabolites (μg/24h) 5820 (4763-‐7225) 4021 (3089-‐7930) F/E 0.58 (0.51-‐0.70) 0.87 (0.55-‐0.95) THF/5αTHF 1.08 (0.78-‐1.47) 1.60 (1.09-‐2.98) 1.00 1.00 0.49 0.02 0.70 0.11 0.17 0.01 0.72 0.41 0.03 1.00 0.80 0.30 0.30 0.14 Supplementary table S6.3: Subject characteristics in age-‐matched female study participants as divided by ethnicity (South Asian vs. Caucasian, n=10 in each group, all subjects in 20-‐40 year age groups). Characteristics include general demographics, anthropometry, body composition, skeletal muscle gene expression and urine steroid GC/MS data. P-‐values shown are from Mann Whitney tests with statistically significant results highlighted in bold. (THF+5αTHF/THE) = (tetra-‐ hydrocortisol+5α-‐tetrahydrocortisol)/tetrahydrocortisone. F= cortisol, F/E = cortisol/cortisone, THF/5αTHF = tetrahydrocortisol/5α-‐tetrahydrocortisol. 284 Male Subjects Patient Characteristics Age (years) BMI (kg/m2) Fat Mass (kg) Lean Mass (kg) Serum biochemistry IGF-‐I DHEAS Testosterone Skeletal Muscle mRNA Expression 11β-‐HSD1 (AU) H6PDH (AU) Urine Steroid GC/MS Analysis (THF+5αTHF/THE) (Cortols/Cortolones) Total F Metabolites (μg/24h) F/E THF/5αTHF Subject Characteristics by Ethnicity (Medians and IQRs) Asian Caucasian P-‐value 36 (27-‐50) 25.1 (22.2-‐26.4) 14.9 (11.1-‐18.5) 53.5 (47.3-‐58.3) 38 (30-‐50) 23.5 (21.6-‐28.5) 16.0 (13.6-‐20.1) 59.8 (52.3-‐65.8) 0.81 1.00 0.55 0.16 21.7 (17.4-‐25.2) 6.7 (3.7-‐8.5) 12.8 (11.3-‐19.7) 17.3 (15.9-‐21.3) 7.4 (4.5-‐8.3) 14.6 (13.3-‐17.8) 0.14 1.00 0.96 N/A N/A N/A N/A N/A N/A 0.88 (0.75-‐1.13) 0.45 (0.33-‐0.54) 8028 (5947-‐ 11432) 0.70 (0.58-‐0.73) 0.93 (0.62-‐1.17) 0.97 (0.62-‐1.32) 0.42 (0.28-‐0.56) 13159 (8089-‐ 1676) 0.79 (0.69-‐0.88) 0.93 (0.60-‐1.18) 0.90 0.76 0.17 0.03 1.00 Supplementary table S6.4: Subject characteristics in age-‐matched male study participants as divided by ethnicity (Asian vs. Caucasian, n=8 in each group). Characteristics include general demographics, anthropometry, body composition, skeletal muscle gene expression and urine steroid GC/MS data. P-‐values shown are from Mann Whitney tests with statistically significant results highlighted in bold. (THF+5αTHF/THE) = (tetra-‐hydrocortisol+5α-‐ tetrahydrocortisol)/tetrahydrocortisone. F= cortisol, F/E = cortisol/cortisone, THF/5αTHF = tetrahydrocortisol/5α-‐tetrahydrocortisol. 285 Age Group (years) N 20-‐30 30-‐40 40-‐50 50-‐60 60-‐70 >70 15 12 15 12 16 7 18 OH THA 1374 (1003-‐1613) 1420 (1241-‐1721) 516 (180-‐1095) 572 (353-‐1039) 168 (121-‐249) 126 (93-‐188) 77 (58-‐158) 84 (49-‐145) 68 (48-‐80) 82 (46-‐137) 174 (73-‐304) 16 (13-‐21) 5 (4-‐6) 252 (152-‐307) 6 (3-‐9) 64 (43-‐89) 335 (256-‐427) 6 (3-‐8) 55 (30-‐65) 53 (37-‐74) 120 (97-‐192) 808 (527-‐1237) 515 (332-‐964) 183 (123-‐293) 264 (226-‐472) 379 (183-‐498) 186 (98-‐233) 73 (61-‐98) 1902 (1373-‐2461) 819 (507-‐973) 350 (249-‐531) 237 (154-‐273) 73 (63-‐95) 1163 (978-‐1766) 1133 (773-‐1826) 334 (117-‐1299) 360 (155-‐675) 170 (136-‐247) 123 (89-‐191) 51 (33-‐103) 65 (57-‐76) 69 (54-‐78) 77 (65-‐87) 140 (128-‐208) 16 (12-‐19) 3 (3-‐5) 219 (141-‐364) 9 (7-‐13) 62 (52-‐140) 410 (247-‐671) 6 (5-‐10) 52 (45-‐58) 56 (31-‐64) 119 (91-‐165) 1014 (899-‐1208) 762 (553-‐949) 208 (187-‐221) 301 (204-‐411) 428 (324-‐540) 296 (136-‐362) 77 (52-‐94) 1727 (1615-‐2164) 719 (651-‐1006) 344 (274-‐545) 258 (150-‐488) 61 (53-‐82) 1380 (912-‐1729) 1199 (986-‐1552) 276 (124-‐528) 447 (297-‐674) 143 (112-‐208) 160 (111-‐210) 43 (24-‐63) 81 (62-‐111) 79 (54-‐96) 96 (83-‐107) 195 (140-‐246) 25 (14-‐42) 3 (3-‐6) 495 (226-‐661) 10 (6-‐28) 90 (68-‐278) 462 (373-‐688) 6 (5-‐12) 66 (52-‐77) 46 (37-‐52) 111 (85-‐130) 1340 (1129-‐1503) 1011 (572-‐1157) 266 (199-‐292) 315 (278-‐475) 437 (295-‐582) 297 (149-‐386) 74 (67-‐87) 2309 (1932-‐2440) 899 (682-‐1232) 426 (351-‐529) 275 (222-‐412) 54 (41-‐63) 707 (416-‐903) 974 (657-‐1124) 204 (109-‐248) 179 (123-‐319) 104 (64-‐121) 56 (48-‐153) 27 (17-‐49) 113 (50-‐124) 64 (41-‐82) 84 (52-‐126) 189 (140-‐246) 9 (6-‐11) 3 (3-‐4) 114 (95-‐151) 4 (4-‐6) 36 (27-‐45) 236 (212-‐280) 7 (6-‐27) 48 (43-‐63) 36 (33-‐49) 97 (70-‐130) 821 (723-‐1182) 553 (342-‐1078) 184 (159-‐225) 262 (205-‐424) 324 (221-‐497) 297 (92-‐415) 66 (53-‐76) 1682 (1430-‐2846) 651 (581-‐1247) 362 (226-‐514) 264 (157-‐400) 36 (33-‐54) 243*** (172-‐346) 331*** (257-‐572) 27*** (17-‐54) 55*** (39-‐132) 61 ** (40-‐69) 58 (35-‐76) 16*** (11-‐24) 62 (53-‐104) 60 (52-‐81) 78 (56-‐141) 134 (103-‐150) 6 (6-‐11) 3 (2-‐6) 115 (97-‐137) 4 (1-‐6) 29* (21-‐38) 156* (113-‐232) 9 (6-‐16) 56 (40-‐71) 39 (34-‐49) 94 (78-‐122) 885 (785-‐1291) 438 (377-‐605) 180 (161-‐243) 310 (226-‐450) 247 (200-‐322) 238 (118-‐287) 62 (53-‐78) 1902 (1663-‐2906) 826 (751-‐1088) 444 (370-‐542) 348 (186-‐483) 39* (24-‐47) 377** (270-‐491) 453** (380-‐536) 20** (13-‐24) 110* (35-‐144) 55 (36-‐62) 44 (31-‐75) 21* (10-‐36) 69 (56-‐78) 72 (63-‐93) 66 (51-‐84) 184 (136-‐232) 8* (4-‐9) 5 (4-‐5) 78 (68-‐142) 4 (2-‐4) 24 (17-‐30) 172 (119-‐327) 10 (7-‐10) 44 (30-‐69) 42 (39-‐55) 119 (90-‐121) 1192 (933-‐1374) 1025 (732-‐1321) 243 (188-‐297) 487 (278-‐681) 375 (299-‐434) 531 (409-‐686) 62 (60-‐82) 2273 (2066-‐2666) 932 (718-‐1090) 578 (440-‐629) 438 (303-‐553) 35 (32-‐40) Total F metab 5413 (3432-‐7250) 5565 (4298-‐6687) 6562 (5261-‐7792) 4665 (4117-‐7929) 4846 (4573-‐6637) 7151 (6096-‐7424) ANDROS ETIO DHEA 16a OH DHEA 5-‐PT 5-‐PD Pregnadienol THA 5a-‐THA THB 5a-‐THB TH-‐DOC 5α-‐TH-‐DOC PD 3a5a 17HP 17-‐HP PT PT'ONE THS Cortisol 6b-‐OH-‐Cortisol THF 5a-‐THF a-‐cortol b-‐cortol 11b-‐OH-‐ANDRO 11b-‐OH-‐ETIO Cortisone THE a-‐cortolone b-‐cortolone 11-‐OXO-‐Et P-‐value <0.0001 <0.0001 <0.0001 <0.0001 0.0002 0.0007 <0.0001 0.6117 0.8466 0.8216 0.5547 <0.0001 0.288 <0.0001 0.0001 <0.0001 <0.0001 0.2513 0.5859 0.3649 0.5413 0.3011 0.1578 0.4623 0.6408 0.0843 0.1545 0.5617 0.6406 0.8175 0.6408 0.5165 0.0082 0.3813 Supplementary Table S6.5: Urine Steroid Analysis by GC/MS in female subjects (n=77). Overall p-‐ values from Kruskal-‐Wallis analysis shown. Differences from 20-‐30 year age-‐group highlighted in red in bold type *p<0.05, **p<0.01 and ***p<0.001. Data are expressed as medians and IQRs (Units = μg/24 hours). 286 Urine Steroid Ratios (GC/MS): Female Ageing Study Subjects (Medians and IQRs) Age Group (years) 20-‐30 30-‐40 40-‐50 50-‐60 60-‐70 >70 (F+E)/(THF+5aTHF+THE) (THA+5aTHA+THB+5aTHB)/ (THE+THF+5aTHF) 15 0.75 (0.61-‐0.92) 0.77 (0.69-‐0.87) 0.42 (0.37-‐0.51) 0.04 (0.03-‐0.06) 0.13 (0.10-‐0.17) 12 0.63 (0.50-‐0.70) 0.91 (0.86-‐1.14) 0.41 (0.37-‐0.48) 0.03 (0.03-‐0.05) 0.10 (0.09-‐0.12) 15 0.58 (0.52-‐0.62) 0.89 (0.83-‐1.14) 0.42 (0.36-‐0.54) 0.03 (0.02-‐0.04) 0.10 (0.09-‐0.11) 12 0.56 (0.51-‐0.70) 0.80 (0.66-‐0.88) 0.46 (0.30-‐0.50) 0.03 (0.02-‐0.04) 0.11 (0.07-‐0.16) 7 0.70 (0.62-‐0.76) 0.94 (0.87-‐1.02) 0.42 (0.37-‐0.53) 0.02 (0.02-‐0.03) 0.09 (0.08-‐0.10) (Andros+Etio)/ (17HP+PT) 7.47 (5.55-‐8.76) 5.70 (3.78-‐6.54) 4.11 (2.86-‐5.08) 5.22 (4.39-‐6.45) (17HP+PT)/ (THE+THF+5aTHF) (PTONE*100)/ (THE+THF+5aTHF) 0.13 (0.10-‐0.17) 0.14 (0.10-‐0.17) 0.14 (0.10-‐0.22) 0.08 (0.06-‐0.11) 16 0.62 (0.53-‐0.66) 0.69 (0.05-‐0.84) 0.36 (0.31-‐0.44) 0.03 (0.02-‐0.03) 0.09 (0.08-‐0.11) 3.26*** (2.72-‐ 4.13) 0.05** (0.04-‐ 0.07) 0.16 (0.11-‐0.19) 0.18 (0.14-‐0.25) 0.17 (0.12-‐0.23) 0.23 (0.18-‐0.44) PD/(THE+THF+5aTHF) 0.07 (0.06-‐0.09) 0.07 (0.05-‐0.08) 0.10 (0.05-‐0.18) 0.04 (0.02-‐0.06) 5PD/(THE+THF+5aTHF) 0.04 (0.03-‐0.04) 0.04 (0.02-‐0.06) 0.04 (0.03-‐0.05) 0.02 (0.01-‐ 0.05) PT/(THE+THF+5aTHF) 0.12 (0.08-‐0.14) 0.13 (0.08-‐0.15) 0.12 (0.09-‐0.16) 0.07 (0.06-‐0.09) 5PT/(THE+THF+5aTHF) 0.04 (0.03-‐0.07) 0.05 (0.04-‐0.09) 0.04 (0.03-‐0.05) 0.02 (0.02-‐0.04) DHEA/(THE+THF+5aTHF) THF/5a THF ETIO/ANDRO 0.14 (0.07-‐0.28) 1.57 (0.79-‐2.41) 1.16 (0.63-‐1.57) 0.08 (0.04-‐0.27) 1.33 (1.10-‐1.65) 0.97 (0.78-‐1.32) 0.06 (0.03-‐0.20) 1.35 (1.14-‐1.59) 0.95 (0.81-‐1.25) 0.04 (0.03-‐0.09) 1.48 (1.25-‐1.73) 1.37 (0.98-‐1.44) N F/E (THF+5aTHF)/THE cortols/cortolones 0.24 (0.20-‐0.31) 0.03* (0.02-‐ 0.04) 0.01** (0.01-‐ 0.02) 0.04** (0.04-‐ 0.06) 0.01*** (0.01-‐ 0.02) 0.01*** (0.01-‐ 0.01) 1.90 (1.42-‐2.79) 1.47 (1.27-‐1.73) Overall P-‐value 0.14 0.02 0.62 0.24 0.15 4.06 (3.00-‐4.38) 0.0006 0.04* (0.04-‐0.08) <0.0001 0.17 (0.14-‐0.24) 0.04 0.02* (0.01-‐0.04) <0.0001 0.01* (0.01-‐0.02) <0.0001 0.03* (0.03-‐0.07) <0.0001 0.01* (0.01-‐0.02) <0.0001 0.00* (0.00-‐0.00) 1.16 (0.90-‐1.33) 1.12 (1.06-‐1.28) <0.0001 Supplementary Table S6.6: Urine Steroid Ratios as analysed by GC/MS for female ageing study participants (n=77). Overall p-‐value as determined by Kruskal-‐Wallis testing is shown in table. Statistically significant differences from the 20-‐30 year age-‐group as derived from Dunn’s multiple comparison test are highlighted red in bold type *p<0.05, **p<0.01 and ***p<0.001. Data are expressed as medians and interquartile ranges (IQRs). 287 0.24 0.09 Age Group (years): N ANDROS ETIO DHEA 16a OH DHEA 5-‐PT 5-‐PD Pregnadienol THA 5a-‐THA THB 5a-‐THB TH-‐DOC 5α-‐TH-‐DOC PD 3a5a 17HP 17-‐HP PT PT'ONE THS Cortisol 6b-‐OH-‐ Cortisol THF 5a-‐THF a-‐cortol b-‐cortol 11b-‐OH-‐ ANDRO 11b-‐OH-‐ETIO Cortisone THE a-‐cortolone b-‐cortolone 11-‐OXO-‐Et 18 OH THA Total F metabolites 20-‐30 30-‐40 40-‐50 50-‐60 60-‐70 >70 13 9 10 4 13 9 4295 (2066-‐6909) 2247 (1872-‐3545) 1170 (783-‐5377) 745 (624-‐1145) 524 (307-‐819) 210 (132-‐672) 186 (108-‐414) 123 (91-‐167) 115 (88-‐174) 116 (110-‐159) 283 (231-‐470) 21 (15-‐46) 8 (4-‐9) 227 (206-‐354) 24 (21-‐77) 239 (208-‐412) 874 (671-‐1341) 13 (8-‐18) 76 (37-‐129) 70 (42-‐90) 181 (84-‐223) 1795 (1055-‐2490) 1529 (1033-‐2672) 305 (229-‐472) 548 (456-‐613) 587 (438-‐1207) 249 (120-‐395) 112 (60-‐141) 3457 (2449-‐6442) 1312 (919-‐1626) 740 (534-‐1012) 318 (192-‐467) 79 (46-‐107) 10979 (6571-‐15828) 2070 (1566-‐3181) 1693 (1316-‐3086) 2284 (1353-‐3375) 786 (646-‐1321) 473 (300-‐491) 502 (244-‐591) 207 (127-‐445) 132 (55-‐176) 95 (85-‐134) 112 (64-‐161) 244 (220-‐430) 12 (10-‐21) 4 (3-‐5) 213 (183-‐257) 20 (13-‐25) 140 (108-‐233) 745 (505-‐844) 12 (11-‐16) 48 (43-‐72) 49 (44-‐92) 104 (93-‐131) 1504 (889-‐1834) 1519 (713-‐1961) 357 (209-‐394) 617 (333-‐683) 788 (395-‐911) 378 (178-‐417) 86 (70-‐116) 2754 (2397-‐5083) 1067 (698-‐1917) 621 (455-‐1043) 365 (280-‐694) 53 (36-‐86) 8904 (5878-‐13317) 2158 (1670-‐3038) 2201 (1307-‐2493) 638 (167-‐1444) 837 (267-‐1031) 193 (189-‐417) 224 (154-‐411) 122 (58-‐158) 70 (56-‐154) 102 (52-‐134) 83 (57-‐98) 226 (118-‐389) 11 (8-‐15) 4 (4-‐6) 152 (138-‐219) 10 (8-‐27) 160 (68-‐229) 698 (541-‐779) 25 (8-‐30) 42 (35-‐49) 47 (45-‐56) 106 (96-‐174) 1583 (1031-‐1773) 1185 (712-‐2346) 292 (178-‐429) 583 (409-‐1023) 707 (372-‐823) 224 (124-‐350) 74 (68-‐76) 2621 (2326-‐4628) 1232 (844-‐1617) 875 (557-‐987) 510 (220-‐670) 44 (37-‐79) 8118 (7151-‐10803) 1635 (1508-‐2034) 1841 (1218-‐2217) 54 (23-‐311) 116 (56-‐324) 125 (88-‐200) 171 (110-‐288) 62 (44-‐100) 90 (67-‐123) 104 (75-‐158) 91 (44-‐163) 264 (135-‐478) 11 (8-‐19) 5 (3-‐5) 111 (84-‐145) 15 (11-‐22) 119 (59-‐210) 679 (505-‐792) 12 (11-‐13) 77 (59-‐93) 56 (47-‐63) 108 (91-‐121) 1638 (1213-‐1944) 2134 (1731-‐2354) 354 (320-‐372) 531 (495-‐562) 637 (571-‐663) 573 (454-‐665) 81 (66-‐93) 3594 (3037-‐3729) 1260 (1146-‐1437) 797 (631-‐937) 559 (466-‐673) 75 (59-‐94) 10192 (9008-‐10914) 1258* (1063-‐1747) 1709 (1043-‐2197) 116 (74-‐281) 183 (158-‐340) 152** (96-‐204) 167 (136-‐260) 73 (69-‐121) 99 (66-‐184) 100 (77-‐112) 124 (73-‐190) 179 (120-‐263) 13 (11-‐13) 4 (4-‐7) 159 (148-‐216) 13 (9-‐19) 136 (87-‐248) 473 (439-‐671) 14 (12-‐16) 70 (56-‐80) 72 (57-‐86) 126 (70-‐175) 1771 (1370-‐2255) 1353 (910-‐1684) 293 (240-‐346) 475 (449-‐584) 505 (412-‐599) 330 (178-‐419) 102 (95-‐129) 3445 (2798-‐4260) 1224 (952-‐1422) 726 (594-‐881) 458 (375-‐556) 61 (33-‐72) 9611 (8061-‐12223) 730*** (582-‐982) 719* (637-‐1336) 55** (36-‐64) 130* (71-‐133) 144** (66-‐148) 66 (54-‐208) 30* (22-‐74) 93 (89-‐132) 94 (88-‐98) 98 (86-‐161) 202 (180-‐293) 11 (6-‐15) 4 (3-‐5) 123 (103-‐249) 12* (8-‐13) 97 (92-‐142) 399** (310-‐438) 11 (8-‐13) 64 (49-‐98) 64 (53-‐75) 129 (65-‐154) 1761 (1379-‐2005) 1410 (873-‐1557) 277 (240-‐398) 369 (306-‐586) 306 (275-‐507) 352 (326-‐381) 85 (77-‐100) 2762 (2411-‐3492) 1233 (959-‐1467) 631 (553-‐685) 346 (330-‐372) 39 (38-‐47) 8216 (7551-‐9873) Overall P-‐value 0.0007 0.05 <0.0001 0.0007 <0.0001 0.06 0.001 0.79 0.79 0.75 0.45 0.07 0.45 0.06 0.03 0.07 0.01 0.59 0.42 0.91 0.55 0.86 0.74 1.00 0.56 0.45 0.49 0.52 0.89 0.95 0.76 0.76 0.39 0.88 Supplementary Table S6.7: Urine Steroid Analysis by GC/MS in male ageing study participants (n=58). Overall p-‐values from Kruskal-‐Wallis testing are show. Statistically significant differences from the 20-‐30 year age-‐group highlighted in red in bold type *p<0.05, **p<0.01 and ***p<0.001. Data are expressed as medians and interquartile ranges (Units = μg/24 hours). 288 Urine Steroid Ratios (GC/MS): Male Ageing Study Subjects (Medians and IQRs) Age Group (years) N F/E (THF+5aTHF)/THE cortols/cortolones (F+E)/(THF+5aTHF+THE) (THA+5aTHA+THB+5aTHB)/ (THE+THF+5aTHF) (Andros+Etio)/(17HP+PT) (17HP+PT)/ (THE+THF+5aTHF) (PTONE*100)/ (THE+THF+5aTHF) PD/(THE+THF+5aTHF) 5PD/(THE+THF+5aTHF) PT/(THE+THF+5aTHF) 5PT/(THE+THF+5aTHF) DHEA/(THE+THF+5aTHF) THF/5a THF ETIO/ANDRO 20-‐30 30-‐40 40-‐50 50-‐60 60-‐70 >70 13 0.73 (0.64-‐0.74) 0.98 (0.76-‐1.04) 0.39 (0.36-‐0.47) 0.02 (0.02-‐0.03) 0.09 (0.08-‐0.12) 6.01 (4.37-‐6.53) 0.16 (0.13-‐0.18) 0.17 (0.14-‐0.21) 0.04 (0.02-‐0.05) 0.03 (0.02-‐0.05) 0.12 (0.10-‐0.14) 0.08 (0.04-‐0.10) 0.31 (0.06-‐0.45) 0.93 (0.74-‐1.03) 0.66 (0.43-‐0.77) 9 0.70 (0.59-‐0.84) 0.91 (0.80-‐1.11) 0.37 (0.34-‐0.50) 0.02 (0.02-‐0.03) 0.10 (0.10-‐0.13) 4.82 (4.59-‐5.67) 0.14 (0.10-‐0.20) 0.21 (0.17-‐0.22) 0.04 (0.02-‐0.04) 0.06 (0.05-‐0.07) 0.12 (0.08-‐0.15) 0.06 (0.06-‐0.08) 0.39 (0.25-‐0.47) 1.06 (0.59-‐1.24) 0.87 (0.52-‐1.10) 10 0.67 (0.64-‐0.74) 0.85 (0.81-‐1.28) 0.51 (0.40-‐0.57) 0.02 (0.02-‐0.03) 0.09 (0.08-‐0.10) 6.66 (4.27-‐7.91) 0.12 (0.10-‐0.17) 0.19 (0.14-‐0.44) 0.03 (0.02-‐0.03) 0.04 (0.03-‐0.05) 0.11 (0.08-‐0.16) 0.04 (0.04-‐0.05) 0.13 (0.04-‐0.21) 0.92 (0.76-‐1.37) 0.90 (0.61-‐1.15) 4 0.70 (0.57-‐0.78) 1.20 (1.04-‐1.39) 0.42 (0.37-‐0.48) 0.02 (0.02-‐0.02) 0.08 (0.06-‐0.12) 4.56 (4.38-‐4.95) 0.11 (0.09-‐0.13) 0.17 (0.15-‐0.20) 0.02 (0.01-‐0.02) 0.02 (0.02-‐0.04) 0.09 (0.07-‐0.11) 0.02* (0.01-‐0.03) 0.01 (0.00-‐0.04) 0.82 (0.72-‐0.91) 0.80 (0.63-‐1.01) 13 0.65 (0.56-‐0.76) 0.95 (0.85-‐1.03) 0.42 (0.37-‐0.50) 0.02 (0.02-‐0.03) 0.08 (0.07-‐0.10) 4.36 (3.72-‐4.74) 0.10 (0.09-‐0.13) 0.19 (0.18-‐0.26) 0.02 (0.02-‐0.03) 0.02 (0.02-‐0.03) 0.08 (0.07-‐0.09) 0.02** (0.02-‐0.03) 0.02* (0.01-‐0.03) 1.49 (1.10-‐1.83) 0.98 (0.76-‐1.56) 9 0.71 (0.57-‐0.84) 1.03 (0.94-‐1.15) 0.39 (0.34-‐0.46) 0.03 (0.03-‐0.03) 0.10 (0.07-‐0.11) 3.71 (3.43-‐4.98) 0.08* (0.07-‐0.09) 0.18 (0.16-‐0.19) 0.02 (0.02-‐0.04) 0.01 (0.01-‐0.02) 0.06* (0.05-‐0.07) 0.02** (0.01-‐0.02) 0.01** (0.01-‐0.01) 1.09 (1.05-‐1.63) 0.93 (0.81-‐1.21) Overall P-‐value 0.81 0.64 0.79 0.46 0.36 0.06 0.02 0.79 0.24 0.005 0.02 <0.0001 <0.0001 0.13 0.22 Supplementary Table S6.8: Urine Steroid Ratios as analysed by GC/MS for male ageing study subjects (n=58). Overall p-‐value as determined by Kruskal-‐Wallis testing is shown in table. Comparisons between groups made using Dunn’s post-‐test correction. Comparisons with 20-‐30 year age group are highlighted in red in bold type *p<0.05, **p<0.01 and ***p<0.001. Medians and interquartile ranges shown (IQRs). 289 Human Skeletal Muscle Gene Expression: Part 1/3 Female Ageing Study Subjects (ΔCT Medians and IQRs) Age Group (years) Gene IRS-‐1 Akt1 GSK-‐3β DDIT3 11β-‐HSD1 11β-‐HSD2 H6PDH HSP90AA HSP90B1 GH-‐R GHS-‐R IGF-‐I HIF-‐1a eif6 eif2b1 PDK4 IGF-‐IR GADD45a ACACA AR CD36 CDKN1A CEBPB CRYAB CYCS GLUL HSL IRS-‐2 LPL MYCL1 MYF5 <50 >50 P-‐value N=23 N=22 14.75 (14.43-‐15.66) 20.38 (19.59-‐21.97) 11.43 (11.07-‐12.93) 12.40 (11.95-‐14.18) 16.81 (16.47-‐17.55) 19.62 (18.50-‐20.65) 13.66 (13.14-‐14.90) 8.76 (8.24-‐9.98) 12.01 (11.77-‐12.91) 12.63 (12.30-‐13.53) 18.71 (17.92-‐19.91) 14.92 (14.50-‐15.67) 13.61 (13.43-‐14.54) 17.60 (17.24-‐21.01) 11.97 (11.64-‐13.13) 9.52 (8.55-‐11.88) 12.49 (12.23-‐13.33) 17.92 (17.53-‐18.26) 14.48 (14.03-‐14.91) 12.92 (12.40-‐13.87) 8.09 (7.84-‐9.05) 17.96 (16.87-‐18.74) 10.91 (10.50-‐12.90) 5.39 (5.04-‐8.19) 8.77 (8.03-‐12.37) 6.49 (5.83-‐7.68) 20.21 (19.25-‐20.68) 16.22 (15.78-‐17.13) 11.02 (10.52-‐11.62) 21.76 (20.76-‐22.34) 16.27 (15.88-‐16.90) 14.75 (14.24-‐15.31) 21.14 (19.07-‐22.63) 11.58 (10.95-‐13.85) 12.81 (11.47-‐14.36) 15.90 (15.21-‐16.39) 18.86 (18.37-‐19.61) 14.19 (12.80-‐14.77) 8.90 (8.30-‐9.53) 11.93 (11.75-‐12.49) 12.72 (12.23-‐13.62) 17.89 (16.60-‐18.86) 14.76 (13.81-‐15.65) 13.21 (12.65-‐13.73) 18.18 (16.87-‐18.90) 12.04 (11.53-‐13.13) 10.08 (8.53-‐12.08) 12.34 (12.02-‐12.91) 17.14 (16.45-‐17.77) 14.19 (13.69-‐14.71) 13.02 (12.47-‐13.58) 8.03 (7.62-‐8.73) 16.93 (16.39-‐18.28) 11.37 (10.06-‐13.85) 5.79 (4.98-‐8.25) 9.74 (8.61-‐12.82) 6.15 (5.02-‐8.48) 19.33 (18.62-‐20.86) 16.09 (15.62-‐17.07) 10.70 (9.74-‐11.35) 20.62 (19.93-‐21.65) 16.35 (15.64-‐17.03) 0.91 0.61 0.97 0.98 0.0007 0.15 0.99 0.97 0.62 0.95 0.03 0.37 0.02 0.33 0.66 0.76 0.26 0.005 0.18 0.81 0.35 0.10 0.95 0.95 0.14 0.42 0.20 0.50 0.30 0.16 0.83 Supplementary table S6.9 (part I of III): Human skeletal muscle (vastus lateralis biopsy) gene expression in female subjects aged under 50 vs. those aged over 50 years, as analysed by microfluidic array (n=55). Statistically significant differences between age groups are highlighted in bold red type (11β-‐HSD1, HIF-‐1a and GADD45a). Median and inter-‐quartile ranges for delta CT values are shown. 290 Human Skeletal Muscle Gene Expression: Part 2/3 Female Ageing Study Subjects (ΔCT Medians and IQRs) Age Group (years) Gene MyoD PPARD PPARG PPARGC1A PPIB PPP3R2 PSMA2 PSMC1 PSMC2 PSMC4 PSMC5 PSMC6 PSMD1 PSMD11 PSMD12 PSMD14 PSMD2 PSMD3 PSMD4 PSMD6 PSMD7 RPS6KB1 RXRG SLC2A4 SOCS3 SOD1 SREBF1 TGFB1 TNF-‐α TRIM54 <50 N=23 >50 N=22 P-‐value 15.36 (15.06-‐15.93) 13.26 (12.76-‐14.91) 16.00 (14.20-‐17.04) 10.62 (10.17-‐16.64) 14.44 (14.20-‐14.97) 18.04 (16.75-‐18.37) 13.91 (13.56-‐14.87) 9.10 (8.68-‐11.25) 10.30 (9.96-‐12.99) 13.20 (12.85-‐15.90) 11.94 (11.43-‐13.39) 10.69 (10.30-‐13.21) 12.32 (11.76-‐13.58) 10.63 (10.24-‐12.99) 10.89 (10.34-‐13.26) 11.53 (10.72-‐13.27) 11.05 (10.49-‐13.52) 17.33 (16.81-‐18.85) 18.10 (17.45-‐18.59) 11.14 (10.65-‐13.15) 9.85 (9.30-‐12.38) 11.94 (11.43-‐13.70) 10.70 (10.00-‐16.18) 10.87 (10.40-‐14.73) 20.57 (19.17-‐21.69) 9.66 (9.20-‐11.28) 12.58 (11.96-‐13.54) 14.79 (13.97-‐15.37) 19.56 (18.98-‐20.41) 11.86 (11.56-‐16.29) 15.11 (14.56-‐15.63) 13.08 (12.28-‐14.38) 14.47 (12.23-‐16.55) 10.90 (10.27-‐17.32) 14.30 (13.83-‐14.91) 17.14 (16.37-‐18.06) 13.09 (12.60-‐13.80) 9.64 (8.87-‐10.74) 10.77 (10.11-‐12.58) 13.87 (12.77-‐15.18) 12.19 (11.45-‐14.11) 11.34 (10.60-‐12.91) 12.28 (11.69-‐13.69) 11.03 (10.41-‐13.57) 11.48 (10.58-‐13.27) 11.75 (10.93-‐12.56) 11.95 (10.73-‐13.42) 18.14 (16.64-‐19.80) 17.07 (16.12-‐18.13) 11.50 (10.86-‐12.74) 10.40 (9.56-‐12.53) 12.00 (11.21-‐13.77) 11.06 (10.54-‐14.63) 11.31 (10.14-‐14.67) 19.54 (18.72-‐20.31) 9.51 (9.06-‐10.38) 12.40 (11.65-‐12.90) 14.48 (13.77-‐15.04) 18.92 (18.42-‐19.90) 12.46 (11.23-‐19.30) 0.26 0.23 0.06 0.36 0.59 0.08 0.004 0.85 0.78 0.87 0.71 0.67 0.88 0.62 0.55 1.00 0.61 0.62 0.006 0.61 0.46 0.95 0.32 0.91 0.07 0.67 0.28 0.65 0.13 0.99 Supplementary table S6.9 (part II of III): Human skeletal muscle (vastus lateralis biopsy) gene expression in female subjects aged under 50 vs. those aged over 50 years, as analysed by microfluidic array (n=55). Statistically significant differences between age groups are highlighted in bold red type (PSMA2 and PSMD4). Median and inter-‐quartile ranges (IQRs) for delta CT values are shown. 291 Human Skeletal Muscle Gene Expression: Part 3/3 Female Ageing Study Subjects (ΔCT Medians and IQRs) Age Group (years) Gene mTOR MAFbx/Atrogin1 p300 MuRF/TRIM63 Calpain1 Calpain2 USP19 ATF-‐4 Caspase3 eif4BP FOXO1 FOXO3a MYH1 MYH2 MYH4 Myogenin SIRT1 SIRT3 Myostatin SMAD2 SMAD3 SMAD4 SMAD7 ACVR2A ACVR2B relA relB IL-‐6 IL-‐1β NF-‐kappa B Insulin-‐R <50 >50 P-‐value N=23 N=22 8.87 (8.35-‐11.20) 8.86 (8.29-‐13.46) 12.85 (12.28-‐14.02) 11.90 (11.02-‐16.96) 13.26 (12.84-‐15.23) 12.66 (12.22-‐13.52) 10.73 (10.23-‐13.09) 9.11 (8.55-‐11.10) 13.59 (13.09-‐15.24) 10.51 (9.87-‐11.98) 11.76 (11.01-‐12.27) 13.72 (13.01-‐15.21) 7.69 (5.95-‐14.50) 2.37 (1.98-‐11.99) 18.24 (17.40-‐18.85) 10.13 (9.74-‐10.59) 13.65 (13.19-‐15.15) 16.66 (16.31-‐18.50) 12.44 (11.32-‐17.33) 13.99 (13.43-‐14.91) 11.21 (10.82-‐13.51) 11.51 (10.91-‐13.33) 16.83 (15.88-‐17.70) 14.19 (13.63-‐15.32) 15.38 (14.89-‐18.01) 17.86 (16.65-‐18.91) 22.18 (21.64-‐22.87) 17.34 (16.55-‐18.06) 19.89 (19.09-‐21.58) 14.18 (13.62-‐15.38) 12.68 (12.40-‐14.64) 9.11 (8.63-‐12.08) 9.48 (8.19-‐13.52) 13.17 (12.41-‐14.44) 11.71 (10.80-‐12.70) 13.46 (12.54-‐14.75) 12.32 (12.09-‐14.34) 11.33 (10.25-‐12.99) 9.44 (8.81-‐10.77) 13.96 (13.50-‐14.83) 10.30 (9.58-‐11.33) 11.36 (10.68-‐12.71) 13.57 (13.09-‐15.30) 9.52 (5.74-‐16.65) 3.64 (1.95-‐12.07) 17.28 (16.69-‐18.17) 10.21 (9.61-‐13.30) 13.54 (13.09-‐13.89) 17.23 (16.22-‐18.69) 12.87 (12.20-‐15.23) 14.18 (13.54-‐14.86) 11.33 (10.51-‐13.87) 11.96 (10.98-‐14.17) 15.92 (15.46-‐17.58) 14.42 (13.46-‐15.10) 15.46 (14.28-‐17.16) 17.56 (16.75-‐19.04) 22.27 (21.58-‐22.90) 16.89 (14.11-‐18.49) 20.99 (20.06-‐21.74) 14.20 (13.72-‐14.60) 13.14 (12.21-‐14.58) 0.23 0.74 0.64 0.51 0.89 0.56 0.61 0.53 0.54 0.17 0.48 0.91 0.50 0.56 <0.05 0.84 0.45 0.66 0.54 0.89 0.95 0.46 0.25 0.94 0.36 0.91 0.96 0.61 0.15 0.71 0.96 Supplementary table S6.9 (part III of III): Human skeletal muscle (vastus lateralis biopsy) gene expression in female subjects aged under 50 vs. those aged over 50 years, as analysed by microfluidic array (n=55). Statistically significant differences between age groups are highlighted in bold red type (MYH4). Median and inter-‐quartile ranges for delta CT values are shown. 292 Human Skeletal Muscle Gene Expression: Part 1/3 Male Ageing Study Subjects (ΔCT Medians and IQRs) Age Group (years) Gene IRS-‐1 Akt1 GSK-‐3β DDIT 11β-‐HSD1 11β-‐HSD2 H6PDH HSP90AA HSP90B1 GH-‐Receptor GHS-‐Receptor IGF-‐I HIF-‐1a eif6 eif2b1 PDK4 IGF-‐I Receptor GADD45a ACACA AR CD36 CDKN1A CEBPB CRYAB CYCS GLUL HSL IRS-‐2 LPL MYCL1 MYF5 <50 N=17 >50 N=7 13.82 (13.14-‐14.39) 20.31 (18.65-‐22.37) 11.30 (11.16-‐11.68) 12.65 (11.96-‐13.35) 16.35 (15.87-‐16.92) 18.68 (18.17-‐19.47) 13.45 (13.27-‐13.92) 8.47 (8.08-‐8.91) 12.32 (11.89-‐12.65) 12.47 (11.83-‐12.95) 19.09 (18.39-‐20.62) 15.34 (14.96-‐15.60) 13.61 (13.21-‐13.99) 17.55 (16.46-‐18.52) 11.87 (11.66-‐12.12) 10.68 (9.56-‐11.76) 12.63 (12.25-‐12.85) 17.43 (16.70-‐18.24) 14.83 (14.58-‐15.07) 13.07 (12.85-‐13.33) 8.66 (8.31-‐9.00) 18.66 (18.20-‐19.58) 10.88 (10.37-‐11.20) 5.39 (4.97-‐5.59) 8.40 (7.90-‐8.84) 6.67 (6.09-‐7.24) 19.93 (19.15-‐20.40) 16.27 (15.78-‐17.49) 12.08 (11.63-‐12.59) 21.03 (20.11-‐21.54) 16.21 (15.84-‐16.50) 13.91 (13.53-‐14.83) 20.32 (18.78-‐21.70) 10.98 (10.67-‐11.46) 12.21 (11.51-‐12.95) 16.04 (15.84-‐16.43) 18.19 (17.33-‐20.75) 12.82 (12.59-‐13.12) 8.51 (8.37-‐8.86) 11.91 (11.55-‐12.26) 12.21 (12.10-‐12.75) 17.99 (17.58-‐20.07) 15.08 (14.68-‐15.27) 13.30 (12.69-‐13.76) 17.13 (16.67-‐18.18) 11.67 (11.19-‐12.01) 11.35 (9.88-‐11.62) 12.24 (12.00-‐12.68) 16.58 (16.30-‐16.79) 14.53 (13.94-‐14.93) 13.08 (12.27-‐13.26) 8.60 (8.09-‐8.97) 17.99 (16.11-‐18.52) 10.38 (10.25-‐11.43) 5.17 (4.47-‐5.69) 8.51 (7.88-‐8.69) 5.89 (5.21-‐7.68) 18.73 (17.47-‐19.61) 15.97 (15.60-‐17.24) 11.99 (10.90-‐12.25) 20.67 (20.62-‐22.82) 16.46 (15.61-‐16.64) P-‐value 0.53 0.80 0.13 0.23 0.48 0.90 0.002 1.00 0.04 0.70 0.15 0.25 0.31 0.61 0.18 0.66 0.10 0.04 0.18 0.66 0.85 0.04 0.41 0.53 0.95 0.53 0.10 0.28 0.57 0.32 0.66 Supplementary table S6.10 (part I of III): Human skeletal muscle (vastus lateralis biopsy) gene expression in male subjects aged under 50 vs. those aged over 50 years, as analysed by microfluidic array (n=24). Statistically significant differences between age groups are highlighted in bold red type (H6PDH, HSP90B1, GADD45a and CDKN1A). Median and inter-‐quartile ranges (IQRs) for delta CT values are shown. 293 Human Skeletal Muscle Gene Expression: Part 2/3 Male Ageing Study Subjects (ΔCT Medians and IQRs) Age Group (years) Gene MyoD PPARD PPARG PPARGC1A PPIB PPP3R2 PSMA2 PSMC1 PSMC2 PSMC4 PSMC5 PSMC6 PSMD1 PSMD11 PSMD12 PSMD14 PSMD2 PSMD3 PSMD4 PSMD6 PSMD7 RPS6KB1 RXRG SLC2A4 SOCSS3 SOD1 SREBF1 TGFB1 TNF-‐α TRIM54 <50 N=17 >50 N=7 P-‐value 14.71 (13.92-‐16.01) 12.98 (12.61-‐13.31) 16.38 (16.10-‐16.81) 10.47 (10.29-‐10.73) 14.81 (14.41-‐15.24) 18.05 (17.29-‐18.82) 13.81 (13.49-‐14.14) 8.91 (8.57-‐9.35) 10.28 (9.96-‐10.51) 13.29 (12.79-‐13.45) 11.50 (11.15-‐11.83) 10.58 (10.22-‐10.98) 12.03 (11.81-‐12.35) 10.77 (10.46-‐10.89) 10.62 (10.15-‐10.94) 10.78 (10.50-‐11.11) 10.75 (10.37-‐11.06) 16.99 (16.33-‐17.49) 17.76 (17.40-‐18.10) 10.49 (9.98-‐10.93) 9.48 (9.24-‐9.87) 11.41 (10.98-‐11.87) 10.38 (9.91-‐10.65) 10.69 (10.49-‐11.03) 21.00 (20.03-‐22.11) 9.46 (9.25-‐9.60) 12.49 (12.17-‐13.05) 14.90 (14.50-‐15.50) 19.83 (18.85-‐21.47) 11.73 (10.95-‐12.00) 14.27 (13.66-‐15.56) 12.96 (12.50-‐13.02) 16.57 (15.47-‐17.01) 10.60 (9.94-‐10.87) 14.46 (13.91-‐14.69) 17.80 (16.37-‐18.09) 13.74 (12.89-‐14.02) 8.87 (8.42-‐9.08) 10.40 (9.50-‐10.48) 12.85 (12.46-‐13.09) 11.50 (11.15-‐11.70) 10.69 (10.13-‐10.86) 11.50 (11.34-‐12.12) 10.40 (10.17-‐10.91) 10.62 (10.47-‐10.96) 11.17 (11.06-‐11.29) 10.49 (10.38-‐10.72) 16.66 (15.53-‐17.39) 16.87 (16.45-‐17.66) 10.73 (10.50-‐11.23) 9.52 (9.35-‐9.72) 11.37 (10.67-‐11.64) 10.46 (9.90-‐10.96) 10.56 (10.04-‐10.81) 20.40 (19.76-‐21.68) 9.51 (9.13-‐9.68) 12.55 (12.15-‐12.74) 14.54 (13.91-‐15.24) 19.39 (18.79-‐21.02) 11.23 (11.15-‐11.96) 0.31 0.37 0.80 0.95 0.06 0.31 0.31 0.45 0.90 0.16 0.75 0.61 0.23 0.31 0.90 0.13 0.25 0.41 0.04 0.34 0.95 0.66 0.90 0.34 0.62 0.95 0.66 0.53 0.70 0.53 Supplementary table S6.10 (part II of III): Human skeletal muscle (vastus lateralis biopsy) gene expression in male subjects aged under 50 vs. those aged over 50 years, as analysed by microfluidic array (n=24). Statistically significant differences between age groups are highlighted in bold red type (PSMD4). Median and inter-‐quartile ranges for delta CT values are shown. 294 Human Skeletal Muscle Gene Expression: Part 3/3 Male Ageing Study Subjects (ΔCT Medians and IQRs) Age Group (years) Gene mTOR MAFbx/Atrogin1 p300 MuRF1/TRIM63 Calpain1 Calpain2 USP19 ATF-‐4 Caspase3 eiF4BP FOXO1 FOXO3a MYH1 MYH2 MYH4 Myogenin SIRT1 SIRT3 Myostatin SMAD2 SMAD3 SMAD4 SMAD7 ACVR2A ACVR2B relA relB IL-‐6 IL-‐1β NF-‐kappa B Insulin Receptor <50 N=17 >50 N=7 P-‐value 8.71 (8.51-‐9.07) 8.14 (7.92-‐8.57) 12.86 (12.54-‐13.29) 11.84 (11.15-‐12.66) 12.86 (12.69-‐13.10) 12.19 (12.05-‐12.85) 10.43 (10.25-‐10.72) 8.92 (8.62-‐9.22) 13.28 (12.88-‐13.49) 10.44 (10.10-‐10.77) 12.07 (11.60-‐12.81) 14.22 (13.74-‐14.49) 5.96 (4.85-‐6.83) 1.93 (1.49-‐2.38) 16.01 (15.33-‐16.69) 10.12 (9.69-‐10.70) 13.83 (13.39-‐14.01) 16.85 (15.85-‐17.07) 11.92 (11.01-‐12.99) 13.71 (13.51-‐14.08) 10.85 (10.55-‐11.23) 11.14 (10.88-‐11.60) 16.37 (15.53-‐16.94) 14.12 (13.69-‐14.51) 15.54 (14.84-‐15.87) 16.93 (16.54-‐17.44) 21.89 (20.57-‐22.34) 17.52 (16.38-‐18.17) 20.64 (19.47-‐21.48) 13.86 (13.73-‐14.42) 12.78 (12.50-‐13.06) 8.46 (8.05-‐8.70) 8.35 (7.33-‐8.72) 12.42 (12.11-‐12.98) 11.44 (11.21-‐12.60) 12.81 (12.29-‐12.84) 12.20 (11.64-‐12.72) 10.26 (10.23-‐10.64) 8.81 (8.20-‐9.02) 13.30 (13.16-‐13.47) 10.78 (10.33-‐11.15) 11.08 (10.77-‐13.09) 13.55 (12.93-‐14.58) 5.12 (3.97-‐6.65) 1.81 (1.26-‐2.08) 15.93 (14.44-‐16.43) 10.12 (9.61-‐10.42) 13.20 (12.61-‐13.65) 16.09 (15.66-‐16.47) 11.19 (10.19-‐12.44) 13.65 (13.14-‐13.91) 10.38 (9.83-‐10.62) 10.87 (10.72-‐11.15) 15.77 (15.18-‐16.70) 13.76 (13.34-‐14.13) 14.93 (14.84-‐15.24) 15.94 (15.47-‐16.67) 20.71 (20.37-‐21.34) 17.47 (15.76-‐17.69) 21.71 (19.64-‐22.53) 13.79 (13.39-‐14.02) 12.62 (12.43-‐12.82) 0.13 1.00 0.11 0.80 0.14 0.41 0.34 0.61 0.70 0.18 0.10 0.11 0.37 0.23 0.52 0.70 0.08 0.04 0.18 0.31 0.01 0.16 0.31 0.18 0.11 0.009 0.14 0.90 0.61 0.20 0.37 Supplementary table S6.10 (part III of III): Human skeletal muscle (vastus lateralis biopsy) gene expression in male subjects aged under 50 vs. those aged over 50 years, as analysed by microfluidic array (n=24). Statistically significant differences between age groups are highlighted in bold red type (SIRT3, SMAD3 and relA). Median and inter-‐quartile ranges for delta CT values are shown. 295 Female Subjects Patient Characteristics Age (years) BMI (kg/m2) Fat Mass (kg) Lean Mass (kg) Serum biochemistry IGF-‐I DHEAS Testosterone SHBG 9am Cortisol Skeletal Muscle mRNA Expression 11β-‐HSD1 (AU) H6PDH (AU) Urine Steroid GC/MS Analysis (THF+5αTHF/THE) (Cortols/Cortolones) Total F Metabolites (μg/24h) F/E THF/5αTHF Subject Characteristics by Grip Strength Dynamometry (Medians and IQRs) Below Median Grip Above Median Grip P-‐value Strength (28kg) Strength (28kg) 52 (32-‐65) 24.2 (22.1-‐26.9) 20.5 (16.5-‐24.4) 39.9 (35.1-‐42.2) 46 (28-‐57) 24.7 (21.3-‐27.1) 21.3 (17.1-‐25.2) 42.6 (40.4-‐45.9) 0.14 0.98 0.89 0.0007 15.6 (12.5-‐24.4) 2.6 (1.5-‐3.6) 0.6 (0.4-‐0.8) 65.6 (46.5-‐95.1) 227 (183-‐344) 20.7 (15.7-‐23.9) 3.3 (2.2-‐4.6) 0.7 (0.5-‐1.0) 59.7 (36.4-‐74.6) 236 (196-‐323) 0.27 0.11 0.14 0.16 0.99 0.01 (0.01-‐0.02) 0.05 (0.02-‐0.13) 0.01 (0.01-‐0.01) 0.08 (0.04-‐0.11) 0.34 0.40 0.82 (0.67-‐0.92) 0.41 (0.32-‐0.51) 6317 (4075-‐7862) 0.88 (0.74-‐1.12) 0.43 (0.36-‐0.51) 5844 (4518-‐6891) 0.06 0.42 0.79 0.63 (0.53-‐0.78) 1.51 (1.17-‐2.20) 0.61 (0.51-‐0.68) 1.37 (1.05-‐1.79) 0.27 0.28 Supplementary table S6.11: Subject characteristics in female ageing study participants as divided into 2 groups depending on maximum grip strength (below and above median maximal grip strength dynamometry measure of 28.00kg) (n=77, except in analyses involving gene expression when n=55). Characteristics include general demographics, anthropometry, body composition, skeletal muscle gene expression and urine steroid GC/MS data. P-‐values shown are from Mann Whitney tests with statistically significant results highlighted in bold. (THF+5αTHF/THE) = (tetra-‐ hydrocortisol+5α-‐tetrahydrocortisol)/tetrahydrocortisone. F= cortisol, F/E = cortisol/cortisone, THF/5αTHF = tetrahydrocortisol/5α-‐tetrahydrocortisol. 296 Male Subjects Patient Characteristics Age (years) BMI (kg/m2) Fat Mass (kg) Lean Mass (kg) Serum biochemistry IGF-‐I DHEAS Testosterone SHBG 9am Cortisol Skeletal Muscle mRNA Expression 11β-‐HSD1 (AU) H6PDH (AU) Urine Steroid GC/MS Analysis (THF+5αTHF/THE) (Cortols/Cortolones) Total F Metabolites (μg/24h) F/E THF/5αTHF Subject Characteristics by Grip Strength Dynamometry (Medians and IQRs) Below Median Grip Above Median Grip P-‐value Strength (43kg) Strength (43kg) 58 (33-‐73) 24.8 (23.4-‐26.5) 16.1 (13.5-‐21.3) 53.2 (49.1-‐62.8) 44 (27-‐61) 26.0 (23.6-‐27.7) 17.5 (12.6-‐20.8) 59.1 (57.5-‐68.1) <0.05 0.30 0.78 0.006 18.2 (15.6-‐23.0) 4.4 (2.5-‐7.6) 13.8 (11.2-‐17.3) 37.6 (27.6-‐55.1) 281 (221-‐369) 20.5 (16.2-‐26.6) 6.4 (3.7-‐8.1) 17.4 (12.6-‐20.4) 32.0 (25.0-‐39.1) 330 (243-‐380) 0.19 0.12 0.02 0.18 0.52 0.01 (0.01-‐0.01) 0.11 (0.08-‐0.12) 0.01 (0.01-‐0.02) 0.09 (0.08-‐0.10) 0.32 0.43 0.98 (0.80-‐1.22) 0.47 (0.34-‐0.55) 9095 (7341-‐12268) 0.95 (0.77-‐1.09) 0.39 (0.35-‐0.48) 9180 (6515-‐12474) 0.40 0.29 0.83 0.70 (0.57-‐0.79) 1.06 (0.86-‐1.21) 0.67 (0.59-‐0.77) 1.08 (0.79-‐1.51) 0.78 0.75 Supplementary table S6.12: Subject characteristics in male ageing study participants as divided into 2 groups depending on maximum grip strength (below and above median maximal grip strength dynamometry measure of 43.00kg) (n=58, except in analyses involving gene expression when n=24). Characteristics include general demographics, anthropometry, body composition, skeletal muscle gene expression and urine steroid GC/MS data. P-‐values shown are from Mann Whitney tests with statistically significant results highlighted in bold. (THF+5αTHF/THE) = (tetra-‐ hydrocortisol+5α-‐tetrahydrocortisol)/tetrahydrocortisone. F= cortisol, F/E = cortisol/cortisone, THF/5αTHF = tetrahydrocortisol/5α-‐tetrahydrocortisol. 297 Female Subjects Patient Characteristics Age (years) Fat Mass (kg) Lean Mass (kg) Serum biochemistry IGF-‐I DHEAS Testosterone SHBG 9am Cortisol Skeletal Muscle mRNA Expression 11β-‐HSD1 (AU) H6PDH (AU) Urine Steroid GC/MS Analysis (THF+5αTHF/THE) (Cortols/Cortolones) Total F Metabolites (μg/24h) F/E THF/5αTHF Subject Characteristics by Body Mass Index (Medians and IQRs) Below Median BMI Above Median BMI P-‐value (24.5kg/m2) (24.5kg/m2) 35 (25-‐63) 16.9 (14.5-‐20.2) 39.0 (34.6-‐42.4) 51 (46-‐62) 24.3 (22.8-‐27.4) 42.5 (40.5-‐45.4) 0.01 <0.0001 0.001 23.3 (19.6-‐26.8) 3.3 (2.5-‐4.6) 0.7 (0.6-‐1.0) 61.6 (43.4-‐74.6) 265 (204-‐435) 14.4 (11.7-‐18.6) 2.1 (1.0-‐3.3) 0.6 (0.4-‐0.8) 67.8 (45.6-‐84.4) 218 (184-‐297) <0.0001 0.0002 0.01 0.41 0.13 0.01 (0.00-‐0.01) 0.10 (0.03-‐0.11) 0.01 (0.01-‐0.03) 0.05 (0.04-‐0.12) 0.37 0.48 0.81 (0.67-‐0.93) 0.42 (0.35-‐0.50) 5060.00 (4075.00-‐ 7173.00) 0.65 (0.58-‐0.82) 1.52 (1.15-‐2.37) 0.87 (0.73-‐1.06) 0.42 (0.32-‐0.54) 6562.00 (4519.00-‐ 7985.00) 0.58 (0.51-‐0.68) 1.43 (1.08-‐1.75) 0.23 0.97 0.12 0.03 0.38 Supplementary table S6.13: Subject characteristics in female ageing study participants as divided into 2 groups depending on BMI (below and above median BMI measure of 24.46 kg/m2)(n=77, except in analyses involving gene expression when n=55). Characteristics include general demographics, anthropometry, body composition, skeletal muscle gene expression and urine steroid GC/MS data. P-‐values shown are from Mann Whitney tests with statistically significant results highlighted in bold. (THF+5αTHF/THE) = (tetra-‐hydrocortisol+5α-‐ tetrahydrocortisol)/tetrahydrocortisone. F= cortisol, F/E = cortisol/cortisone, THF/5αTHF = tetrahydrocortisol/5α-‐tetrahydrocortisol. 298 Male Subjects Patient Characteristics Age (years) Fat Mass (kg) Lean Mass (kg) Serum biochemistry IGF-‐I DHEAS Testosterone SHBG 9am Cortisol Skeletal Muscle mRNA Expression 11β-‐HSD1 (AU) H6PDH (AU) Urine Steroid GC/MS Analysis (THF+5αTHF/THE) (Cortols/Cortolones) Total F Metabolites (μg/24h) F/E THF/5αTHF Subject Characteristics by Body Mass Index (Medians and IQRs) Below Median BMI Above Median BMI P-‐value (20.1kg/m2) (20.1kg/m2) 36 (27-‐68) 13.6 (11.7-‐15.9) 53.2 (50.1-‐58.7) 50 (41-‐64) 18.6 (16.9-‐23.7) 62.7 (57.7-‐69.0) 0.21 <0.0001 <0.0001 19.7 (15.8-‐22.8) 5.9 (2.6-‐9.2) 17.3 (13.1-‐19.8) 33.3 (23.0-‐52.0) 311 (265-‐392) 19.4 (16.0-‐25.1) 5.0 (3.2-‐7.0) 14.0 (11.9-‐18.9) 33.7 (28.1-‐42.0) 293 (219-‐368) 0.60 0.47 0.25 0.81 0.29 0.01 (0.01-‐0.02) 0.10 (0.08-‐0.11) 0.01 (0.01-‐0.02) 0.10 (0.07-‐0.16) 0.60 0.56 0.98 (0.78-‐1.03) 0.47 (0.36-‐0.52) 8216 (6038-‐11079) 0.97 (0.78-‐1.20) 0.39 (0.33-‐0.51) 9665 (7446-‐13032) 0.70 0.22 0.19 0.71 (0.61-‐0.80) 1.02 (0.84-‐1.36) 0.68 (0.58-‐0.77) 1.07 (0.73-‐1.39) 0.45 0.90 Supplementary table S6.14: Subject characteristics in male ageing study participants as divided into 2 groups depending on BMI (below and above median BMI measure of 24.46 kg/m2)(n=58, except in analyses involving gene expression when n=24). Characteristics include general demographics, anthropometry, body composition, skeletal muscle gene expression and urine steroid GC/MS data. P-‐values shown are from Mann Whitney tests with statistically significant results highlighted in bold. (THF+5αTHF/THE) = (tetra-‐hydrocortisol+5α tetrahydrocortisol)/ tetrahydrocortisone. F= cortisol, F/E = cortisol/cortisone, THF/5αTHF = tetrahydrocortisol/5α-‐ tetrahydrocortisol. 299 Supplementary Figures Supplementary Figure S.5.1: Response to glucose tolerance test (GTT) and calculated area under the curve (AUC) was measured in C57BL/6 mice. Aged WT mice were less tolerant to glucose challenge with increased AUC values compared to young WT mice. Aged 11β-‐HSD1 KO mice had improved glucose tolerance compared to the age-‐matched WT group. Means and S.E.s shown (n=6-‐8 per group). *P<0.05 vs. young WT and §P<0.05 vs. Old WT. 300 Supplementary Figure S.5.2: C57BL/6 wildtype and 11β-‐HSD1 knockout mice were treated with CORT (100μg/mL, 0.66% ethanol), 11DHC (100μg/mL, 0.66% ethanol) or vehicle (0.66% ethanol) via drinking water for 5 weeks (n=7-‐9). Assessment of fasting insulin (A), glucose tolerance in 11β-‐ HSD1 KO mice and calculated area under curve (AUC) for glucose tolerance data (B). Glucose tolerance in WT (C) and 11β-‐HSD1KO mice (D). Statistics analysed using two-‐way ANOVA (***p<0.001 vs. WT vehicle; ∅∅p<0.01 vs. WT CORT). 11DHC = 11-‐dehydrocorticosterone, CORT = corticosterone. 301 Supplementary figure S6.1: Correlations between serum androgen levels and markers of global 11β-‐HSD1 activity as measured by urine GC/MS analysis in men (n=58). In male participants in the ageing study, a) testosterone and b) DHEAS were inversely correlated with urine (THF+5αTHF)/THE ratios. In addition an inverse correlation was seen between testosterone and urinary cortol/cortolone ratios in men. Full-‐line = linear regression. r-‐values represent correlation coefficients derived from Spearman Analysis. 302 Conference Proceedings and Publications 303 Conference Proceedings Oral Communications Hassan-‐Smith ZK, Morgan SA, Sherlock M, Hughes B, Lavery G, Tomlinson JW, Stewart PM. Pre-‐receptor glucocorticoid metabolism across human ageing: the impact of gender and menopausal status. BES 2014, Liverpool, UK. Hassan-‐Smith ZK, Morgan SA, Bujalska I, Cooper MS, Lavery GG, Stewart PM. 11ß-‐HSD1KO mice are protected from glucocorticoid dependent age-‐associated muscle atrophy. Top Scoring Oral Communication (Basic Science) in the Young Endocrinologists’ Prize Session BES 2013, Harrogate, UK. Hassan-‐Smith ZK, Johnson AP, Arlt W, Toogood AA, Cooper MS, Sherlock M, Stewart PM. Surgical Management of Cushing Disease: The Birmingham, UK, Experience 1988-‐2009. ENDO 2011, Boston, Mass, US. Poster Presentations Hassan-‐Smith Z, Morgan S, Sherlock M, Bujalska I, Tomlinson J, Lavery G, Stewart P. 11β-‐hydroxysteroid dehydrogenase type 1 and age-‐associated muscle weakness in mice: implications for human ageing. Spring Meeting for Clinician Scientists in Training at the Academy of Medical Sciences 2014. Abstract published in The Lancet, 383, PS53. Hassan-‐Smith ZK, Morgan SA, Sherlock M, Crabtree N, Bujalska I, Cooper MS, Tomlinson JW, Lavery GG, Stewart PM. Identification of an 11 Beta-‐ Hydroxysteroid Dehydrogenase Type 1 Regulated Gene Expression Profile Common to Glucocorticoid and Age Associated Myopathies. ENDO 2013, San Francisco, US. Hassan-‐Smith ZK, Johnson AP, Toogood AA, Arlt W, Sherlock M, Stewart PM. 20 year experience in the surgical management of Cushing’s Disease in a UK tertiary referral centre. BES 2011, Birmingham, UK. Publications Arising from this thesis Hassan-‐Smith ZK, Sherlock M, Reulen RC, Arlt W, Ayuk J, Toogood AA, Cooper MS, Johnson AP, Stewart PM. Outcome of Cushing’s disease following transphenoidal surgery in a single center over 20 years. J Clin Endocrinol Metab. 2012 Apr;97(4):1194-‐201. Related to this thesis Hassan-‐Smith Z, Stewart PM. Inherited forms of mineralocorticoid hypertension. Curr Opin Endocrinol Diabetes Obes. 2011 Jun;18(3):177-‐85. 304 Tiganescu A, Tahrani A, Morgan S, Otranto M, Desmouliere A, Abrahams L, Hassan-‐Smith Z, Walker E, Rabbitt E, Cooper M, Amrein K, Lavery G, Stewart P. 11ß-‐hydroxysteroid dehydrogenase blockade prevents age-‐induced skin structure and function defects. Journal of Clinical Investigation, 2013 June 3 [Epub ahead of print]. Douglas MD, Hassan-‐Smith Z, Ruff RL. Endocrine Myopathies (Book Chapter). Neuromuscular disorders in clinical practice. Edited by Katirji B, Kaminski HJ, Ruff RL. 2nd Edition (Springer) 2013. 305


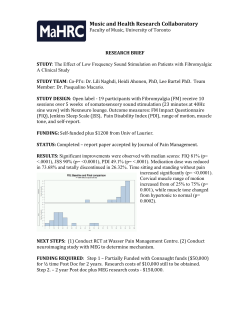
© Copyright 2026