
Growth patterns among HIV-exposed infants receiving nevirapine prophylaxis in Pune, India
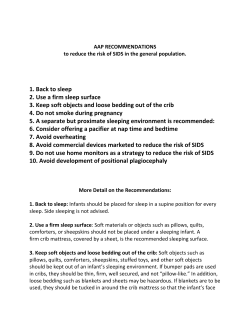
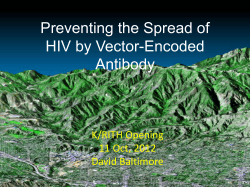
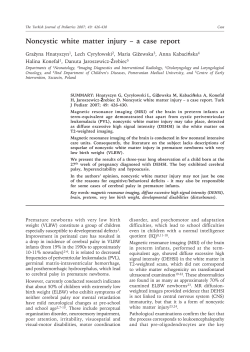
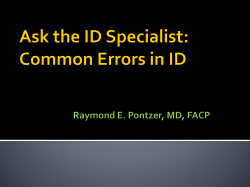
Ram et al. BMC Infectious Diseases 2012, 12:282
http://www.biomedcentral.com/1471-2334/12/282
RESEARCH ARTICLE
Open Access
Growth patterns among HIV-exposed infants
receiving nevirapine prophylaxis in Pune, India
Malathi Ram1*, Nikhil Gupte2, Uma Nayak5, Aarti A Kinikar3, Mangesh Khandave2, Anita V Shankar1,
Jayagowri Sastry6, Robert C Bollinger1,4 and Amita Gupta1,4 For SWEN India and BJMC-JHU Clinical Trials Study Team
Abstract
Background: India has among the highest rates of infant malnutrition. Few studies investigating the growth
patterns of HIV-exposed infants in India or the impact of timing of HIV infection on growth in settings such as India
exist.
Methods: We used data from the Six Week Extended Nevirapine (SWEN) trial to compare the growth patterns of
HIV-infected and HIV-exposed but uninfected infants accounting for timing of HIV infection, and to identify risk
factors for stunting, underweight and wasting. Growth and timing of HIV infection were assessed at weeks 1, 2, 4, 6,
10, 14 weeks and 6, 9, 12 months of life. Random effects multivariable logistic regression method was used to
assess factors associated with stunting, underweight and wasting.
Results: Among 737 HIV-exposed infants, 93 (13%) were HIV-infected by 12 months of age. Among HIV-infected
and uninfected infants, baseline prevalence of stunting (48% vs. 46%), underweight (27% vs. 26%) and wasting
(7% vs. 11%) was similar (p>0.29), but by 12 months stunting and underweight, but not wasting, were significantly
higher in HIV-infected infants (80% vs. 56%, 52% vs. 29%, p< 0.0001; 5% vs. 6%, p=0.65, respectively). These
differences rapidly manifested within 4–6 weeks of birth. Infants infected in utero had the worst growth outcomes
during the follow-up period. SWEN was associated with non-significant reductions in stunting and underweight
among HIV-infected infants and significantly less wasting in HIV-uninfected infants. In multivariate analysis, maternal
CD4 < 250, infant HIV status, less breastfeeding, low birth weight, non-vaginal delivery, and infant gestational age
were significant risk factors for underweight and stunting.
Conclusion: Baseline stunting and underweight was high in both HIV-infected and uninfected infants; growth
indices diverged early and were impacted by timing of infection and SWEN prophylaxis. Early growth monitoring of
all HIV-exposed infants is an important low-cost strategy for improving health and survival outcomes of
these infants.
Trial Registration: NCT00061321
Keywords: HIV-exposed infants, Growth patterns, India, Extended use of nevirapine, Risk factors,
Timing of HIV Infection
* Correspondence: [email protected]
1
Johns Hopkins Bloomberg School of Public Health, Dept. of International
Health/GDEC, Suite W5506, 615 N. Wolfe Street, Baltimore, MD 21205, USA
Full list of author information is available at the end of the article
© 2012 Ram et al.; licensee BioMed Central Ltd. This is an Open Access article distributed under the terms of the Creative
Commons Attribution License (http://creativecommons.org/licenses/by/2.0), which permits unrestricted use, distribution, and
reproduction in any medium, provided the original work is properly cited.
Ram et al. BMC Infectious Diseases 2012, 12:282
http://www.biomedcentral.com/1471-2334/12/282
Background
Poor growth, as a result of inadequate nutritional intake
and/or increased susceptibility to infections, poses an
increased risk of mortality among children [1]. Data
from 53 developing countries found that the percentage
of child deaths attributable to the potentiating effects of
malnutrition ranged from 13% to 67%, and that 83% of
malnutrition-related deaths were related to mild-tomoderate malnutrition (weight-for-age <80% of median)
rather than severe malnutrition (weight-for-age <60% of
median), highlighting the significant impact of nutritional status on child survival [2-5].
HIV-infection further negatively impacts growth and
manifests as weight loss as well as compromised ponderal and linear growth [6,7]. Among infants exposed to
HIV- infection in utero, during birth, or postnatally
through breastfeeding, growth faltering or failure is now
recognized as early markers of HIV infection, disease
progression and as a prognostic tool for survival [7,8].
Abnormal growth patterns in HIV-infected children
have been documented in both developed and developing country settings [9-20]. For children that are already
suffering with poor nutritional status, concurrent HIV
infection poses substantial additional risks for morbidity
and mortality.
Despite the significant literature on infant growth and
HIV in resource-constrained settings, a recent review
noted that the vast majority of research comes from
countries of Africa and that very few studies have incorporated the data of timing of transmission (assessed by
repeated PCR measures) to assess differences in growth
[9]. India has the world’s third largest number of HIVinfected individuals, nearly half of the pediatric population lives in poverty and malnutrition of infants and
young children is a significant public health problem
(38% of those under 3 years of age are stunted, 19%
wasted, and 46% underweight) [21]; these proportions
are higher than in most countries in Africa. To date,
there have been no studies in India comparing growth
patterns of HIV-infected infants with those of HIVexposed but uninfected infants. Furthermore, the factors
associated with poor growth among HIV-exposed infants
in India could be very different from those evidenced in
African countries given the higher prevalence of malnutrition in poor Indian children in general.
The objectives of our study were to: a) compare the
growth patterns of HIV-infected and HIV-exposed but
uninfected infants and account for timing of HIV infection, and b) identify risk factors for stunting, underweight and wasting. We used data from the Six Week
Extended Nevirapine (SWEN) prevention of mother to
child HIV transmission trial, India’s only Phase III trial
to examine HIV prevention in breastfed infants, to address our objectives. We also assessed the impact of the
Page 2 of 11
new WHO recommended strategy of extended nevirapine prophylaxis given to breastfed infants on growth indices as previously we had noted a mortality benefit
among children exposed to extended nevirapine and we
hypothesized that this benefit may be manifested by
improved growth patterns independent of HIV status.
Methods
Population and study design
The SWEN study enrolled HIV-infected pregnant
women who were attending the antenatal clinic and/or
delivery ward of Sassoon General Hospital, the urban
public hospital of Byramji Jeejeebhoy Medical College
(BJMC) located in Pune, Maharashtra, India between
2002 and 2007. The details of this trial have been published elsewhere [22]. HIV-infected women who indicated an intention to breastfeed their infants and
provided informed consent were eligible for study enrollment. Written consent was obtained where possible;
for eligible women who could not read, consent was
obtained orally and documented in writing by a witness.
The criteria for enrollment included: intention to breastfeed their infant, ≥18 years of age, gestational age ≥24
weeks, hemoglobin > 7.5 gm/dl, creatinine <1.2 mg/dl,
liver function tests < 3 times the upper limit of normal,
and lack of serious pregnancy complications. Live-born
infants were randomized to receive either a single dose
nevirapine (SdNVP) within 72 hours of birth or an
extended nevirapine prophylaxis (SWEN) during the
first six weeks of life if they met the following criteria
within 7 days after birth: hemoglobin > 7.5 gm/dl, SGPT
< 5 times upper limit of normal values, and serum creatinine <1.0 mg/dl. All infants were also given daily multivitamins (VI-SYNERAL) from day 8 to 42 days after
birth. In case of twin birth, both the siblings were enrolled in the same cohort and received the same random
treatment assignment.
Follow-up procedures
Mother-infant pairs were followed prospectively for up
to 12 months postpartum with eleven scheduled visits
occurring at 1, 2, 3, 4, 5, 6, 10, 14 weeks and at 6, 9 and
12 months. At each visit, except weeks 3 and 5, anthropometric measurements, clinical assessments and laboratory investigations were completed. Determination
of qualitative HIV infection was done with an in-house,
externally validated HIV DNA PCR assay developed at
the National AIDS Research Institute in Pune, India. A
positive DNA PCR test was confirmed by a quantitative
HIV-1 RNA PCR of >5000 copies/ml during the next
follow-up visit using Roche Amplicor HIV-1 Monitor
test, version 1.5 (F Hoffmann-La Roche Ltd, Basel,
Switzerland), and was externally quality assured as
described elsewhere [22]. An infant was determined to
Ram et al. BMC Infectious Diseases 2012, 12:282
http://www.biomedcentral.com/1471-2334/12/282
be infected with HIV if two independent HIV PCR tests
were positive at different time points or if one test was
HIV PCR positive and there were no subsequent infant
samples available for testing.
Anthropometric measurements
Birth weight and length were obtained immediately after
birth in the delivery room or postpartum ward, as appropriate. Subsequent anthropometric measurements
were performed by an experienced study nurse trained
in standard anthropometric techniques. Weight was
measured to the nearest 100 grams using a standard
weighing scale, and length was measured to the nearest
0.1 cm in a recumbent position using an infantometer.
Measurements were taken in duplicate and if more than
10% discrepant, a third measurement was taken.
The SWEN trial was approved by the Johns Hopkins
and Pune institutional review boards, and BJMC Ethics
Committee.
Statistics
Standardized Z-scores for Weight-for-Age (WAZ, referring to underweight), Length-for-Age (LAZ, referring to
stunting) and Weight-for-Length (WLZ, referring to
wasting) were calculated using the WHO Anthro version
2.0 software [23]. The Z-score measures the number of
standard deviations above/below the median for age and
gender of a reference population, drawn from The
WHO Multicentre Growth Reference Study, an internationally applicable standard that includes children
from a diverse set of countries: Brazil, Ghana, India,
Norway, Oman and the USA [24]. We defined poor
growth as categorical variables using the following three
anthropometric indices: Underweight, if WAZ score was
<−2.0 SD units; Stunted, if LAZ was <−2.0 SD units; and
Wasted, if WLZ was <−2.0 SD units. Since infants in our
study were randomized to receive SWEN or SdNVP, we
examined whether the SWEN dose afforded any additional benefit to the infants as evidenced by their anthropometric indices and whether HIV infection had any
impact on growth.
Infants were categorized as HIV-infected in two
ways: 1) if an infant was found to be HIV positive
anytime during the follow-up period of 12 months, or
negative otherwise; and 2) depending on timing of infection, he/she was categorized as in utero infected if
found to be HIV positive within 48 hours of birth;
infected peripartum if found to be HIV positive after
48 hours but before 6 weeks after birth; or infected
postpartum if found to be HIV positive after age
6 weeks and older.
For continuous variables, comparison of median values
of maternal and infant covariates between the HIVinfected infants and HIV-exposed but uninfected infants
Page 3 of 11
was done using Wilcoxon Mann–Whitney U test; for
categorical variables, the comparison were based on χ2
test or Fisher’s exact test as appropriate. In order to
identify factors associated with underweight, stunting,
and wasting, we used random effects logistic regression
modeling methodology using several maternal and infant
covariates. Maternal variables included in the analyses
were: age, religion, marital status, family type, educational status, employment status, parity, gestational age
at delivery, hemoglobin levels at delivery, CD4 cell
count/mm3, and HIV quantitative RNA (i.e.viral load) in
log10 units. Infant covariates included in the analyses were:
gender, time-dependent HIV status, time-dependent not
breastfeeding, interaction term between time-dependent
HIV status and not breastfeeding, birth weight, treatment
arm, prematurity, delivery mode, and hospitalization, as a
proxy for severity of illnesses, during follow-up period.
For the multivariate analyses, we adjusted for those variables with a p-value of <0.05 in the univariate analyses.
Variables for treatment arm, HIV status and whether or
not being breastfed were forced into the model even if
the p-value was not significant in the univariate analysis
(p > 0.05) since they were primary variables of interest
for this paper. Statistical analyses were performed using
STATA [25] Version 10 software for personal computers,
and in all cases the level of significance was established
at <0.05.
Results
Among 737 live-born infants born to 730 HIV-infected
mother, 93 (12.6%) were HIV-infected infants (Infected
cohort) and 644 were HIV-exposed but uninfected
infants (Uninfected cohort) by 12 months of life. There
were 7 set of twins in the study sample. Of 737
infants, 28 (3.8%) infants were in utero HIV-infected,
10 (1.4%) were peripartum infected (within 6 weeks
after birth) and 55 (7.5%) were postpartum infected
(after 6 weeks of birth). Table 1 shows the comparison of baseline maternal and infant characteristics
between the two cohorts. Mothers of infected infants
had significantly lower median hemoglobin levels
(10.1 vs. 10.8, p<0.0001), lower median CD4 cell
counts (320 vs. 470, p<0.0001) and higher log10 viral
load (4.7 vs. 3.8, p<0.0001) compared to those in the
uninfected cohort. Both cohorts had a similar median
duration of breastfeeding (98 days vs. 98 days) and
proportion breastfed for 1–4 months (81% vs. 79%).
A significantly higher proportion of infants in the
infected cohort were hospitalized for illnesses during
the follow-up period compared to those in the uninfected infants (37% vs. 18%, p<0.0001). Only 16 HIVinfected infants were on HAART during the follow-up
period.
Ram et al. BMC Infectious Diseases 2012, 12:282
http://www.biomedcentral.com/1471-2334/12/282
Page 4 of 11
Table 1 Maternal and infant characteristics by exposure to infant HIV status (N=737)
Total N = 737
HIV -uninfected N = 644
HIV- infected* N = 93
P-value#
23 (21,25)
23 (21,25)
24 (21,26)
0.082
Hindu Religion, n (%)
570 (78)
493 (77)
77 (83)
0.212
Married, n (%)
714 (97)
624 (98)
90 (97)
0.681
Nuclear Family, n (%)
351 (48)
306 (48)
45 (48)
0.928
Characteristics
Baseline Maternal Characteristics
Age in years, Median (IQR)
≤ Primary School Education, n (%)
294 (40)
250 (39)
44 (47)
0.129
Housewife/Unemployed, n (%)
594 (81)
525 (82)
69 (74)
0.066
Parity, Median (IQR)
1 (0, 2)
1 (0, 2)
1 (1, 2)
0.004
Gestational Age at Delivery, Median (IQR)
32 (28,35)
32 (28,35)
32 (26,34)
0.069
10.7 (9.2, 11.9)
10.8 (9.2, 10.8)
10.1 (8.8, 11.5)
<0.0001
CD4 Counts (in 100 s), Median (IQR)
4.6 (3.1, 6.5)
4.7 (3.34, 6.4)
3.2 (1.9, 5.3)
<0.0001
log10 Viral Load, Median (IQR)
3.9 (3.2, 4.5)
3.8 (3.1, 4.4)
4.7 (4.0, 5.1)
<0.0001
Hemoglobin at Delivery, Median (IQR)
Baseline Infant Characteristics
Male Gender, n(%)
390 (53)
343 (53)
47 (51)
0.623
HIV Positive at Birth, n (%)
28 (4)
–
28 (30)
–
Birth Weight, Median (IQR)
2.6 (2.4, 3.0)
2.7 (2.4, 3.0)
2.6 (2.5, 2.6)
0.292
207 (28)
181 (28)
26 (28)
0.941
46 (45, 48)
46 (45, 48)
46 (45, 47)
0.865
−0.03 (−1.1, 0.6)
−0.03 (−1.2, 0.7)
−0.04 (−0.8, 0.6)
0.908
Low Birth Weight (< 2.5 kg) n (%)
Birth Length, Median (IQR)
Weight for Height Z-score, Median (IQR)
Wasting, n (%)
Length for Age Z-score, Median (IQR)
62 (10)
57 (11)
5 (7)
0.299
−1.7 (−2.2, –1.0)
−1.7 (−2.2, –1.0)
−1.7 (−2.6, –1.2)
0.922
339 (47)
295 (46)
44 (48)
0.795
−1.5 (−2.0, –0.7)
−1.5 (−2.0, –0.7)
−1.7 (−2.0, –0.7)
0.408
190 (26)
165 (26)
25 (27)
0.828
38 (38, 38)
38 (38, 38)
38 (38, 38)
0.434
17.3 (15.7, 18.7)
17.3 (15.7, 18.8)
17.3 (15.7, 18.5)
0.868
590 (80)
513 (80)
77 (83)
0.513
98 (97, 100)
98 (97, 100)
98 (72, 100)
0.606
0.741
Stunting, n (%)
Weight for Age Z-score, Median (IQR)
Underweight, n (%)
Infant Gestational Age in Weeks, Median (IQR)
Hemoglobin at Birth, Median (IQR)
Normal Vaginal Delivery, n (%)
Follow-up Variables
Exclusive Breastfeeding (days), Median (IQR)
Exclusive Breastfeeding, n (%)
< 1 Month
61 (8)
54 (8)
7 (8)
1 – 4 Months
587 (80)
512 (79)
75 (81)
4 – 6 Months
46 (6)
42 (6)
4 (4)
>6 Months
43 (6)
36 (6)
7 (8)
Grade 3 or 4 Adverse Event, n (%)
261 (35)
214 (33)
47 (51)
0.001
Hospitalization, n (%)
156 (21)
122 (19)
34 (37)
<0.0001
* HIV-infected group includes infants infected at any time during the 12-month follow-up period.
#
P values for comparison of median values based on Wilcoxon Mann–Whitney U test, and for comparison of proportions, based on χ2 test.
Anthropometric Indices by Infant HIV Status
Figures 1, 2 and 3 graphically display the differences in
the anthropometric indices (LAZ, WAZ and WLZ) at
each time point using a dichotomized definition of HIVinfection during 12 month follow-up period (ie HIVinfected or HIV-exposed uninfected). At birth, both the
infected and the uninfected cohort had a similar high
proportion of stunting (48% vs. 46%), underweight (27%
vs. 26%), and wasting (7% vs. 11%), respectively (p>0.29)
[Additional file 1: Tables S1, S2 and S3]. By 12 months,
80% of infants in the infected cohort were significantly
more stunted compared to 56% in the uninfected cohort
(p<0.0001). The stunting among the infected cohort
emerged early and became statistically significant at
week 4 and persisted through to 12 months of age;
(12 month LAZ infected cohort −2.98 vs. uninfected
cohort −2.17, p<0.0001).
A similar trend was seen for underweight, with infants
in the infected cohort more underweight (lower WAZ
scores) during the follow-up period compared to
Ram et al. BMC Infectious Diseases 2012, 12:282
http://www.biomedcentral.com/1471-2334/12/282
Figure 1 Mean Length -for-Age Z Scores by Infant HIV Status
(Stunting).
uninfected infants, with statistically significant differences arising at week 6 and persisting through to 12months of life. At 12 months, 52% of infected cohort
was underweight compared to 26% in the uninfected
cohort (WAZ −2.08 vs. –1.44, p<0.0001).
There were no significant differences in the mean
wasting (WLZ) between infants in the two cohorts
throughout the follow-up period, except at 6 months,
when infants in the infected cohort had statistically significantly worse WLZ score compared to those in the
uninfected cohort (−0.37 vs. –0.06, p=0.043). Prevalence
of wasting (<−2.0 WLZ score) at 12 months was about
6% among infants in both cohorts.
Page 5 of 11
Figure 3 Mean Weight-for-Length Z Scores by Infant HIV Status
(Wasting).
6 weeks had growth stunting patterns similar to those
uninfected upto 6 months after which the LAZ scores
diverged dramatically compared to those uninfected.
WAZ scores among in utero infected infants were lower
throughout follow-up period of 12 months compared to
those infected peripartum or postpartum. The growth
curves of uninfected infants and those postpartum
infected diverged around 14 weeks and continued to
remain divergent throughout the subsequent followup period. For WLZ scores, infants infected at birth had
lower scores from 6 weeks on. The WLZ curves
for those infected within 6 weeks, those infected after
6 weeks, and infants uninfected followed a similar
pattern.
Impact of timing of HIV transmission
Figures 4, 5 and 6 show the anthropometric indices by
timing of HIV infection. In utero and peripartum
infected infants had similar stunting up to 9 months but
by 12 months, those infected in utero had more stunting
(worse LAZ scores). Infants postpartum infected after
Figure 2 Mean Weight-for-Age Z Scores by Infant HIV Status
(Underweight).
Impact of extended nevirapine prophylaxis
While SWEN exposure among infants in the infected
cohort appeared to have a beneficial effect on LAZ and
WAZ scores, these differences did not reach statistical
significance. There was no clear pattern in the impact
of SWEN on wasting (WLZ) in the infected cohort
(Figures 7, 8, and 9). SWEN however was associated
Figure 4 Mean Length -for-Age Z Scores by Timing of HIV
Transmission (Stunting).
Ram et al. BMC Infectious Diseases 2012, 12:282
http://www.biomedcentral.com/1471-2334/12/282
Page 6 of 11
Figure 5 Mean Weight -for-Age Z Scores by Timing of HIV
Transmission (Underweight).
with significantly less wasting among infants in the uninfected cohort between week 10 and month 9, a difference in Z score ranging from 0.25 to 0.27, p≤0.024
(Additional file 1: Tables S4, S5 and S6).
Risk Factors for Poor Growth
In multivariate analyses, several factors were identified
as being independently associated with malnutrition
(Table 2). Infants whose mothers had primary education
or less were more likely to be stunted, but not underweight or wasted, when compared to those with education levels above primary school. Infants born to
mothers with CD4 counts below 250 cells/mm3 had a
higher risk of being stunted and underweight, while a
high maternal HIV viral load at delivery was associated
with increased the risk of wasting. Infants who were
HIV-infected and not breast-fed were at a higher risk of
being stunted and underweight, but not wasted, and the
interaction term between these two variables was not statistically significant. The factors that had a similar impact
on all measures of malnutrition were: birth weight below
2.5 Kg, gestational age below 37 weeks and delivery mode
other than normal vaginal delivery – all three substantially
Figure 6 Mean Weight -for-Length Z Scores by Timing of HIV
Transmission (Wasting).
Figure 7 Mean Length-for-Age Z Scores by SWEN Arm and
Infant HIV Status (Stunting).
increasing the risk of stunting, underweight and wasting.
Maternal anemia significantly increased the risk of stunting but not underweight. Infant morbidity, as measured
by whether the infant was hospitalized or not, increased
the risk of underweight and wasting, but not stunting.
We conducted a time dependent analysis on growth
z-scores stratified by vital status and HIV status. Among
the infected cohort, infants who died had a significantly
poor growth pattern than those who were alive at 12
months of age. Similar results were observed in the HIV
uninfected cohort (Data not shown but are available on
request). We conducted additional analysis excluding
low birth weight infants to examine if preexisting malnutrition had any impact on our results, however, we found
that the results of this analysis were similar to the one
including all infants and didn't alter our conclusions.
Discussion
Our data on infant growth among HIV-exposed infants
from the SWEN trial in India highlight several important
findings. First, we found a high prevalence of baseline
malnutrition among both HIV-infected and HIV-exposed,
uninfected infants. We observed that differences in stunting and underweight between HIV-infected and uninfected infants emerged early and persisted throughout the
Ram et al. BMC Infectious Diseases 2012, 12:282
http://www.biomedcentral.com/1471-2334/12/282
Figure 8 Mean Weight-for-Age Z Scores by SWEN Arm and
Infant HIV Status (Underweight).
first year of life. Secondly, we found that SWEN exposure
was associated with lower risk of wasting in HIV-exposed,
uninfected infants. Lastly, we confirmed the impact of
maternal and infant factors on growth – low maternal
education, maternal advanced disease state as measured
by CD4 count and viral load, low infant birth weight, infant HIV infection and morbidity were the key independent factors associated with poor growth outcome. As
expected, breastfed infants were found to have better
growth outcomes compared to those not breastfed.
The latest national nutritional status data for Indian
infants 0–6 months in the general population showed
23% stunting, 32% underweight, and 31% wasting [26].
The nutritional status of infants in the same age group in
some of the African countries is comparatively better
than those in India, with 9% 19% stunted, 4%-14% underweight, and 3%-16% wasted (Additional file 1: Table S7).
Hence, the baseline levels of malnutrition among Indian
infants in the community are far worse to begin with
than in many other resource-constrained regions.
In our study, there was an overall high prevalence of
malnutrition at birth with HIV-exposed infants having
approximately 47% stunting, 10% wasting and 26%
underweight. In a retrospective study of 162 HIVexposed infants at a Regional Pediatric Center for HIV
Page 7 of 11
Figure 9 Mean Weight-for-Length Z Scores by SWEN Arm and
Infant HIV Status (Wasting).
in Delhi, prevalence of wasting and stunting was 50.5%
and 48.8%, respectively [27]. While our prevalence of
stunting was comparable to that in this study, the wasting was lower in our study. In a cohort of antiretroviralnaïve HIV-infected infants in south India, the prevalence
of stunting, underweight and wasting was 58%, 63% and
16%, respectively [28]. In contrast to Indian studies, one
in Dar es Salaam, Tanzania found less baseline stunting
(29%) but similar wasting prevalence (8%) [20]. By
6 months of life, stunting in both HIV-exposed but
uninfected (51%) and HIV-infected infants (63%) in our
study were significantly worse off compared to infants
0–6 months of age in the general population in India
(23%) [26]. In a review of 6 infant growth studies examining HIV exposure and postnatal growth outside of
India, only one study in Kenya showed significantly
more stunting among HIV-exposed uninfected compared to infants unexposed to HIV. The other studies
found a lack of association suggesting that viral exposure
without infection is not detrimental to postnatal growth
[9]. In our study, HIV-exposed but uninfected infants
also had poor growth outcomes, although HIV-infected
infants had far worse outcomes. This could partly be
explained by the overall high levels of malnutrition at
birth in our sample.
Ram et al. BMC Infectious Diseases 2012, 12:282
http://www.biomedcentral.com/1471-2334/12/282
Page 8 of 11
Table 2 Multivariate random-effects logistic regression results
Stunting (<−2 SD LAZ)
Underweight (<−2 SD WAZ)
Wasting (<−2 SD WLZ)
Odds ratio (CI)
P-value
Odds ratio (CI)
P-value
Odds ratio (CI)
P-value
Less than Primary Education
1.57 (1.11, 2.23)
0.012
1.20 (0.84, 1.73)
0.318
–
Housewife/Unemployed
0.79 (0.51, 1.23)
0.305
0.84 (0.53, 1.31)
0.433
–
Hemoglobin <9 g/dL
1.76 (1.14, 2.72)
0.011
1.31 (0.83, 2.06)
0.240
–
CD4 <250
2.03 (1.22, 3.38)
0.006
1.73 (1.03, 2.91)
0.038
–
log10 Viral Load
1.06 (0.86, 1.31)
0.606
1.16 (0.93, 1.46)
0.199
1.24 (1.02, 1.52)
Male Gender
1.84 (1.30, 2.60)
0.001
–#
SWEN
0.89 (0.63, 1.25)
0.498
0.76 (0.53, 1.08)
0.123
0.71 (0.51, 0.99)
HIV Status (Time Dependent)
2.33 (1.23, 4.43)
0.010
2.09 (1.15, 3.82)
0.016
1.24 (0.61, 2.52)
0.554
Not Breastfeeding (Time dependent)
1.31 (1.11, 1.55)
0.002
0.83 (0.69, 1.00)
0.047
0.86 (0.65, 1.14)
0.293
Maternal Characteristics
0.034
Infant Characteristics
HIV Status * Not Breastfeeding Interaction
–
0.046
0.99 (0.48, 2.04)
0.985
1.83 (0.92, 3.65)
0.087
0.84 (0.33, 2.10)
0.708
Low Birth Weight (< 2.5 kg)
11.00 (6.82, 17.75)
<0.0001
41.56 (26.04, 66.34)
<0.0001
2.83 (1.87, 4.26)
<0.0001
Gestational Age <37 weeks
1.79 (1.37, 5.71)
0.005
5.34 (2.69, 10.60)
<0.0001
1.93 (1.13, 3.29)
0.015
Delivery mode other than normal vaginal
1.99 (1.30, 3.07)
0.002
2.63 (1.70, 4.07)
<0.0001
1.92 (1.30, 2.84)
0.001
Hospitalization
1.24 (0.81, 1.89)
0.323
2.16 (1.40, 3.32)
0.001
1.62 (1.10, 2.38)
0.014
#
Not included in the multivariate model.
Among infected cohort in our study, baseline LAZ,
WAZ, and WLZ scores were −1.84, –1.63 and −0.15 respectively as compared to the better LAZ, WAZ and
WLZ (−0.62, –0.83, and −1.11 respectively), reported
among HIV-infected infants in Democratic Republic of
Congo [16] or Durban, South Africa [10] (0.13, 0.10, and
−0.43) respectively. By 12 months, infected cohort in our
study were far worse off especially with respect to LAZ
and WAZ scores (−2.98 and −2.08 respectively), as compared to infected infants in the Democratic Republic of
Congo study (−1.67 and −1.86, respectively), or Durban,
South Africa study (−1.26 and −0.53, respectively).
We confirmed the compounding impact HIV infection
has on growth as measured by LAZ and WAZ scores.
With onset of HIV infection, the divergence in growth
profile in our infants occurred within 4–6 weeks of life
and persisted through one year of life. Other studies
have noted differences occurring around 3 months of
age [13,16,17], but most have noted the difference in
growth between HIV-infected and uninfected occurring
by one year of life [8,9,27]. LAZ score among infected
infants in our study was lower by 0.35 at 6 months and
0.81 at 12 months. In other studies where negative association was found, HIV-infected infants had lower LAZ
scores by 0.23 to 1.55 at 6 months of age, and 0.25 to
0.72 at 12 months [9]. WAZ scores among HIV-infected
infants were lower by 0.59 at 6 months and 0.64 at
12 months. The corresponding numbers reported by
other studies ranged from 0.20 to 1.72 at 6 months and
0.17 to 0.87 at 12 months. Clearly, infants in our study
were worse off both in terms of LAZ and WAZ. Some
studies have reported that differences in weight between
the two groups were detected around the same time that
differences in height [9] were detected, which is consistent with what we found in our study. As in other studies, we found that the differences in WLZ scores
between the two groups were inconsistent and were not
statistically significant.
With regard to the timing of infection, not surprisingly
those infected at birth have worse WAZ and WLZ during
the follow-up period compared to those infected within
6 weeks and those infected after 6 weeks. Critical factors
in preventing in utero infection and associated poor
growth are getting pregnant women into prenatal care,
rapidly testing them for HIV and starting those that are
HIV-infected with antiretrovirals as soon as possible. Furthermore protecting infants while being breastfed with
regimens such as SWEN are important for preventing
HIV and poor growth outcomes overall. We found that
infants who remained HIV-uninfected and received
SWEN were less likely to be wasted, but SWEN did not
significantly reduce the risk of stunting or underweight.
Antiretroviral therapy has been shown to improve LAZ
and WAZ scores among HIV-infected children [28-38],
but this is the first time that early extended exposure to
nevirapine in infants has been shown to be associated with
improved WLZ scores among HIV-exposed but uninfected infants. The extended dose of nevirapine was well
tolerated by the infants in the SWEN arm of our study.
Interestingly, one study in India reported that pre-existing
malnutrition impacted negatively on the nutritional response to ART [33]. Furthermore, a recent multicountry
Ram et al. BMC Infectious Diseases 2012, 12:282
http://www.biomedcentral.com/1471-2334/12/282
trial found that HIV-infected young children treated
with a nevirapine-based ART had higher increases in Z
scores for height and weight compared to those treated
with a ritonavir-boosted lopinavir regimen [39]. We
likely did not observe this finding in our HIV-infected
cohort due to our small sample size of HIV-infected
infants receiving SWEN. The mechanism for this presumed nevirapine effect however is unclear. Nevirapine
has been studied in terms of antimicrobial properties
but does not appear to have any specific activity against
common bacteria impacting childhood illness [40], but it
is not known if it has any effect on pediatric respiratory
pathogens. To assess if other characteristics related to
growth could explain our finding, we compared the duration of breastfeeding as well as the hospitalization rates
between SWEN-exposed vs. SDNVP infants and found
no significant differences. Interestingly, the FDA package
insert for Nevirapine shows that the drug vehicle
includes sorbitol and sucrose, but it is likely that this
amount administered is too small to explain it’s effect on
growth. While it could be a coincidental result, it is
plausible that SWEN protected these infants from acquiring HIV infection, consequently protecting them
against compromised nutritional status. Nevirapine may
also have an effect on absorption of nutrients and on GI
infections. Further understanding of the effect of nevirapine on growth is warranted. Although availability of cART
in India has improved, the average age at which HIVinfected infants present for care in India is typically 6 years
and many infants with perinatally acquired HIV infection
remain undiagnosed and uninitiated on treatment [28].
We confirmed that importance of several of the maternal and infant factors that have been shown to be associated with poor growth in both HIV-unexposed and
HIV-exposed infants in other settings. Maternal
hemoglobin level remains a critical predictor of gestational weight gain [41]. It is routine practice to measure
maternal hemoglobin levels during antenatal visits, and
our data reinforce the need for women with lower
hemoglobin levels to be identified during pregnancy
should be more closely monitored and managed to prevent adverse outcomes for both maternal and infant
health irrespective of the HIV status.
We found that low maternal education significantly
increases the risk of stunting as have other studies
[42-44]. Maternal education is not only a good measure
of their knowledge of health-related issues, prenatal and
postnatal infant care, infant feeding practices, and better
sanitary habits, but it also impacts health-seeking behavior, income generating capacity, and ability to make autonomous decisions. Ascertaining the level of maternal
education at first antenatal clinic contact in conjunction
with measuring levels of malnutrition and anemia would
be helpful to clinicians in providing adequate
Page 9 of 11
information and care to HIV-infected pregnant women
and subsequently ensuring positive outcomes for infants.
Similar to other studies, we also found that advanced
disease status of the mother as measured by her CD4
cell count and HIV viral load at delivery also negatively
impacts growth outcomes [20,45,46]. It is likely that
mothers with low CD4 and/or higher viral load may be
unable to provide adequate care for their infants because
of the severity of their own illness [47-49]. Several of
these factors are associated with maternal health and nutritional status both prior to and during delivery and
therefore, emphasis on improving maternal health is
critical to addressing adverse growth outcomes in
infants, particularly if mother is HIV-infected. Infant factors such as low birth weight, preterm delivery and delivery mode other than normal vaginal delivery were all
factors that significantly increased the risk of stunting,
underweight, and wasting. Additionally, our results highlight the importance of breastfeeding among HIVexposed infants.
As with other studies, our study has several strengths
and limitations. A major strength of our study is the assessment of timing of infection which is likely to be
more accurate due to multiple and frequent testing.
While our study had excellent infant HIV diagnosis
ascertainment, few children received ART as it was not
available in the public sector at the time of our study.
We however had prospective follow-up with multiple
growth parameter assessments along with excellent retention, therefore our growth data from Indian infants
are among the most robust. The limitation of our study
was the lack of maternal BMI data, which is an important characteristic impacting infant growth. We also had
limited information about weaning practices, especially
between 6 and 9 month visits, when solid foods are
introduced. Furthermore, our data come from a single
site clinical trial where infants received enhanced care so
some of our findings may not be generalizable to other
settings; however since many children with HIV exposure are managed in urban public sector settings in India,
we feel our data contribute relevant observations.
Conclusions
Our study of growth patterns of infants born to HIVinfected mothers has revealed interesting and important
findings not previously reported for such infants in
India. Differences in anthropometric indices between
infected and uninfected infants appear within 4–6 weeks
of birth which is much earlier than 3 months to 1 year
reported by previous studies. This emphasizes the need
for monitoring their growth during the early months
after birth. SWEN appeared to have a beneficial impact
on growth especially among HIV-uninfected infants, and
significantly reduced the risk of wasting. The high rates
Ram et al. BMC Infectious Diseases 2012, 12:282
http://www.biomedcentral.com/1471-2334/12/282
of maternal and infant malnutrition in India, and the
low availability of early infant HIV testing suggests that
early growth monitoring of all HIV-exposed infants
coupled with nutritional advice to the parents are important low-cost strategies for improving health and
survival outcomes of these infants.
Additional file
Additional file 1: Table S1. Proportion Stunted, and Mean
Length-for-Age Z Score by Infant HIV Status. Table S2. Proportion
Underweight by HIV Status (WAZ). Table S3. Proportion Wasted by HIV
Status (WLZ). Table S4. Mean Length-for-Age Z Scores by Infant HIV
Status and SWEN. Table S5. Mean Weight-for-Age Z Scores by Infant HIV
Status and SWEN. Table S6. Mean Weight-for-Length Z Scores by Infant
HIV Status and SWEN. Table S7. Comparison of indicators of malnutrition
among infants (Birth – 6 Months) in the general population between
India and selected African countries.
Abbreviations
HIV: Human immunodeficiency virus; SWEN: Six-week extended nevirapine;
sdNVP: Single dose nevirapine; WAZ: Weight-for-Age standardized Z score;
WLZ: Weight-for-Length standardized Z score; LAZ: Length-for-Age
standardized Z score; SD: Standard Deviation; WHO: World Health
Organization; PCR: Polymerase chain reaction; DNA: Deoxyribonucleic acid;
RNA: Ribonucleic acid; CD4: Cluster of differentiation 4.
Page 10 of 11
4.
5.
6.
7.
8.
9.
10.
11.
12.
13.
Competing interests
The authors declare that they have no competing interests.
Authors’ contributions
RB and AG conceived the study and designed the research; MR and UN
participated in developing study instruments and standard operating
procedures; AAK, MK, and JS conducted the research; MR, UN, and NG
created and maintained databases, and performed statistical analysis; MR, AG,
RB, NG, and AS helped to draft the manuscript. All authors read and
approved the final manuscript.
Acknowledgement
This study was supported by the US National Institutes of Health (NIH), US
National Institute of Allergy and Infectious Diseases (NIAID) Grant
R01A145462, and the Fogarty International Center NIH Program of
International Training Grants in Epidemiology Related to AIDS (D43TW000010-22). AG, NG, AS, JG, and RCB have also been supported by the
NIH, NIAID BJMC HIV Clinical Trials Unit (U01A1069497).
Author details
1
Johns Hopkins Bloomberg School of Public Health, Dept. of International
Health/GDEC, Suite W5506, 615 N. Wolfe Street, Baltimore, MD 21205, USA.
2
BJMC-JHU Clinical Trials Unit, Pune, India. 3BJ Medical College & Sassoon
General Hospitals, Pune, India. 4Johns Hopkins University School of Medicine,
Infectious Diseases, Baltimore, MD, USA. 5University of Virginia School of
Medicine, Department of Health Sciences, Charlottesville, VA, USA. 6Shrimati
Kashibai Navale Medical College & Hospital, Narhe Pune, India.
Received: 21 December 2011 Accepted: 26 October 2012
Published: 31 October 2012
14.
15.
16.
17.
18.
19.
20.
21.
22.
References
1. De Onis M, Frongillo EA, Blössner M: Is malnutrition declining? An analysis
of changes in levels of child malnutrition since 1980. Bull World Health
Organ 2000, 78:1222–1233.
2. Pelletier DL, Frongillo EA Jr, Habicht J-P: Epidemiologic evidence for a
potentiating effect of malnutrition on child mortality. Am J Pub Health
1993, 83:1130–1133.
3. Pelletier DL, Frongillo EA Jr, Schroeder DG, Habicht J-P: A methodology for
estimating the contribution of malnutrition to child mortality in
developing countries. J Nutr 1994, 124(10 Suppl):2106S–2122S.
23.
24.
Pelletier DL, Frongillo EA Jr, Schroeder DG, Habicht J-P: The effects of
malnutrition on child mortality in developing countries. Bull World Health
Organ 1995, 73:443–448.
Caulfield LE, de Onis M, Blossner M, Black RE: Undernutrition as an
underlying cause of child deaths associated with diarrhea, pneumonia,
malaria, and measles. Am J Clin Nutr. 2004, 80(1):193–198.
Moye J Jr, Rich KC, Kalish LA, Sheon AR, Diaz C, Cooper ER, Pitt J,
Handelsman E: Natural history of somatic growth in infants born to
women infected by human immunodeficiency virus. J Pediatr 1996,
128:58–69.
McKinney R, Robertson WR: Effect of human immunodeficiency virus
infection on the growth of young children. J Pediatr 1993,
123:579–582.
Berhane R, Bagenda D, Marum L, Aceng E, Ndugwa C, Bosch RJ, Olness K:
Growth failure as a prognostic indicator of mortality in pediatric HIV
infection. Pediatrics 1997, 100:1–4. doi:10.1542/peds.100.1.e7.
Isanaka S, Duggan C, Fawzi WW: Patterns of postnatal growth in
HIV-infected and HIV-exposed children. Nutr Rev 2009,
67(6):343–359.
Bobat R, Coovadia H, Moodley D, Coutsoudis A, Gouws E: Growth in early
childhood in a cohort of children born to HIV-1-infected women from
Durban, South Africa. Ann Trop Paediatr 2001, 21:203–210.
Arpadi SM, Cuff PA, Kotler DP, Wang J, Bamji M, Lange M, Pierson RN,
Matthews DE: Growth velocity, fat-free mass and energy intake are
inversely related to viral load in HIV-infected children. J Nutr 2000,
130:2498–2502.
Miller TL, Evans SJ, Orav EJ, Morris V, McIntosh K, Winter HS: Growth and
body composition in children infected with human immunodeficiency
virus-1. Am J Clin Nutr 1993, 57:588–592.
Lepage P, Msellati P, Hitimana DG, Bazubagira A, Van Goethem C, Simonon
A, Karita E, Dequae-Merchadou L, Van de Perre P, Dabis F: Growth of
human immunodeficiecy type 1-infected and uninfected children: a
prospective cohort study in Kigali, Rwanda, 1988 to 1993. Pediatr Infect
Dis J 1996, 15(6):479–485.
Pollack H, Glasberg H, Lee E, Nirenberg A, David R, Krasinski K, Borkowsky W,
Oberfield S: Impaired early growth of infants perinatally infected with
human immunodeficiency virus: Correlation with viral load. J pediatr
1997, 130(6):915–922.
Agostoni C, Zuccotti GV, Giovannini M, Decarlis S, Giannì ML, Piacentini E,
D'Auria E, Riva E: Growth in the first two years of uninfected children
born to HIV-1 seropositive mothers. Arch Dis Child 1998, 79:175–178.
Bailey RC, Kamenga MC, Nsuami MJ, Nieburg P: St Louis ME. Growth of
children according to maternal and child HIV, immunological and
disease characteristics: a prospective cohort study in Kinshasa,
Democratic Republic of Congo. Int J Epidemiol 1999, 28:532–540.
Chantry CJ, Byrd RS, Englund JA, Baker CJ, McKinney RE, Pediatric AIDS Jr:
Clinical Trials Group Protocol 152 Study Team. Growth, Survival and Viral
Load in symptomatic childhood human immunodeficiency virus
infection. Pediatr Infect Dis J 2003, 22:1033–1038.
Benjamin DK Jr, Miller WC, Benjamin DK, Ryder RW, Weber DJ, Walter E,
McKinney RE: A comparison of height and weight velocity as a part of
composite endpoint in pediatric HIV. AIDS 2003, 17:2331–2336.
Newell ML, Borja MC, Peckham C: European Collaborative Study. Height,
weight and growth in children born to mothers with HIV-1 infection in
Europe. Pediatrics 2003, 111:52–60. doi:10.1542/peds.111.1.e52.
Villamor E, Fataki MR, Bosch RJ, Mbise RL, Fawzi WW: Human
immunodeficiency virus infection, diarrheal disease and sociodemographic
predictors of child growth. Acta Paediatr 2004, 93:372–379.
National Family Health Survey (NFHS-3): National Fact Sheet India.
2005–2006. (Provisional Data) http://www.nfhsindia.org/pdf/IN.pdf.
Six Week Extended-Dose Nevirapine (SWEN) Study Team: Extended-dose
nevirapine to 6 weeks of age for infants to prevent HIV transmission via
breastfeeding in Ethiopia, India, and Uganda: an analysis of three
randomised controlled trials. Lancet 2008, 372:300–313.
WHO Anthro for personal computers, version 2, 2007: Software for assessing
growth and development of the world's children. 2007. http://www.who.int/
childgrowth/software/en/.
Multicentre Growth Reference Study Group: WHO Child Growth Standards:
Length/height-for-age, weight-for-age, weight-for-length, weight-for-height and
body mass index-for-age: Methods and development. Geneva: World Health
Organization; 2006.
Ram et al. BMC Infectious Diseases 2012, 12:282
http://www.biomedcentral.com/1471-2334/12/282
25. STATA Version 10 software for personal computers, Santa Monica: CA:
Computing Resource Center.
26. WHO Global Database on Child Growth and Malnutrition:: WHO Global
Database on Child Growth and Malnutrition; http://www.who.int/
nutgrowthdb/database/countries/who_standards/ind.pdf.
27. Seth A, Chandra J, Gupta R, Kumar P, Aggarwal V, Dutta A: Outcome of HIV
Exposed Infants: Experience of a Regional Pediatric Center for HIV in
North India. Indian J Pediatr 2012, 79(2):188–193.
28. Padmapriyadarsini C, Pooranagangadevi K, Chandrasekaran K, Subramanyan
S, Thiruvalluvan C, Bhavani PK, Swaminathan S: Prevalence of Underweight,
Stunting, and Wasting among Children Infected with Human
Immunodeficiency Virus in South India.; 2009. doi:10.1155/2009/837627.
29. Webb AL, Manji K, Fawzi WW, Villamor E: Time-independent Maternal and
Infant Factors and Time-dependent Infant Morbidities including HIV
Infection, Contribute to Infant Growth Faltering during the First 2 Years
of Life. J Trop Pediatr 2009, 55(2):83–90. Epub 2008 Aug 22.
30. Lodha R, Upadhyay A, Kapoor V, Kabra SK: Clinical profile and natural
history of children with HIV infection. Indian J Pediatr 2006,
73:201–204.
31. Lodha R, Upadhyay A, Kabra SK: Antiretroviral Therapy in HIV-1 Infected
Children. Indian J Pediatr 2005, 42:789–796.
32. Banerjee T, Pensi T, Banerjee D, Grover G: Impact of HAART on survival,
weight gain and resting energy expenditure in HIV-1-infected children in
India. Ann Trop Paediatr 2010, 30(1):27–37.
33. Bandyopadhyay A, Bhattacharyya S: Effect of pre-existing malnutrition on
growth parameters in HIV-infected children commencing antiretroviral
therapy. Ann Trop Paediatr 2008, 28(4):279–285.
34. Pooranagangadevi C, Chandrasekaran K, Bhavani PK, Thiruvalluvan C,
Swaminathan S: Persistence of Stunting after Highly Active Antiretroviral
Therapy in HIV-Infected Children in South India. Indian Pediatr 2011,
48:333–334.
35. Guillén S, Ramos JT, Resino R, Bellón JM, Muñoz MA: Impact on weight and
height with the use of HAART in HIV-infected children. Pediatr Infect Dis J
2007, 26:334–338.
36. Kabue MM, Kekitiinwa A, Maganda A, Risser JM, Chan W, Kline MW: Growth
in HIV-infected children receiving antiretroviral therapy at a pediatric
infectious disease clinic in Uganda. AIDS Patient Care STDS 2008,
22(3):245–251.
37. Nachman SA, Lindsey JC, Moye J, Stanley KE, Johnson GM, Krogstad PA,
Wiznia AA, Pediatric AIDS: Clinical Trials Group 377 Study Team. Growth
of Human Immunodeficiency virus-infected children receiving
highly activie antiretroviral therapy. Pediatr Infect Dis J 2005,
24:352–357.
38. Wamalwa DC, Farquhar C, Obimbo EM, Selig S, Mbori-Ngacha DA,
Richardson BA, Overbaugh J, Emery S, Wariua G, Gichuhi C, et al: Early
response to highly active antiretroviral therapy in HIV-1-infected Kenyan
children. J Acquir Immune Defic syndr 2007, 45:311–317.
39. Palumbo P, Lindsey JC, Hughes MD, Cotton MF, Bobat R, Meyers T,
Bwakura-Dangarembizi M, Chi BH, Musoke P, Kamthunzi P, et al:
Antiretroviral treatment for children with peripartum nevirapine
exposure. N Engl J Med 2010, 363(16):1510–1520.
40. Jackson JB, Dick J, Tekle T, Simmons A, Carroll KC: Lack of
antimicrobial activity by the antiretroviral drug nevirapine against
common bacterial pathogens. Antimicrob Agents Chemother 2009,
53(8):3606–3607.
41. Young S, Murray K, Mwesigwa J, Natureeba P, Osterbauer B, Achan J,
Arinaitwe E, Clark T, Ades V, Plenty A, et al: Maternal Nutritional Status
Predicts Adverse Birth Outcomes among HIV-Infected Rural Ugandan
Women Receiving Combination Antiretroviral Therapy. PLos ONE,
7(8):41934. doi:10.1371/journal.pone.0041934.
42. Frost MB, Forste R, Haas DW: Maternal education and nutritional status in
Bolivia: finding the links. Soc Sci Med 2005, 60(2):395–407.
43. Wachs TD, Creed-Kanashiro H, Cueto S, Jacoby E: Maternal education and
Intelligence predict offspring diet and nutritional status. J Nutr 2005,
135:2179–2186.
44. Semba RD, de Pee S, Sun K, Sari M, Akhter N, Bloem MW: Effect of parental
formal education on risk of child stunting in Indonesia and Bangladesh:
a cross-sectional study. Lancet 2008, 371:322–328.
45. Briand N, Le Coeur S, Traisathit P, Karnchanamayul V, Hansudewechakul R,
Ngampiyasakul C, Bhakeecheep S, Ithisukanan J, Hongsiriwon S, McIntosh K,
et al: Growth of human immunodeficiency virus-uninfected children
Page 11 of 11
46.
47.
48.
49.
exposed to perinatal zidovudine for the prevention of Mother-to-child
human immunodeficiency virus transmission. Pediatr Infec Dis J 2006,
25:325–332.
Zemel BS, Riley EM, Stallings VA: Evaluation of methodology for nutritional
assessment in children: anthropometry, body composition, and energy
expenditure. Ann Rev Nutr 1997, 17:211–235.
Patel D, Bland R, Coovadia H, Rollins N, Coutsoudis A, Newell ML:
Breastfeeding, HIV status and weights in South African Children: a
comparison of HIV-exposed and unexposed children. AIDS 2010,
24:437–445.
Thea DM, St Louis ME, Atido U, Kanjinga K, Kembo B, Matondo M, Tshiamala
T, Kamenga C, Davachi F, Brown C, et al: A prospective study of diarrhea
and HIV-1 infection among 429 Zairian infants. N Engl J Med 1993,
329:1696–1702.
Chisenga M, Kasonka L, Makasa M, Sinkala M, Chintu C, Kaseba C, Kasolo F,
Tomkins A, Murray S, Filteau S: Factors affecting duration of exclusive
breastfeeding among HIV-infected and -uninfected women in Lusaka,
Zambia. J Hum Lact 2005, 21:266–275.
doi:10.1186/1471-2334-12-282
Cite this article as: Ram et al.: Growth patterns among HIV-exposed
infants receiving nevirapine prophylaxis in Pune, India. BMC Infectious
Diseases 2012 12:282.
Submit your next manuscript to BioMed Central
and take full advantage of:
• Convenient online submission
• Thorough peer review
• No space constraints or color figure charges
• Immediate publication on acceptance
• Inclusion in PubMed, CAS, Scopus and Google Scholar
• Research which is freely available for redistribution
Submit your manuscript at
www.biomedcentral.com/submit


© Copyright 2026