
Follow-up Care of High-Risk Infants
Follow-up Care of High-Risk Infants
ABSTRACT. A workshop on the follow-up care of
high-risk infants sponsored by the National Institute of
Child Health and Human Development, National Institute of Neurologic Disorders and Stroke, and the Centers
for Disease Control and Prevention was held June 19-20,
2002. There are currently no standardized guidelines for
provision of follow-up services for high-risk infants in
tertiary care centers despite the requirement for follow-up clinic experience in the 97 approved neonatal
fellowship training programs in the United States and
the increasing number of centers participating in multicenter networks. As the total number of survivors at risk
for neurodevelopmental morbidities increases, many
clinical research questions have surfaced that can only be
answered by long-term follow-up studies. There is increasing awareness of the importance of long-term outcome in randomized, controlled trials, because perinatal
interventions may dramatically alter later growth and
development. There is also an increased recognition of
the potential disconnect between perinatal outcomes and
long-term outcomes. The administration of oxygen and
postnatal steroids are prime examples of interventions
that may have immediate positive effects but negative
long-term effects. In addition, multicenter studies have
identified significant center differences in the management and developmental outcome of high-risk infants.
These findings led to the recognition of the need to
improve standardization and comparability of methodology and data collection within and among centers and
networks as a first step toward research to improve the
long-term neurodevelopmental outcome of high-risk infants. The workshop participants met to define optimal
methods to assess the outcome of high-risk infants, identify gaps in knowledge about the neurodevelopmental
outcome of high-risk infants, and prioritize research efforts in response to these gaps. Pediatrics 2004;114:1377–
1397.
ABBREVIATIONS. NICHD, National Institute of Child Health
and Development; NICU, neonatal intensive care unit; RCT, randomized, controlled trial; ELBW, extremely low birth weight;
VLBW, very low birth weight; CNS, central nervous system; MRI,
magnetic resonance imaging; PVL, periventricular leukomalacia;
NEC, necrotizing enterocolitis; SES, socioeconomic status; MDI,
Mental Development Index; PDI, Psychomotor Developmental
Index; BSID-II, Bayley Scales of Infants Development-II; GMFCS,
Gross Motor Function Classification System; ADHD, attentiondeficit/hyperactivity disorder; NEPSY, Neuropsychological Test;
BINS, Bayley Infant Neurodevelopmental Screener; LRO, Language Receptive Organization; LEO, Language Expressive Organization; CPT, Continuous Performance Test; CAT/CLAMS, Cognitive Adaptive Test/Clinical Linguistic and Auditory Milestone
Scale; TOVO, Test of Variables of Attention; CBCL, Child Behavior
Check List; QOL, quality of life; CHQ, Child Health Questionnaire; HRQL, health-related quality of life.
BACKGROUND
A
dvances in perinatal intensive care have been
associated with improved survival of highrisk neonates but have not resulted in decreased morbidity. Small sample sizes, heterogeneity
of cohorts and methodology, diversity of perinatal
clinical practice, and the high cost of randomized,
controlled trials (RCTs) and follow-up care have all
contributed to the lack of rigorous data on the sequelae of preterm delivery and the therapies used to
improve the long-term outcome of high-risk infants.
In response to this need, a workshop on follow-up
care of high-risk infants sponsored by the National
Institute of Child Health and Development (NICHD)
and the National Institute of Neurologic Diseases
and Stroke was held in Bethesda, Maryland, on June
19 and 20, 2002. The goal of the workshop was to
define optimal methods to assess the outcome of
high-risk infants, identify gaps in knowledge about
the neurodevelopmental outcome of high-risk infants, and prioritize research efforts in response to
these gaps.
There are currently no standardized guidelines for
provision of follow-up services for high-risk infants
in tertiary care centers despite the requirement for
follow-up clinic experience in the 97 approved neonatal fellowship training programs in the United
States and the increasing number of centers participating in multicenter networks. As the total number
of survivors at risk for neurodevelopmental morbidities increases, many clinical research questions have
surfaced that can only be answered by long-term
follow-up studies. There is increasing awareness of
the importance of long-term outcome in RCTs, because perinatal interventions may dramatically alter
later growth and development. There is also an increased recognition of the potential disconnect between perinatal outcomes and long-term outcomes.
The administration of oxygen and postnatal steroids
are prime examples of interventions that may have
immediate positive effects but negative long-term
effects.1–4 In addition, multicenter studies have identified significant center differences in the management and developmental outcome of high-risk infants.5–8 These findings led to the recognition of the
need to improve standardization and comparability
of methodology and data collection within and
among centers and networks as a first step toward
research to improve the long-term neurodevelopmental outcome of high-risk infants.
OBJECTIVES OF THE WORKSHOP
Accepted for publication Aug 2, 2004.
doi:10.1542/peds.2004-0866
PEDIATRICS (ISSN 0031 4005). Published in the public domain by the
American Academy of Pediatrics.
1. To discuss the benefits of neonatal follow-up programs for nurseries providing neonatal intensive
care unit (NICU) care.
PEDIATRICS Vol. 114 No. 5 November 2004
1377
2. To define who should be followed and what characteristics of premature infants and term infants
are associated with an increased risk for neurodevelopmental morbidity.
3. To define the (1) the optimal ages of follow-up
assessment and (2) the optimal assessment measures and to minimize barriers to assessment
caused by motor, vision, or hearing impairments.
4. To discuss approaches to selection of controls and
maintaining follow-up.
5. To describe alternative, less costly methods and
approaches to assessment for the community physician.
6. Describe the challenges encountered in multicenter networks.
7A. To identify gaps in knowledge about assessment
of neurodevelopmental outcome among highrisk infants and the mechanisms contributing to
these outcomes.
7B. To further advance areas of investigation.
8. To propose future research questions.
OBJECTIVE 1: DETERMINE THE BENEFITS OF
NEONATAL FOLLOW-UP PROGRAMS AT
PERINATAL CENTERS
The 2 primary areas of responsibility for neonatal
follow-up programs are surveillance and research.
Surveillance
The first step in surveillance is to establish a mechanism to systematically monitor the care of high-risk
infants during their initial hospitalization as well as
their general health and neurodevelopmental outcomes after discharge from the NICU. Surveillance is
necessary for NICUs to (1) audit NICU interventions,
(2) monitor important quality indicators for the individual NICU, (3) summarize information about center outcomes for a specific condition (eg, chronic
lung disease), and (4) summarize annual outcome
data to be used to influence policy and as a basis for
public health programs designed to improve outcomes. Outcomes of interest may include rates of
growth failure, cerebral palsy, mental retardation, or
developmental delay; hearing impairments, vision
impairments, or autism; need for technologic support such as home oxygen, ventilators, tracheostomies, or gastrostomies; and educational resources
needed. Information about center outcomes for
specific conditions and specific gestational ages also
allows staff caring for high-risk infants to counsel
parents with regard to prognosis.9 Providing comprehensive feedback of each evaluation to the family
and the primary provider with appropriate counseling and referrals supports the concept of an effective
medical home for NICU graduates.
Research
Follow-up results of populations enrolled in RCTs
and well-designed cohort studies are needed to evaluate the long-term impact of interventions designed
to improve the outcome of high-risk populations and
identify previously unknown safety problems.
1378
FOLLOW-UP CARE OF HIGH-RISK INFANTS
OBJECTIVE 2: DETERMINE WHO NEEDS TO BE
FOLLOWED AND WHAT THE IMPORTANT RISK
CATEGORIES ARE
Identified risk factors for adverse neurodevelopmental outcome in preterm and term infants identified in studies to date are listed in Table 1. Infants
should receive follow-up assessments based on the
severity of the perinatal problems, the interventions
received in the NICU, the demographic risk factors
of the infants’ families, the outcome profile of the
cohort in the individual NICU, and the NICU’s resources. At a minimum, the follow-up cohort should
include extremely low birth weight (ELBW) infants
ⱕ1000 g birth weight and/or ⱕ28 weeks’ gestation
and term infants with hypoxic ischemic encephalopathy or severe hyperbilirubinemia requiring exchange transfusion. In addition, it is recommended
that all children, especially those cared for in a
NICU, have the benefit of periodic preventive assessments by their primary care physicians within the
context of a medical home. The guidelines established for the periodicity schedule developed by the
Committee on Practice and Ambulatory Medicine10
in consultation with national committees and sections of the American Academy of Pediatrics include
regular basic assessments of growth, sensory function, behavior, and neurodevelopment. Infants with
suspect findings and families with parenting challenges should be referred for additional, more comprehensive evaluation to their follow-up program,
child development center, and additional community resources as needed. Moreover, follow-up care
in a follow-up program or by the primary care provider should include counseling and support for
families and communication among all participants
in the medical home. Evaluation of the family should
include information on adequacy of parenting skills,
use of drugs, alcohol, and/or cigarettes, parent physical and mental health status, and adequacy of finances and health insurance. Referrals need to be
facilitated by the medical home, as needed, with
input from the family. Early-intervention parent
groups, NICU parent groups, Family Voices, and
community mental health services may be beneficial.
Risk Factors for Preterm (<32 Weeks or Very Low Birth
Weight, <1500 g) Infants
The developing brain of the premature infant is
extremely vulnerable to injury. The long-term consequences of such injury include motor deficits commonly referred to as cerebral palsy (a nonprogressive
injury of the central nervous system (CNS) characterized by abnormal control of movement and posture) as well as cognitive and behavioral problems.11–19 The risk for neurodevelopmental deficits
increases with decreasing gestational age, resulting
in relatively high risk of cerebral palsy, developmental delay, hearing and vision impairment, and
subnormal academic achievement among ELBW infants.4,8,11 These performance deficits are thought
to be related to the increased biological vulnerability
to injury of the basal ganglia, hippocampus, and
periventricular white matter in premature in-
TABLE 1.
Defined Risk Categories in the Term and Preterm Infant
Infants
Biologic risk
Interventions
Social/environmental
Preterm
Term
VLBW infants ⱕ1500 g birth weight
ELBW infants ⱕ1000 g birth weight
Infants with cranial ultrasound abnormalities
including PVL-intraventricular hemorrhage,
linear hyperechogenicity,
Other neurologic problems (seizures,
hydrocephalus)
NEC
Chronic lung disease
Complex medical problems
Small for gestation
Higher-order multiples
Twin-twin transfusion
Complex congenital anomalies
Recurrent apnea and bradycardia
Hyperbilirubinemia requiring exchange
Failure to grow in the NICU
Sepsis, meningitis, nosocomial infections
Multiparity
Abnormal neurologic exam at discharge
Resuscitation
Postnatal steroids
High-frequency ventilation
Prolonged ventilation ⬎7 days
Total parenteral nutrition
Prolonged oxygen requirements
Nutritional therapies
Other medications
Surgical interventions for NEC, patent ductus
arteriosus, shunt
Low maternal education, teen mother
Low SES: Hollingshead,32 Hauser33
Single marital status
Minority status
No insurance or Medicaid insurance
Low income
Drugs/alcohol, smoking, substance abuse
No prenatal care
Environmental stress
fants.20–23 Risk for cerebral palsy and neurodevelopmental disabilities can be predicted in part from
specific abnormalities on neonatal cranial ultrasound
or magnetic resonance imaging (MRI); however, cognitive and behavioral problems may occur in the
absence of identified neonatal neuroimaging abnormalities.13
Factors That May Affect Outcome: Biological Factors
Periventricular-intraventricular hemorrhage is the
most common CNS lesion in the premature infant,
which in its mildest form is confined to the germinal
matrix and in more severe cases is complicated by
bleeding into the adjacent ventricular system and/or
white matter. Long-term neurodevelopmental deficits are strongly linked to these severe lesions.16,17
Approximately 26% of infants with birth weights
between 501 and 750 g and 12% of infants with birth
weights between 751 and 1000 g develop the more
severe forms of CNS hemorrhage.18
Periventricular white matter injury (or periventricular leukomalacia [PVL]) may be identified on
cranial ultrasound or MRI by the appearance of cystic lesions.12 Cystic PVL is invariably associated with
significant motor and cognitive deficits. Nonprogressive ventriculomegaly, secondary to loss of cortical
Encephalopathy persisting at discharge
Other neurologic problems/meningitis
Complex medical problems
Small for gestation
Twin-twin transfusion
Complex congenital anomalies
Birth defects
Metabolic disorders
Sepsis, meningitis, nosocomial infections
Hyperbilirubinemia requiring exchange
Failure to grow in the NICU
Multiparity
Abnormal neurologic exam at discharge
Resuscitation
Postnatal steroids
High-frequency ventilation
Prolonged ventilation ⬎7 days
Total parenteral nutrition
Prolonged oxygen requirements
Nutritional therapies
Other medications
Surgical intervention for NEC, shunt
Extracorporeal membrane oxygenation
Low maternal education, teen mother
Low SES: Hollingshead,32 Hauser33
Single marital status
Minority status
No insurance or Medicaid insurance
Low income
Drugs/alcohol, smoking, substance abuse
No prenatal care
Environmental stress
mass, is also associated with increased risk of neurodevelopmental deficit.20 Linear hyperechogenicity
within the thalamo-striatal ganglia of premature infants also has been associated with lower mental and
developmental behavioral scores.21
Severe preterm delivery, male gender, sepsis, meningitis, necrotizing enterocolitis (NEC) requiring surgery, chronic lung disease/prolonged ventilation, severe growth restriction (⬍10th percentile for age and
gestational age), and posthemorrhagic hydrocephalus have been identified as risk factors for adverse
neurodevelopmental outcome in neonatal follow-up
databases.18,19 Additional risk factors identified include multiple birth, medical complications in the
NICU, and congenital abnormalities requiring medical or surgical intervention. Finally, research suggests that environmental stress in the NICU may be
an important risk factor. For example, experimental
evidence from animal models implicates environmental stress in the genesis of hippocampal injury.22–24
Therapeutic Interventions
Perinatal interventions may affect neurodevelopmental outcome. For example, a large RCT and many
large observational studies have documented that a
SUPPLEMENT
1379
single course of antenatal glucocorticoid therapy matures the fetus and improves survival, skin integrity,
and renal function and decreases periventricular/
intraventricular hemorrhage.25–27 In contrast, prolonged postnatal steroid therapy to prevent or ameliorate chronic lung disease seems to be associated
with negative CNS outcomes.19,28–30 Prolonged exposure to glucocorticoids in the animal model is associated with reductions in regional cerebral blood
flow, specifically to hippocampus, with concomitant
histologic changes, significant reduction in hippocampal volume, down-regulation of myelin basic
protein and proteolipid protein in white matter, delayed myelination of optic axons, hyperactivity of the
hypothalamic-pituitary-adrenal axis, and alterations
in dopamine receptor responses.31
Family/Environmental Characteristics
The social and/or environmental characteristics of
families32–35 become increasingly important as the
child matures. Assessment of socioeconomic status
(SES) in an individual or family unit is an indirect
rather than direct measure of the social environment
of the family. Mother-child interaction is a more
proximal factor and is more predictive of earlier
outcome ⱕ2 years, whereas SES is a status or distal
factor and is more predictive of later outcome.36 In a
review of social class and developmental outcomes
in 37 studies conducted in 2000,33 low social class, as
determined by several different means, was associated with poorer growth, greater academic difficulties including reading and spelling problems, lower
IQ, poorer language skills, poorer fine motor skills,
more aggression and externalizing behavior, more
depression and other psychiatric disorders, poorer
sibling relationships, and poorer social development.
However, social class did not consistently predict
symbolic play in infants or Bayley Mental Development Index (MDI)37 and Psychomotor Developmental Index (PDI) scores up to 2 years. Although indicators of social class are effective predictors for a
number of developmental outcomes, it must be recognized that effects are mediated by the child characteristics, family characteristics, and external supports.
The most common single measures used to assess
SES are family income, educational level, and occupation. The easiest information to obtain is maternal
educational level, but it may be only weakly related
to the current status of the family. Although income
may be more closely related to the family’s current
SES status, many respondents are uncomfortable
about disclosing their income or uncertain about the
actual amount. To overcome these problems, research protocols typically ask for income category,
which is easier for the respondent but poses statistical challenges because categories are not continuous
variables. The most common composite measure of
SES is the Hollingshead32 Index of Social Prestige,
which is a weighted average of educational and occupational levels. Years of education completed are
classified into 7 categories, and occupations are classified into 9 categories of increasing status. The Hollingshead scale has the advantage of combining edu1380
FOLLOW-UP CARE OF HIGH-RISK INFANTS
cation and occupation across 1 or 2 adult wage
earners in the household as an algorithm for classification into SES levels. An important disadvantage
is that the original combination rules are designed
for nuclear families. Other disadvantages are that the
Hollingshead Scale is insensitive to heterogeneity
within a social class category, and the categories for
occupation were developed almost 30 years ago. Inclusion of income level or percent of poverty level
provides better discrimination among families.34
Composite scores that combine several SES indicators and a standardized assessment of the home
environment (Caldwell’s HOME scale38) have been
used to overcome some of these limitations. The
HOME scale is highly predictive of school performance but is generally too expensive for standard
use.39 Attempts to define a question or set of questions that capture family-life characteristics, eg,
monthly rent or mortgage,34 as recommended by the
World Health Organization for the developing
world, have been less successful in the United States,
because many of the questions are subject to non-SES
influences. Overall, the Hollingshead Scale is a solid
measure and remains a powerful predictor of outcome. It is one of the best measures of poverty,
single-parent families, and the lifetime consequences
of low education.
Any analysis of differences between study groups
that does not account for SES either by equivalent
groups or statistical adjustment may be flawed, because SES may be an important moderator of perinatal risk and developmental outcome. The choice of
how to manage the variance accounted for by SES
depends on the study hypothesis. SES is frequently
adjusted even with equivalent groups to reduce error
variance. With very preterm infants or infants sustaining biological insult, there can be an interaction
between perinatal risk status and SES such that highrisk infants raised in high-SES families have more
positive outcomes, whereas those raised in low-SES
families have poorer outcomes.39 There are numerous additional environmental factors that have been
shown to be associated with outcomes, including
maternal depression, substance abuse, crowding in
the home, and availability of educational materials
and early-intervention services. Investigators must
identify which variables are important at their center
and which variables contribute to the specific research question being asked. In addition, most programs currently collect data on resource utilization,
including early intervention, physical therapy, occupational therapy, speech therapy, day care, specialized educational services, and rehospitalizations.
These data are collected to determine if the child is
receiving adequate services so that referrals can be
made or information shared as needed. In addition,
resource utilization is an important variable to be
evaluated in outcome studies.
OBJECTIVE 3A: DETERMINE THE OPTIMAL AGES
OF ASSESSMENT
Although long-term follow-up of complete cohorts
is optimal for determining the ultimate function of
high-risk infants and the safety of antenatal and pre-
natal interventions, most follow-up studies are shortterm (ⱕ2 years). The selection of age of assessment is
driven by several factors: developmental acquisitions
available at a given age; availability and applicability
of appropriate test instruments at specific ages;
trends found in extant studies; and the cost and
feasibility of long-term tracking in the population in
question.
Assessment schedules should reflect the question
asked in a specific research protocol. For surveillance
purposes, a center may propose periodic enrollment
(eg, ELBW infants may be enrolled for 1 year every 5
years and followed for 5 years, after which a new
cohort may be enrolled).
In many NICU programs, all very low birth weight
(VLBW) infants are referred to early intervention at
the time of discharge from the NICU. Eligibility for
early-intervention services, however, varies by state.
If a developmental assessment is needed before 12
months to establish eligibility for a referral to an
infant stimulation program, a 6- to 8-month corrected-age evaluation is recommended, using the Bayley
Scales of Infant Development-II (BSID-II) MDI. The utility of assessment before this age is questionable.
12 Months’ Corrected Age
Environmental factors are less influential on performance at 12 months’ corrected age, and biomedical issues such as oxygen supplementation for
chronic lung disease have resolved and may be less
intrusive on testing procedures. By 12 months’ corrected age, a more varied behavioral repertoire is
available, and cognitive processes and emerging language can be assessed. Evaluation at this age also
encourages family involvement in the program.
However, cognitive and motor functions are still
highly intertwined at 12 months’ corrected age, and
the period of developmental acquisition is a time of
variability. Also, some neurologic abnormalities that
are identified in the first year of life are transient or
improve, whereas findings in other children may
worsen over time.40
18 to 24 Months’ Corrected Age
By 18 to 24 months’ corrected age, environmental
factors begin to exert a stronger influence on test
results, cognitive and motor abilities diverge, language and reasoning skills are developing, and there
is improved prediction to early school-age performance.41–43 A potential problem is that many intelligence tests have weak floors at this age, thereby
restricting use to developmental tests, and therefore
impairments may be overestimated or underestimated. Application of corrected age (the sum of chronologic age in weeks minus the difference between
gestational age at birth and 40 weeks’ gestation) to 2
or 2 1/2 years is controversial but generally accepted.44,45 Standard follow-up for many multicenter networks is currently at 18 to 24 months’ corrected age.
3 to 4 Years
At 3 to 4 years, “intelligence” can first be assessed,
as well as concept development, preacademic skills,
early indicators of executive function, and visual-
motor integrative abilities. Verbal and nonverbal
skills can be better differentiated. There is also an
acceptable level of prediction46 from scores at this
age to later IQ scores. SES and social support, as well
as other environmental factors, influence test results
more strongly from age 3 years onward.
6 Years
By 6 years of age, a variety of tests and procedures
can be used, and attention problems and school
achievement (approximately first grade) can be assessed. The array of possible tests that can be used is
more restricted at age 5 than at age 6.
8 Years
IQ, neuropsychological function, learning disabilities, school performance, and behavioral adjustment
can be adequately assessed at 8 years (approximately
third grade). IQ measured at 8 years predicts later IQ
more accurately than at earlier ages.
OBJECTIVE 3B: DETERMINE THE APPROPRIATE
ASSESSMENTS FOR ADMINISTRATION AT THE
RECOMMENDED AGES
Ten different domains of development were identified and are related to age of assessment in Table 2.
Three areas are basic (growth, neurologic status, and
developmental status) and should be included in
every follow-up program. The measures presented
are based on the extensive experience of the participants in the workshop. It is anticipated that the information provided will assist follow-up programs
to make choices based on this report and practical
considerations.
Growth
Assessment of growth should include birth
weight, birth length, and birth head circumference
relative to an appropriate growth chart and an accurate determination of gestational age at birth. The
most commonly used fetal growth charts are those of
Lubchenco et al47,48; however, these charts reflect
preterm deliveries at ⬃1 mile above sea level. The
intrauterine growth standards developed by Usher
and McLean49 do not reflect the cohort at greatest
risk (22–24 weeks’ gestation); they were published in
1969 for infants between 25 and 44 weeks’ gestation.
More recent population-based intrauterine growth
standards have been published for the Canadian
population for infants between 22 and 44 weeks’
gestation.50 The NICHD Neonatal Research Network
uses fetal growth charts developed by Alexander et
al51 that provide reference weights for infants born
from 20 to 38 weeks’ gestation for US infants. These
fetal growth charts are often used to plot postnatal
growth, although the environmental and metabolic
demands of postnatal growth are very different from
those during fetal development. The NICHD Neonatal Research Network has developed postnatal
growth charts for VLBW infants52; however, these
growth trajectories should not be considered optimal, because ⬃15% of VLBW infants have a weight
ⱕ10th percentile at birth but 90% are ⱕ10th percentile for their corrected fetal age at hospital discharge.
SUPPLEMENT
1381
1382
FOLLOW-UP CARE OF HIGH-RISK INFANTS
Bayley MDI
Bayley PDI
Bayley MDI
Bayley PDI
QOL; HRQL; health status
QOL research*
Limited for young children;
parent checklist; PPVT101;
Grammar TEGI104
WeeFIM95; Vineland96; PEDI98
CBCL109,110; TOVA (4–5)90;
GDS (4–5)116
QOL; HRQL; health status
Wt, Lt, HC
BMI, skinfolds
Caloric/protein fat intake;
energy expenditure
Standard for age
Amiel-Tison55
Conventional
Functional, MRI, DTI, DWI,
CT
GMFCS
IQ, visual-motor skills,
ADHD (age 5)
3–5 y
WeeFIM95; Vineland96; PEDI98
CBCL109,110; Conners CPT73;
Conners RS111,112
QOL; HRQL; health status
School placement; achievement;
executive function; academic
performance; abdominal
circumference
Limited for young children;
PPVT101; Grammar TEGI104
GMFCS
IQ, Visual-motor skills, reasoning,
memory, ADHD, executive
function
Conventional
Functional, MRI, DTI, DWI, CT
Wt, Lt, HC
BMI, skinfolds
Caloric/protein fat intake; energy
expenditure
Standard for age49–54
School Age
CA, indicated corrected age; Wt, weight; Lt, length; HC, head circumference; BMI, body mass index; GDS, Gordon Diagnostic System; DTI, diffusion tension imaging; DWI, diffusion weighted
imaging; CT, computed tomography imaging; WeeFIM, Functional Independence Measure for Children; Vineland, Vineland Social Maturity Scale; PEDI, Pediatric Evaluation of Disabilities Inventory;
PPVT, Peabody Picture Vocabulary Test; TEGI, Test of Early Grammatical Impairment104; Conners RS, Conners Teacher Rating Scale111 and Parent Rating Scale.112
* Research protocols (auditory CPT) can be measured at later ages,81 and verbal IQs can be obtained.
QOL; HRQL; health status
WeeFIM95; Vineland96; PEDI98
CBCL109,110
WeeFIM95; Vineland96; PEDI98
CBCL109,110
Functional
Behavior
Bayley MDI
Bayley PDI
Bayley PDI
Wt, Lt, HC
BMI, skinfolds
Caloric/protein fat intake;
energy expenditure
Standard for age
Amiel-Tison55
Conventional
MRI, DTI, DWI, CT
18 mo CA
Limited for young children;
parent checklist
Limited for young children;
parent checklist
Bayley PDI
Wt, Lt, HC
BMI, skinfolds
Caloric/protein fat intake;
energy expenditure
Standard for age
Amiel-Tison55
Conventional
MRI, DTI, DWI, CT
Bayley PDI
Wt, Lt, HC
BMI, skinfolds
Caloric/protein fat intake;
energy expenditure
Standard for age
Amiel-Tison55
Conventional
MRI, DTI, DWI, CT
12–14 mo CA
Limited for young children;
parent checklist
Language
School age
research*
Gross motor*
Development
Neurologic*
assessment
Neuroimaging
Research*58–66
Growth*
Nutrition
3–4 and 6–8 mo CA
Basic Categories of Assessment by Age
Area of
Assessment*
TABLE 2.
Weight, length, and head circumferences should be
collected routinely and serially in all programs by
examiners trained to reliability using standard techniques. For children ⱕ2 years, weight should be
obtained with the child completely undressed. Recumbent length is obtained until age 2 by using a
pediatric length board, and maximal occipital frontal
head circumference is recorded to the nearest millimeter by using a nonstretch measuring tape. Anthropometric measures in the United States are plotted
according to gender and age (adjusted until age 2) on
National Center for Health Statistics growth charts.
Poor growth is defined as weight, length, head circumference, or weight-to-length ratio ⱕ10th percentile.53 Other measures of growth used in research
protocols include skinfold thickness,54 calculated
measures of weight-to-length ratios, growth velocity,
protein and caloric intake, energy expenditure, and
bone density.
Neurologic Outcome
The neurologic examination of the toddler and
older child40,55–57 is an integral part of the neurodevelopmental follow-up assessment, yet it remains
poorly described and standardized in many research
protocols. This early assessment can identify infants
with mild, moderate, and severe abnormalities. This
assessment is of interest because infants with mild or
transient neurologic abnormalities often improve
over time, unlike infants with severe early neurologic
dysfunction, who are less likely to improve and have
the worst neurodevelopmental outcome.40 The neurologic examination of the toddler and older child
can be used to determine resource needs such as
early intervention. Follow-up programs need to develop a manual of operations for the entire assessment, use a standardized neurologic examination,
establish definitions, and train and certify examiners
to reliability on an annual basis. Components of the
examination should include assessment of gross motor function, tone, reflexes, cerebellar function, cranial nerves, and language. In addition, excellent observation skills, adherence to examination protocol,
good interpersonal skills, and flexibility are the key
to an accurate assessment of the young child; much
can be learned by observation of posture, movement,
and quality of movement before the onset of the
“formal” examination.
Imaging
The application of MRI to predicting outcome in
high-risk children or for evaluating them later in life
is an evolving field.58–66 Conventional MRI is effective for detecting developmental abnormalities of the
CNS and PVL virtually any time after birth. Diffusion magnetic resonance methods measure changes
in water apparent diffusion coefficient and are used
as an early indicator of brain injury becoming sensitive 2 to 5 days after injury in infants. T1- and T2weighted images also detect CNS injury, although
their sensitivity varies with the time after the injury.
Conventional T1- and T2-weighted MRI is routinely
used to assess myelin development and maturation
status in children and preterm infants. Functional
MRI may be used to assess the cortical reorganization associated with injury and recovery. These techniques and the development of age-based norms are
under continuous development. Imaging technologies are currently being used in the NICU to evaluate
CNS injury to determine risk category and potential
postdischarge needs and to predict outcome. Current
studies are evaluating the use of MRI in older children to evaluate the association between neurocognitive skills and brain injury.
Gross Motor Skills
Specific tests of gross motor function are currently
frequently combined with the standard neurologic
examination. The Gross Motor Function Classification System (GMFCS)67 is the first reliable and validated system available to describe the severity of
motor dysfunction in children with cerebral palsy
and has been shown to be reasonably stable between
the ages of 2 and 12 years.68 The GMFCS for cerebral
palsy provides classification of age-adjusted variations in 5 levels of gross motor function, with the
highest level of mobility expected between 6 and 12
years of age. Descriptions are available for children
⬍2 years, 2 to 4 years, 4 to 6 years, and 6 to 12 years.
The GMFCS is quick and easy to use; classification is
made by determining which level best represents the
child’s present abilities and limitations in gross motor function. The description for each level is broad
and not intended to describe all aspects of the motor
function of individual children. Distinctions between
levels of gross motor function are based on functional limitations, the need for assistive mobility devices (eg, walkers, crutches, canes), wheeled mobility, and, to a lesser extent, quality of movement. The
scale is ordinal, with no intent that the distances
between levels be considered equal or that children
with cerebral palsy are equally distributed among
the 5 levels. The 5 levels of function (level 1 is the
highest) are:
1. Walks without restrictions; limitations in more
advanced gross motor skills
2. Walks without assistive devices; limitations walking outdoors and in the community
3. Walks with assistive mobility devices; limitations
walking outdoors and in the community
4. Self-mobility with limitations; children are transported or use power mobility outdoors and in the
community
5. Self-mobility is severely limited even with the use
of assistive technology
The algorithm shown, based on the GMFCS, was
developed to classify infants at 24 to 28 months’
corrected age in the NICHD- and National Institute
of Neurologic Diseases and Stroke-sponsored randomized clinical trial of the Beneficial Effects of Antenatal Magnesium Sulfate in the Maternal Fetal
Medicine Units Network (Fig 1). In addition, the
characteristics of upper extremity function including
bimanual function and bilateral pincer grasp are
needed to differentiate among right hemiplegia, left
hemiplegia, diplegia, and other minor motor impairments.
SUPPLEMENT
1383
Fig 1. Gross motor function classification system at 24 months corrected age.
Cognitive and Developmental Skills
The emergence of high-prevalence/low-severity
dysfunction (borderline IQ, learning disabilities, attention-deficit/hyperactivity disorder [ADHD], neuropsychologic deficits, and behavior problems) in
children at biological risk has underscored the need
for detailed assessment of cognitive development.
Although major deficits can be detected in infancy,
more subtle high-prevalence/low-severity dysfunctions become increasingly obvious as the child grows
older, which is assumed to be because of continued
cortical development and increased demands for
performance in emerging areas of cognitive function.
Moreover, there is some evidence that the cognitive
function of infants with severe CNS injury tends to
deteriorate over time, whereas the cognitive scores of
neurologically intact but immature infants tend to
improve as they mature.69 These data support the
importance of long-term follow-up to obtain schoolage outcomes on high-risk infants.
IQs
Earlier meta-analyses of cognitive deficits in low
birth weight (⬍2500 g) infants indicated a 5- to
7-point deficit in comparison to term infants. More
recent comparisons suggest a 0.3- to 0.6-SD decrease
in IQ in children born prematurely, producing a
reported decrement that ranges from 4.5 to 9.0
points. Therefore, in VLBW infants free of major
disabilities, mean group IQs fall in the borderline to
average range, with low average scores being the
mode. However, use of IQ scores masks more subtle
deficits; a verbal, performance, or area index score is
the average of various subtests (ie, verbal comprehension, processing speed, etc), whereas a full-scale
IQ is an average of averages. IQ scores are influenced
1384
FOLLOW-UP CARE OF HIGH-RISK INFANTS
by socioeconomic variables, particularly with respect
to verbal function.
Visual-Motor Skills
The majority of children born at ELBW and VLBW,
even those with average IQs, manifest visual-motor
problems that include deficits on neuropsychological
tasks such as copying, perceptual matching, spatial
processing, finger-tapping, pegboard performance,
visual memory, and visual-sequential memory. Estimates of visual-perceptual and visual-motor integration problems are in the 11% to 20% range; fine
motor problems are as high as 71%. These deficits
seem mostly related to biological risks rather than
environmental risks.
Neuropsychological Functions
Preliminary data suggest an increased incidence of
executive-function problems in planning, organization, problem-solving, working memory, and inhibition as well as attention. Related to this, a sizeable
number of children born VLBW display nonverbal
learning disabilities (in which verbal cognitive skills
are better developed than nonverbal abilities, producing verbal IQ/performance IQ discrepancies)
and associated problems in visual-motor integration,
visual perception, mathematics, spatial skills, and
fine motor speed. Verbal abstracting, reading comprehension, written output, and social skills are also
areas of deficit with nonverbal learning disabilities.
Neuropsychologic deficits are related to both biological and environmental risks.
The array of potential problems found in the follow-up of preterm infants mandates that assessment
extend beyond traditional IQ and achievement testing. The pattern of developmental change or im-
provement may be more informative than the midpoint score in a given area of function. These process
issues, which have often been overlooked, may be
informative and useful for intervention and predictive purposes. Assessment of intelligence in follow-up studies to school age should include 5 key
elements: reasoning, knowledge, quantitative reasoning, visual/spatial processing, and working
memory.
Areas of Assessment
Specific tests and rating scales that assess the following areas should be considered in follow-up protocols (those falling under a broad categorization of
“cognitive” are in italic type):
1. Intelligence (including verbal and nonverbal aspects) and executive function
2. Achievement
3. Functional status (self-care, mobility, communication)
4. Language (phonological awareness, syntax, verbal fluency, comprehension of instructions, speed
naming, higher-order abstracting functions)
5. Sensorimotor functions (visual-motor precision, fine
motor speed)
6. Visual spatial processes (design-copying, visual closure)
7. Memory and learning (list-learning, delayed recall,
narrative memory, and use of semantic/strategic
and rote/episodic verbal and visual tasks)
8. Behavioral adjustment (ADHD, internalizing and
externalizing behaviors, and social functioning).
Table 3 lists specific tests recommended to evaluate developmental/cognitive function.70–85 Tests in
the first row are those considered most desirable,
and tests in subsequent rows are acceptable alternatives; listed tests are not necessarily all administered
at any given time. Moreover, some tests have not
been included because of lack of valid test norms or
because they do not sample cognitive constructs of
interest. Finally, certain functions (eg, visual perception) may be measured on several different tests (eg,
Neuropsychological Test [NEPSY]78 and Motor Free
Visual Perception Test86).
Most IQ tests require so-called level C qualification
TABLE 3.
Minimizing Barriers to Assessment
Assessment of children with sensorimotor impairments remains challenging for new examiners. Children with visual impairment are extremely difficult
to evaluate before the preschool age, because most
test items are sensorimotor in nature. Evaluation is
restricted to verbal behaviors and gross motor milestones. The Mullen Scales of Early Learning,89 Language Receptive Organization (LRO), and Language
Expressive Organization (LEO) scales may be useful
for children with vision impairment, although items
of an “intersensory” (ie, auditory and visual) nature
are eliminated or scored in a prorated fashion. With
increasing age, verbal subtests can be used, although
many still require viewing pictures and then producing a response. Auditory memory as well as auditory
attentiveness can be measured with the auditory
Continuous Performance Test (CPT)73 at later ages,
and verbal IQs can be obtained. The standard use of
the BSID-II is not appropriate for children who are
legally blind.
Hearing impairment precludes adequate assessment of verbal abilities; sensorimotor subtests can be
administered, but an overall BSID-II MDI cannot be
computed. The Mullen Scales of Early Learning89
may be considered, using the LRO and LEO scales
for children with hearing impairment, although intersensory items (requiring hearing and vision or
hearing and motor skills) must be addressed. With
increasing age, nonverbal tests can be used (allowing
computation of nonverbal indexes), but the hearing-
Comprehensive Cognitive Assessment Protocol
12 mo CA
37
for administration, meaning that they should be administered by qualified masters-level or above psychologists: pediatric, clinical, child, and school psychologists and child neuropsychologists. Centers
that use limited assessment batteries because of limitations of staff or funding require level B qualifications for administration. Examples of these tests include the Bayley Infant Neurodevelopmental
Screener (BINS),87 Kaufman Brief Intelligence Test,88
Developmental Test of Vision Motor Integration,70
rating scales, and similar instruments. Adequately
trained support staff can administer level B tests, and
appropriately trained developmental pediatricians
and psychologists can administer the BSID-II.37
BSID-II
MDI and PDI
Bayley MDI
24 mo CA
37
BSID-II
MDI and PDI
Bayley MDI
3–4 y
75
DAS
BSID-II (36 mo)
McCarthy79
Stanford Binet-V81
WPPSI-III83
Bracken Basic Concepts-R71
K-ABC77 (sequencing simultaneous
processing subscales)
6y
85
WISC-IV
84
WASI
Stanford Binet-V81
NEPSY78
VMI70
Grooved Pegboard80
Conners CPT checklists73
8y
85
WISC-IV
WASI84
Stanford Binet-V81
NEPSY78
BRIEF76
Parent and teacher versions
Conners CPT checklists73
WRAML82/CMS72
CVLT-C74
DAS indicates Differential Ability Scale; MSCA, McCarthy Scales of Children’s Abilities; SB-V, Stanford-Binet V; WPPSI-IV, Wechsler
Preschool and Primary Scale of Intelligence-IV; K-ABC, Kaufman Assessment Battery for Children; WISC-IV, Wechsler Intelligence Scale
for Children-IV; WASI, Wechsler Abbreviated Scale of Intelligence; VMI, Developmental Test of Visual Motor Integration; BRIEF,
Behavior Rating Index of Executive Function (questionnaire); WRAML, Wide Range Assessment of Memory and Learning; CMS,
Children’s Memory Scale; CVLT-C-California Verbal Learning Test–Children’s Version.
SUPPLEMENT
1385
impaired child still may find it difficult to understand directions and provide the required response.
In these settings, performance IQs can be derived,
and visual CPTs,73 visual memory tasks,90 visualmotor integration,70 rating scales, and more specific
neuropsychological tests may be used. The Leiter
International Performance Scales-R91 is a useful test
for use in the hearing-disabled population (2–20
years), because auditory skills are not required.
Finally, it is important to realize that the reference
norms of most tests are children without sensory
impairments; hence, administration to children with
visual or hearing deficits may affect the tests’ psychometric qualities. The NICHD protocol codes specifically for children who have a sensory loss (code 6
indicates that the child cannot be tested but appears
normal; code 5, the child cannot be tested but appears to be mild to moderately delayed; code 4, the
child is severely developmentally delayed). For the
child classified as severely developmentally delayed,
a Bayley score of 49 is assigned.
Assessment of cognitive abilities in children with
motor impairments is particularly difficult before
preschool because of the interweaving of cognitive
and motor function. Substantial alterations of test
procedures are necessary that, in turn, may have an
impact on comparability to norm-referenced data.
Subsequently, verbal tasks as well as nonverbal tasks
that do not require a motor response (eg, matrices)
can be used. Assistive devices/technology also may
be used in such situations. Tests recommended for
programs with comprehensive follow-up protocols
include the Differential Ability Scales,75 McCarthy
Scales of Children’s Abilities,79 Stanford Binet,81
Wechsler Intelligence Scales for Children,85 Kaufman
Assessment Battery for Children,77 Wechsler Preschool and Primary Scale of Intelligence-III,83
Wechsler Abbreviated Scale of Intelligence,84 the
NEPSY,78 Developmental Test of Visual Motor Integration,70 CPTs,73 Behavior Rating Inventory of
Executive Function,76 Wide Range Assessment of
Memory and Learning,82 Children’s Memory Scale,72
and the California Verbal Learning Test-Children74
(Table 3).
Cognitive tests recommended for programs
with limited assessment protocols include the
BINS,87 the BSID-II MDI,37 Ages and Stages,92 and
the Cognitive Adaptive Test/Clinical Linguistic and
Auditory Milestone Scale93 (CAT/CLAMS) (Table 4).
TABLE 4.
Functional Skills
Instruments for measuring functional status in essential activities of self-care, mobility, communication, and learning are assessed with the Functional
Independence Measure for Children,95 the Vineland
Adaptive Behavior Scale,96 the Battelle,97 and the
Pediatric Evaluation of Disability Inventory98 psychometric properties of these assessments are shown
in Table 5. Examination of the functional strengths
and challenges of children with neurodevelopmental
impairments provides additional information regarding disablement (attitudes, barriers, and policies
that restrict opportunities) and enablement (supports
that break down barriers). A similar assessment of
functional skills obtained by parent interview was
developed by Stein et al.99 Functional assessments
have important strengths including the need for a
minimal database, use of criterion referencing, obtaining information on typical performance, and
ability to measure severe disability. In addition,
functional assessments can be administered to a reliable observer/informant by staff trained in a variety of disciplines and by telephone interview and
may be linked to population surveys.
Language
Effective receptive and expressive language is fundamental for communication, adaptive behavioral
and academic success, and literacy. Assessing receptive and expressive language is particularly challenging, because different language skills emerge and are
mastered at different ages, the rate of development
of different language skills is not linear, and different
means of assessment are suitable for different ages.
Comprehensive language testing including expressive and receptive language, organization, and grammar is required to obtain a complete assessment of
language function. Parental checklists of expressive
language are available including the McArthur100 for
ages ⱖ1 year. Receptive language can be tested from
ages 2 to adulthood with the Peabody Picture Vocabulary Test-III.101 The combination of receptive and
expressive language can be assessed with the Expressive One-Word Picture Vocabulary Test102 and the
Receptive One-Word Picture Vocabulary Test.103
Language organization can be assessed with the
Limited Cognitive-Assessment Protocol
12 mo
87
Additional assessments are brief versions of some of
the tests listed in Table 3.70,73,77–79,84,85,88,94
BINS
Ages and Stage92
CAT/CLAMS93
BSID-II MDI37
24 mo
87
BINS
Ages and Stage92
CAT/CLAMS93
BSID-II MDI37
3–4 y
88
6y
84
8y
84
K-BIT
WASI
WASI
WRIT94
BSID-II MDI (3)37
McCarthy Screener79/K-ABC77
short form
DTVMI70
4 subtests from WISC-IV85
4 subtests from WISC-IV85
Conners CPT73
Selected NEPSY78 subtests
Conners CPT73
DTVMI70
DTVMI70
K-BIT indicates Kaufman Brief Intelligence Test; WRIT, Wide Range Intelligence Test; WASI, Wechsler Abbreviated Scale of Intelligence;
MSCA, McCarthy Scales of Children’s Abilities; WISC-IV, Wechsler Intelligence Scale for Children Subtests; DVTMI, Developmental Test
of Vision Motor Integration.
1386
FOLLOW-UP CARE OF HIGH-RISK INFANTS
TABLE 5.
Levels of Follow-up Program Intensity
Level 1
Level 2
Level 3
Level 4
Telephone interview to screen:
developmental screeners;
Ages and Stages92 and
CAT/CLAMS93
In-clinic single visit: growth;
neurologic exam; screen;
developmental screeners;
Ages and Stages92 and
CAT/CLAMS93
developmental screeners:
BINS87
Refer for diagnostic or
intervention services as
needed
Collect data
Clinical
Refer for diagnostic or
intervention services as
needed
Collect data
Clinical
Single visit: comprehensive
assessment; growth;
neurologic exam;
developmental
assessment (Tables 2 and
3) (behavior, other
reduced comprehension
or comprehension)
Refer for diagnostic or
intervention services as
needed
Collect data
Clinical/Research
Serial comprehensive assessments:
growth; neurologic exam;
developmental assessment,
behavior (may include
videotapes, MRIs, actigraphy,
parent IQ, telemedicine,
biochemical parameters,
genetics
Refer for diagnostic or
intervention services as needed
Mullen Scales of Early Learning,89 which has both
LRO and LEO scales. Assessment of grammar using
the Rice/Wexler Test for Grammatical Impairment104 targets elements of morphosyntax known to
be weak in children with language impairments. It
has strong predictive validity for children 4 to 6 years
of age and has been standardized for ages 3 to 8
years. The Clinical Evaluation of Language Fundamentals III105 is another language test that assesses
higher-level language function for children ⱖ6 years.
Behavior and Attention
The choice of which behavioral domain to measure
is a difficult decision for individuals designing a
follow-up study. Target outcomes should be selected
on the basis of theoretical and clinical concerns for
the specific at-risk group. These concerns are combined with known stages of development to determine when to assess. Fig 2 describes the timeline for
behavioral domains relevant to high-risk children.
Cognition and motor control may be a higher priority among ELBW children, whereas psychopathology and antisocial behavior may be of greater concern in drug-exposed children. Specific methodology
issues such as what measures to use, where to conduct the assessment, and how to train testers are
guided by good research practices and practical consideration of time and resources.
In general, the easiest, least demanding method is
parent report. The next easiest are tests and child
interviews. The most difficult are procedures that
require specific settings and extensive scoring. Com-
Collect data
Clinical/Research
puter implementations have helped to bring some
difficult procedures within reach (eg, Cambridge
Neuropsychological Test Automated Battery,106 Diagnostic Interview Schedule for Children,107 and
Test of Variables of Attention [TOVA]90), but these
tests are demanding in terms of equipment and software.
Parent questionnaires are useful in cases in which
the child exhibits a behavior but is too young to
self-report or when brief observation is insufficient to
capture the outcome of interest. A behavior assessment administered by questionnaire is the Brief Infant-Toddler Social Emotional Assessment Version
1.0.108 It is designed as a first step in the early identification of 1- to 3-year-olds with social-emotional
problems and/or delays in social competence. It consists of 60 interview questions. A trained medical or
nonmedical professional may administer this scale to
the primary caretaker of the child. Estimated time to
administer the Brief Infant-Toddler Social Emotional
Assessment is 15 minutes. Another good example of
a behavior assessment for children is the Achenbach
Child Behavior Check List (CBCL).109,110 The CBCL
is a comprehensive measure of parental perception
of children’s behaviors designed to assess the social
competencies and behavioral problems of children
aged 2 to 3 (CBCL 2-3) and 4 to 18 (CBCL 4-18) in a
standardized format. The CBCL provides norms for
interpretation, can be administered by interview for
parents with low reading skills, and has a simple
yes/no response format. There are versions for
teachers and adolescents, which can be useful. Re-
Fig 2. Timeline: child outcomes.
SUPPLEMENT
1387
sults from all parent-report questionnaires must be
interpreted with caution, because they reflect the
parent’s own bias and relationship with the child as
well as the child’s behavior. Therefore, it is probably
best among school-aged children to have both parent
and teacher versions. The Conners111,112 parent and
teacher rating forms are frequently used when assessing school-aged children for attention deficit and
hyperkinesis.
Parent and child report as well as tests are subject
to sources of error. As noted, parent reports are
subject to parental bias. Child reports are also subject
to the child’s desire to please or hide bad things and
to the child’s understanding of the questions and the
response scale. Tests with good psychometric properties typically have highly constrained acceptable
answers and strict instructions for administration.
Thus, children’s spontaneous responses and strategies, including how they reach their conclusion, are
not typically measured.
For older children (7–17 years), the Children’s Depression Inventory113 and the Behavior Assessment
Systems for Children114 may be useful. The Behavior
Assessment Systems for Children is a broad-band
tool that provides a good representation of the
child’s behavioral functioning. Diagnostic and Statistical Manual of Mental Disorders, Fourth Edition115 criteria are used to establish diagnostic categories.
TOVA90 is a computerized test that provides a
continuous performance task involving sustained attention and response inhibition. It is less fun for the
children by design but provides data that can be
compared with norms (separately for girls and boys).
The Gordon Diagnostic System,116 which is similar,
is a microprocessor-based system with tasks for diagnosing attention deficits, especially ADHD. Both
tests give insight into attention and impulsivity disorders. The Conners111,112 parent and teacher rating
forms, which are frequently used when assessing
school-aged children for attention deficit and hyperkinesis, differ somewhat but also give comparable information. Finally, the Diagnostic Interview
Schedule for Children107 has the advantage of generating psychiatric diagnoses without professionallevel staff, which makes it accessible for a research
study, but it is demanding for children, particularly
those who are lower functioning.
School-Age Outcomes
Studies of school-age outcomes of high-risk children to date have been predominantly descriptive
rather than hypothesis driven. Assessments have included measurement of growth; parent and teacher
questionnaires concerning health, school performance, behavior and psychiatric disorders, quality of
life (QOL), self-esteem, impact on the family, and
examination and testing of children for neurosensory
disorders, cognition, specific neuropsychologic and
motor functioning, and academic achievement. The
impact on society of the increased survival of highrisk children and the costs to the health and educational system at school age have not been fully examined.
At school age and older, it becomes important to
1388
FOLLOW-UP CARE OF HIGH-RISK INFANTS
know how the children and their families function in
the various outcome categories; however, a noncategorical combined or functional approach may provide better information concerning the overall impact of modern intensive care methods.117
The traditional assessment of high-risk outcomes
based on specific diagnoses or problems has limitations. Health problems in normal child populations
are reported to occur in clusters, with many children
having ⬎1 type of problem.118 Additionally, high
health utilization tends to be associated with the
presence of a variety of health problems rather than
with a particular type of illness.119 Extremely preterm or high-risk children epitomize the pattern of
multiple health and educational problems. Categorization of the medical, neurologic, developmental,
and behavioral problems individually thus will not
reflect the impact of the combined effects on their
overall health status and health care and educational
service utilization. The use of diagnostic labels has
additional disadvantages in that there may be inconsistency in diagnoses. A diagnosis, furthermore, does
not convey the extent of morbidity, especially functional consequences, for individual children, caregivers, and health and educational providers.
The noncategorical approach provides for comprehensive assessment of the functional impact of neonatal intensive care survival on health and psychological outcomes. It can be applied to meet various
service- and policy-related objectives such as identification of needs for service, functional impact, and
program eligibility for Title V programs.120,121 This
approach does not preclude assessment of the obvious biological differences that distinguish one disease from another but complements the more traditional categorical approach. It has been advocated for
perinatal outcomes research but has rarely been
used.122–124
The 2 health instruments based on the generic or
noncategorical approach for late childhood and
young-adult studies124–126 are the Child Health Illness Profile (CHIP-CE)127 and the Questionnaire for
Identifying Children With Chronic Conditions
(QuICC).128 The 2 questionnaires complement each
other in that the CHIP-CE examines the profile of the
child’s general health and developmental status,
whereas the QuICC examines functioning and special health care and educational needs attributed to
chronic illness. The CHIP-CE includes 6 domains: (1)
satisfaction with health, (2) discomfort, (3) achievement, (4) risk, (5) resilience, and (6) medical and
psychosocial disorders. It is applicable from 6 to 11
years of age. The adolescent version (the CHIP-E129)
can be used from 11 years old until late adolescence.
The QuICC incorporates the consequences of chronic
physical, cognitive, psychological, and behavioral
health conditions into 3 domains: (1) functional limitations, (2) dependence on compensatory mechanisms, and (3) need for services beyond routine
care.128,130 It was developed for children with special
health care needs. The Child Health Questionnaire
(CHQ)131 is an instrument that has been designed
and normed for children 5 to 18 years of age. The
CHQ can be used independently or in conjunction
with Health Act condition-specific surveys in research or clinical settings.
QOL
There has been increasing interest in the parent
and child perception of “well-being” regarding aspects of health that are relevant to the child and
family, which has resulted in the concept of measurement of QOL.132 Although health status, functional
abilities, and QOL are 3 different concepts, they are
used interchangeably. Broadly speaking, QOL is an
all-inclusive concept that incorporates many factors
that impact on the life of an individual, of which
health is only 1 domain. Health-related QOL
(HRQL),132–135 on the other hand, is a multidimensional measure that takes into account all aspects of
health and implicitly reflects the personal values of
an individual. These values may be unrelated to
disease state or severity. It is the characteristic of
personal values that distinguishes HRQL from other
measures of health. It is important to take into account the fact that young children are constantly
developing and have varying capabilities that
change over time.136 In addition, their personal values also evolve over time and generally differ from
adults in their views about QOL. Investigators recently attempted to involve older children in measuring their own HRQL. Others have also obtained
parallel proxy ratings from parents.137
Which Groups Should Have Measurement of HRQL
It is useful to learn from the personal perspectives
of the premature children and their parents.135,137 To
date, self-reported HRQL has been measured for infants of ⬍1000-g birth weight at adolescence137; recent studies of preschool-aged children have shown
that, by parent report, the HRQL of infants ⬍32
weeks’ gestational age was significantly lower than
that for infants ⱖ32 weeks’ gestation and the reference group.138 HRQL measures also may have the
potential of providing complementary information
on subjects in pediatric clinical trials, although little
work has been done on this.
Practical Considerations
It is important that the HRQL measures include
those aspects of functioning that are important to the
child and family: they should reflect the multiple
domains of age-appropriate activities, and they
should be reliable, valid, and sensitive to changes in
QOL of the child.136,139,140 In addition, because of the
short attention span of the children, the questionnaires should be brief and impose as little burden as
possible to the respondents and staff. It is also essential that the self-completed measures are phrased in
ways that children can understand and are at the
appropriate reading level of the child.
Strictly speaking, because HRQL measures are designed to reflect the personal perspective of the patient, it is not possible to accurately obtain the data
from children younger than 7 to 8 years. However,
investigators recently showed that young children
are capable of recognizing their emotions, although
they may have limited memory and ability to carry
out logical thinking of tasks. Given the opportunity
and correct context, children as young as 7 years are
able to answer questions regarding their own health
status. However, at least grade 2 skills are necessary
for rating the feeling thermometer, and grade 6 reading skills are required to complete the Standard
Gamble technique.141 In older children, the opinion
of the child should be sought whenever possible.
Thus, unless parental proxy responses are obtained,
it is not possible to obtain HRQL measures accurately for children ⬍8 years old.
There are several modalities of administration of
the HRQL measures: self-administered questionnaires at the study site, mailed questionnaires (selfadministered at home), telephone interview, face-toface interview questionnaires at the study site or
home visit, and face-to-face interviews for younger
children (⬍8 years) using interactive pictures, videos, and computer programs. A self-completed questionnaire at the study site is obviously the most
cost-effective and suitable for older children and adolescents. A self-completed mailed questionnaire is
also cost-effective but less reliable, and the response
rates are lower than with other modes of administration.142 Telephone interviews achieve a higher
compliance than mailed questionnaires, but the validity is questionable in young children. Face-to-face
interviews are the most costly, but compliance is
greater and the data are more reliable.143
Finally, despite the growing literature, there continues to be skepticism by the medical community in
accepting self-reported HRQL as relevant and valid
information.136 Eiser and Morse136 suggests that
QOL measures need to be used more routinely in
evaluation of alternative treatments to understand
the burden experienced by the family.
The following is a brief description of the available
measures for young children:
1. The PedsQL144 is a generic 23-item developmentally appropriate questionnaire for children aged
2 to 4, 5 to 7, 8 to 12, and 13 to 18 years. Pediatric
self-report measures are available for children and
adolescents aged 5 to 18 years, and parent proxyreport measures of child HRQL are available for
children aged 2 to 18 years. A complementary
PedsQL disease-specific measure for chronic
health conditions is also available. The PedsQL is
the only generic self- and proxy-reported pediatric HRQL instrument that spans a wide range of 2
to 18 years while maintaining items and scale.144
2. The TACQOL145 is a 108-item parent form that
taps 7 domains and also measures the child’s emotional reaction to his or her health problems.
3. The Quality of Life Preschool Children (TAPQOL)
questionnaire133 has 43 items, taps 12 domains,
and is also weighted by the emotional response to
problems in health states. In a study of preschool
preterm infants between ages 1 and 4 years, who
were infants of ⬍32 weeks’ gestation, differences
were found between neonatologists’ and parents’
perception of the HRQL of preterm children.138
4. The CHQ131 is a generic QOL instrument that has
14 unique physical and psychosocial concepts. A
SUPPLEMENT
1389
parent-completed form is available for children 5
to 11 years of age (full-length, 50 items; short
form, 28 items). In addition, a parent-completed
Infant/Toddler Health Questionnaire with 8 infant concepts and 5 parent concepts is also available. The CHQ and Infant/Toddler Health Questionnaire essentially provide health profiles and
do not have a valuative component.
5. Health Status Classification System-PS146,147 is
adapted from the widely used HU12/3 systems.148 It is comprised of 12 dimensions encompassing a broad range of physical and developmental parameters, each with 3 to 5 levels per
dimension.
OBJECTIVE 4: DETERMINE THE RELEVANT ISSUES
RELATED TO SELECTION OF CONTROLS AND
TRACKING OF SUBJECTS
Well-selected control populations with background variables similar to study subjects are important for the assessment of outcomes of high-risk children. Variables to consider in selecting controls
include those related to sociodemographic status,
ethnicity, gender, and age of the child. Measures of
sociodemographic status most commonly used include parental education, age, marital status, type of
health insurance, and area of residence. Maternal
rather than paternal sociodemographic status is usually considered in the United States, because many
mothers of high-risk children are unmarried, and the
fathers may have little contact with their children.
Siblings have been suggested as ideal controls, because they share the same sociodemographic and
genetic background as the study child. However,
siblings are rarely used, because they need to be of
the same gender and of an age fairly close to that of
the study child. Additional problems in using siblings are that they, themselves, are often preterm,
and even if born at term gestation, their behavior and
school performance may be influenced by having a
“special-born” sibling.
Normal birth weight control populations are usually not needed when RCTs of perinatal therapies are
undertaken. Normal birth weight controls are often
not included when comparing the outcome of lowrisk versus high-risk birth weight groups, eg, in studies assessing the effects of chronic lung disease, brain
hemorrhage, jaundice, etc.149
In contrast to school-age studies, descriptive studies of early-childhood outcomes of high-risk children
(⬍3 years) have often not included control subjects.
However, it is currently recommended that if the
true impact of prematurity is to be identified, “normal” control populations should be included at all
ages. In 1992, Gross et al150 stressed the importance
of concurrent controls, because the cognitive tests
used in earlier time periods may be outdated. Experience with the BSID-II presents problems in that
rates of cognitive impairment are overestimated
when compared with those found at school age. In
addition, average IQ scores increase by 0.5 points per
year or 5 points per decade. Ideally, controls should
be selected at birth by matching the study infant with
the next born infant of the same race, gender, se1390
FOLLOW-UP CARE OF HIGH-RISK INFANTS
lected maternal characteristics (age, parity, etc), and
hospital of birth, excluding infants with intrauterine
infections and major congenital malformations.151–155
Race is often used as a proxy for SES in inner-city
populations. Hospital of birth may serve as a proxy
for type and quality of perinatal care and area of
residence, although high-risk mothers may be transported to tertiary perinatal centers from other areas
of residence.
Because many early-childhood studies have not
included birth controls, it may be necessary to find
controls at school age.156–160 The most commonly
used method is to randomly select a classmate of the
same gender, race, and age (within 3– 6 months) as
the study child. The school serves as a proxy for area
of residence and type and quality of education. Ideally, all the children of the same age in the child’s
school, rather than class, should be considered as
potential controls, because high-risk children repeat
grades more often than low-risk children. When children are home-schooled, attend special schools for
the disabled, or have moved out of the area, matches
are usually selected from the school the child would
have attended. Other study-design methods include
random selection of controls from regional schoolsystem records.158,161 Studies of large regional or
national populations have obtained outcomes through
linkage of birth records to school records162,163 or
linkage of birth records to military-recruitment
records164,165 with comparison of the subjects to the
rest of the population.
Follow-up rates of at least 90% should be achieved
at early childhood, at least 80% at early school age,
and at least 70% at middle-school age and during
adolescence.124,159 Follow-up rates of control subjects
are usually 10% to 20% lower than those of study
subjects. In addition, despite the best attempts, control subjects usually have subtly better home environments than study subjects. Intervention and control subjects who are lost to follow-up are usually of
lower SES than those followed. Because there are
higher rates of loss to follow-up among control lower-SES subjects, the controls are usually of higher SES
than study subjects.166,167 Also, families of children
considered healthy may be less likely to return.
Therefore, it is imperative that strategies be developed to maintain compliance, because it is difficult to
determine the “true” outcome of lost infants.
Elements needed to maintain good follow-up rates
are:
1. Enrollment of subjects before discharge from hospital and identification of a specific contact person.
2. Multiple back-up addresses of family and place of
work.
3. Postdischarge and interim visits during the first
year of life, for clinical purposes of developmental
and health surveillance, and maintenance of family involvement even when the first formal study
visit may only be at 2 years of age; ideally, comprehensive health care should be provided but is
usually not feasible.168
4. Close communication with, and respect for, health
care providers of the subjects.
5. A dedicated study coordinator who is prepared to
track and call families at night and over weekends
and a research staff prepared to accommodate
parent work schedules and to work weekends and
perform home visits if necessary.
6. Reimbursement for transportation and parking
and specific financial incentives for time spent for
the collection of study data.
7. Adequate funding for all of the above.
OBJECTIVE 5: DETERMINE ALTERNATE, LESS
COSTLY METHODS AND APPROACHES FOR
FOLLOW-UP AND THE ROLE OF THE
COMMUNITY PHYSICIAN
Because of limited funding sources, it is currently
not feasible for all NICUs to have a comprehensive
follow-up program. NICUs that do not have the resources to establish a program need to share information with the family and primary provider about
increased risk of neurodevelopmental, behavioral,
growth, and medical sequelae and facilitate referrals
to early intervention and/or a child development
center. Clinical programs with limited funding available, however, may use screening methods such as a
phone or in-house parent interview as a first-stage
screen to determine if more in depth assessments are
warranted or if referrals to early intervention or educational resources are indicated. In addition, a clinical program with limited resources may by necessity
offer a single follow-up visit. An optimal assessment
age combines a short interval between discharge and
assessment age (to minimize tracking) with a developmental age at which the accurate diagnosis of
motor and developmental handicaps is feasible. The
approach should facilitate a timely diagnosis and
referrals as needed for families and center surveillance objectives. The feasibility of collecting some
annual well-defined short-term follow-up data for all
NICUs continues to improve. The ability to provide
feedback on individual child outcome and support
for families is available to all NICUs.
The NICHD Network identified 18 to 22 months’
corrected age as the optimal time for a single visit.
Interim visits or phone contacts are recommended
for tracking purposes.
Community physicians can take an active role participating in follow-up by performing periodic developmental screening and responding to requests for
health information on a child who does not return to
the follow-up program. This requires a partnership
between the community physicians and the tertiary
care center and the use of standardized tools. In
addition, follow-up programs can provide valuable
information about the child’s growth, neurodevelopment, and behavior to the community physician.
Table 6 contrasts 4 levels of management for the
individual provider, for programs with clinical surveillance or referral objectives, and for programs
with combined research and clinical objectives.
Whereas the clinical program may maintain a database with a limited number of key variables, screen
children (an important service for families), and re-
fer, the research program has the opportunity to
develop more sophisticated protocols that are hypothesis driven and explore novel assessments.
Screening tools such as the Ages and Stages92 and
CAT/CLAMS93 may be administered during an office visit or over the phone. Primary care providers
who perform a screen may share information with
the follow-up or diagnostic program and refer families as needed. Diagnostic and/or follow-up programs reciprocate by sharing results of comprehensive evaluations and recommendations. Primary care
physicians can collaborate by completing study
forms requesting data on growth, medical status,
vision, and hearing.
OBJECTIVE 6: DETERMINE THE CHALLENGES
ENCOUNTERED IN MULTICENTER NETWORKS
Multicenter networks have the advantage of being
able to assess low-incidence neonatal illness such as
perinatal asphyxia and achieve adequate sample
sizes for hypothesis-driven studies within a shorter
period of time than a single-center study.169,170 However, a number of challenges must be addressed if a
network is going to succeed:
1. Achieving standardization of study protocols,
manuals, definitions, and methodology among
centers in diverse geographic areas is a major
challenge for networks. Multicenter networks
vary in their approaches to planning well-coordinated follow-up studies.
2. Achieving adequate follow-up rates is a major
challenge, particularly with populations having
diverse SESs, cultures, and primary spoken languages. The NICHD network endorses a follow-up rate of at least 80% for centers at 18 and 30
months’ corrected age.
3. A third challenge for multicenter networks is to
define the critical study population and the interval for enrollment. Network centers may enroll
infants with a birth weight of ⱕ1000 g annually
and follow them for 18 months as a framework for
multicenter trials. This approach facilitates on-going standardization of follow-up protocols and
reliability among examiners. An alternate approach is to enroll children born ⱕ1000 g every 3
years and follow each cohort for 3 years. This
approach has somewhat higher costs, follows children to preschool age, and has changing protocols
consistent with the age assessed. Networks
should identify their unique study populations
with high illness severity and poor outcomes for
additional study (eg, extracorporeal membrane
oxygenation patients).
4. A fourth challenge is to identify and enroll an
appropriate cost-effective control population.
The following 4 multicenter networks provide insights into the complexities of conducting multicenter follow-up studies.
Vermont Oxford Network
The Vermont Oxford Network is a nonprofit voluntary collaboration of NICUs dedicated to improvSUPPLEMENT
1391
1392
FOLLOW-UP CARE OF HIGH-RISK INFANTS
45
Normal and disabled preschooler in early
intervention; children with
developmental disabilities in early
elementary school
Excellent correlation with VABS and
WeeFIM; concurrent validity and
WISC-R
Daily living (adaptive), motor,
communication, cognitive, personalsocial
Test-retest and interrater reliability good
to excellent
Discriminative measure of developmental
skills in children aged birth to 8 y
Battelle97
30
Preschool and long-term outcome in
VLBW children; use in
developmental disabilities
Split half for domains and composite,
excellent; test-retest reliability,
excellent; interrater reliability, good
Excellent correlation with school-age IQ
Daily living skills, motor,
communication, socialization
Descriptive measure of communication,
daily living, socialization, and motor
skills for children aged birth to 18 y,
disabled and nondisabled
VABS96
45
Parent interview format for children
with cerebral palsy; clinical
evaluation after rhizotomy and
traumatic brain injury
Concurrent with Battelle and
WeeFIM
Excellent test-retest and interrater
reliability
Motor, self-care, social
Discriminative measure of functional
limitations in children aged 6 mo
to 7.5 y
PEDI98
WeeFIM indicates Functional Independence Measure for Children; PEDI, Pediatric Evaluation of Disability Inventory; VABS, Vineland Adaptive Behavior Scale; WISC-R, Wechsler Intelligence Scale
for Children-Revised; AAQ, Amount of Assistance Questionnaire.
Excellent test-retest and interrater
reliability; equivalence reliability
of telephone interview
Content validation by expert group;
concurrent validity with VABS,
Battelle, AAQ, and PEDI; total
WeeFIM at kindergarten entry
correlates with special-education
resources
Measure of functional status at age
5.5 y in VLBW CryoROP cohort;
4-y outcome in multicenter
surfactant comparison trials;
functional goal-setting in children
with cerebral palsy, spina bifida,
and genetic and acquired
disabilities
20
Discipline-free measure of consistent
performance of functional skills in
children aged 6 mo to 8 y and
children through adolescence with
neurodevelopmental disabilities
Self-care, mobility, cognition
WeeFIM95
Psychometric Properties of WeeFIM, Vineland, Battelle, and Pediatric Evaluation of Disability Inventory
Administration
time, min
Application
Validity
Reliability
Domains
Purpose
TABLE 6.
ing the quality and safety of medical care for newborn infants and their families through a coordinated
program of clinical trials, research, education, and
quality-improvement projects. Established in 1988,
the network has grown to ⬎400 member centers
representing NICUs throughout the United States
and 17 other countries. The network maintains a
database of information about the care and shortterm outcomes of VLBW infants. In 1998, the Vermont Oxford Network began to collect follow-up
data for ELBW infants at 2 years of age. To participate, centers had to have a follow-up clinic, evaluate
children until 2 years of age, and administer the
BSID-II.
individuals living with a disability. It supports a
public health approach to the prevention of birth
defects with surveillance systems, epidemiologic
studies, and prevention programs. An example of a
successful population-based surveillance system operating continuously since 1968 is the Metropolitan
Atlanta Congenital Defects Program. Success is
maintained with intensive case ascertainment, a case
registry, a surveillance laboratory, and professional
training.
Canadian Neonatal Network
1. Do they attain the social/educational status of
their parents, or do they demonstrate downward
mobility (measured by comparing educational
and occupational attainment, associated rating of
prestige, and earning capacity)?
2. Can they live independently and support themselves?
3. Do they develop normal social and family relationships (measured by specific questionnaires
and from their history of permanent personal relationships of marriage)?
4. Does catch-up growth occur in late adolescence?
5. What are the long-term metabolic and cardiovascular implications of growth failure in utero, neonatally, and during infancy and of catch-up
growth during various time periods of childhood
and adolescence?
6. What are the long-term health effects of chronic
medical sequelae of prematurity (especially pulmonary, visual, and neurologic)?
7. Do they have higher rates of psychiatric disorders,
substance abuse, contact with police, and incarceration?
8. Does the ADHD associated with prematurity persist into adulthood?
9. Are there intergenerational effects of high-risk
birth, prematurity, and/or low birth weight, and,
if so, is it possible to break the cycle?
The Canadian Neonatal Network was developed
in 1996. Data were prospectively collected by trained
abstractors at 17 tertiary-level NICUs across Canada.
This network has assessed variations in practice relative to outcome. As a result, more regionalized approaches to follow-up are in place in Canada. A
follow-up network was developed in Quebec in 2001
with funds from the Fonds de la Recherche en Santé
du Québec and included all infants already enrolled
in 6 follow-up programs.
NICHD Research Follow-up Study
The NICHD Research Follow-up Study was initiated in 1993 and consists of 16 academic tertiary care
centers. The primary study objective for the NICHD
Follow-up Network is to track and successfully evaluate ⬎80% of infants entered in to the generic database with birth weights of 401 to 1000 g born after
January 1, 1993, and infants enrolled in clinical trials
with neurodevelopment as an outcome. Currently,
the network is conducting a pilot 30-month neurodevelopmental outcome study on infants enrolled in
the glutamine trial. The network has an infrastructure that includes a steering committee, protocol review committee, study manuals, standardized definitions, training protocols, and a data-coordinating
center. Annual workshops and regular conference
calls and meetings facilitate communication, coordination, and standardization. The network has established standardized methods to assess growth, motor skills, cognitive skills, language and behavior,
and strict criteria for annual certification of Bayley
examiners and neurologic examiners. All network
study interviews and assessments are available in
English and Spanish. Studies and assessments are
conducted by network investigators at the individual
center and have resulted in numerous publications.
Centers for Disease Control and Prevention Network
for Developmental Disabilities and Birth Defects:
Surveillance System and Centers of Excellence
This national surveillance system under the National Center on Birth Defects and Developmental
Disabilities was mandated by the Children’s Health
Act of 2000 and implemented in April, 2001. The
mission is to prevent birth defects and developmental disabilities, pursue the causes and risk factors
associated with defects, and promote wellness of
OBJECTIVE 7A. IDENTIFY GAPS IN KNOWLEDGE
ABOUT HIGH-RISK SURVIVORS IN YOUNG
ADULTHOOD
OBJECTIVE 7B. FURTHER AREAS OF
INVESTIGATION
The following areas of investigation with a potential to improve and optimize the outcomes of highrisk infants were identified. The recommendations
were:
1. to propose hypothesis-driven studies and RCTs to
identify the mechanisms that contribute to both
injury and plasticity and recovery of the CNS,
including animal and tissue studies
2. to identify the assessment strategies and schedules that are the most predictive of long-term
outcomes and identify earlier surrogate markers
for long-term outcomes
3. to determine the predictive value of neonatal imaging modalities in the prediction of neurodevelopmental outcome
4. to identify perinatal interventions that contribute
to positive neurodevelopmental outcomes
SUPPLEMENT
1393
5. to conduct population-based studies to determine
the true societal burden of illness within a geographic region or a national sample (currently, the
vast majority of studies report on subgroups of
infants such as VLBW, ELBW, chronic lung disease, asphyxia, small for gestational age, etc); a
geographic sample would include all infants born
within a geographic region (such a study could
ask questions regarding the total population of
infants born within a specific time interval, in a
specific region, and followed for a predetermined
length of time)
OBJECTIVE 8: PROPOSE RESEARCH QUESTIONS
1. What are the mechanisms by which intrauterine/neonatal inflammation/cytokines and hypoxia ischemia produce CNS injury, and what are
the effects on long-term outcome?
2. What are the mechanisms contributing to and the
interventions that can further reduce the severity
of chronic lung disease in ELBW infants?
3. Does stress and/or recurrent pain in the neonate
result in permanent physiologic changes in response to pain?
4. What threshold of bilirubin and what duration of
hyperbilirubinemia result in neurodevelopmental injury?
5. What modalities of resuscitation contribute to
optimal neurodevelopmental outcome of ELBW
infants?
6. What is the outcome of the macro premature
infant (1500- to 2500-g birth weight)?
7. What is the impact of major congenital malformations and cardiac anomalies on outcome, and
what are the effective perinatal interventions?
8. What are the neurodevelopmental and growth
morbidities associated with monochorionic twin
pregnancy and higher-order multiples?
9. What is the cost/benefit of follow-up care and
assessment?
10. What is the impact of neonatal and postdischarge
nutrition on early catch-up growth and developmental outcome?
11. What is the role of early calorie and protein
intake and human milk on brain growth, and
what are the long-term effects on cardiovascular
and endocrine function disorder?
12. What is the impact of specific antenatal and neonatal interventions (magnesium sulfate, antenatal steroids, postnatal steroids, repeat doses of
indomethacin antioxidants) on brain growth and
function?
13. What is the impact of medical and/or surgical
interventions for NEC on outcomes? What are
the potential interventions to prevent NEC?
14. What are the neonatal neuroimaging techniques
that best identify neurologic insult and predict
neurologic and developmental outcome?
15. What are the genetic factors contributing to CNS
morbidity and recovery? Is there a genomic vulnerability to injury?
16. What are the mechanisms by which an enriched
environment contributes to plasticity? Are there
critical periods for intervention?
1394
FOLLOW-UP CARE OF HIGH-RISK INFANTS
17. What are the best screening tools for identification of infants at risk of adverse neurodevelopmental sequelae?
18. What are the best early surrogate markers for
long-term neurodevelopmental disability?
Systematic long-term outcome studies of extremely premature or ELBW infants are indispensable for perinatologists and neonatologists: (1) outcome data facilitate informed decision-making in the
NICU and the development of strategies for identifying infants at high risk for medical and neurodevelopmental sequelae; (2) families of infants identified as high risk may be guided to comprehensive
follow-up and early intervention, and (3) morbidity
rates may be used to estimate resources that society
should be prepared to provide to optimize QOL of
survivors and their families. Considerable challenges, however, secondary to limitations of staffing,
costs, and expertise with assessments confront investigators performing long-term outcome studies and
these challenges contribute to a paucity of high-quality outcome data. Limitations of many studies include small sample sizes, heterogeneity of cohorts,
heterogeneity of methodology, limited information
about both perinatal clinical practice and perinatal
complications associated with long-term sequelae,
and heterogeneity of specific neurodevelopmental
assessments and age of outcome.
CONCLUSIONS
Although single-center studies may address some
of these issues and answer important questions, multicenter research networks with standardized study
manuals, protocols, and methods are needed for representative surveillance and clinical trials. It is hoped
that this supplement provides information that will
help follow-up program directors and primary care
providers make choices about assessment protocols
based on options provided and practical considerations.
Unfortunately, ELBW infants remain at increased
risk of neurodevelopmental sequelae. Well-conducted multicenter trials, which include neurodevelopmental follow-up, continue to be the catalysts that
allow investigators to identify the mechanisms that
contribute to injury and recovery and the perinatal
interventions that contribute to positive neurodevelopmental outcome.
REFERENCES
1. Barrington KJ. The adverse neuro-developmental effects of postnatal
steroids in the preterm infant: a systematic review of RCTs. BMC
Pediatr. 2001;1:1
2. Thebaud B, Lacaze-Masmonteil T, Watterberg K. Postnatal glucocorticoids in very preterm infants: “the good, the bad, and the ugly”?
Pediatrics. 2001;107:413– 415
3. Kinsey VE, Arnold HJ, Kalina RE, et al. PaO2 levels and retrolental
fibroplasia: a report of the cooperative study. Pediatrics. 1977;60:
655– 668
4. Msall ME, Phelps DL, DiGaudio KM, et al. Severity of neonatal retinopathy of prematurity is predictive of neurodevelopmental functional outcome at age 5.5 years. Pediatrics. 2000;106:998 –1005
5. Avery ME, Tooley WH, Keller JB, et al. Is chronic lung disease in low
birth weight infants preventable? A survey of eight centers. Pediatrics.
1987;79:26 –30
6. Horbar JD, Rogowski J, Plsek PE, et al. Collaborative quality improvement for neonatal intensive care. Pediatrics. 2001;107:14 –22
7. Richardson DK, Shah BL, Frantz ID 3rd, Bednarek F, Rubin LP, McCormick MC. Perinatal risk and severity of illness in newborns at 6
neonatal intensive care units. Am J Public Health. 1999;89:511–516
8. Vohr BR, Wright LL, Dusick AM, et al. Center differences and outcomes of extremely low birth weight infants. Pediatrics. 2004;113:
781–789
9. American Academy of Pediatrics, Committee on Fetus and Newborn.
The initiation or withdrawal of treatment for high-risk newborns.
Pediatrics. 1995;96:362–363
10. American Academy of Pediatrics, Committee on Practice and Ambulatory Medicine. Recommendations for preventative pediatric health
care. Pediatrics. 2000;105:645– 646
11. Perlman JM. Neurobehavioral deficits in premature graduates of intensive care—potential medical and neonatal environmental risk factors. Pediatrics. 2001;108:1339 –1348
12. Perlman JM. White matter injury in the preterm infant: an important
determination of abnormal neurodevelopment outcome. Early Hum
Dev. 1998;53:99 –120
13. Hack M, Fanaroff AA. Outcomes of children of extremely low birthweight and gestational age in the 1990’s. Early Hum Dev. 1999;53:
193–218
14. Botting N, Powls A, Cooke RW, Marlow N. Attention deficit hyperactivity disorders and other psychiatric outcomes in very low birthweight children at 12 years. J Child Psychol Psychiatry. 1997;38:931–941
15. Stjernqvist K, Svenningsen NW. Ten-year follow-up of children born
before 29 gestational weeks: health, cognitive development, behaviour
and school achievement. Acta Paediatr. 1999;88:557–562
16. Cooke RW, Abernethy LJ. Cranial magnetic resonance imaging and
school performance in very low birth weight infants in adolescence.
Arch Dis Child Fetal Neonatal Ed. 1999;81:F116 –F121
17. Stewart AL, Rifkin L, Amess PN, et al. Brain structure and neurocognitive and behavioural function in adolescents who were born very
preterm. Lancet. 1999;353:1653–1657
18. Stevenson DK, Wright LL, Lemons JA, et al. Very low birth weight
outcomes of the National Institute of Child Health and Human Development Neonatal Research Network, January 1993 through December
1994. Am J Obstet Gynecol. 1998;179:1632–1639
19. Vohr BR, Wright LL, Dusick AM, et al. Neurodevelopmental and
functional outcomes of extremely low birth weight infants in the
National Institute of Child Health and Human Development Neonatal
Research Network, 1993–1994. Pediatrics. 2000;105:1216 –1226
20. Ment LR, Vohr B, Allan W, et al. The etiology and outcome of cerebral
ventriculomegaly at term in very low birth weight preterm infants.
Pediatrics. 1999;104:243–248
21. Chamnanvanakij S, Rogers CG, Luppino C, Broyles SR, Hickman J,
Perlman JM. Linear hyperechogenicity within the basal ganglia and
thalamus of preterm infants. Pediatr Neurol. 2000;23:129 –133
22. Meaney MJ, Diorio J, Francis D, et al. Postnatal handling increases the
expression of cAMP-inducible transcription factors in the rat
hippocampus: the effects of thyroid hormones and serotonin. J Neurosci. 2000;20:3926 –3935
23. McEwen BS. Stress and hippocampal plasticity. Annu Rev Neurosci.
1999;22:105–122
24. Sapolsky RM. Why stress is bad for your brain. Science. 1996;273:
749 –750
25. Ballard RA, Ballard PL. Antenatal hormone therapy for improving the
outcome of the preterm infant. J Perinatol. 1996;16:390 –396
26. Effect of corticosteroids for fetal maturation on perinatal outcomes.
NIH Consensus Development Panel on the Effect of Corticosteroids for
Fetal Maturation on Perinatal Outcomes. JAMA. 1995;273:413– 418
27. Gardner MO, Papile LA, Wright LL. Antenatal corticosteroids in pregnancies complicated by preterm premature rupture of membranes.
Obstet Gynecol. 1997;90:851– 853
28. Jobe AH. Glucocorticoids in perinatal medicine: misguided rockets?
J Pediatr. 2000;137:1–3
29. Yeh TF, Lin YJ, Huang CC, et al. Early dexamethasone therapy in
preterm infants: a follow-up study. Pediatrics. 1998;101(5). Available at:
www.pediatrics.org/cgi/content/full/101/5/e7
30. American Academy of Pediatrics, Committee on Fetus and Newborn.
Postnatal corticosteroids to treat or prevent chronic lung disease in
preterm infants. Pediatrics. 2002;109:330 –338
31. Sapolsky RM, Uno H, Rebert CS, Finch CE. Hippocampal damage
associated with prolonged glucocorticoid exposure in primates. J Neurosci. 1990;10:2897–2902
32. Hollingshead A. Four Factor Index of Social Status. New Haven, CT:
University Press; 1975
33. Bradley RH, Corwyn RF. Socioeconomic status and child development. Annu Rev Psychol. 2002;53:371–399
34. Entwisle DR, Astone NM. Some practical guidelines for measuring
youth’s race/ethnicity and socio economic status. Child Dev. 1994;65:
1521–1540
35. Hauser RM. Measuring socioeconomic status in studies of child development. Child Dev. 1994;65:1541–1545
36. Aylward GP. The relationship between environmental risk and developmental outcome. J Dev Behav Pediatr. 1992;13:222–229
37. Bayley N. Bayley Scales of Infants Development-II. San Antonio, TX: The
Psychological Corporation; 1993
38. Bradley RH, Caldwell BM, Brisby J, Magee M, Whiteside L, Rock SL.
The HOME inventory: a new scale for families of pre- and early
adolescent children with disabilities. Res Dev Disabil. 1992;13:313–333
39. Bradley RH, Caldwell BM. The relation of infants’ home environments
to achievement test performance in first grade: a follow-up study. Child
Dev. 1984;55:803– 809
40. Drillien C. Abnormal neurologic signs in the first year of life in
low-birth weight infants: possible prognostic significance. Dev Med
Child Neurol. 1997;14:575–584
41. Weisglas-Kuperus N, Baerts W, Smrkovsky M, Sauer PJ. Effects of
biological and social factors on the cognitive development of very low
birth weight children. Pediatrics. 1993;92:658 – 665
42. Dezoete JA, MacArthur BA, Tuck B. Prediction of Bayley and StanfordBinet scores with a group of very low birthweight children. Child Care
Health Dev. 2003;29:367–372
43. Lee H, Barratt MS. Cognitive development of preterm low birth weight
children at 5 to 8 years old. J Dev Behav Pediatr. 1993;14:242–249
44. Blasco PA. Preterm birth: to correct or not to correct. Dev Med Child
Neurol. 1989;31:816 – 821
45. Lems W, Hopkins B, Samson JF. Mental and motor development in
preterm infants: the issue of corrected age. Early Hum Dev. 1993;34:
113–123
46. Dewey DG, Crawford SG, Creighton DE, Sauve RS. Long-term neuropsychological outcomes in very low birth weight children free of
sensorineural impairments. J Clin Exp Neuropsychol. 1999;21:851– 865
47. Battaglia FC, Lubchenco LO. A practical classification of newborn
infants by weight and gestational age. J Pediatr. 1967;71:159 –163
48. Lubchenco LO, Hansman C, Boyd E. Intrauterine growth in length and
head circumference as estimated from live births at gestational ages
from 26 to 42 weeks. Pediatrics. 1966;37:403– 408
49. Usher R, McLean F. Intrauterine growth of live-born Caucasian infants
at sea level: standards obtained from measurements in 7 dimensions of
infants born between 25 and 44 weeks of gestation. J Pediatr. 1969;74:
901–910
50. Arbuckle TE, Sherman GJ. An analysis of birth weight by gestational
age in Canada. CMAJ. 1989;140:157–160, 165
51. Alexander GR, Himes JH, Kaufman RB, Mor J, Kogan M. A United
States national reference for fetal growth. Obstet Gynecol. 1996;87:
163–168
52. Ehrenkranz RA, Younes N, Lemons JA, et al. Longitudinal growth of
hospitalized very low birth weight infants. Pediatrics. 1999;104:280 –289
53. Hamill PV, Drizd TA, Johnson CL, Reed RB, Roche AF, Moore WM.
Physical growth: National Center for Health Statistics percentiles. Am J
Clin Nutr. 1979;32:607– 629
54. Lothman T, Roche AF, Martorell R, eds. Anthropometric Standardization
Reference Manual. Champaign, IL: Human Kinetics Books; 1988
55. Amiel-Tison C. Neuromotor Status. Boston, MA: Little, Brown &
Company; 1987
56. Fenichel G. Clinical Pediatric Neurology: A Signs and Symptoms Approach.
3rd ed. Philadelphia, PA: WB Saunders; 1997
57. Swaiman K. Neurological examination of the older child. In: Swaiman
K, Ashwal S, eds. Pediatric Neurology. Vol 1. 3rd ed. Boston, MA:
Mosby; 1999:14 –30
58. Baker LL, Stevenson DK, Enzmann DR. End-stage periventricular
leukomalacia: MR evaluation. Radiology. 1988;168:809 – 815
59. Olsen P, Paakko E, Vainionpaa L, Pyhtinen J, Jarvelin MR. Magnetic
resonance imaging of periventricular leukomalacia and its clinical
correlation in children. Ann Neurol. 1997;41:754 –761
60. Barkovich AJ, Kjos BO, Jackson DE Jr, Norman D. Normal maturation
of the neonatal and infant brain: MR imaging at 1.5 T. Radiology.
1988;166:173–180
61. Counsell SJ, Maalouf EF, Fletcher AM, et al. MR imaging assessment of
myelination in the very preterm brain. AJNR Am J Neuroradiol. 2002;
23:872– 881
62. van de Bor M, den Ouden L, Guit GL. Value of cranial ultrasound and
magnetic resonance imaging in predicting neurodevelopmental outcome in preterm infants. Pediatrics. 1992;90:196 –199
SUPPLEMENT
1395
63. Wilson DA, Steiner RE. Periventricular leukomalacia: evaluation with
MR imaging. Radiology. 1986;160:507–511
64. Johnson AJ, Lee BC, Lin W. Echoplanar diffusion-weighted imaging in
neonates and infants with suspected hypoxic-ischemic injury: correlation with patient outcome. AJR Am J Roentgenol. 1999;172:219 –226
65. Forbes KP, Pipe JG, Bird R. Neonatal hypoxic-ischemic encephalopathy:
detection with diffusion-weighted MR imaging. AJNR Am J Neuroradiol. 2000;21:1490 –1496
66. Huppi PS, Murphy B, Maier SE, et al. Microstructural brain development after perinatal cerebral white matter injury assessed by diffusion
tensor magnetic resonance imaging. Pediatrics. 2001;107:455– 460
67. Wood E, Rosenbaum P. The gross motor function classification system
for cerebral palsy: a study of reliability and stability over time. Dev
Med Child Neurol. 2000;42:292–296
68. Palisano RJ. Validity of goal attainment scaling in infants with motor
delays. Phys Ther. 1993;73:651– 658; discussion 658 – 660
69. Ment LR, Vohr B, Allan W, et al. Change in cognitive function over
time in very low-birth-weight infants. JAMA. 2003;289:705–711
70. Beery K. Developmental Test of Visual Motor Integration. 4th ed. Parsippany, NJ: Modern Curriculum Press; 1997
71. Bracken BA. Bracken Basic Concepts Scale. Version 2. San Antonio, TX:
The Psychological Corporation; 1998
72. Cohen M. Children’s Memory Scale. San Antonio, TX: The Psychological
Corporation; 1997
73. Conners CK. Conners Continuous Performance Test for Windows [computer program]. Version 2. North Tonawanda, NY: International Psychological Services; 2000
74. Delis D, Kramer JH, Kaplan E, Ober BA. California Verbal Learning
Test-Children. San Antonio, TX: The Psychological Corporation; 1994
75. Elliott C. Differential Ability Scales. Introductory and Technical Handbook.
New York, NY: The Psychological Corporation; 1990
76. Gioia G, Isquith PK, Guy SC, Kenworthy L. Behavior Rating Inventory of
Executive Function, Professional Manual. Odessa, FL: Psychological Assessment Resources, Inc; 2000
77. Kaufman A, Kaufman NL. Interpretive Manual for the Kaufman Assessment Battery for Children. Circle Pines, MN: American Guidance
Service; 1983
78. Korkman M, Kirk U, Kemp S. Neuropsychological Test. San Antonio, TX:
The Psychological Corporation; 1997
79. McCarthy D. Manual for the McCarthy Scales of Children’s Abilities. New
York, NY: The Psychological Corporation; 1972
80. Klove H. Clinical neuropsychology. In: Forster FM, ed. The Medical
Clinics of North America. New York, NY: WB Saunders; 1963
81. Roid G. The Stanford-Binet Intelligence Scales. 4th ed. Itasca, IL: Riverside
Publishing Co; 2003
82. Sheslow D, Adams W. Wide Range Assessment of Memory and Learning
Administration Manual. Wilmington, DE: Jastek Associates; 1990
83. Wechsler D. Wechsler Preschool and Primary Scale of Intelligence-III. San
Antonio, TX: The Psychological Corporation; 2002
84. Wechsler D. The Wechsler Abbreviated Scale of Intelligence. San Antonio,
TX: The Psychological Corporation; 1999
85. Wechsler D. The Wechsler Intelligence Scale for Children. 4th ed. San
Antonio, TX: The Psychological Corporation; 2003
86. Colarusso RP, Hammill DD. Motor-Free Visual Perception Test Manual.
Los Angeles, CA: Western Psychological Services; 1972
87. Aylward G. The Bayley Infant Neurodevelopmental Screener. San Antonio,
TX: The Psychological Corporation; 1995
88. Kaufman A, Kaufman NL. Kaufman Brief Intelligence Test Manual. Circle
Pines, MN: American Guidance Service; 1990
89. Mullen E. Mullen Scales of Early Learning. AGS Edition. Circle Pines,
MN: American Guidance Service; 1995
90. Greenberg L, Kindschi CL, Corman CM. TOVA: Test of Variables of
Attention. Los Alamitos, CA: Universal Attention Disorders, Inc; 2000
91. Roid G. The Leiter International Performance Scales. Woodale, IL: Stoelting Publishing Company; 2003
92. Bricker D, Squires J. Ages & Stages Questionnaires (ASQ). Baltimore,
MD: Paul H. Brookes Publishing Co; 1995
93. Capute A. The Capute Scales. CAT-CLAMS. Instruction Manual. Baltimore, MD: Kennedy Fellows Association; 1996
94. Glutting J, Adams W, Sheslow D. Wide Range Intelligence Test. Wilmington, DE: Jastek Associates; 2000
95. Msall M, DiGaudio K, Rogers BT, et al. The Functional Independence
Measure for Children (WeeFIM): Conceptual basis and pilot use in
children with developmental disabilities. Clin Pediatr (Phila). 1994;33:
421– 430
96. Sparrow SS, Balla DA, Cicchetti DV. Vineland Adaptive Behavior Scales
Interview Edition: Survey Form Manual. A revision of the Vineland Social
1396
FOLLOW-UP CARE OF HIGH-RISK INFANTS
97.
98.
99.
100.
101.
102.
103.
104.
105.
106.
107.
108.
109.
110.
111.
112.
113.
114.
115.
116.
117.
118.
119.
120.
121.
122.
123.
124.
125.
Maturity Scale by E. A. Doll. Circle Pines, MN: American Guidance
Service; 1984
Newborg JSJ, Guidubaldi J, Stock JR, Wnek L. Battelle Developmental
Inventory and Recalibrated Technical Data and Norms: Examiner’s Manual.
Allen, TX: DLM, LINC Associates; 1984
Haley SM, Coster WJ, Ludlow LH, Haltiwanger JT, Andrellos PJ.
Pediatric Evaluation of Disability. Nashville, TN: Ellsworth and Vandermeer Press, Ltd; 1997
Stein RE, Jessop DJ. Functional status II(R). A measure of child health
status. Med Care. 1990;28:1041–1055
Fenson L, Dale P, Resnick J, et al. MacArthur Communicative Development Inventories. San Diego, CA: Singular Publishing; 1993
Dunn LM, Dunn LM. Peabody Picture Vocabulary Test-III. Circle Pines,
MN: American Guidance Service; 1997
Gardner M. Expressive One-Word Picture Vocabulary Test. 2000 Ed. Wilmington, DE: Wide Range, Inc; 2000
Brownell R. Receptive One-Word Picture Vocabulary Test. 2000 Ed. Wilmington, DE: Wide Range, Inc; 2000
Rice M, Wexler K. Rice/Wexler Test of Early Grammatical Impairment. San
Antonio, TX: The Psychological Corporation; 2001
Semel E, Wiig EH, Secord WA. Clinical Evaluation of Language Fundamentals III. San Antonio, TX: The Psychological Corporation; 2003
Cambridge Neuropsychological Test Automated Battery [computer program]. Version 1. Cambridge, United Kingdom: Cambridge Cognition;
2002
Costello A, Edelbrock CS, Costello AJ. Validity of the NIMH Diagnostic Interview Schedule: a comparison between psychiatric and pediatric referrals. J Abnorm Child Psychol. 1985;13:579 –595
Briggs-Gowan MJ, Carter AS, Irwin JR, Wachtel K, Cicchetti DV. The
Brief Infant-Toddler Social Emotional Assessment: screening for socialemotional problems and delays in competence. J Pediatr Psychol. 2004;
29:143–155
Achenbach TM. CBCL 2–3. Burlington, VT: University of Vermont,
Department of Psychiatry; 1992
Achenbach TM. Integrative Guide for the 1991 CBCL-4-18 YSR and TRF
Profiles. Burlington, VT: University of Vermont, Department of
Psychiatry; 1991
Connors CK. Conners Teaching Rating Scales Revised. San Antonio, TX:
The Psychological Corporation; 1996
Connors CK. Conners Parent Rating Scales Revised. San Antonio, TX: The
Psychological Corporation; 1996
Kovacs M. The Children’s Depression Inventory. North Tonawanda, NY:
Mental Health Systems; 1995
Reynolds CR, Kamphaus RW. Behavior Assessment Systems for Children.
Circle Pines, MN: American Guidance Service; 1992
American Psychiatric Association. Diagnostic and Statistical Manual of
Mental Disorders, Fourth Edition. Washington, DC: American Psychiatric Association; 1994
Gordon M. The Gordon Diagnostic System. Boulder, CO: Gordon
Systems; 1983
Kirby RS. A parable wrapped in an enigma. Population-based assessments of outcomes among high-risk neonates are even less achievable
in the age of clinical informatics. Arch Pediatr Adolesc Med. 1999;153:
789 –792
Starfield B, Katz H, Gabriel A, et al. Morbidity in childhood—a longitudinal view. N Engl J Med. 1984;310:824 – 829
Starfield B, Hankin J, Steinwachs D, et al. Utilization and morbidity:
random or tandem? Pediatrics. 1985;75:241–247
Ireys HT, Nelson RP. New federal policy for children with special
health care needs: implications for pediatricians. Pediatrics. 1992;90:
321–327
Stein RE, Bauman LJ, Westbrook LE, Coupey SM, Ireys HT. Framework for identifying children who have chronic conditions: the case for
a new definition. J Pediatr. 1993;122:342–347
Palta M, Sadek-Badawi M, Evans M, Weinstein MR, McGuinness G; for
the Newborn Lung Project. Functional assessment of a multicenter
very low-birth-weight cohort at 5 years. Arch Pediatr Adolesc Med.
1999;154:23–29
Jackson DJ, Lang JM, Ganiats TG. Epidemiological issues in perinatal
outcomes research. Paediatr Perinat Epidemiol. 1999;13:392– 404
Hack M, Taylor HG, Klein N, Mercuri-Minich N. Functional limitations and special health care needs of 10- to 14-year-old children
weighing less than 750 grams at birth. Pediatrics. 2000;106:554 –560
Hack M, Flannery DJ, Schluchter M, Cartar E, Borawski E, Klein N.
Young adult health and risk taking behavior of very low birth weight
children (VLBW, ⬍1.5kg) [abstract]. Pediatr Res. 2001;49:312A
126. Hack M, Flannery DJ, Schluchter M, Cartar L, Borawski E, Klein N.
Outcomes in young adulthood for very-low-birth-weight infants.
N Engl J Med. 2002;346:149 –157
127. Starfield B, Riley AW, Green BF, et al. The adolescent child health and
illness profile. A population-based measure of health. Med Care. 1995;
33:553–566
128. Stein RE, Westbrook LE, Bauman LJ. The Questionnaire for Identifying
Children with Chronic Conditions: a measure based on a noncategorical approach. Pediatrics. 1997;99:513–521
129. Starfield B. Child Health and Illness Profile. Adolescent Edition. Baltimore, MD: Johns Hopkins University; 2003
130. Stein RE, Silver EJ. Operationalizing a conceptually based noncategorical definition: a first look at US children with chronic conditions. Arch
Pediatr Adolesc Med. 1999;153:68 –74
131. Langgraff J, Ware JE. Child Health Questionnaire. Boston, MA: Health
Act; 2003
132. Gill TM, Feinstein AR. A critical appraisal of the quality of quality-oflife measurements. JAMA. 1994;272:619 – 626
133. Fekkes M, Theunissen NC, Brugman E, et al. Development and psychometric evaluation of the TAPQOL: a health-related quality of life
instrument for 1–5-year-old children. Qual Life Res. 2000;9:961–972
134. Varni JW, Seid M, Rode CA. The PedsQL: measurement model for the
pediatric quality of life inventory. Med Care. 1999;37:126 –139
135. Rosenbaum P, Saigal S. Quality of life and pharmacoeconomics in
clinical trials. In: Spilker B, ed. Measuring Health-Related Quality of Life
in Pediatric Populations: Conceptual Issues. 2nd ed. Philadelphia, PA:
Lippincott-Raven Publishers; 1996:785–791
136. Eiser C, Morse R. Can parents rate their child’s health-related quality
of life? Results of a systematic review. Qual Life Res. 2001;10:347–357
137. Saigal S, Rosenbaum PL, Feeny D, et al. Parental perspectives of the
health status and health-related quality of life of teen-aged children
who were extremely low birth weight and term controls. Pediatrics.
2000;105:569 –574
138. Theunissen N, Veen S, Fekkes M, et al. Quality of life in preschool
children born preterm. Dev Med Child Neurol. 2001;43:460 – 465
139. Eiser C. Children’s quality of life measures. Arch Dis Child. 1997;77:
350 –354
140. Eiser C, Mohay H, Morse R. The measurement of quality of life in
young children. Child Care Health Dev. 2000;26:401– 414
141. Juniper EF, Guyatt GH, Feeny DH, Griffith LE, Ferrie PJ. Minimum
skills required by children to complete health-related quality of life
instruments for asthma: comparison of measurement properties. Eur
Respir J. 1997;10:2285–2294
142. Jenney ME, Campbell S. Measuring quality of life. Arch Dis Child.
1997;77:347–350
143. Verrips GH, Stuifbergen MC, den Ouden AL, et al. Measuring health
status using the Health Utilities Index: agreement between raters and
between modalities of administration. J Clin Epidemiol. 2001;54:475– 481
144. Varni JW, Seid M, Kurtin PS. PedsQL 4.0: Reliability and validity of the
Pediatric Quality of Life Inventory version 4.0 generic core scales in
healthy and patient populations. Med Care. 2001;39:800 – 812
145. Vogels T, Verrips GH, Verloove-Vanhorick SP, et al. Measuring healthrelated quality of life in children: the development of the TACQOL
parent form. Qual Life Res. 1998;7:457– 465
146. Saigal S, Stoskopf B, Rosenbaum PL, Hoult LA, Furlong WJ, Feeny DH.
Development of a multiattribute pre-school health status classification
system [abstract]. Pediatr Res. 1998;43:228A
147. Feeny D, Furlong W, Barr RD, Torrance GW, Rosenbaum P, Weitzman
S. A comprehensive multiattribute system for classifying the health
status of survivors of childhood cancer. J Clin Oncol. 1992;10:923–928
148. Torrance GW, Furlong W, Feeny D, Boyle M. Multi-attribute preference functions. Health Utilities Index. Pharmacoeconomics. 1995;7:
503–520
149. Landry SH, Denson SE, Swank PR. Effects of medical risk and socioeconomic status on the rate of change in cognitive and social devel-
150.
151.
152.
153.
154.
155.
156.
157.
158.
159.
160.
161.
162.
163.
164.
165.
166.
167.
168.
169.
170.
opment for low birth weight children. J Clin Exp Neuropsychol. 1997;
19:261–274
Gross SJ, Slagle TA, D’Eugenio DB, Mettelman BB. Impact of a
matched term control group on interpretation of developmental performance in preterm infants. Pediatrics. 1992;90:681– 687
Doyle LW, Cheung MM, Ford GW, Olinsky A, Davis NM, Callanan C.
Birth weight ⬍1501 g and respiratory health at age 14. Arch Dis Child.
2001;84:40 – 44
Buck GM, Msall ME, Schisterman EF, Lyon NR, Rogers BT. Extreme
prematurity and school outcomes. Paediatr Perinat Epidemiol. 2000;14:
324 –331
Bylund B, Cervin T, Finnstrom O, et al. Very low-birth-weight children
at 9 years: school performance and behavior in relation to risk factors.
Prenat Neonatal Med. 2002;5:124 –133
Gross SJ, Mettelman BB, Dye TD, Slagle TA. Impact of family structure
and stability on academic outcome in preterm children at 10 years of
age. J Pediatr. 2001;138:169 –175
Hall A, McLeod A, Counsell C, Thomson L, Mutch L. School attainment, cognitive ability and motor function in a total Scottish very-lowbirthweight population at eight years: a controlled study. Dev Med
Child Neurol. 1995;37:1037–1050
Saigal S, Szatmari P, Rosenbaum P, Campbell D, King S. Cognitive
abilities and school performance of extremely low birth weight children and matched term control children at age 8 years: a regional
study. J Pediatr. 1991;118:751–760
Pharoah PO, Stevenson CJ, Cooke RW, Stevenson RC. Prevalence of
behaviour disorders in low birthweight infants. Arch Dis Child. 1994;
70:271–274
Hack M, Breslau N, Aram D, Weissman B, Klein N, Borawski-Clark E.
The effect of very low birth weight and social risk on neurocognitive
abilities at school age. J Dev Behav Pediatr. 1992;13:412– 420
Hack M, Taylor HG, Klein N, Eiben R, Schatschneider C, MercuriMinich N. School-age outcomes in children with birth weights under
750 g. N Engl J Med. 1994;331:753–759
O’Callaghan MJ, Burns YR, Gray PH, et al. School performance of
ELBW children: a controlled study. Dev Med Child Neurol. 1996;38:
917–926
Saigal S, Szatmari P, Rosenbaum P. Can learning disabilities in children who were extremely low birth weight be identified at school
entry? J Dev Behav Pediatr. 1992;13:356 –362
Avchen RN, Scott KG, Mason CA. Birth weight and school-age
disabilities: a population-based study. Am J Epidemiol. 2001;154:
895–901
Resnick MB, Gomatam SV, Carter RL, et al. Educational disabilities of
neonatal intensive care graduates. Pediatrics. 1998;102:308 –314
Seidman DS, Paz I, Stevenson DK, Laor A, Danon YL, Gale R. Neonatal
hyperbilirubinemia and physical and cognitive performance at 17
years of age. Pediatrics. 1991;88:828 – 833
Erickson A, Kallen B. Very low birthweight boys at the age of 19. Arch
Dis Child Fetal Neonatal Ed. 1998;78:F171–F174
Aylward GP, Hatcher RP, Stripp B, Gustafson NF, Leavitt LA. Who
goes and who stays: subject loss in a multicenter, longitudinal follow-up study. J Dev Behav Pediatr. 1985;6:3– 8
Wolke D, Ratschinski G, Ohrt B, Riegel K. The cognitive outcome of
very preterm infants may be poorer than often reported: an empirical
investigation of how methodological issues make a big difference. Eur
J Pediatr. 1994;153:906 –915
Broyles RS, Tyson JE, Heyne ET, et al. Comprehensive follow-up care
and life-threatening illnesses among high-risk infants: a randomized
controlled trial. JAMA. 2000;284:2070 –2076
Bednarek FJ, Weisberger S, Richardson DK, Frantz ID 3rd, Shah B,
Rubin LP. Variations in blood transfusions among newborn intensive
care units. SNAP II Study Group. J Pediatr. 1998;133:601– 607
Synnes AR, Chien LY, Peliowski A, Baboolal R, Lee SK. Variations in
intraventricular hemorrhage incidence rates among Canadian neonatal
intensive care units. J Pediatr. 2001;138:525–531
SUPPLEMENT
1397
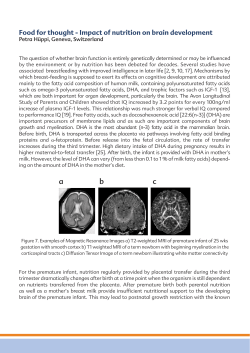


© Copyright 2026