
S W ™ E
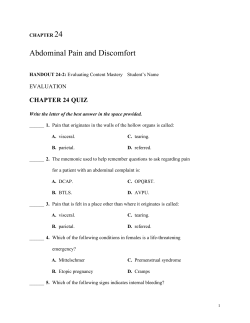
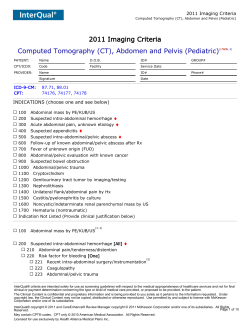
SHEA ARWAVE™ ELASTO L OGRA APHY Y IN ABDO OMINA AL APPLIC CATIO ONS PUBLLICAT TIONS S AND ABSTRA B ACTS S Updated 11/18/2011 Abdominal Publications Abdominal-1/26 Updated 11/18/2011 Abdominal Publications Abdominal-2/26 Shear wave elastography of adrenal masses Poster No.: C-0396 Congress: ECR 2011 Type: Scientific Paper Authors: R. Z. Slapa , A. A. Kasperlik-Zaluska , W. Jakubowski , A. 1 1 2 1 1 1 1 Piwowonski , T. Bednarczuk , K. T. Szopinski ; Warsaw/PL, 2 Jaros#aw/PL Keywords: Adrenals, Elastography, Technology assessment, Tissue characterisation, Endocrine disorders DOI: 10.1594/ecr2011/C-0396 Any information contained in this pdf file is automatically generated from digital material submitted to EPOS by third parties in the form of scientific presentations. References to any names, marks, products, or services of third parties or hypertext links to thirdparty sites or information are provided solely as a convenience to you and do not in any way constitute or imply ECR's endorsement, sponsorship or recommendation of the third party, information, product or service. ECR is not responsible for the content of these pages and does not make any representations regarding the content or accuracy of material in this file. As per copyright regulations, any unauthorised use of the material or parts thereof as well as commercial reproduction or multiple distribution by any traditional or electronically based reproduction/publication method ist strictly prohibited. You agree to defend, indemnify, and hold ECR harmless from and against any and all claims, damages, costs, and expenses, including attorneys' fees, arising from or related to your use of these pages. Please note: Links to movies, ppt slideshows and any other multimedia files are not available in the pdf version of presentations. www.myESR.org Page 1 of 9 Updated 11/18/2011 Abdominal Publications Abdominal-3/26 Purpose The estimation of tissue hardness is a very ancient diagnostic tool in medicine. Palpation - the earliest and most common form of tissue hardness estimation - was practiced by Egyptian physicians as early as 2600 BCE [1]. In the era of advancement of ultrasound diagnostics there have been developed a method called sonopalpation which involved monitoring of palpation with B-mode ultrasound. A more recent and sophisticated method of imaging tissue hardness is technique known as elastography. Roughly 20 years have elapsed since the production of the first images depicting the local elastic properties of tissues. The first decade of development produced a remarkable proliferation of techniques and optimization strategies. The second decade continued this trend, but with the important extension to dedicated platforms for conducting clinical trials in the hands of radiologists and skilled clinicians [2]. There are 3 main types of US elasticity imaging: elastography that tracks tissue movement during compression to obtain an estimate of strain, sonoelastography that uses color Doppler to generate an image of tissue movement in response to external vibrations and tracking shear wave propagation through tissue to obtain the elastic modulus [1]. The new generation of elasticity imaging called supersonic shear wave imaging has already been introduced to imaging of superficial organs as breast and thyroid with high frequency linear probes [3-5] (fig 1). This type of elastography does not require the compression of the tissues during their elasticity examination and may be applied with lower frequency convex probes for examination of deep laying organs and tissues in abdominal cavity and retroperitoneum. The aim of our study was to evaluate the feasibility of assessment of elasticity of adrenal masses with supersonic shear wave elastography. Images for this section: Page 2 of 9 Updated 11/18/2011 Abdominal Publications Abdominal-4/26 Fig. 1: Shear wave elastography of the breast phantom. Hard inclusion in the phantom is visible in color on elastographic image (uper image). Hardness of the object (circle ROI) is measured in kPa. Hardness of the object can be also related to hardness of surounding structures (dotted circle ROI) with ratio calculation. The lower image presents B-mode presentation of the phantom. Page 3 of 9 Updated 11/18/2011 Abdominal Publications Abdominal-5/26 Methods and Materials We evaluated with ultrasound 14 consecutive patients with adrenal masses . The B mode ultrasound revealed 16 adrenal masses that were examined with shear wave elastography quantitatively, with Aixplorer ultrasound scanner (Supersonic, France) with convex abdominal transducer. The final diagnosis was based on multiple CT or MRI and biochemical studies. Results • • • • • Final diagnosis established: 1 myelolipoma, 7 hyperplastic nodules, 5 adenomas, 3 cysts. In 1 patient with small left adrenal nodule ultrasound did not show the lesion. All the solid lesions showed the elasticity map and measurements of their hardness in kPa were possible. Myelolipoma (fig 1) was harder than adenomas (fig 2) and hyperplastic nodules. The cysts (fig 3) (some not obvious on B-mode imaging) did not show elasticity signal, as shear waves do not propagate through liquids. Images for this section: Page 4 of 9 Updated 11/18/2011 Abdominal Publications Abdominal-6/26 Fig. 1: Myelolipoma of the left adrenal gland (arrows). LK - left kidney. On the upper elastographic image myelolipoma is harder (circa 40 kPa) then adenoma (next figure). On B-mode presentation (lower image) myelolipoma is distinctively hyperechoic. Page 5 of 9 Updated 11/18/2011 Abdominal Publications Abdominal-7/26 Fig. 2: Non-hyperfunctioning adenoma (incidentaloma) of the right adrenal gland (arrows). RK - right kidney. Liv - liver. On the elastographic image (upper) the measurements of adenoma hardness (circa 25 kPa) and hardness of liver and kidney parenchyma are marked with circle ROIs. The respective ratios of the hardness are also calculated. On B-mode presentation (lower image) adrenal adenoma is isoechoic to liver. Page 6 of 9 Updated 11/18/2011 Abdominal Publications Abdominal-8/26 Fig. 3: Large reccurent cyst of the right adrenal gland with elasticity imaging (upper image) and B-mode presentation (lower image). Main part of the cyst does not show elasticity signal as shear waves do not propagate through liquids. Discrete dense material within the upper pole of the cyst shows some signal of elastic structure. Page 7 of 9 Updated 11/18/2011 Abdominal Publications Abdominal-9/26 Conclusion 1. 2. 3. 4. Shear wave elastography with convex ultrasound probe is a feasible technique for evaluation of adrenal masses. Shear wave elastography shows the potential for differentiation of adrenal masses. Shear wave elastography indicates the liquid content of adrenal cystic lesions, even these that do not present simple cyst features on B-mode ultrasound. Further large scale studies evaluating the possibility of differentiation of adrenal masses with shear wave elastography are warranted. References 1. 2. 3. 4. 5. Garra BS: Imaging and estimation of tissue elasticity by ultrasound. Ultrasound Quarterly 2007; 23: 255-268. Parker KJ, Doyley MM, Rubens DJ: Imaging the elastic properties of tissue: the 20 year perspective. Phys. Med. Biol. 2011; 56: R1-R29. Tanter M, Bercoff J, Athanasiou A, Deffieux T, Gennisson J-L, Montaldo G, Muller M, Tardivon A, Fink M: Quantitative assessment of breast lesion viscoelasticity: Initial clinical results using supersonic shear imaging. Ultrasound in Med. & Biol. 2008; 34: 1373-1386 Sebag F, Vaillant-Lombard J, Berbis J, Griset V, Henry JF, Petit P, Olivier C: Shear wave elastography: a new ultrasound imaging mode for the differential diagnosis of benign and malignant thyroid nodules. J Clin Endocrinol Metab. 2010; 95: 5281-8. Evans A, Whelehan P, Tomson K, McLean D, Brauer K, Purdie C, Jordan L, Baker L, Thompson A: Quantitative shear wave ultrasound elastography: initial experience in solid breast masses. Breast Cancer Research 2010; 12:R104. Personal Information Supported by the Ministry of Science and Higher Education of Poland grant Nr N N402 481239 in years 2010-2013. Corresponding author: Rafal Zenon Slapa Page 8 of 9 Updated 11/18/2011 Abdominal Publications Abdominal-10/26 E-mail: [email protected] From: Department of Diagnostic Imaging, Second Faculty of Medicine with the English Division and the Physiotherapy Division, Medical University of Warsaw, ul. Kondratowicza 8, 03-242 Warsaw, Poland (RZS, WJ, KTS) Department of Endocrinology, Centre for Posgraduate Medical Education, Warsaw, Poland (AAK-Z) NZOZ Almed, Jaroslaw, Poland (AP) Department and Clinic of Internal Medicine and Endocrinology, First Faculty of Medicine, Medical University of Warsaw, Warsaw, Poland (TB) Interdisciplinary Centre for Mathematical and Computational Modelling, Warsaw University, Warsaw, Poland (KTS) Page 9 of 9 Updated 11/18/2011 Abdominal Publications Abdominal-11/26 Updated 11/18/2011 Abdominal Publications Abdominal-12/26 11proceedingsv7.qxp:Layout 1 3/15/11 2:15 PM Page S78 American Institute of Ultrasound in Medicine Proceedings 987721 J Ultrasound Med 30:S1–S120, April 2011 Shear Wave and Strain Elastography in Ultrasound Diagnosis of Thyroid Cancer Slapa R,1* Jakubowski W,1 Piwowonski A,2,3 Bierca J,4 Szopinski K1,5 1Diagnostic Imaging, Medical University of Warsaw, Faculty of Medicine II, English Division, Physiotherapy Division, Warsaw, Poland; 2Niepublicznych Zakladów Opieki Zdrowotnej Almed, Jaroslaw, Poland; 3Samodzielny Publiczny Zaklad Opieki Zdrowotnej, Przeworsk, Poland; 4Surgery, Solec Hospital, Warsaw, Poland; 5Interdisciplinary Center for Mathematical and Computational Modeling, University of Warsaw, Warsaw, Poland Objective. From a clinical background, hard nodules on palpation are more suspicious for thyroid cancer. So far, various variants of ultrasound elastography have been developed: strain (correlation method or tissue Doppler) and shear wave elastography. Ultrasound elastography, as more precise and objective than palpation, should help indicate nodules for fine-needle aspiration (FNA). The purpose of this study was to compare the usefulness of shear wave and strain elastography for evaluation of thyroid nodules. Methods. With ultrasound, we evaluated 4 consecutive patients with a single thyroid nodule (1) and nodular goiter (3). B-mode and power Doppler ultrasound of the whole thyroid and neck lymph nodes was performed. Six dominant nodules (with regard to ultrasound features) were evaluated with shear wave and strain elastography (tissue Doppler based) qualitatively and quantitatively and with ultrasound using the contrast agent SonoVue (Bracco) with following scanners: Aixplorer (Supersonic), Aplio XG (Toshiba), and Technos (Esaote) with linear high-resolution transducers. The final diagnosis was based on clinical evaluation, multiple FNA, or surgery. Results. Final diagnoses established included 1 papillary carcinoma, 4 coloid nodules, and a benign nodule. Shear weave elastography revealed 1 true-positive, 4 true-negative, and 1 false-positive diagnoses with regard to thyroid cancer. Strain elastography revealed 5 false-positive and 1 false-negative diagnoses. False-positive diagnoses with strain elastography were found in nodules with partly liquid content or necrosis visible on contrast-enhanced ultrasound or inferred from B-mode ultrasound. Conclusions. (1) Shear wave elastography did better than strain elastography in characterization of thyroid nodules, whether suspicious for cancer or not. (2) False-positives on strain ultrasound were due to liquid or necrotic content in the nodules. (3) Further multicenter large-scale studies of thyroid nodules evaluating different elastographic methods are warranted. (Supported by grant N402 476437.) 987454 Estimate of Effective Scatterer Diameter and Acoustic Concentration in Ultrasound Examination of the Cervix in Pregnant Women as Predictors of Premature Delivery Bigelow T,1* McFarlin B,2 Labyed Y,1 Abramowicz J3 1Electrical and Computer Engineering, Iowa State University, Ames, Iowa USA; 2Women, Children, and Family Health Science, University of Illinois, Chicago, Illinois USA; 3Obstetrics and Gynecology, Rush University Medical Center, Chicago, Illinois USA Objective. The cervix prepares for the delivery weeks to months before labor by a process termed cervical ripening without any signs or symptoms currently detectable noninvasively. As the cervix ripens, the spacing between the collagen fibers increases and fills with water, hyaluronan, decorin, and enzymes, suggesting that the ultrasound scattering properties of the cervix should change. The objective of this study was to assess the effective scatterer diameter and acoustic concentration as a function of the time to delivery to see if monitoring these quantitative ultrasound parameters could predict premature delivery. Methods. A convenience sample of 33 pregnant women consented to a transvaginal scan of the cervix using a 5- to 9-MHz transducer at a single time point during their pregnancy. Ultrasound radio frequency data and corresponding beam-formed images were obtained with a Z.one (Zonare) commercial ultrasound system. Then, the cervix attenuation was estimated by comparing the echoes to the echoes from a tissue-mimicking phantom with known attenuation and scattering properties. Multiple attenuation estimates were obtained for regions throughout the cervix and then averaged to get a single attenuation estimate for the entire cervix. The attenuation estimate and echoes from the tissue-mimicking phantom were then used to estimate the effective scatterer diameter and acoustic concentration for the cervix. Results. The time from the ultrasound exam to delivery for the patients varied from 0 to 29 weeks with a mean time to delivery of 16 weeks. There was a statistically significant decrease in attenuation (P < .02), increase in effective scatterer diameter (P < .01), and decrease in acoustic concentration (P < .025) as the delivery date approached. Conclusions. The study validates the feasibility of using quantitative ultrasound parameters such as attenuation, effective scatterer diameter, and acoustic concentration to assess cervical ripening. In the future, the goal will be to reduce some of the variability in the data by longitudinal studies and further improvement to the quantitative ultrasound algorithms. 987586 Shear Wave Elastography During Sonography of Adrenal and Liver Masses: Feasibility Study Slapa R,1* Kasperlik-Zaluska A,2 Jakubowski W,1 Piwowonski A,3,4 Bednarczuk T,5 Szopinski K1,6 1Diagnostic Imaging, Medical University of Warsaw, Faculty of Medicine II, English Division, Physiotherapy Division, Warsaw, Poland; 2Endocrinology, Center for Postgraduate Medical Education, Warsaw, Poland; 3Niepublicznych Zakladów Opieki Zdrowotnej Almed, Jaroslaw, Poland; 4Samodzielny Publiczny Zaklad Opieki Zdrowotnej, Przeworsk, Poland; 5Internal Medicine and Endocrinology, Medical University of Warsaw, Faculty of Medicine II, Warsaw, Poland; 6Interdisciplinary Center for Mathematical and Computational Modeling, University of Warsaw, Warsaw, Poland Objective. The elasticity of abdominal masses depends on their composition (eg, amount of vascularity, fibrosis, necrosis, lipids, or fluid). The purpose of this study was to evaluate the feasibility of assessment of the elasticity of adrenal and liver masses with shear wave elastography performed during ultrasound examination. Methods. With ultrasound, we evaluated 16 consecutive patients with adrenal and/or liver masses. B-mode ultrasound revealed 16 adrenal masses that were examined with shear wave elastography quantitatively with an Aixplorer (Supersonic) and a convex abdominal transducer. Five liver masses (3 single and 2 dominant) were similarly evaluated with shear wave elastography. The final diagnosis was based on contrast-enhanced ultrasound, computed tomography, magnetic resonance imaging, follow-up, and biochemical studies. Results. Final diagnoses of adrenal lesions established included 1 myelolipoma, 7 hyperplastic nodules, 5 adenomas, and 3 cysts. In 1 patient with a small left adrenal nodule, ultrasound did not show the lesion. Final diagnoses of liver lesions established included 2 metastases (from breast and adrenal cortex cancer), 1 focal nodular hyperplasia, 1 hemangioma, and 1 benign lesion. All the solid adrenal lesions showed an elasticity map. Adrenal myelolipoma was harder than adenomas and hyperplastic nodules. The adrenal cysts (some not obvious on B-mode imaging) did not show an elasticity signal, as shear waves do not propagate through liquids. Liver hemangioma was hard. Brest cancer metastasis was partly hard and partly elastic. Other liver lesions were elastic. Conclusions. (1) Shear wave elastography with an abdominal convex ultrasound probe is a feasible technique that can be performed during ultrasound evaluation of adrenal and liver masses. (2) Shear wave elastography shows some potential for differential characterization of adrenal and liver masses. (3) Shear wave elastography indicates the liquid con- S78 Updated 11/18/2011 Abdominal Publications Abdominal-13/26 11proceedingsv7.qxp:Layout 1 3/15/11 2:15 PM Page S79 American Institute of Ultrasound in Medicine Proceedings J Ultrasound Med 30:S1–S120, April 2011 tent of adrenal cystic lesions, even those that do not present simple cyst features on B-mode ultrasound. (4) Further large-scale studies evaluating the possibility of differentiation of abdominal masses with shear wave elastography are warranted. (Supported by grant N402 481239.) VASCULAR ULTRASOUND Moderators: Liz Ladrido, RDMS, and Tricia Turner, RDMS 988333 990471 Potential of Ultrasound Elasticity Measurements of the Brachial Artery for Determining Arteriovenous Fistula Maturation Sorace A,1* Hoyt K,1,2 Abts C,2 Robbin M,1,2 Lockhart M,2 Allon M3 1Biomedical Engineering, 2Radiology, 3Medicine, University of Alabama, Birmingham, Alabama USA Objective. To use ultrasound (US) to noninvasively measure the elasticity of human brachial arteries and assess potential in determining the likelihood of arteriovenous (AV) fistula maturation in chronic kidney disease (CKD) patients. Methods. US cine data were collected in the brachial artery of both normal and potential AV fistula patients using a Philips iU22 scanner with an L17-5 transducer. The forearm was placed in a custom rest to minimize any discomfort or patient motion. Simultaneous electrocardiographic (EKG) recordings of 10 cardiac cycles of US data were acquired. Arterial Health prototype software (Siemens) was used to determine the intima-media thickness (IMT) of the arterial wall during systole and diastole. Patient EKG data helped determine these extreme states of vessel distension and contraction. Assuming a linear elastic medium, the modulus of elasticity for the vessel wall was estimated as the ratio of vascular stress to strain. More specifically, stress was taken as the difference between systolic and diastolic pressure measurements. Tissue strain was derived from changes in IMT measurements (between systole and diastole) and averaged over 6 different cardiac cycles. Results. Preliminary results in normal healthy (non-CKD) patients were used to establish a database for comparison to patients scheduled for AV fistula surgical placement. Fistulas are tracked to either maturation or failure on follow-up clinical examinations, and a comprehensive database is being compiled. To date, normal patient brachial artery elasticity measurements were found to be 70.3 ± 8.8 kPa. The low SE demonstrates feasibility and indicates low variability in healthy brachial artery elasticity. In comparison, CKD patient elasticity exhibits striations in data, showing clusters near normal (78.1 kPa) and much stiffer (150.4 kPa). It is hypothesized that maturation outcomes will correlate with elasticity values. Comparison to AV fistula outcomes and histologic measures of vascular fibrosis are pending. Conclusions. US can be used to noninvasively measure the elasticity of the brachial artery in human. A comprehensive database of vascular elasticity measurements has great potential in helping determine whether CKD patients will have complete AV fistula maturation. 977586 Results. Thrombi were isolated to the common femoral vein or femoral vein in 23.2% of extremities. Contiguous thrombi isolated to the combination of the common femoral vein and femoral vein were present in 11.8% of extremities. In total, 35% of extremities with DVT did not have thrombus located within the popliteal vein. Conclusions. The conventional wisdom that lower extremity thrombi begin in the calves and propagate centrally may not be correct in a not-insignificant number of cases. Transcranial Doppler Sonography to Evaluate Neurovascular Changes in Acute Blunt Cervical Vascular Injury Purvis D,1* Aldaghlas T,3 Rizzo A,3 Sikdar S2 1Neuroscience, 2 Electrical and Computer Engineering, George Mason University, Fairfax, Virginia USA; 3Trauma Services, Inova Fairfax Hospital, Fairfax, Virginia USA Objective. Complications of undetected blunt cervical vascular injury (BCVI) can lead to adverse neurologic sequelae. Screening for BCVI with computed tomographic angiography (CTA) is more common than conventional angiography. CTA is a validated screening modality; the diagnosis remains imperfect due to high false-positive rates. Doppler sonography has demonstrated high specificity in detecting vascular injuries. We are investigating bedside use of transcranial Doppler (TCD) sonography during initial assessment and evaluation of BCVI in severely injured trauma patients. Methods. This is a prospective pilot study conducted at a large level I trauma center. Patients enrolled were screened for BCVI with CTA, followed by TCD. Positive CTA findings were followed up with traditional 4-vessel angiography. All extracranial cervical and intracranial vascular segments were insonated using a portable multigate power M-mode TCD unit with a 2-MHz pencil probe. Results. Nine trauma patients meeting study criteria were enrolled. Four were diagnosed with BCVIs: 2 internal carotid artery (ICA) dissections and 2 vertebral artery (VA) dissections. Four had normal CTA findings, and 1 had a probable injury. One had contralateral innominate and subclavian artery pseudoaneursyms with ICA dissection. Another with VA injury had a cerebellar infarct. TCD findings on these patients correlated with positive CTA results and included bruits, high-resistance flow, tardus-parvus waveforms, steal phenomena, reverse flow, and to-and-fro waveforms with retrograde diastolic flow. Abnormalities had a global effect, extending downstream beyond the local injury site to major intracranial vessels. Conclusions. Preliminary results indicate abnormal TCD findings consistent with CTA results. To our knowledge, global neurovascular changes in BCVI are not well studied. Whereas CTA and angiography provide definitive assessment of vascular injury, TCD provides rich flow data regarding hemodynamic abnormalities and vessel wall integrity without contrast and patient risk. BCVI evaluation with portable TCD has huge potential for field and bedside screening of injured patients. Additional patients should be evaluated. Distribution of Lower Extremity Thrombi at Ultrasound in 270 Extremities Coursey C,1* Mittal P,1 Applegate K,1 Stein J2 1Radiology, 2 Internal Medicine, Emory Healthcare, Atlanta, Georgia USA Objective. To determine the distribution of lower extremity deep venous thromboses (DVT) seen at ultrasound. Methods. Institutional Review Board approval was obtained, and a waiver of informed consent was granted for this Health Insurance Portability and Accountability Act–compliant study. Reports from 270 ultrasound studies that were positive for lower extremity DVT were reviewed, and the distribution of lower extremity thrombi was recorded. S79 Updated 11/18/2011 Abdominal Publications Abdominal-14/26 WFUMB 2011 Shear Wave Elastography of Abdominal and Retroperitoneal Masses and Inflammatory Processes: a Feasibility Study R.Z. Slapa1, W. Jakubowski1, A. Kasperlik-Zaluska1, A. Piwowonski2, K.T. Szopinski1; 1 Warsaw, Poland, 2Przeworsk, Poland Purpose The purpose of the study was to evaluate the feasibility of assessment of elasticity of abdominal and retroperitoneal masses and inflammatory processes with shear wave elastography performed during sonographic examination. Material & Methods We evaluated with ultrasound 18 consecutive patients with adrenal and/or liver masses and abdominal inflammatory processes. Quantitative shear wave elastography was performed with Aixplorer (Supersonic) with convex abdominal transducer and/or linear one. Results We evaluated with supersonic shear wave elastography 16 adrenal and 5 liver masses, Crohn’s disease, ulcerative colitis and inflammatory changes related to arterial graft. All the solid adrenal, liver masses and bowel inflammatory lesions showed the elasticity map. The adrenal cysts (some not obvious on B-mode imaging) did not show elasticity signal, as shear waves do not propagate through liquids. Conclusion Shear wave elastography of abdominal and retroperitoneal masses and inflammatory processes is a feasible technique that can be performed during ultrasound examination and has shown some potential for differential characterization of adrenal or liver masses and inflammatory bowel diseases. Shear wave elastography may deliver the information on the extent of inflammatory abdominal processes. Further large-scale studies evaluating the possibility of differentiation and evaluation of extent of abdominal and retroperitoneal lesions using shear wave elastography are warranted. Ultrasound elastography is able to provide stiffness informations and is used since 2005 in thyroid nodule examination. ShearWave elastography (SWE) is becoming available and provides true quantitative measurement of stiffness with reduced variability between operators. The purpose of our study was to evaluate SWE in routine clinical practice. Updated 11/18/2011 Abdominal Publications Abdominal-15/26 Updated 11/18/2011 Abdominal Publications Abdominal-16/26 Eur Radiol DOI 10.1007/s00330-011-2229-9 UROGENITAL Detection of intrarenal microstructural changes with supersonic shear wave elastography in rats Marc Derieppe & Yahsou Delmas & Jean-Luc Gennisson & Colette Deminière & Sandrine Placier & Mickaël Tanter & Christian Combe & Nicolas Grenier Received: 4 May 2011 / Revised: 25 July 2011 / Accepted: 28 July 2011 # European Society of Radiology 2011 Abstract Objectives To evaluate, in a rat model of glomerulosclerosis, whether ultrasonic shear wave elastography detects kidney cortex stiffness changes and predicts histopathological development of fibrosis. Materials and methods Three groups were studied transversally: a control group (n=8), a group after 4 weeks of L-NAME administration (H4, n=8), and a group after 6 weeks (H6, n = 15). A fourth group was studied longitudinally (n =8) before, after 4 weeks and after 7 weeks of L-NAME administration. Shear modulus of renal cortex was quantified using supersonic shear imaging technique. Urine was analysed for dosage of protein/creatinine ratio. Kidneys were removed for histological quantification of fibrosis. Results Diseased rats showed an increased urinary protein/ creatinine ratio. Cortical stiffness expressed as median (interquartile range) was 4.0 kPa (3.3–4.5) in control kidneys. It increased in all but one pathological groups: H4: 7.7 kPa (5.5–8.6) (p<0.01); H6: 4.8 kPa (3.9–5.9) (not significant); in the longitudinal cohort, from 4.5 kPa (3.1–5.9) to 7.7 kPa (5.9–8.3) at week 4 (p<0.05) and to 6.9 kPa (6.1–7.8) at week 7 (p<0.05). Stiffness values were correlated with the proteinuria/creatininuria ratio (r=0.639, p<0.001). Conclusions Increased cortical stiffness is correlated with the degree of renal dysfunction. More experience in other M. Derieppe (*) Laboratory for Molecular and Functional Imaging: from Physiology to Therapy, FRE 3313 CNRS & University Bordeaux Segalen, Bordeaux, France e-mail: [email protected] S. Placier INSERM U489, Hôpital Tenon, Paris, France M. Derieppe : J.-L. Gennisson : M. Tanter Institut Langevin – Ondes et Images, ESPCI ParisTech, CNRS UMR7587, INSERM U979, ESPCI, 10 rue Vauquelin, 75005 Paris, France Y. Delmas : C. Combe Service de Néphrologie, Groupe Hospitalier Pellegrin, Place Amélie Raba-Léon, 33076 Bordeaux Cedex, France C. Deminière Service d’Anatomopathologie, Groupe Hospitalier Pellegrin, Place Amélie Raba-Léon, 33076 Bordeaux Cedex, France Updated 11/18/2011 C. Combe Unité INSERM 1026, Université Bordeaux Segalen, Bordeaux, France N. Grenier Service d’Imagerie Diagnostique et Interventionnelle de l’Adulte, Groupe Hospitalier Pellegrin, Bordeaux, France N. Grenier Laboratory for Molecular and Functional Imaging: from Physiology to Therapy, FRE 3313, CNRS & University Bordeaux Segalen, 146 rue Léo Saignat, 33076 Bordeaux cedex, France Abdominal Publications Abdominal-17/26 Eur Radiol models is necessary to understand its relationship with microstructural changes. Key Points & Ultrasound elastography with supersonic shear wave imaging can predict parenchymal microstructural changes & In this rat model, cortical stiffness correlated with the proteinuria/creatininuria ratio & Quantification of cortical stiffness could be a useful biomarker for chronic renal disease & SSI should now be investigated in patients with native/ transplanted renal disease Keywords Elastography . Renal fibrosis . Supersonic shear wave imaging . L-NAME . Cortical stiffness Introduction Chronic kidney disease (CKD) incidence and prevalence are increasing in developed countries, particularly diabetes and hypertension-related nephropathies [1]. Because it is a progressive disease, CKD may lead to end-stage renal failure, with extensive morbidity, mortality and increasing health costs. This justifies developing more efficient diagnostic strategies in patients with CKD by using non-invasive methods. Non-invasive imaging could participate in this challenge in the near future using functional, structural or molecular approaches. However, adequate imaging biomarkers have to be validated first. In most types of renal disease, CKD progression is characterised by progressive fibrotic processes that may involve first either glomeruli (glomerulosclerosis) or the interstitial space (interstitial fibrosis) depending on the initial nephropathy [2, 3]. The detection of intrarenal fibrosis and quantifying its progression with non-invasive methods could be useful to nephrologists, in addition to current methods used to evaluate CKD progression, which are mainly based on quantification of the glomerular filtration rate. Among imaging methods used for that purpose, diffusion-weighted MRI (DW–MRI) was recently proposed in liver fibrosis [4, 5] and experimental interstitial renal fibrosis [6]. Elastography is another attractive alternative, as already demonstrated in the liver using ultrasound [7]. The supersonic shear imaging (SSI) technique combines the induction of mechanical vibrations by acoustic radiation force pulses created by a focused ultrasound beam with a very high ultrasound frame rate (up to 20,000 frames/s) to capture the propagation of the shear waves [8, 9]. The speed of the shear waves relates to Young’s modulus. This method has already been applied in different organs for the Updated 11/18/2011 diagnosis of different pathological conditions, such as breast cancer [9], cornea diseases [10] or liver fibrosis, and seems attractive for evaluating renal fibrosis. Materials and methods Animal protocol This study involved 40 male Sprague Dawley®™ rats (Harlan France and Charles River) with a mean body weight of 50 g at the beginning of the experiments. These were conducted in agreement with the European Commission guidelines and directives of the French Research Ministry. Renal fibrosis was induced by administration of L-NAME (Nω — Nitro — L — arginine methyl ester hydrochloride, Sigma®) in drinking water [3, 4] at a dosage of 20 mg/kg/day. Chronic administration of L-NAME was previously shown to induce cortical vascular fibrosis and glomerulosclerosis [11]. In a first step, three groups of rats were studied before sacrifice for histological correlation: a control group (Co, n = 8), a group undergoing imaging and sacrificed at the fourth week of L-NAME administration (H4, n=8), a group undergoing imaging and sacrificed at the sixth week of L-NAME administration (H6, n=15). In a second step, a longitudinal cohort (n=8) was studied sequentially: before (L0), after 4 weeks (L4) and after 7 weeks (L7) of L-NAME administration, then sacrificed after this last session. The rats were anaesthetised with isoflurane (3% v/v for induction and 1.5% v/v afterwards, Baxter, France). After the last imaging session, rats under anaesthesia were sacrificed using a lethal injection of pentobarbital intraperitoneally. Blood and urine samples were collected for measurement of serum creatinine (automated Jaffe method) and proteinuria normalised to urinary creatinine concentration (ratio mg/mg) respectively, and the imaged kidney was harvested. From the experimental work by Boffa et al. [11] we know that the mean normal value of the urinary protein/creatinine ratio is 2.8± 0.7 mg/mg in rats of these strains. Elastography sequence and data processing An ultrafast ultrasound system (Aixplorer, SuperSonic Imagine, Aix-en-Provence, France) was used with an 8-MHz probe. Principles of SSI have been described elsewhere [8]. Briefly, a vibration force was generated by four successive focusing ultrasound beams at different depths with 5-mm spaces. Each focused beam, the socalled pushing beam, consisted of a 150 μs burst at 8 MHz. Propagating shear waves were imaged at a very high frame Abdominal Publications Abdominal-18/26 Eur Radiol Fig. 1 Elastic map of the left kidney of a control rat superimposed on the classical ultrasound image in coronal views. The elastic image is colour-coded from 0 to 45 kPa, corresponding to a shear waves speed of 0 to 3.87 m/s. The image size is about 42×25 mm², with a spatial resolution of 0.3 mm² for the ultrasound image and 1.2 mm² for the elastic image rate (up to 20,000 frames/s) and raw radiofrequency data were recorded. Using a speckle tracking correlation technique, movies of displacements induced in tissues by the shear wave were calculated. Then the shear wave speed (cT) was locally deduced by using a time-of-flight algorithm. From the shear-wave speed in locally homogeneous Fig. 2 Box plots illustrate the values of the urinary protein/creatinine ratio 4 weeks (H4) and 6 weeks (H6) after L-NAME administration for the transverse cohort, and 7 weeks (L7) after L-NAME administration for the longitudinal cohort Updated 11/18/2011 soft tissues, the elastic modulus, the so-called Young’s modulus (E), is deduced from the following equation: E 3m ¼ 3rc2T ; ð1Þ where μ is the shear modulus and ρ is the density. The results were displayed on a colour scale ranging from 0 to 45 kPa (Young’s modulus) as presented in Fig. 1. Fig. 3 Box plots illustrate cortical stiffness values (Young’s modulus) in the transverse cohort: in the control group (C0) and in the groups studied 4 weeks (H4) and 6 weeks (H6) after L-NAME administration Abdominal Publications Abdominal-19/26 Eur Radiol Histopathological examination Fig. 4 Box plots illustrate cortical stiffness values (Young’s modulus) in the longitudinal cohort (9 kidneys) before (L0) and 4 weeks (L4) and 7 weeks (L7) after L-NAME administration in the longitudinal cohort After the last elastography session, the imaged left kidney was removed, fixed in buffered 4% acetic formalin, embedded in paraffin and sectioned into 3-μm-thick coronal slices. Histological examination (C.D., 30 years’ experience) was performed after haematoxylin-eosin and Masson trichrome staining. Histological scoring was performed on x 400 sections by two observers in consensus (C.D. and Y.D., 12 years’ experience), applying a semi-quantitative scale to the following items: inflammation, vascular fibrosis, glomerular sclerosis, tubular sclerosis and interstitial sclerosis, each item ranging from 0 to 5. Finally, a global score was calculated by the addition of each grade (from 0 to 25). Statistical analysis In the following, all data were presented in terms of shear modulus μ. The corresponding shear-wave speed thus roughly ranged from 0 to 3.87 m/s. Spatial resolution was 0.3 mm² for the ultrasound image and 1.2 mm2 for the elastic image. The left kidney was imaged in all cases (N.G., 25 years’ experience in ultrasound). Three measurements were made for each animal at each session. Data analysis The colour scale stiffness map was positioned to cover the entire kidney. Data analysis of stiffness values was performed by using regions of interest within the cortex only because the model induced a glomerulosclerosis without involving the medulla. The regions of interest were 2×2 mm2 and drawn by one of the authors (N.G.) within the cortex. Three separate measurements were performed for each animal. Values were expressed as mean ± standard deviations or as median (interquartile range), as appropriate depending on the normality of distribution. For each kidney, a mean cortical stiffness value was calculated from the three measurements. The intraoperator reproducibility was evaluated by measuring the coefficient of variation for the three measurements performed within the entire cohorts. It was verified that the logarithm of the proteinuria/ creatininuria ratio was normally distributed. It was then compared with reference values in control rats (from Boffa et al. [11]) using a t-test. Stiffness values between groups of the transverse cohort (H4 and H6 groups versus Co group) were compared using the Kruskal-Wallis ANOVA. In the longitudinal cohort, comparison of stiffness between baseline and values at 4 weeks and 7 weeks (L4 and L7) respectively was made using Wilcoxon’s signed rank test. The relationships between Fig. 5 Evolution of stiffness values for each longitudinal rat: homogeneous increase in the shear modulus between the baseline and the fourth week, and a more variable evolution between the fourth and the seventh week Updated 11/18/2011 Abdominal Publications Abdominal-20/26 Eur Radiol Fig. 6 Representative histopathological sections of the renal cortex in a control rat (a) and in diseased rats after L-NAME administration (b, c) using Masson trichrome staining (original magnification, x250). In the control cortex (a), no glomerulosclerosis (arrow) and no interstitial fibrosis is noted. Sections of diseased cortex demonstrate green staining indicative of extracellular matrix due to inhibition of NO within the interstitial space (double arrows in b and c), and shows mild glomerulosclerosis (arrow in c) and mild infiltration of interstitium by inflammatory cells (large arrow in b) and p≤0.05 was considered to indicate a statistically significant difference. Results Biological results Values of the urinary protein/creatinine ratio in diseased rats from groups H4, H6 and L7, were 2.8 mg/mg (1.9–11.9), 2.3 mg/mg (1.6–3.8) and 10.4 mg/mg (4.5–15.4) respectively (Fig. 2). These values were significantly increased for the L7 group only, compared with reference values (p<0.005). Supersonic shear wave elastography Cortical stiffness values measured in the three groups of the transverse cohort and in the longitudinal cohort are summarised in Figs. 3 and 4 respectively. Mean standard deviation of the three measures was 0.85 kPa±068. In the transverse cohort, mean cortical stiffness was 4.0 kPa (3.3– 4.5) in control kidneys versus 7.7 kPa (5.5–8.6) in the H4 group (p<0.01). However, the stiffness of the H6 group was not significantly different from that of controls 4.8 kPa (3.9–5.9). Considering the longitudinal cohort, the mean cortical stiffness increased from 4.5 kPa (3.1–5.9) to 7.7 kPa (5.9–8.3) at week 4 (p<0.05) and to 6.9 kPa (6.1–7.8) at week 7 (p<0.05), corresponding to a mean increase of paired stiffness values for each individual of 62% (week 4 compared to week 0) and 35% (week 7 compared to week 0). The cortical stiffness values between these two time points were not statistically significant. However, Fig. 5 illustrates the evolution of stiffness values for each longitudinal rat: it clearly shows a homogeneous increase in the shear modulus between the baseline and the fourth week, and a more variable evolution between the fourth and the seventh week. Histopathological analysis stiffness and histopathological analyses, and between the stiffness and the logarithm of the proteinuria/creatininuria ratio, for all the kidneys analysed, were tested by Spearman’s rank coefficient. All statistical analyses were performed with Statistica 9.1 (Statsoft, Tulsa, OK, USA) Updated 11/18/2011 Diseased kidneys were characterised by mild pathological changes associated with glomerulosclerosis, interstitial fibrosis and infiltration by inflammatory cells (Fig. 6). The mean histological global score was 5.5 (4.5–6.0) for the H4 group and 6 (5–7) for the H6 group (Fig. 7). The Abdominal Publications Abdominal-21/26 Eur Radiol Discussion Fig. 7 Box plots illustrate histopathological global score (addition of 5 items, ranging from 0 to 5: inflammation, vascular fibrosis, glomerular sclerosis, tubular sclerosis and interstitial sclerosis) 4 weeks (H4) and 6 weeks (H6) after L-NAME administration for the transverse cohort, and 7 weeks (L7) after L-NAME administration for the longitudinal cohort difference between these two pathological scores was not statistically significant. In the longitudinal cohort, the mean histological global score was 7 (7–7) at week 7, which was not statistically significant from the other groups. Stiffness versus biology and histological score Considering all the animals from the H4, H6 and L7 groups, SSI values were highly correlated with the proteinuria/creatininuria ratio (Spearman’s rank coefficient: r=0.6394, p<0.001, Fig. 8). However, neither individual items from the histological scoring system (inflammation, vascular fibrosis, glomerular sclerosis, interstitial sclerosis, tubular and interstitial sclerosis), nor the global histological score was correlated with the level of cortical stiffness (p=0.16 for the global score). Fig. 8 Graph illustrates relationship between cortical stiffness values (Young’s modulus) and the logarithm of the protein/creatinine ratio; data indicate a strong correlation (p<0.0001, r=0.64; Spearman’s rank coefficient) Updated 11/18/2011 An increase in the extracellular matrix synthesis, with excessive fibrillary collagens, characterises the development of chronic lesions in the glomerular, interstitial and vascular compartments [3], leading progressively to endstage renal failure. Mechanisms participating in these processes are increasingly identified and various therapeutic interventions have been shown to prevent or to favour regression of fibrosis in several experimental models [12]. Therefore, development of new non-invasive methods for identification and quantification of fibrosis would be worthwhile. This study showed that cortical stiffness values, measured by ultrasound SSI, increase with the development of intrarenal disease. When followed longitudinally, these values increased to approximately 76% of their baseline values 4 weeks after the onset of the model and remained stable 3 weeks later, as suggested by the non significant decrease at 7 weeks. All measurements performed in pathological groups (except for the H6 transverse group that showed a proteinuria not significantly greater than the normal proteinuria) were significantly increased compared with controls. The high degree of correlation between the enhanced renal stiffness and the degree of renal dysfunction, measured by the proteinuria/creatininuria ratio, is very encouraging. Histological changes associated with glomerular sclerosis, vascular fibrosis, interstitial sclerosis and inflammation, were observed to be only small or mild in pathological kidneys, because of the low level of fibrosis induced by this model. The quantified global score ranged between 1 and 8 on a 25-point scale. This is the reason why, from our point of view, no correlation could be found between the semi-quantitative scoring system (which is the addition of several graded items evaluated qualitatively) and SSI (which is a quantitative value changing linearly). Conversely, the proteinuria/creatininuria ratio, which is an early marker of glomerular dysfunction, is also a quantitative value changing linearly, suggesting that SSI is a sensitive technique for detecting early intrarenal structural changes. Study of more fibrotic models is now mandatory to evaluate how stiffness values increase according to the degree of fibrosis. Unfortunately, such models with advanced fibrosis are difficult to obtain in rats. For example, ureteral obstruction is a classical highly fibrotic model but it has the disadvantage of associating fibrosis with a high level of cellularity [13, 14] and with a decrease in the tubular flow and water retention. Therefore, it could not be applied easily to elastographic investigation because increased cellularity and increased intratubular and interstitial hydrostatic pressure would change and bias the stiffness values obtained within the renal parenchyma. Abdominal Publications Abdominal-22/26 Eur Radiol Supersonic shear imaging has the advantage, compared with other ultrasound elastography approaches, of providing dynamic two-dimensional quantitative stiffness maps. Quantitative transient ultrasound elastography was developed first, and is already used in clinics for staging liver fibrosis (FibroScan®, Echosens, Paris, France) [7]. Whereas this system was recently proposed to detect fibrosis in renal transplants [15], the technique has several limitations when used for renal purposes. First, its sampling volume is fixed in depth and it is not imageguided, which poses a problem considering the complex anatomy of the kidney with its cortical and medullary portions and makes it difficult to focus samplings within the cortex only. Second, the mechanical wave needs to be applied to a rigid surface to get rid of compression effects by the probe, which is impossible for the kidney. Acoustic radiation force impulse (ARFI®, Siemens, Erlangen, Germany) [16, 17] seems more promising because it is quantitative and ultrasound-guided but limited to 5 cm in depth. Finally, the one-dimensional characteristic of these two systems is a major inconvenience knowing that the development of this degenerative fibrotic process is heterogeneous within tissues. Experience of MR elastography of the kidney is extremely limited [18]. It is based on the transmission of low-frequency mechanical waves across the tissue of interest, the wave propagation then being encoded in a tridimensional way using phase data processing. This study showed, in a rat model of nephrocalcinosis, an increase in stiffness values with renal dysfunction. Intrarenal diffusion coefficient value measured with MR imaging has also been proposed as a surrogate marker of renal fibrosis, as demonstrated recently in a model of unilateral ureteral obstruction [6]. However, in this model, as for elastography, changes in diffusion coefficients may also be due to increased cellularity and decreased tubular flow and water exchanges induced by obstruction. In the future, molecular imaging could overcome these problems by specifically targeting collagen fibres [19]. One of the main limitations of our study is the low level of fibrosis induced by this model, as discussed above. Second, measurements of stiffness were performed in the cortex only, without taking into account medullary changes because of the small size of this compartment in rats. The lack of a fibrosis score in kidney diseases, that could be correlated with stiffness values, is another limitation compared with liver diseases. Finally, interobserver variability was not evaluated in this first pilot study. In conclusion, ultrasound elastography, using the twodimensional SSI system, appears to be an efficient technique for the detection of parenchymal microstructural changes responsible for renal dysfunction. These results Updated 11/18/2011 suggest that quantification of cortical stiffness may be a useful biomarker of the progression of chronic renal disease in native or transplanted kidneys in humans. However, more experience in fibrotic experimental models and in chronic human renal diseases is still mandatory. Acknowledgements We are grateful to Angélique Foucault-Simonin and colleagues (UMR914, PNCA-INRA, AgroParisTech, Paris, France) for technical support. This work was supported by Programme National de Recherche en Imagerie 2007, Institut National de la Santé et de la Recherche Médicale (INSERM), ELASTOREIN, France. References 1. El Nahas M (2005) The global challenge of chronic kidney disease. Kidney Int 68:2918–2929 2. Lee SB, Kalluri R (2010) Mechanistic connection between inflammation and fibrosis. Kidney Int 78(Suppl 119):S22– S26 3. Ricardo SD, van Goor H, Eddy AA (2008) Macrophage diversity in renal injury and repair. J Clin Invest 118:3522–3530 4. Taouli B, Chouli M, Martin AJ, Qayyum A, Coakley FV, Vilgrain V (2008) Chronic hepatitis: role of diffusion-weighted imaging and diffusion tensor imaging for the diagnosis of liver fibrosis and inflammation. J Magn Reson Imaging 28:89–95 5. Taouli B, Tolia AJ, Losada M et al (2007) Diffusion-weighted MRI for quantification of liver fibrosis: preliminary experience. AJR Am J Roentgenol 189:799–806 6. Togao O, Doi S, Kuro-o M, Masaki T, Yorioka N, Takahashi M (2010) Assessment of renal fibrosis with diffusion-weighted MR imaging: study with murine model of unilateral ureteral obstruction. Radiology 255:772–780 7. Castera L, Forns X, Alberti A (2008) Non-invasive evaluation of liver fibrosis using transient elastography. J Hepatol 48:835–847 8. Bercoff J, Tanter M, Fink M (2004) Supersonic shear imaging: a new technique for soft tissue elasticity mapping. IEEE Trans Ultrason Ferroelectr Freq Control 51:396–409 9. Athanasiou A, Tardivon A, Tanter M et al (2010) Breast lesions: quantitative elastography with supersonic shear imaging–preliminary results. Radiology 256:297–303 10. Tanter M, Touboul D, Gennisson JL, Bercoff J, Fink M (2009) High-resolution quantitative imaging of cornea elasticity using supersonic shear imaging. IEEE Trans Med Imaging 28:1881– 1893 11. Boffa JJ, Lu Y, Placier S, Stefanski A, Dussaule JC, Chatziantoniou C (2003) Regression of renal vascular and glomerular fibrosis: role of angiotensin II receptor antagonism and matrix metalloproteinases. J Am Soc Nephrol 14:1132–1144 12. Chatziantoniou C, Boffa JJ, Tharaux PL, Flamant M, Ronco P, Dussaule JC (2004) Progression and regression in renal vascular and glomerular fibrosis. Int J Exp Pathol 85:1–11 13. Hauger O, Delalande C, Deminiere C et al (2000) Nephrotoxic nephritis and obstructive nephropathy: evaluation with MR imaging enhanced with ultrasmall superparamagnetic iron oxide-preliminary findings in a rat model. Radiology 217:819–826 14. Schreiner GF, Harris KP, Purkerson ML, Klahr S (1988) Immunological aspects of acute ureteral obstruction: immune cell infiltrate in the kidney. Kidney Int 34:487–493 Abdominal Publications Abdominal-23/26 Eur Radiol 15. Arndt R, Schmidt S, Loddenkemper C et al (2010) Noninvasive evaluation of renal allograft fibrosis by transient elastography – a pilot study. Transpl Int 23:871–877 16. Fahey BJ, Nightingale KR, McAleavey SA, Palmeri ML, Wolf PD, Trahey GE (2005) Acoustic radiation force impulse imaging of myocardial radiofrequency ablation: initial in vivo results. IEEE Trans Ultrason Ferroelectr Freq Control 52:631–641 17. Friedrich-Rust M, Wunder K, Kriener S et al (2009) Liver fibrosis in viral hepatitis: noninvasive assessment with acoustic radiation Updated 11/18/2011 force impulse imaging versus transient elastography. Radiology 252:595–604 18. Shah NS, Kruse SA, Lager DJ et al (2004) Evaluation of renal parenchymal disease in a rat model with magnetic resonance elastography. Magn Reson Med 52:56–64 19. Helm PA, Caravan P, French BA et al (2008) Postinfarction myocardial scarring in mice: molecular MR imaging with use of a collagen-targeting contrast agent. Radiology 247:788– 796 Abdominal Publications Abdominal-24/26 RSNA 2011 Quantification of the Kidney Fibrosis Using Supersonic Shear Wave Imaging: Experimental Study with Rabbit Model SK Moon, DH Lee MD, SY Kim MD, JY Cho MD, SH Kim, KC Moon. Purpose To evaluate the values and feasibility of ultrasonic shear wave elastography for the quantification of renal fibrosis in an experimental rabbit model. Materials and Methods Thirty-eight kidneys of 19 rabbits were studied and categorized into three groups; hydronephrosis group, renal vein thrombosis group and normal control group. Hydronephrosis (n=9) and renal vein thrombosis (n=10) was surgically made in each left kidney. Their right kidneys were control group (n=19).We repeatedly measured viscoelasticity (Young’s modulus, kPa) at renal cortex using shear wave elastography and evaluated sonographic findings of each kidney; size, echogenicity, other pathology, perfusion degree, and resistive index (RI) measurement before operation, on 1st day after operation, 3rd day, and weekly until 2nd week in hydronephrosis group, and until 4th week in vein thrombosis group. After sacrifice of the rabbits, degree of histologicallyquantified fibrosis and measured viscoelasticity was statistically compared. Results Before surgery, initial mean viscoelasticity of renal cortex and conventional US findings in three groups showed no significant difference (p> 0.05, 9.74kPa in control, 8.95kPa in hydronephrosis, and 9.06kPa in thrombosis). However, in the last US exam, mean viscoelasticity in each group were significantly different (p= 0.01, 9.77kPa in control, 10.91kPa in hydronephrosis, and 13.92kPa in thrombosis). Pathologically, degree of fibrosis was significantly different among three groups (p< 0.001, 0.70% in control, 3.62% in hydronephrosis, and 11.70% in thrombosis), and the fibrosis degree and viscoelasticity showed statistically good correlation (rho= 0.568, p= 0.01). In addition, mean kidney size of the thrombosis group was significantly decreased as compared with other two groups (p = 0.01). Of 39 kidneys, 19 control group kidneys had no fibrosis (< 1.5%, 0.70%), 12 minimal fibrosis (1~10%, 4.48%), and 7 mild fibrosis (> 10 %, 13.70%). In the prediction of fibrosis more than 10%, shear wave elastography showed sensitivity 100% and specificity 87.1% at a cut-off value of 12.80kPa. Conclusions Ultrasonic shear wave elastography showed good correlation between viscoelasticity and histologic degree of renal fibrosis. It can be the feasible tool in quantification of the renal fibrosis. Clinical Relevance/Application Ultrasonic shear wave elastography can be the noninvasive tool for the prediction of the renal interstitial fibrosis. Updated 11/18/2011 Abdominal Publications Abdominal-25/26 Updated 11/18/2011 Abdominal Publications Abdominal-26/26


© Copyright 2026