
Consolidated Revenue - Alberta Treasury Board and Finance
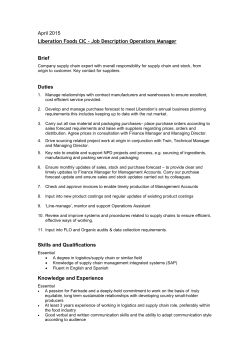
CONSOLIDATED REVENUE
25
TABLE OF CONTENTS
CONSOLIDATED REVENUE
26
Revenue Outlook. . . . . . . . . . . . . . . . . . . . . . . . . . . . . . . . . . . . . 27
Non-renewable Resource Revenue . . . . . . . . . . . . . . . . . . . . . . . . 29
Tax Revenue. . . . . . . . . . . . . . . . . . . . . . . . . . . . . . . . . . . . . . . . . 33
Federal Transfers. . . . . . . . . . . . . . . . . . . . . . . . . . . . . . . . . . . . . . 35
Investment Income. . . . . . . . . . . . . . . . . . . . . . . . . . . . . . . . . . . . 35
Other Revenue. . . . . . . . . . . . . . . . . . . . . . . . . . . . . . . . . . . . . . . 36
Risks. . . . . . . . . . . . . . . . . . . . . . . . . . . . . . . . . . . . . . . . . . . . . . . 38
CONSOLIDATED REVENUE • FISCAL PLAN 2015 –20
CONSOLIDATED REVENUE
REVENUE OUTLOOK
Total revenue, on the Consolidated Financial Statements (CFS) basis, is forecast to
be $43.4 billion in 2015-16, a decline of $5.6 billion, or 11% from the 2014-15
forecast. The CFS basis includes additional revenue of school boards, universities and
colleges and health entities (the SUCH sector) and Alberta Innovates corporations.
It also requires moving to the “deferred capital contribution” accounting treatment
for transfers received for capital purposes. These result in additional net revenue of
$4.3 billion. A reconciliation between the CFS basis and the previous Fiscal Plan
basis is provided on page 108 of the Fiscal Plan Tables chapter.
Drop in global oil prices has
significantly decreased
Alberta’s revenue forecast.
On the Fiscal Plan basis, total revenue is forecast to be $39 billion, a decrease of
$5.6 billion, or 12.6% from 2014-15. The decrease is almost entirely due to the
impact of substantially lower oil prices on resource and income tax revenue, partially
offset by a number of initiatives increasing taxes, fees and traffic violation fines,
Without revenue initiatives,
and by general growth in other revenue. Without the revenue initiatives, revenue
2015-16 revenue would have
would have dropped by $7.1 billion, or 16% in 2015-16 from the 2014-15 forecast.
Budget 2015
med: FP_B15_C-Rev_tb01_B15rf.pdf
been $7.1 billion lower than
Relative to Budget 2014 forecasts for fiscal years 2015-16 and 2016-17, and after
Consolidated Revenue
2014-15.
removing the impact of the Budget 2015 initiatives, total revenue on the Fiscal Plan
basis would be $8.3 billion and $9.4 billion lower.
Budget 2014 vs. Budget 2015 revenue forecasts
Budget 2014 vs. Budget 2015 revenue forecasts
Prior to revenue initiatives, Fiscal Plan basis
Prior
to revenue initiatives, Fiscal Plan basis
(millions of dollars)
(millions of dollars)
2014-15
2015-16
2016-17
2014-15
2015-16
2016-17
Difference
Budget 2014 Forecast
Non-renewable
resource revenue
Personal income tax
Corporate income tax
Other revenue
9,209
11,153
5,495
18,497
9,327
11,930
5,656
18,985
10,070
12,705
6,115
19,807
(415)
(159)
222
710
(6,458)
(714)
(1,127)
(11)
(6,593)
(1,010)
(1,529)
(275)
Total Revenue
44,354
45,898
48,697
358
(8,310)
(9,407)
Budget 2015
med: FP_B15_C-Rev_tb02_tr.pdf
Consolidated Revenue
The impact of lower oil prices on the revenue forecast has been slightly diminished
by a lower estimate for the US-Canadian dollar exchange rate and a lower lightheavy oil price differential. With continued, though slower, population and personal
Total Revenue
(millions of dollars)
Total
Revenue
(millions of dollars)
Personal income tax / health
care contribution levy
Corporate income tax
Other tax revenue
Non-renewable
resource revenue
Federal transfers
Investment income
Other revenue
Total Revenue
2014-15 2015-16
Forecast Estimate
2016-17
Target
2017-18
Target
2018-19
Target
2019-20
Target
10,994
5,717
4,605
11,699
4,529
5,322
12,647
4,586
5,617
13,477
5,499
5,744
14,402
6,371
5,877
15,167
7,283
6,012
8,794
6,291
3,073
9,485
2,869
6,922
2,562
9,494
3,477
7,275
2,630
9,596
4,753
7,563
2,840
9,951
6,279
7,878
3,048
10,109
8,739
8,173
3,189
10,214
48,959
43,397
45,828
49,827
53,964
58,777
pdf named: FP_B15_C-Rev_tb02_tr.pdf
Total revenue forecast to be
$43.4 billion in 2015-16.
FISCAL PLAN 2015 –20 • CONSOLIDATED REVENUE
27
pdf named: FP_B15_C-Rev_ch01_tr.pdf
Budget
Rev
Fiscal Plan
Total Revenue, 2000-01 to 2019-20
(billions of dollars)
Total Revenue, 2000-01 to 2019-20
(billions of dollars)
60
50
40
Investment Income
30
20
10
Total Revenue
Resource Revenue
Corporate Income Tax
Federal Transfers
Other Revenue
0
Personal Income Tax /
Health Care Contibution Levy
Other Taxes
In 2002-03 and 2008-09, the value of Alberta’s investment assets fell. This is accounted for
as negative income.
income growth in Alberta, personal income tax revenue is forecast to increase
in 2015-16, but by much less than previously expected. In addition, federal
transfer revenue is estimated to increase due to the national escalators and
Alberta’s population growth relative to other provinces. There are a myriad
of other factors that affect Alberta’s revenue, as outlined in the following
discussion, but changes to commodity prices, the exchange rate and population
growth impact the economic forecast directly and drive most of the other
variables factored into the revenue forecast. A more detailed discussion of these
elements
old order is provided in the Economic Outlook chapter.
line for total
The
50% drop in oil prices between June 2014 and March 2015, and resulting
significant
OVERVIEW reduction to Alberta government revenue in 2015-16, encouraged
- black line
is added
in InDesign
aformatted
re-evaluation
of fiscal
planning
policies. In an effort to manage the inevitable
revenue
volatility
associated
with
an economy dominated by the resource
A higher proportion of funding for
pdf named: FP_B15_C-Rev_ch01_tr.pdf
Budget 20
pdf named: FP_B15_C-Rev_tb03_irfb5i.pdf
sector, and to balance the budget, the government is implementing a number ofConsolidated Reve
programs and services will come
changes to its revenue structure. This will mean a higher proportion of funding
from taxes and user fees.
for programs and services will come from taxes and user fees.
Incremental Revenue from Budget 2015 Initiatives
from Budget 2015 Initiatives
(millions of dollars)
Incremental
Revenue
(millions of dollars)
Personal income tax
Health care contribution levy
Fuel tax
Tobacco tax
Insurance premiums tax
Liquor mark-ups
Traffic fines
Land titles fees
Motor vehicle fees
Other fees
Total Revenue Initatives
28
2015-16
Estimate
87
396
530
90
75
60
160
34
50
1,482
2016-17
Target
420
532
535
90
165
76
60
163
37
78
2,156
2017-18
Target
649
540
546
91
177
77
60
167
38
92
2,437
2018-19
Target
820
557
562
91
177
77
60
172
39
108
2,663
2019-20
Target
790
567
579
92
177
80
60
177
40
122
2,684
M:\MinShare\PublnsProd\CorpFin\OBM.PUBLNS-2015-16\2015-18_BUDGET_FiscalPlan-volume\3_Cons_REV_B2015\source-docs\
Last printed: 3/19/2015/ 2:18
CONSOLIDATED
REVENUE • FISCAL PLAN 2015 –20
B-2015_FP_Cons_REV_tables.xlsx
/ Ch 1 Total Rev
pdf named: FP_B15_C-Rev_tb03_irfb5i.pdf
Revenue initiatives being implemented amount to $1.5 billion in 2015-16 and
grow to $2.7 billion by 2019-20. This primarily reflects higher personal income
taxes, introducing a health care contribution levy through the personal income
tax system, raising tobacco, fuel and insurance premium taxes, liquor mark-ups,
traffic violation fines, and land titles, motor vehicle and other fees. Details on
the tax changes are provided in the Tax Plan chapter, and on the fee changes, in
following sections.
Revenue initiaitves amount to
$1.5 billion in 2015-16, growing
to $2.7 billion by 2019-20.
In addition, the government is altering how resource revenue is factored into
budgeting, such that by 2019-20 (or earlier, depending on the fiscal situation),
By 2019-20, only 50% of resource
only 50% of resource revenue will be used for the budget, with the other 50%
revenue will be used for budget
allocated to savings or paying for investment in infrastructure (or alternatively,
purposes, reducing risk and reliance
reduction of debt for the Capital Plan). The impact over time will be to reduce
on the volatile revenue source.
reliance on volatile resource revenue for budget purposes. In the current
Budget 2015
med: FP_B15_C-Rev_tb04_rrorrfbp.pdf
ten-year outlook, resource revenue is forecast to climb to 17.4% of total
Consolidated Revenue
revenue, but under the new fiscal policy, resource revenue used for budget
purposes would remain below 10% of total revenue for budget purposes.
Reducedreliance
relianceon
onresource
resource revenue
revenue for
for budget
budget purposes
purposes
Reduced
2014-15
2015-16
2019-20
2024-25
Resource revenue / Total revenue
18.0%
6.6%
14.9%
17.4%
Resource revenue for budget purposes /
Total revenue for budget purposes
18.0%
6.6%
8.0%
9.5%
NON-RENEWABLE RESOURCE REVENUE
pdf named: FP_B15_C-Rev_tb04_rrorrfbp.pdf
Non-renewable resource revenue in 2015-16 accounts for under 7% of
total revenue, though its share is expected to grow to 15% by 2019-20. It is
forecast at $2.9 billion, $5.9 billion, or 67% lower than in 2014-15, with
bitumen and crude oil royalties $5.2 billion, or 73% lower. Resource revenue
is estimated to increase by an average of 32% per year between 2015-16 and
2019-20, to $8.7 billion, with substantial growth in bitumen royalties, mainly
ed: FP_B15_C-Rev_ch02_nrrr.pdf
Fiscal Plan
due to rising production and a steady
climb in oil prices. Revenue forecast for
2019-20 is basically the same level as forecast for 2014-15.
Resource revenue in 2015-16 is
estimated at $2.9 billion, less than
7% of total revenue, and 67%
lower than 2014-15.
Budget 201
C. Revenue
Non-Renewable Resource Revenue, 1998-99 to 2019-20
(billions)
Non-Renewable Resource Revenue, 1998-99 to 2019-20
(billions
(billions)of dollars)
16
14
12
10
8
6
4
2
0
a
Natural gas
Other
Bitumen
Crude oil
Other includes Crown land lease sales revenue.
Series4
Series3
Series2
FISCAL PLAN 2015 –20 • CONSOLIDATED REVENUE
29
Increasing supply, decreasing
demand growth and OPEC’s
decision not to cut production
resulted in oil price free fall.
Oil prices tumbled from a high of US$107 per barrel (/bbl) in June 2014 to
mid-$40/bbl in January and have remained in the $40-50/bbl range since. The
drop in prices arose from a combination of factors, including an acceleration
of global supply growth, mainly from steadily increasing North American
production over the last several years, and from the return of production
from Iran, Iraq and Libya. At the same time, global demand growth has been
weakening, due to a deceleration of expansion in developing economies,
continued economic problems in Europe, and other geopolitical events. Finally,
OPEC members in November determined that their interests were best served
by not cutting their production to support prices, but rather continuing to
produce with a goal of forcing other market participants to restrain their
contribution to what was considered an “over-supplied” global market. The
result was a dramatic free fall in oil prices.
Global energy producers have responded, with reduced capital investment
announced or expected, and significantly reduced North American rigs drilling.
Analysts vary considerably on how long the oversupply will continue, when
prices will bottom out, and how fast prices will climb and what level they will
attain. The Alberta government forecast is for prices to rebound starting in the
second half of 2015, as the impact of lower drilling in North America, reduced
investment elsewhere and production disruptions in war-torn regions impact
supply, and as demand picks up.
Revenue forecast based on
US$54.84 in 2015-16, with prices
starting to rebound in second half
of 2015.
The revenue forecast is based on West Texas Intermediate oil price (WTI)
averaging US$54.84 in 2015-16, $62.80 in 2016-17 and reaching just under
$84 by 2019-20. Other factors affecting oil royalty revenue are the light-heavy
oil price differential, the US-Canadian dollar exchange rate, actual Alberta
production and producer costs:
pdf named: FP_B15_C-Rev_tb05_oa.pdf
F The Western
Canadian Select price (WCS), a benchmark price for heavy
oil (bitumen), has not declined to the same degree as WTI, so that the
differential between the two prices has narrowed. In both 2014-15 and
Oil Assumptions
Oil Assumptions
2014-15 2015-16 2016-17
Forecast Estimate
Target
2017-18
Target
2018-19
Target
2019-20
Target
Revenue ($ millions)
Bitumen royalty
Crude oil royalty
5,001
2,163
1,361
594
1,767
776
2,850
907
4,326
928
6,551
1,022
Prices
West Texas Intermediate
(US$/bbl)
79.87
54.84
62.80
75.14
78.89
83.83
69.86
46.33
51.12
61.77
65.76
74.23
(17.30)
(17.07)
(20.37)
(23.25)
(23.00)
(20.00)
Conventional
Raw bitumen
585
2,346
575
2,552
566
2,676
545
2,944
527
3,313
510
3,567
Exchange rate
(US¢/Cdn$)
88.30
81.50
83.00
84.00
85.00
86.00
WCS @ Hardisty
(Cdn$/bbl)
Differential
(US$/bbl)
Production
(thousands of barrels per day)
30
CONSOLIDATED REVENUE • FISCAL PLAN 2015 –20
Budget 2
Cons. Reven
2015-16, it is estimated at just over US$17/bbl, which has positively
impacted revenue. However, with Alberta production expected to
continue increasing, with more projects coming on stream and existing
projects expanding, access to Texas refineries or coastal ports for export is
anticipated to remain insufficient or to be achieved through more costly
rail transportation. The light-heavy oil price differential is thus forecast to
expand to US$23.25 by 2017-18.
F Similarly, the weakening of the Canadian dollar relative to the US dollar,
caused mostly by the strength of the US dollar relative to most currencies
with a return to healthy US economic performance, supports royalty
revenue. The bitumen royalty rate is based on the WTI price expressed in
Canadian dollars, so the royalty rate is higher with a lower Canadian dollar.
A lower dollar also elevates producers’ incomes in Canadian dollars. The
exchange rate is, however, expected to strengthen over the forecast period.
Lower US-Canadian dollar
exchange rate, easing business costs
and increasing bitumen production
help support royalty revenue.
F Bitumen production continues to grow, and is estimated to increase 52%
between 2014-15 and 2019-20. Conventional crude oil production is
expected to slowly decline.
F Finally, business costs are forecast to ease. Low oil prices should dampen
Alberta’s previously red-hot labour market and reduce prices for condensate
used to dilute bitumen for transportation (as condensate prices follow oil
prices). Natural gas is a significant input for certain oil sands operations
and gas prices also remain weak. Since costs are part of royalty calculations,
these support royalty revenue, though it is also the case that royalty rates are
sensitive to prices, so that rates are lower with lower prices.
Bitumen royalties are estimated at $1.4 billion in 2015-16, $3.6 billion, or
73% lower than in 2014-15. They are forecast to increase to $1.8 billion in
2016-17, and then climb to $6.6 billion by 2019-20, with an average annual
growth rate of 48% between 2015-16 to 2019-20. The main drivers are
increasing oil prices and higher production.
Bitumen royalties expected
to grow to $6.6 billion by
2019‑20.
The government will supply bitumen to the North West Upgrader, tentatively
scheduled to begin operations in 2017, which will upgrade bitumen into
higher-valued products such as ultra low sulphur diesel. The Province will
receive a portion of the revenue from the sale of the upgraded product, but
is also responsible to pay monthly cost of service tolls for the 30-year term of
the contract. The financial return from the project is heavily dependent on the
costs of constructing and operating the facility, as well as the price differential
between bitumen and upgraded products over the term of the contract.
Conventional oil royalties are estimated at $594 million in 2015-16,
$1.6 billion or 73% lower than in 2014-15. While they are forecast to recover
also, they are only forecast at $1 billion by 2019-20, with average annual
growth of 14.5% between 2015-16 and 2019-20. Changes to the royalty
system implemented five years ago have encouraged the use of new technologies
to drill wells that previously would have been too costly to develop. Production
has risen since 2011, but an increasing amount of production is from
horizontal wells, subject to the same 5% royalty rate as all conventional oil
wells for year one of production, but then paying the 5% rate for an additional
FISCAL PLAN 2015 –20 • CONSOLIDATED REVENUE
31
one to three years, depending on well depth. In 2014, 83% of crude oil wells
placed on production were horizontal wells.
Immediate outlook for natural gas
prices and royalties remains weak.
Natural gas and by-product royalties are estimated at $450 million in
2015-16, $510 million or 53% lower than in 2014-15. They are expected to
grow marginally, at 9% per year on average, out to 2019-20, when they are
forecast at $645 million. Revenue includes royalties from natural gas byproducts, such as propane, butane and pentane. The prices of these by-products
more closely follow oil prices, and thus revenue tracks the oil price forecast.
The immediate outlook for natural gas prices continues to be weak, with
abundant natural gas supplies keeping prices low. North American natural gas
storage levels recovered during 2014 from the low levels reached at the end of
2013, with mild summer weather, no hurricane-induced supply disruptions,
and a generally warm, though tumultuous, winter. Continued strong growth
in US shale gas production is expected to meet demand growth arising from
improving US economic conditions, US liquid natural gas exports and
increasing North American demand from retirement of coal-fired electricity
plants over the medium term.
As a result, the Alberta Reference Price (ARP) for 2015-16 is estimated at
Cdn$2.94/GJ, 59 cents lower than in 2014-15. The ARP is forecast to remain
low over the next four years, reaching $3.64/GJ by 2019-20. Natural gas
production is forecast to increase slightly in 2015-16 and then to trend down
during
the next
Natural
Gasfour
andyears.
By-product Assumptions
PDF named: FP_B15_C-Rev_tb06_ngabpa.pdf
Budget 20
C. Reven
Natural Gas Assumptions
Revenue ($ millions)
Price (Cdn$/GJ)
Production
(billions of cubic feet)
Lower demand for
Crown leases expected.
2014-15
Forecast
960
3.53
2015-16
Estimate
450
2.94
2016-17
Target
466
3.17
2017-18
Target
474
3.44
2018-19
Target
505
3.53
2019-20
Target
645
3.64
4,700
4,743
4,546
4,399
4,397
4,398
Bonuses and sales of Crown land leases revenue has fallen substantially
since the $3.3 billion realized in 2011-12, when the June 1, 2011 sale brought
highest one-day sale amount in Alberta’s history. In
2014-15, revenue from land lease sales is expected to be only $484 million,
while in 2015-16 it is estimated at $315 million. With companies tightening
their belts, it is anticipated that fewer hectares will be requested and sold over
the
forecast period. resource revenue
Non-renewable
in $842 million, the
Pdf named: FP_B15_C-Rev_tb07_nrrr.pdf
(millions of dollars)
Non-Renewable Resource Revenue
(millions of dollars)
Bitumen royalty
Rentals and fees
Coal royalty
5,001
2,163
960
484
168
18
1,361
594
450
315
135
14
1,767
776
466
334
120
14
2,850
907
474
396
112
14
4,326
928
505
400
106
14
6,551
1,022
645
404
103
14
Total Resource Revenue
8,794
2,869
3,477
4,753
6,279
8,739
Crude oil royalty
Natural gas & by-products royalty
Bonuses & sales of Crown leases
32
2014-15 2015-16 2016-17 2017-18 2018-19 2019-20
Forecast Estimate
Target
Target
Target
Target
CONSOLIDATED REVENUE • FISCAL PLAN 2015 –20
Budget
C. Reve
med:
TAX REVENUE
Tax revenue is forecast at $21.6 billion in 2015-16. This is an increase of
only $234 million, or 1% from 2014-15. While a number of tax increases are
being implemented, including the introduction on July 1, 2015 of a new health
care contribution levy administered through the personal income tax system,
other personal income tax changes are not effective until January 1, 2016 or
later. Thus the full impact of these measures is not realized in 2015-16 revenue.
Furthermore, an estimated 50% drop in corporate profits is forecast to reduce
corporate income tax revenue by $1.2 billion.
Personal income tax is estimated at $11.3 billion in 2015-16. After removing
the impact of tax measures and a prior-years’ adjustment included in 2014-15
revenue, this is an increase of $284 million, or 2.6% from 2014-15. This is due
mainly to a lower forecast for primary household income, expected to increase
by only 2.4% in 2015. It is estimated that population, employment and wage
growth will be slower, with economic activity dampened by lower oil prices.
FP_B15_C-Rev_tb08_piahctr.pdf
Revenue is forecast to increase between 2015-16 and 2019-20, with average
growth of almost 7%, both from the anticipated strengthening of oil prices and
the economy, and to the tax measures.
New health care contribution levy,
administered through personal
income tax system, to be introduced
July 1, 2015.
Personal income tax revenue
estimated at $11.3 billion for
2015-16.
Budget 2015
C. Revenue
Personal Income Tax / Health Care Contribution Levy Reve
(millions of dollars)
Personal
Income Tax / Health Care Contribution Levy Revenue
(millions of dollars)
Total personal income
tax (PIT) revenue
Adjustments to prior years
PIT measures
Base PIT revenue
2014-15
Forecast
2015-16
Estimate
2016-17
Target
2017-18
Target
2018-19
Target
2019-20
Target
10,994
(62)
-
11,303
(87)
12,115
(420)
12,937
(649)
13,845
(820)
14,600
(790)
10,932
11,216
11,695
12,288
13,025
13,810
2.6
4.3
5.1
6.0
6.0
396
532
540
557
567
Base PIT revenue change (%)
Health care contribution levy
-
It is estimated that the health care contribution levy will raise $396 million
in 2015-16, when it is only applicable for a portion of the fiscal year, and
$532 million in 2016-17 when it will be in effect for the whole fiscal year. The
tax is being administered as part of the personal income tax system to minimize
administrative costs, to implement a progressive structure, and to avoid
complications for employers. Details of the various personal income tax and
health care contribution levy changes are discussed in the Tax Plan chapter.
Corporate income tax is forecast at $4.5 billion in 2015-16, $1.2 billion or
21% lower than 2014-15. Cash instalment payments from corporations in
2014-15 remained strong despite the collapse in oil prices, partly from the high
oil prices in the first half of 2014. There has also been continued health in the
construction, consumer, forestry, agriculture and food manufacturing sectors,
aided by the US economy’s strength and the low Canadian dollar.
Corporate income tax revenue
forecast at $4.5 billion in 2015-16,
21% lower than 2014-15.
Corporate income tax revenue is expected to remain low in 2016-17, and then
strengthen, reaching $7.3 billion by 2019-20. Net corporate operating surplus
is not forecast to recover from the drop of over 50% estimated for 2015 until
2018. Business income is anticipated to rise, driven by oil sands production
growth and recovering energy prices, gains in the manufacturing sector, a
FISCAL PLAN 2015 –20 • CONSOLIDATED REVENUE
33
Budget 2
C. Reve
Pdf named: FP_B15_C-Rev_tb09_citr.pdf
positive outlook for the agriculture and forestry sectors, and moderation in
labour
and other
costs. Tax Revenue
Corporate
Income
(millions of dollars)
Corporate Income Tax Revenue
(millions of dollars)
Total
2014-15
Forecast
2015-16
Estimate
2016-17
Target
2017-18
Target
2018-19
Target
2019-20
Target
5,717
4,529
4,586
5,499
6,371
7,283
1.3
19.9
15.9
14.3
(20.8)
Revenue change (%)
Education property tax revenue is forecast at $2.3 billion in 2015-16, an
increase of $147 million, or 7% from 2014-15. The increase is due primarily
to the policy, implemented in Budget 2013, that set the next fiscal year’s
requisition amount based on 32% of the next fiscal year’s total education
system operating expense target contained in the current year’s budget (so the
2015-16 amount was set in Budget 2014). This policy will not be continued
after 2015-16. The requisition will be determined annually, as it was before
2013-14, giving the government flexibility with respect to property tax policy
as part of the budget process.
With the move to budgeting on the CFS basis, property tax revenue now
includes the opted-out board portion, which adds about $220 million to
revenue in 2015-16.
Education property tax mill
rates reduced about 1.25%
in 2015.
Increases to fuel, tobacco,
insurance premiums taxes.
Education property tax mill rates for 2015 are being reduced by about 1.25%.
The residential/farm rate will drop 3 cents to $2.50 per $1,000 of equalized
assessment, and the non-residential rate will fall 5 cents to $3.67 per $1,000
of equalized assessment. Since the province took over responsibility for the
education property tax in 1994, the proportion of provincial education
property tax relative to total provincial and municipal property tax has fallen
from 51% to 26%, while the municipal portion has increased from 49% to
74%. Education property tax revenue is forecast to increase $195 million by
2019-20, an average of 2% per year between 2015-16 and 2019-20.
Other tax revenue is forecast at $3.1 billion in 2015-16, an increase of
$570 million, or 23% from 2014-15. The increase reflects the tax rate increases
being implemented with Budget 2015, for fuel and tobacco taxes, partly offset
by lower revenue forecasts for several of the taxes related to the impact of the oil
price drop. The majority of the revenue increase in 2015-16, $530 million, is
due to the 4¢ per litre increase to gasoline and diesel taxes. The insurance
premiums tax is also being increased by $165 million, but not until 2016-17.
More details are provided in the Tax Plan chapter. Other tax revenue is
Pdf named: FP_B15_C-Rev_tb10_tr.pdf
anticipated to grow at an annual average of 3.8% for the following four years,
reaching $3.6 billion by 2019-20.
Budget 2
C. Reve
Tax Revenue
(millions
of dollars)
Tax
Revenue
(millions of dollars)
34
Personal income tax
Health care contrib. levy
Corporate income tax
Education property tax
Other taxes
2014-15
Forecast
10,994
5,717
2,106
2,499
2015-16
Estimate
11,303
396
4,529
2,253
3,069
2016-17
Target
12,115
532
4,586
2,318
3,299
2017-18
Target
12,937
540
5,499
2,360
3,384
2018-19
Target
13,845
557
6,371
2,403
3,474
2019-20
Target
14,600
567
7,283
2,448
3,564
Total
21,316
21,550
22,850
24,720
26,650
28,462
CONSOLIDATED REVENUE • FISCAL PLAN 2015 –20
M:\MinShare\PublnsProd\CorpFin\OBM.PUBLNS-2015-16\2015-18_BUDGET_FiscalPlan-volume\3_Cons_REV_B2015\source-docs\
Printed: 3/18/2015 / 9:51
B-2015_FP_Cons_REV_tables.xlsx / Tb 9 CIT revenue
FEDERAL TRANSFERS
Federal transfers are forecast at $6.9 billion in 2015-16. This is an increase
of $631 million or 10% from 2014-15, though base 2014-15 revenue is
understated by $246 million. A negative adjustment was required in 2014‑15
revenue to account for a revision to revenue reported in 2013-14 financial
statements for 2013 flood disaster assistance. After removing this anomaly, the
increase is $385 million, or 6%. The forecast now includes revenue transferred
directly to the SUCH sector, mainly for education programs delivered by postsecondary institutions.
Federal transfer forecast to be
$6.9 billion in 2015-16.
Transfers for infrastructure programs are now reported based on the “deferred
capital contribution” accounting treatment. Instead of recognizing revenue
when the cash is spent, the revenue recognition is deferred and matched to
the recognition of the related capital asset’s amortization expense as the asset
depreciates over time. This lowers reported revenue slightly in the first few
years, and then increases it slightly in the final three years.
The Canada Social Transfer and Canada Health Transfer grow in line with the
federal annual escalators (3% for CST and 6% for CHT) and changes to
5_C-Rev_tb11_tfgoc.pdf
Alberta’s share of the national population. Federal transfers are forecast to grow
by an average of 4.2% between 2015-16 and 2019-20, reaching $8.2 billion.
Budget 2015
C. Revenue
Transfers from Government of Canada
Transfers
from Government of Canada
(millions of dollars)
(millions of dollars)
2014-15
Forecast
3,618
Canada Health Transfer
Canada Social Transfer
1,452
Transfers to SUCH sector
474
Agriculture support programs
304
Infrastructure support
278
2013 Alberta flood assistance
(246)
Other transfers
411
Total
6,291
2015-16
Estimate
3,978
1,515
476
288
259
406
2016-17
Target
4,242
1,570
478
296
283
406
2017-18
Target
4,460
1,626
478
302
285
412
2018-19
Target
4,694
1,687
480
306
299
412
2019-20
Target
4,944
1,751
480
308
299
391
6,922
7,275
7,563
7,878
8,173
INVESTMENT INCOME
Investment income is forecast at $2.6 billion in 2015-16, a $511 million or
16.6% decrease from 2014-15. The decline in investment income is mainly due
to significant income realized in 2014-15, a large portion of which was carried
forward from exceptional 2013-14 returns, when investment income was the
second highest level ever. The strong equity markets during 2013 elevated
Heritage Fund and endowment fund earnings, and gains embedded in assets
from that year were realized in 2014, boosting 2014-15 income. Although
the projected year-over-year change in income seems to be a dramatic drop,
investment income in 2014-15 is poised to be the fourth highest level ever.
Investment income to decrease
from solid 2014-15 levels.
Investment income is estimated to grow by an average of 5.6% between
2015‑16 and 2019-20, to $3.2 billion, as income realized by the Heritage and
endowment funds, and overall financial market returns, reset to normal levels.
Income now includes about $200 million from the SUCH sector, primarily
reflecting reserves and post-secondary institution endowments.
FISCAL PLAN 2015 –20 • CONSOLIDATED REVENUE
35
Investment income from Alberta Capital Finance Authority (ACFA) is forecast
to increase by an average of 18% per year between 2015-16 and 2019-20.
ACFA, which accesses the government’s triple A credit rating to borrow and
then transfers that advantage to municpalities and other local authorities by
on-lending the proceeds, is expecting increased lending activity. This elevates
both its investment income, and also government’s general debt servicing
costs, approximately by an equivalent amount. Investment income of the
Agriculture Financial Services Corporation (AFSC) is forecast to increase by an
annual average of 14.6% between 2015-16 and 2019-20, mainly due to higher
estimated balances in its insurance funds.
Investment income from the Contingency Account is forecast to decrease as its
balance is depleted over the next several years, as is its function, to deal with the
deficits associated with the current revenue challenge. Its income begins to
recover as the other two levers employed by government, revenue intitiatives
and significant expense restraint, take hold, first balancing the budget and then
producing surpluses that are allocated initially to replenishing the Contingency
Pdf named: FP_B15_C-Rev_tb12_faii.pdf
Account. The Account’s balance, and income, are forecast to start increasing in
2017-18, with the balance reaching $5 billion by 2019-20.
Fund Assets/Investment Income
Contingency Account used to offset
deficits and stabilize fiscal situation
in short term, which is its purpose.
Fund
(millionsAssets
of dollars) / Investment Income
(millions of dollars)
Assets as at
Mar. 31, 2015
Heritage Savings
Trust Fund
Endowment Funds a
Contingency Account
Alberta Capital
Finance Authority
Agriculture Financial
Services Corp.
SUCH sector
Other b
Total
a Includes Alberta
2014-15
Forecast
2015-16
Estimate
2016-17
Target
2017-18
Target
2018-19
Target
2019-20
Target
15,091
3,319
6,520
1,867
352
110
1,455
260
103
1,413
283
63
1,462
303
72
1,498
317
144
1,514
331
174
15,148
289
318
420
512
564
625
4,232
n.a.
129
212
137
212
155
212
185
212
216
212
236
212
583
114
77
84
94
97
97
44,893
3,073
2,562
2,630
2,840
3,048
3,189
Heritage Foundation for Medical Research Endowment Fund, Alberta
a Includes
Heritage
Foundation
for Medical
Research
Endowment
Fund, Alberta
Heritage
HeritageAlberta
Scholarship
Fund
and Alberta
Heritage
Science
and Engineering
Research
Fund.
Scholarship Fund and Alberta Heritage Science and Engineering Research Fund
b Assets include the Cancer Prevention Legacy Fund and Alberta Enterprise Fund; investment
b Assets include the Cancer Prevention Legacy Fund and Alberta Enterprise Fund; investment income
incomeincome
includes
from these
sources
and other
investment
income
a variety
of
includes
fromincome
these sources
and other
investment
income
from a variety
of from
smaller
funds and
smaller funds and accounts.
OTHER REVENUE
Other revenue is forecast at $9.5 billion in 2015-16, essentially unchanged
from 2014-15. However, 2014-15 revenue includes a $436 million positive
adjustment to account for a revision to expense reported in 2013-14 financial
statements for 2013 flood disaster assistance (“refund of expense”; a related
negative adjustment, noted earlier, was made to federal transfer revenue). After
removing this anomaly, the increase is $445 million, or 4.9%, almost all of
which reflects a number of increases to fees, fines and liquor mark-ups.
Other revenue includes preliminary
estimates for SUCH sector fees,
sales and donations revenue.
36
The “other revenue” forecast also now includes health and school board fees
and charges, post-secondary tuition fees, other SUCH sector sales, rental and
services revenue, and SUCH sector fundraising, gifts and donations revenue.
The estimates for several of these, in particular, tuition and school board fees,
CONSOLIDATED REVENUE • FISCAL PLAN 2015 –20
Budget 2
C. Reve
are based on preliminary assumptions, as post-secondary institutions and
school boards will make final decisions on their individual rates.
Other revenue is estimated to grow by an average of about 2% per year over the
remaining four years, reaching $10.2 billion by 2019-20.
✦ Revenue from liquor mark-ups administered by the Alberta Gaming and
Liquor Commision is being increased by 10%, or $75 million in 2015-16.
Changes to the various mark-ups will take effect March 27.
Revenue from liquor mark-ups
increasing 10%.
✦ Increases to various motor vehicle fees, including obtaining driver abstracts,
vehicle registration and applying for or renewing licences are estimated to
increase revenue by a net $34 million in 2015-16.
✦ Increases to various land titles fees, including searches, transfers and title
creation and mortgage registrations, are estimated to increase revenue by
$160 million, and will be enacted via enabling legislation. Similarly,
changes to corporate registry fees raising $11 million will be legislated.
Motor vehicle, land titles and other
fees are being increased in Budget
2015.
F Various other fee increases are estimated to increase 2015-16 revenue by
$39 million. These include various civil, family and surrogate court filing
fees, vital statistics, land rent for dispositions on public land, application
fees for public land leases, royalty rates for sand, silt and gravel, and various
parks fees.
✦ Changes to various fines for traffic violations, which have not been increased
since 2003, are estimated to increase 2015-16 revenue by $60 million.
Average traffic ticket fines will increase 35%. Municipalities will also benefit
from these changes, with approximately $26 million more revenue.
More details on the
med: FP_B15_C-Rev_tb13_rfos.pdf
changes to specific fee and fine rates are provided in the
“Changes to Premiums, Fees and Fines” table in the Fiscal Plan Tables chapter.
Traffic fines going up 35% on
average.
Budget 2015
C. Revenue
Revenue from Other Sources
(millions of dollars)
Revenue from Other Sources
(millions of dollars)
Alberta Gaming and
Liquor Commission
Alberta Treasury Branches
Tuition fees
Health / school board fees
Other prem., fees and licences
SUCH sector sales, rentals
SUCH sector fundraising, gifts
Other
Total
2014-15 2015-16 2016-17 2017-18 2018-19 2019-20
Forecast Estimate
Target
Target
Target
Target
2,243
316
1,122
634
1,796
862
549
1,963
2,379
283
1,153
671
2,048
855
563
1,542
2,450
264
1,172
673
2,113
858
563
1,503
2,525
376
1,193
675
2,206
863
563
1,550
2,574
401
1,217
677
2,246
868
564
1,562
2,627
426
1,242
679
2,300
874
565
1,501
9,485
9,494
9,596
9,951
10,109
10,214
FISCAL PLAN 2015 –20 • CONSOLIDATED REVENUE
37
RISKS
Alberta’s reliance on volatile and
unpredictable revenue puts program
and service funding at risk.
Alberta relies heavily on revenue sources that can be volatile and unpredictable,
including non-renewable resources, corporate income tax and investment
income. Since 2000-01, these revenue sources have accounted for anywhere
between 38% and 55% of total revenue, but in 2015-16 they are estimated at
25% of total revenue (Fiscal Plan basis). This revenue is linked to factors such
as energy prices, equity markets, exchange rates, geopolitical events and global
economic swings. These are all clearly unpredictable, can fluctuate rapidly, and
are outside Alberta’s influence. The drop in resource revenue and corporate
income tax is directly tied to the current precipitous drop in oil prices.
New fiscal principles reduce
reliance on volatile revenue, focus
spending on prioirites,
and increase proportion funded
by taxes and user fees.
The degree of revenue uncertainty exposes the Alberta government uniquely
relative to other governments. Like energy companies, banks and other
investors, Alberta must assess the degree of risk it is willing to take associated
with its revenue outlook and spending decisions. The government has decided
to act with Budget 2015, developing a new set of fiscal principles that will
lead to less reliance on volatile resource revenue for budget planning, and also
increase the proportion of revenue from taxes and user fees that covers dayto-day spending. Budget 2015 also begins the difficult process of retracting
Alberta’s relatively high spending levels, enabled by the past positive spikes in
volatile revenue, and accompanied by economic growth and population-driven
operating and infrastructure pressures.
GLOBAL AND US ECONOMIES
✦ Budget 2015 assumes global economic growth of just over 3% in 2015,
about the same as in 2014, based on solid performance in the US,
continued struggles in Europe, and mixed prospects for the emerging
economies. Substantial risks remain.
✦ Weaker-than-forecast global growth would further harm Alberta’s revenue
forecast, as it would likely keep oil prices lower, for a longer period. Stronger
growth would have a positive impact.
ENERGY PRICES
✦ Oil prices are expected to begin recovering in the second half of 2015,
averaging in the mid-US$50 range for 2015-16, and then to slowly ascend
towards US$80 level by 2019-20. Energy analysts have widely different
opinions on the speed of recovery and the level prices will recover to. Views
on the underlying fundamental price vary from $70 to $100, and time
frames are anywhere from two to five years.
✦ Price forecasts depend on an array of assumptions about demand and
supply. Factors influencing demand include economic growth in disparate
regions around the world, from the US to China to Europe, pipeline or
refinery outages, and storage and speculative market activities by traders.
On the supply side, investment and drilling decisions by producers,
geopolitical events, civil unrest or terrorist strikes, economic sanctions,
OPEC market-manipulation or simple weather-related production
disruptions all have to be factored into forecasting.
38
CONSOLIDATED REVENUE • FISCAL PLAN 2015 –20
✦ Alberta’s current dependence on a single export market (the US) adds risk.
✦ Natural gas prices remain weak due mainly to increasing production of US
shale gas that has outstripped demand growth.
INTEREST RATES
✦ Interest rates are forecast to remain low as global economic prospects
continue to be fragile. Lower rates generally help government investment
income. While short-term investments perform poorly, the market value of
bonds with higher rates held in endowment portfolios increase.
✦ Lower rates also typically encourage business investment, economic activity
and consumer spending, all providing economic support to Alberta’s
resource-based economy harmed by the oil price weakness.
✦ However, rates eventually will rise, posing a risk for indebted households,
consumer spending and the government as substantial borrowing for the
Capital Plan is planned. Higher future interest rates make borrowing or
refinancing of debt more expensive.
EXCHANGE RATES
✦ The US-Canadian dollar exchange rate has weakened considerably, in large
part due to US economic strength relative to other global economies, but
more dramatically in early 2015 when the Bank of Canada cut the target
interest rate by 25 basis points. The forecast assumes the dollar will remain
low at 81.5US¢/Cdn$ in 2015-16, and move tepidly to 86¢ by 2019-20. A
weaker Canadian dollar increases the value of oil exports and the demand
for exports priced in Canadian dollars, and in turn Alberta’s economic
growth. Changes in the exchange rate affect the profitability of energy
producers, which can affect investment and government resource revenue
as energy prices and contracts are mainly in US dollars. Investment income
me: FP_B15_C-Rev_tb14_sfya.pdf
is also impacted due to significant foreign holdings in the Heritage Savings
Trust Fund and endowment funds.
Budget 2015
C. Revenue
Sensitivities to Fiscal Year Assumptions, 2015-16 a
Sensitivities to Fiscal Year Assumptions, 2015–16 a
(millions of dollars)
(millions
of dollars)
Oil price (WTI US$/bbl)
Light-heavy oil price differential (US$/bbl)
Natural gas price (Cdn$/GJ)
Exchange rate (US¢/Cdn$)
Interest rates
Primary household income
Change
-$1
+$1
-10¢
+ 1¢
+1%
-1%
Net Impact
-148
-82
-31
-61
-188
-143
a
Sensitivities are based on current assumptions of prices and rates and show the effect for a
Sensitivities are based on current assumptions of prices and rates and show the effect for a
full 12 month period. Sensitivities can vary significantly at different price and rate levels. The
full 12 month period. Sensitivities can vary significantly at different price and rate levels. The
energy price sensitivities do not include the potential impact of price changes on the revenue
energy price sensitivities do not include the potential impact of price changes on the revenue
from land lease sales.
from land lease sales. The interest rate sensitivity has two components, an increase in cash
interest income and a capital loss. When interest rates rise, bond prices go down, causing a
capital loss.
a
FISCAL PLAN 2015 –20 • CONSOLIDATED REVENUE
39
EQUITY MARKETS
✦ While equity markets performed well in 2013, and 2014 income benefited,
markets can be affected by a wide range of factors, such as the strength
of the US economy, uncertainty regarding the European and developing
economies, or fluctuations in commodity prices and interest rates.
✦ Alberta has significant assets invested globally in a variety of asset classes.
The investment income forecast is based on long-run expected rates of
return. Annual market performance and, in turn investment income, could
vary considerably from the average.
NET CORPORATE OPERATING SURPLUS
✦ Corporate profits in Alberta are expected to take a significant hit this year
and take several years to recover, due to the low oil price environment. Partly
offsetting this are the expected easing of labour and other costs, the positive
impact of the low Canadian dollar on exports, and continued strength in
consumer spending, and manufacturing and agriculture sectors. Energy
investment will also decline due to the drop in oil prices, and as energy
projects transition from the construction to production phase. However,
it can be difficult to predict how forecast net corporate operating surplus
translates to corporate income tax revenue, as taxable income can differ
significantly from corporate profits, due to tax changes or discretionary
deductions such as depreciation or prior-year losses.
40
CONSOLIDATED REVENUE • FISCAL PLAN 2015 –20


© Copyright 2026