
Supervised Text Classification of Medical Triage Reports
Master Thesis
Supervised Text Classification of
Medical Triage Reports
Supervisors:
Dr. ir. Dolf Trieschnigg
Author:
Dr. Pim van den Broek
Jurgen Kleverwal, BSc
Bram Kievit, MSc
Michiel Hakvoort, BSc
A thesis submitted in fulfillment of the requirements
for the degree of Master of Science
in the
Formal Methods and Tools Group
Faculty of Electrical Engineering, Mathematics and Computer Science
University of Twente
The Netherlands
April 2015
Abstract
Topicus Zorg has developed a system to help triage officers at the emergency department
perform a triage. This system uses keyword scanning for text classification; an entered
description of medical symptoms is categorized in one or more presenting complaints.
This way of classification has its limitations. Only keywords are recognized, which makes
that some information is ignored. Also sometimes more than two presenting complaints
are used as category for one text, although almost always one presenting complaint is
sufficient.
In this thesis the characteristics of medical texts are discussed. 10 characteristics of
medical texts were found, only three of these characteristics were highly represented
in the used data collection. These three characteristics are telegraphic style (no complete sentences), shorthand text (abbreviations, acronyms and local dialectal shorthand
phrases) and negation (negated words or phrases, like ‘no pain on chest’). Also some
commonly used supervised text classification methods are reviewed; k Nearest Neighbors, Support Vector Machines and Naive Bayes. One text classification method is
chosen (k Nearest Neighbors, kNN) and five parameters are defined for modification of
this text classification method. These parameters focus on query construction, number
of nearest neighbors, scoring and ranking. Some implementations of these parameters
are chosen to be tested. The current triage system of Topicus Zorg is then compared
to the implementation of kNN and the parameters using an F-measure. A similar score
is obtained for both systems, the triage system and the implementation of kNN using
parameters.
Dankwoord
Allereerst wil ik Dolf Trieschnigg bedanken voor de begeleiding gedurende dit afstudeerproject en voor het mij wegwijs maken in het veld van de tekstclassificatie. Ook wil ik
Pim van den Broek bedanken voor het zijn van mijn tweede begeleider en Christoph
Bockisch voor het begeleiden van de opstartfase van dit afstudeerproject. Van Topicus
Zorg wil ik Bram Kievit en Michiel Hakvoort bedanken voor de begeleiding en ondersteuning vanuit het bedrijf. Daarnaast wil ik Rob Lichtveld van de Regionale Ambulance
Voorziening Utrecht (RAVU) bedanken voor het beschikbaar maken van de historische
triage data. Als laatste wil ik mijn ouders, Tinus en Irma, en zus, Carlijn, bedanken
voor het tonen van interesse in mijn afstudeerproject ook al was mijn uitleg niet altijd
even duidelijk.
ii
Contents
Abstract
i
Dankwoord
ii
Contents
iii
Abbreviations
v
1 Introduction
1.1 Triage . . . . . . . . . . . . .
1.2 Automatic text classification
1.3 Problem statement . . . . . .
1.4 Research Questions . . . . . .
1.5 Research Method . . . . . . .
1.5.1 Method . . . . . . . .
1.5.2 Overview . . . . . . .
.
.
.
.
.
.
.
.
.
.
.
.
.
.
.
.
.
.
.
.
.
.
.
.
.
.
.
.
.
.
.
.
.
.
.
.
.
.
.
.
.
.
.
.
.
.
.
.
.
.
.
.
.
.
.
.
.
.
.
.
.
.
.
.
.
.
.
.
.
.
.
.
.
.
.
.
.
.
.
.
.
.
.
.
.
.
.
.
.
.
.
1
2
3
4
5
5
6
6
2 Background
2.1 Information retrieval . . . . . . . . . . . . . . . . . .
2.2 Natural Language Processing . . . . . . . . . . . . .
2.2.1 Morphological and lexical analysis . . . . . .
2.2.2 Syntactic analysis . . . . . . . . . . . . . . .
2.2.3 Semantic analysis . . . . . . . . . . . . . . . .
2.2.4 Discourse integration and pragmatic analysis
2.3 Text classification . . . . . . . . . . . . . . . . . . . .
2.3.1 General . . . . . . . . . . . . . . . . . . . . .
2.3.2 Evaluation of text classification . . . . . . . .
2.3.3 k Nearest Neighbors . . . . . . . . . . . . . .
2.3.4 Support Vector Machines . . . . . . . . . . .
2.3.5 Naive Bayes . . . . . . . . . . . . . . . . . . .
2.3.6 Comparison . . . . . . . . . . . . . . . . . . .
2.4 Related work . . . . . . . . . . . . . . . . . . . . . .
2.4.1 Characteristics of medical texts . . . . . . . .
2.4.2 Medical text classification . . . . . . . . . . .
.
.
.
.
.
.
.
.
.
.
.
.
.
.
.
.
.
.
.
.
.
.
.
.
.
.
.
.
.
.
.
.
.
.
.
.
.
.
.
.
.
.
.
.
.
.
.
.
.
.
.
.
.
.
.
.
.
.
.
.
.
.
.
.
.
.
.
.
.
.
.
.
.
.
.
.
.
.
.
.
.
.
.
.
.
.
.
.
.
.
.
.
.
.
.
.
.
.
.
.
.
.
.
.
.
.
.
.
.
.
.
.
.
.
.
.
.
.
.
.
.
.
.
.
.
.
.
.
.
.
.
.
.
.
.
.
.
.
.
.
.
.
.
.
.
.
.
.
.
.
.
.
.
.
.
.
.
.
.
.
.
.
.
.
.
.
.
.
.
.
.
.
.
.
.
.
.
.
.
.
.
.
.
.
.
.
.
.
.
.
.
.
7
7
9
10
11
11
11
12
12
13
14
15
16
16
17
17
18
.
.
.
.
.
.
.
.
.
.
.
.
.
.
.
.
.
.
.
.
.
.
.
.
.
.
.
.
.
.
.
.
.
.
.
.
.
.
.
.
.
.
.
.
.
.
.
.
.
.
.
.
.
.
.
.
.
.
.
.
.
.
.
.
.
.
.
.
.
.
.
.
.
.
.
.
.
.
.
.
.
.
.
.
3 Current Practice
20
3.1 Current System . . . . . . . . . . . . . . . . . . . . . . . . . . . . . . . . . 20
iii
Contents
3.2
3.3
iv
Dataset analysis . . . . . . . . . . . . . . . . . . . . . . . . . . . . . . . . 22
System analysis . . . . . . . . . . . . . . . . . . . . . . . . . . . . . . . . . 23
4 Software System
4.1 Concept . . . . . . . . . . . . . . .
4.2 Model . . . . . . . . . . . . . . . .
4.3 Parameter selection . . . . . . . . .
4.3.1 Query construction method
4.3.2 Nearest neighbors . . . . .
4.3.3 Scoring method . . . . . . .
4.3.4 Top . . . . . . . . . . . . .
4.3.5 Complaint coverage . . . .
4.4 Implementation . . . . . . . . . . .
.
.
.
.
.
.
.
.
.
.
.
.
.
.
.
.
.
.
.
.
.
.
.
.
.
.
.
.
.
.
.
.
.
.
.
.
.
.
.
.
.
.
.
.
.
.
.
.
.
.
.
.
.
.
.
.
.
.
.
.
.
.
.
.
.
.
.
.
.
.
.
.
.
.
.
.
.
.
.
.
.
.
.
.
.
.
.
.
.
.
.
.
.
.
.
.
.
.
.
.
.
.
.
.
.
.
.
.
.
.
.
.
.
.
.
.
.
.
.
.
.
.
.
.
.
.
.
.
.
.
.
.
.
.
.
.
.
.
.
.
.
.
.
.
.
.
.
.
.
.
.
.
.
.
.
.
.
.
.
.
.
.
.
.
.
.
.
.
.
.
.
.
.
.
.
.
.
.
.
.
.
.
.
.
.
.
.
.
.
.
.
.
.
.
.
.
.
.
25
25
26
27
27
28
28
29
29
30
5 Experimental Design
33
5.1 Evaluation metrics . . . . . . . . . . . . . . . . . . . . . . . . . . . . . . . 33
5.2 Data collection . . . . . . . . . . . . . . . . . . . . . . . . . . . . . . . . . 34
5.3 Method . . . . . . . . . . . . . . . . . . . . . . . . . . . . . . . . . . . . . 34
6 Results and Analysis
6.1 Results . . . . . . . . . . . . . . . . . . . . . . .
6.1.1 Query construction & Nearest neighbors
6.1.2 Top & Scoring method . . . . . . . . . .
6.1.3 Complaint Coverage . . . . . . . . . . .
6.2 Analysis . . . . . . . . . . . . . . . . . . . . . .
6.2.1 Best combination . . . . . . . . . . . . .
6.2.2 Comparison . . . . . . . . . . . . . . . .
.
.
.
.
.
.
.
.
.
.
.
.
.
.
.
.
.
.
.
.
.
.
.
.
.
.
.
.
.
.
.
.
.
.
.
.
.
.
.
.
.
.
.
.
.
.
.
.
.
.
.
.
.
.
.
.
.
.
.
.
.
.
.
.
.
.
.
.
.
.
.
.
.
.
.
.
.
.
.
.
.
.
.
.
.
.
.
.
.
.
.
.
.
.
.
.
.
.
.
.
.
.
.
.
.
36
36
36
38
41
43
43
44
7 Conclusion
7.1 Research answers . . . . . . . . . . . . .
7.1.1 Characteristics of medical texts .
7.1.2 Limitations of keyword scanning
7.1.3 Classification methods . . . . . .
7.1.4 Variant of classification method .
7.1.5 Best classification method . . . .
7.2 Future work . . . . . . . . . . . . . . . .
.
.
.
.
.
.
.
.
.
.
.
.
.
.
.
.
.
.
.
.
.
.
.
.
.
.
.
.
.
.
.
.
.
.
.
.
.
.
.
.
.
.
.
.
.
.
.
.
.
.
.
.
.
.
.
.
.
.
.
.
.
.
.
.
.
.
.
.
.
.
.
.
.
.
.
.
.
.
.
.
.
.
.
.
.
.
.
.
.
.
.
.
.
.
.
.
.
.
.
.
.
.
.
.
.
49
50
50
51
51
52
53
53
Bibliography
.
.
.
.
.
.
.
.
.
.
.
.
.
.
.
.
.
.
.
.
.
.
.
.
.
.
.
.
55
Abbreviations
CDSS
Clinical Decision Support System
IR
Information Retrieval
kNN
k Nearest Neighbors
NB
Naive Bayes
NLP
Natural Language Processing
NTS
Nederlandse Triage Standaard (Dutch Triage Standard)
SVM
Support Vector Machines
TTM
Topicus Triage Module
v
Chapter 1
Introduction
Topicus Zorg builds software for the healthcare domain. One of their software products
is a triage system. A triage is the process of determining the urgency of the request for
help of a patient. The triage system helps specialized triage officers at the emergency
call center to perform triages. Short unstructured texts that describe the complaints of
reporting patients are written down in this system. Currently this system is based on
keyword scanning. Predefined keywords are linked to presenting complaints. Presenting
complaints are common complaint categories (e.g. headache or leg pain). The presenting
complaints are used as input for standardized questions, to help the triage officer perform
the triage. By scanning for exact words or phrases the text is linked to presenting
complaints. For example, when the unstructured text is ‘person did hurt his leg by
walking into a lamppost’, the presenting complaints ‘limb trauma’ (symptoms raised
after an accident) and ‘leg pain’ (symptoms that came spontaneously or became worse
over a longer period of time) are shown because the keyword ‘leg’ was recognized and the
presenting complaints were linked to this keyword. All other words in the unstructured
text are not keywords and are therefore ignored by the triage system.
Keyword scanning is a variant of automatic text classification. However, keyword scanning has its limitations. The largest limitation is that not all words of the unstructured
text are used, since only keywords are recognized. This makes that important information could be missed. For example, the words ‘walking’ and ‘lamppost’ in the previous
example could be used as indicators for the presenting complaint ‘head trauma’.
1
Chapter 1. Introduction
2
Another variant of automatic text classification could perform better. This variant
could use supervised machine learning, which is machine learning with labeled training
data. The labeled training data could be the previously entered unstructured texts and
the selected presenting complaints, for example. This training data must be correctly
labeled, since all future decisions are made based on this training data.
The goal of this thesis is improving the triage system by using supervised text classification. In this chapter the terms triage and automatic text classification will be explained
further. Also the problem statement, research questions and research method will be
discussed.
1.1
Triage
Triage is the process of determining the urgency of the request for help of a patient
calling the emergency call center. A triage can be performed physically or by phone.
In this thesis only triages performed by phone are discussed. A triage officer can be
supported by a Clinical Decision Support System (CDSS). An example of an CDSS is
the triage system of Topicus Zorg, called Topicus Triage Module (TTM). An overview
of the layout of TTM is shown in figure 1.1. TTM supports specialized triage officers in
emergency call centers when they perform a triage. One characteristic of this domain is
the speed that is involved, since the triage should be performed immediately. Also, there
is often no physical contact, which restricts the ways of getting information. In case of
a triage by phone, the only available information is verbally communicated between the
triage officer and the caller.
The TTM implements the Dutch triage standard called Nederlandse Triage Standaard 1
(NTS). The triage officer can enter unstructured text, describing the medical symptoms
of the patient in natural language, into the system. This is done in the text field marked
as 1 in figure 1.1. The entered text is ‘person did hurt his leg by walking into a lamp
post’. The system will recognize some words in the text (using keyword scanning) and
then suggest presenting complaints. These suggested presenting complaints are marked
as 2 in figure 1.1. The suggested presenting complaints are ‘limb trauma’ and ‘leg
pain’. After one or more presenting complaints are chosen by the triage officer a list of
1
http://de-nts.nl
Chapter 1. Introduction
3
Figure 1.1: The TTM with unstructured text and suggested presenting complaints
standardized questions (from the NTS) will be shown. This is shown later on in figure 3.1.
After answering these questions a follow-up action (e.g. sending an ambulance) will be
presented (not shown in a figure).
This thesis focuses on the translation from unstructured texts to presenting complaints.
The TTM and its current limitations will be explained further in chapter 3.
1.2
Automatic text classification
One practice of machine learning is text classification. Text classification, also called
text categorization, focuses on classifying text documents, photo’s or music pieces in
one or more categories (also called classes or labels in this thesis). The categories could
be subject, year of publication, etc.
Text classification assigns a text document (a document could contain one word, one
sentence or a complete paragraph), to one or more predefined classes. This can be done
manually or automatically. To classify a large number of text documents manually is
an expensive and time consuming task. Classifying documents automatically can be
done by using keyword scanning or labeled training data, for example. Automatic text
Chapter 1. Introduction
4
classification is consistent, the same text will be classified in the same way. For manual
text classification this might not be the case, since each person interprets a text different.
Automatic text classification can be divided into three categories; supervised, unsupervised and semi-supervised. Supervised text classification uses labeled training data to
categorize texts. The texts will therefore be categorized by categories, predefined in the
training data. Unsupervised text classification does not use labeled training data. An
example of an unsupervised text classification system is a rule-based text classification
system, such as keyword scanning. Semi-supervised text classification is a combination
of supervised and unsupervised text classification. Both labeled and unlabeled training
data is used for the classification task.
This thesis focuses on supervised text classification as replacement of the currently used
unsupervised text classification in TTM. In chapter 2 commonly used supervised text
classification techniques will be discussed.
1.3
Problem statement
There are three problems with the unsupervised text classification method of TTM.
The first problem is that not all words of an unstructured text are used for determining
the wanted presenting complaints, because only keywords are recognized. Therefore,
sometimes obvious presenting complaints are not suggested. Also too many, and thereby
unfocused, suggestions are given sometimes. The second problem is that the system does
not learn from its errors. Wrongly suggested presenting complaints will be corrected by
the triage officer for each triage. However, the next time the system will suggest the same
presenting complaints, since the previous correction is not used by the triage system.
The third problem is that the suggestions are currently not ranked, making it hard for
the user of the TTM to choose the most important presenting complaint(s) if multiple
presenting complaints are suggested. An in depth analysis of the problems can be found
in chapter 3.
Supervised text classification could solve these problems. The first problem is solved
since the complete text is used for both training data and new texts that need classification. The second problem can be solved by expanding the training data with new
Chapter 1. Introduction
5
entered triage documents. By using supervised text classification ranking could be easily implemented, since most supervised text classification techniques could calculate the
relevance of a presenting complaint to the unlabeled text.
Besides unstructured texts in the TTM, there are more characteristics for medical texts.
These characteristics are discussed first before talking about limitations of a keyword
scanning system.
1.4
Research Questions
The thesis has one main research question; What is the best classification method
for medical text classification? The goal of this question is finding a model that
describes the best way of classifying medical texts, especially triages.
In order to answer the main research question, four questions are defined.
• What are the characteristics of medical texts that complicate medical text classification?
• What are the limitations of a keyword scanning system for medical text classification?
• What are other classification methods for medical text classification?
• Given the best classification method, what variation of this classification method
performs best?
The answers for these four questions combined gives the answer to the main research
question. The characteristics of medical texts and the limitations of a keyword scanning
system have influence on the way of viewing classification methods, other than keyword
scanning. When the best classification method is found, this method can be modified in
order to improve the classification result.
1.5
Research Method
This thesis focuses on improving automatic text classification for medical triages. The
thesis is divided in two parts. In the first part, the limitations of the current triage system
Chapter 1. Introduction
6
are described. In the second part, an approach based on supervised text classification is
implemented and evaluated.
1.5.1
Method
The four questions are answered in the following way. The first question, ‘What are
the characteristics of medical texts that complicate medical text classification?’, is answered by performing a literature study and comparing the found characteristics to a
sample of the data collection. The data collection contains historical unstructured triage
texts and presenting complaints chosen by the triage officers. The data collection is described more extensive in chapter 3. The second question, ‘What are the limitations of
a keyword scanning system for medical text classification?’, is answered by analyzing
the errors found in TTM using the data collection. The third question, ‘What are other
classification methods for medical text classification?’, is answered by giving an overview
of commonly used classification methods based on literature. One classification method
will be chosen to be used for the following question. The fourth question, ‘Given the
best classification method, what variation of this classification method performs best?’,
is answered by first proposing a software system that uses this classification method.
Parameters are created to influence the classification method and aiming to improve it.
The parameter implementations are described. For each parameter at least one implementation is tested in an experiment, to find the best combination of parameter values.
The found classification method and best performing parameter combination are then
used to compare to TTM.
1.5.2
Overview
In the next chapter an introduction to information retrieval, natural language processing
and commonly used supervised text classification methods will be discussed. Followed
by a chapter about the limitations of the TTM using keyword scanning. In chapter four
a software system, based on the best classification method in this case, will be discussed.
This software system will be evaluated, which is described in chapters five and six. The
last chapter of this thesis contains the conclusion and future work.
Chapter 2
Background
This chapter gives an overview of information retrieval, natural language processing,
commonly used methods of supervised text classification and related work in the medical
text classification domain.
2.1
Information retrieval
This section is a quick introduction to information retrieval (IR). The focus is on information relevant for this thesis. A more elaborate introduction to IR can be found in
Manning (2008)[1].
‘Information retrieval is finding material (usually documents) of unstructured nature
(usually text) that satisfies an information need from within large collections (usually
stored on computers)’ [1]. An example of an IR system is a library search system. One
can enter a search query containing words that should (not) be present in the books. IR
can be done by just going through the documents (in this example books) and checking
word for word if the document does (not) contain the requested words. This is called
grepping. Grepping can be done for a small collection, but for a large collection like
in a library this will take too much time. A solution to this problem is indexing, the
documents are indexed in advance and a term-document matrix is created. This matrix
contains all unique words and all document names. The cell corresponding to a word
and document contains value 1 if the word is present in the document and 0 otherwise.
7
Chapter 2. Background
8
For example, we have the following three documents, each containing a small text.
• Document A: ‘Pain on chest’
• Document B: ‘Pressure on chest’
• Document C: ‘Pain around meniscus’
Each word is called a term. The term-document matrix for these documents is shown
in the following table.
Document
A
B
C
pain
1
0
1
on
1
1
0
chest
1
1
0
pressure
0
1
0
around
0
0
1
meniscus
0
0
1
Table 2.1: Term-Document Matrix
The documents could also be represented in a vector space model, which is a vector
representation of a certain document set. Each vector corresponds to a single document,
and each item in the vector corresponds to a term in the document. Each dimension in a
vector corresponds to an index term. The value of this index term is 1 if the term occurs
in the document and 0 otherwise. The example documents above could be represented
as follows.
• DA = {1,1,1,0,0,0}
• DB = {0,1,1,1,0,0}
• DC = {1,0,0,0,1,1}
Instead of using this binary encoding, terms can be weighted according to their importance, for example with term frequency - inverse document frequency (tf-idf). In a
document collection, each term has a different importance in a certain document. The
tf-idf calculates the weight for every term in a document, taking all documents into
account. The more a word occurs in a document (term frequency), and the less it occurs
in the other documents of the collection (inverse document frequency), the higher the
weight is. The score is highest when a term occurs often in a small subset of the document set. The score is lower when a term occurs more times in other documents. tf-idf
Chapter 2. Background
9
is widely used to compare the similarity between documents. Also, tf-idf is used for
queries by calculating the similarity of a query q with a document d, providing a ranked
list of the most relevant documents. This practice is used in the k Nearest Neighbors
classification technique, which is described in section 3 of this chapter.
Word combinations, like word n-grams, are also used in IR. Word n-grams are n adjacent
words from a given text. N-Grams of size 1 are called ‘unigrams’, of size 2 ‘bigrams’,
of size 3 ‘trigrams’, and with a size of more than 3 words, they are simply referred to
as ‘n-grams’. For example, the bigrams of the sentence ‘Pain on chest’ would be ‘pain
on’ and ‘on chest’. N-Grams could also be used for letters or syllables, which works the
same as described for word n-grams.
2.2
Natural Language Processing
In the software solution, described in chapter 4, Natural Language Processing (NLP)
techniques are used. Therefore, an overview of NLP techniques is given in this section.
Within searching and categorizing documents, no understanding of the lexical structure
of the text is needed. Processing lexical structure, among other language specific characteristics, is part of NLP. NLP is a broad research area, focusing on understanding
natural language by computer systems. This research area is an addition to the IR area,
since understanding the natural language is a good starting point for more complex IR
operations. IR is searching for information, NLP is understanding natural language and
NLP techniques could be used to improve IR. This can be done by recognizing persons
and companies in texts, for example.
Chapter 2. Background
10
NLP can be divided into the following five levels[2].
1. Morphological and lexical analysis
2. Syntactic analysis
3. Semantic analysis
4. Discourse integration
5. Pragmatic analysis
The first four levels each have their own techniques, which could be combined by creating
a pipeline. Each level is used as preprocess for the next level. For example, morphological
an lexical analysis is used as preprocess for syntactic analysis.
2.2.1
Morphological and lexical analysis
The first level (morphological and lexical analysis) contains the following techniques.
• Tokenization, basically splitting a sentence into symbols, words or phrases. In its
most simple form, each space and punctuation mark is the starting point of a new
token.
• Sentence segmentation, which is detecting the boundaries of a sentence. This is
typically done by looking for periods, question marks, exclamation points and
capital letters. However, a period is also used in abbreviations, so sentence segmentation is not as straight forward as it sounds.
• Word segmentation, also called decompounding. This is the process of splitting a
word that contains multiple nouns into separate words.
• Stemming is cutting of the last part of a word using predefined rules. For example,
‘drive’ and ‘driving’ would become ‘driv’. By doing this word variants are reduced
to the same words, which are easier to recognize as the same.
• Lemmatization is a more sophisticated method of stemming using dictionaries,
which returns the base of the word instead of the stem. For example ‘driving’
Chapter 2. Background
11
would become ‘drive’. Notice that ‘calling’ becomes ‘call’, which is different from
the ‘driving’ example. Lemmatization is more complex than stemming, because a
lot of language knowledge is required to perform this method correctly.
2.2.2
Syntactic analysis
On the syntactic analysis level there are two techniques.
• Part-of-Speech tagging (PoS) tags parts of text, such as nouns, verbs, adjectives,
etc. When a word has multiple syntactic roles, it is hard to tag the word without
looking at the words around it.
• Chunking labels parts of text as phrases, such as noun phrases or verb phrases.
2.2.3
Semantic analysis
The third level (semantic analysis) contains the following three techniques.
• Named entity recognition (NER) labels parts of text that contain predefined entities, like persons, organizations or locations.
• Semantic role labeling (SRL) labels parts of text that have a specific role in the
text. For example ‘The text was written’, where ’The text’ is the item (argument
that undergoes a change of state) and ’written’ is the action (argument expressing
some dimension).
• Word-sense disambiguation (WSD) identifies which meaning of a word is used in
a sentence, when the word has multiple meanings by looking at the surrounding
words.
2.2.4
Discourse integration and pragmatic analysis
On the discourse integration level there is one technique, namely Coreference resolution,
which is finding different words that refer to the same single entity, e.g. a person or
location. The fifth and last level (pragmatic analysis) does not contain a clear technique,
Chapter 2. Background
12
but focuses on reinterpreting a text. For example, ‘close the door?’ should be interpreted
as an request instead of an order.
The described NLP techniques could be used for preprocessing the unstructured text
before classification. For example, tokenization and stemming are used in the implementation of the proposed software system.
2.3
Text classification
Text classification assigns a text document to one or more predefined classes. Previously
described IR techniques can be used for text classification.
In this section text classification techniques will be discussed and compared. At the end
of this chapter related work in medical text classification will be discussed. The focus
hereby will be on supervised text classification, since labeled training data is used.
2.3.1
General
A classifier is an algorithm that implements classification. The simplest classifier is a
two-class classifier or binary classifier. This type of classifier determines if a document
belongs to one of two classes. This could be two different classes (e.g. trauma raised
after an accident or pain that became worse over a longer period of time) or one class
(e.g. diabetes or not). When more than two different classes are used, one two-class
classifier is not sufficient. In this case, there are two methods to create a multi-class
classifier, which determines the class(es) a document belongs to.
The first method is called one-of, which can be used to determine whether a document
belongs to a specific class. This can only be exactly one class, so the classes should be
mutually exclusive. The one-of method also needs a classifier for each class, where the
training set (a set containing labeled document that is used for training in classification)
consists of documents labeled with that class and documents not labeled with that class.
The unclassified (or unlabeled) document is also entered into each classifier separately,
but instead of assigning the document to all classes, the document can only be assigned
to one class. This is done by giving confidence values or probability scores to the classes.
The class with the highest score is chosen.
Chapter 2. Background
13
The second method is called any-of. This method can be used to determine to which
classes a document belongs. This can be zero, one or more classes. This implies that
the classes may overlap. The any-of method needs a classifier for each class, where the
training set consists of documents in a particular class and documents not in that class.
An unclassified (or unlabeled) document is processed by each classifier separately. Each
classifier determines of the document belongs to the class that is tested by the classifier.
The different classifiers do not influence each other. Using any-of classifiers is also called
multi-label classification. For example, a patient could be suffering from diabetes and
leg pain at the same time. In this case we want to assign both labels to the triage text.
This type of classification can also be used for ranking.
2.3.2
Evaluation of text classification
A supervised text classification algorithm uses a training dataset. This dataset contains
labeled documents, which are used to train the classifiers. After training, an unclassified
document can be classified by the classifiers. The classifiers then return the found labels
for the document.
For evaluation of the trained classifiers,a test dataset is used. This dataset contains
labeled documents that are not used for training the classifiers. Each document (without
its labels) is classified by the classifiers. The classifiers then return the found labels for
the document. The found labels are then compared with the labels that were originally
assigned to the document in the test dataset.
The effectiveness of the classifiers can be measured using the measuring method recall.
The efficiency of the classifiers can be measured using the measureing method precision.
This can be done for each document or for each label (in this case, presenting complaint).
Recall per document is the fraction of relevant labels that are retrieved. Precision per
document is the fraction of retrieved labels that are relevant.
The recall per label is calculated by dividing the number of times the label is suggested
and expected, by the number of times the label is expected. The precision per label is
calculated by dividing the number of times the label is suggested and expected, by the
number of times the label is suggested.
Chapter 2. Background
14
The F-measure is a commonly used measure that combines recall and precision into a
single value by taking their harmonic mean, which is defined by the following formula.
Fβ =
(1 + β 2 ) · precision · recall
(β 2 · precision) + recall
(2.1)
Where 0 ≤ Fβ ≤ 1
and Fβ = 1 ⇔ precision = recall = 1.
The F-measure is commonly used with a β value of 1. By choosing value 0.5 or 0.25 the
precision becomes more important than the recall. Choosing value 2 or 4 will make the
recall more important than the precision.
When classification results are ranked, a rank-based metric should be used to assure the
order of the presenting complaints is considered. One example of a rank-based metric is
mean average precision (MAP). This metric calculates the mean of the average precision
(AP) of each unclassified document. The average precision is calculated by averaging
the rank precision of the relevant documents. The rank position of relevant documents
that are not retrieved is assumed to be 0. The AP is defined by the following formula.
Pn
AP =
i=1 precision(i)
· rel(i)
R
(2.2)
Where n is the number of retrieved documents and R is the total number of relevant
documents. precision(i) is the precision of the retrieved documents at rank i. rel(i)
is a binary function which indicates if the document retrieved at rank i is relevant (1)
or not relevant (0). This assures that missing a relevant suggestion in the ranked list
lowers the AP value and thereby also the MAP value[3].
2.3.3
k Nearest Neighbors
The k Nearest Neighbors (kNN) algorithm can be used for text classification, but also for
recommender systems1 . This algorithm is a lazy learning algorithm, which means that
the query is compared to the training dataset, without training. The algorithm defers
1
For example, systems that give a suggestion which movie to see next, based on your previously seen
movies.
Chapter 2. Background
15
its calculations until classification is needed. kNN assigns each unclassified document to
one or more classes of its k closest neighbors. This is done by calculating the similarity
or dissimilarity between the unclassified document and the documents in the training
dataset. For example, by counting the number of words that are the same between the
unclassified document and a document in the training dataset. An unclassified document
can be expected to have the same label as the training documents located in the local
region of the unclassified document (with high similarity). When the found neighbors
are part of different classes, all these classes are chosen. The choice of a k value for kNN
is typically in the range 20 to 40[4].
An advantage of kNN is that it is simple to implement, since kNN only needs two
parameters, k and similarity or dissimilarity. Furthermore, kNN is a variant of memorybased learning[1]. This means that the training data is memorized and used during
classification. A disadvantage is that more time is needed to compute the similarity or
dissimilarity for each document when using a high k value. kNN therefore also performs
slow on a large training set.
2.3.4
Support Vector Machines
Support Vector Machine (SVM) classifiers attempt to partition the documents by projecting them and the use of boundaries between the different classes. The key in such
classifiers is to determine the optimal boundaries between the different classes and use
them for the purposes of classification. The main principle of SVMs is to determine
separators in the search space which can best separate the different classes[4]. The algorithm looks for an area that is as far as possible from any data point. The distance
between a decision surface and the closest data point is called the margin of the classifier.
This margin is used to determine support vectors; point that have a maximal margin
between them, without any point in between.
The SVM algorithm is implemented using two-class classifiers or binary classifiers.
Therefore, the decision boundaries2 should be linear. However, a training document
might end up on the wrong side of the decision boundary and therefore in the class that
is not the best fit. This can be fixed by a kernel trick, which projects the points in a
2
The boundaries between vectors.
Chapter 2. Background
16
higher dimensional space[1]. Because of the use of two-class classifiers or binary classifiers, this algorithm can be implemented for multi-label classification when the any-of
method is used.
An advantage of this algorithm is that SVMs are fast at training and classifying. A
disadvantage is that this technique acts like a black box, it is hard to predict the performance of an implementation and intermediate results cannot be used or modified. Also
a large training set is needed for each class (minimum of 200 training documents per
class) to train correct classifiers[1].
2.3.5
Naive Bayes
The Naive Bayes (NB) algorithm classifies texts based on the probability of the documents belonging to the different classes. This is done by comparing the word presence in
a new document with the training documents[4]. This technique assumes that the classes
are mutually exclusive. NB can use two different models; multinomial and Bernoulli.
The multinomial model uses each word in the document that has to be categorized. This
model than compares these words with the words that are part of the training data of
each class. The Bernoulli model generates binary attributes for each word in a specific
class, containing value 0 when this word is not present in the document and value 1
when this word is present in the document[1]. This algorithm can be implemented for
multi-label classification when the any-of method is used. This also works around the
assumption of mutually exclusive classes.
An advantage of the NB algorithm is that it easy to implement and performs well, since
only a small training set is needed for each class. A disadvantage is that a classifier is
created for each class and each classifier needs a set of documents containing the class
and another set of documents not containing the class.
2.3.6
Comparison
All three classification methods have their advantages and limitations. This section
discusses the advantages and limitations of the classification methods in five areas in
the context of the TTM, which are also shown in table 2.2. The first area is the ability
to implement multi-label classification. kNN can be extended to support this. Both
Chapter 2. Background
Classification
method
kNN
SVM
NB
Multilabel
++
+
+
17
Non-mutually
exclusive
classes
++
++
+
Small
dataset
++
–
++
Modifiability
intermediate
results
++
–
++
Computational
time
+
++
++
Table 2.2: Comparison of the classification methods
SVM and NB need to be transformed in order to support multi-label classification. The
classes (presenting complaints) of the TTM are not mutually exclusive, which is the
second area. This is not a limitation for kNN. For SVM and NB, this is also not a
limitation as long as the any-of method is used. The third area is the size of the dataset.
The used development dataset contains 7,863 cases, as described in chapter 3. This is a
relatively small dataset. kNN and NB can handle a small dataset. SVM needs a bigger
dataset. The fourth area is modifiability of intermediate results. kNN and NB can be
modified to handle intermediate results differently. SVM does not have this property.
The fifth and last area is the computational time needed for classification. SVM and NB
use trained classifiers, which makes that they need training time but are fast at test time
(when unknown texts are classified). kNN does not use training time, so the test time is
longer. Of course, the training and test durations are linked to the size of the dataset.
Considering these five areas, kNN is chosen to be used for multi-label classification. This
technique works well with the small dataset and intermediate results can be modified,
to influence the classification outcome.
2.4
Related work
In this section the related work to characteristics of medical texts and medical text
classification is described.
2.4.1
Characteristics of medical texts
Ten characteristics in are found in literature. The first characteristic is that medical texts
contain short sentences, in telegraphic style. Shorthand text is the second characteristic.
Examples of shorthand text are abbreviations, acronyms and local dialectal shorthand
Chapter 2. Background
18
phrases. The third characteristic is misspelling. This challenge occurs often in text
without spell check. Clinical texts can also contain special characters, for example when
describing a prescription of medication, like ‘40 mg/d’. This is the fourth described
characteristic. The fifth characteristic is that users of a system sometimes try to create
some self-made structure in the free text, for example by adding extra characters, like
a slash, to create a tabular format and make the text more readable. The sixth and
seventh characteristic are synonymy and ambiguity[3]. These characteristics are not
specific for medical texts, but occur in medical texts as well as in other texts (for
example, financial texts). Different words with the same meaning are called synonyms.
For example, ‘headache’ could also be described as ‘pounding’ or ‘throbbing head’. One
word with different meanings is called ambiguous. The last three characteristics focus
on contextual information. These characteristics are also not specific for medical texts.
The eighth characteristic is negation. For example, ‘no pain on chest’. Temporality
says something about the time in which an event occurs. For example, ‘leg trauma
three years ago’. This is the ninth characteristic. The tenth and last characteristic is
event subject identification[5], where another person is meant. For example, ‘mother has
hypolactasia3 ’.
Not recognizing contextual information, can give unwanted results. For example, when
the phrase ‘no pain on chest’ is not recognized as negated, a classification system could
interpret pain on chest or heart attack, while this is incorrect. The occurrence of these
characteristics in the dataset are checked in the next chapter.
2.4.2
Medical text classification
In Gerbier (2011)[6], a system is described that automatically extracts and encodes
information in texts, using NLP. This system is part of an information retrieval process.
The information encoded by this system is used as input for another system, which is not
part of the research. 100 computer generated reports, containing medical information in
text, were used as test data. In the process the texts were split into sentences. This was
done by tracking periods followed by a space or when 2 groups of words were separated
by a line break. The identified sentences were then further split into phrases. This was
done after looking for punctuation marks (question marks, exclamation marks, commas,
3
Medical term for lactose intolerance.
Chapter 2. Background
19
parentheses and semicolons), coordinating conjunctions and prepositions (and, but, or,
therefore, however, neither, nor, because, and with). After the phrases were created,
negations were identified. This was done by search for different negation methods (no,
not, nor, none, lack of, lack, lacking, of absence, absence of, the absence, devoid of,
does not, did not, didn’t, doesn’t, is not, isnot, isn’t, isnt, has not received, has not
received any, has not, destitute of, devoid of, never). Phrases containing negation were
removed. Next, a list of non-standard terms (abbreviations, acronyms, spelling errors
and synonyms) was used for recognizing these terms and replacing them with a standard
term (which would be recognized by the next system). Also numeric values were spotted
and removed (since the next system cannot handle numeric values). Finally, the phrases
are concatenated again into one text, which then is used as input for the next system.
Classification method kNN is used by Huang (2011)[7] to retrieve similar documents and
extract possible classes for a target document. The extracted classes are then ranked
using a learning to rank system. 200 documents were used as training set and two sets
of 200 and 1000 documents were used as test sets. A class was extracted by counting the
number of neighbor documents in which the class occurred and summing the document
similarity scores.
Villena Roman (2011)[8] describes a hybrid approach of supervised text classification
and unsupervised text classification. A kNN implementation is fine-tuned by a rulebased system. A large document collection was used for training (108,838 documents for
1,349 categories). For testing, a smaller document collection was used (756 documents,
with an average of 5.16 categories per document). The kNN implementation, uses tfidf weighting and a k value of 200. The rule-based system is simplified. For each
category (class) there are three collections of terms; positive terms, negative terms and
relevant terms. If an unclassified document gets a class suggestion from the classification
method, the rule-based method accepted, rejects or boosts (for example, by counting this
class multiple times) this class based on the three term collections. If the unclassified
document contains at least one word from the positive terms collection of the class,
this class is accepted. Otherwise the class is rejected. If any word in the unclassified
document occurs in the negative terms collection, the class is rejected (also if the class
was first accepted using the positive terms collection). The class is boosted if the class
is already accepted and at least one word in the unclassified document occurs in the
relevant terms collection.
Chapter 3
Current Practice
In this chapter the TTM is analyzed in more detail. Also, the dataset used in this thesis
is explained.
3.1
Current System
Triage is the process of determining the urgency of the request for help of a patient calling
the emergency call center. The TTM helps specialized triage officers at an emergency call
center to perform triages. Short unstructured texts that describe the medical symptoms
of reporting patients are written down in the TTM. The TTM implements the Dutch
triage standard called NTS. The triage officer can enter unstructured text, describing
the medical symptoms of the patient in natural language, into the system. The system
will recognize some words in the text and will then suggest presenting complaints. This
translation from unstructured texts to presenting complaints is not part of the NTS,
but is an addition made by Topicus Zorg. The presenting complaints are predefined by
NTS. After one or more presenting complaints are selected by the triage officer, a list
of standardized questions (from the NTS) will be shown, as seen in figure 3.1. After
answering these questions a follow-up action (e.g. sending an ambulance) and urgency
of the request for help will be presented (not shown in a figure). A triage officer could
also chose a presenting complaint that was not suggested by the system.
The TTM is a Software as a Service (SaaS) application, which means that the module
is accessed via a web browser. The input field for the unstructured text is a basic text
20
Chapter 3. Current Practice
21
Figure 3.1: The TTM with questions
field. There is no auto-complete. All recent browsers have a spell check option, so the
entered text could be spell checked, however this is not done by the TTM.
There are 48 presenting complaints, predefined by NTS. The presenting complaints are
only shown after a linked keyword is spotted in the unstructured text. The selected
presenting complaints (could be more than one) are saved as the category to which the
entered unstructured text belongs. However, when a presenting complaint that was not
suggested is chosen, this new knowledge is not used by the TTM for future triages.
The TTM is currently using keyword scanning. Each presenting complaint is linked to
multiple keywords and each keyword is linked to one or more presenting complaints. As
mentioned before, only keywords in the keyword list will be recognized.
Chapter 3. Current Practice
3.2
22
Dataset analysis
The Regionale Ambulance Voorziening Utrecht (RAVU), an organization that coordinates all emergency care and ambulance transport in the province Utrecht in the Netherlands, made a dataset available for this research. The data collection contains 9,874 cases
of triage texts that were entered at an emergency call center. Each case represents a
call to the emergency call center between March 11, 2013 and February 23, 2014 and
contains the unstructured text and the chosen presenting complaints.
The presenting complaint ‘genital complaints’ is least frequently used as label. This
presenting complaint occurs 3 times in the data collection. All presenting complaints are
represented in the data collection. The data collection is separated into a development
set and a test set. This is done in a 80/20 distribution, 80% of the data collection is
used as development set and 20% is used as test set.
The medical text characteristics, found in section related work of chapter 2, are checked
for the development set. Of these 7,863 cases, the first case, and after that each 79th
case, is chosen. This makes 99 cases. All chosen cases are reviewed by hand for the previously described medical text characteristics. The characteristic misspelling is split into
two new characteristics, typo’s and forgotten whitespaces, since these have different approaches in correcting these characteristics. Typo’s could be corrected by implementing
a spell check. Forgotten whitespaces could be corrected by implementing decompounding. The number of occurrences of each characteristic is shown in table 3.1.
Medical text characteristics
Telegraphic style
Shorthand text
Negation
Synonymy
Typo’s
Temporality
Forgotten whitespaces
Special characters
Event subject identification
Ambiguity
Self-made structure
Occurrence
99
45
36
13
11
8
7
6
4
1
0
Table 3.1: Occurrence of medical text characteristics in the development set
Chapter 3. Current Practice
23
All reviewed cases were written in telegraphic style. This is expected, since one characteristic of the domain of performing triages is the speed that is involved. NLP techniques
that rely on structured texts, like sentence segmentation or PoS, are therefore not useful. That 45% of the cases uses shorthand text, confirms that this domain has domain
specific abbreviations, like ‘pob’1 , which are already implemented in the keyword list.
In 36 of the 99 cases, negation was found. This are phrases like ‘no breathing’ and
‘not responding’. These phrases do not exclude a situation, but are rather informative.
Therefore finding negation will only improve the the system in some cases. All other
characteristics occur too less to be used for improvement.
3.3
System analysis
The data collection is used to reconstruct the suggested presenting complaints, which
are needed to calculate the precision and recall of the current system. This is done by
entering each unstructured text in a TTM instance with the most recent keyword list2 .
The TTM often shows the correct presenting complaints, which results in a recall of
0.93. Too many presenting complaints are currently shown by the TTM, which results
in a precision of 0.29.
Ten randomly selected cases in the data collection with a low precision and high recall
were analyzed in order to find the limitations of TTM. The results of this analysis can be
found in table 3.2. The first thing that stands out is that a lot of presenting complaints
are suggested. Over these 10 medical texts only an average of 1.7 presenting complaints
are chosen versus an average of 7.6 suggested presenting complaints. In one case a
presenting complaint was chosen that was not suggested. Also some word combinations
(like ‘allergic reaction’) are recognized, but also the individual words (‘allergic’ and
‘reaction’) are then recognized and added to the total of suggestions, which results in
more presenting complaints.
In this chapter the current system and used data collection were analyzed. The current
system performs good on recall and has room for improvement on precision. The data
collection contains almost 10,000 cases, which is a good number of cases to be used for
developing and testing the software system presented in the next chapter.
1
2
‘Pijn op borst’, meaning ‘pain on chest’.
The most recent keyword list dates from July 22, 2014
Chapter 3. Current Practice
Medical text
[location] accident this morning car rollover check by
emergency personal gets a
headache now
Man has fallen communicative
stumbled fallen on face sits
straight connection lost
This afternoon fallen stumbled. heavy back pain tendency to collapse. Morphine
pill taken collapses now
pain on back [medicine 1].
and [medicine 2]. effluence to
leg and calf. [medicine 3] 2x
600 mg.
Pain thorax
Headache
Fallen during walking gap in
the head prob glass of glasses
in eye
Very short of breath pain in
stomach dull
[age] visited doctor last week
big bump on head headache
ascertained did a scan collapses now and vomits not
very communicative does respond
Allergic reaction. [medicine 1]
taken. vague about reason.
pale. swollen tongue. short
of breath
24
Analysis
Only word ’headache’ is recognized and 3 presenting complaints are suggested. This are all logical suggestions.
Only word ‘fallen’ is recognized. 7 trauma presenting complaints are suggested. ‘face’ could be used for reducing these
suggestions to 3, but it is not used.
Words ‘fallen’, ‘back pain’ and ‘collapse’ are recognized. 7
trauma presenting complaints plus 2 additional presenting
complaint. ‘back pain’ could exclude some presenting complaints, however this is not done.
word combination ‘pain on back’ recognized and suggests 1
presenting complaint, ‘pain’ also recognized, which results in
4 additional presenting complaints. ‘leg’ recognized, 2 additional presenting complaints. ‘calf’ recognized, but not additional presenting complaints (linked presenting complaint
was already suggested)
Should be 1 presenting complaint, but words are also recognized individually, which gives 7 suggested presenting complaints.
Only word ’headache’ is recognized and 3 presenting complaints are suggested. This are all logical suggestions.
Word ‘fallen’ gives 7 presenting complaints, ‘head’ gives 4
more, ‘eye’ gives 1 additional presenting complaints. Presenting complaint ‘Wound’ is not suggested, but is chosen.
Even if the text contains word ‘head wound’, this presenting
complaint would not be suggested.
‘short of brearth’, ‘pain’ and ‘stomach’ are recognized as
individual words, which gives 11 suggested presenting complaints.
Recognizing ‘bump’, ‘head’, ‘headache’, ‘collapses’ and
‘vomits’ results in 10 presenting complaints.
Recognizing ‘allergic’, ‘allergic reaction’, ‘tongue’, ‘short of
breath’ results in 7 presenting complaints
Table 3.2: Analysis of 10 medical texts that have a low precision and high recall in
TTM
Chapter 4
Software System
In this chapter a conceptual overview is given, followed by the implementation and
parameter variations.
4.1
Concept
Figure 4.1: General information retrieval process
Croft (1993)[9] describes a general information retrieval process as shown in figure 4.1.
In this model, the separation between labeled and unlabeled documents is clearly illustrated. The set of labeled documents is indexed (as described in chapter 2), whereas
25
Chapter 4. Software System
26
unlabeled documents are used for query formulation. By matching the query with the
indexed documents, similar documents will be retrieved. A feedback loop is included, to
further specify the query if the retrieved documents are not the expected result. This
model will be adapted for the classification of unlabeled triage documents.
4.2
Model
Figure 4.2: IR model for classification of unknown triage documents
In figure 4.2 the classification of unknown triage documents is described generally. kNN
is used as classification technique in this model. An index of the labeled documents
(the training collection) is created by the indexer. Presenting complaints linked to a
document will stay linked to this document in the index. This index is created once; all
Chapter 4. Software System
27
searches can be done on the same index. Of course, the index need to be recreated after
some time. For example, when a new training collection is available.
A query of the unlabeled document is created. This is can be done in two ways. One
way is combining all words in the document in one OR-query. The other way is using
n-grams (for example, unigrams) to create a query per n-gram. When using n-grams,
multiple queries will be created and the results of these queries will be combined later,
in rank. For each created query a search is done. A query is used to find the nearest
neighbors. This can be done using a fixed k (the number of nearest documents) or based
on a minimal similarity score. The linked presenting complaints of the found nearest
neighbors are then evaluated in suggest. The same presenting complaints are counted
and included in the result using one of three methods. The first method is using a fixed
top; only the most occurring presenting complaints are included. The second method is
a dynamic top, related to the value of k. For example, only presenting complaints that
at least occur 1/3 of the value of k are included (so if k is 30, 10 of the 30 documents
have to be labeled with the same presenting complaint). The last method is a minimum
similarity score that should be met after summing the similarity scores of all the same
presenting complaints. In rank all the same included presenting complaints of all query
results are counted or their scores are summed. Then, the list of presenting complaints
is ranked, so the most probable presenting complaints are on the top of the list. Last, a
top is used to cut off the top of the ranked list in order to reduce the number of assigned
presenting complaints to the unlabeled document.
4.3
Parameter selection
In this section the different parameters are discussed in more detail. First the query
construction method is discussed, followed by nearest neighbors and scoring method.
Then top and complaint coverage are discussed. These parameters are chosen because
they could improve the precision of the system.
4.3.1
Query construction method
Query construction method occurs in query in figure 4.2. Two methods could be used,
OR-query or Unigrams. The OR-query method constructs one big OR-query of all words
Chapter 4. Software System
28
in the text that needs classification. By using this method documents that contain more
words of the query will get a higher score than documents only containing one word
of the query. The other methods is Unigrams. For each unigram a query is created,
to avoid that a unigram is overruled by other unigrams (which could be the case if
a ’OR’-query is constructed). The results of all queries are combined into one result
of presenting complaint suggestions, as described in section 4.4. However, doing this
could result in overfitting[1]; Suppose an unigram, for example ‘sidewalk’, happens to
occur only in documents labeled with presenting complaint ‘headache’. In this case the
presenting complaint will be suggested for this unigram, which is clearly not suppose to
happen. This disadvantage can be reduced by using cross-validation. In cross-validation
the dataset is split into multiple sets. Each set is once used as test set and the other sets
are used as training set. Cross-validation will be explained in more detail in the next
chapter. Another method to reduce overfitting is to combine the results of all unigram
queries and create one ranked result for the original query of the document that needed
classification. This is done in rank in figure 4.2. By doing this, multiple unigrams queries
that suggest one specific presenting complaint will outweigh a single unigram query that
suggests a specific presenting complaint.
4.3.2
Nearest neighbors
Nearest neighbors occurs in search in figure 4.2. This parameter is used to specify the
number of nearest neighbors used for counting the presenting complaints per query. A
low value will result in a small number of documents that are similar to the query. A
high value will result in a larger number of documents, but also less similar document
are returned.
4.3.3
Scoring method
Scoring method occurs in rank in figure 4.2, although the scores are already calculated
per query in suggest. In rank the scores of multiple queries are combined to create scores
for the document query. When using the OR-query method, only one query is used, so
combining scores is not needed then. The first scoring method counts the amount of
returned presenting complaints that are the same and is called count. The second scoring
method sums the scores of the returned presenting complaints that are the same and is
Chapter 4. Software System
29
called score. The difference between these scoring methods is that the second scoring
method uses the similarity (to the query) of each found document. The first scoring
method ignores the similarity, a distant document is in this case counted equally as a
document close to the query.
4.3.4
Top
Top occurs also in rank in figure 4.2. This parameter defines the maximum number
of different presenting complaints that can be assigned to the unclassified unstructured
text. First, if there are multiple queries these results will be merged. Second, the results
will be ranked and only the top will be presented. The top assures that not too many
presenting complaints will be assigned to the unclassified text, as happened in the current
practice. For example, only the top two presenting complaints will be suggested, out
of a ranked list of eight presenting complaints. A triage officer most often chooses only
one or two presenting complaints. A low top value will ensure less suggested presenting
complaints, which will result in a high precision if relevant presenting complaints are
suggested. A high top value will result in a high recall, since there is more chance to
suggest the right presenting complaints.
4.3.5
Complaint coverage
Complaint coverage occurs in suggest in figure 4.2. A way to reduce the number of
apparently unwanted presenting complaints is setting a minimum number of documents
that should represent the presenting complaint before counting it. This parameter is
called min docs and is chosen to be linked to the nearest neighbors parameter. An
advantage is that occasionally occurring suggestions will be excluded. For example,
when 30 nearest neighbors are evaluated and only two documents suggest a specific
presenting complaint, this presenting complaint should probably not be suggested. A
minimum of
1
10
will then ensure that only presenting complaints that occur in at least
three documents are considered. A disadvantage of this method occurs when a presenting
complaint is represented by very few documents in the training collection. Setting a
minimum of documents with the same presenting complaint will then result in loss of
this specific presenting complaint. This disadvantage can be solved by adding more
documents labeled with the presenting complaint to the training collection.
Chapter 4. Software System
4.4
30
Implementation
Figure 4.3: Classdiagram of the software system
As seen in figure 4.3 the starter is used to define the parameter values Nearest Neighbors, Top and Complaint Coverage. The method used for parameter Query construction method can be chosen by calling either the ORQueryMethod or the UnigramsQueryMethod. The Scoring methods count and score are always used. For each NN
value a new Query construction method is called. Within this method, for each crossvalidation iteration (combination of test and training sets) all Top and Complaint Coverage values are tested. The precision and recall is kept in a Counter for each combination
of these parameters values. By doing this, each cross-validation iteration is used efficiently.
The text search engine library Apache Lucene Core1 is used in this implementation. For
indexing, the Snowball2 stemming algorithm is used in order to handle similar words as
1
2
http://lucene.apache.org/core
http://snowball.tartarus.org
Chapter 4. Software System
31
the same. For example, ‘falling’ and ‘fallen’ will both be ‘fall’ after stemming. Also some
misspelling is corrected using the same stemming algorithm. For example, ‘heaadache’
and ‘headache’ become ‘headache’. For creating the queries, tokenization is used to
either identify single words for a big OR-query or creating word n-grams. The query is
separated into words based on serried characters. Punctuation marks are included, if
not at the end of the query. Also a stopword list is used. This list contains words that
are not useful in the text. For example, ‘the’ and ‘also’. These words are ignored.
score(q, d) = wordsInDoc(q, d) ·
X
(tf-idf(w, d) · fieldLength(d))
(4.1)
w in q
During searching, the words in the query are searched in the indexed documents. This is
done using tf-idf. For each word w in the query q, the more times that word is found in
document d and the less different documents that word is found in, the higher the tf-idf
score for that word. The tf-idf score is multiplied with a computation of the word length
of the document. This will ensure that short texts (which are often more to the point)
contribute more to the score than longer texts. The result of this multiplication is then
summed for each word in the query. Next, this summation is multiplied with the number
of words in the query that are found in the document. The result is a score for that
document with that query3 . This score is used in ranking the presenting complaints.
The suggesting and ranking parts of the model are combined in this implementation. For
each query the count and sum of each presenting complaint is calculated, as described
in figure 4.4. The count and sum are only used when the prerequisites of suggesting
are met (in the figure; ‘number of the presenting complaint is higher than 3’). After all
queries are executed, the global counter and summer are sorted from high to low, so a
ranked list is obtained.
3
http : //lucene.apache.org/core/4 10 0/core/org/apache/lucene/search/similarities/T F IDF Similarity.html
(note that boosting is not used in this experiment)
Chapter 4. Software System
Data: List of all nearest neighbors
Result: The count and summed scores of each presenting complaint
foreach document doc in list list do
foreach presenting complaint pc in document doc do
// increase the counter for this specific presenting complaint
localCounter.increase(pc, 1);
// sum the score for this specific presenting complaint
localSummer.increase(pc, doc.score);
end
end
foreach presenting complaint pc in list of all presenting complaints do
if number of the presenting complaint is higher than 3, for example then
// add this presenting complaint count and score to the global
counter and summer
globalCounter.increase(pc, localCounter.get(pc);
globalSummer.increase(pc, localSummer.get(pc);
end
Figure 4.4: Algorithm for counting and summing the same presenting complaints
32
Chapter 5
Experimental Design
This chapter discusses the evaluation metrics and data collection used in the experiment.
Also the method of finding the best combination of parameters is described.
5.1
Evaluation metrics
The current practice does not suggest ranked presenting complaints. Therefore using a
rank-based metric, like MAP, makes it hard to compare the results of the software system
with the current practice. So, a rank-based metric will not be used in this experiment.
Precision and recall do not consider the ranking of the presenting complaints, therefore
these measures are used to measure the effectiveness of the software system. Recall is
the fraction of relevant labels that are retrieved. Precision is the fraction of retrieved
labels that are relevant. Precision and recall trade off against one another. You can get
a recall of 1 by suggesting all presenting complaints, but this will result in a very low
precision. You can also get a precision of 1 by suggesting one presenting complaints that
is always expected (if for some reason all documents are labeled with that presenting
complaint), but this will result in a very low recall. The F-measure is the harmonic
mean of precision and recall[1]. This measure can also be modified to prioritize either
precision over recall, or vice versa. For this experiment, recall is considered to be more
important than precision, since missing relevant labels should be avoided in the medical
domain. Because recall is more important than precision, the F4 -measure is chosen.
The precision, recall and F-measure are calculated per document. Next, the average
33
Chapter 5. Experimental Design
34
of the precision of all documents is calculated. This is also done for the recall and
F-measure of all documents. These averages are then used to evaluate the different
parameter settings with each other and to compare the precision, recall and F-measure
of the current practice with the measures of the new proposed software system. This is
done by comparing the F4 -measure. Since the current practice has a high recall value,
using the F4 -measure will force the software system to pursue a high recall value as well.
5.2
Data collection
The data collection contains unstructured texts and related presenting complaints, chosen by the triage officer. This data collection is used as ground truth, which means that
it is a representation of relevant presenting complaints per unstructured text [1]. The
data collection is separated into a development set and a test set. This is done in a
80/20 distribution, 80% of the data collection is used as development set and 20% is
used as test set. The test set is not used during development of the software system, but
is used to check if the best combination of parameter values are also the best settings
for new, unseen, unclassified documents. Because of the limited number of cases in
the development set, 4-fold cross-validation is used during development of the software
system. To use this method, the development set is split into four sets of equal size.
In cross-validation each set is once used as test set and the other sets are used as one
combined training set. For example, set 1 is used as test set and the pieces 2, 3 and 4
are used as training set. In the next iteration the sets 1, 3 and 4 are the training set
as piece 2 is the test set. This continues until each set has been the test set. 4-fold
means that there are four sets and each combination of test set and training sets is
used. The isolated test set (which is not the same set as the test sets used in the 4-fold
cross-validation) is used to check the found best combination of parameter values. The
entire development set is then used as training set.
5.3
Method
The experiment will start by comparing the two query construction methods, OR-query
and Unigrams. This is done using cross-validation on the development set. The Fmeasure is calculated for the development set for each nearest neighbor value in the
Chapter 5. Experimental Design
35
range of 1 till 20. Since all suggested presenting complaints will be presented and the Fmeasure does not consider the ranking of the suggestions, the F-measure of each nearest
neighbors value will be the same for both scoring methods, count and score. Next, the
two query construction methods are combined with parameter top with value range 1
till 10. Since the top excludes suggesting complaints, also the nearest neighbors value
range needs to be expanded. This new range becomes 1 till 100. Also the two scoring
methods are compared.
Based on the outcome of the combination of query construction methods, nearest neighbors, scoring methods and top, new ranges will be determined. With the new ranges the
combinations will be expanded by adding complaint coverage method min docs. Based
on the F-measure F4 the best combination of parameter values will then be determined.
For the best combination of parameters (query construction method, nearest neighbor
value, scoring method and the use of top and/or complaint coverage), the precision,
recall and F-measure of the software system using the cross-validated development set
will be compared to the measurements of the current practice on the cross-validated
development set. Also the precision, recall and F-measure of the software system using
the test set will be compared to the measurements of the current practice on the test set.
The same is done for the precision and recall of each presenting complaint. By comparing
the precision and recall of each presenting complaint, it becomes visible which presenting
complaints are missed.
Chapter 6
Results and Analysis
In this chapter the results of the experiment are presented. These results are also
analyzed. As previously described, the precision of the current practice is 0.29 and
the recall is 0.93, when using the cross-validated development set. This results in a
F4 -measure of 0.75.
6.1
Results
In section 6.1.1, the query construction methods, OR-query and Unigrams, are compared for different nearest neighbors values. The scoring methods and top are added
to the comparison in section 6.1.2. In section 6.1.3, a complaint coverage method is
also included in the comparison. The query construction methods, nearest neighbors
and scoring methods are common modifications for the kNN algorithm. Top and complaint coverage are chosen in order to improve the precision. The precision, recall and
F4 -measure are calculated per document. Each measure is than averaged over all documents.
6.1.1
Query construction & Nearest neighbors
The cross-validated development set is used to compare the two query construction
methods, OR-query and Unigrams. The range 1 till 20 is chosen for parameter nearest
36
Chapter 6. Results and Analysis
#
20
19
18
16
11
7
5
3
2
1
4
6
8
9
10
12
13
14
15
17
NN
1
2
3
4
5
6
7
8
9
10
11
12
13
14
15
16
17
18
19
20
OR-query
P
R
0.407 0.409
0.382 0.562
0.342 0.652
0.307 0.707
0.274 0.747
0.249 0.781
0.229 0.806
0.214 0.826
0.201 0.843
0.190 0.859
0.179 0.869
0.170 0.879
0.162 0.888
0.155 0.897
0.148 0.904
0.143 0.908
0.138 0.914
0.133 0.919
0.128 0.924
0.125 0.929
37
F4
0.406
0.538
0.604
0.637
0.655
0.667
0.673
0.676
0.677
0.677
0.673
0.670
0.666
0.663
0.658
0.653
0.648
0.644
0.640
0.636
#
1
2
3
4
5
6
7
8
9
10
11
12
13
14
15
16
17
18
19
20
NN
1
2
3
4
5
6
7
8
9
10
11
12
13
14
15
16
17
18
19
20
Unigrams
P
R
0.163 0.839
0.126 0.921
0.106 0.947
0.093 0.962
0.085 0.969
0.077 0.974
0.072 0.979
0.069 0.981
0.066 0.982
0.063 0.984
0.061 0.985
0.059 0.986
0.056 0.987
0.055 0.988
0.053 0.988
0.052 0.989
0.052 0.989
0.051 0.990
0.050 0.990
0.049 0.990
F4
0.620
0.601
0.569
0.545
0.525
0.509
0.495
0.484
0.474
0.465
0.458
0.451
0.444
0.439
0.434
0.429
0.426
0.422
0.419
0.415
Table 6.1: Top 20 F-measures
neighbors (NN). As shown in figure 6.1 using a combined OR-query gives a higher Fmeasure (F4) than using unigrams. Also, the unigrams method results in a very low
precision (P), but a high recall (R). The results are shown in table 6.1.
With NN value 10, the OR-query construction method reaches a F-measure of 0.677.
The Unigrams query construction method reaches a F-measure of 0.620, with NN value 1.
Chapter 6. Results and Analysis
38
F4-measure
0.7
OR − query
U nigrams
0.6
0.5
0.4
0
5
10
15
Nearest Neighbors
20
Figure 6.1: OR-query vs Unigrams, without top
6.1.2
Top & Scoring method
Next, the two query construction methods are combined with parameter top with value
range 1 till 10. Because it is expected that a higher NN value is needed, the range is
expanded to 1 till 100. Also, both scoring methods (SM), count and score, are used.
The top 10 results for query construction method Unigrams are shown in table 6.2. The
best 38 combinations all contain top value 4. Also the best 170 combinations contain
scoring method score. Therefore these values are used for the overview of the F-measure
trend of Unigrams. As seen in figure 6.2, the F-measure decreases after NN value 40.
#
1
2
3
4
5
6
7
8
9
10
NN
26
27
34
22
28
33
25
21
32
24
SM
Score
Score
Score
Score
Score
Score
Score
Score
Score
Score
Top
4
4
4
4
4
4
4
4
4
4
P
0.243
0.243
0.242
0.243
0.243
0.242
0.243
0.243
0.242
0.243
R
0.847
0.847
0.847
0.846
0.846
0.846
0.846
0.845
0.846
0.845
F4
0.731
0.731
0.730
0.730
0.730
0.730
0.730
0.729
0.729
0.729
Table 6.2: Top 10 F-measures using Unigrams
Chapter 6. Results and Analysis
39
0.74
F4-measure
0.72
0.7
0.68
0.66
0.64
0.62
0
20
40
60
80
Nearest Neighbors
100
F4-measure
0.73
0.73
0.73
0.72
0.72
0.72
20
40
60
Nearest Neighbors
Figure 6.2: Unigrams with top 4 and score method (overview and zoom)
The top 10 results for query construction method OR-query are shown in table 6.3. The
best 48 combinations all contain top value 4. Also the best 46 combinations contain
scoring method score. Therefore these values are also used for the overview of the
F-measure trend of OR-query.
As seen in figure 6.3, the F-measure stabilizes after NN value 40. The increase of the
F-measure for each additional NN is very small.
Both query construction methods perform best at the same top value (4) and scoring
method (score). The similar F-measures are close to each other (Unigrams: 0.731, ORquery: 0.722). However, the NN value needed to reach this F-measure is different for
both query construction methods. The Unigrams method needs less than 40 nearest
neighbors. After this value the F-measure decreases. The OR-query method needs
Chapter 6. Results and Analysis
#
1
2
3
4
5
6
7
8
9
10
NN
94
95
96
89
99
100
97
90
91
92
SM
Score
Score
Score
Score
Score
Score
Score
Score
Score
Score
40
Top
4
4
4
4
4
4
4
4
4
4
P
0.239
0.239
0.239
0.239
0.239
0.239
0.239
0.239
0.238
0.238
R
0.838
0.838
0.837
0.837
0.837
0.837
0.837
0.837
0.837
0.837
F4
0.722
0.722
0.722
0.722
0.722
0.722
0.722
0.721
0.721
0.721
Table 6.3: Top 10 F-measures using OR-query
more than 40 nearest neighbors. The F-measure increases very slowly after this value,
so choosing a higher value will have a very small influence on the F-measure, but a
negative influence on the performance of the system.
Chapter 6. Results and Analysis
41
F4-measure
0.7
0.6
0.5
0.4
0
20
40
60
80
Nearest Neighbors
100
60
80
Nearest Neighbors
100
F4-measure
0.72
0.72
0.71
0.71
40
Figure 6.3: OR-query with top 4 and score method (overview and zoom)
6.1.3
Complaint Coverage
For the unigrams method, the complaint coverage (CC) method min docs is used to test
improvement of the F-measure. The range 1 till 40 is chosen for NN. For CC, the values
1 1 1 1 1 1 1 1
2, 3, 4, 5, 6, 7, 8, 9
and
1
10 ,
relative to the nearest neighbors value, are chosen. Both
scoring methods, count and score, are used. The value of top is the range 1 till 7. This
because the value 4 seems to be a good value, according to the previous section. The
results are shown in table 6.4.
The complaint coverage method min docs is also used to test improvement of the Fmeasure of the OR-query method. The range 40 till 60 is chosen for NN. For CC, the
values
1 1 1 1 1 1 1 1
2, 3, 4, 5, 6, 7, 8, 9
and
1
10 ,
relative to the nearest neighbors value, are chosen.
Both scoring methods, count and score, are used. The value of top is the range 1 till 10.
Chapter 6. Results and Analysis
#
1
2
3
4
5
6
7
8
9
10
NN
36
27
30
35
24
25
24
26
35
30
SM
Score
Score
Score
Score
Count
Score
Score
Score
Score
Score
42
Top
5
4
4
5
5
5
5
4
6
5
CC
(1/x)
5
4
5
4
4
4
4
4
4
5
Precision
0.283
0.307
0.297
0.326
0.321
0.310
0.321
0.316
0.321
0.275
Recall
0.858
0.836
0.840
0.837
0.839
0.844
0.839
0.833
0.843
0.861
F4
0.741
0.741
0.741
0.741
0.741
0.741
0.741
0.741
0.741
0.741
Table 6.4: Top 10 F-measures using Unigrams and min docs
This range is expanded because the previous range was too small. The results are shown
in table 6.5.
#
1
2
3
4
5
6
7
8
9
10
NN
44
44
44
44
42
42
44
44
44
44
SM
Count
Count
Score
Score
Count
Count
Count
Score
Count
Score
Top
7
7
7
7
6
6
8
8
8
8
CC
(1/x)
9
10
9
10
9
10
9
9
10
10
Precision
0.296
0.296
0.296
0.296
0.308
0.308
0.296
0.296
0.296
0.296
Recall
0.833
0.833
0.833
0.833
0.825
0.825
0.833
0.833
0.833
0.833
F4
0.731
0.731
0.731
0.731
0.731
0.731
0.731
0.731
0.731
0.731
Table 6.5: Top 10 F-measures using OR-query and min docs
When adding the CC method to the combination of parameters, there is a small difference between the two query construction methods. The Unigrams method reaches a
F-measure of 0.741 with NN value 36, scoring method score, top value 5 and CC value
1
5.
The OR-query reaches a lower F-measure of 0.731 with a NN value 44, the scoring
method count, the top 7 and CC value of 19 . When calculating the minimal documents
needed for both query construction methods (NN*CC), the values are different. The
number of minimal documents needed for Unigrams is 7, for OR-query only 4.
Chapter 6. Results and Analysis
6.2
43
Analysis
When no top value is used, high recall and low precision is obtained by the Unigrams
method. This is because all found presenting complaints are shown, which is the number
of unigrams times the NN value times the number of presenting complaints that is linked
to a specific document. Adding a top value improves the F-measure for both query
construction methods, since only the most probable presenting complaints are shown.
Also the scoring method score seems to perform better then the scoring method count.
However, when adding CC method min docs to the combination of parameters, also
count is represented in the top 10 F-measures, but score keeps performing better. This
CC method increases the F-measure even more for both Unigrams and OR-query, but
Unigrams has clearly the better F-measures when using these parameter combinations.
6.2.1
Best combination
As seen in table 6.4 the best nearest neighbors value is 36, obtained by query construction
method Unigrams, if also complaint coverage value 51 , the scoring method score and top
value 5 are chosen. This means that 36 related documents are found per unigram.
From the presenting complaints that are linked to these 36 documents only presenting
complaints that occur 7 times ( 15 of 36) are used to sum the scores of the documents
that are linked to these presenting complaints. Finally the list of scores per presenting
complaint is ranked and the top 5 presenting complaints are suggested.
By using the F4 -measure, recall becomes more important than precision. This results
in a high value of parameter Top to achieve a high recall value. Having a high value of
parameter Top also results in a low precision value, since most of the time suggesting
one correct presenting complaint should be sufficient.
The best combination of parameters is used in a system trained on the full development
set and tested on the held-out test set. This is done without cross-validation, since the
test set contains unseen documents, so this set cannot be used as training data. Also
the precision, recall and F-measures of the current practice using both, the development
set and the test set, are calculated. For the current practice, cross-validation is also not
needed, since keyword scanning is used instead of training data.
Chapter 6. Results and Analysis
1
44
0.93
0.86
0.8
0.75 0.74
0.6
0.4
0.29 0.28
0.2
Precision
Recall
Current (dev)
F4-measure
Development
Figure 6.4: Comparison of Precision, Recall and F4-measure using the development
set
6.2.2
Comparison
Test set
Current practice (dev set)
Current practice (test set)
Development set
Precision
0.275
0.288
0.282
0.283
Recall
0.874
0.934
0.932
0.858
F4
0.751
0.748
0.742
0.741
Table 6.6: Comparing the current practice, development set and test set
As shown in table 6.6 and figures 6.4 and 6.5 the best parameter combination in the
software system using the test set has the best F-measure, followed by the current
practice. The precision and recall are calculated for each presenting complaint for both
the current practice and the software system. This is done in order to determine which
presenting complaints are found better and which are found less or not at all, when
using the software system. The comparison is done using the development set as shown
in the tables 6.7 and 6.8.
As seen in these tables, when using the software system with the development set 8
out of 48 presenting complaints are missed. Nevertheless, 26 presenting complaints are
assigned better to the unclassified documents than was done by the current practice.
Some presenting complaints show a high increase in precision. This seems to be related
to the number of documents describing that presenting complaint (the development
Chapter 6. Results and Analysis
45
1
0.93
0.87
0.8
0.74 0.75
0.6
0.4
0.28 0.28
0.2
Precision
Recall
Current (test)
F4-measure
Test
Figure 6.5: Comparison of Precision, Recall and F4-measure using the test set
Presenting Complaint
Geslachtsorgaanklachten
Borstontsteking
Corpus alienum
Gebitsklachten
Oorklachten
Brandwond
Huidklachten
Partus
Buikpijn kind
Rectale klachten
Obstipatie
Oogklachten
Trauma buik
Vaginaal bloedverlies
Keelklachten
Urinewegproblemen
Ziek kind
Hoesten
Allergische reactie
of insectensteek
Diarree
Koorts volwassene
Trauma thorax
Nekklachten
Occ.
3
4
12
14
15
17
17
17
18
22
24
28
28
31
33
33
39
42
Pcur
0.200
0.002
0.833
0.325
0.178
0.929
0.098
0.151
0.015
0.238
0.076
0.141
0.009
0.184
0.109
0.382
0.134
0.296
Pdev
0.000
0.000
0.000
0.167
0.242
1.000
0.000
0.000
0.000
0.500
0.000
0.270
0.000
0.270
0.429
0.567
0.305
0.561
%
-100
-100
-100
-49
36
8
-100
-100
-100
111
-100
92
-100
47
293
49
128
89
Rcur
0.333
1.000
0.417
0.929
0.867
0.765
0.765
0.824
0.944
0.864
0.750
0.893
0.929
0.968
0.939
0.879
0.821
0.952
Rdev
0.000
0.000
0.000
0.071
0.267
0.353
0.000
0.000
0.000
0.159
0.000
0.589
0.000
0.484
0.636
0.258
0.321
0.762
%
-100
-100
-100
-92
-69
-54
-100
-100
-100
-82
-100
-34
-100
-50
-32
-71
-61
-20
51
55
59
61
64
0.056
0.096
0.200
0.018
0.303
0.591
0.496
0.241
0.516
0.311
956
415
20
2846
3
0.980
0.982
0.983
0.885
0.984
0.735
0.627
0.559
0.262
0.609
-25
-36
-43
-70
-38
Table 6.7: Underrepresented presenting complaints in the development set
(Occ. = Occurences in the development dataset)
Chapter 6. Results and Analysis
Presenting Complaint
Bloedneus
Koorts kind
Trauma nek
Armklachten
Diabetes
Rugpijn
Trauma rug
Braken
Hoofdpijn
Vreemd gedrag of suicidaal
Insult
Intoxicatie
Wond
Neurologische uitval
Wegraking
Trauma schedel
Beenklachten
Hartkloppingen
Trauma aangezicht
Kortademig
Duizelig
Buikpijn volwassene
Algehele malaise volwassene
Pijn thorax
Trauma extremiteit
46
Occ.
89
110
121
149
171
173
196
201
205
226
261
269
284
286
318
324
332
338
464
475
495
522
523
797
1110
Pcur
0.336
0.166
0.043
0.062
0.464
0.364
0.068
0.252
0.237
0.474
0.683
0.577
0.305
0.414
0.272
0.131
0.128
0.545
0.149
0.451
0.395
0.421
0.118
0.508
0.298
Pdev
0.230
0.284
0.268
0.199
0.528
0.318
0.321
0.248
0.423
0.380
0.531
0.335
0.242
0.305
0.275
0.181
0.197
0.383
0.199
0.238
0.441
0.239
0.178
0.174
0.205
%
-31
70
524
221
14
-13
371
-1
78
-20
-22
-42
-21
-26
1
39
54
-30
33
-47
12
-43
51
-66
-31
Rcur
0.966
0.909
0.959
0.993
0.982
0.960
0.985
0.886
0.927
0.618
0.981
0.866
0.852
0.850
0.836
0.985
0.979
0.926
0.978
0.872
0.939
0.941
0.946
0.961
0.968
Rdev
0.927
0.855
0.752
0.617
0.863
0.850
0.750
0.816
0.659
0.641
0.954
0.937
0.759
0.846
0.722
0.889
0.839
0.917
0.933
0.917
0.870
0.962
0.683
0.990
0.995
%
-4
-6
-22
-38
-12
-11
-24
-8
-29
4
-3
8
-11
0
-14
-10
-14
-1
-5
5
-7
2
-28
3
3
Table 6.8: Represented presenting complaints in the development set
(Occ. = Occurences in the development dataset)
set is a larger set than the test set) or the specificness of the presenting complaints.
For example, documents labeled with presenting complaint ‘allergic reaction’ contain
almost always the words ‘allergic’ or ‘allergy’. The recall of each presenting complaint
is very high in the current practice. Naturally, this makes it hard to improve the recall
of these presenting complaints. Additional to the 8 presenting complaints that are
missed, 8 presenting complaints have a recall that is decreased with 50% or more when
using the classification software system. These presenting complaints are apparently
expected much more than they are suggested. This seems also to be related to size
of the development set. Underrepresented presenting complaints are less likely to be
suggested, as seen in table 6.7. This problem could be solved by adding documents
labeled with these presenting complaints to the training set or use boosting. In case of
boosting, if a presenting complaint is found, but underrepresented in the training set
Chapter 6. Results and Analysis
47
this presenting complaint is counted multiple times to give it a change of being selected.
For each presenting complaint the F4 -measure is calculated, as shown in table 6.9 and table 6.10. 11 presenting complaints perform better and 37 presenting complaints perform
less than the current practice. Using the F4 -measure of each presenting complaint, the
macro F4 (non-weighted average over all presenting complaints) and micro F4 (average
using the occurrences of the presenting complaint as weight) are calculated, as shown in
table 6.11.
Presenting Complaint
Trauma nek
Allergische reactie
of insectensteek
Trauma rug
Trauma thorax
Koorts kind
Armklachten
Trauma aangezicht
Trauma schedel
Vreemd gedrag of suicidaal
Intoxicatie
Beenklachten
Occ.
121
F 4cur
0.426
F 4dev
0.680
%
60
51
196
61
110
149
464
324
226
269
332
0.497
0.550
0.226
0.720
0.528
0.737
0.711
0.607
0.841
0.704
0.725
0.695
0.270
0.764
0.550
0.766
0.723
0.616
0.847
0.704
46
26
19
6
4
4
2
1
1
0
Table 6.9: Better performing presenting complaints
(Occ. = Occurences in the development dataset)
Chapter 6. Results and Analysis
48
Presenting Complaint
Diarree
Neurologische uitval
Keelklachten
Insult
Hartkloppingen
Kortademig
Trauma extremiteit
Duizelig
Braken
Buikpijn volwassene
Bloedneus
Diabetes
Hoesten
Rugpijn
Wegraking
Wond
Algehele malaise volwassene
Pijn thorax
Oogklachten
Hoofdpijn
Nekklachten
Koorts volwassene
Vaginaal bloedverlies
Ziek kind
Brandwond
Oorklachten
Urinewegproblemen
Rectale klachten
Gebitsklachten
Borstontsteking
Buikpijn kind
Corpus alienum
Geslachtsorgaanklachten
Huidklachten
Obstipatie
Partus
Trauma buik
Occ.
55
286
33
261
338
475
1110
495
201
522
89
171
42
173
318
284
523
797
28
205
64
59
31
39
17
15
33
22
14
4
18
12
3
17
24
17
28
F 4cur
0.638
0.800
0.649
0.956
0.890
0.826
0.855
0.869
0.771
0.877
0.870
0.922
0.843
0.875
0.746
0.771
0.669
0.913
0.680
0.791
0.869
0.799
0.774
0.630
0.773
0.706
0.816
0.748
0.837
0.036
0.207
0.429
0.321
0.546
0.492
0.652
0.130
F 4dev
0.618
0.766
0.619
0.911
0.848
0.785
0.812
0.823
0.719
0.816
0.787
0.832
0.746
0.774
0.659
0.674
0.585
0.776
0.551
0.638
0.577
0.519
0.462
0.320
0.367
0.265
0.266
0.166
0.074
0.000
0.000
0.000
0.000
0.000
0.000
0.000
0.000
%
-3
-4
-5
-5
-5
-5
-5
-5
-7
-7
-10
-10
-11
-12
-12
-13
-13
-15
-19
-19
-34
-35
-40
-49
-53
-62
-67
-78
-91
-100
-100
-100
-100
-100
-100
-100
-100
Table 6.10: Less performing presenting complaints
(Occ. = Occurences in the development dataset)
Macro F4
Micro F4
Cur
0.678
0.784
Dev
0.523
0.728
%
-23
-7
Table 6.11: Comparing the macro F4 and micro F4 measures
Chapter 7
Conclusion
The software system does not show a clear improvement as compared to the current
practice (shown earlier, in table 6.6). The software system could therefore not replace
the current practice yet. However, the software system has the advantage that documents, classified by the software system, can also be reused as training data. Possible
misses will be corrected by the triage officer and these corrected cases will be used for
future cases. This mean that the software system keeps improving itself. Also, only 5
presenting complaints are shown by the software system, whereas the current practice
has a suggestion average of 8 different presenting complaints per triage text. Since the
complete triage text is used, similar texts will result in similar suggestions, even if a word
that is used as keyword in the current practice is missing. Furthermore, the software
system can rank the suggestions by likelihood, whereas the current practice cannot rank
its suggestions.
In the next section the answer to the research question is given. After some improvements, described in the section 7.2, the software system could probably replace the
current practice.
49
Chapter 7. Conclusion
7.1
50
Research answers
In order to answer the research question What is the best classification method
for medical text classification?, the four questions, defined in chapter 1, need to be
answered first.
7.1.1
Characteristics of medical texts
The first question that needs to be answered is: What are the characteristics of medical
texts that complicate medical text classification? 10 characteristics of medical texts were
found, as described in chapter 2. These characteristics are:
• Telegraphic style; no complete sentences are used.
• Shorthand text; abbreviations, acronyms and local dialectal shorthand phrases are
used.
• Misspelling; spelling errors are made. For example, typo’s and forgotten whitespaces.
• Special characters; non-alphanumeric characters are used. For example, a medication description ‘40 mg/d’.
• Self-made structure; extra characters are added with the only purpose to create a
visible structure in the text. For example, to create a table.
• Synonymy; different words that mean the same.
• Ambiguity; one word with different meanings.
• Negation; negated words or phrases. For example, ‘no pain on chest’.
• Temporality; this says something about the time in which an event occurs. For
example, ‘leg trauma three years ago’.
• Event subject identification; another person is mentioned.
Some of these characteristics do occur in the data collection, used in this thesis, as
described in table 3.1. Only telegraphic style, shorthand text and negation are found
Chapter 7. Conclusion
51
in more than 35% of the analyzed cases. The characteristic telegraphic style does not
complicate medical text classification, since most classification methods do not rely on
complete sentences. The characteristic shorthand text will only complicate medical text
classification if an abbreviation is little used. Abbreviations like ‘pob’ (pain on chest)
are often used, so these abbreviations will be used as regular words in medical text
classification. The use of punctuation in abbreviations (for example ‘p.o.b.’) does complicate medical text classification. The characteristic negation does complicate medical
text classification, since words or phrases are by default not recognized as negated in
medical text classification.
7.1.2
Limitations of keyword scanning
The second question that needs to be answered is: What are the limitations of a keyword scanning system for medical text classification? The main limitation of keyword
scanning is that not all words in the text are used. Only words that are part of the list
of used keywords are recognized. The current practice has one big limitation; keywords
are linked to more than two presenting complaints. Since most of the times only one
presenting complaint is chosen by the triage officer, suggesting multiple presenting complaints results in a low precision. Also some word combinations are recognized, but also
the single words of the word combination are then recognized. Again, this increases the
number of suggestions. Furthermore, when a triage officer chooses another presenting
complaint than suggested by the keyword scanning system, this is saved by the system,
but not used for future triages. When the exact same text is entered for a new triage,
the keyword scanning system will still not suggest the presenting complaint that was
chosen before by the traige nurse.
7.1.3
Classification methods
The third question that needs to be answered is: What are other classification methods
for medical text classification? Since the current practice is using a unsupervised text
classification method, keyword scanning, this thesis focuses on supervised text classification methods. Three methods are discussed; k Nearest Neighbors (kNN), Support
Vector Machines (SVM) and Naive Bayes (NB). These classification methods are compared on five areas. The first area is the ability to implement multi-label classification.
Chapter 7. Conclusion
52
kNN can be extended to support this. Both SVM and NB need to be transformed in
order to support multi-label classification. The second area is the support for not mutually exclusive classes. All three classification methods satisfy this area. The third area
is the size of the dataset. The used development dataset contains 7,863 cases, which is a
relatively small dataset. kNN and NB can handle a small dataset. SVM needs a bigger
dataset. The fourth area is modifiability of intermediate results. kNN and NB can be
modified to handle intermediate results differently. SVM does not have this property.
The fifth and last area is the computational time needed for classification. SVM and
NB use trained classifiers, which makes that they need training time but are fast at
test time (when previously unseen texts are classified). kNN does not have training
time, so the test time is longer. Considering these five areas, kNN is chosen to be used
for multi-label text classification. This method works well with the small dataset and
intermediate results can be modified to influence the classification outcome.
7.1.4
Variant of classification method
The fourth question that needs to be answered is: Given the best classification method,
what variation of this classification method performs best? The best classification method
is kNN, as discussed in the previous section. This method does not perform well out
of the box, as seen in chapter 6. Some modifications are therefore necessary. These
modifications are done via defined parameters, as described in chapter 4. The following five parameters are defined. The first parameter is the Query construction method,
which could be implemented by using one big OR-query or split the text in Unigram
queries. The second parameter is Nearest neighbors, which defines the number of similar
documents that are used for classification. The third parameter is the Scoring method.
The intermediate results could be scored based on the number of the same presenting
complaints or the score of the found documents. The fourth parameter is the Top, which
defines the maximum number of different presenting complaints that will be shown. This
could be a static value or all different presenting complaints with a minimal averaged
document score per presenting complaint. The last parameter is the Complaint coverage, which can be implemented by defining a minimal number of the same presenting
complaints (called min docs in this thesis) needed in order to count the presenting complaint. Another implementation is a minimal document score that is needed in order
to count the presenting complaints labeled to that document. The Query construction
Chapter 7. Conclusion
53
methods OR-query and Unigrams, the Nearest neighbors value, the Scoring methods
count and score, the static Top method and the Complaint coverage method min docs
were tested for the best value combinations.
7.1.5
Best classification method
The answers to the previous four questions give the answer to the research question
What is the best classification method for medical text classification? The best
classification method is kNN with use of all five defined parameters, specifically Query
construction method Unigrams, Nearest neighbors value 36, Scoring method score, static
Top value 5 and Complaint coverage implementation min docs with value of
1 th
5
of the
Nearest neighbors value. This gives a similar F4 -measure value as the current practice,
as seen in chapter 6. The software system could be improved more, as discussed in the
next section.
7.2
Future work
In this section some improvements to the software system are presented.
Since often only one presenting complaint is chosen, suggesting more than one presenting
complaint results in a low precision. Another implementation of the parameter Top could
be used, for example a dynamic implementation; Only different presenting complaints
with a minimal averaged document score per presenting complaint are suggested. In
this way only presenting complaints with a high likelihood will be suggested. This could
be 1 presenting complaint in a case and 7 presenting complaints in another case. Also
the parameter Complaint coverage could be implemented in another way. For example,
an implementation where a minimal document score is needed in order to count the
presenting complaints labeled to that document. Instead of Unigrams, also other word
n-grams could be used for parameter Query construction method.
The training data does not represent all presenting complaints equally. This is also
visible in chapter 6. For future work the dataset used for training could be analyzed
to see which presenting complaints are underrepresented. Next, documents containing
these presenting complaints as labels should be added to the dataset. Another solution is
Chapter 7. Conclusion
54
boosting the underrepresented presenting complaints, so if these presenting complaints
are found, they will be counted heavier than other presenting complaints.
The characteristics negation and shorthand text occur often in the dataset used in this
thesis. Both characteristics are not used in this thesis, but could improve the precision
of the suggestions of the software system. Therefore, these characteristics should be
recognized, so shorthand text is replaced by complete text. Negation could be excluded
from the results or used as negation in the query (which only suggests document that
do not contain the negated word), for example.
Both systems, the current practice and the proposed software system, could be combined
into one hybrid system. The text will be entered into both systems. If a presenting
complaint is suggested by both systems, it will be suggested to the user. If one of the
systems does not suggest any presenting complaints, the presenting complaint suggested
by the other system will not be suggested to the user. This will solve the problem of a
large number of suggestions by the current practice.
Bibliography
[1] Christopher D Manning, Prabhakar Raghavan, and Hinrich Sch¨
utze. Introduction to
information retrieval. Cambridge university press Cambridge, 2008.
[2] Abhimanyu Chopra, Abhinav Prashar, and Chandresh Sain. Natural language processing. International Journal of Technology Enhancements and Emerging Engineering Research, 1(4):131–134, 2013.
[3] Dolf Trieschnigg. Proof of concept: concept-based biomedical information retrieval.
Number 10-176. Centre for Telematics and Information Technology, University of
Twente, 2010.
[4] Charu C Aggarwal and ChengXiang Zhai. A survey of text classification algorithms.
In Mining text data, pages 163–222. Springer, 2012.
[5] Stephane M Meystre, Guergana K Savova, Karin C Kipper-Schuler, John F Hurdle,
et al. Extracting information from textual documents in the electronic health record:
a review of recent research. Yearb Med Inform, 35:128–44, 2008.
[6] Solweig Gerbier, Olga Yarovaya, Quentin Gicquel, Anne-Laure Millet, Veronique
Smaldore, Veronique Pagliaroli, Stefan Darmoni, and Marie-Helene Metzger. Evaluation of natural language processing from emergency department computerized medical records for intra-hospital syndromic surveillance. BMC medical informatics and
decision making, 11(1):50, 2011.
[7] Minlie Huang, Aurelie Neveol, and Zhiyong Lu. Recommending mesh terms for annotating biomedical articles. Journal of the American Medical Informatics Association,
18(5):660–667, 2011.
[8] Julio Villena Roman, Sonia Collada Perez, Sara Lana Serrano, and Jose Carlos
Gonzalez Cristobal. Hybrid approach combining machine learning and a rule-based
55
Bibliography
56
expert system for text categorization. In Twenty-Fourth International FLAIRS Conference. AAAI, 2011.
[9] W Bruce Croft. Knowledge-based and statistical approaches to text retrieval. IEEE
Intelligent Systems, 8(2):8–12, 1993.

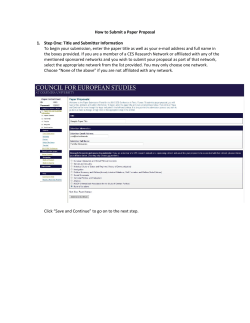


© Copyright 2026