
fetalneonatal-2014-307636 1..9 - Fetal and Neonatal Edition
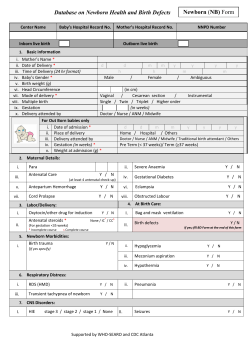
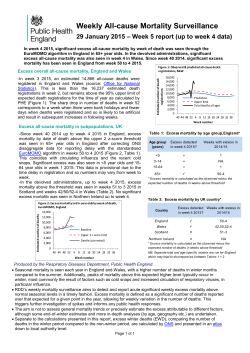
Downloaded from http://fn.bmj.com/ on July 6, 2015 - Published by group.bmj.com
ADC-FNN Online First, published on May 13, 2015 as 10.1136/archdischild-2014-307636
Global child health
Cause-specific neonatal mortality: analysis of 3772
neonatal deaths in Nepal, Bangladesh, Malawi
and India
Edward Fottrell,1 David Osrin,1 Glyn Alcock,1 Kishwar Azad,2 Ujwala Bapat,3
James Beard,1 Austin Bondo,4 Tim Colbourn,1 Sushmita Das,3 Carina King,1
Dharma Manandhar,5 Sunil Manandhar,5 Joanna Morrison,1 Charles Mwansambo,6
Nirmala Nair,7 Bejoy Nambiar,1 Melissa Neuman,1 Tambosi Phiri,8 Naomi Saville,1
Aman Sen,5 Nadine Seward,1 Neena Shah Moore,3 Bhim Prasad Shrestha,5
Bright Singini,8 Kirti Man Tumbahangphe,5 Anthony Costello,1 Audrey Prost1
▸ Additional material is
published online only. To view
please visit the journal online
(http://dx.doi.org/10.1136/
archdischild-2014-307636).
For numbered affiliations see
end of article.
Correspondence to
Dr Edward Fottrell, University
College London, Institute for
Global Health, 30 Guilford
Street, London WC1N 1EH,
UK; [email protected]
Received 2 October 2014
Revised 13 April 2015
Accepted 14 April 2015
ABSTRACT
Objective Understanding the causes of death is key to
tackling the burden of three million annual neonatal
deaths. Resource-poor settings lack effective vital
registration systems for births, deaths and causes of
death. We set out to describe cause-specific neonatal
mortality in rural areas of Malawi, Bangladesh, Nepal
and rural and urban India using verbal autopsy (VA)
data.
Design We prospectively recorded births, neonatal
deaths and stillbirths in seven population surveillance
sites. VAs were carried out to ascertain cause of death.
We applied descriptive epidemiological techniques and
the InterVA method to characterise the burden, timing
and causes of neonatal mortality at each site.
Results Analysis included 3772 neonatal deaths and
3256 stillbirths. Between 63% and 82% of neonatal
deaths occurred in the first week of life, and males were
more likely to die than females. Prematurity, birth
asphyxia and infections accounted for most neonatal
deaths, but important subnational and regional
differences were observed. More than one-third of
deaths in urban India were attributed to asphyxia,
making it the leading cause of death in this setting.
Conclusions Population-based VA methods can fill
information gaps on the burden and causes of neonatal
mortality in resource-poor and data-poor settings. Local
data should be used to inform and monitor the
implementation of interventions to improve newborn
health. High rates of home births demand a particular
focus on community interventions to improve hygienic
delivery and essential newborn care.
INTRODUCTION
To cite: Fottrell E, Osrin D,
Alcock G, et al. Arch Dis
Child Fetal Neonatal Ed
Published Online First:
[please include Day Month
Year] doi:10.1136/
archdischild-2014-307636
Each year, approximately three million children die
in the first 28 days after birth, predominantly due
to complications of preterm birth, asphyxia and
sepsis.1–3 With postneonatal mortality declining
faster than neonatal mortality,4 these deaths
account for a growing proportion of under-five
deaths. Understanding the numbers and causes of
neonatal deaths, as well as gender differences and
national and subnational variation, is key to realising the Every Newborn Action Plan and
post-Millennium Development Goals of a ‘grand
What is already known on this topic?
▸ Globally, there are three million neonatal
deaths every year, mostly from prematurity,
asphyxia and sepsis.
▸ Ninety-eight per cent of these deaths occur in
low-income countries, where poor mortality
data hinders intervention strategies.
▸ More direct measurement could guide policy
and practice at national and subnational levels.
What this study adds?
▸ Population-based verbal autopsy (VA) tools
such as InterVA offer a standardised method to
directly measure the burden and causes of
neonatal mortality in low-income settings.
▸ Although patterns of neonatal death differ
between sites, both early and late neonatal
mortality remain unacceptably high.
▸ Localised, direct measurement reveals
important subnational variations in mortality
rates and causes, which might be masked by
estimation methods at the national level.
convergence’ in health, with substantial reductions
in neonatal and child mortality.5–8 Unfortunately,
the resource-poor settings that bear the burden of
more than 98% of neonatal deaths often lack the
effective vital registration systems crucial to understanding mortality and planning services or
interventions.
Advances in epidemiological modelling methods
have recently been applied to pooled datasets to
characterise neonatal mortality.5 9 Such estimates
are useful at a global level, but have limitations.
Broad underlying assumptions, lack of transparency
in the data and methods used and restrictions on
disaggregating the data limit their relevance at subnational levels, where there can be substantial variation in rates, trends and cause distributions. There
is a growing recognition that measurement rather
than modelling is needed10 11 and frustration at
Fottrell E, et al. Arch Dis Child Fetal Neonatal Ed 2015;0:F1–F9. doi:10.1136/archdischild-2014-307636
F1
Copyright Article author (or their employer) 2015. Produced by BMJ Publishing Group Ltd (& RCPCH) under licence.
Downloaded from http://fn.bmj.com/ on July 6, 2015 - Published by group.bmj.com
Global child health
unsatisfactory progress with civil registration systems. Global
bodies, including the WHO, call for the application of
fit-for-purpose methods for registering deaths and assigning
their causes in a consistent, systematic and timely manner.12–16
Since 2001, we have implemented community-based surveillance of perinatal events along with verbal autopsies (VA) in
rural Nepal, Bangladesh, Malawi and urban and rural India.
This has enabled us to prospectively document births, neonatal
deaths and their causes within geographical areas covering a
total population of approximately 2.4 million. Using these data,
we describe the rates, timing and causes of neonatal mortality
for 3772 deaths from low-income and middle-income settings,
highlighting regional and gender disparities and identifying
priorities for public health intervention.
METHODS
Study populations
We used data gathered between 2001 and 2011 in cluster randomised controlled trials of community mobilisation ‘women’s
group’ interventions in Bangladesh (Perinatal Care Project
(PCP)17 18), Malawi (MaiMwana19 and MaiKhanda20), India
(Society for Nutrition, Education and Health Action
(SNEHA)21 and Ekjut22) and Nepal (Makwanpur and
Dhanusha23). The data represent 118 084 births recorded in
seven locations with community-based surveillance of perinatal
events. Characteristics of each study population, study timelines
and basic neonatal health indicators are summarised in table 1.
Given the documented effect of the women’s group intervention
on neonatal mortality,24 only data from counterfactual clusters
without women’s groups were included in the analysis.
Counterfactual clusters were not pure control areas in every
setting: in MaiMwana, Malawi, a breastfeeding counselling
intervention was implemented and tested in 12 of the 24 counterfactual clusters;19 in PCP, Bangladesh, four of the nine clusters received training of traditional birth attendants on
resuscitation;25 in Dhanusha, Nepal, a community-based neonatal sepsis management intervention was implemented in 9 of
the 30 counterfactual clusters.26
Community-based surveillance and verbal autopsy
Surveillance systems for births and newborn deaths were established in each setting. Their design and implementation have
been described elsewhere.17 20 21 23 26–30 Field-based key informants recruited in cluster subareas identified births and deaths,
which were then verified by trained interviewers. At all sites,
stillbirths were distinguished from very early neonatal deaths
based on the absence of signs of life (movement, breathing,
crying) when the infant was born, according to the mother or
other caregivers. In MaiKhanda, Malawi, a simple algorithm
was used to classify deaths as stillbirths or neonatal deaths from
data pertaining to these reported signs of life.30
To ascertain likely causes of neonatal deaths, trained lay interviewers conducted VAs. VA is the process of interviewing a caregiver, relative or witness to ascertain the presence, absence or
nature of signs, symptoms and circumstances observed at or
around the time of death.31 Interviewers used a structured questionnaire to gather VA information, usually from the mother of
the deceased child. Questionnaires comprised a series of
fixed-response questions, with space to record open-ended comments, but this open-ended information was not included in the
current analysis, as previous work has shown that it does not
add to biomedical interpretations of cause of death using automated methods.32 The questionnaires were similar in all settings
(see online supplementary table S1), and interviewers were
F2
trained to ask all relevant questions on the VA questionnaire,
adhering to predefined skip patterns, regardless of perceived
relevance to the specific case. Interviews were conducted after a
culturally appropriate mourning period. Only VAs with sex and
age at death data were considered to be complete and included
in the study. The VA completion rates for each site are summarised in table 1.
Data management and quality control
Registered vital events identified by incentivised key informants
or salaried enumerators were confirmed by interviewer visits to
households and, in a subsample of cases, through field supervisor visits. Trends were compared with local public system
registration figures. Further quality checks during in-country
electronic data entry mandated referral back to the field for correction when errors were detected.17–23 26–30
Interpreting verbal autopsy
VA data were interpreted through InterVA V.4.02 (http://www.
interva.net), an automated method for interpreting signs, symptoms and circumstances.33 Based on the reported presence or
absence of indicators, Bayesian reasoning is applied to calculate
the likelihood of 60 possible cause-of-death categories compatible with the International Classification of Diseases V.10.
Following procedures outlined in the InterVA user guide,34 variables describing specific signs and symptoms were mapped to
equivalent InterVA indicators to generate files to be processed
through the Bayesian model. For example, any positive
responses to questions about intermittent or fast breathing,
chest in-drawing, grunting or nasal flaring before death were
used to generate a positive response in InterVA’s ‘difficulty
breathing’ indicator. One member of the research team (EF)
reviewed the mapping between each study site’s data and the
InterVA input file as a quality control measure to check plausibility of symptom frequencies.
InterVA requires population HIV and malaria prevalence to be
specified so that the model can account for baseline differences
between locations. Previous research has shown that simple
descriptions of ‘very low’, ‘low’ or ‘high’ prevalence, corresponding to increasing orders of magnitude, are adequate for
this.35 Malaria and HIV settings for each site are summarised in
table 1.
InterVA reports the probability of up to three of the most
likely causes for each death.33 We summed the likelihoods of
each cause from every individual death to estimate the burden
of each at population level. Dividing this estimate by the total
number of deaths provided population cause-specific mortality
fractions (CSMFs), and dividing by the number of live births at
each study site provided estimates of cause-specific mortality
rates (CSMRs). In MaiMwana (Malawi) and all Asian sites, it
was possible to calculate mortality rates by sex, based on the directly measured number of liveborn males and females. In
MaiKhanda (Malawi), however, sex was not recorded for all live
births, and estimates of the numbers of liveborn males and
females were derived by splitting the total number on the basis
of the 2010 Demographic and Health Survey live-birth sex ratio
for 2007–2010.36
Ethical considerations
The trials in which the current data were gathered were
approved by either the University College London or the Great
Ormond Street Hospital Research Ethics Committee in the UK,
and by ethical review committees in each setting: the Ethical
Review Committee of the Diabetic Association of Bangladesh,
Fottrell E, et al. Arch Dis Child Fetal Neonatal Ed 2015;0:F1–F9. doi:10.1136/archdischild-2014-307636
Downloaded from http://fn.bmj.com/ on July 6, 2015 - Published by group.bmj.com
Global child health
the Nepal Health Research Council (with a Memorandum of
Understanding with the Government of Nepal Ministry of
Health), the Independent Ethics Committee for Research on
Human Subjects (Mumbai), an independent ethical committee
in Jamshedpur, India, and the Malawi National Health Sciences
Research Committee.
RESULTS
A total of 3772 neonatal deaths with complete age and sex data
were included in the analysis. The average time from death to
VA interview varied between study sites, with an average of
3 weeks at Ekjut and SNEHA (India), 5–6 weeks at PCP
(Bangladesh) and Dhanusha (Nepal), 29 weeks at MaiMwana
and 67 weeks at MaiKhanda (Malawi). The relatively long
death-to-interview time in MaiKhanda reflects the fact that a
large number of VAs were not completed initially, but rather
included as part of a verification exercise after the trial ended in
May 2011.30 Interview dates were not available for Makwanpur
(Nepal). The average number of VA indicators per case was
12 for MaiKhanda, 13 for Makwanpur, 14 for Dhanusha, Ekjut
and MaiMwana, 15 for SNEHA and 17 for PCP. Numbers of
stillbirths and neonatal deaths contributed by each study site are
presented in table 2, which also shows crude and sex-specific
mortality rates and mortality rate ratios comparing males with
females.
Table 3 shows sex-specific and cause-specific neonatal mortality fractions for all InterVA-derived cause categories. Infectious
causes—diarrhoeal disease, meningitis and encephalitis, pneumonia and sepsis—were consolidated into a broad cause category of infection, and the categories ‘other and unspecified’
and ‘indeterminate’ were consolidated to facilitate presentation
of cause-specific rates and overall fractions in figure 1.
Crude sex-specific neonatal mortality rates and rate ratios
(table 2) show that males had 20%–50% higher mortality than
females, with rate ratios (95% CIs) ranging from 1.2 (1.0–1.3)
in MaiKhanda to 1.5 (1.1–2.0) in Makwanpur. In most settings,
there were no obvious important differences between cause distributions by sex (table 3). However, at SNEHA in urban India
and, to a lesser extent, Makwanpur in Nepal, a larger proportion of female deaths were attributed to prematurity.
Figure 2 shows CSMFs by day of death. Across all Asian sites,
approximately one-third of neonatal deaths occurred on the first
day of life. This proportion was greater than 40% in both
Malawian sites, and, in all settings, the first week of life
accounted for most neonatal deaths, ranging from 63% in
Makwanpur (Nepal) and SNEHA (India) to 82% in MaiKhanda
(Malawi).
DISCUSSION
Using prospective data from seven community-based surveillance systems, we applied an automated method of VA interpretation to provide a uniquely standardised summary and
comparison of neonatal mortality across four low-income and
middle-income settings. Across all settings, and particularly in
rural areas, neonatal mortality rates were unacceptably high and
driven by prematurity, birth asphyxia (intrapartum-related
deaths) and infections, which were particularly important in the
rural Asian sites. The first days of life remain the most risky,
with more than one-third of deaths occurring on the first day,
half in the first 2 days and three-quarters in the first week.
Gender disparities
Male gender disadvantage was observed in all study sites, with
boys being up to 50% more likely to die than girls. While our
observation could be a consequence of methodological bias,
whereby social desirability may lead to an over-reporting for
male offspring, a neonatal mortality ratio of males to females of
at least 1.2 has been reported previously.37 38 Recent research
has also shown that boys are more likely to be born prematurely
and have a higher incidence of infections and encephalopathy.39–41 With the exception of Dhanusha (Nepal) and PCP
(Bangladesh), sex differentials in CSMFs in table 3 suggested
more infections in males, although prematurity appeared to act
in the opposite direction, and was responsible for a higher proportion of female deaths. Similar findings for late neonatal
deaths have been observed in other studies from Nepal38 and
India,42 and may reflect overarching gender preference or preferential care-seeking as well as interactions between ethnicity,
sex and the presence of prior siblings. The extent to which
observed sex differentials reflect biological phenomena or are a
consequence of modifiable socioeconomic factors demands
further investigation.
Differences between countries
There were important differences in overall mortality and cause
distributions between settings. PCP (Bangladesh) and the sites in
Malawi and Nepal had similar overall neonatal mortality rates
of 25–35 deaths per 1000 live births. However, the proportion
of deaths attributed to prematurity, birth asphyxia and infections
varied considerably between settings. In the Bangladesh site and
both Nepal sites, the burden of the combined infectious causes
of death accounted for almost two-fifths of the total mortality
burden, whereas in Malawi, the burden ranged from 26% to
34%, and a greater proportion of prematurity-related mortality
was observed. This is perhaps unsurprising given that Malawi is
reported to have the highest prematurity rate in the world, at
18%.43
Differences within countries
Ekjut, in rural India, had the highest neonatal mortality rate of
59 deaths per 1000 live births, almost seven times greater than
SNEHA in urban Mumbai, reflecting huge subnational variation.
Infections and prematurity each accounted for around one-third
of neonatal deaths in Ekjut. While infections and prematurity
remained in the top three causes in Mumbai, more than
one-third of deaths were attributed to asphyxia, making it the
leading cause of death. This is in agreement with a neonatal VA
study from the same setting, which identified one-third of
asphyxia deaths as being associated with obstetric complications.44 Observed differences between rural and urban India are
likely to reflect documented shifts in cause patterns as overall
mortality rates fall, largely driven by decreases in the rates of
death from infections, particularly pneumonia.45
Within-country differences were also observed in Malawi and
Nepal, but are not easily explained by underlying mortality
rates. In Malawi, data from MaiMwana suggest that approximately one-third of neonatal deaths were attributable to neonatal pneumonia/sepsis, approximately 8% greater than the
burden identified at the MaiKhanda site, where slightly higher
burdens of prematurity and asphyxia were observed. Both
MaiMwana and MaiKhanda represent rural Malawian populations, but at slightly different times and within a period of rapid
increase in institutional deliveries.36 More births occurred in
facilities in MaiKhanda than in MaiMwana (table 1). Given that
home deliveries are associated with less hygienic practices and
higher rates of infectious causes of neonatal death,46 the higher
proportion of institutional delivery in MaiKhanda may partly
explain the differences in cause-specific mortality. A similar
Fottrell E, et al. Arch Dis Child Fetal Neonatal Ed 2015;0:F1–F9. doi:10.1136/archdischild-2014-307636
F3
F4
12
Village development committee: population ∼7000
8819
10 029
15 299*
6735
42 241
15 258
22 563*
Ekjut, rural India
SNEHA, urban India
Dhanusha, Nepal
Makwanpur, Nepal
PCP, rural Bangladesh
MaiMwana, Malawi
MaiKhanda, Malawi
270
80
463
146
1361
324
612
(34%)
(48%)
(47%)
(42%)
(51%)
(46%)
(46%)
Stillbirths included
(proportion of all deaths)
*Estimated from available data.
PCP, Perinatal Care Project; SNEHA, Society for Nutrition, Education and Health Action.
Live births
included
Neonatal verbal autopsies (VA) included in the study
Study site
Table 2
Jun 2004–Jan 2011
Jun 2007–Dec 2010
24
31 (sample of 4000
from each cluster)
518 (66%)
87 (52%)
528 (53%)
203 (58%)
1324 (49%)
382 (54%)
730 (54%)
92%*
86%30
83%17
98%*
18
70% (51)
59
9
35
30
31
25
32
Total
68
10
39
36
36
29
35
Male
50
7
30
24
27
21
30
Female
Very
low
Very
low
Very
low
High
High
Low
High
Malaria
Very
low
Very
low
Very
low
Very
low
High
High
Very
low
HIV
InterVA disease
prevalence
settings
1.4
1.3
1.3
1.5
1.3
1.4
1.2
(1.1
(0.8
(1.1
(1.1
(1.2
(1.1
(1.0
to
to
to
to
to
to
to
1.6)
2.1)
1.5)
2.0)
1.5)
1.7)
1.4)
Crude neonatal mortality
rate ratio (male: female) (95% CI)
37%–44%19
50%–67%20
16%–28%17 18
2%23
26%63
87%21
20%
60%44
98%
22
Estimated %
institutional births
during data collection
22
VA completion rate
as proportion of
recorded neonatal
deaths (reference)
Neonatal mortality rate (per 1000 live
births)
Nov 2004–Jul 2011
Apr 2001–Oct 2008
9
Neonatal deaths included
(proportion of all deaths)
*Estimated from available data.
PCP, Perinatal Care Project; SNEHA, Society for Nutrition, Education and Health Action; VA, verbal autopsies.
Union (lowest administrative unit): population 25 000–
30 000
Census enumeration area: population ∼3000
Health centre catchment area: population ∼30 000
30
Village development committee: population ∼8000
Jun 2006–Apr 2011
Oct 2005–Feb 2010
24
Dhanusha—rural Nepal: district excluding Janakpur
municipality26
Makwanpur—rural Nepal: village development committee
areas in Makwanpur district23
(PCP—rural Bangladesh: nine unions in three rural districts
(Bogra, Faridpur and Moulavibazar)17 18
MaiMwana—rural Malawi: Mchinji district19 29
MaiKhanda—rural Malawi: three districts in central region
(Kasungu, Lilongwe and Salima)20
Aug 2005–Jul 2008
18
Ekjut—rural India: three rural districts in Jharkhand
(Saraikela Kharsawan, West Singhbhum) and Odisha
(Keonjhar)22
SNEHA—urban India: six municipal wards in Mumbai21
Clusters included
Period of mortality
surveillance
8–10 villages with residents classified as tribal/
scheduled caste or other backward caste: average
population 6338
Slum area: population ∼1000 residents
Cluster definition
Study populations in descending order of neonatal mortality rate
Study site and area description
Table 1
Downloaded from http://fn.bmj.com/ on July 6, 2015 - Published by group.bmj.com
Global child health
Fottrell E, et al. Arch Dis Child Fetal Neonatal Ed 2015;0:F1–F9. doi:10.1136/archdischild-2014-307636
Downloaded from http://fn.bmj.com/ on July 6, 2015 - Published by group.bmj.com
2.0
14.3
9.4
25.7
26.8
1.1
8.6
8.4
1.2
14.9
9.1
25.2
24.1
1.7
8.6
7.8
6.89
9.8
5.1
10.0
Study strengths and limitations
8.2
9.6
1.7
23.3
8.5
33.5
24.7
2.4
19.6
8.9
30.9
25.0
1.2
26.2
8.1
35.5
24.4
25.2
2.7
13.9
9.7
26.3
29.3
0.5
8.5
9.0
29.4
32.7
scenario may also explain differences observed between
Makwanpur (2% facility deliveries) and Dhanusha (26% facility
deliveries) in Nepal. However, the different time periods for
data collection and contextual differences between the plains of
Dhanusha and the hills of Makwanpur may also be important.
Finally, the substantial difference in the proportion of deaths
with insufficient VA data to attribute a specified cause (categorised as ‘indeterminate’ and ‘other unspecified’ in table 3)
suggests that observed differences in cause distribution may also
relate to underlying differences in VA data completeness.
1.2
29.9
7.2
38.3
16.6
9.1
7.9
19.2
1.2
21.0
8.4
30.5
18.1
7.6
7.6
24.4
1.7
12.4
ICD, International Classification of Diseases; PCP, Perinatal Care Project; SNEHA, Society for Nutrition, Education and Health Action.
1.2
35.7
6.5
43.4
15.6
10.1
8.2
15.9
1.1
24.6
14.2
39.9
30.1
1.9
5.4
7.8
1.3
25.6
16.3
43.1
29.0
2.7
4.4
7.9
1.0
24.0
12.7
37.6
31.0
1.3
6.2
7.7
1.6
21.9
3.9
27.4
35.6
0.9
2.1
11.6
2.4
20.6
1.3
24.3
29.4
2.3
2.7
10.4
1.1
22.8
5.6
29.5
39.8
31.3
10.01 prematurity
01.04 diarrhoeal diseases
01.07 meningitis and encephalitis
10.03 neonatal pneumonia
10.04 neonatal sepsis
Infections (01.04+01.07+10.03+10.04)
10.02 birth asphyxia
10.06 congenital malformation
10.99 other and unspecified
99 indeterminate
5.0
19.6
9.0
33.6
22.9
0.7
1.2
10.4
34.2
0.5
4.0
19.0
8.5
32.1
21.6
0.9
1.3
9.9
32.5
0.2
4.6
19.4
8.8
32.9
22.4
0.8
1.2
10.2
16.8
30.8
22.4
16.4
12.9
14.9
7.0
11.7
8.8
12.1
0.2
2.1
29.9
5.9
38.0
23.7
3.2
7.6
15.4
13.0
0.2
1.6
29.9
6.4
38.1
25.5
2.6
6.3
14.6
12.5
0.2
1.9
29.9
6.1
38.0
24.4
3.0
7.1
15.1
22.3
28.9
26.4
Total
F
M
Total
F
M
Total
F
M
Total
F
M
Total
F
M
Total
F
M
Total
F
M
PCP, Bangladesh
Makwanpur, Nepal
Dhanusha, Nepal
SNEHA, urban India
Ekjut, rural India
Cause and corresponding ICD classification
Table 3
Cause and sex-specific neonatal mortality fractions and corresponding International Classification of Diseases V.10 (ICD-10) code
MaiMwana, Malawi
MaiKhanda, Malawi
Global child health
The prospective birth and death surveillance systems, high
follow-up rate for completion of VAs, data quality procedures
and large sample size are the strengths of the study. There
remains a potential bias if certain neonatal deaths were systematically unsuccessfully followed up for VA, but we do not expect
this given that the sum of the VA-derived CSMRs closely
approximated total mortality rates derived from surveillance in
the same areas.17–23 The use of InterVA is also a strength in that
it allows identification of multiple causes of death per case with
quantified degrees of certainty, provides confidence that
observed differences are not a consequence of differing methods
of assigning causes and has been shown to compare well with
available reference standards for cause of death in a range of settings,47 including perinatal death classifications.48 Indeed, the
CSMFs identified by InterVA for Dhanusha and SNEHA were
similar to those derived by physician review.44 49 Cause distributions were also similar between InterVA and physician interpretation of neonatal VA data from Ekjut and PCP (unpublished
data). However, physicians at PCP identified asphyxia as the
leading cause of death, and Ekjut physicians attributed a substantial number of neonatal deaths to hypothermia, which is not
one of the causes included in the 2012 WHO VA standards and,
therefore, in InterVA, which may have largely classified such
deaths as ‘indeterminate’.
Several methodological limitations might have influenced the
cause distributions observed. The specific questionnaires used at
each site, though similar, were not exactly the same, and the
period between neonatal death and VA interview differed. In
addition to the potential biases inherent in survey methods and
maternal reporting,50 51 these differences may have influenced
VA respondents’ ability to recognise, recall and report signs and
symptoms. They may also partly explain the differing mean
number of non-missing indicators reported per case in each
setting, ranging from 12 in MaiKhanda to 17 in Bangladesh.
Similarly, it is possible that the processing of common questions
into site-specific translations for InterVA may have led to subtle
differences in meaning and comprehension. Although there is no
empirical evidence on the effect of such factors on VA-derived
causes of death, and InterVA was designed with the reality of different VA data collection tools in mind (eg, only affirmative
reports of the presence of indicators influence cause probabilities), the possibility that differing cause distributions are driven
by differing data capture methods cannot be ruled out.
Comparisons with other studies
In general, our analysis supports current modelled characterisations of neonatal mortality at an aggregate level.45 Our causedistribution findings are also similar in magnitude and rank
order to survey results reported elsewhere for comparable settings,44 49 52 53 and are broadly similar to descriptions of neonatal mortality from 18 INDEPTH health and demographic
surveillance sites using similar methods.54 There are some
Fottrell E, et al. Arch Dis Child Fetal Neonatal Ed 2015;0:F1–F9. doi:10.1136/archdischild-2014-307636
F5
Downloaded from http://fn.bmj.com/ on July 6, 2015 - Published by group.bmj.com
Global child health
Figure 1 Total and cause-specific neonatal mortality rates by study site ordered left to right by decreasing neonatal mortality rate. Superimposed
numbers represent cause-specific mortality fractions (CSMFs) (%) for each site.
PCP, Perinatal Care Project; SNEHA, Society for Nutrition, Education and Health Action.
notable exceptions. Chowdhury et al55 identified birth asphyxia
as the leading cause among 365 neonatal deaths in Matlab, rural
Bangladesh, accounting for 45% of the total burden, whereas
infection-related causes accounted for less than 20% of deaths.
This contrasts with our findings from Bangladesh, which attributed approximately one-quarter of deaths to asphyxia and a
much higher proportion to infections. Conversely, comparisons
of our findings with public domain INDEPTH data56 for 1619
and 207 neonatal deaths from Bangladesh and India, respectively, identify higher CSMFs of asphyxia and lower proportions
of other unspecified/indeterminate causes in our data. While it
is possible that such differences reflect varying epidemiology
and rates of skilled attendance at birth between different areas,
it is also conceivable that they are an artefact of differing VA
survey methods. The Matlab study, for example, had a relatively
small sample size, and VA interpretation was by a panel of physicians required to reach consensus on a single cause of death for
each case.55 Neonatal causes of death can be difficult to attribute with certainty, depending on clinical factors and issues of
definition; a recent analysis showed a fivefold difference in the
proportion of deaths attributed to prematurity depending on
definition used.57 As such, identifying a single direct cause of
death from VA may be unrealistic and masks the uncertainty
that may have been evident in the original physicians’ consideration of individual cases. Our method, and that used by the
INDEPTH group, of calculating population-level CSMFs and
splitting deaths between multiple causes is arguably a more
F6
epidemiological approach that shifts the focus from individuals
to populations.58 This fundamental methodological difference
may explain the lower overall proportion of asphyxia deaths
observed in the INDEPTH datasets as well as ours compared
with the study by Chowdhury et al.55 Given that both PCP and
the INDEPTH data were interpreted using InterVA V.4.02
however, differences between these datasets must be due to
other reasons, possibly underlying differences in the time and
location of the surveys, or differences in VA data capture.
Programmatic implications
At all study sites, stillbirths accounted for a large proportion of
deaths in the extended perinatal period. The estimates in our
data ranged from 34% in Ekjut, India, to 51% in PCP,
Bangladesh. All methods used to distinguish stillbirths from
early neonatal deaths are open to misclassification bias, influenced by sociocultural factors and limited assessment of vital
signs or attempts at resuscitation in apparently lifeless newborns,
particularly after home birth.59 Misclassification bias notwithstanding, the burden of stillbirths remains high and is likely to
reflect inadequacies in skilled attendance at birth and the availability of emergency obstetric care and caesarean sections.
The neonatal cause-of-death distributions described here have
important programmatic implications. High levels of infection
and prematurity-related deaths imply that essentials of hygienic
delivery and newborn care, including thermal care, remain priorities. Preventative strategies that target maternal health,
Fottrell E, et al. Arch Dis Child Fetal Neonatal Ed 2015;0:F1–F9. doi:10.1136/archdischild-2014-307636
Downloaded from http://fn.bmj.com/ on July 6, 2015 - Published by group.bmj.com
Global child health
Figure 2 Cause-specific mortality fractions (CSMFs) by day of death and study site ordered left to right by decreasing neonatal mortality rate.
PCP, Perinatal Care Project; SNEHA, Society for Nutrition, Education and Health Action.
recognising the importance of nutrition and vector-borne diseases such as malaria, a major cause of anaemia in malaria
endemic regions, must also be prioritised. At the same time, the
major burden of asphyxia mortality demands a focus on the
intrapartum period, with improved capacity within facilities to
manage obstetric complications and awareness of the importance of skilled attendance at birth among communities and
expectant mothers. Given the high rates of home births, intervention strategies must think beyond the biomedical aspects of
mortality described by VA results and consider the distal, social
determinants of mortality and the three delays model.60 In this
regard, there is a clear need to focus on community
interventions for newborn health that also encompass the health
of the mother and the continuum of preconception, pregnancy
and the intrapartum and postpartum periods, and which
promote hygienic practices, thermal care, the recognition of
danger signs and appropriate care-seeking. There is a growing
body of evidence suggesting that cost-effective community interventions achieving impact on neonatal mortality should be
scaled up as a matter of urgency.24 61 62
CONCLUSION
The application of simple mortality surveillance and VA
methods in localised, low-income and middle-income settings
Fottrell E, et al. Arch Dis Child Fetal Neonatal Ed 2015;0:F1–F9. doi:10.1136/archdischild-2014-307636
F7
Downloaded from http://fn.bmj.com/ on July 6, 2015 - Published by group.bmj.com
Global child health
reveals important regional and subnational variation in the epidemiology of neonatal mortality that may be masked by aggregate or modelled estimates. Although population health survey
and VA approaches are likely to be imperfect compared with
complete vital registration and medical cause of death certification, methodological advances enable the generation of timely,
low-cost and consistent cause-specific mortality estimates necessary to direct local policy in settings with little or no existing
data. The wider application of these methods beyond research
settings to better inform and strengthen health systems is a
global priority. However, it is not for lack of data that the
burden of neonatal mortality remains so high; efforts must
focus on implementing proven interventions to protect the three
million newborns who die every year.
Author affiliations
1
University College London, Institute for Global Health, London, UK
2
Diabetic Association of Bangladesh, Perinatal Care Project, Dhaka, Bangladesh
3
Society for Nutrition, Education and Health Action, Mumbai, India
4
Parent and Child Health Initiative, Lilongwe, Malawi
5
Mother and Infant Research Activities, Kathmandu, Nepal
6
Ministry of Health, Government of Malawi, Lilongwe, Malawi
7
Ekjut, Chakradharpur, India
8
MaiMwana Project, Mchinji, Malawi
3
4
5
6
7
8
9
10
11
12
13
14
15
16
Twitter Follow Edward Fottrell at @fottrell
Acknowledgements The authors gratefully acknowledge fieldwork, coordination
and management teams in the Perinatal Care Project, Bangladesh; the Society for
Nutrition, Education and Health Action, India; the Parent and Child Health Initiative,
Malawi; Mother and Infant Research Activities, Nepal; Ekjut, India; and the
MaiMwana Project, Malawi, for their crucial role in data acquisition.
17
18
Contributors EF conceived the study, carried out analysis and wrote the first draft
of the manuscript. DO, GA, UB, SD and NSM led data capture activities and data
processing in Mumbai. EF, KA and JB led data capture activities and data processing
in Bangladesh. AB, TC, CK, CM, BN, TP and BS led data capture activities and data
processing and interpretation in Malawi. DM, SM, JM, NSa, AS, BPS, KMT and JB
led data capture activities and data processing and interpretation in Nepal. NN and
AP led data capture activities and data processing in Ekjut, rural India. MN and NSe
contributed to data pooling and processing. AC established the international
collaboration between all partners and helped to design the analysis plan. EF, AP,
DO, TC, MN and NN provided technical oversight to analysis and interpretation of
data. All authors contributed to context-specific interpretation of the results and
revisions of the manuscript.
20
Funding This work was supported by a Wellcome Trust Strategic Award
(085417ma/Z/08/Z).
22
19
21
Competing interests None declared.
Ethics approval The University College London or the Great Ormond Street
Hospital Research Ethics Committee, UK; the Ethical Review Committee of the
Diabetic Association of Bangladesh; the Nepal Health Research Council (with a
Memorandum of Understanding with the Government of Nepal Ministry of Health);
the Independent Ethics Committee for Research on Human Subjects (Mumbai), India;
the Malawi National Health Sciences Research Committee.
23
24
25
Provenance and peer review Not commissioned; externally peer reviewed.
Data sharing statement We will make an anonymised version of the dataset
used for the analyses in this article available to researchers upon completion of a
simple data request form, which can be obtained from Dr Audrey Prost (Audrey.
[email protected]).
26
27
Open Access This is an Open Access article distributed in accordance with the
terms of the Creative Commons Attribution (CC BY 4.0) license, which permits
others to distribute, remix, adapt and build upon this work, for commercial use,
provided the original work is properly cited. See: http://creativecommons.org/
licenses/by/4.0/
29
REFERENCES
30
1
2
F8
Lozano R, Wang H, Foreman KJ, et al. Progress towards Millennium Development
Goals 4 and 5 on maternal and child mortality: an updated systematic analysis.
Lancet 2011;378:1139–65.
Kinney MV, Kerber KJ, Black RE, et al. Sub-Saharan Africa’s Mothers, Newborns,
and Children: Where and Why Do They Die? PLoS Med 2010;7:e1000294.
28
31
Black RE, Cousens S, Johnson HL, et al. Global, regional, and national causes of
child mortality in 2008: a systematic analysis. Lancet 2010;375:1969–87.
Lawn J, Kinney M, Black R, et al. Newborn survival: a multi-country analysis of a
decade of change. Health Policy Plan 2012;27:iii6–iii28.
Oestergaard MZ, Inoue M, Yoshida S, et al. Neonatal mortality levels for 193
countries in 2009 with trends since 1990: a systematic analysis of progress,
projections and priorities. PLoS Med 2011;8:e1001080.
Jamison DT, Summers LH, Alleyne G, et al. Global health 2035: a world converging
within a generation. Lancet 2013;382:1898–955.
WHO. Every Newborn: a draft actionplan to end preventable deaths. Geneva: World
Health Organization, 2014.
Lawn JE, Blencowe H, Oza S, et al. Progress, priorities, and potential beyond
survival. Lancet 2014;384:189–205.
Lozano R, Naghavi M, Foreman K, et al. Global and regional mortality from 235
causes of death for 20 age groups in 1990 and 2010: a systematic analysis for the
Global Burden of Disease Study 2010. Lancet 2012;380:2095–128.
Byass P, de Courten M, Graham WJ, et al. Reflections on the Global Burden of
Disease 2010 Estimates. PLoS Med 2013;10:e1001477.
Mathers CD, Boerma T. Mortality measurement matters: improving data collection
and estimation methods for child and Adult Mortality. PLoS Med 2010;7:e1000265.
Chan M. From new estimates to better data. Lancet 2012;380:2054.
WHO. Verbal autopsy standards: the 2012 WHO verbal autopsy instruments (release
candidate 1). Geneva: WHO, 2012.
Byass P. The UN needs joined-up thinking on vital registration. Lancet 2012;380:1643.
WHO. Commission on information and accountability for Women’s and Children’s
Health: keeping promises, measuring results. Geneva: World Health Organization,
2011.
WHO. Every Woman, Every Child: strengthening equity and dignity through health:
the second report of the independent Expert Review Group (iERG) on information
and accountability for Women’s and Children’s health. Geneva: World Health
Organization, 2013.
Azad K, Barnett S, Banerjee B, et al. Effect of scaling up women’s groups on birth
outcomes in three rural districts in Bangladesh: a cluster-randomised controlled trial.
Lancet 2010;375:1193–202.
Fottrell E, Azad K, Kuddus A, et al. The effect of increased coverage of participatory
women’s groups on neonatal mortality in Bangladesh: a cluster randomized trial.
JAMA Pediatr 2013;167:816–25.
Lewycka S, Mwansambo C, Rosato M, et al. Effect of women’s groups and
volunteer peer counsellors on mortality, morbidity and health behaviours among
mothers and children in rural Malawi: the MaiMwana cluster randomised controlled
trial. Lancet 2013;381:1721–35.
Colbourn T, Nambiar B, Bondo A, et al. Effects of quality improvement in health
facilities and community mobilisation through women’s groups on maternal,
neonatal and perinatal mortality in three districts of Malawi: MaiKhanda, a cluster
randomised controlled effectiveness trial. Int Health 2013;5:180–95.
More NS, Bapat U, Das S, et al. Community Mobilization in Mumbai Slums to
Improve Perinatal Care and Outcomes: A Cluster Randomized Controlled Trial.
PLoS Med 2012;9:e1001257.
Tripathy P, Nair N, Barnett S, et al. Effect of a participatory intervention with
women’s groups on birth outcomes and maternal depression in Jharkhand and
Orissa, India: a cluster-randomised controlled trial. Lancet 2010;375:1182–92.
Manandhar DS, Osrin D, Shrestha BP, et al. Effect of a participatory intervention
with women’s groups on birth outcomes in Nepal: cluster-randomised controlled
trial. Lancet 2004;364:970–9.
Prost A, Colbourn T, Seward N, et al. Women’s groups practising participatory
learning and action to improve maternal and newborn health in low-resource
settings: a systematic review and meta-analysis. Lancet 2013;381:1736–46.
Azad K. The impact of TBA resuscitation training on early neonatal mortality in
Bangladesh: results and implications. Presentation from Towards 4+5 conference;
25–26 May 2010. London, UK: DfID, 2010.
Shrestha BP, Bhandari B, Manandhar DS, et al. Community interventions to reduce
child mortality in Dhanusha, Nepal: study protocol for a cluster randomized
controlled trial. Trials 2011;12:136.
Osrin D, Manandhar A, Shrestha A, et al. Design of a surveillance system for
pregnancy and its outcomes in rural Nepal. J Nepal Med Assoc 2003;41:411–22.
Barnett S, Nair N, Tripathy P, et al. A prospective key informant surveillance system
to measure maternal mortality—findings from indigenous populations in Jharkhand
and Orissa, India. BMC Pregnancy & Childbirth 2008;8:6.
Lewycka S, Mwansambo C, Kazembe P, et al. A cluster randomised controlled trial
of the community effectiveness of two interventions in rural Malawi to improve
health care and to reduce maternal, newborn and infant mortality. Trials
2010;11:88.
Colbourn T, Nambiar B, Costello A. MaiKhanda—Final evaluation report.
The impact of quality improvement at health facilities and community mobilisation
by women’s groups on birth outcomes: an effectiveness study in three districts of
Malawi. London: The Health Foundation, 2013.
Fottrell E, Byass P. Verbal autopsy: methods in transition. Epidemiol Rev
2010;32:38–55.
Fottrell E, et al. Arch Dis Child Fetal Neonatal Ed 2015;0:F1–F9. doi:10.1136/archdischild-2014-307636
Downloaded from http://fn.bmj.com/ on July 6, 2015 - Published by group.bmj.com
Global child health
32
33
34
35
36
37
38
39
40
41
42
43
44
45
46
47
Fottrell E, Byass P, Ouedraogo T, et al. Revealing the burden of maternal mortality:
a probabilistic model for determining pregnancy-related causes of death from verbal
autopsies. Popul Health Metr 2007;5:1.
Byass P, Chandramohan D, D’Ambruoso L, et al. Strengthening standardized
interpretation of verbal autopsy data: the new InterVA-4 tool. Global Health Action
2012;5:1–8.
InterVA. User Guide.
Fottrell E, Kahn K, Tollman SM, et al. Probabilistic methods for verbal autopsy
interpretation: InterVA robustness in relation to variations in a priori probabilities.
PLoS ONE 2011;6:e27200.
National Statistical Office (NSO) and ICF Macro. Malawi Demographic and Health
Survey 2010. Zomba, Malawi, and Calverton, Maryland, USA: NSO and ICF Macro,
2011.
Lawn J, Kerber K, Enweronu-Laryea C, et al. 3.6 million neonatal deaths—what is
progressing and what is not? Semin Perinatol 2010;34:371–86.
Rosenstock S, Katz J, Mullany L, et al. Sex differences in neonatal mortality in
Sarlahi, Nepal: the role of biology and environment. J Epidemiol Community Health
2013;67:986–91.
Lawn J, Blencowe H, Darmstadt G, et al. Beyond newborn survival: the world you
are born into determines your risk of disability-free survival. Pediatr Res
2013;74:1–3.
Lee A, Kozuki N, Blencowe H, et al. Intrapartum-related neonatal encephalopathy
incidence and impairment at regional and global levels for 2010 with trends from
1990. Pediatr Res 2013;74(Suppl 1):50–72.
Seale A, Blencowe H, Zaidi A, et al. Neonatal severe bacterial infection impairment
estimates in South Asia, sub-Saharan Africa, and Latin America for 2010. Pediatr
Res 2013;74(Suppl 1):73–85.
Krishnan A, Ng N, Kapoor S, et al. Temporal trends and gender differentials in
causes of childhood deaths at Ballabgarh, India—need for revisiting child survival
strategies. BMC Public Health 2012;12:555.
March of Dimes, PMNCH, Save the Children, WHO. Born Too Soon: The Global
Action Report on Preterm Birth. In Howson CP, Kinney MV, Lawn JE, eds. Geneva:
World Health Organization, 2012.
Bapat U, Alcock G, More N, et al. Stillbirths and newborn deaths in slum
settlements in Mumbai, India: a prospective verbal autopsy study. BMC Pregnancy
Childbirth 2012;12:39.
Bhutta ZA, Black RE. Global maternal, newborn and child health—so near yet so
far. N Engl J Med 2013;639:2226–35.
Seward N, Osrin D, Li L, et al. Association between clean delivery kit use, clean
delivery practices, and neonatal survival: pooled analysis of data from three sites in
South Asia. PLoS Med 2012;9:e1001180.
Byass P, Herbst A, Fottrell E, et al. Comparing verbal autopsy cause of death
findings as determined by physician coding and probabilistic modelling:
a public health analysis of 54,000 deaths in Africa and Asia. J Glob Health
2015;5:010402.
48
49
50
51
52
53
54
55
56
57
58
59
60
61
62
63
Vergnano S, Fottrell E, Osrin D, et al. Adaptation of a probabilistic method (InterVA)
of verbal autopsy to improve the interpretation of cause of stillbirth and neonatal
death in Malawi, Nepal and Zimbabwe. Popul Health Metr 2011;9:48.
Manandhar S, Ojha A, Manandhar D, et al. Causes of stillbirths and neonatal
deaths in Dhanusha district, Nepal: a verbal autopsy study. Kathmandu Univ Med J
(KUMJ) 2010;8:62–72.
Yoder P, Rosato M, Mahmud R, et al. Women’s recall of delivery and neonatal care:
a study of terms, concepts and survey questions. Calverton, Maryland, USA: ICF
Macro, 2010.
Snow RW, Basto de Azevedo I, Forster D, et al. Maternal recall of symptoms associated
with childhood deaths in rural east Africa. Int J Epidemiol 1993;22:677–83.
Baqui AH, Darmstadt GL, Williams EK, et al. Rates, timing and causes of neonatal
deaths in rural India: implications for neonatal health programmes. Bull World
Health Organ 2006;84:706–13.
Khanal S, Gc V, Dawson P, et al. Verbal autopsy to ascertain causes of neonatal
deaths in a community setting: a study from Morang, Nepal. JNMA J Nepal Med
Assoc 2011;51:21–7.
Streatfield P, Khan W, Bhuiya A, et al. Cause-specific childhood mortality in Africa
and Asia: evidence from INDEPTH health and demographic surveillance systems.
Glob Health Action 2014;7:25363.
Chowdhury H, Thompson S, Ali M, et al. Causes of neonatal deaths in a rural
subdistrict of Bangladesh: implications for intervention. J Health Popul Nutr
2010;28:375–82.
INDPETH. Africa, Asia, Oceania—INDEPTH Network Cause-Specific Mortality—
Release 2014. 2014. http://www.indepth-ishare.org/index.php/catalog/48
Byass P. Usefulness of the Population Health Metrics Research Consortium gold
standard verbal autopsy data for general verbal autopsy methods. BMC Med
2014;12:23.
Byass P, Kahn K, Fottrell E, et al. Moving from data on deaths to public health
policy in Agincourt, South Africa: approaches to analysing and understanding verbal
autopsy findings. PLoS Med 2010;7:e1000325.
Fron J, Gordin S, Abdel-Aleem H, et al. Making stillbirths count, making numbers talk
—issues in data collection for stillbirths. BMC Pregnancy Childbirth 2009;9:58.
Upadhyay R, Krishnan A, Rai S, et al. Need to focus beyond the medical causes:
a systematic review of the social factors affecting neonatal deaths. Paediatr Perinatal
Epidemiol 2014;28:127–37.
Kirkwood B, Manu A, ten Asbroek A, et al. Effect of the Newhints home-visits
intervention on neonatal mortality rate and care practices in Ghana: a cluster
randomised controlled trial. Lancet 2013;381:2184–92.
Lawn J, Mwansa-Kambafwile J, Horta B, et al. ‘Kangaroo mother care’ to prevent
neonatal deaths due to preterm birth complications. Int J Epidemiol 2010;39(suppl
1):i144–i54.
Clarke K, Saville N, Shrestha B, et al. Predictors of psychological distress among
postnatal mothers in rural Nepal: A cross-sectional community-based study. J Affect
Disord 2014;156:76–86.
Fottrell E, et al. Arch Dis Child Fetal Neonatal Ed 2015;0:F1–F9. doi:10.1136/archdischild-2014-307636
F9
Downloaded from http://fn.bmj.com/ on July 6, 2015 - Published by group.bmj.com
Cause-specific neonatal mortality: analysis of
3772 neonatal deaths in Nepal, Bangladesh,
Malawi and India
Edward Fottrell, David Osrin, Glyn Alcock, Kishwar Azad, Ujwala Bapat,
James Beard, Austin Bondo, Tim Colbourn, Sushmita Das, Carina King,
Dharma Manandhar, Sunil Manandhar, Joanna Morrison, Charles
Mwansambo, Nirmala Nair, Bejoy Nambiar, Melissa Neuman, Tambosi
Phiri, Naomi Saville, Aman Sen, Nadine Seward, Neena Shah Moore,
Bhim Prasad Shrestha, Bright Singini, Kirti Man Tumbahangphe, Anthony
Costello and Audrey Prost
Arch Dis Child Fetal Neonatal Ed published online May 13, 2015
Updated information and services can be found at:
http://fn.bmj.com/content/early/2015/05/13/archdischild-2014-307636
These include:
Supplementary Supplementary material can be found at:
Material http://fn.bmj.com/content/suppl/2015/05/13/archdischild-2014-307636
.DC1.html
References
This article cites 50 articles, 6 of which you can access for free at:
http://fn.bmj.com/content/early/2015/05/13/archdischild-2014-307636
#BIBL
Open Access
This is an Open Access article distributed in accordance with the terms of
the Creative Commons Attribution (CC BY 4.0) license, which permits
others to distribute, remix, adapt and build upon this work, for commercial
use, provided the original work is properly cited. See:
http://creativecommons.org/licenses/by/4.0/
Email alerting
service
Receive free email alerts when new articles cite this article. Sign up in the
box at the top right corner of the online article.
Topic
Collections
Articles on similar topics can be found in the following collections
Open access (39)
Epidemiologic studies (862)
Injury (164)
Trauma (173)
Pregnancy (1483)
To request permissions go to:
http://group.bmj.com/group/rights-licensing/permissions
To order reprints go to:
http://journals.bmj.com/cgi/reprintform
To subscribe to BMJ go to:
http://group.bmj.com/subscribe/
Downloaded from http://fn.bmj.com/ on July 6, 2015 - Published by group.bmj.com
Notes
To request permissions go to:
http://group.bmj.com/group/rights-licensing/permissions
To order reprints go to:
http://journals.bmj.com/cgi/reprintform
To subscribe to BMJ go to:
http://group.bmj.com/subscribe/


© Copyright 2026