
School Breakfast Program - Food Research and Action Center
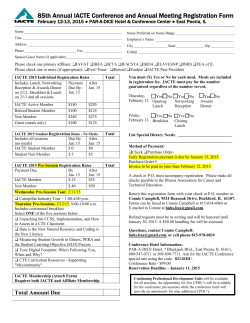
SCHOOL BREAKFAST PROGRAM: TRENDS AND FACTORS AFFECTING STUDENT PARTICIPATION About FRAC The Food Research and Action Center (FRAC) is the leading national organization working for more effective public and private policies to eradicate domestic hunger and undernutrition. For more information about FRAC, or to sign up for FRAC’s electronic publications, including our monthly Meals Matter: School Breakfast newsletter, go to: www.frac.org. For information about the School Breakfast Program, go to: http://frac.org/federal‐foodnutrition‐ programs/school‐breakfast‐program/ New, Improved School Breakfast Nutrition Standards Have Not Adversely Affected Student Participation in the Program The Healthy, Hunger‐Free Kids Act of 2010 made sweeping improvements to the school nutrition landscape, improving all foods provided or sold in schools. In recent months, a number of claims have been made that the new standards have caused decreases in participation by students in the federally‐funded school meals programs. This report is a companion analysis to one released by the Food Research and Action Center in January 2015, which showed that implementation of the new lunch nutrition standards – beginning in the 2012‐2013 school year – had not significantly changed student participation trends of long standing: one continuing trend that began in the 2007‐2008 school year was year‐after‐year gains in the number of low‐income children eating free and reduced‐priced school lunches; and the other ongoing trend was year‐after‐year declines in the number of other children paying for most of the cost of their lunches, commonly referred to as “paid meals.” In this report we look at what has happened to school breakfast participation, and whether the new introduction of better nutrition standards appear to have affected participation trends in this program. Average Daily Participation in the School Breakfast Program School Years 2004‐2014 12,000,000 Great Recession Millions of Children 10,000,000 School Nutrition Standards Began 8,000,000 6,000,000 4,000,000 2,000,000 0 Free Reduced Data Source: U.S. Department of Agriculture, Food and Nutrition Service Paid School Breakfast Program: Trends and Factors Affecting Student Participation | Page 1 The implementation of new school breakfast nutrition improvements began a year later than the lunch improvements did – a deliberate U.S. Department of Agriculture (USDA) decision to help schools phase in the new rules – so this report looks at a year and three months post‐implementation data, while the school lunch report looked at two years of post‐implementation data. But the breakfast data are even more unequivocal than the lunch data: there is no evident measurable negative impact of the new rules on breakfast participation. In particular: Free and reduced‐price breakfast participation continued growing rapidly as the new nutrition standards were implemented. “Paid” student participation remained essentially stable both before and after the new breakfast standards were implemented. Participation Trends Since 2004 The table below looks at average breakfast participation for different categories of students since the 2004‐ 2005 school year through the 2013‐2014 school year: School Year 2004‐2005 2005‐2006 2006‐2007 2007‐2008 2008‐2009 2009‐2010 2010‐2011 2011‐2012 2012‐2013 2013‐2014 Free 6,656,763 6,847,613 7,151,829 7,421,243 7,788,013 8,404,764 8,845,874 9,506,804 9,844,444 10,168,928 Reduced 839,871 892,291 978,628 1,036,618 1,058,077 1,028,521 941,593 1,019,533 992,730 987,474 Free and Reduced 7,496,634 7,739,904 8,130,457 8,457,861 8,846,090 9,433,285 9,787,467 10,526,336 10,837,174 11,156,405 Paid 1,670,716 1,818,595 1,988,336 2,087,695 2,000,619 1,902,512 1,949,397 2,005,437 1,977,987 2,033,565 *The dotted line represents introduction of the first wave of breakfast standards. What these data show is that annual rates of children eating free and reduced‐price breakfast rose steadily throughout the period. Participation grew by about 300,000‐400,000 low‐income students per year from 2005‐2006 to 2008‐2009 and again in the 2010‐2011 and 2012‐2013 school years. Two schools years, 2009‐2010 and 2011‐2012, in the early part of the recession and recovery, had even bigger jumps in low‐income student participation, nearly 600,000 and over 700,000 respectively. The annual data for “paid” breakfast also show no effect from the nutrition standards. The numbers remained relatively stable with small increases in participation leading up to the recession, followed by small decreases in participation during the first two years of the recession. Participation began slightly increasing again in the 2010‐2011 school year, dropped by a very small margin in the 2012‐2013 school year before any new nutrition standards were implemented for breakfast, and then grew slightly the school year that the first set of new nutrition standards for breakfast were implemented. These slight shifts in School Breakfast Program: Trends and Factors Affecting Student Participation | Page 2 annual participation all together meant an increase in paid school breakfast participation of 22 percent from the 2004‐2005 school year to the 2013‐2014 school year. FRAC also has looked at the available data from the U.S. Department of Agriculture (USDA) for the early months of the 2014‐2015 school year (September, October and November). This school year has seen the phase‐in of the second part of the breakfast rules. Appendix A shows September, October and November data for each year from 2004 through 2014. Again the numbers demonstrate that the new standards have not driven down participation. Free and reduced‐price participation grew substantially in each month by several hundred thousand in these months in 2014 compared to the same months in 2013 (and the monthly numbers were higher in 2013 than in 2012), and paid participation remained stable. Average Daily Participation in the School Breakfast Program 2004‐2014 12,000,000 September November October 10,000,000 Millions of Children 8,000,000 6,000,000 4,000,000 2,000,000 2004 2005 2006 2007 2008 2009 2010 2011 2012 2013 2014 2004 2005 2006 2007 2008 2009 2010 2011 2012 2013 2014 2004 2005 2006 2007 2008 2009 2010 2011 2012 2013 2014 0 Free Reduced Paid Data Source: U.S. Department of Agriculture, Food and Nutrition Service There are several reasons why the pace of breakfast growth in recent years was smoother for both free and reduced‐price children and more stable for “paid” children than it has been for school lunch: School lunch participation for paid lunches was driven down in recent years by the requirement that schools phase in price increases in lunch for paying students in order to assure that families not eligible for free or reduced‐price meals are paying the actual cost of the lunch (minus a small federal reimbursement). This “paid lunch equity” provision created in the Healthy, Hunger‐Free Kids Act of 2010 had the (largely unintended) effect of driving children out of the school lunch program both before and during the years that the new nutrition standards took effect. There is no comparable “paid breakfast equity” requirement. As discussed at length in FRAC’s school lunch report, research School Breakfast Program: Trends and Factors Affecting Student Participation | Page 3 from USDA, the School Nutrition Association, the Government Accountability Office and others shows that raising prices for school lunches drives participation down among students not eligible for free‐or reduced‐price meals, but whose moderate income families struggle to pay. In 2013, 6.4 million school‐aged children lived in households with incomes between 185 and 250 percent of the poverty line – the income band where such struggles are most likely to occur. “Competitive foods” play much less of a role in pulling children away from school breakfast than school lunch. Competitive foods are those sold outside of the federal nutrition programs, including a la carte sales in the cafeteria, vending machines and student stores. Competitive foods – often unhealthy – push down federal program participation. A national study found that competitive foods, especially a la carte items, are more widely available in schools during lunch than breakfast. This study also found that children were more likely to consume competitive foods during lunch than at breakfast or other times of the day. 1 The combination of greater availability of competitive foods at lunch and the introduction of paid lunch equity changes in the years FRAC is studying – which precede new nutrition standards for competitive foods – drove paid children out of lunch but not breakfast. The phased‐in implementation of Community Eligibility has pushed up both overall breakfast and lunch participation in some schools, with the most dramatic effects on school breakfast participation. Community Eligibility allows schools with high concentrations of low‐income children to offer breakfast and lunch at no charge to all children in the school. Federal reimbursements are calculated based on the percentage of students approved for free school meals based on their participation in other means‐tested government programs such as the Supplemental Nutrition Assistance Program (SNAP) and Temporary Assistance for Needy Families (TANF). In a 2013 report by FRAC and the Center on Budget and Policy Priorities, in the initial pilot states, schools that implemented the provision for two years increased overall breakfast participation by 25 percent and lunch participation by 13 percent.2 Phase‐In of School Breakfast Standards The healthier school nutrition standards have been implemented in stages. The school lunch standards began in the 2012‐2013 school year. The first phase of the breakfast standards began in 2013‐2014, and the second phase began in the current (2014‐2015) school year. In the first breakfast phase, 2013‐2014, schools were required to initiate new standards for monitoring and menu planning, calorie limits, a requirement for half of all grains served to be whole grain‐rich, and a zero trans‐fat limit. In 2014‐2015, schools have entered the second major phase of implementation for breakfast meal pattern changes, in which schools must double the amount of fruits and vegetables offered at breakfast. In addition, this school year, both school breakfast and lunch programs moved to serving all whole grain‐rich types of breads, grains and cereals and implemented limitations on overall sodium levels. For more information, see http://www.fns.usda.gov/sites/default/files/implementation_timeline.pdf 1 Fox, M. K., Gordon, A., Nogales, R., & Wilson, A. (2009). Availability and consumption of competitive foods in US public schools. Journal of the American Dietetic Association, 109(2 Supplement 1), S57‐S66. 2 FRAC and Center on Budget and Policy Priorities, Community Eligibility: Making High‐Poverty Schools Hunger Free, www.frac.org/pdf/community_eligibility_report_2013.pdf School Breakfast Program: Trends and Factors Affecting Student Participation | Page 4 School breakfast participation historically has been significantly lower than school lunch. In the 2013‐ 2014 school year, 21 million low‐income children participated in school lunch compared to only 11.2 million in school breakfast. This lower participation creates more room for program growth. The growing number of schools implementing alternative breakfast models, such as breakfast in the classroom and grab‐and‐go often in conjunction with offering breakfast for free to all students through Community Eligibility or Provision 2, is having a positive impact on participation levels. In addition, there are several notable factors that have increased participation in school breakfast and lunch and have significantly contributed to participation trends in both programs: The slow recovery from the recession kept the number of children eligible for free and reduced‐price meals at high levels. Since the beginning of the recession, the number of children living in poverty increased from 13.3 million in 2007 to a peak of 16.3 million in 2012, and slid to 14.7 million in 2013. Improved strategies to certify eligible children for free meals have contributed to program growth among low‐income students. One example is improvements in “direct certification” systems that use data matching from programs like SNAP and TANF to automatically certify children for free meals (both breakfast and lunch) without an application. Other Evidence of the Success of the New Nutrition Rules A poll of 500 school administrators about the new lunch rules’ implementation in the 2012‐2013 school year found 56 percent indicating that students initially complained about the healthier portions, but by the end of the school year 64 percent said few complaints remained and 70 percent said students generally liked the new lunch items. Across the school year, food consumption increased and food waste declined markedly.3 In a poll taken after the 2013‐2014 school year (two years after full implementation of the new lunch standards and the summer after the first phase of the new breakfast standards), the vast majority of parents supported strong national nutrition standards for school meals, including 91 percent supporting requiring schools to include a serving of fruits or vegetables with every meal.4 A study from researchers at the Harvard School of Public Health found that the new standards increased fruit selection by 23 percent, and increased vegetable consumption by 16 percent per student. The study also found the new standards did not result in increased average plate waste per student.5 A recently released study by the Rudd Center for Food Policy and Research at the University of Connecticut had similar findings on fruit and vegetable consumption and plate waste.6 3 Turner, L., and Chaloupka, F.J. (2014). Perceived Reactions of Elementary School Students to Changes in School Lunches after Implementation of the United States Department of Agriculture's New Meals Standards: Minimal Backlash, but Rural and Socioeconomic Disparities Exist. Child. Obes. 2014 Aug 1; 10(4): 349–356. http://www.ncbi.nlm.nih.gov/pmc/articles/PMC4121045/# Accessed on March 18, 2015. 4 Hart Research Associates and Ferguson Research Poll, “Nationwide Polling Regarding Parents’ Views of School Meal and Smart Snacks Standards, June 19 to 28, 2015, The Kids’ Safe and Healthful Food Project, www.pewtrusts.org/~/media/Assets/2014/09/KSHFNationalSchoolNutritionSurvey.pdf. Accessed on March 18, 2015. 5 Cohen, J.F., Richardson, S., Parker, E., Catalano, P.J., Rimm, E.B. (2014). Impact of the new U.S. Department of Agriculture school meal standards on food selection, consumption, and waste. Am. J. Prev. Med. 2014 Apr; 46(4):388‐94 6 Schwartz, M. B., Henderson, K. E., Read, M., Danna, N., & Ickovics, J. R. (2015). New school meal regulations increase fruit consumption and do not increase total plate waste. Child Obesity, Epub ahead of print (March 3, 2015). School Breakfast Program: Trends and Factors Affecting Student Participation | Page 5 Conclusion The breakfast data underscore – as did FRAC’s school lunch analysis ‐‐ that the new nutrition standards are not a primary cause of any significant change in school meals participation rates. As the new breakfast standards have taken effect over the last two years, long‐term breakfast trends have continued for all categories of students with participation among low‐income students increasing each year and participation among paid students remaining stable. School Breakfast Program: Trends and Factors Affecting Student Participation | Page 6 Appendix A | School Breakfast Program: How it Works Who Can Participate in the School Breakfast Program: Any student attending a school that offers the program can eat breakfast. How much, if anything, a student pays depends on family income: Children from families with incomes at or below 130 percent of the federal poverty level are eligible for free school meals. Children from families with incomes between 130 and 185 percent of the federal poverty level qualify for reduced‐price meals and can be charged no more than 30 cents per breakfast (and 40 cents per lunch). Children from families with incomes above 185 percent of the federal poverty level pay charges (referred to as “paid meals”), but schools receive a small federal reimbursement (28 cents in the 2014‐2015 school year) for such children. Charges for school breakfast are set by the school district, unlike for lunch, where federal law requires school districts to increase over time “paid lunch” charges in order to equal the difference between the small federal “paid lunch” reimbursement and the free reimbursement rate.7 How Children are Certified for Free and Reduced‐Price School Meals: Most children are certified for free or reduced‐price meals via applications collected by the school district each year. However, children in households participating in the Supplemental Nutrition Assistance Program (SNAP), Temporary Assistance for Needy Families (TANF), and the Food Distribution Program on Indian Reservations (FDPIR), as well as foster youth, migrant, homeless, or runaway youth, and Head Start participants are “categorically eligible” (automatically eligible) for free school meals and can be certified without submitting a school meal application. School districts are required to “directly certify” children in SNAP participant households for free school meals through data matching, and have the option of directly certifying other categorically eligible children as well. The Healthy, Hunger‐Free Kids Act of 2010 The Healthy, Hunger‐Free Kids Act of 2010 incorporated several key improvements, including: The Community Eligibility Provision (CEP), which allows high poverty schools to offer both breakfast and lunch at no charge to all students while eliminating the traditional school meal application process and reducing administrative work (see below); Improvements to direct certification requirements to ensure that more low‐income children are certified without an application; 7 Resource Management, 7 C.F.R. § 210.14(e)(2) (2011). (Known, as “Paid Lunch Equity,” this provision went into effect in the 2011‐2012 school year. Districts can phase in the equalization so that any one year’s increase does not exceed 10 cents per meal. Districts also can use non‐federal funds in lieu of increasing charges but there is little evidence that districts are doing so). School Breakfast Program: Trends and Factors Affecting Student Participation | Page 7 Much‐needed updates to nutrition standards based on recommendations from the Institute of Medicine; and Authorization of the U.S. Department of Agriculture (USDA) to regulate all food sold in schools, including so‐called “competitive” foods. Community Eligibility Provision and Free School Breakfast Community Eligibility allows high‐poverty schools to offer breakfast and lunch free of charge to all students and to realize significant administrative savings by eliminating school meal applications. Any district, group of schools in a district, or school with 40 percent or more “identified students”— children eligible for free school meals who are already identified by means other than an individual household application—can choose to participate. The majority of identified students are those directly certified through data matching because their households receive SNAP, TANF, or FDPIR, and in some states and areas, Medicaid benefits. Identified students also include children who are certified for free meals without an application because they are homeless, migrant, enrolled in Head Start, or in foster care. Reimbursements to the school are calculated by multiplying the percentage of identified students by 1.6 to determine the percentage of meals reimbursed at the federal free rate. For example, a school with 50 percent identified students would be reimbursed for 80 percent of the meals eaten at the free reimbursement rate (50 x 1.6 = 80), and 20 percent at the paid rate. Community Eligibility joins Provision 2 as an important option for high poverty schools to provide free breakfast and lunch to all students. Provision 2 allows schools to collect school meal applications at most once every four year cycle and provide free breakfast, lunch or both to all students. The federal reimbursement under Provision 2 is based on the percentage of students in each fee category (free, reduced‐price, or paid) that participates in school breakfast or lunch the first year the school implements Provision 2 (called the “base year”). For example, if during the base year, 80 percent of breakfasts are served to students certified for free school meals, 10 percent to students certified for reduced‐price meals, and 10 percent to paid, those percentages would be applied to the number of breakfasts served each year for the next three years. Provision 2 is an important option for schools in which the identified student percentage for Community Eligibility does not adequately reflect the poverty in the school, such as schools in states with low direct certification rates or with low SNAP enrollment. Some schools will choose to offer breakfast for free to all students or eliminate the reduced‐price co‐ payment for near poor children without utilizing one of the federal options, and this is called non‐pricing. School Breakfast Program: Trends and Factors Affecting Student Participation | Page 8 Appendix B | Average Daily Participation in the School Breakfast Program (SBP)8 Average Daily Participation in the SBP in September by year and paid‐status Free Reduced Free and Reduced Paid Sep 2004 6,559,115 792,507 7,351,622 1,633,130 Sep 2005 6,770,326 845,623 7,615,949 1,766,692 Sep 2006 7,015,343 926,276 7,941,619 1,956,529 Sep 2007 7,207,229 965,463 8,172,692 2,069,896 Sep 2008 7,655,737 1,022,367 8,678,105 2,042,340 Sep 2009 8,170,121 990,975 9,161,096 1,913,132 Sep 2010 8,824,973 942,181 9,767,154 1,983,412 Sep 2011 9,451,487 987,334 10,438,820 2,038,416 Sep 2012 9,809,953 981,998 10,791,950 2,039,993 980,243 11,285,203 2,102,719 Sep 2013 10,304,959 Sep 2014 11,012,630 882,013 11,894,643 2,094,232 Average Daily Participation in the SBP in October by year and paid‐status Free Reduced Free and Reduced Oct 2004 6,815,571 856,208 7,671,780 Oct 2005 6,979,528 902,918 7,882,446 Oct 2006 7,192,838 987,657 8,180,495 Oct 2007 7,426,675 1,045,568 8,472,243 Oct 2008 7,988,253 1,094,813 9,083,066 Oct 2009 8,471,104 1,044,077 9,515,181 Oct 2010 9,183,458 985,056 10,168,514 Oct 2011 9,676,745 1,047,787 10,724,532 Oct 2012 10,130,654 1,048,413 11,179,067 1,050,206 11,706,733 Oct 2013 10,656,527 Oct 2014 11,192,676 924,616 12,117,292 Paid 1,699,691 1,852,833 2,051,272 2,201,961 2,143,025 1,993,256 2,114,410 2,154,627 2,156,348 2,240,657 2,233,735 8 Data source: U.S. Department of Agriculture, Food and Nutrition Service School Breakfast Program: Trends and Factors Affecting Student Participation | Page 9 Average Daily Participation in the SBP in November by year and paid‐status Free Reduced Free and Reduced Paid Nov 2004 6,956,614 887,559 7,844,173 1,722,009 Nov 2005 7,180,549 935,761 8,116,309 1,875,858 Nov 2006 7,337,198 1,012,836 8,350,034 2,045,584 Nov 2007 7,635,400 1,079,327 8,714,727 2,174,291 Nov 2008 8,159,953 1,126,403 9,286,355 2,130,407 Nov 2009 8,821,082 1,087,277 9,908,359 2,001,688 Nov 2010 9,313,914 999,648 10,313,562 2,071,905 Nov 2011 9,897,202 1,079,585 10,976,787 2,124,371 Nov 2012 10,340,900 1,048,104 11,389,005 2,075,314 1,054,889 11,746,438 2,136,395 Nov 2013 10,691,548 Nov 2014 11,243,710 953,991 12,197,701 2,182,928 School Breakfast Program: Trends and Factors Affecting Student Participation | Page 10


© Copyright 2026