
DRAFT BUDGET 2015 / 2016
FRANCES BAARD DISTRICT MUNICIPALITY DRAFT BUDGET 2015 / 2016 INDEX PAGE Mayoral Budget Speech Budget Related Resolutions Executive Summary Quality Certificate Budget Tables Table A1: Budget Summary Table A2: Budgeted Financial Performance (Revenue and Expenditure by standard Classification) Table A2: Budgeted Financial Performance (Revenue and Expenditure by standard Classification) Table A3: Budgeted Financial Performance (revenue and expenditure by municipal vote) Table A3: Budgeted Financial Performance (revenue and expenditure by municipal vote) A Table A4: Budgeted Financial Performance (revenue and expenditure) Table A5: Budgeted Capital Expenditure by vote, standard classification and funding Table A5: Budgeted Capital Expenditure by vote, standard classification and funding Table A6: Budgeted Financial Position Table A7: Budgeted Cash Flows Table A8: Cash backed reserves/accumulated surplus reconciliation Table A9: Asset Management Table A10: Basic service delivery measurement Other Related Supporting Documentation Supporting Table SA1: Supporting detail to 'Budgeted Financial Performance' Supporting Table SA2: Matrix Financial Performance Budget (revenue source/expenditure type and dept.) Supporting Table SA3: Supporting detail to 'Budgeted Financial Position' Supporting Table SA4: Reconciliation of IDP strategic objectives and budget (revenue) Supporting Table SA5: Reconciliation of IDP strategic objectives and budget (operating expenditure) Supporting Table SA6: Reconciliation of IDP strategic objectives and budget (capital expenditure) Supporting Table SA7: Measurable performance objectives Supporting Table SA8: Performance indicators and benchmarks Supporting Table SA9: Social, economic and demographic statistics and assumptions Supporting Table SA10: Funding measurement Supporting Table SA11: Property rates summary Supporting Table SA12 a: Property rates by category (current year) Supporting Table SA12 b: Property rates by category (current year) Supporting Table SA13 a: Property rates by category (budget year) Supporting Table SA13 b: Property rates by category (budget year) Supporting Table SA14: Household bills Supporting Table SA15: Investment particulars by type Supporting Table SA16: Investment particulars by maturity Supporting Table SA17: Borrowing Supporting Table SA18: Transfers and grant receipts Supporting Table SA19: Expenditure on transfers and grant programme Supporting Table SA20: Reconciliation of transfers, grant receipts and unspent funds Supporting Table SA21: Transfers and grants made by the municipality Supporting Table SA22: Summary councillor and staff benefits Supporting Table SA23: Salaries, allowances & benefits (political office bearers/councillors/senior managers) Supporting Table SA24: Summary of personnel numbers Supporting Table SA25: Budgeted monthly revenue and expenditure Supporting Table SA26: Budgeted monthly revenue and expenditure (municipal vote) Supporting Table SA27: Budgeted monthly revenue and expenditure (standard classification) Supporting Table SA28: Budgeted monthly capital expenditure (municipal vote) Supporting Table SA29: Budgeted monthly capital expenditure (standard classification) Supporting Table SA30: Budgeted monthly cash flow Supporting Table SA31: Not required by FBDB - Table regarding municipal entities Supporting Table SA32: List of external mechanisms Supporting Table SA33: Contracts having future budgetary implications Supporting Table SA34a: Capital expenditure on new assets by asset class Supporting Table SA34b: Capital expenditure on the renewal of existing assets by asset class Supporting Table SA34c: Repairs and maintenance expenditure by asset class Supporting Table SA34d: Depreciation by asset class Supporting Table SA35: Future financial implications of the capital budget Supporting Table SA36: Detailed capital budget Supporting Table SA37: Projects delayed from previous financial year/s Service Delivery & Budget Implementation Plan B1 B2 B3 B5 B6 B 12 B 13 B 14 B 17 B 18 B 19 B 20 B 21 B 22 B 25 B 26 B 27 B 28 B 30 B 32 B 34 B 35 B 36 B 37 B 38 B 39 B 40 B 42 B 43 B 44 B 45 B 46 B 47 B 48 B 49 B 50 B 52 B 55 B 56 B 57 B 58 B 59 B 60 B 61 B 62 B 64 B 65 B 66 B 68 B 70 B 72 B 74 B 75 B 76 MAYORAL BUDGET SPEECH BUDGET SPEECH 2015 - 2016 FRANCES BAARD DISTRICT MUNICIPALITY Honourable Speaker, Honourable Mayors and Speakers of our Local Municipalities, Honourable Councillors, Municipal Managers, Partners in Local Government, Members of the media, Distinguished Guests, Ladies and gentlemen, Mr Speaker, I am honoured to present to the Frances Baard District the 5th budget of the current Council, what makes it even a greater honour is that I present it in the year when our country celebrates 21 years of democracy. As government, the road we have traversed over the past 21 years has not been an easy one from having to transform a government machinery which was geared towards providing basic services only to the minority and denying the millions of our people access to basic services, to having to create a growing and sustainable economy which is inclusive for all to benefit from it without prejudice. Today we introduce the budget for 2015/16, or as we refer to it, a three-year fiscal plan. Coming up with this fiscal plan has not been easy, we have worked for many months to find the right balance of measures to maintain support for our local municipalities to provide basic services to the people of this district. This budget has been a product of very careful planning and forward thinking to ensure that we do not lose sight of the identified five year Integrated Development Plan (IDP) priorities. The Municipal Systems Act 32 of 2000 requires us to ensure financially and economically viable municipalities and essentially this is guided by the IDP, which is our principal strategic planning instrument. The Medium Term Budget Policy Statement for 2015 indicates that “Municipalities must adopt a conservative approach when projecting their expected revenues and cash receipts. It further states that municipalities should also pay particular attention to managing revenue effectively and carefully evaluate all spending decisions. In generating capacity for spending on key municipal infrastructure, municipalities will have to identify inefficiencies and eliminate non-priority spending.” Former Minister Pravin Gordhan said in his budget speech to Parliament that South Africa has stabilised its economy after the 2008 crisis. We as a district municipality in particular, have managed to continue to evolve as we adapted to new developments and the inevitable setbacks. Mr Speaker Some may consider this an old clichéd statement but we have to mention it again because it will always stay relevant. Most of our delivery efforts over the past years have been focussed on assisting category B municipalities in terms of infrastructure for the provision of free basic services and well as for repairs and maintenance of those assets. In addition to that we have assisted our smaller municipalities (Dikgatlong, Magareng and Phokwane) with administrative and financial reforms and now have functional support services for the district in terms of Internal Audit, Legal and Risk Management. We have also put tremendous effort into institutional and administrative reforms, developmental issues, governance and financial reforms. Looking back over the past 16 years since the new dispensation, the district municipality has grown in terms of incorporating new legislation, new terminology, new governance structures, new technology and new responsibilities for almost everyone in the organisation. It was a very steep learning curve for all of us, but the municipality always thrived. On the delivery side we have been able to increase our input into infrastructure development by systematically tackling the backlogs in the district. We have remained consistent with the allocation to local municipalities which is approximately R10m to operation and maintenance annually. In the 2015/16 financial year, an amount of R29m will also be allocated to the local municipalities for capital projects. This allocation is focussed primarily on maintenance of infrastructure and support of infrastructure delivery. The technicians appointed by the district municipality continue to operate within our three (3) smaller local municipalities and assist with project identification and planning; project terms of reference, specifications and evaluation of tenders; project management and technical support for projects under construction. The planning and development department, which was established after the PMU or Project Management Units were absolved, continues to focus on the following key areas; the implementation of a sustainable integrated development planning, efficient and effective use of spatial planning and GIS and lastly to ensure the promotion and development of the local economy in the district. All the above shows that our priorities have been very much in line with national priorities and confirms that we are not misdirected in terms of our priority areas. Our priorities still direct us to invest in infrastructure in order to assist municipalities to speed up service delivery. Water, sanitation and electricity provisioning still top our priority list. Housing has also been indicated as a high priority need – a function that does not yet belong with us but we have achieved level 1 & 2 accreditation. This was a major accomplishment, not only for the District, but for the Province as a whole as we became one of the only two (2) districts in the country, at the time, to attain level 2 accreditation. We have a fully-fledged housing unit and we are steadfastly working towards obtaining level 3 accreditation. Mr Speaker We have been the first municipality in the Province to be audited according to GAMAP standards which, in its own, has been a learning curve for all involved. In terms of the audit opinions from the office of the auditor-general on the affairs of the district municipality we have maintained a relatively healthy track-record. We have steadily worked towards an unqualified opinion from the onset of the new dispensation in 2000 and although we have received qualified audit opinions from 2001/02 – 2003/04 we have turned the tide in the 2004/05 financial year when we finally received an unqualified audit report from the Auditor-General. Since then we have improved by leaps and bounds. The FBDM went on to receive unqualified audit opinions for five years in succession (2005/06 – 2009/10), and only lapsed in 2010/11 when we received a qualified opinion. We recovered however in 2011/12 and 2012/13 when we once again received unqualified opinions; thus reaffirming our status as Ambassador for Clean Audit when we received the unqualified audit opinion with no matters in the 2013/14 financial year. I wish to reiterate what the Honourable Premier Sylvia Lucas said in her state of the province address, and I quote “The people of the Province and the country have placed great trust in this Administration to improve their livelihoods. We cannot and shall not betray that trust. We will continue to put our shoulders to the wheel to ensure a better life for everyone. There are exciting prospects on the horizon that will ensure that our beloved Province makes measurable strides in the fight against poverty, unemployment and inequality” close quote. I wish to echo these sentiments and throw our efforts behind government by saying that the Frances Baard District Municipality will play its part fully in ensuring the people of our district receive a fair chance at a better life. Mr Speaker In terms of access to basic services the position in the district remains positive. It is estimated that only 5% of households in the district have no access to water and only 16% of households lack access to proper sanitation. As the case in the rest of the country availability of energy remains a serious resource challenge, however according to Census 2011, 83% of households in the district have access to electricity for lighting. The district economy is still very much primary based and skewed towards the Sol Plaatje Local Municipality’s economy. Sol Plaatje Municipality remains the biggest contributor to the economy of the district. There are a number of activities planned and happening in the district to diversify the economy such as the establishment of the Cape Malt plant for malt processing in Richie and the positioning of emerging farmers to produce and supply barley to the plant; the formalisation of the pebbles trading in Dikgatlong; the establishment of an oil processing plant in Phokwane and training of small and emerging miners. Other projects that are also continuing is the support and strengthening of SMMEs; the training of graduates on local economic development and entrepreneurship and the promotion and marketing of unique indigenous products and services. Apart from these the municipality will also concentrate on the following during the 2015/16 financial year: R2000, 000 has been earmarked for the Richie incubation centre, the Kimberley manufacturing hub, the entrepreneurship programme and the Galeshewe SMME Village. In the Frances Baard District tourism has been identified as a sector with massive potential for economic growth. As the smallest district geographically in the Northern Cape, which boasts Kimberley as a major tourist destination within its region, the district remains the most visited destination in the Province. As the Atmospheric Emissions Licensing Authority in the district the FBDM is required to monitor industrial activities emitting offensive substances to the atmosphere. The municipality intends to undertake more awareness campaigns on the causes and effects of air pollution to sensitize the communities on air pollution. Mr Speaker, The major revenue streams that supported the programmes and activities of the district municipality were through government grants and subsidies, interest earned on external investments and actuarial gains. I would now like to take you through a more detailed presentation of how we propose to invest the funds that have been entrusted to us. The total budget for the 2015/16 financial year is R 152,895m. The operational budget is R 140,315m and the capital budget is R 12,580m. The largest portion of the budget is allocated to Corporate Services and Infrastructure Services departments. Allocations to these departments amounts to R 80,556m and is directly linked towards the improvement of the quality of life of communities in the district. This includes R 54,121m for infrastructure development and maintenance at local municipalities. For the 2015/16 financial year we will be allocating and amount of R9m to each of our smaller local municipalities and R5m to Sol Plaatje for infrastructure development and a further R2.5m to each for operation and maintenance. The above allocation will include the following major infrastructure projects: • In Phokwane: the replacement of collapsed bulk sewer gravity line, resealing of a reservoir and water storage dam and the upgrading of the chlorination system at the waste water treatment works in Jan Kempdorp and Hartswater; • In Magareng and Sol Plaatje the main focus will be on sewer reticulation for a number of sites and water and sanitation services respectively; and • In Dikgatlong the focus will be on upgrading of electrical infrastructure, improving waste water treatment plants and improving the provision of sanitation services through the procurement of sanitation vehicles. In terms of Operation and Maintenance the focus will be as follows: • In Phokwane, Magareng and Dikgatlong: the maintenance of water, waste water treatment infrastructure, electrical infrastructure, streets and stormwater and the sewer plant in Magareng. • In Sol Plaatje: the maintenance of the Platfontein Sewer System and the maintenance of the gravel roads in Greenpoint, Colville, Phutanang and Galeshewe. For local economic development and tourism an amount of R 6,115m and R 6,693m has been allocated respectively for 2015/16 and 2016/17 budget years. In terms of spatial planning R3, 898m has been earmarked for the surveying of ervens in our local municipalities; the development of a spatial development framework for the district as well as for Magareng municipality in particular. Other related special projects per division include the following: • Political office admin R331k • Youth unit R550k • Finance R 781k • Human Resources R 400k • Disaster Management R 477k • Environmental Health R 110k • GIS R 600k • MSIG Projects R 940k • Internal Audit R 168k Mr Speaker as said before, grants and subsidies remain to be our biggest source of income and we are at R 106,509m for 2015/2016. This dependency on grants and subsidies influences our expenditure. The major grant funding that the district municipality is receiving from national government is as follows: • Equitable Share: R 106,509m • Finance Management Grant: R1,25m • Municipal Systems Improvement Grant: R 940k. Mr Speaker, as you can see through this budget we continue to be a district municipality which focusses most of its resources towards the support of our local municipalities. We will continue to do so in order to ensure that we improve the lives and living conditions of the communities that we were elected to serve. I wish to conclude with the following quote from Jim Rohn, “Part of your heritage in this society is the opportunity to become financially independent” close quote. I want us to be the solid foundation for our succeeding generations to know that sound financial planning and implementation is the backbone of a strong organisation. Mr Speaker, lastly, I want to sincerely thank all Councillors, the Municipal Manager, the Heads of Departments, managers, officials, stakeholders and members of the public who gave input to this process. I believe that this was a team effort and by sharing credit and thanking all involved I know we will have more of your dedication and support. I thank you BUDGET RELATED RESOLUTIONS EXECUTIVE SUMMARY ANNUAL BUDGET FOR THE YEAR ENDING 30 JUNE 2016 INTRODUCTION The budget for the 2015/16 financial year has been drawn up in terms of chapter 4 of the Municipal Finance Management Act 56 of 2003 (MFMA) and the Municipal Systems Act of 2000 (MSA) on matters specifically related to the budget as well as direction from National Treasury on policy guidelines (MFMA Circulars). The Medium Term Budget Policy Statement 2015 notes that the South African economy is projected to grow by 2, 7% against an actual growth rate of 1, 9% in 2013. The high unemployment rates are a still very high, consequently municipal revenue and cash flow are expected to remain under pressure for 2015/16 budget year. Municipalities must adopt a conservative approach when projecting their expected revenue and cash receipts. Municipalities should also pay particular attention to managing revenue effectively and carefully evaluate all spending decisions. In generating capacity for spending on key municipal infrastructure, municipalities will have to identify inefficiencies and eliminate non-priority spending. The Local Government Budget and Expenditure Review highlighted the burgeoning crisis in the declining credibility of local government through various monitoring and surveys which reflected high levels of disenchantment with service delivery and perceived corruption at municipalities. This public perception will only improve as service delivery improves by demonstrating sound leadership and putting in place measures to address mismanagement through the implementation of effective systems to measure, monitor and evaluate performance. National Treasury published the “Local Government Budgets and Expenditure Review” as a tool to measure progress made by local government in the fulfilment of its mandate while at the same time highlighting those areas where challenges still exist. The review highlighted the following areas as requiring particular attention by municipalities: • • • • • Revenue Management – To ensure the collection of revenues, municipalities need to ensure that billing systems are accurate, send accounts to residents and follow up to collect revenues owed; Collecting Outstanding Debt - Requires political commitment, sufficient administrative capacity and pricing policies that ensure bills are accurate and affordable; Pricing services correctly – Full cost of services should be reflected in the price charged to residents who can afford to pay; Underspending on repairs and maintenance – Underspending on maintenance can shorten the life of assets, increase long-term maintenance and refurbishment cost, and cause a deterioration in the reliability of services; and Spending on Non-Priorities – Considering the pressurised economic climate continued spending on non-priority wants such as unnecessary travel, luxury furnishings, excessive catering, unwarranted public relations projects and consultant to perform routine tasks cannot be sustained and needs to be eliminated from the budget. National Treasury continues to encourage municipalities to keep increases in rates, tariffs and other charges as low as possible and to justify all increases in excess of the forecast 5, 5% upper boundary of the South African Reserve Bank’s inflation target. The proposed budget covers all revenue and expenditure matters as ES-1 presented by management after thorough evaluation of the operational resources and costing in order to effectively achieve objectives set in conjunction with Council. The annual budget in respect of the 2015/16 financial year has been prepared according to the approved IDP / Budget Process Plan and consists of the following six processes: • Planning: Schedule key dates, establish consultation forums, review previous processes. The Executive Mayor has during July 2014 tabled a time schedule outlining key deadlines for reviewing the IDP, preparation, tabling and approval of the budget. • Strategizing:- Review IDP; Set service delivery objectives (3 years); Consider local, provincial and national issues; Consider previous and current year performances; Consider economic and demographic trends; Review policies and consult on tariffs ES-2 • Preparing: - Prepare budget, revenue and expenditure projections; Draft and amend policies; Consider local, provincial and national priorities. • Tabling: Table draft budget (90 days prior to new financial year), IDP & Budget related policies; Consult and consider formal responses from local, provincial and national. • Approving: - Council considers approval of the budget and related policies 30 days prior to new financial year. • Finalising: - Publish approved Service Delivery and Budget Implementation Plan (SDBIP) as well as Annual Performance agreements and key indicators. 1. OUTCOMES OF CONSULTATIVE PROCESS After Council’s approval of the draft annual budget on 23 March 2015, the following consultation processes and meetings in terms of section 23 of the MFMA were held or still to be held with identified stakeholders on the contents of the budget as well as on measurable performance indicators for the 2014/15 budget year: • • • IDP / Budget Strategic Session Budget Committee working sessions – HOD’s / Unit Managers Workshop with Council 04 – 05 December 2014 12,13 & 16 March 2015 17 March 2015 2. SITUATIONAL ANALYSIS The Northern Cape Province is the largest province geographically with a total area of 372,889 square kilometers. The estimated population of the province is 1,114,861 people; which is the smallest share of the South African population (Statistics SA, 2011). Frances Baard is situated in the north-eastern corner of the Northern Cape Province. The district is the most densely populated district with approximately 382, 086 people. It is bordered by 2 provinces namely the Free State in the east, the North West to the north and by two district namely Siyanda to the west and Pixley ka Seme to the south. The district comprises of four local municipalities with the population distribution estimated as follows: Magareng (24 000), Dikgatlong (47 000), Phokwane (63 000) and Sol Plaatje (248 000) (Statistics SA, 2011). 2.1 Demographic Composition: The Frances Baard District Municipality is the most populous district in the province, accounting for over a third (34, 28%) of the provincial population; and majority of which (64, 91%) lives in Sol Plaatje municipality. It has a total area of 12,384 square km and a population density of 30, 85 persons per square km-making it the most density populated district in the province. ES-3 The district population has grown at a rate of 1.6% per annum between 2001 and 2011. It is important to note that the population of Frances Baard is fairly equally distributed with 48, 5% males and 51, 4% females. The population of the district is similar to that of most developing economies; it is dominated by a young population. Thus a third (30%) of the population is ≤15 year old, about 65% of the population is economically active 1 (16-64 years) and 5.5% of the population are pensioners. The economically active age group has increased from about 203,000 people in 2000 to almost 240,807 people in 2011 (Statistics Data, 2011). In 2010 the majority (88.8%) of the adult population (population aged 20 years and older) living in Frances Baard had some form of schooling. However 11.2% of the district adult population had no form of schooling; only 26.6% of the Frances Baard adult population had obtained some primary schooling; and only a limited portion of the District adult population (26.3%) had obtained Grade 12. As a result, the majority of the economically active population of the district is unskilled rendering it employable only in semi-skilled and unskilled occupations. 2.2 Economic Analysis: The Northern Cape Province recorded a 2.1% annual economic growth rate which is 1.5% lower than the average South African Growth Rate of 3.6%. The Northern Cape Province’s largest economic contributor is the primary sector (mining and agriculture) which contribute 32.2% followed by the secondary sector (manufacturing and construction) which contributes 7.3% and lastly the tertiary sector which contributes 51% of the Provinces’ Economy (Statistics SA: GDP p0441: 2010). The Gross Domestic Product (GDP) indicates the value of services and goods produced within the geographic boundaries of an area during a period of one year. Frances Baard District Municipality is the strongest economic region in the province, accounting for 36% of the provincial GDP. The Major contributor to the regional GDP is Sol Plaatje (74, 5%), followed by Phokwane (15%), Dikgatlong (8, 5%), and Magareng (2%). 2.3 Employment Analysis: The Frances Baard DM has a high unemployment rate (34.0%) and youth unemployment is even higher (43.9%). Dikgatlong LM has the highest unemployment rate (39.7%) within the District Municipality as compared to the other local municipalities. The main contributing factor to the low levels of employment in Dikgatlong LM is the high percentage (86.2%) of labour force that has not obtained a Grade 12 Senior Certificate and Higher Qualification, resulting in a primarily unskilled labour force (Quantec Research, Standardized Regional Data, 2011). 1 The term economically active means the population that is employed or actively seeking employment. ES-4 The District has an employable population of 87, 170 people and a total of 102, 529 people that are not economically active. In terms of the distribution of the employed, it is skewed towards Sol Plaatje with 72.3%, while only 4.2% of the employed are in Magareng. 2.4 Basic Service Delivery – Infrastructure Services: • Water & Sanitation: Access to water is a constitutional right to everyone as stipulated by Section 27 (b) of the Constitution of South Africa 1996. Municipalities are mandated by amongst others the Municipal Structure Act 1998, the Municipal Structures Amendment Act 2000 and the Water Services Act 1999, to provide potable water to households within their areas of jurisdiction. It is estimated that about 5450 households (5%) in the district have no access to water and about 16,576 households (16%) lack access to proper sanitation. These are administratively and spatially distributed as follows:Water: - Sol Plaatje – 2285, Dikgatlong – 851, Magareng – 630, Phokwane – 1726 Sanitation:- Sol Plaatje – 8417, Dikgatlong – 2963, Magareng – 700, Phokwane – 4238 (STATSSA: Census 2011) • Electricity The availability of energy remains a serious resource challenge. ESKOM does not have the generation capacity to meet the rising energy demand resulting from the rapid economic growth in South Africa (DME-2008). In the last ten years or so community’s access to electricity has significantly improved. In accordance with the Census 2011 survey by Statistics SA, over 83% of the households in the district have access to electricity for lighting. Issues: • Inability of ESKOM to generate enough power to meet national demand. • Lack of initiatives in renewable energy sources (wind power, solar energy, etc.) nationally or locally. • Lack of suitable incentives for energy saving. • Roads Frances Baard District has about 606 km of gravel roads within the municipal areas. The district has purchased a grader and appointed a grader operating team to assist with grading of gravel streets in the category B municipalities. Frances Baard District Municipality’s service level agreement with the Department of Roads to maintain provincial gravel roads in the district ended in 2011. ES-5 There are no road master plans for the different municipalities. Municipalities also do not have sufficient funds to budget adequately for maintenance of streets and storm water. The conditions of provincial gravel roads within the district have deteriorated over the years due to the following reasons:- • • Insufficient funds are allocated for road maintenance. • Many of the graders and machinery at the Department of Roads are outdated. • Although most new machinery has been bought, it is not utilized optimally. • Increased traffic volume – has exacerbated road conditions. Housing In 2009, the District was assessed for level 1 and 2 accreditation by the Accreditation Compliance and Capacity Assessment Panel, which was successful. Following this, the Minister of Human Settlements and the Northern Cape MEC for Co-operative Governance, Human Settlements and Traditional Affairs delegated level 1 and 2 functions to the District in terms of the Accreditation certificate in May 2011. Functions to be undertaken includes quality assurance; subsidy administration; project/program management and contract administration and the initiation, planning and approval of housing projects. This was a major accomplishment, not only for the District, but for the Province as a whole as it became one of the only two Districts in the country, at the time, to attain level 2 accreditation. The District now has level 3 in sight, and has made numerous submissions and presentations, including to the National Housing Portfolio Committee. The District’s ability to handle the housing function has not been a concern for both National and Provincial Human Settlements; however, financial constraints have been the main impediment delaying the District’s accreditation to level 3. Although the district municipality is fully committed towards the housing accreditation programme the function is not formally delegated to district municipalities and as a result of underfunding to perform key housing functions as per service level agreement, the budgeted amount from the district municipality’s resources been regarded as an unfunded mandate for rectification at political / legislative level. Principle of resources follows function is not fully adhered to by the delegating authority and allocation for performing the housing function needs to be gazette per Division of Revenue Act (DoRA) as stipulated by the National Treasury Guidelines – Circular 67. 2.5 Local Economic Development (LED): Local Economic Development is the creation of a platform and environment in order to engage stakeholders to implement municipal strategies and programmes. It’s the process whereby all economic forces in a municipality are brought on board to identify resources, understand needs and plan the best way of making the local economy fully functional, investor friendly and competitively productive. Municipalities are mandated by the provisions of Section 152 (c) of the Constitution of South Africa 1996 to ensure the socio-economic development of local communities. The district economy is still very much primary based and skewed towards the Sol Plaatje Local mucipality’s economy. Sol Plaatje local municipality alone is responsible for over 80% (rand value) of the value addition in the district while the secondary sector contributes well under 10%. ES-6 There are a lot of activity planned and happening in the Dsitrict to divercify the economy and some of these initiatives are: • • • • • • • • The establishment of the Cape Malt plant for malt processing in Richie and the possitioning of emerging farmers to produce and supply barley to the the plant The formalisation of the pebbles trading in Dikgatlong The establishment of an oil processing plant in Phokwane Training of small and emerging miners Formalization of 20 woman contractors Support and strengthening of SMMEs Exposing and training of graduates on local economic development and entrepreneurship Promotion and marketing of unique indigenous products and services 2.6 Tourism: Tourism has been identified in the Frances Baard District as a sector with massive potential of economic growth. Frances Baard District Municipality is the smallest district in the Northern Cape Province, which boasts Kimberley as a major tourist destination within its region. The District remains the most visited destination within the Northern Cape. FBDM has a rich history and natural resources that can promote tourism development in the region. These resources are untapped and are not adequately budgeted for within the District and local municipalities. The District has access to a number of major routes; the N12 Treasure Route which runs from Johannesburg to Cape Town and N8 from Bloemfontein to Upington leading up to the N10 towards Namibia. The district offers an array of tourism experiences ranging from wildlife, adventure activities, historical buildings, icons and sites, township tourism, the San Cultural & ancient rock art experience, Agri-tourism, mining tourism and heritage, Anglo-Boer war sites and the Mighty Vaal and Orange River running through the District. 2.7 Environmental Management: • Municipal Health Services: Municipal Health Services (MHS) have been devolved to Metropolitan and District Municipalities in terms of the National Health Act, 2003. Sol Plaatje and Phokwane municipalities are currently rendering the services in their own municipalities. Due to inadequate funding, the function has not yet been devolved to FBDM. • Waste Management: ES-7 In accordance with the provisions of Section 11 of the National Environmental Management Waste Act (59) 2008; municipalities are required to prepare Integrated Waste Management Plan as part of their Integrated Development Plan. In terms of the National Environmental Management: Waste Management Plan, 2008, local municipalities are responsible for the operation and management of landfill sites in their municipal areas. The operation and management of these sites remains a challenge for local municipalities due to inadequate budgets and a lack of equipment. • Water Quality Most communities and schools especially in rural areas are dependent on boreholes for water. In many instances the water does not conform to the standards (SANS, 241 of 2011). Failures are communicated through to the local municipalities and the FBDM’s Technical Unit for intervention. The Department of Education is busy installing treatment equipment at these schools • Air Quality: Frances Baard District Municipality is the Atmospheric Emissions Licensing Authority. Four applications have been received and reviewed. Smoke from households remains a main cause of air pollution. More awareness campaigns on the causes and effects of air pollution must be conducted to sensitize the communities on air pollution. • Environmental Health: At the municipal level, municipal health service is one of the corner stones of National Health Systems that promotes good quality health through the control and prevention of health nuisance and environmental health risks. It is one of the major elements of preventative and promote aspects of the health care system that provides opportunities to enhance health through the promotion of health environments that contributes to better health outcomes. Many local municipalities do not have environmental by-laws in place to protect the communities against health hazards and nuisances and to protect the environment against degradation. FBDM has developed a set of municipal and environmental health by-laws to act against perpetrators causing these hazards of nuisances. These by-laws have been approved by Council and will be gazetted. 2.8 Disaster management and fire services: District and metropolitan municipalities are empowered by the provisions of the Disaster Management Act 2002 to ensure sound disaster management in their areas of jurisdiction. Furthermore the National Veld and Forest Fires Act 1998 is administered by managing veld fires in the municipalities. Fire prevention association is critical in firefighting activities in the district. ES-8 To build institutional capacity at local level Frances Baard District Municipality (FBDM) has appointed three (3) Disaster Management Practitioners. One practitioner allocated per municipality i.e. Magareng, Dikgatlong and Phokwane. 3. DISTRICT–WIDE PRIORITY ISSUES: In order to enhance the impact of resources allocation nationally it is imperative that planning within the three spheres of government is aligned. It is from this premise that the district Integrated Development Plan is aligned with the IDP’s of local municipalities. To facilitate alignment, the priority issues of all the municipalities are combined to produce district-wide priority issues. The district-wide priority issues are a summation of the priority issues of the local municipalities. This in essence is the process of alignment between the district integrated development plan and the IDP’s of local municipalities. On this basis the district-wide priority issues for 2015-2016 may be summarized as follows:1. 2. 3. 4. 5. 6. 7. 8. 9. 10. 11. Housing and land Roads and storm water Unemployment – Job Creation Early Childhood Development Education Water Health - Clinics Refuse and waste management Sanitation facilities Electricity and lights Recreational facilities The provision of basic services (water, sanitation, electricity, housing, etc.) still dominates the priority list of the district municipality and remains a key focus area for attention and support. 4. ALIGNMENT WITH NATIONAL, PROVINCIAL AND DISTRICT PRIORITIES In order to achieve maximum impact in resource allocation and project implementation it is critical that the prioritization of needs, allocation of resources and the implementation of projects within and between the three spheres of government is aligned and harmonized. It is through this “concept” that planning at national, provincial and local level relates and informs one another. Each of the three spheres of government has a planning tool used in the execution of its mandate. At the national level they are: the National Development Plan (NDP), Medium Term Strategic Framework (MTSF), the National Spatial Development Perspective (NSDP) to mention only a few. At the provincial level it is the Provincial Growth and Development Strategy (PGDS) and Strategic Plans of individual departments, and at the municipal level it is the Integrated Development Plans (IDP’s) and the Local Government Turn Around Strategy and Implementation. ES-9 In accordance with the provisions of the Constitution of South Africa 1996 and the White Paper on Local Government 1998, municipalities are supposed to be “developmental local government – which is local government committed to working with citizens and groups within the community to find sustainable ways to meet their social, economic and material needs and improve the quality of their lives”. Thus ideally a municipality should: • • • • • • • • Provide democratic and accountable government for local communities Be responsive to the needs of the community Ensure the provision of services to communities in a sustainable manner Promote social and economic development Promote safe and healthy environment Encourage the involvement of communities and community organizations in the matters of local government Facilitate a culture of public service and accountability amongst its staff Assign clear responsibilities for the management and coordination of this administrative unit and mechanism However after several years of local government system, cracks seem to appear within the structures of local government. There are signs of discontent in the streets of municipalities. The ongoing service delivery protests in municipalities may be interpreted as lack of citizens’ confidence and trust in the system and a symptom of alienation of citizens from local government. It is critical to note that municipalities have varying strengths and weaknesses and therefore require individually tailored intervention measures. These intervention measures termed “Turn Around Strategy” are comprehensive but differentiated programmes of action aimed at ensuring that municipalities meet the basic service needs of communities. They are high level government-wide responses aimed at stabilizing local government. The objective of the Municipal Turn Around Strategies are: • • • • • To ensure that municipalities meet the basic service needs of communities To build clean, effective, efficient responsive and accountable local government To improve performance and professionalism in municipalities To improve national and provincial policy, oversight support To strengthen partnership between communities, civil society and local government (Source: Implementation Plan-Local Government Turn Around Strategy-COGTA-January 2010) Short, medium and long term steps underpin the vision of the District Municipality in improving the quality of life of communities in the district. Developmental strategic goals, objectives and annual priorities were therefore identified for the five-year electoral term of office of the Council. These focus areas are encapsulated in the IDP in accordance with the “Turn Around Strategy” and the Local Government: Municipal Performance Regulations for Section 57 employees, the main KPA’s for municipalities are:• • • • • Basic service delivery Municipal Institutional Development and Transformation Local Economic Development (LED) Municipal Financial Viability and Management Good governance and public participation ES-10 On this basis therefore strategic priority issues were identified and adopted. The outcome of these strategic goals and priorities with regard to the impact on the community is the reduction of backlogs in infrastructure e.g. increased access to free basic services; increased community participation in the affairs of the municipality, customer care, job creation and poverty alleviation, increased economic growth, safe and healthy environment. Council is optimistic that the political arrangements allow for solid and stable leadership and the municipality’s limited institutional structure has matured to allow for sustainable service delivery within the confines of the delegated powers and functions. 5. STRATEGIC OBJECTIVES Informed by the district municipality’s Turn-around Strategy and the Local Government: Municipal Performance Regulations for Section 57 employees, the following strategic objectives were formulated: KPA 1: Basic Service Delivery Goal: To facilitate and support the eradication of backlogs in infrastructure and provide basic services. Objective: • • • • To facilitate and support the eradication of backlogs in infrastructure. To provide and facilitate basic services in the DMA. (Transferred to local municipalities from 01 July 2011) To support the maintenance of municipal infrastructure. To facilitate and support provision of housing. KPA 2: Local Economic Development (LED) Goal: To support and stimulate the creation of a growing economy improving the quality of life in the district community. Objective: • • • • To coordinate corporate social investment. To support and promote SMME development. To develop an investment and marketing strategy. To promote community economic development. KPA 3: Municipal Institutional Development and Transformation Goal: To implement an effective environmental management system ES-11 Objective: • • • • • • • • To reduce pollution levels through identification and implementation of programmes. To develop an effective food monitoring programme To evaluate and monitor non-food premises. To provide environmental health awareness. To facilitate awareness campaigns in the district. To monitor, evaluate and improve safe disposal of hazardous and general waste. To facilitate pauper burials. To monitor, review and implement Integrated Waste Management Plan (IWMP) and Integrated Environmental Management Plan (IEMP) in all municipalities. Goal: To build in-house capacity in Integrated Development Planning in local municipalities in the district Objective: • • • To support the preparation and implementation of integrated development plans of the district and local municipality. To support MSIG capacity building programmes and projects. To facilitate the implementation of Sector Plans. Goal: To provide spatial planning services to municipalities in the district Objective: • • • To prepare and review Spatial Development Frameworks of municipalities. To manage urban development in accordance with approved plans. To prepare and implement Township Establishment Plans. Goal: Implement and support PMS in the municipality Objective: • • To review and maintain the performance management system in the municipality. To support the implementation of PMS in B- municipalities. Goal: To support and facilitate the enhancement of services through the creation of a conducive environment for social development in the district Objective: • • To support the reduction of crime. To coordinate and facilitate the provision of government services. ES-12 Goal: To ensure a safe and secure municipal environment Objective: • • • • • To implement the disaster management policy. To implement integrated communication links with all disaster management role players. To coordinate firefighting activities in the DMA. To coordinate the functions of the Health and Safety Committee activities. To coordinate security services. Objectives: • • • • • • • • • • • To conduct internal audit reviews according to the audit plan. To perform internal audit functions at category B municipalities. To provide an internal and external communication network. To develop corporate identity and image. Provision of effective IT services to all users and stakeholders. To support and manage auxiliary services effectively and efficiently. Managing human resources and development units. Provision of an effective and efficient human resources function. Compliance with the Employment Equity Act. Compliance with the Skills Development Act. Provision of administrative support to all committees of Council. KPA 4: Good Governance and Public Participation Goal: To empower the organisation and community through participatory governance Objectives: • • • • • • • To manage the interface between the Mayoral Committee and Council so that the administration is aligned with the political priorities of Council. To establish a performance management system. To fully operationalise the district IDP Forum and Technical Committee. To develop all policies programs and plans. To improve public knowledge and understanding of how Council functions. To ensure that the approved budget is in line with the IDP. To manage and coordinate administrative activities of the entire Council. KPA 5: Municipal Financial Viability and Management ES-13 Goal: To provide an effective and efficient financial management service in respect of council’s assets, liabilities, revenue and expenditure in a sustained manner to maximised the district municipality’s developmental role. Objectives: • Ensure long-term financial sustainability • Ensure full compliance with all accounting statutory and legislative requirements • Ensure effective debt collection and implementation of revenue generating strategies • Ensure the proper management of cash resources to meet financial liabilities • Ensure the implementation and maintenance of a fully compliant supply chain management system and store facility • 6. Ensure effective capacity building within the FBDM district BY providing financial management support to four local municipalities. PREVIOUS YEAR FINANCIAL PERFORMANCE (2013/14) According to the financial year end performance result, the district municipality continues to improve its financial position through efficiency and sound financial practices in order to deliver on its constitutional and developmental mandate. The district municipality remains committed to support and build the capacity of its local municipalities within the district to meaningfully perform their functions and exercise their powers. It is therefore imperative to transform the local municipalities to such an extent that they become self-sufficient, responsive, developmental in nature and above all financially sustainable. Despite the global economic downturn experienced at the moment and the ripple effect it might have on local government to deliver in terms of its mandate, the district municipality is under severe pressure to allocate more resources as supplementary funding in an effort to protect the poor from the worst economic turndown impacts. Notwithstanding the negative impact on revenue streams and ability to spend according to service delivery and budget implementation plan, the district municipality manages to maintain focus on key service delivery areas in supporting the local municipalities in the district area by spending almost 35% of its total operating expenditure on infrastructure, maintenance and social related projects. The implementation of infrastructure and other related projects in the current financial year reflects fairly good as most of the projects have been completed timeously with the exception of a few projects to be completed early in the new financial year. The Community Wealth (CRR and Unappropriated Surplus) has decreased from a R103, 955 million to R103, 622 million for the financial year under review. All of the provisions and resources are cash backed. 6.1 OPERATING RESULTS Operating results for 2013 / 2014 ended in a deficit of R332,852. The operating results for the year ended 30 June 2014 are as follows: ES-14 Revenue & Expenditure Actual 2013 R Actual 2014 R Variance 2013/14 % Budget 2014 R Variance Actual / Budget % Operating Income for the year 101 920 686 102 078 439 0.15% 99 839 680 (2.24%) Operating Expenditure for the year (99 554 983) (102 411 291) 2.87% (121 903 670) 15.99% 0 0 Discontinued Operations SURPLUS / (DEFICIT) FOR THE YEAR 2 365 702 332 852 Accumulated Surplus / (Deficit) at the beginning of the year 74 688 564 75 947 879 Net appropriations for the year (1 106 387) (796 436) Accumulated Surplus / (Deficit) at the end of the year 75 947 879 74 818 591 (22 063 990) -28.01% (22 063 990) Council’s performance, when compared to the budget, must be seen in the context of conservative budgeting practices influenced by other factors such as the inability of some Category B municipalities to implement grant & subsidy allocated projects. 6.2 OPERATING REVENUE The major revenue streams that supported the programmes and activities of the district municipality were: • • • • Government Grants and Subsidies Interest Earned – External Investments Rental of Facilities and other income Gains on disposal of property, plant and equipment ES-15 The main sources of revenue (93%) are received by way of annual allocations in terms of the Division of Revenue Act (DoRA) and / or whereby services are rendered. Conditional grant allocations from Government and other sources are only recognized as revenue to the extent that there has been compliance with the conditions associated with such amounts received. OPERATING EXPENDITURE The following graph indicates the main categories of expenditure for the year under review: 1% 12% 40% Employee related costs Remuneration of councillors Debt impairment Depreciation & asset impairment Finance Charges - External Funding Other materials Contracted services 33% Grants and subsidies paid Other expenditure 0% 3% 2% 4% ES-16 0% 5% Loss on disposal of PPE Operating Ratios Detail % Employee Cost 40.00% Repairs & Maintenance 3.00% Finance Charges & Depreciation 6.00% T1.4.3 The district municipality exceeded the 35% norm for employee cost due to its outward looking approach by attracting and appointing highly skilled / dedicated personnel to support the local municipalities in the district area in order to address the challenge of scares skills / expertise such as engineers, IDP professionals, internal auditors, human resources practioners, finance related personnel, etc. General maintenance costs cover is less than the expected guideline norm from National Treasury mainly due to the fact that the district municipality doesn’t have any major infrastructure assets except for its administrative buildings. The amount spent on repairs and maintenance covers asset maintenance, support contracts for systems, equipment maintenance and other related services. Expenditure on finance charges & depreciation is back to normal levels after the asset impairment of R18m in the previous financial year. 6.3 APPROPRIATIONS ( ACCUMULATED SURPLUS / DEFICIT) Appropriations for the year amount to a net outflow of R796 k which can mainly be attributed to: • • • Transfer to Capital Replacement Reserve Property, Plant and Equipment purchased Offsetting of depreciation (R3 661 500) R2 553 462 R 311 602 6.4 CONDITIONAL GOVERNMENT GRANTS Except for the Municipal Systems Improvement grant, all other conditional grants have been dealt with in compliance with DoRA with a 100% expenditure rate for the financial year under review. Unspent grants reflected at financial year end is fully cash backed as defined in the district municipality’s accounting policy 6.5 EXTERNAL BORROWINGS ES-17 The District Municipality reflects an external loan of R15m from Development Bank of Southern Africa to partially finance the construction of the new Council Chamber, offices and training facilities to the total estimated value of R34m. An amount of R10, 04m reflects outstanding as at 30 June 2014 in terms of the external loan agreement. Some financial ratios relevant to external borrowings are: 2013/14 Interest Bearing Debt to Own Revenue (Excluding Grants) 73, 12% 2012/13 55, 13% This indicator measures the relationship between all long term liabilities and bank overdrafts to a single years operating income. It indicates the extent to which it is possible to redeem all long term liabilities plus bank overdrafts from a single years operating income if used solely for that purpose. The DM ratio of 53, 30% is above the compared norm of 50%, excluding any grant funding inclusive of the RSC replacement portion reflected under the Equitable Share allocation. 6.6 CASH AND INVESTMENTS Council’s cash and equivalents to the amount of R87,93m reflect a increase of R4,37m compared to the previous financial year. The district municipality does have adequate cash available to meet its operating requirements with cash coverage of at least three months of the average operational expenditure as per National Treasury guidelines. 6.7 OUTSTANDING RECEIVABLES Outstanding receivables are adequately managed and are under control. 6.8 OUTSTANDING PAYABLES Outstanding payables increased with R2, 04m to R6, 22m mainly due to projects completed earlier in the financial year. Some financial ratios relevant to payables are: Creditors Management Creditors system efficiency 2013/14 2012/13 100% 100% A trademark of the District Municipality is its commitment and ability to fully settle its creditors’ accounts within the required terms of 30 days or as per applicable legislative requirement. This statement is supported by the constant 100% payment levels to creditors. ES-18 6.9 RATIO ANALYSIS / BENCHMARKS Financial viability and sustainability is one of the key performance areas of the District Municipality as determined in the IDP. In order to ensure that the District Municipality maintains a healthy financial position, appropriate financial ratios / benchmarks are used to assist the District Municipality in assessing its financial wealth. Financial the appropriate financial ratios / benchmarks to assets relevant to the District Municipality’s financial position are: Liquidity 2013/14 2012/13 Liquidity - Current Ratio 6.04 7.12 This ratio indicates the extent to which assets can be translated into cash in the short term to cover the claims of short term creditors. The norm is about 1.50:1 and according to the above mentioned ratio of the district municipality’s it reflects above the norm which is an indication that the district municipality do not experience any cash flow problems and / or is not expected to experience any cash flow problem over the short term. The district municipality managed to sustain its healthy financial position and in some instance even improved compare to the previous financial year’s ratio indicators. Based on the above mentioned information the financial position of the district municipality remains good and its cash flow is well managed to meets its obligations. The district municipality has a good ability to repay its debt in the short to medium term. 7. PROJECTED FINANCIAL PERFORMANCE 2014/15 7.1 CONSOLIDATED PERFORMANCE AGAINST ANNUAL BUDGET (Projected Operating Results) • Revenue by source Year-to-date accrued revenue is R68, 490 million compared to the year-to-date budget projections of R70, 164 million for December 2014. This is as a result of receiving equitable share in advance for the quarter ended 31 December 2014. The main sources of revenue that are above budget are transfer of operational government grants and rental of facilities and equipment. • Operating expenditure by type To date, a total of R46, 724 million has been spent compared to the operational approved budget of R132, 631 million. This does not include non-cash items such as depreciation & impairment, amortization and actuarial losses. The main areas where expenditure is less than the budget is employee related costs, repairs & maintenance, finance charges, contracted services, grants and subsidies paid as well as general expenses. Refer to Annexure A, Table SC1 for further explanation for material variances on both revenue by source and expenditure by type. The summary statement of financial performance in Annexure A, Table C4, is ES-19 prepared on a similar basis to the prescribed budget format, detailing revenue by source type and expenditure by input type. • Capital Expenditure Year-to-date expenditure on capital amounts to R0, 888million of the total original budget of R5, 340 million. Departments are encouraged to start spending their allocated amounts as this remains a concern especially with late commencement or delayed implementation of capital projects resulting in rejects being rolled over to the next financial year. Please refer to Annexure A, Table C5 for further details. • Cash Flows The Municipality started the year with a total cash and cash equivalents of R88, 633 million. Cash equivalents amounted to R123, 085 million at the end of December 2014. The net increase of R34, 452 million is as a result of receiving Equitable Share Grant in advance for the second quarter ending 31 December 2013. Table C7 includes all cash and cash equivalents (cashbook balances, petty cash balances and short and long term deposits) ES-20 7.2 IN-YEAR BUDGET STATEMENT TABLES: Table C1: Monthly Budget Statement Summary Budget Year 2014/15 2013/14 Description Audited Original Adjusted Monthly YearTD YearTD Outcome Budget Budget actual actual budget R thousands Financial Performance YTD Property rates – – – – – – – Serv ice charges – – – – – – – Inv estment rev enue Transfers recognised - operational Other ow n rev enue Total Revenue (excluding capital transfers and contributions) Employ ee costs YTD variance variance % 5 841 5 673 – 541 2 909 2 855 54 95 053 101 083 – 70 65 258 66 925 1 208 1 236 – 3 323 384 102 102 107 992 – 614 68 490 Full Year Forecast – – 2% 5 673 (1 667) -2% 101 083 (61) -16% 647 70 164 (1 674) -2% 107 403 45 446 41 012 54 388 – 3 460 21 546 24 833 (3 287) -13% Remuneration of Councillors 5 424 6 055 – 446 2 702 2 838 (137) -5% Depreciation & asset impairment 4 105 5 380 – 2 217 3 777 – 3 777 6 055 4 679 Finance charges 2 300 2 854 – 552 552 1 474 (922) -63% 2 903 Materials and bulk purchases 3 376 5 245 – 131 1 268 1 879 (611) -32% 4 115 Transfers and grants 33 666 42 973 – 2 354 10 795 15 759 (4 964) -31% 42 832 Other ex penditure 12 605 15 736 – 805 6 084 8 856 (2 772) -31% 14 980 Total Expenditure 102 489 132 631 – 9 966 46 724 55 640 (8 916) -16% 121 012 (387) (24 639) – (9 352) 21 766 14 524 7 241 50% (13 609) Surplus/(Deficit) Transfers recognised - capital – – – – – – – Contributions & Contributed assets – – – – – – – Surplus/(Deficit) after capital transfers & (387) (24 639) – (9 352) 21 766 14 524 7 241 – – 50% (13 609) contributions Share of surplus/ (deficit) of associate Surplus/ (Deficit) for the year – – (387) (24 639) 2 553 5 340 – – – – – – – (9 352) 21 766 14 524 7 241 50% (13 609) 11% 5 133 Capital expenditure & funds sources Capital expenditure – 573 888 797 91 Capital transfers recognised – – – – – – – – Public contributions & donations – – – – – – – – Borrow ing – – – – – – – – 2 553 5 340 – 573 888 797 91 11% 5 133 2 553 5 340 – 573 888 797 91 11% 5 133 Total current assets 91 792 91 792 – 118 986 81 843 Total non current assets 60 983 60 983 – 58 094 60 777 Total current liabilities 15 921 15 921 – 19 274 14 143 Total non current liabilities 33 232 33 232 – 32 454 31 481 Community wealth/Equity 103 623 99 995 – 125 353 96 995 Internally generated funds Total sources of capital funds Financial position Cash flows Net cash from (used) operating 9 764 (8 285) – 20 025 35 068 7 923 27 146 343% (352) Net cash from (used) inv esting (3 949) (4 482) – (279) (616) (957) 341 -36% (4 175) (1 445) (1 606) – 87 934 82 960 – Net cash from (used) financing Cash/cash equivalents at the month/year end Debtors & creditors analysis 0-30 Days 31-60 Days – 123 085 (778) (569) (209) 37% (1 496) 123 085 103 729 19 356 19% 82 609 61-90 Days 91-120 Days 121-150 Dys 151-180 Dys 181 Dys1 Yr Over 1Yr Total Debtors Age Analysis Total By Rev enue Source 2 991 170 – – – – 172 12 – – – – – – – 3 345 Creditors Age Analysis Total Creditors 587 ES-21 587 Table C2 Monthly Budget Statement - Financial Performance (standard classification) 2013/14 Description R thousands Ref Budget Year 2014/15 Audited Original Adjusted Monthly YearTD YearTD YTD YTD Full Year Outcome Budget Budget actual actual budget variance variance Forecast % 1 Revenue - Standard Governance and administration Ex ecutiv e and council Budget and treasury office Corporate serv ices 87 228 94 768 – 573 65 109 65 073 36 3 716 4 683 – – 3 122 3 122 – 83 512 90 085 – 573 61 987 61 951 36 – 1 600 Community and public safety 0% 94 699 0% 90 016 4 683 – – – – – – – 315 – – – – – 315 – Community and social serv ices – – – – – – – Sport and recreation – – – – – – – – 600 315 – – – – – 315 – – – – – – – – – – – – – Public safety Housing 1 000 Health – Economic and environmental services Planning and dev elopment Road transport 12 909 – 40 3 381 5 092 (1 710) -34% 12 389 10 266 9 909 – 40 1 381 3 092 (1 710) -55% 9 389 – – – – – Env ironmental protection – 13 274 – 3 008 3 000 – 2 000 – 2 000 – – – 3 000 – – – – – – – – Electricity – – – – – – – – Water – – – – – – – – Waste w ater management – – – – – – – – Waste management – – – – – – – – – – – – – – – – 614 68 490 Trading services Other Total Revenue - Standard 4 2 102 102 107 992 70 164 (1 674) – -2% 107 403 Expenditure - Standard Governance and administration Ex ecutiv e and council 48 659 62 169 – 5 092 23 555 28 863 (5 309) -18% 53 603 15 800 22 502 – 1 849 8 464 10 554 (2 090) -20% 18 872 Budget and treasury office 18 071 20 901 – 1 995 8 337 11 010 (2 673) -24% 19 771 Corporate serv ices 14 788 18 766 – 1 248 6 753 7 299 (546) -7% 14 960 7 892 10 981 4 610 4 543 66 1% 9 354 – 991 Community and social serv ices – – – – – – – Sport and recreation – – – – – – – – 607 2 271 2 575 (303) -12% 4 303 – 383 2 338 1 969 370 19% 5 051 – – Community and public safety Public safety 4 405 5 060 Housing 3 487 5 921 Health – Economic and environmental services Planning and dev elopment Road transport – 45 939 59 480 43 948 56 629 – Env ironmental protection – 1 991 2 851 – – – – – – – 3 883 18 560 22 233 (3 673) -17% 58 054 – 3 713 17 581 20 820 (3 240) -16% 55 400 -31% 2 655 – – – – 171 980 – 1 413 – (433) – – – – – – – – – Electricity – – – – – – – – Water – – – – – – – – Waste w ater management – – – – – – – – Waste management – – – – – – – – – – – – – – – Trading services Other Total Expenditure - Standard Surplus/ (Deficit) for the year 3 – 102 489 132 631 – 9 966 46 724 55 640 (8 916) -16% 121 011 (387) (24 639) – (9 352) 21 766 14 524 7 241 50% (13 609) This table reflects the operating budget (Financial Performance) in the standard classifications which are Government Finance Statistics Functions and Sub-functions. The aim of revenue and expenditure per standard classification is to provide a breakdown of the activities of Council to specific services. ES-22 Table C3 Monthly Budget Statement - Financial Performance (revenue and expenditure by municipal vote) 2013/14 Vote Description [Insert departmental structure etc 3.] R thousands Revenue by Vote Ref Budget Year 2014/15 Audited Original Adjusted Monthly YearTD YearTD Outcome Budget Budget actual actual budget YTD 3 716 4 683 – – 3 122 3 122 – 83 512 90 085 – 573 61 987 61 951 36 Vote 3 - Corporate Serv ices 3 608 3 315 – – 2 000 2 000 Vote 4 - Planning & Dev elopment 1 128 949 – – 15 10 138 8 960 – 40 1 366 3 092 (1 725) 102 102 107 992 – 614 68 490 70 164 (1 674) Vote 2 - Budget & Treasury Vote 5 - Project Management & Adv isory Serv ices Total Revenue by Vote 2 Expenditure by Vote 1 Full Year Forecast % 1 Vote 1 - Council & Ex ecutiv e YTD variance variance – 4 683 0.1% – 90 016 3 315 15 964 -55.8% -2.4% 8 425 107 403 Vote 1 - Council & Ex ecutiv e 15 800 22 502 – 1 849 8 464 10 554 (2 090) -19.8% 18 872 Vote 2 - Budget & Treasury 18 071 20 901 – 1 995 8 337 11 010 (2 673) -24.3% 19 771 Vote 3 - Corporate Serv ices 21 183 26 677 – 2 026 10 004 11 287 (1 282) -11.4% 21 917 Vote 4 - Planning & Dev elopment 12 612 19 719 – 1 237 6 151 8 766 (2 615) -29.8% 18 499 Vote 5 - Project Management & Adv isory Serv ices 34 824 42 832 – 2 859 13 768 14 023 (256) -1.8% 41 952 Total Expenditure by Vote 2 102 489 132 631 – 9 966 46 724 55 640 (8 916) -16.0% 121 011 Surplus/ (Deficit) for the year 2 (387) (24 639) – (9 352) 21 766 14 524 7 241 49.9% (13 609) The municipal vote reflects the organisational structure of the municipality which is made up of the following directorates: Council & Executive, Budget & Treasury, Corporate Services, Planning & development and Project Management &Advisory Services. The following charts will depict the financial performance as per Municipal vote according to the approved organogram of council. Actual operating expenditure of Council & Executive is R8, 302 018 as compared to the year-todate budget R10, 554 429. The main areas where expenditure is less than YTD budgets are: employee related costs, consultancy, repairs and maintenance, legal services, special projects and general expenses. ES-23 Consolidated performance of year-to-date expenditure on special projects against full year budget (Council & Executive) COUNCIL & EXECUTIVE YTD Actual % Spending Budget Remarks COUNCIL Commorative Days 13 117 86 000 Mayoral Bursary Fund Total - 200 000 13 117 286 000 COMMITTEE & ADMINISTRATION SERVICES Youth Unit Special Projects Total 59 000 59 000 200 000 200 000 Fraud Preventation Plan 84 000 350 000 Total 84 000 350 000 9 808 9 808 10 000 5 000 15 000 15.25% Spending as per the operational plan 0.00% Will be utilised during the current financial year 4.59% 29.50% Will spend on the 3rd Quarter 29.50% INTERNAL AUDIT COMMUNICATIONS Branding Communication PAIA Management Communication Total ES-24 24.00% To be adjusted during the adjustment budget 24.00% 98.08% Complete 0.00% Will be utilised during the current financial year 65.38% Actual operating expenditure of Budget & Treasury office is R7, 963 381 as compared to the year-to-date projected budget of R11, 009 945. The main areas where expenditure is less than YTD budgets are: employee related costs, employee benefits, consultancy, repairs and maintenance, audit fees, actuarial losses, special projects and general expenses. Consolidated performance of year-to-date expenditure on special projects against full year budget (Budget & Treasury) FINANCE: DIRECTORATE YTD Actual Financial System Support Local Municipalities Operation Clean Audit AFS Quality Control & GRAP Staff Benefits Actuarial Evaluation Total Budget 86 250 21 582 107 832 300 000 540 000 160 000 50 000 1 050 000 % Spending Remarks 28.75% To be adjusted during the adjustment budget 4.00% The local municipalities did not request for any assistance. 0.00% Will be utilised during the current financial year 0.00% Will be utilised during the current financial year 10.27% An amount of R86, 250 was spent on Financial System Support Local Municipality, and will be adjusted during the adjustment budget process. The actual spending on special projects for the Department of Finance amounted to R107, 832 as compared to the approved budget of R1, 050 000. ES-25 Actual operating expenditure of Corporate Services is R9, 211 455 as compared to the year-todate projected budget of R11, 286 594. The main areas where expenditure is less than YTD budgets are: employee related costs, maintenance of computer hardware, software, printers, networks and telephone system, consultancy, special projects, training, and general expenses. Consolidated performance of year-to-date expenditure on special projects against full year budget (Corporate Services) CORPORATE SERVICES YTD Actual % Spending Budget Remarks INFORMATION COMMUNICATION & TECHNOLOGY ICT Forum Meetings - 10 000 0.00% Expenditure as per the operational plan during the third quarter Total - 10 000 0.00% HUMAN RESOURCE MANAGEMENT Employee Assistance Programme Employee Wellness Total 1 503 241 062 242 565 100 000 450 000 550 000 1.50% Spending as per the operational plan 53.57% Spending as per the operational plan 44.10% ENVIRONMENTAL HEALTH Awareness Programme - HIV, TB & STI Awareness Programme - Sanitation Recycling Project Air Quality Projects Environmental Health Forum Greening Projects Waste Management Campaigns Sector 78 Assesment Total 3 358 2 618 3 922 531 10 429 24 000 24 000 20 000 120 000 20 000 60 000 40 000 450 000 758 000 13.99% Spending as per the operational plan 10.91% Spending as per the operational plan 0.00% Will be used during the 3rd quarter 0.00% To be adjusted during the adjustment budget 19.61% Spending as per the operational plan 0.00% To be adjusted during the adjustment budget 1.33% To be adjusted during the adjustment budget 0.00% Project implemented - on track 1.38% FIRE FIGHTINNG AND DISASTER MANAGEMENT Fire Fighting - Volunteers Training Fire Fighting - Volunteers Stipend Fire Fighting - Volunteers Ins Contingency Fund Disaster Management Forum Awareness Programmes Total 133 864 133 864 75 000 63 400 11 000 300 000 8 000 18 000 475 400 0.00% Expenditure as per the operational plan during the third quarter 0.00% Expenditure as per the operational plan during the third quarter 0.00% To be adjusted during the adjustment budget 44.62% On a needs basis per Local Municipality 0.00% Will spend on the 3rd Quarter 0.00% Will spend on the 3rd Quarter 28.16% The actual spending on special projects for Corporate Services amounted to R386 858 as compared to the approved budget R1, 793 400. ES-26 Actual operating expenditure of Planning & Development is R6, 040 110 as compared to the year-to-date projected budget of R8, 766 180. The main areas where expenditure is less than YTD budgets are: employee related costs, depreciation, repairs & maintenance, consultancy, special projects, advertisement general notices and general expenses. Consolidated performance of year-to-date expenditure on special projects against full year budget (Planning & Development) PLANNING & DEVELOPMENT YTD Actual Budget % Spending Remarks PLANNING & DEVELOPMENT DIRECTORATE MSIG 14/15: Review Mun Polices (FBDM) MSIG 14/15: Review FBDM Int Fin Man Plan - 300 000 300 000 0.00% Project in progress & on schedule 0.00% Project in progress & on schedule MSIG 14/15: Int Zoning Scheme Magareng Mum Total - 334 000 934 000 0.00% Project in progress & on schedule 0.00% ES-27 YTD Actual LED LED SMME Development LED Richie Incubation Centre LED Promotion Of Smme's LED Coordinte Structures & Forum LED Vegetable Plant - Phokwane LED Entrepreneurship Programme LED Bokomotso Project-Dikgatlong LED Expo LED Bio-Mass Dikgatlong Kby Hub LED Develop Incentive Policies Total Budget 411 000 260 640 333 600 50 000 50 000 336 050 100 000 639 000 120 000 120 000 30 000 2 450 290 224 150 250 836 7 375 150 962 628 963 1 344 1 263 630 YTD Actual Budget % Spending Remarks 0.00% In progress & NVT Funds committed 86.00% Completed 75.19% In progress 14.75% In progress 0.00% In progress 44.92% In progress, awaiting new interns 0.00% Advertised 98.43% In progress 0.00% In progress 0.00% In progress 4.48% In progress 51.57% % Spending Remarks GIS Verify Water Infrastructure Financial Data Clensing Total - 600 000 1 000 000 1 600 000 0.00% Tender advertised 0.00% Appointment of bidder to be finalised 0.00% SPATIAL PLANNING Surveying Of Erven Dikgatlong Spatial Development Framework - Magareng Spatial Development Framework (Fbdm) Zoning Scheme - Magareng EIA - Dikgatlong Total - 397 000 291 980 276 500 316 800 36 600 1 318 880 0.00% In progress 0.00% Saving R261 064 0.00% In progress 0.00% In progress (Appointment stage) 0.00% In progress still waiting for EIA approval 0.00% YTD Actual TOURISM Diamonds & Dorings Support Tourism Contribution: Ncta Support Tourism N12 Promotion Tourism Treasure Route Support Tourism Businessplan Competition Indaba Trade Expo Tourism Website Tourism Advertising & Promotion Tourism Association Exhibition Tourguide Busuness Esteb Training Community Awareness Campaigns Total IDP MANAGEMENT IDP Steering Committee Meeting IDP Projects Total Budget 135 000 50 000 335 251 73 580 66 150 22 960 128 500 811 441 550 000 135 000 50 000 20 000 615 000 316 930 5 400 172 500 17 000 23 390 232 710 168 000 2 305 930 724 724 7 600 35 170 42 770 % Spending Remarks 0.00% In progress 100.00% In progress 100.00% In progress 0.00% In progress 54.51% In progress 23.22% In progress 0.00% In progress 38.35% In progress 0.00% In progress 98.16% In progress 0.00% In progress 76.49% In progress 35.19% 9.53% In accordance with Budget 0.00% To be adjusted during the adjustment budget 1.69% The actual spending on special projects for Planning & Development amounted to R2, 075 795 as compared to the approved budget of R8, 651 870. ES-28 Actual operating expenditure of Project Management & Advisory Services is R13, 420 119 as compared to the year-to-date projected budget of R14, 023 057. The main areas where expenditure is less than YTD budgets are: consultancy, maintenance and provision of infrastructure projects and general expenses. Consolidated performance of year-to-date expenditure on special projects against full year budget (Project Management & Advisory Services) YTD Actual % Spending Budget INFRASTRUCTURE SERVICE DIRECTORATE District Technical Forum Meetings 2 311 9 000 25.68% Will be spent Total 2 311 9 000 25.68% ES-29 Remarks YTD Actual Budget % Spending Remarks PROJECT & ADVISORY SERVICES Phokwane - Maintenance Municipal Infrastructure Magareng - Maintenance Municipal Infrastructure Sol Plaatje - Maintenance Municipal Infrastructure Dikgatlong - Waste Water Operating Room Phokwane - Replace Sewer Gravity Line Phokwane - Resealing Of Reservoir Phokwane - Upgrade Chlorination System Phokwane - Road Infrastructure & Maintenance Plan Phokwane - Water & Sanitation Maintenance Plan Phokwane - Resealing Sewer Storage Dam Magareng - Waternetwork. 558 Sites Dikgatlong - Procure TLB Dikgatlong - Sanitation Truck Dikgatlong - Electricity Master Plan Dikgatlong - Purchase Cherry Picker Dikgatlong Electricity Infrastructure Upgrade Dikgatlong - Prosess Controller Sol Plaatje - Water Reticulation Sol Plaatje - Maintenance Municipal Infrastructure Dikgatlong - Maintenance Municipal Infrastructure Total HOUSING Special Project: Women's Month Special Project: Mandela Month Special Project: 16 Days of Activism Housing Consumer Education Housing Field Workers Housing Steering Committee Meeting Total 1 207 806 542 634 1 032 221 25 600 936 045 2 404 789 846 939 474 799 554 231 8 029 686 2 500 000 2 500 000 1 965 000 480 000 1 300 000 800 000 500 000 1 200 000 400 000 800 000 5 000 000 800 000 1 000 000 1 000 000 800 000 900 000 500 000 5 000 000 535 000 2 500 000 30 498 000 2 097 23 464 5 560 31 121 16 000 16 000 16 000 40 000 30 000 20 000 138 000 48.31% Will be spent 21.71% Will be spent 52.53% Will be spent 5.33% Will be spent 72.00% Will be spent 0.00% Will be spent 0.00% Will be spent 0.00% Will be spent 0.00% Will be spent 0.00% Will be spent 48.10% Will be spent 0.00% Will be spent 84.69% Will be spent 0.00% Will be spent 0.00% Will be spent 0.00% Will be spent 0.00% Will be spent 0.00% Will be spent 88.75% Will be spent 22.17% Will be spent 26.33% 0.00% Contractor still to claim funding 0.00% Funding secured from Coghsta 0.00% Submission still not approved at Coghsta 5.24% Programme is still running not completed yet 78.21% Budget increased in adjustment budget 27.80% Meeting costs reduced in line with circular 62. 22.55% The actual spending on special projects for Project Management & Advisory Services amounted to R8, 058 496 compared to the approved budget of R30, 627 000. ES-30 IN-YEAR BUDGET STATEMENT TABLES (ANNEXURE: A) Table C1: Monthly Budget Statement Summary Budget Year 2014/15 2013/14 Description Audited Original Adjusted Monthly YearTD YearTD Outcome Budget Budget actual actual budget R thousands Financial Performance YTD Property rates – – – – – – – Serv ice charges – – – – – – – Inv estment rev enue Transfers recognised - operational Other ow n rev enue Total Revenue (excluding capital transfers and contributions) Employ ee costs YTD variance variance % 5 841 5 673 – 541 2 909 2 855 54 95 053 101 083 – 70 65 258 66 925 1 208 1 236 – 3 323 384 102 102 107 992 – 614 68 490 Full Year Forecast – – 2% 5 673 (1 667) -2% 101 083 (61) -16% 647 70 164 (1 674) -2% 107 403 45 446 41 012 54 388 – 3 460 21 546 24 833 (3 287) -13% Remuneration of Councillors 5 424 6 055 – 446 2 702 2 838 (137) -5% Depreciation & asset impairment 4 105 5 380 – 2 217 3 777 – 3 777 6 055 4 679 Finance charges 2 300 2 854 – 552 552 1 474 (922) -63% 2 903 Materials and bulk purchases 3 376 5 245 – 131 1 268 1 879 (611) -32% 4 115 Transfers and grants 33 666 42 973 – 2 354 10 795 15 759 (4 964) -31% 42 832 Other ex penditure 12 605 15 736 – 805 6 084 8 856 (2 772) -31% 14 980 Total Expenditure 102 489 132 631 – 9 966 46 724 55 640 (8 916) -16% 121 012 (387) (24 639) – (9 352) 21 766 14 524 7 241 50% (13 609) Surplus/(Deficit) Transfers recognised - capital – – – – – – – Contributions & Contributed assets – – – – – – – Surplus/(Deficit) after capital transfers & (387) (24 639) – (9 352) 21 766 14 524 7 241 – – 50% (13 609) contributions Share of surplus/ (deficit) of associate Surplus/ (Deficit) for the year – – (387) (24 639) 2 553 5 340 – – – – – – – (9 352) 21 766 14 524 7 241 50% (13 609) 11% 5 133 Capital expenditure & funds sources Capital expenditure – 573 888 797 91 Capital transfers recognised – – – – – – – – Public contributions & donations – – – – – – – – Borrow ing – – – – – – – – 2 553 5 340 – 573 888 797 91 11% 5 133 2 553 5 340 – 573 888 797 91 11% 5 133 Total current assets 91 792 91 792 – 118 986 81 843 Total non current assets 60 983 60 983 – 58 094 60 777 Total current liabilities 15 921 15 921 – 19 274 14 143 Total non current liabilities 33 232 33 232 – 32 454 31 481 Community wealth/Equity 103 623 99 995 – 125 353 96 995 Internally generated funds Total sources of capital funds Financial position Cash flows Net cash from (used) operating 9 764 (8 285) – 20 025 35 068 7 923 27 146 343% (352) Net cash from (used) inv esting (3 949) (4 482) – (279) (616) (957) 341 -36% (4 175) (1 445) (1 606) – 87 934 82 960 – Net cash from (used) financing Cash/cash equivalents at the month/year end Debtors & creditors analysis 0-30 Days 31-60 Days – 123 085 (778) (569) (209) 37% (1 496) 123 085 103 729 19 356 19% 82 609 61-90 Days 91-120 Days 121-150 Dys 151-180 Dys 181 Dys1 Yr Over 1Yr Total Debtors Age Analysis Total By Rev enue Source 2 991 170 – – – – 172 12 – – – – – – – 3 345 Creditors Age Analysis Total Creditors 587 ES-31 587 Table C2 Monthly Budget Statement - Financial Performance (standard classification) 2013/14 Description R thousands Ref Budget Year 2014/15 Audited Original Adjusted Monthly YearTD YearTD YTD YTD Full Year Outcome Budget Budget actual actual budget variance variance Forecast % 1 Revenue - Standard Governance and administration Ex ecutiv e and council Budget and treasury office Corporate serv ices 87 228 94 768 – 573 65 109 65 073 36 3 716 4 683 – – 3 122 3 122 – 83 512 90 085 – 573 61 987 61 951 36 – 1 600 Community and public safety 0% 94 699 0% 90 016 4 683 – – – – – – – 315 – – – – – 315 – Community and social serv ices – – – – – – – Sport and recreation – – – – – – – – 600 315 – – – – – 315 – – – – – – – – – – – – – Public safety Housing 1 000 Health – Economic and environmental services Planning and dev elopment Road transport 12 909 – 40 3 381 5 092 (1 710) -34% 12 389 10 266 9 909 – 40 1 381 3 092 (1 710) -55% 9 389 – – – – – Env ironmental protection – 13 274 3 008 – 3 000 – 2 000 – 2 000 – – – 3 000 – – – – – – – – Electricity – – – – – – – – Water – – – – – – – – Waste w ater management – – – – – – – – Waste management – – – – – – – – – – – – – – – – 614 68 490 Trading services Other Total Revenue - Standard 4 2 102 102 107 992 70 164 (1 674) – -2% 107 403 Expenditure - Standard Governance and administration Ex ecutiv e and council 48 659 62 169 – 5 092 23 555 28 863 (5 309) -18% 53 603 15 800 22 502 – 1 849 8 464 10 554 (2 090) -20% 18 872 Budget and treasury office 18 071 20 901 – 1 995 8 337 11 010 (2 673) -24% 19 771 Corporate serv ices 14 788 18 766 – 1 248 6 753 7 299 (546) -7% 14 960 7 892 10 981 4 610 4 543 66 1% 9 354 – 991 Community and social serv ices – – – – – – – Sport and recreation – – – – – – – – 607 2 271 2 575 (303) -12% 4 303 – 383 2 338 1 969 370 19% 5 051 – – Community and public safety Public safety 4 405 5 060 Housing 3 487 5 921 Health – Economic and environmental services Planning and dev elopment Road transport 45 939 59 480 43 948 56 629 – Env ironmental protection – 1 991 – 2 851 – – – – – – – 3 883 18 560 22 233 (3 673) -17% 58 054 – 3 713 17 581 20 820 (3 240) -16% 55 400 -31% 2 655 – – – – 171 980 – 1 413 – (433) – – – – – – – – – Electricity – – – – – – – – Water – – – – – – – – Waste w ater management – – – – – – – – Waste management – – – – – – – – – – – – – – – Trading services Other Total Expenditure - Standard Surplus/ (Deficit) for the year 3 – 102 489 132 631 – 9 966 46 724 55 640 (8 916) -16% 121 011 (387) (24 639) – (9 352) 21 766 14 524 7 241 50% (13 609) ES-32 Table C3 Monthly Budget Statement - Financial Performance (revenue and expenditure by municipal vote) [Insert departmental structure etc 3.] R thousands Revenue by Vote Budget Year 2014/15 2013/14 Vote Description Ref Audited Original Adjusted Monthly YearTD YearTD Outcome Budget Budget actual actual budget YTD 3 716 4 683 – – 3 122 3 122 – Vote 2 - Budget & Treasury 83 512 90 085 – 573 61 987 61 951 36 3 608 3 315 – – 2 000 2 000 – Vote 4 - Planning & Dev elopment 1 128 949 – – 15 – 15 10 138 8 960 – 40 1 366 3 092 102 102 107 992 – 614 68 490 70 164 (1 674) 15 800 22 502 – 1 849 8 464 10 554 (2 090) -19.8% Total Revenue by Vote 2 Expenditure by Vote 1 Vote 1 - Council & Ex ecutiv e Forecast 4 683 Vote 3 - Corporate Serv ices Vote 5 - Project Management & Adv isory Serv ices Full Year % 1 Vote 1 - Council & Ex ecutiv e YTD variance variance 0.1% 90 016 3 315 964 (1 725) -55.8% -2.4% 8 425 107 403 18 872 Vote 2 - Budget & Treasury 18 071 20 901 – 1 995 8 337 11 010 (2 673) -24.3% 19 771 Vote 3 - Corporate Serv ices 21 183 26 677 – 2 026 10 004 11 287 (1 282) -11.4% 21 917 Vote 4 - Planning & Dev elopment 12 612 19 719 – 1 237 6 151 8 766 (2 615) -29.8% 18 499 34 824 42 832 – 2 859 13 768 14 023 -1.8% 41 952 Total Expenditure by Vote Vote 5 - Project Management & Adv isory Serv ices 2 102 489 132 631 – 9 966 46 724 55 640 (8 916) -16.0% 121 011 Surplus/ (Deficit) for the year 2 (387) (24 639) – (9 352) 21 766 14 524 7 241 (13 609) ES-33 (256) 49.9% Table C4 Monthly Budget Statement - Financial Performance (revenue and expenditure) 2013/14 Description Ref Budget Year 2014/15 Audited Original Adjusted Monthly Outcome Budget Budget actual YearTD actual YearTD YTD budget R thousands Revenue By Source Property rates Property rates - penalties & collection charges Serv ice charges - electricity rev enue Serv ice charges - w ater rev enue Serv ice charges - sanitation rev enue Serv ice charges - refuse rev enue Serv ice charges - other Rental of facilities and equipment Interest earned - ex ternal inv estments Interest earned - outstanding debtors Div idends receiv ed Fines Licences and permits Agency serv ices Transfers recognised - operational Other rev enue Gains on disposal of PPE Total Revenue (excluding capital transfers and YTD Full Year variance variance Forecast % – – – – – – – 885 5 841 – – – – – 95 053 322 1 – – – – – – – 1 061 5 673 – – – – – 101 083 115 60 – – – – – – – – – – – – – – – – – – – – – – – – 541 – – – – – 70 3 – – – – – – – – 260 2 909 – – – – – 65 258 55 9 – – – – – – – 332 2 855 – – – – – 66 925 52 – – – – – – – – (72) 54 – – – – – (1 667) 3 9 102 102 107 992 41 012 5 424 – – – – – – – 519 5 673 – – – – – 101 083 110 17 – 614 68 490 70 164 (1 674) -2% 107 403 54 388 – 3 460 21 546 24 833 (3 287) -13% 45 446 6 055 – 446 2 702 2 838 (137) -5% 6 055 3 – – – – – -22% 2% -2% 6% contributions) Expenditure By Type Employ ee related costs Remuneration of councillors Debt impairment – Depreciation & asset impairment 4 105 5 380 – 2 217 3 777 – 3 777 Finance charges 2 300 2 854 – 552 552 1 474 (922) Bulk purchases – – – – – – – Other materials 3 376 5 245 – 131 1 268 1 879 (611) – Contracted serv ices – 2 903 -32% 4 115 – – 33 666 42 973 – 2 354 10 795 15 759 (4 964) -31% 42 832 Other ex penditure Loss on disposal of PPE 12 207 398 15 533 200 – – 805 – 6 084 – 8 856 – (2 772) – -31% 14 777 200 102 489 132 631 – 9 966 46 724 55 640 (8 916) -16% 121 012 (387) (24 639) – (9 352) 21 766 14 524 7 241 Surplus/ (Deficit) for the year – 4 679 -63% Transfers and grants Total Expenditure – 3 – Transfers recognised - capital – Contributions recognised - capital – Contributed assets – Surplus/(Deficit) after capital transfers & 0 (13 609) (387) (24 639) – (9 352) 21 766 14 524 (13 609) (387) (24 639) – (9 352) 21 766 14 524 (13 609) (387) (24 639) – (9 352) 21 766 14 524 (13 609) (387) (24 639) – (9 352) 21 766 14 524 (13 609) contributions Tax ation Surplus/(Deficit) after taxation – Attributable to minorities Surplus/(Deficit) attributable to municipality Share of surplus/ (deficit) of associate Surplus/ (Deficit) for the year ES-34 Table C5 Monthly Budget Statement - Capital Expenditure (municipal vote, standard classification and funding) ES-35 Table C6 Monthly Budget Statement - Financial Position 2013/14 Description R thousands ASSETS Current assets Ref Budget Year 2014/15 Audited Original Adjusted Outcome Budget Budget YearTD actual Full Year Forecast 1 Cash Call inv estment deposits Consumer debtors 9 934 1 081 – 840 4 150 78 000 77 479 – 113 000 73 887 – 3 921 2 601 898 898 – Other debtors 2 668 Current portion of long-term receiv ables – 2 000 898 Inv entory Total current assets 292 400 – 327 308 91 792 80 960 – 118 986 81 843 Non current assets Long-term receiv ables 9 579 9 674 – 9 579 9 674 Inv estments 4 400 4 400 – 4 400 4 400 46 228 46 003 – 43 422 46 003 777 1 429 – 693 700 – – Inv estment property Inv estments in Associate Property , plant and equipment Agricultural Biological assets Intangible assets Other non-current assets – Total non current assets TOTAL ASSETS 60 983 61 505 – 58 094 60 777 152 775 142 465 – 177 080 142 619 1 786 LIABILITIES Current liabilities Bank ov erdraft – Borrow ing – – 1 606 1 786 – 1 606 Trade and other pay ables 6 566 4 500 – 11 531 4 500 Prov isions 7 750 6 500 – 6 137 7 858 15 921 12 786 – 19 274 14 143 Consumer deposits Total current liabilities Non current liabilities Borrow ing 8 435 6 685 – 7 657 6 685 Prov isions 24 797 23 000 – 24 797 24 797 Total non current liabilities 33 232 29 685 – 32 454 31 481 TOTAL LIABILITIES 49 153 42 470 – 51 727 45 624 103 623 99 995 – 125 353 96 995 74 819 73 333 – 96 591 70 333 28 804 26 662 – 28 762 26 662 103 623 99 995 – 125 353 96 995 NET ASSETS 2 COMMUNITY WEALTH/EQUITY Accumulated Surplus/(Deficit) Reserv es TOTAL COMMUNITY WEALTH/EQUITY 2 ES-36 1.4.7 Table C7 Monthly Budget Statement - Cash Flow 2013/14 Description R thousands Ref Budget Year 2014/15 Audited Outcome Original Adjusted Budget Budget Monthly actual YearTD actual YearTD budget YTD YTD Full Year variance variance Forecast % 1 CASH FLOW FROM OPERATING ACTIVITIES Receipts Ratepayers and other 7 363 145 – 182 1 706 382 1 324 346% 135 Government - operating 95 068 101 083 – 32 617 75 160 55 546 19 614 35% 101 083 – – – 5 673 – 425 2 751 2 873 (122) -4% 5 726 – – Government - capital Interest – 6 255 Dividends – – – – Payments Suppliers and employees Finance charges Transfers and Grants NET CASH FROM/(USED) OPERATING ACTIVITIES (62 483) (74 941) – (7 573) (1 215) (1 569) – – (31 188) (35 225) (38 676) – (5 627) (13 360) (13 628) (267) 9 764 (8 285) – 20 025 35 068 7 923 27 146 57 – – (37 777) (6 589) 17% (69 808) 527 527 100% (1 462) 2% (36 027) 343% (352) CASH FLOWS FROM INVESTING ACTIVITIES Receipts Proceeds on disposal of PPE – – – – – 53 Decrease (Increase) in non-current debtors – – – – – – – – Decrease (increase) other non-current receivables – – – – – – – – (600) – – – – – – – (3 349) (4 539) – (279) (616) (957) (341) 36% (4 228) (3 949) (4 482) – (279) (616) (957) (341) 36% (4 175) – – – – – – – Decrease (increase) in non-current investments Payments Capital assets NET CASH FROM/(USED) INVESTING ACTIVITIES – CASH FLOWS FROM FINANCING ACTIVITIES Receipts Short term loans Borrowing long term/refinancing – – – – – – – Increase (decrease) in consumer deposits – – – – – – – (1 445) (1 606) – (778) (569) 209 -37% (1 496) (1 445) (1 606) – – (778) (569) 209 -37% (1 496) – Payments Repayment of borrowing NET CASH FROM/(USED) FINANCING ACTIVITIES NET INCREASE/ (DECREASE) IN CASH HELD 4 370 (14 373) Cash/cash equivalents at beginning: 83 564 97 333 Cash/cash equivalents at month/year end: 87 934 82 960 ES-37 – 19 746 33 674 6 396 (6 024) 103 339 88 633 97 333 88 633 123 085 123 085 103 729 82 609 1. SUPPORTING DOCUMENTATION Table SC1 Material variance explanations Ref 1 Description Reasons for material deviations Variance Remedial or corrective steps/remarks R thousands Revenue By Source Rental of facilities and equipment -21.83% Rental of grader to local municipalities . Rental of the grader started earlier than ex pected Interest earned on ex ternal inv estment is less than y ear-to- 2 Interest earned - ex ternal inv estments 1.88% date budget. Acceptable and dependant on the market y ield. Other income 5.62% Year-to-date actual income more than the y ear-to-date budget Acceptable - No remedial steps required Expenditure By Type Salaries -13.24% Approv ed v acant posts not filled according to the organogram Most v acant post w ere adv ertised and w ill be filled shortly . All maintenance projects are needs driv en. The District does not hav e any major infrastructure assets to maintain ex cept Other Materials -32.50% for its administrativ e building Transfers and grants -31.50% procurement plan for the first quarter. Other ex penditure -31.30% to-date budget Most projects are in the planning phase as per the All maintenance projects are incurred as and w hen required. Grants & subsidies paid w ill gain momentum as the financial y ear progresses. Year-to-date actual general ex penditure is less than the y ear- Spending on general ex penses w ill gain momentum as the 3 financial y ear progresses Capital Expenditure Spending on capital projects are in the planning phase as per As per the policy , all capital projects / purchases should hav e Capital ex penditure 4 11.38% the procurement plan. been completed / finalized by 31 March of each y ear Financial Position Reserv es R 2 099 525 Under budget Will be rev iew ed during the adjustment budget. Property , plant & equipment R -2 580 161 Under budget Will be rev iew ed during the adjustment budget. 5 Cash Flow Net cash from operating / (used) Operating Activ ities Net cash from operating / (used) Inv esting Activ ities 6 Measureable performance 342.63% RSC Lev y Replacement Grant Receipts 35.66% Capital Ex penditure not materialising per SDBIP ES-38 Acceptable There is a need to accelerate this spending Table SC2 Monthly Budget Statement - performance indicators 2013/14 Description of financial indicator Basis of calculation Ref Budget Year 2014/15 Audited Original Adjusted YearTD Full Year Outcome Budget Budget actual Forecast Percentage Borrowing Management Borrow ing to Asset Ratio Total Long-term Borrow ing/ Total Assets 5.5% 4.7% 0.0% 4.3% 0.0% Capital Charges to Operating Ex penditure Interest & principal paid/Operating Ex penditure 6.2% 6.2% 0.0% 1.2% 7.4% Borrow ed funding of capital ex penditure Borrow ings/Capital ex penditure ex cl. transfers and 0.0% 0.0% 0.0% 0.0% 0.0% 16.0% 13.0% 0.0% 16.6% 13.4% 29.3% 25.1% 0.0% 26.6% 25.1% 576.5% 633.2% 0.0% 617.4% 578.7% 579.9% 648.9% 0.0% 613.5% 582.9% grants Safety of Capital Debt to Equity Loans, Accounts Pay able, Ov erdraft & Tax Prov ision/ Funds & Reserv es Gearing Long Term Borrow ing/ Funds & Reserv es Liquidity Current Ratio 1 Current assets/current liabilities Liquidity Ratio Monetary Assets/Current Liabilities 1 Revenue Management Annual Debtors Collection Rate Last 12 Mths Receipts/ Last 12 Mths Billing (Pay ment Lev el %) Outstanding Debtors to Rev enue Total Outstanding Debtors to Annual Rev enue 12.9% 10.8% 0.0% 21.0% 12.3% Longstanding Debtors Reduction Due To Debtors > 12 Mths Recov ered/Total Debtors > 0.0% 0.0% 0.0% 0.0% 0.0% Recov ery 12 Months Old 100.0% 100.0% Unfunded Prov isions/Total Prov isions 0.0% 0.0% 0.0% 0.0% Employ ee costs Employ ee costs/Total Rev enue - capital rev enue 40.2% 50.4% 0.0% 31.5% 42.3% Repairs & Maintenance R&M/Total Rev enue - capital rev enue 3.3% 4.9% 0.0% 0.2% 1.2% Interest & Depreciation I&D/Total Rev enue - capital rev enue 6.3% 7.6% 0.0% 0.8% 8.3% 196.4% 148.9% 0.0% 149.8% 270.4% Creditors Management Creditors Sy stem Efficiency % of Creditors Paid Within Terms (w ithin MFMA s 65(e)) Funding of Provisions Percentage Of Prov isions Not Funded Other Indicators IDP regulation financial viability indicators i. Debt cov erage (Total Operating Rev enue - Operating Grants)/Debt serv ice pay ments due w ithin financial y ear) iii. Cost cov erage (Av ailable cash + Inv estments)/monthly fix ed 12.4 2.3 - 4.8 operational ex penditure The above ratios indicate that the municipality is financially stable and adequately funded to continue with its operations. The year-to-date ratio of employee costs as compared to the total revenue – capital revenue for the year to date is 31.5%. The level of employee costs should be monitored and managed effectively to keep the national norm of 35 % in consideration. The municipality still depends on grant funding of over 93.4% to fund its operations. All council’s provisions and the Capital Replacement Reserve are cash backed and the cash and cash equivalents are sufficient to cover outstanding debt. ES-39 1.8 Table SC3 Monthly Budget Statement - aged debtors Description R thousands NT Code Budget Year 2014/15 0-30 Days 31-60 Days 61-90 Days 91-120 Days 121-150 Dys 151-180 Dys 181 Dys-1 Yr Over 1Yr Total Bad >90 days Debts Debtors Age Analysis By Revenue Source Rates 1200 – – Electricity 1300 – – Water 1400 – – Sew erage / Sanitation 1500 – – Refuse Remov al 1600 – – Housing (Rental Rev enue) 1700 – Other 1900 2 991 170 – – – – 172 12 3 345 2000 2 991 170 – – – – 172 12 3 345 2 842 162 – – – – 163 11 3 178 Total By Revenue Source 2014/15 - totals only – 184 – 174 Debtors Age Analysis By Customer Category Gov ernment 2200 166 168 – – – - – – 334 Business 2300 – – – – – - – – – Households 2400 – – – – – - – – Other 2500 2 826 2 – – – – 172 12 3 011 2600 2 991 170 – – – – 172 12 3 345 Total By Customer Category – – Council’s debtors consist of three main groups, namely: • Provincial or Local government bodies for services rendered to or on behalf of these bodies, • Ex-employees entitled to post-service benefits, and • Other entities by way of service delivery for which costs are to be recovered. Matters reported below are in respect of debts outstanding in excess of 90 days on the effective reporting date. • Provincial and Local Government There is no outstanding debt for more than 90 days as at 31 December 2014 in respect of Provincial and Local Governments Department. • Post-Service Benefits The only outstanding debts reflected for more than 90 days as at 31 December 2014 is: Payne ME R7, 210.60 and Benson SC R3, 484.70 for post medical-aid. Payne ME & Benson SC have since passed on and the Revenue Unit is struggling to recover the monies from the deceased estates. The debt will be written off by council in January as per audit recommendation. • Sundry Debtors The only outstanding debt reflected for more than 90 days as at 31 December 2014 for sundry debtors is: Mathe E.M R1, 182.99 for overpayment on her salary after resigning. A letter was sent to Sol Plaatje Local Municipality on the 29 November 2014, and they confirmed on the 23rd of ES-40 184 December 2014 that they have deducted the amount from her salary. The deducted amount still needed to be transferred to Frances Baard District Municipality’s bank account. Debts are continuously being monitored; reviewed and adequate controls are in place according to approved policies. Table SC4 Monthly Budget Statement - aged creditors Description R thousands NT Code Budget Year 2014/15 Prior y ear 0- 31 - 61 - 91 - 121 - 151 - 181 Days - Over 1 30 Days 60 Days 90 Days 120 Days 150 Days 180 Days 1 Year Year Total totals for chart (same period) Creditors Age Analysis By Customer Type Bulk Electricity 0100 – Bulk Water 0200 – PAYE deductions 0300 – VAT (output less input) 0400 – Pensions / Retirement deductions 0500 – Loan repay ments 0600 – Trade Creditors 0700 – Auditor General 0800 – Other Total By Customer Type 0900 1 300 9 – – – – – – 1 309 2600 1 300 9 – – – – – – 1 309 – The expenditure section continues to administer, manage, assess and improve creditors, salaries and sundry payments subject to internal prescriptions. Salary Payment: Salary payments are under adequate control and occur according to approved policies and agreement in terms of the Bargaining Council. Salary increase of 6.79% for staff has been implemented as from the 1st of July 2014. The annual increase for Councilors’ in terms of the remuneration of Public Office Bearers Act, 1998 is still outstanding for the current financial year. Trade Creditors: Council purchases and payments to creditors are under adequate control. Expenditure statistics for the month of December 2014 is listed below: ES-41 Table SC5 Monthly Budget Statement - investment portfolio Investments by maturity Name of institution & investment ID R thousands Period of Ref Type of Expiry date Accrued Yield for the Market Change in Market Investment of interest for month 1 value at market value at end investment the month (%) beginning value Investment of the of the month month Yrs/Months Municipality NEDCOR 31 CALL 31-Dec-14 22 5.1% 5 000 STANDARD BANK 31 CALL 31-Dec-14 8 5.0% 2 000 5 000 2 000 ABSA - Leav e Reserv e 365 FIXED 24-Jun-15 311 7.1% 4 400 4 400 RMB 31 CALL 31-Dec-14 13 5.0% 3 000 3 000 ABSA 31 CALL 31-Dec-14 18 5.3% 4 000 4 000 NEDCOR 120 NOTICE 6-Mar-15 207 6.3% 10 000 10 000 STANDARD BANK 90 NOTICE 4-Feb-15 75 6.1% 5 000 5 000 NEDCOR 120 NOTICE 11-Mar-15 145 6.3% 7 000 7 000 STANDARD BANK 120 NOTICE 11-Mar-15 166 6.3% 8 000 8 000 ABSA 120 NOTICE 11-Mar-15 186 6.3% 9 000 9 000 RMB 120 NOTICE 11-Mar-15 205 6.3% 10 000 10 000 ABSA 120 NOTICE ABSA 28 CALL STANDARD BANK 120 NOTICE STANDARD BANK 28 CALL NEDCOR 120 NOTICE NEDCOR 28 CALL RMB 120 NOTICE RMB 28 RMB 2-Apr-15 148 6.5% 7 000 7 000 31-Dec-14 12 5.4% 3 000 3 000 2-Apr-15 124 6.3% 6 000 6 000 31-Dec-14 12 5.3% 3 000 3 000 2-Apr-15 82 6.3% 4 000 4 000 31-Dec-14 12 5.4% 3 000 3 000 2-Apr-15 61 6.2% 3 000 3 000 CALL 31-Dec-14 12 5.3% 3 000 3 000 120 NOTICE 17-Apr-15 92 6.2% 4 500 4 500 STANDARD BANK 120 NOTICE 17-Apr-15 94 6.4% 4 500 4 500 ABSA 120 NOTICE 17-Apr-15 96 6.5% 4 500 4 500 NEDCOR 120 NOTICE 17-Apr-15 93 6.3% 4 500 TOTAL INVESTMENTS AND INTEREST 117 400 ES-42 4 500 – 117 400 Table SC6 Monthly Budget Statement - transfers and grant receipts 2013/14 Description Ref Budget Year 2014/15 Audited Original Adjusted Monthly YearTD Outcome Budget Budget actual actual YearTD budget YTD R thousands RECEIPTS: YTD variance variance Full Year Forecast % 1,2 Operating Transfers and Grants National Government: Local Gov ernment Equitable Share Special Contribution: Councillor Remuneration Lev y replacement 3 Finance Management Grant Municipal Sy stems Improv ement Ex tended Public Works Programme Water Affairs 93 130 100 618 – 179 73 929 65 553 10 329 9 965 – – 2 927 2 927 – 3 716 4 683 – – 3 122 3 122 – 75 945 82 780 – 179 64 992 56 817 1 250 1 250 – – 1 250 1 250 – 890 934 – – 934 934 – 1 000 1 006 – – 704 503 201 – – – – – 8 175 12.8% 100 618 9 965 4 683 14.4% 82 780 1 250 934 40.0% 1 006 – – Provincial Government: 8 376 – 1 850 315 – – 1 380 158 1 223 776.2% 1 695 1 000 – – – 1 380 – 1 380 100.0% 1 380 300 – – – Fire Fighting Equipment Grant 300 315 – (158) -100.0% 315 NC Tourism 150 – – – – – – – 100 – – – – – – – – Housing 4 Near Grant Env ironmental Health Recy cling Grant District Aids Programme – – – – 158 – – – – – – – – District Municipality: – – – Other transfers and grants [ABSA Donation] – – – – – – – – – [insert description] – Other grant providers: 92 150 – – 12 75 (63) -84.1% 150 SETA Skills Grant 77 150 – – 12 75 (63) -84.1% 150 Koopmansfontein Self Build Sceme – – ABSA 15 – 75 321 65 786 – – – Total Operating Transfers and Grants 5 95 072 101 083 – 179 – – 9 535 14.5% 102 463 Capital Transfers and Grants National Government: Municipal Infrastructure (MIG) – – – – – – – – – Water Affairs – – EPWP – – – – – Other capital transfers [insert description] – Provincial Government: – – – – – – – [insert description] – District Municipality: – – – – – – – – – [insert description] – Other grant providers: – – [insert description] – ESCOM (Electricity on Farms) – – – – – – – Total Capital Transfers and Grants 5 TOTAL RECEIPTS OF TRANSFERS & GRANTS 5 – 95 072 – 101 083 ES-43 – – – – – – – 179 – 75 321 – 65 786 – 9 535 – 14.5% 102 463 Table SC7 Monthly Budget Statement - transfers and grant expenditure 2013/14 Description Ref Budget Year 2014/15 Audited Original Adjusted Monthly Outcome Budget Budget actual YearTD actual YearTD budget YTD YTD Full Year variance variance Forecast R thousands % EXPENDITURE Operating expenditure of Transfers and Grants National Government: Local Gov ernment Equitable Share Special Contribution: Councillor Remuneration Lev y replacement Finance Management Grant Municipal Sy stems Improv ement Ex tended Public Works Programme Water Affairs Provincial Government: Housing 100 618 – 70 66 778 65 638 10 329 9 965 – – 2 927 2 927 – 3 716 4 683 – – 3 122 2 342 781 75 945 82 780 – – 58 775 58 775 – 1 250 1 250 – 30 1 250 625 625 100.0% 978 934 – 0 0 467 (467) -100.0% 1 000 1 006 – 40 704 503 201 40.0% – 1 140 1.7% 93 218 – – – – – – 1 758 315 – 10 – 158 (158) 100 476 9 965 33.3% 4 683 82 780 1 250 792 1 006 – -100.0% 315 1 000 – – – – – – Near Grant 300 – – – – – – Fire Fighting Equipment Grant 300 315 – – – 158 (158) NC Tourism 150 – – – – – – – 8 – – – – – – – – – 10 – – – – – – – – Env ironmental Health Recy cling Grant District Aids Programme District Municipality: – – – – – – -100.0% 315 – – – – – – [insert description] Other grant providers: 77 Koopmansfontein Self Build Sceme – ABSA – SETA Skills Grant Total operating expenditure of Transfers and Grants: 150 – – 12 75 (63) 96 – – – – – – 77 150 – – 95 053 101 083 – 80 – – 12 75 (63) 66 790 65 871 919 96 1.4% 100 887 Capital expenditure of Transfers and Grants National Government: – – – – Municipal Infrastructure (MIG) Water Affairs – – – – – EPWP – – – Other capital transfers [insert description] Provincial Government: – – – – – – – – – – – District Municipality: – – – – – – – – – – Other grant providers: – – – – – – ESCOM (Electricity on Farms) – – – – Total capital expenditure of Transfers and Grants TOTAL EXPENDITURE OF TRANSFERS AND GRANTS – 95 053 – 101 083 – – – 80 – 66 790 – 65 871 – 919 – 1.4% 100 887 External funding account balances reflect transfers to revenue adequate to cover the relevant operating or capital expenditure for which the funds have been received. Grant funding is reflected as unspent grants where relevant, with revenue transferred to the income statement as expenditure is incurred. ES-44 Table SC8 Monthly Budget Statement - councilor and staff benefits Budget Year 2014/15 2013/14 Summary of Employee and Councillor remuneration Ref Audited Original Adjusted Monthly Outcome Budget Budget actual A B C YearTD actual YearTD YTD budget YTD variance variance R thousands Full Year Forecast % 1 D Councillors (Political Office Bearers plus Other) Salary Pension Contributions 3 688 4 055 – 303 1 842 1 903 (61) -3% 4 055 (14) -14% 202 173 202 – 14 87 101 Medical Aid Contributions 17 17 – 1 9 9 Motor v ehicle allow ance 1 189 1 402 – 103 619 701 (82) -12% 1 402 296 358 – 24 146 179 (34) -19% 358 Workmen's Compensation 60 20 – – – 10 (10) -100% 20 Unemploy ment Insurance – – – – – – – 5 424 6 055 – 446 2 702 2 903 (201) Cell phone and other allow ances Sub Total - Councillors % increase Senior Managers of the Municipality – 17 – -7% 11.6% 11.6% 4 6 055 3 Basic Salaries and Wages 4 377 4 826 – 249 1 122 1 206 (84) -7% Pension and UIF Contributions 580 811 – 13 152 203 (50) -25% 774 Medical Aid Contributions 118 139 – 9 (35) -100% 133 Ov ertime – – 35 – 3 501 – Performance Bonus 434 464 – 5 Motor Vehicle Allow ance 480 673 – 26 117 168 (51) -30% 400 Cellphone Allow ance 89 112 – 5 23 28 (5) -19% 80 Housing Allow ances 10 – – Other benefits and allow ances 52 57 – Pay ments in lieu of leav e – 107 – – – Long serv ice aw ards – – – – – – – – – 6 140 7 188 – 306 Post-retirement benefit obligations 2 Sub Total - Senior Managers of Municipality % increase – 443 – 14 (14) -100% – 1 414 1 654 (240) -15% 17.1% 4 55 102 5 488 -10.6% Other Municipal Staff 24 337 33 829 – 2 256 14 809 16 479 (1 670) -10% Pension and UIF Contributions Basic Salaries and Wages 3 858 5 480 – 403 2 306 2 537 (231) -9% 4 917 Medical Aid Contributions 1 272 1 674 – 102 658 802 (145) -18% 1 494 – – – – – – Ov ertime 72 Performance Bonus 27 577 – – – – – – – – 2 109 3 112 – 236 1 333 1 388 (55) Cellphone Allow ance 94 108 – 8 60 54 6 11% 94 Housing Allow ances 196 221 – 21 126 110 16 14% 200 Other benefits and allow ances 1 038 1 081 – 62 392 526 (134) -25% 1 062 Pay ments in lieu of leav e 1 404 753 – – – – – 860 131 193 – – 31 31 – 244 360 748 – 70 417 374 43 11% 47 199 – 3 159 20 132 22 302 (2 170) -10% Motor Vehicle Allow ance Long serv ice aw ards Post-retirement benefit obligations 2 Sub Total - Other Municipal Staff % increase Total Parent Municipality 34 872 – -4% 35.3% 4 46 436 60 443 ES-45 2 812 550 39 810 14.2% – 3 911 24 248 26 859 (2 611) -10% 51 353 Table SC9 Monthly Budget Statement - actuals and revised targets for cash receipts Description August July R thousands 2013/14 Medium Term Revenue & Budget Year 2014/15 Ref Sept October Nov Dec 1 Outcome Outcome Outcome Outcome Outcome Outcome Expenditure Framework January Feb March April May June Budget Budget Budget Budget Budget Budget Budget Year Budget Year Budget Year 2014/15 +1 2015/16 +2 2016/17 Cash Receipts By Source Property rates – – – – – – – – – – – – Property rates - penalties & collection charges – – – – – – – – – – – – Service charges - electricity revenue – – – – – – – – – – – – Service charges - water revenue – – – – – – – – – – – – Service charges - sanitation revenue – – – – – – – – – – – – Service charges - refuse – – – – – – – – – – – – Service charges - other – – – – – – – – – – – – Rental of facilities and equipment – – – – – – – – – – – – 53 56 58 Interest earned - external investments 610 397 728 592 425 – – – – – – – 5 673 4 907 5 103 115 778 Interest earned - outstanding debtors – – – – – – – – – – – – Dividends received – – – – – – – – – – – – Fines – – – – – – – – – – – Licences and permits – – – – – – – – – – – Agency services – – – – – – – – – – – 39 815 1 348 – 1 380 32 617 – – – – – – – 101 083 108 725 334 67 642 480 182 – – – – – – – 92 80 80 40 759 1 812 1 370 2 452 33 225 – – – – – – – 106 901 113 767 121 019 57 60 62 106 958 113 827 121 081 57 884 Transfer receipts - operating Other revenue Cash Receipts by Source – Other Cash Flows by Source – – – – – – – – – – – Transfer receipts - capital – – – – – – – – – – – Contributions & Contributed assets – – – – – – – – – – Proceeds on disposal of PPE – – 10 – – – – – – – Short term loans – – – – – – – – – – – Borrowing long term/refinancing – – – – – – – – – – – Increase in consumer deposits – – – – – – – – – – – Receipt of non-current debtors – – – – – – – – – – – Receipt of non-current receivables – – – – – – – – – – – Change in non-current investments Total Cash Receipts by Source – – – – – – – – – – – – 40 759 1 812 1 370 2 462 33 225 – – – – – – – Cash Payments by Type Employee related costs Remuneration of councillors Interest paid – 3 512 3 827 3 630 3 722 5 671 – – – – – – – 51 668 55 090 439 481 443 451 442 – – – – – – – 5 874 6 145 6 431 – – – – – – – – – – – – 1 569 1 129 1 129 4 196 4 406 4 583 Bulk purchases - Electricity – – – – – – – – – – – – Bulk purchases - Water & Sewer – – – – – – – – – – – – 227 587 151 351 149 – – – – – – – – – – – – – – – – – – – Other materials Contracted services Grants and subsidies paid - other municipalities – – – – – – – – – – – – Grants and subsidies paid - other 3 849 962 1 731 1 193 5 627 – – – – – – – General expenses 1 455 917 1 766 1 655 1 311 – – – – – – – 13 203 13 895 14 444 9 483 6 774 7 721 7 371 13 200 – – – – – – – 115 186 111 460 114 525 – Cash Payments by Type Other Cash Flows/Payments by Type Capital assets 306 Repayment of borrowing – – 38 676 – 30 795 – 30 053 – – – – – – – – – – 9 23 – 279 – – – – – – – 4 539 749 950 – – – – – – – – – – 1 606 1 785 1 980 113 994 117 455 – Other Cash Flows/Payments – – – – – – – – – – – – Total Cash Payments by Type 9 789 6 782 7 744 7 371 13 478 – – – – – – – 121 331 NET INCREASE/(DECREASE) IN CASH HELD 30 970 (4 971) (6 374) (4 909) 19 746 – – – – – – – (14 373) (167) 3 626 87 934 118 904 113 933 107 560 103 339 – – – – – – – 97 333 82 960 82 793 118 904 113 933 107 560 113 840 123 085 – – – – – – – 82 960 82 793 86 419 Cash/cash equivalents at the month/year beginning: Cash/cash equivalents at the month/year end: ES-46 Table SC12 Monthly Budget Statement - capital expenditure trend 2013/14 Month Budget Year 2014/15 Audited Original Adjusted Monthly YearTD Outcome Budget Budget actual actual YearTD budget YTD variance R thousands YTD variance % spend of Original Budget % Monthly expenditure performance trend July 13 – – – – – August 34 198 – 28 28 198 170 86.1% 1% September 305 238 – 43 71 797 727 91.1% 1% October 154 361 – – – – – – 244 315 797 482 60.5% 6% – 573 888 797 (91) -11.4% 17% Nov ember December January 60 72 600 1 496 – February 247 187 – March 103 15 – April 16 2 746 – May 138 June 523 99 2 265 5 340 Total Capital expenditure – ES-47 – – 888 0% 0% Table SC13a Monthly Budget Statement - capital expenditure on new assets by asset class 2013/14 Description R thousands Ref Budget Year 2014/15 Audited Original Adjusted Monthly YearTD YearTD Outcome Budget Budget actual actual budget YTD YTD variance variance Full Year Forecast % 1 Capital expenditure on new assets by Asset Class/Sub-class Infrastructure – – – – – – – – Community – – – – – – – – Parks & gardens – Sportsfields & stadia – Sw imming pools – Community halls – Libraries – Recreational facilities – Fire, safety & emergency – Security and policing – Buses – Clinics – Museums & Art Galleries – Cemeteries – Social rental housing – Other – Heritage assets – – – – – – Buildings – – – – Other Investment properties – – – – – – – Housing dev elopment – – – Other Other assets General v ehicles Specialised v ehicles – – 1 029 3 754 – – 38 487 2 700 – – – – – – – – – – – 527 490 92.9% 3 606 2 579 Plant & equipment – 28 – – 5 14 9 61.4% 27 Computers - hardw are/equipment 96 858 – – 28 429 401 93.4% 840 Furniture and other office equipment 38 100 – – 4 50 46 91.7% 96 Abattoirs – – – – – – Markets – – – – – – Civ ic Land and Buildings – – – – – 409 68 – – – 100.0% 65 – – – – – Surplus Assets - (Inv estment or Inv entory ) – – – Other - Emergency Equipment – – – – – Other Buildings Other Land Agricultural assets – – – – 34 – – – – List sub-class Biological assets – – – – – – – – – List sub-class Intangibles Computers - softw are & programming – – – – – – – – – – – – – – Other Total Capital Expenditure on new assets 34 – – 1 1 029 3 754 ES-48 – – 38 527 490 92.9% 3 606 Table SC13b Monthly Budget Statement - capital expenditure on renewal of existing assets by asset class Budget Year 2014/15 2013/14 Description R thousands Ref Audited Original Adjusted Monthly YearTD YearTD Outcome Budget Budget actual actual budget YTD YTD variance variance Full Year Forecast % 1 Capital expenditure on renewal of existing assets by Asset Class/Sub-class Infrastructure – – – – – – – – Community – – – – – – – – Parks & gardens – Sportsfields & stadia – Sw imming pools – Community halls – Libraries – Recreational facilities – Fire, safety & emergency – Security and policing – Buses – Clinics – Museums & Art Galleries – Cemeteries – Social rental housing – Other Heritage assets – – – – – – – – Buildings – Other – Investment properties – – – – – – Other General v ehicles Specialised v ehicles – – – Housing dev elopment Other assets – – 1 236 1 586 – 573 850 393 (457) -116.2% 1 527 602 1 160 – 474 718 180 (538) -298.0% 1 144 – – – – – – – 21 – – 18 11 406 235 – – 14 118 104 88.4% 211 Furniture and other office equipment 58 36 – – 1 18 17 95.1% 30 Abattoirs – – – – – – Markets – – – – – – Civ ic Land and Buildings – – – – – 170 133 – 99 99 (33) -49.3% 122 – – – – – – – – – – – – – – – Plant & equipment Computers - hardw are/equipment Other Buildings Other Land Agricultural assets 20 – 67 – Surplus Assets - (Inv estment or Inv entory ) Other (8) -72.4% – – – – – – List sub-class – Biological assets – – – – – – – – – List sub-class – Intangibles – Computers - softw are & programming – – – – – – – – – Other Total Capital Expenditure on renewal of existing ass 1 – – 1 236 1 586 ES-49 – 573 850 393 (457) -116.2% 1 527 Table SC13c Monthly Budget Statement - expenditure on repairs and maintenance by asset class 2013/14 Description R thousands Ref Budget Year 2014/15 Audited Original Adjusted Monthly Outcome Budget Budget actual YearTD actual YearTD YTD budget YTD variance variance Full Year Forecast % 1 Repairs and maintenance expenditure by Asset Class/Sub-class Infrastructure – – – – – – – – Community – – – – – – – – Parks & gardens – Sportsfields & stadia – Sw imming pools – Community halls – Libraries – Recreational facilities – Fire, safety & emergency – Security and policing – Buses – Clinics – Museums & Art Galleries – Cemeteries – Social rental housing – Other Heritage assets – – – – – – – – Buildings – Other – Investment properties – – – – – – Housing dev elopment General v ehicles Specialised v ehicles Plant & equipment – – – Other Other assets – – 1 459 2 769 – 108 599 1 331 731 55.0% 2 645 245 477 – 23 136 239 102 42.9% 456 – – – – – – 5 53 – 2 2 27 24 92.0% 51 634 883 – 36 282 588 306 52.1% 844 Furniture and other office equipment 90 132 – – 3 66 62 94.7% 126 Abattoirs – – – – 52.1% 558 Computers - hardw are/equipment Markets – – – – – – – 442 584 – 35 140 Other Buildings – – – – Other Land – – Surplus Assets - (Inv estment or Inv entory ) – – – – 42 640 – 12 29 120 91 – – – – – – – Civ ic Land and Buildings Other - Emergency Equipment Agricultural assets 0 – 292 152 – 7 (7) #DIV/0! – 76.2% 611 – – List sub-class – Biological assets – – – – – – – – – List sub-class – Intangibles Computers - softw are & programming 1 744 1 814 1 744 1 814 – 23 669 677 8 1.1% 1 733 23 669 677 8 1.1% 1 733 36.8% 4 377 Other Total Repairs and Maintenance Expenditure – 3 202 4 583 ES-50 – 131 1 268 2 008 739 Table SC13d Monthly Budget Statement - depreciation by asset class 2013/14 Description R thousands Ref Budget Year 2014/15 Audited Original Adjusted Monthly Outcome Budget Budget actual YearTD actual YearTD YTD budget YTD variance variance Full Year Forecast % 1 Repairs and maintenance expenditure by Asset Class/Sub-class Infrastructure Community – 3 900 – – 200 – – 2 217 – 2 284 – 2 217 Parks & gardens – Sportsfields & stadia – Sw imming pools – Community halls – Libraries – Recreational facilities – Fire, safety & emergency – Security and policing – Buses – Clinics – Museums & Art Galleries – Cemeteries – Social rental housing Other Heritage assets – 200 – – – 2 217 – 2 284 – 2 217 (67) – – -3.0% 191 – – – – – – – – Housing dev elopment – – – Other – 160 4 930 – – 1 410 1 410 – 4 708 669 General v ehicles – 700 – – – – Specialised v ehicles – – – – – – Plant & equipment 191 – Other Other assets -3.0% – 3 900 Buildings Investment properties – – (67) 160 500 – – 167 167 – 478 Computers - hardw are/equipment – 900 – – 300 300 – 860 Furniture and other office equipment – 980 – – 327 327 – 936 Abattoirs – Markets – Civ ic Land and Buildings – Other Buildings – Other Land – 1 700 – Surplus Assets - (Inv estment or Inv entory ) Other Agricultural assets – 567 – – 567 – 1 624 – – – – 150 – – 50 50 – 143 – – – – – – – – – List sub-class – Biological assets – – – – – – – – – List sub-class – Intangibles Computers - softw are & programming 141 250 – – 83 83 – 239 141 250 – – 83 83 – 239 Other Total Repairs and Maintenance Expenditure Specialised vehicles – 4 200 – 5 380 – – – 2 217 – 3 777 – 3 710 – (67) – – Refuse Fire – Conserv ancy – Ambulances – ES-51 -1.8% 5 138 – 8. BUDGET 2015/16 The budget document that is tabled is prescribed by the Budget Regulations as published in Government Gazette of 17 April 2009. According to section 14 (1) (b), the budget must be realistic, credible and capable of being approved and implemented as tabled. This implies that the envisaged expenditure may not exceed the probable revenues and expected cash flows must be sufficient to cover all council’s financial responsibilities and service delivery targets. The content of the budget is illustrated by the following graphs and explanations. 8.1 Revenue by Source – R113 137 150 Detail breakdown in respect of revenue can be viewed in the budget – Table A1 & Table A4 (Page B1 & B 8 respectively). The graph clearly illustrates the district municipality’s high reliance on grants funding as the DM’s main source of revenue Main revenue stream – Grants 94% and interest on external investment 4%. The total revenue increase with 3.37% to R113 137 150 million. The biggest contributor is the increase in the equitable share. ES-52 8.2 Expenditure Main contributors as a percentage of the total expenditure: Transfer & Grants Employee Related Cost ( Councillors& Employees) Other Expenditure R 54,439,870 R 63,488,642 R 21,980,284 Table A1 & A4 on page B1& B8 and Supporting table SA 1 on page B 16 and B 17 provide a detailed breakdown of all expenditure. Salaries exceeded the prescribe norm of 35% norm as a result of the following reasons: Organogram approved by council is focused on external support to LM’s. 75 Positions are directly and / or indirectly involved in support to LM’s to the estimated amount of R15,12m or 68,80% of the total employee related costs budget; As part of council’s commitment for job creation and assisting youth to be developed for the labour market, Council employed 30 interns to the estimated amount of R1,90m – inclusive of five finance interns compulsory in terms of the FMG grant Furthermore council budgeted for 44 vacant and 5 unfunded positions to the value of R13, 21m. ES-53 Salaries increase is mainly due to: annual notch increments; annual salary increase based on the multi-year Salary and Wage Collective Agreement estimated at 7,2% for the year Transfers & Grants (Special Projects) increased from R42, 973m in respect of the previous budget year to an amount of R54, 440m. The funding of these projects consists of contributions from government grants – R13, 16m and own revenue – R29, 11m Other Expenditure mainly inclusive of non-priority expenditure such as printing & stationery, advertising costs, motor vehicle usage, subsistence & travelling, accommodation and transportation reflects an increase of R6, 447m compare to the previous budget year. Expenditure by Type – Mayor (Continues): ES-54 Graph clearly illustrates the increasing trends in other expenditure and transfers & grants compare to the previous years as well as the increasing trends in employee related cost excluding councillor’s remuneration. Councillor’s remuneration reflects a fair increase over the past years based on the Remuneration of Public Office Bearers Act, 1998 (Act No. 20 0f 1998) 8.5 Expenditure by Type – Minor: Expenditure relating to minor expenditure consists mainly of finance charges, depreciation & asset impairment and other materials which remains fairly consistent compare to the previous expenditure patterns. The increase in depreciation is mainly due to the acquirement of new and replacement of property, plant and equipment needed to fulfil the municipality’s mandate. This includes capital items such as motor vehicles, computer equipment and other office furniture etc. A detail list of the capital needs can be viewed in table SA 36 on page B64. ES-55 8.6 Capital Expenditure – 12 579 670 The increase in capital expenditure is based on the needs of the municipality for plant and equipment and vehicles to combat fires. Capital expenditure consists of the acquiring of new assets and the replacement of assets. CAPITAL EXPENDITURE BY STANDARD CLASSIFICATION TRENDS 9 000 8 000 7 000 6 000 5 000 Rm 4 000 3 000 2 000 1 000 Housing 11/12 AUD 12/13 AUD 13/14 AUD 42 535 73 CY 14/15 CY 14/15 CY 14/15 BUD BUD BUD Budget Year 15/16 44 44 60 640 18 18 18 420 8 130 Budget Year +1 16/17 Budget Year +2 17/18 135 135 1 200 800 Tourism Environmental protection Information Technology Civil Defense 1 2 470 1 074 2 746 2 762 2 774 Human Resources 584 531 359 738 868 665 Other Admin 593 874 1 519 3 539 3 700 3 514 593 Municipal Manager 101 53 18 18 20 613 Corporate services Budget and treasury office Executive and council Planning and development 3 7 14 7 693 1 358 1 365 1 636 112 59 187 187 189 115 163 209 151 550 170 1 339 295 1 853 138 1 313 ES-56 730 8.7 Capital Expenditure – Funding Source CAPITAL EXPENDITURE BY FUNDING SOURCE 14 000 12 000 10 000 8 000 Rm 6 000 4 000 2 000 Internally generated funds 11/12 AUD 12/13 AUD 13/14 AUD 2 382 4 344 2 553 CY 14/15 CY 14/15 CY 14/15 BUD BUD BUD 5 279 5 845 5 570 Budget Year 15/16 Budget Year +1 16/17 Budget Year +2 17/18 12 580 1 335 935 Borrowing Public contributions & donations Table A5 on page B15 as well as other supporting documentation - SA34a to SA36 has further reference and breakdown relating to capital expenditure 8.8 Projected Cash Flows CASH FLOW TREND 20 000 15 000 10 000 5 000 Rm (5 000) (10 000) (15 000) 11/12 AUD 12/13 AUD 13/14 AUD CY 14/15 CY 14/15 CY 14/15 BUD BUD BUD Budget Year 15/16 Budget Year +1 16/17 Budget Year +2 17/18 Cash Flow - Op. Activities 16 751 5 441 8 832 (8 285) (6 906) 5 912 (11 874) (188) 2 297 Cash Flow - Investing (used) (2 375) (6 758) (3 017) (4 482) (4 656) (1 926) (11 659) (1 619) (1 098) Cash Flow - Financing (1 289) (1 333) (1 445) (1 606) (1 606) (1 556) (1 111) (1 173) (1 235) ES-57 The decrease in cash is mainly as a result of the utilisation of cash reserves to assist the local municipalities in the district to fund basic infrastructure and social priorities as per community needs assessment form the respective IDP’s. However the district municipality will not be in a position to sustain the high level of reserve funding. 8.9 Other EXPENDITURE ANALYSIS OF TOTAL REVENUE 70% 60% 50% 40% 30% 20% 10% 0% Rm CY CY CY 11/12 12/13 13/14 14/15 14/15 14/15 AUD AUD AUD BUD BUD BUD Repairs & Maintenance Budg et Year 15/16 Budg Budg et et Year Year +1 +2 16/17 17/18 36% 39% 40% 50% 50% 42% 51% 51% 52% Finance charges & Depreciation 41% 44% 45% 56% 55% 53% 56% 57% 58% Remuneration 5% 5% 5% 6% 6% 6% 6% 6% 5% Employee costs 0% 0% 0% 0% 0% 0% 0% 0% 0% Special projects 28% 35% 33% 40% 38% 38% 48% 37% 35% Above mentioned graph illustrates the ration of expenditure by type versus the total revenue. 9. SERVICE DELIVERY AND PROPOSED TARIFFS Council reviewed and amended its tariff policy in respect of the 2014/15 budget year and the following proposed tariffs will be for implementation effective from 1 July 2014: Sundry Charges: Finance & Administration:• Rental of Council Facilities Lecture room: R1, 500 per day per room, excluding VAT If both 1 & 2 utilised: R2, 500 per day, excluding VAT Projector required: R 300 per day, excluding VAT ES-58 . A refundable breakage deposit of 20% of total rent amount. • Tender Documents – Bids from R200,000 to R500000: R100-00 non-refundable deposit (Under discretion of Municipal Manager) – Bids from R500, 001 and More R200-00 non-refundable deposit (Under Discretion of Municipal Manager Planning and Development:• 10. Rental of Plant & Machinery - Grader R910.00 per hour, excluding VAT POLICY REVIEWS In accordance with the MFMA the mayor of a municipality must co-ordinate the processes for preparing the annual budget and for reviewing the municipality’s integrated development plan and budget-related policies to ensure that the tabled budget and any revisions of the integrated development plan and budget-related policies are mutually consistent and credible. Therefore all budget related policies have been reviewed during the course of the financial year and any amendments if necessary will be implemented as an ongoing process during the 2013/14 budget year. The following policies have been classified as budget related: • Asset management Policy Approved on 26 May 2010 – Due for review and amendments during April / May 2013 • Debt and Credit Control Policy Approved on 25 May 2005 – Due for review and update during April / May 2013 • Indigent Policy Approved on 25 May 2005 – To be repealed as a result of the abolishment of the District Management Area during April / May 2013 • Tariff Policy Approved on 26 May 2010 – Amendments as an on-going procedure as and if required • Investment Policy Approved on 26 May 2010 – Amendments as an on-going procedure as and if required • Supply Chain Management Policy Approved on 27 November 2007 – Due for review and amendments during April / May 2013 • Property Rates Policy Approved on 27 May 2009 – To be repealed as a result of the abolishment of the District Management Area during April / May 2013 ES-59 QUALITY CERTIFICATE BUDGET TABLES DC9 Frances Baard - Table A1 Budget Summary Description R thousands Financial Performance Property rates Service charges Investment revenue Transfers recognised - operational Other own revenue 2015/16 Medium Term Revenue & Expenditure Framework Current Year 2014/15 2011/12 2012/13 2013/14 Audited Outcome Audited Outcome Audited Outcome Original Budget Adjusted Budget Full Year Forecast Budget Year 2015/16 Budget Year +1 2016/17 Budget Year +2 2017/18 – – 5 491 88 914 840 95 246 – – 5 672 94 579 1 670 101 921 – – 5 841 95 053 1 185 102 079 – – 5 673 101 083 1 236 107 992 – – 5 673 102 898 1 236 109 807 – – 5 673 102 932 717 109 321 – – 5 443 106 509 1 185 113 137 – – 5 648 112 246 1 244 119 138 – – 5 820 118 711 1 294 125 825 34 634 4 595 22 562 2 471 2 314 26 382 12 746 105 704 (10 458) – – (10 458) 39 423 5 160 3 429 2 318 2 569 35 437 11 189 99 524 2 396 – – 2 396 41 012 5 424 4 050 2 300 3 376 33 666 12 582 102 412 (333) – – (333) 54 388 6 055 5 380 2 854 5 245 42 973 15 736 132 631 (24 639) – – (24 639) 54 407 6 055 5 380 2 854 5 325 41 803 18 063 133 887 (24 080) – – (24 080) 45 446 6 055 4 679 2 903 4 115 41 803 17 709 122 711 (13 390) – – (13 390) 57 152 6 337 5 615 3 111 4 046 54 440 22 193 152 895 (39 757) – – (39 757) 61 181 6 574 5 635 3 173 4 048 44 424 20 660 145 693 (26 555) – – (26 555) 65 539 6 822 5 655 3 235 4 205 43 796 21 357 150 609 (24 784) – – (24 784) – (10 458) – 2 396 – (333) – (24 639) – (24 080) – (13 390) – (39 757) – (26 555) – (24 784) 2 382 – – – 2 382 2 382 6 008 1 664 – – 4 344 6 008 2 553 – – – 2 553 2 553 5 279 – – – 5 279 5 279 5 845 – – – 5 845 5 845 5 570 – – – 5 570 5 570 12 580 – – – 12 580 12 580 1 335 – – – 1 335 1 335 935 – – – 935 935 93 212 57 283 14 905 34 012 101 578 91 151 58 668 12 802 33 042 103 975 96 192 56 583 15 921 33 232 103 623 85 360 57 105 12 786 29 685 99 995 87 463 57 614 12 786 29 685 102 606 93 663 58 245 16 786 34 000 101 122 68 820 59 760 17 000 36 000 75 580 65 841 54 960 17 000 36 000 67 800 65 805 49 740 17 000 36 000 62 545 Cash flows Net cash from (used) operating Net cash from (used) investing Net cash from (used) financing Cash/cash equivalents at the year end 16 751 (2 375) (1 289) 86 214 5 441 (6 758) (1 333) 83 564 8 832 (3 017) (1 445) 87 934 (8 285) (4 482) (1 606) 82 960 (6 906) (4 656) (1 606) 84 165 5 912 (1 926) (1 556) 90 365 (11 874) (11 659) (1 111) 65 720 (188) (1 619) (1 173) 62 741 2 297 (1 098) (1 235) 62 705 Cash backing/surplus reconciliation Cash and investments available Application of cash and investments Balance - surplus (shortfall) 89 114 16 455 72 659 87 364 34 788 52 576 92 334 22 261 70 073 82 960 40 264 42 695 84 165 40 264 43 901 90 365 (16 985) 107 350 65 720 23 000 42 720 62 741 26 100 36 641 62 705 28 470 34 235 Asset management Asset register summary (WDV) Depreciation & asset impairment Renewal of Existing Assets Repairs and Maintenance 46 869 22 562 433 2 314 48 288 3 429 2 392 2 569 46 373 4 050 1 289 3 376 47 431 5 380 1 686 5 245 47 939 5 380 1 710 5 325 47 940 4 679 1 179 4 115 50 129 5 615 1 047 4 046 45 829 5 635 1 335 4 048 41 109 5 655 935 4 205 Total Revenue (excluding capital transfers and contributions) Employee costs Remuneration of councillors Depreciation & asset impairment Finance charges Materials and bulk purchases Transfers and grants Other expenditure Total Expenditure Surplus/(Deficit) Transfers recognised - capital Contributions recognised - capital & contributed assets Surplus/(Deficit) after capital transfers & contributions Share of surplus/ (deficit) of associate Surplus/(Deficit) for the year Capital expenditure & funds sources Capital expenditure Transfers recognised - capital Public contributions & donations Borrowing Internally generated funds Total sources of capital funds Financial position Total current assets Total non current assets Total current liabilities Total non current liabilities Community wealth/Equity Free services Cost of Free Basic Services provided Revenue cost of free services provided Households below minimum service level Water: Sanitation/sewerage: Energy: Refuse: – – – – – – – – – – – – – – – – – – – – – – – – – – – – – – – – – – – – – – – – – – – – – – – – – – – – – – B1 OTHER RELATED SUPPORTING DOCUMENTATION DC9 Frances Baard - Supporting Table SA1 Supportinging detail to 'Budgeted Financial Performance' Description R thousand REVENUE ITEMS: Property rates Total Property Rates less Revenue Foregone Net Property Rates 2011/12 2012/13 2013/14 Audited Outcome Audited Outcome Audited Outcome 2015/16 Medium Term Revenue & Expenditure Framework Current Year 2014/15 Original Budget Adjusted Budget Full Year Forecast Budget Year 2015/16 Budget Year +1 Budget Year +2 2016/17 2017/18 – – – – – – – – – Service charges - electricity revenue Total Service charges - electricity revenue less Revenue Foregone Net Service charges - electricity revenue – – – – – – – – – Service charges - water revenue Total Service charges - water revenue less Revenue Foregone Net Service charges - water revenue – – – – – – – – – Service charges - sanitation revenue Total Service charges - sanitation revenue less Revenue Foregone Net Service charges - sanitation revenue – – – – – – – – – Service charges - refuse revenue Total refuse removal revenue Total landfill revenue less Revenue Foregone Net Service charges - refuse revenue – – – – – – – – – 251 82 996 77 – 300 115 115 180 53 55 58 333 1 073 300 115 115 180 53 55 58 24 103 3 724 1 088 58 209 1 892 181 528 799 883 141 1 029 34 634 27 205 4 227 1 269 54 366 2 302 192 413 1 025 1 121 209 1 038 39 423 28 992 4 438 1 390 138 434 2 590 183 206 745 1 404 131 360 41 012 39 164 6 291 1 814 – 464 3 784 220 221 629 860 193 748 54 388 39 164 6 291 1 814 – 464 3 784 239 221 629 860 193 748 54 407 32 286 4 917 1 494 – 464 3 268 183 257 637 860 244 833 45 446 42 131 7 390 451 78 440 3 426 193 242 780 934 213 874 57 152 45 399 7 970 451 72 440 3 426 159 242 827 1 007 230 959 61 181 48 904 8 586 451 72 440 3 426 159 242 876 1 085 248 1 052 65 539 34 634 39 423 41 012 54 388 54 407 45 446 57 152 61 181 65 539 Other Revenue by source Actuarial Gains Other income Total 'Other' Revenue EXPENDITURE ITEMS: Employee related costs Basic Salaries and Wages Pension and UIF Contributions Medical Aid Contributions Overtime Performance Bonus Motor Vehicle Allowance Cellphone Allowance Housing Allowances Other benefits and allowances Payments in lieu of leave Long service awards Post-retirement benefit obligations sub-total Less: Employees costs capitalised to PPE Total Employee related costs Contributions recognised - capital List contributions by contract Total Contributions recognised - capital Depreciation & asset impairment Depreciation of Property, Plant & Equipment Lease amortisation Capital asset impairment Depreciation resulting from revaluation of PPE Total Depreciation & asset impairment – 3 898 – 18 665 – 22 562 – 3 429 – – – 3 429 – – – – – – – 4 050 5 380 5 380 4 679 5 615 5 635 5 655 4 050 5 380 5 380 4 679 5 615 5 635 5 655 B1 DC9 Frances Baard - Supporting Table SA1 Supportinging detail to 'Budgeted Financial Performance' Description Bulk purchases Electricity Bulk Purchases Water Bulk Purchases Total bulk purchases 2011/12 2012/13 2013/14 Audited Outcome Audited Outcome Audited Outcome – Transfers and grants Cash transfers and grants Non-cash transfers and grants Total transfers and grants 135 26 247 26 382 – 135 35 302 35 437 2015/16 Medium Term Revenue & Expenditure Framework Current Year 2014/15 Original Budget – 135 33 531 33 666 Adjusted Budget – 135 42 838 42 973 Full Year Forecast – 135 41 668 41 803 Budget Year 2015/16 – 135 41 668 41 803 – 135 54 305 54 440 Budget Year +1 Budget Year +2 2016/17 2017/18 – 135 44 289 44 424 – 135 43 661 43 796 Contracted services List services provided by contract Allocations to organs of state: Electricity Water Sanitation Other Total contracted services sub-total – – – – – – – – – – – – – – – – – – B2 DC9 Frances Baard - Supporting Table SA1 Supportinging detail to 'Budgeted Financial Performance' Description Other Expenditure By Type Collection costs Contributions to 'other' provisions Consultant fees Audit fees General expenses Advertisement Affiliation Fees Bank Charges Printing, stationery & publications Entertaiment Free basic services Motor vehicle oprating cost Motot vehicle usage Insurance Actuarial Losses Municipal services & Taxes Postage Office requirements Pauper Burials Protective clothing Relocation Cost Rentals Security Services Telekommunications Training, Study Busaries, Cinference & Seminars Accommpdation Transportation Total 'Other' Expenditure 2011/12 2012/13 2013/14 Audited Outcome Audited Outcome Audited Outcome 2 512 1 330 487 680 306 53 462 213 – 755 (63) 272 763 749 6 22 5 15 44 58 414 501 985 927 635 12 130 212 1 401 194 874 400 65 652 234 – 780 (0) 194 – 1 085 11 4 12 17 36 46 455 527 1 245 859 838 10 138 2 314 2015/16 Medium Term Revenue & Expenditure Framework Current Year 2014/15 Original Budget 444 1 580 279 1 196 415 64 544 209 Adjusted Budget Full Year Forecast Budget Year 2015/16 Budget Year +1 Budget Year +2 2016/17 2017/18 545 448 1 352 815 355 12 184 1 946 1 700 526 1 059 550 70 860 233 – 976 (592) 350 500 1 522 15 24 24 31 100 24 712 775 1 995 1 072 1 061 15 533 2 156 1 950 535 1 069 550 70 951 237 – 1 060 (580) 390 1 285 1 612 15 24 24 36 350 24 887 735 2 034 1 222 1 223 17 860 2 156 2 482 238 1 080 556 50 723 256 – 936 888 604 500 1 612 8 19 10 38 108 24 590 599 1 806 1 209 1 018 17 509 3 730 2 200 418 1 136 589 83 1 101 314 – (152) 1 366 391 1 200 1 796 20 13 12 47 250 24 1 183 757 2 217 1 942 1 345 21 980 1 409 2 300 438 1 193 618 87 1 270 329 – (203) 1 430 410 1 200 1 886 21 14 12 49 263 24 1 243 714 2 336 2 006 1 393 20 440 1 442 2 400 456 1 244 643 90 1 320 343 – (245) 1 482 426 1 200 1 963 22 14 12 51 273 25 1 292 740 2 443 2 066 1 427 21 128 2 569 3 376 5 245 5 325 4 115 4 046 4 048 4 205 2 314 2 569 3 376 5 245 5 325 4 115 4 046 4 048 4 205 (0) 1 0 745 6 240 1 264 1 239 11 10 18 402 by Expenditure Item Employee related costs Other materials Contracted Services Other Expenditure Total Repairs and Maintenance Expenditure check B3 – – 0 – – – DC9 Frances Baard - Supporting Table SA2 Matrix Financial Performance Budget (revenue source/expenditure type and dept.) Description R thousand Revenue By Source Property rates Property rates - penalties & collection charges Service charges - electricity revenue Service charges - water revenue Service charges - sanitation revenue Service charges - refuse revenue Service charges - other Rental of facilities and equipment Interest earned - external investments Interest earned - outstanding debtors Dividends received Fines Licences and permits Agency services Other revenue Transfers recognised - operational Gains on disposal of PPE Total Revenue (excluding capital transfers and contrib Expenditure By Type Employee related costs Remuneration of councillors Debt impairment Depreciation & asset impairment Finance charges Bulk purchases Other materials Contracted services Transfers and grants Other expenditure Loss on disposal of PPE Total Expenditure Surplus/(Deficit) Transfers recognised - capital Contributions recognised - capital Contributed assets Surplus/(Deficit) after capital transfers & contributions Vote 1 Executive & Council Vote 2 - Budget & Treasury Vote 3 Corporate Services Vote 4 Vote 5 - Project Vote 6 - [NAME Vote 7 - [NAME Vote 8 - [NAME Vote 9 - [NAME Planning & Management & OF VOTE 6] OF VOTE 7] OF VOTE 8] OF VOTE 9] Development Advisory Services 72 5 443 4 891 4 891 11 420 6 337 3 53 88 467 60 94 095 Vote 10 [NAME OF VOTE 10] Vote 11 [NAME OF VOTE 11] Vote 12 [NAME OF VOTE 12] Vote 13 [NAME OF VOTE 13] Vote 14 [NAME OF VOTE 14] Vote 15 [NAME OF VOTE 15] – – – – – – – – 1 072 5 443 – – – – – 53 106 509 60 113 137 57 152 6 337 3 5 615 3 111 – 4 046 – 57 046 19 374 210 152 895 1 000 630 940 11 581 630 940 12 581 9 895 15 122 9 858 10 857 4 085 3 111 1 338 – – – – – – – – – 193 257 1 343 1 906 262 278 1 776 5 983 1 734 6 335 10 246 1 698 39 154 3 639 25 776 4 136 1 719 210 24 499 26 435 22 064 54 121 – – – – – – – – – – (20 885) 69 597 (25 805) (21 124) (41 540) – – – – – – – – – – (20 885) 69 597 (25 805) (21 124) (41 540) – – – – – – – – – – B1 Total (39 757) – – – (39 757) DC9 Frances Baard - Supporting Table SA3 Supportinging detail to 'Budgeted Financial Position' Description R thousand ASSETS Call investment deposits Call deposits < 90 days Other current investments > 90 days Total Call investment deposits 2011/12 2012/13 2013/14 Audited Outcome Audited Outcome Audited Outcome 2 900 2 900 83 200 3 800 87 000 2015/16 Medium Term Revenue & Expenditure Framework Current Year 2014/15 Original Budget 78 000 4 400 82 400 Adjusted Budget 77 879 4 000 81 879 Full Year Forecast 77 000 4 000 81 000 Budget Year 2015/16 Budget Year +1 Budget Year +2 2017/18 2016/17 – – – – Consumer debtors Consumer debtors Less: Provision for debt impairment Total Consumer debtors – – – – – – – – – Debt impairment provision Balance at the beginning of the year Contributions to the provision Bad debts written off Balance at end of year – – – – – – – – – Property, plant and equipment (PPE) PPE at cost/valuation (excl. finance leases) Leases recognised as PPE Less: Accumulated depreciation Total Property, plant and equipment (PPE) 78 315 81 821 83 753 79 383 32 341 45 974 34 381 47 439 38 156 45 597 LIABILITIES Current liabilities - Borrowing Short term loans (other than bank overdraft) Current portion of long-term liabilities Total Current liabilities - Borrowing 1 333 1 333 1 444 1 444 5 369 2 179 Trade and other payables Trade and other creditors Unspent conditional transfers VAT Total Trade and other payables Non current liabilities - Borrowing Borrowing Finance leases (including PPP asset element) Total Non current liabilities - Borrowing Provisions - non-current Retirement benefits List other major provision items Refuse landfill site rehabilitation Other Total Provisions - non-current CHANGES IN NET ASSETS Accumulated Surplus/(Deficit) Accumulated Surplus/(Deficit) - opening balance GRAP adjustments Restated balance Surplus/(Deficit) Appropriations to Reserves Transfers from Reserves Depreciation offsets Other adjustments Accumulated Surplus/(Deficit) Reserves Housing Development Fund Capital replacement Self-insurance Other reserves Revaluation Total Reserves TOTAL COMMUNITY WEALTH/EQUITY 79 891 – 33 381 46 511 92 471 93 806 94 741 33 381 46 003 79 891 – 33 381 46 511 43 771 48 700 49 406 44 400 55 061 39 680 1 606 1 606 1 786 1 786 1 786 1 786 1 786 1 786 2 000 2 000 2 000 2 000 2 000 2 000 4 171 327 6 219 346 4 500 – 4 500 7 000 7 000 7 000 7 000 7 547 4 499 6 566 4 500 4 500 7 000 7 000 7 000 7 000 11 486 10 041 8 435 6 685 6 685 9 000 9 000 9 000 9 000 11 486 10 041 8 435 6 685 6 685 9 000 9 000 9 000 9 000 22 526 23 001 24 797 23 000 23 000 25 000 27 000 27 000 27 000 22 526 23 001 24 797 23 000 23 000 25 000 27 000 27 000 27 000 76 169 9 839 86 008 (10 458) (3 450) 2 340 238 74 677 75 948 88 294 88 294 88 294 74 460 74 460 66 500 74 677 2 396 (6 781) 5 229 446 75 948 (333) (3 662) 2 553 312 66 500 (24 784) (935) 74 819 88 294 (13 390) (5 340) 5 340 446 (890) 74 460 74 460 (26 555) (1 335) 75 967 88 294 (24 080) (5 340) 5 340 446 (16 328) 48 332 74 460 (39 757) (12 580) 74 677 88 294 (24 639) (5 340) 5 340 446 9 232 73 333 53 457 75 580 19 931 66 500 19 529 60 310 5 522 7 074 8 182 7 102 2 235 20 933 28 008 103 975 20 622 28 804 103 623 19 560 26 662 99 995 7 102 – – 19 560 26 662 101 122 1 300 21 379 26 901 101 578 7 102 – – 19 560 26 662 74 994 1 300 67 800 2 235 62 545 Total capital expenditure includes expenditure on nationally significant priorities: Provision of basic services B1 – 75 580 DC9 Frances Baard - Supporting Table SA4 Reconciliation of IDP strategic objectives and budget (revenue) Strategic Objective R thousand Basic Services Municipal Institutional Development And Transformation Local Economic Development Municipal Financial Viability and Management Good Governance and Public Participation Goal Provision & maintenance of infrastructure & basic services Housing Social Services Planning & Development Environmental Health Fire Fighting & Disaster Management Local economic Development & Tourism To effectively manage the revenue and expenditure functions of the municipality To implement an effective system of budgeting and in year reporting procedures Good Governance Allocations to other priorities Total Revenue (excluding capital transfers and contributions) Goal Code 2015/16 Medium Term Revenue & Expenditure Framework Current Year 2014/15 2011/12 2012/13 2013/14 Audited Outcome 9 101 Audited Outcome 9 609 Audited Outcome 9 138 Original Budget 8 960 Adjusted Budget 8 960 Full Year Forecast 8 878 3 149 983 1 000 – 1 380 1 380 1 400 1 400 1 400 1 200 5 062 – 733 3 006 2 288 978 3 008 600 934 3 000 315 934 3 000 315 934 3 000 315 940 – 630 960 – 630 1 033 – 630 – – 150 15 15 15 – – – 73 722 79 737 82 239 88 835 89 170 88 766 92 845 100 334 106 785 1 250 2 246 1 250 1 250 1 250 1 250 1 250 1 250 1 250 1 763 3 318 3 716 4 683 4 783 4 783 4 891 5 110 5 110 95 246 101 921 102 079 107 992 109 807 109 321 113 137 119 138 125 825 B1 Budget Year Budget Year +1 Budget Year +2 2015/16 2016/17 2017/18 11 181 9 454 9 617 DC9 Frances Baard - Supporting Table SA5 Reconciliation of IDP strategic objectives and budget (operating expenditure) Goal Code 2015/16 Medium Term Revenue & Expenditure Framework Current Year 2014/15 2011/12 2012/13 2013/14 Audited Outcome 38 250 Audited Outcome 28 233 Audited Outcome 28 688 Original Budget 33 879 Adjusted Budget 34 049 Full Year Forecast 33 949 638 644 860 1 069 1 034 985 1 029 1 069 1 112 To facilitate and support provision of housing 3 168 3 973 3 487 5 921 5 864 5 051 6 885 6 305 6 700 Management of basic service delivery 2 262 1 603 1 785 2 043 2 046 1 967 3 409 2 034 2 167 Municipal Institutional Prepare and monitor Development And Transformation implementation of IDP 1 367 1 367 1 523 1 934 1 954 1 689 1 916 2 044 2 178 Mange of planning & Development services 2 616 2 162 2 573 2 664 2 750 2 595 2 653 2 794 2 996 To Prepare and Review Spatial Development Frameworks in Municipalities and DMA 1 245 1 297 966 3 205 2 668 2 178 3 898 3 143 2 804 Develop and supply geographic information services to users in the district 1 280 1 700 1 404 2 806 2 206 2 815 1 872 1 351 1 431 – – – – – – – Strategic Objective R thousand Basic Services Goal To facilitate and support the eradication of backlogs & maintenance of infrastructure Provision of basic services to other rural areas within DMA To support maintenance of municipal roads To facilitate community related services in the DMA Budget Year Budget Year +1 Budget Year +2 2015/16 2016/17 2017/18 42 798 34 036 34 272 – – Provision of effective IT service to all users & stakeholders 3 527 3 689 4 099 5 867 6 031 4 838 4 142 4 324 4 502 Provision of an efficient and effective HR & performance management Function 3 445 3 470 3 377 4 417 4 687 3 387 4 457 4 889 5 178 To manage auxiliary services efficiently and effectively 5 491 6 697 7 312 8 403 8 507 6 735 8 639 9 191 9 778 Rendering of effective environmental protection services an food safety programmes 3 691 1 797 1 991 2 851 2 692 2 655 2 364 2 519 2 681 Rendering of disaster management services in the district 3 352 3 958 4 405 5 060 5 414 4 303 6 833 7 203 7 587 Local Economic Development Enhance local economic development trough LED capacity building and tourism 5 079 6 456 6 147 9 110 9 247 9 221 11 725 13 370 13 770 Municipal Financial Viability and Management Ensure that all financial systems and procedures are managed properly and effectively 4 984 6 043 4 940 6 204 6 456 6 558 7 330 7 061 7 429 To implement a effective system of supply chain management 2 170 2 257 2 468 2 839 2 802 3 121 2 894 3 087 3 305 To implement an effective system of budgeting and in year reporting procedures 6 750 3 687 6 643 8 739 9 524 7 980 9 792 10 038 10 314 To effectively manage the revenue and expenditure functions of the municipality and ensure that proper asset To establish a support service to category "B" municipalities 3 118 3 777 4 020 3 118 3 175 3 712 4 483 4 379 4 604 658 410 B1 DC9 Frances Baard - Supporting Table SA5 Reconciliation of IDP strategic objectives and budget (operating expenditure) Strategic Objective R thousand Good Governance and Public Participation Goal Political oversight & administration Ensure accountable administration Legal & risk Unit Communication Services Goal Code 2012/13 2013/14 Audited Outcome 8 392 Audited Outcome 9 183 Audited Outcome 7 646 Original Budget 9 695 Adjusted Budget 9 978 Full Year Forecast 9 680 2 973 5 354 6 571 9 589 9 581 7 131 6 390 6 790 7 199 – – – 1 209 1 214 596 1 519 1 626 1 740 1 248 1 766 1 508 2 010 2 010 1 566 2 684 2 385 2 515 – – – – 1 577 1 647 1 718 102 412 132 631 133 887 122 711 152 895 145 693 150 609 Youth Development Allocations to other priorities Total Expenditure 2015/16 Medium Term Revenue & Expenditure Framework Current Year 2014/15 2011/12 105 704 99 524 B2 Budget Year Budget Year +1 Budget Year +2 2015/16 2016/17 2017/18 13 605 14 411 14 630 DC9 Frances Baard - Supporting Table SA6 Reconciliation of IDP strategic objectives and budget (capital expenditure) Strategic Objective Goal Goal Code 2011/12 2012/13 – Audited Outcome 182 178 – 6 – – – – – – A 42 535 73 44 44 60 640 – – A – 76 – – – – 327 – – Municipal Institutional Prepare and monitor Development And Transformation implementation of IDP B – – 19 – – – 12 – – Mange of planning & Development services B – – – – – – – – – To Prepare and Review Spatial Development Frameworks in Municipalities and DMA B – – – – – – – – – Develop and supply geographic information services to users in the district B 20 88 – 15 15 15 – – – To facilitate community related services in the DMA B Provision of effective IT service to all users & stakeholders B 584 531 359 738 868 665 438 135 135 Provision of an efficient and effective HR & performance management Function B – – 3 7 14 7 36 – – To manage auxiliary services efficiently and effectively B 9 343 83 30 38 50 119 – – Rendering of effective environmental protection services an food safety programmes B – – – 18 18 18 420 – – Rendering of disaster management services in the district B 1 2 470 1 074 2 746 2 762 2 774 8 130 – – R thousand Basic Services To facilitate and support the eradication of backlogs in infrastructure A Provision of basic services to other rural areas within DMA A To support maintenance of municipal roads A To support the maintenance of municipal infrastructure A To facilitate and support provision of housing Management of basic service delivery Audited Outcome 1 087 Audited Outcome 2015/16 Medium Term Revenue & Expenditure Framework Current Year 2014/15 2013/14 B1 Original Budget 88 Adjusted Budget 91 Full Year Forecast 107 Budget Year Budget Year +1 Budget Year +2 2015/16 2016/17 2017/18 1 000 – – DC9 Frances Baard - Supporting Table SA6 Reconciliation of IDP strategic objectives and budget (capital expenditure) Strategic Objective R thousand Local Economic Development Municipal Financial Viability and Management Good Governance and Public Participation Goal Goal Code 2015/16 Medium Term Revenue & Expenditure Framework Current Year 2014/15 2012/13 2013/14 Audited Outcome Audited Outcome Enhance local economic development trough LED capacity building and tourism C Audited Outcome 28 Ensure that all financial systems and procedures are managed properly and effectively D – – 1 100 107 100 7 – – To implement a effective system of supply chain management D – 57 22 92 92 92 – – – To implement an effective system of budgeting and in year reporting procedures D 3 – – – – – 18 – – To effectively manage the revenue and expenditure functions of the municipality and ensure that proper asset To establish a support service to category "B" municipalities D 293 1 796 670 1 166 1 166 1 444 705 1 200 800 Political oversight & administration E 2 – – – – – – – – Ensure accountable administration E 100 – 53 18 18 20 115 – – – – – 49 49 49 3 – – 36 112 6 120 120 120 610 – – 2 382 6 008 2 553 5 279 5 845 5 570 12 580 Communication Services – 2 Original Budget 48 Adjusted Budget 444 Full Year Forecast 48 Budget Year Budget Year +1 Budget Year +2 2015/16 2016/17 2017/18 – – – D Legal & Risk Unit Allocations to other priorities Total Capital Expenditure 2011/12 E B2 1 335 935 DC9 Frances Baard - Supporting Table SA7 Measureable performance objectives Description Vote1 - Executive & Council Good Governance and Public Participation Committee Services & Administration To ensure administrative support to Council and the Communications To implement projects in order to sustain a positive To facilitate communications programmes to improve To implement a support plan for staff morale and Internal Audit & Risk Management To assist in the risk management process in the To implement the approved Internal Audit plan. To comply with the shared services capacity Vote2 - Budget & Treasury Sound Financial Management Budget Office To ensure budget process & reporting mechanisms To ensure accurate & timeous reporting to all To compile & implement a financial plan. To support with capacity building & performance Revenue & Expenditure To maintain an effective payroll management system To ensure creditor payments as per legislation. To manage & maintain an effective revenue system. To manage financial resources according to councils To effectively manage councils assets. SCM To acquire goods & services timely in accordane with To maintain an effective store function in To promote & increase procurement with SMME's Support effective & efficient financial Support effective & efficient financial Budget office SCM Vote 3 - Corporate Services Provide an effective, efficient & economic ICT To create a conducive IT environment that enables To facilitate the creation of a conducive IT environment To institute business continuity in the district by 2016. To provide a fully effective human resource To provide, support & assistance with labour relations To provide, support & assist with organisational To provide, support & assist l/m's in the district with To provide, support & assist the l/m's in the district To ensure effective human resource planning. To ensure the establishment of a district HR forum. To ensure efficient, effective & economic To maintain quality customer-care services in the Rendering of administrative support Maintenance of machinery & payment of expenditure To render effective & sustained municipal To improve the quality of water in the district in To render municipal health education & awareness To ensure compliance of food products, food & nonTo render effective & sustained Ensure compliance to environmental policies & To render & or support environmental education & Vote4 - Planning & Development To manage the implementation & maintenance of an effective performance management system IDP/PMS To facilitate & administer performance plans & To facilitate four (4) quarterly reviews for section 57 To compile & submit four (4) quarterly institutional To facilitate the annual institutional performance To amend & update the performance management To support the implementation & maintenance of performance management in the local municipalities of the district IDP/PMS To ensure the implementation & maintenance of PMS To facilitate the preparation of credible IDP's in the district IDP/PMS To prepare & review the district IDP To support the preparation & review of IDP's in the To facilitate the review of identified sector plans To grow & diversify the district economy by optimising all available resources 2015/16 Medium Term Revenue & Expenditure Framework Current Year 2014/15 2011/12 2012/13 2013/14 Audited Outcome Audited Outcome Audited Outcome Original Budget Adjusted Budget Full Year Forecast Budget Year 2015/16 % compliance with 100.0% 100.0% 100.0% 100.0% 100.0% 100.0% 100.0% 100.0% 100.0% projects completed programmes completed % implementation of the 100.0% 100.0% 100.0% 100.0% 100.0% 100.0% 100.0% 100.0% 100.0% 100.0% 100.0% 100.0% 100.0% 100.0% 100.0% 100.0% 100.0% 100.0% 100.0% 100.0% 100.0% 100.0% 100.0% 100.0% 100.0% 100.0% 100.0% approved Internal Audit Plan % implementation of % compliance with i/a 100.0% 100.0% 100.0% 100.0% 100.0% 100.0% 100.0% 100.0% 100.0% 100.0% 100.0% 100.0% 100.0% 100.0% 100.0% 100.0% 100.0% 100.0% 100.0% 100.0% 100.0% 100.0% 100.0% 100.0% 100.0% 100.0% 100.0% % of compliance with % of compliance with % Implementation of % of identified programmes 100.0% 100.0% _ 100.0% 100.0% _ 100.0% 100.0% _ 100.0% 100.0% 100.0% 100.0% 100.0% 100.0% 100.0% 100.0% 100.0% 100.0% 100.0% 100.0% 100.0% 100.0% 100.0% 100.0% 100.0% 100.0% 100.0% 100.0% 100.0% 100.0% 100.0% 100.0% % of compliance with % of compliance with % of compliance with % of compliance with % of compliance with 100.0% 100.0% 100.0% 100.0% 100.0% 100.0% 100.0% 100.0% 100.0% 100.0% 100.0% 100.0% 100.0% 100.0% 100.0% 100.0% 100.0% 100.0% 100.0% 100.0% 100.0% 100.0% 100.0% 100.0% 100.0% 100.0% 100.0% 100.0% 100.0% 100.0% 100.0% 100.0% 100.0% 100.0% 100.0% 100.0% 100.0% 100.0% 100.0% 100.0% 100.0% 100.0% 100.0% 100.0% 100.0% % of compliance with % of compliance with % of compliance with 100.0% 100.0% 100.0% 100.0% 100.0% 100.0% 100.0% 100.0% 100.0% 100.0% 100.0% 100.0% 100.0% 100.0% 100.0% 100.0% 100.0% 100.0% 100.0% 100.0% 100.0% 100.0% 100.0% 100.0% 100.0% 100.0% 100.0% % of identified programmes % of identified programmes 100.0% 100.0% 100.0% 100.0% 100.0% 100.0% 100.0% 100.0% 100.0% 100.0% 100.0% 100.0% 100.0% 100.0% 100.0% 100.0% 100.0% 100.0% % of identified programmes % of identified programmes % of identified programmes 55.0% 60.0% _ 55.0% 65.0% _ 55.0% 65.0% _ 70.0% 70.0% 75.0% 70.0% 70.0% 75.0% 70.0% 70.0% 75.0% 80.0% 70.0% 80.0% 90.0% 70.0% 85.0% 100.0% 70.0% 95.0% % of compliance to % of identified programmes Excellent Service delivery to % of identified programmes % of identified programmes % of identified programmes 100.0% 100.0% 100.0% 100.0% 100.0% 100.0% 100.0% 100.0% 100.0% 100.0% 100.0% 100.0% 100.0% 100.0% 100.0% 100.0% 100.0% 100.0% 100.0% 100.0% 100.0% 100.0% 100.0% 100.0% 100.0% 100.0% 100.0% 100.0% 100.0% 100.0% 100.0% 100.0% 100.0% 100.0% 100.0% 100.0% 100.0% 100.0% 100.0% 100.0% 100.0% 100.0% 100.0% 100.0% 100.0% 100.0% 100.0% 100.0% 100.0% 100.0% 100.0% 100.0% 100.0% 100.0% % reduction in complaints Excellent Service delivery to % of compliance to 60.0% 100.0% 100.0% 65.0% 100.0% 100.0% 65.0% 100.0% 100.0% 75.0% 100.0% 100.0% 75.0% 100.0% 100.0% 75.0% 100.0% 100.0% 75.0% 100.0% 100.0% 75.0% 100.0% 100.0% 75.0% 100.0% 100.0% % of identified programmes % of identified programmes % of compliance to 100.0% 100.0% 100.0% 100.0% 100.0% 100.0% 60.0% 100.0% 100.0% 60.0% 100.0% 100.0% 60.0% 100.0% 100.0% 60.0% 100.0% 100.0% 60.0% 100.0% 100.0% 60.0% 100.0% 100.0% % of compliance to % of identified programmes 100.0% 100.0% 100.0% 100.0% 100.0% 100.0% 100.0% 100.0% 100.0% 100.0% 100.0% 100.0% 100.0% 100.0% 100.0% 100.0% 100.0% 100.0% % of compliance to % of compliance to % of compliance to % of compliance to % of compliance to 100.0% 100.0% 100.0% 100.0% 100.0% 100.0% 100.0% 100.0% 100.0% 100.0% 100.0% 100.0% 100.0% 100.0% 100.0% 100.0% 100.0% 100.0% 100.0% 100.0% 100.0% 100.0% 100.0% 100.0% 100.0% 100.0% 100.0% 100.0% 100.0% 100.0% 100.0% 100.0% 100.0% 100.0% 100.0% 100.0% 100.0% 100.0% 100.0% 100.0% 100.0% 100.0% 100.0% 100.0% 100.0% applicable legislation 50.0% 50.0% 60.0% 70.0% 70.0% 70.0% 70.0% 70.0% 70.0% applicable legislation applicable legislation applicable legislation 100.0% 100.0% 100.0% 100.0% 100.0% 100.0% 100.0% 100.0% 100.0% 100.0% 100.0% 100.0% 100.0% 100.0% 100.0% 100.0% 100.0% 100.0% 100.0% 100.0% 100.0% 100.0% 100.0% 100.0% 100.0% 100.0% 100.0% Unit of measurement B1 Budget Year +1 Budget Year +2 2016/17 2017/18 DC9 Frances Baard - Supporting Table SA7 Measureable performance objectives Description LED To promote & ensure SMME capacity building To promote & support the main economic sectors in To facilitate the development of LED strategies for To develop & promote tourism in the district Tourism To promote tourism enterprise development To facilitate the implementation of the Tourism BEE To support & co-ordinate local stakeholder To support tourism product owners to comply with the To market the district as a preferred tourism GIS To ensure that the GIS delivers on municipal To ensure that the GIS delivers on municipal To ensure that GIS is used as a planning tool in To document all GIS data in accordance with national To capacitate both the district & local municipalities To ensure user friendly GIS mapping applications To integrate FBDM's GIS data with other database To facilitate the development of sustainable human settlement through town planning legislation & policies in the district Spatial Planning To facilitate the development of Urban areas in To facilitate development of local municipalities in To ensure effective & efficient disaster risk Fire fighting & Disaster Management To build integrated institutional capacity for disaster To implement the disaster risk reduction management plan by 2014 To ensure effective & efficient response & recovery to To reduce the advers effect of veld fires in the district To comply with the veld & forest fires Act 101 of 1998 To build fire fighting capacity in the district To ensure the effective co-ordination of the To ensure the safeguarding of council's assets To adhere to Occupational Health & Safety To ensure that regular inspections are done as per the Vote 5 - Project Management & Advisory Services Provision of basic services Project Management Services To ensure sustainable municipal infrastructure identification To improve housing delivery within the framework of Housing To ensure that the district acquires level 3 2015/16 Medium Term Revenue & Expenditure Framework Current Year 2014/15 2011/12 2012/13 2013/14 Audited Outcome Audited Outcome Audited Outcome Original Budget Adjusted Budget Full Year Forecast Budget Year 2015/16 % of identified programmes % of identified programmes % of identified programmes 100.0% 100.0% 100.0% 100.0% 100.0% 100.0% 100.0% 100.0% 100.0% 100.0% 100.0% 100.0% 100.0% 100.0% 100.0% 100.0% 100.0% 100.0% 100.0% 100.0% 100.0% 100.0% 100.0% 100.0% 100.0% 100.0% 100.0% % of identified programmes Compliance to charter % of identified programmes % of identified programmes % of identified programmes 100.0% 100.0% 100.0% 100.0% 100.0% 100.0% 100.0% 100.0% 100.0% 100.0% 100.0% 100.0% 100.0% 100.0% 100.0% 100.0% 100.0% 100.0% 100.0% 100.0% 100.0% 100.0% 100.0% 100.0% 100.0% 100.0% 100.0% 100.0% 100.0% 100.0% 100.0% 100.0% 100.0% 100.0% 100.0% 100.0% 100.0% 100.0% 100.0% 100.0% 100.0% 100.0% 100.0% 100.0% 100.0% applicable policy Improved planning standards % of identified programmes information systems 100.0% 100.0% 100.0% 65.0% 65.0% 60.0% 100.0% 100.0% 100.0% 70.0% 70.0% 70.0% 100.0% 100.0% 100.0% 70.0% 70.0% 70.0% 100.0% 100.0% 100.0% 60.0% 60.0% 50.0% 100.0% 100.0% 100.0% 60.0% 60.0% 50.0% 100.0% 100.0% 100.0% 60.0% 60.0% 50.0% 100.0% 100.0% 100.0% 60.0% 60.0% 50.0% 100.0% 100.0% 100.0% 60.0% 60.0% 50.0% 100.0% 100.0% 100.0% 60.0% 60.0% 50.0% applicable legislation applicable legislation 100.0% 100.0% 100.0% 100.0% 100.0% 100.0% Integrated capacity building Implementation of plan 55.0% _ 60.0% 30.0% 60.0% 30.0% 75.0% 100.0% 75.0% 100.0% 75.0% 100.0% 75.0% 100.0% 75.0% 100.0% 75.0% 100.0% % of identified programmes 100.0% 100.0% 100.0% 100.0% 100.0% 100.0% 100.0% 100.0% 100.0% % of compliance to % of identified programmes 100.0% 100.0% 100.0% 100.0% 100.0% 100.0% 100.0% 100.0% 100.0% 100.0% 100.0% 100.0% 100.0% 100.0% 100.0% 100.0% 100.0% 100.0% % of compliance to applicable legislation 100.0% 100.0% 100.0% 100.0% 100.0% 100.0% 100.0% 100.0% 100.0% applicable Act 95.0% 100.0% 100.0% 100.0% 100.0% 100.0% 100.0% 100.0% 100.0% backlogs Funded projects 80.0% 85.0% 85.0% 90.0% 100.0% 100.0% 100.0% 100.0% 100.0% 100.0% 100.0% 100.0% 100.0% 100.0% 100.0% 100.0% 100.0% 100.0% % of compliance to 110.0% 115.0% 100.0% 100.0% 100.0% 100.0% 100.0% 100.0% 100.0% Unit of measurement Budget Year +1 Budget Year +2 2016/17 2017/18 And so on for the rest of the Votes 1. Include a measurable performance objective for each revenue source (within a relevant function) and each vote (MFMA s17(3)(b)) 2. Include all Basic Services performance targets from 'Basic Service Delivery' to ensure Table SA7 represents all strategic responsibilities 3. Only include prior year comparative information for individual measures where relevant activity occurred in that year/s DC9 Frances Baard - Entities measureable performance objectives Description Entity 1 - (name of entity) Insert measure/s description Unit of measurement 2011/12 2012/13 2013/14 Audited Outcome Audited Outcome Audited Outcome Entity 2 - (name of entity) To implement projects in order to sustain a positive Entity 3 - (name of entity) To implement projects in order to sustain a positive And so on for the rest of the Entities 1. Include a measurable performance objective as agreed with the parent municipality (MFMA s87(5)(d)) 2. Only include prior year comparative information for individual measures where relevant activity occurred in that year/s B2 2015/16 Medium Term Revenue & Expenditure Framework Current Year 2014/15 Original Budget Adjusted Budget Full Year Forecast Budget Year 2015/16 Budget Year +1 Budget Year +2 2016/17 2017/18 DC9 Frances Baard - Supporting Table SA8 Performance indicators and benchmarks Description of financial indicator Basis of calculation Borrowing Management Credit Rating Capital Charges to Operating Expenditure Capital Charges to Own Revenue Borrowed funding of 'own' capital expenditure Safety of Capital Gearing Liquidity Current Ratio Current Ratio adjusted for aged debtors Interest & Principal Paid /Operating Expenditure Finance charges & Repayment of borrowing /Own Revenue Borrowing/Capital expenditure excl. transfers and grants and contributions Long Term Borrowing/ Funds & Reserves Outstanding Debtors to Revenue Longstanding Debtors Recovered Creditors Management Creditors System Efficiency Total Outstanding Debtors to Annual Revenue Debtors > 12 Mths Recovered/Total Debtors > 12 Months Old 2013/14 Audited Outcome Audited Outcome Audited Outcome Original Budget Adjusted Budget Full Year Forecast Budget Year 2015/16 Budget Year +1 2016/17 Budget Year +2 2017/18 3.6% 3.7% 3.7% 3.4% 3.3% 3.6% 2.8% 3.0% 3.0% 59.4% 49.7% 53.3% 64.5% 64.5% 69.8% 63.7% 63.0% 62.8% 0.0% 0.0% 0.0% 0.0% 0.0% 0.0% 0.0% 0.0% 0.0% 42.7% 35.9% 6.3 6.3 29.3% 7.1 7.1 6.0 25.1% 6.0 6.0 6.8 25.1% 6.7 6.7 5.8 33.8% 6.8 6.8 6.5 0.0% 692.3% 5.6 5.6 6.6 4.0 4.0 5.4 402.7% 3.9 3.9 3.9 3.9 3.9 3.7 3.7 0.0% 0.0% 0.0% 0.0% 0.0% 0.0% 0.0% 0.0% 0.0% 0.0% 0.0% 0.0% 0.0% 0.0% 0.0% 0.0% 0.0% 14.2% 13.0% 12.9% 10.8% 11.4% 11.5% 10.4% 9.5% 8.6% 6.2% 5.0% 7.1% 5.4% 5.3% 7.7% 10.7% 11.2% 11.2% 36.4% 38.7% 40.2% 50.4% 49.5% 41.6% 50.5% 51.4% 52.1% 41.2% 43.7% 45.5% 56.0% 55.1% 52.6% 56.1% 56.9% 57.5% 2.4% 2.5% 3.3% 4.9% 4.8% 3.8% 3.6% 3.4% 3.3% % of Creditors Paid Within Terms (within`MFMA' s 65(e)) Creditors to Cash and Investments Other Indicators 2012/13 Current assets/current liabilities Current assets less debtors > 90 days/current liabilities Monetary Assets/Current Liabilities Liquidity Ratio Revenue Management Annual Debtors Collection Rate (Payment Level Last 12 Mths Receipts/Last 12 Mths Billing %) Current Debtors Collection Rate (Cash receipts % of Ratepayer & Other revenue) 2015/16 Medium Term Revenue & Expenditure Framework Current Year 2014/15 2011/12 Total Volume Losses (kW) Total Cost of Losses (Rand '000) Electricity Distribution Losses (2) % Volume (units purchased and generated less units sold)/units purchased and generated Total Volume Losses (kℓ) Total Cost of Losses (Rand '000) Water Distribution Losses (2) Employee costs Remuneration Repairs & Maintenance Finance charges & Depreciation IDP regulation financial viability indicators i. Debt coverage ii.O/S Service Debtors to Revenue iii. Cost coverage % Volume (units purchased and generated less units sold)/units purchased and generated Employee costs/(Total Revenue - capital revenue) Total remuneration/(Total Revenue - capital revenue) R&M/(Total Revenue excluding capital revenue) FC&D/(Total Revenue - capital revenue) (Total Operating Revenue - Operating Grants)/Debt service payments due within financial year) Total outstanding service debtors/annual revenue received for services (Available cash + Investments)/monthly fixed operational expenditure 26.3% 5.6% 6.2% 0.9 738.6% 7.6% 1.0 590.4% 22.3 19.7 B1 7.5% 1.0 403.1% 19.7 6.9% 0.9 188.6% 14.2 7.7% 0.9 273.2% 14.2 7.4% 0.9 558.1% 17.6 1.0 261.2% 10.4 7.1% 1.0 248.8% 1.0 239.2% 9.4 8.9 DC9 Frances Baard - Supporting Table SA9 Social, economic and demographic statistics and assumptions Description of economic indicator Demographics Population Females aged 5 - 14 Males aged 5 - 14 Females aged 15 - 34 Males aged 15 - 34 Unemployment Monthly household income (no. of households) No income R1 - R1 600 R1 601 - R3 200 R3 201 - R6 400 R6 401 - R12 800 R12 801 - R25 600 R25 601 - R51 200 R52 201 - R102 400 R102 401 - R204 800 R204 801 - R409 600 R409 601 - R819 200 > R819 200 Poverty profiles (no. of households) < R2 060 per household per month Insert description Basis of calculation 2011/12 2012/13 2013/14 Current Year 2014/15 Outcome Outcome Outcome Original Budget 2015/16 Medium Term Revenue & Expenditure Framework 2001 Census 2007 Survey 2011 Census - - - - - - - - - - - - - - - - - - - - Ref. Outcome Outcome Outcome 1, 12 13 2 Household/demographics (000) Number of people in municipal area Number of poor people in municipal area Number of households in municipal area Number of poor households in municipal area Definition of poor household (R per month) Housing statistics Formal Informal Total number of households Dwellings provided by municipality Dwellings provided by province/s Dwellings provided by private sector Total new housing dwellings 3 Economic Inflation/inflation outlook (CPIX) Interest rate - borrowing Interest rate - investment Remuneration increases Consumption growth (electricity) Consumption growth (water) 6 Collection rates Property tax/service charges Rental of facilities & equipment Interest - external investments Interest - debtors Revenue from agency services 7 4 5 B1 DC9 Frances Baard Supporting Table SA10 Funding measurement Description Funding measures Cash/cash equivalents at the year end - R'000 Cash + investments at the yr end less applications - R'000 Cash year end/monthly employee/supplier payments Surplus/(Deficit) excluding depreciation offsets: R'000 Service charge rev % change - macro CPIX target exclusive Cash receipts % of Ratepayer & Other revenue Debt impairment expense as a % of total billable revenue Capital payments % of capital expenditure Borrowing receipts % of capital expenditure (excl. transfers) Grants % of Govt. legislated/gazetted allocations Current consumer debtors % change - incr(decr) Long term receivables % change - incr(decr) R&M % of Property Plant & Equipment Asset renewal % of capital budget MFMA section 2011/12 2012/13 2013/14 Audited Outcome Audited Outcome Audited Outcome 2015/16 Medium Term Revenue & Expenditure Framework Current Year 2014/15 Original Budget Adjusted Budget Full Year Forecast Budget Year 2015/16 Budget Year +1 2016/17 Budget Year +2 2017/18 18(1)b 18(1)b 18(1)b 18(1) 18(1)a,(2) 18(1)a,(2) 18(1)a,(2) 18(1)c;19 18(1)c 86 214 72 659 22.3 (10 221) N.A. 194.8% 0.0% 100.0% 0.0% 83 564 52 576 19.7 2 842 (6.0%) 55.3% 0.0% 100.0% 0.0% 87 934 70 073 19.7 (21) (6.0%) 189.4% 0.0% 100.0% 0.0% 82 960 42 695 14.2 (24 193) (6.0%) 12.3% 0.0% 86.0% 0.0% 84 165 43 901 14.2 (23 634) (6.0%) 12.3% 0.0% 80.6% 0.0% 90 365 107 350 17.6 (12 944) (6.0%) 539.5% 0.0% 34.7% 0.0% 65 720 42 720 10.4 (39 757) (6.0%) 100.0% 0.0% 91.5% 0.0% 62 741 36 641 9.4 (26 555) (6.0%) 100.0% 0.0% 100.0% 0.0% 62 705 34 235 8.9 (24 784) (6.0%) 100.0% 0.0% 100.0% 0.0% 18(1)a 18(1)a 18(1)a 20(1)(vi) 20(1)(vi) N.A. N.A. 5.0% 18.2% (6.1%) (0.3%) 5.4% 39.8% 1.3% (1.7%) 7.4% 50.5% (43.9%) 1.0% 11.4% 31.9% 44.9% 0.0% 11.4% 29.3% 0.0% 0.0% 8.8% 21.2% 0.0% (3.4%) (7.0%) 8.3% 8.3% 0.0% 0.0% (5.6%) 9.1% 100.0% 0.0% 0.0% (5.9%) 10.6% 100.0% B1 DC9 Frances Baard - Supporting Table SA11 Property rates summary Description Valuation: Date of valuation: Financial year valuation used Municipal by-laws s6 in place? (Y/N) Municipal/assistant valuer appointed? (Y/N) Municipal partnership s38 used? (Y/N) No. of assistant valuers (FTE) No. of data collectors (FTE) No. of internal valuers (FTE) No. of external valuers (FTE) No. of additional valuers (FTE) Valuation appeal board established? (Y/N) Implementation time of new valuation roll (mths) No. of properties No. of sectional title values No. of unreasonably difficult properties s7(2) No. of supplementary valuations No. of valuation roll amendments No. of objections by rate payers No. of appeals by rate payers No. of successful objections No. of successful objections > 10% Supplementary valuation Public service infrastructure value (Rm) Municipality owned property value (Rm) Valuation reductions: Valuation reductions-public infrastructure (Rm) Valuation reductions-nature reserves/park (Rm) Valuation reductions-mineral rights (Rm) Valuation reductions-R15,000 threshold (Rm) Valuation reductions-public worship (Rm) Valuation reductions-other (Rm) Total valuation reductions: 2011/12 2012/13 2013/14 Audited Outcome Audited Outcome Audited Outcome 2015/16 Medium Term Revenue & Expenditure Framework Current Year 2014/15 Original Budget Adjusted Budget Full Year Forecast Budget Year 2015/16 Budget Year +1 Budget Year +2 2016/17 2017/18 – – – – – – – – – – – – – – – – – – Total value used for rating (Rm) Total land value (Rm) Total value of improvements (Rm) Total market value (Rm) Rating: Residential rate used to determine rate for other categories? (Y/N) Differential rates used? (Y/N) Limit on annual rate increase (s20)? (Y/N) Special rating area used? (Y/N) Phasing-in properties s21 (number) Rates policy accompanying budget? (Y/N) Fixed amount minimum value (R'000) Non-residential prescribed ratio s19? (%) Rate revenue: Rate revenue budget (R '000) Rate revenue expected to collect (R'000) Expected cash collection rate (%) Special rating areas (R'000) Rebates, exemptions - indigent (R'000) Rebates, exemptions - pensioners (R'000) Rebates, exemptions - bona fide farm. (R'000) Rebates, exemptions - other (R'000) Phase-in reductions/discounts (R'000) Total rebates,exemptns,reductns,discs (R'000) B1 DC9 Frances Baard - Supporting Table SA12a Property rates by category (current year) Description Resi. Indust. Bus. & Comm. Farm props. State-owned Muni props. Public service infra. Current Year 2014/15 Valuation: No. of properties No. of sectional title property values No. of unreasonably difficult properties s7(2) No. of supplementary valuations Supplementary valuation (Rm) No. of valuation roll amendments No. of objections by rate-payers No. of appeals by rate-payers No. of appeals by rate-payers finalised No. of successful objections No. of successful objections > 10% Estimated no. of properties not valued Years since last valuation (select) Frequency of valuation (select) Method of valuation used (select) Base of valuation (select) Phasing-in properties s21 (number) Combination of rating types used? (Y/N) Flat rate used? (Y/N) Is balance rated by uniform rate/variable rate? Valuation reductions: Valuation reductions-public infrastructure (Rm) Valuation reductions-nature reserves/park (Rm) Valuation reductions-mineral rights (Rm) Valuation reductions-R15,000 threshold (Rm) Valuation reductions-public worship (Rm) Valuation reductions-other (Rm) Total valuation reductions: Total value used for rating (Rm) Total land value (Rm) Total value of improvements (Rm) Total market value (Rm) Rating: Average rate Rate revenue budget (R '000) Rate revenue expected to collect (R'000) Expected cash collection rate (%) Special rating areas (R'000) Rebates, exemptions - indigent (R'000) Rebates, exemptions - pensioners (R'000) Rebates, exemptions - bona fide farm. (R'000) Rebates, exemptions - other (R'000) Phase-in reductions/discounts (R'000) Total rebates,exemptns,reductns,discs (R'000) B1 Private owned towns Formal & Informal Settle. Comm. Land State trust land Section 8(2)(n) (note 1) Protect. Areas National Monum/ts Public benefit organs. Mining Props. DC9 Frances Baard - Supporting Table SA12b Property rates by category (budget year) Description Resi. Indust. Bus. & Comm. Farm props. State-owned Muni props. Public service infra. Budget Year 2015/16 Valuation: No. of properties No. of sectional title property values No. of unreasonably difficult properties s7(2) No. of supplementary valuations Supplementary valuation (Rm) No. of valuation roll amendments No. of objections by rate-payers No. of appeals by rate-payers No. of appeals by rate-payers finalised No. of successful objections No. of successful objections > 10% Estimated no. of properties not valued Years since last valuation (select) Frequency of valuation (select) Method of valuation used (select) Base of valuation (select) Phasing-in properties s21 (number) Combination of rating types used? (Y/N) Flat rate used? (Y/N) Is balance rated by uniform rate/variable rate? Valuation reductions: Valuation reductions-public infrastructure (Rm) Valuation reductions-nature reserves/park (Rm) Valuation reductions-mineral rights (Rm) Valuation reductions-R15,000 threshold (Rm) Valuation reductions-public worship (Rm) Valuation reductions-other (Rm) Total valuation reductions: Total value used for rating (Rm) Total land value (Rm) Total value of improvements (Rm) Total market value (Rm) Rating: Average rate Rate revenue budget (R '000) Rate revenue expected to collect (R'000) Expected cash collection rate (%) Special rating areas (R'000) Rebates, exemptions - indigent (R'000) Rebates, exemptions - pensioners (R'000) Rebates, exemptions - bona fide farm. (R'000) Rebates, exemptions - other (R'000) Phase-in reductions/discounts (R'000) Total rebates,exemptns,reductns,discs (R'000) B1 Private owned towns Formal & Informal Settle. Comm. Land State trust land Section 8(2)(n) (note 1) Protect. Areas National Monum/ts Public benefit organs. Mining Props. DC9 Frances Baard - Supporting Table SA13a Service Tariffs by category Description Provide description of tariff structure where appropriate 2011/12 2012/13 2013/14 Current Year 2014/15 2015/16 Medium Term Revenue & Expenditure Framework Budget Year 2015/16 Budget Year +1 Budget Year +2 2016/17 2017/18 Property rates (rate in the Rand) Residential properties Residential properties - vacant land Formal/informal settlements Small holdings Farm properties - used Farm properties - not used Industrial properties Business and commercial properties Communal land - residential Communal land - small holdings Communal land - farm property Communal land - business and commercial Communal land - other State-owned properties Municipal properties Public service infrastructure Privately owned towns serviced by the owner State trust land Restitution and redistribution properties Protected areas National monuments properties Exemptions, reductions and rebates (Rands) Residential properties R15 000 threshhold rebate General residential rebate Indigent rebate or exemption Pensioners/social grants rebate or exemption Temporary relief rebate or exemption Bona fide farmers rebate or exemption Other rebates or exemptions Water tariffs Domestic Basic charge/fixed fee (Rands/month) Service point - vacant land (Rands/month) Water usage - flat rate tariff (c/kl) Water usage - life line tariff Water usage - Block 1 (c/kl) Water usage - Block 2 (c/kl) Water usage - Block 3 (c/kl) Water usage - Block 4 (c/kl) Other 15 000 (describe structure) (fill in thresholds) (fill in thresholds) (fill in thresholds) (fill in thresholds) B1 15 000 15 000 15 000 15 000 15 000 15 000 DC9 Frances Baard - Supporting Table SA13a Service Tariffs by category Description Waste water tariffs Domestic Basic charge/fixed fee (Rands/month) Service point - vacant land (Rands/month) Waste water - flat rate tariff (c/kl) Volumetric charge - Block 1 (c/kl) Volumetric charge - Block 2 (c/kl) Volumetric charge - Block 3 (c/kl) Volumetric charge - Block 4 (c/kl) Provide description of tariff structure where appropriate 2011/12 (fill in structure) (fill in structure) (fill in structure) (fill in structure) Other Electricity tariffs Domestic Basic charge/fixed fee (Rands/month) Service point - vacant land (Rands/month) FBE Life-line tariff - meter Life-line tariff - prepaid Flat rate tariff - meter (c/kwh) Flat rate tariff - prepaid(c/kwh) Meter - IBT Block 1 (c/kwh) Meter - IBT Block 2 (c/kwh) Meter - IBT Block 3 (c/kwh) Meter - IBT Block 4 (c/kwh) Meter - IBT Block 5 (c/kwh) Prepaid - IBT Block 1 (c/kwh) Prepaid - IBT Block 2 (c/kwh) Prepaid - IBT Block 3 (c/kwh) Prepaid - IBT Block 4 (c/kwh) Prepaid - IBT Block 5 (c/kwh) Other (how is this targeted?) (describe structure) (describe structure) (fill in thresholds) (fill in thresholds) (fill in thresholds) (fill in thresholds) (fill in thresholds) (fill in thresholds) (fill in thresholds) (fill in thresholds) (fill in thresholds) (fill in thresholds) Waste management tariffs Domestic Street cleaning charge Basic charge/fixed fee 80l bin - once a week 250l bin - once a week B2 2012/13 2013/14 Current Year 2014/15 2015/16 Medium Term Revenue & Expenditure Framework Budget Year 2015/16 Budget Year +1 Budget Year +2 2016/17 2017/18 DC9 Frances Baard - Supporting Table SA13b Service Tariffs by category - explanatory Description Provide description of tariff structure where appropriate 2011/12 Exemptions, reductions and rebates (Rands) [Insert lines as applicable] Water tariffs [Insert blocks as applicable] Waste water tariffs [Insert blocks as applicable] Electricity tariffs [Insert blocks as applicable] (fill in thresholds) (fill in thresholds) (fill in thresholds) (fill in thresholds) (fill in thresholds) (fill in thresholds) (fill in thresholds) (fill in thresholds) (fill in thresholds) (fill in thresholds) (fill in structure) (fill in structure) (fill in structure) (fill in structure) (fill in structure) (fill in structure) (fill in structure) (fill in structure) (fill in structure) (fill in thresholds) (fill in thresholds) (fill in thresholds) (fill in thresholds) (fill in thresholds) (fill in thresholds) (fill in thresholds) (fill in thresholds) (fill in thresholds) (fill in thresholds) (fill in thresholds) (fill in thresholds) (fill in thresholds) B1 2012/13 2013/14 Current Year 2014/15 2015/16 Medium Term Revenue & Expenditure Framework Budget Year 2015/16 Budget Year +1 Budget Year +2 2016/17 2017/18 DC9 Frances Baard - Supporting Table SA14 Household bills Description Rand/cent Monthly Account for Household - 'Middle Income Range' Rates and services charges: Property rates Electricity: Basic levy Electricity: Consumption Water: Basic levy Water: Consumption Sanitation Refuse removal Other sub-total VAT on Services Total large household bill: % increase/-decrease Monthly Account for Household - 'Affordable Range' Rates and services charges: Property rates Electricity: Basic levy Electricity: Consumption Water: Basic levy Water: Consumption Sanitation Refuse removal Other sub-total VAT on Services Total small household bill: % increase/-decrease Monthly Account for Household - 'Indigent' Household receiving free basic services Rates and services charges: Property rates Electricity: Basic levy Electricity: Consumption Water: Basic levy Water: Consumption Sanitation Refuse removal Other VAT on Services Total small household bill: % increase/-decrease sub-total 2011/12 2012/13 2013/14 Audited Outcome Audited Outcome Audited Outcome Current Year 2014/15 Original Budget Adjusted Budget 2015/16 Medium Term Revenue & Expenditure Framework Full Year Forecast Budget Year 2015/16 % incr. Budget Year 2015/16 Budget Year +1 Budget Year +2 2016/17 2017/18 – – – – – – – – – – – – – – – – – – – – – – – – – – – – – – – – – – – – – – – – – – – – – – – – – – – – – – – – – – – – – – – – – – – – – – – – – – – – – – – – – – – – B1 DC9 Frances Baard - Supporting Table SA15 Investment particulars by type Investment type R thousand Parent municipality Securities - National Government Listed Corporate Bonds Deposits - Bank Deposits - Public Investment Commissioners Deposits - Corporation for Public Deposits Bankers Acceptance Certificates Negotiable Certificates of Deposit - Banks Guaranteed Endowment Policies (sinking) Repurchase Agreements - Banks Municipal Bonds Municipality sub-total 2011/12 2012/13 2013/14 Audited Outcome Audited Outcome Audited Outcome 2015/16 Medium Term Revenue & Expenditure Framework Current Year 2014/15 Original Budget Adjusted Budget Full Year Forecast Budget Year 2015/16 Budget Year +1 Budget Year +2 2016/17 2017/18 89 114 87 364 92 334 82 960 84 165 90 365 65 720 62 741 62 705 89 114 87 364 92 334 82 960 84 165 90 365 65 720 62 741 62 705 Entities Securities - National Government Listed Corporate Bonds Deposits - Bank Deposits - Public Investment Commissioners Deposits - Corporation for Public Deposits Bankers Acceptance Certificates Negotiable Certificates of Deposit - Banks Guaranteed Endowment Policies (sinking) Repurchase Agreements - Banks Entities sub-total Consolidated total: – 89 114 – 87 364 – 92 334 B1 – 82 960 – 84 165 – 90 365 – 65 720 – 62 741 – 62 705 DC9 Frances Baard - Supporting Table SA16 Investment particulars by maturity Investments by Maturity Period of Investment Name of institution & investment ID Yrs/Months Type of Investment Capital Guarantee (Yes/ No) Parent municipality Municipality sub-total Entities Entities sub-total TOTAL INVESTMENTS AND INTEREST B1 Variable or Fixed interest rate Interest Rate 3. Commission Paid (Rands) Commission Recipient Expiry date of investment DC9 Frances Baard - Supporting Table SA17 Borrowing Borrowing - Categorised by type R thousand Parent municipality Long-Term Loans (annuity/reducing balance) Long-Term Loans (non-annuity) Local registered stock Instalment Credit Financial Leases PPP liabilities Finance Granted By Cap Equipment Supplier Marketable Bonds Non-Marketable Bonds Bankers Acceptances Financial derivatives Other Securities Municipality sub-total Entities Long-Term Loans (annuity/reducing balance) Long-Term Loans (non-annuity) Local registered stock Instalment Credit Financial Leases PPP liabilities Finance Granted By Cap Equipment Supplier Marketable Bonds Non-Marketable Bonds Bankers Acceptances Financial derivatives Other Securities Entities sub-total Total Borrowing 2011/12 2012/13 2013/14 Audited Outcome Audited Outcome Audited Outcome 2015/16 Medium Term Revenue & Expenditure Framework Current Year 2014/15 Original Budget Adjusted Budget Full Year Forecast Budget Year 2015/16 Budget Year +1 Budget Year +2 2016/17 2017/18 11 486 10 041 8 435 6 685 6 685 9 000 – 9 000 9 000 11 486 10 041 8 435 6 685 6 685 9 000 – 9 000 9 000 – 11 486 – 10 041 – 8 435 – 6 685 – 6 685 – 9 000 – – – 9 000 – 9 000 Unspent Borrowing - Categorised by type Parent municipality Long-Term Loans (annuity/reducing balance) Long-Term Loans (non-annuity) Local registered stock Instalment Credit Financial Leases PPP liabilities Finance Granted By Cap Equipment Supplier Marketable Bonds Non-Marketable Bonds Bankers Acceptances Financial derivatives Other Securities Municipality sub-total – – – – – – – – – Entities Long-Term Loans (annuity/reducing balance) Long-Term Loans (non-annuity) Local registered stock Instalment Credit Financial Leases PPP liabilities Finance Granted By Cap Equipment Supplier Marketable Bonds Non-Marketable Bonds Bankers Acceptances Financial derivatives Other Securities Entities sub-total – – – – – – – – – Total Unspent Borrowing – – – – – – – – – B1 DC9 Frances Baard - Supporting Table SA18 Transfers and grant receipts Description R thousand RECEIPTS: 2011/12 2012/13 2013/14 Audited Outcome Audited Outcome Audited Outcome 2015/16 Medium Term Revenue & Expenditure Framework Current Year 2014/15 Original Budget Adjusted Budget Full Year Forecast Budget Year 2015/16 Budget Year +1 Budget Year +2 2016/17 2017/18 Operating Transfers and Grants National Government: Local Government Equitable Share – – – – – – – – – – – – – – – – – – District Municipality: [insert description] – – – – – – – – – Other grant providers: [insert description] – – – – – – – – – – – – – – – – – – – – – – – – – – – Provincial Government: Other capital transfers/grants [insert description] – – – – – – – – – District Municipality: [insert description] – – – – – – – – – Other grant providers: [insert description] – – – – – – – – – Total Capital Transfers and Grants – – – – – – – – – TOTAL RECEIPTS OF TRANSFERS & GRANTS – – – – – – – – – Other transfers/grants [insert description] Provincial Government: Other transfers/grants [insert description] Total Operating Transfers and Grants Capital Transfers and Grants National Government: Other capital transfers/grants [insert desc] B1 DC9 Frances Baard - Supporting Table SA19 Expenditure on transfers and grant programme Description R thousand EXPENDITURE: 2011/12 2012/13 2013/14 Audited Outcome Audited Outcome Audited Outcome 2015/16 Medium Term Revenue & Expenditure Framework Current Year 2014/15 Original Budget Adjusted Budget Full Year Forecast Budget Year 2015/16 Budget Year +1 Budget Year +2 2016/17 2017/18 Operating expenditure of Transfers and Grants National Government: Local Government Equitable Share – – – – – – – – – – – – – – – – – – District Municipality: [insert description] – – – – – – – – – Other grant providers: [insert description] – – – – – – – – – – – – – – – – – – – – – – – – – – – Provincial Government: Other capital transfers/grants [insert description] – – – – – – – – – District Municipality: [insert description] – – – – – – – – – Other grant providers: [insert description] – – – – – – – – – Total capital expenditure of Transfers and Grants – – – – – – – – – TOTAL EXPENDITURE OF TRANSFERS AND GRANTS – – – – – – – – – Other transfers/grants [insert description] Provincial Government: Other transfers/grants [insert description] Total operating expenditure of Transfers and Grants: Capital expenditure of Transfers and Grants National Government: Other capital transfers/grants [insert desc] B1 DC9 Frances Baard - Supporting Table SA20 Reconciliation of transfers, grant receipts and unspent funds Description R thousand Operating transfers and grants: National Government: Balance unspent at beginning of the year Current year receipts Conditions met - transferred to revenue Conditions still to be met - transferred to liabilities Provincial Government: Balance unspent at beginning of the year Current year receipts Conditions met - transferred to revenue Conditions still to be met - transferred to liabilities District Municipality: Balance unspent at beginning of the year Current year receipts Conditions met - transferred to revenue Conditions still to be met - transferred to liabilities Other grant providers: Balance unspent at beginning of the year Current year receipts Conditions met - transferred to revenue Conditions still to be met - transferred to liabilities Total operating transfers and grants revenue Total operating transfers and grants - CTBM Capital transfers and grants: National Government: Balance unspent at beginning of the year Current year receipts Conditions met - transferred to revenue Conditions still to be met - transferred to liabilities Provincial Government: Balance unspent at beginning of the year Current year receipts Conditions met - transferred to revenue Conditions still to be met - transferred to liabilities District Municipality: Balance unspent at beginning of the year Current year receipts Conditions met - transferred to revenue Conditions still to be met - transferred to liabilities Other grant providers: Balance unspent at beginning of the year Current year receipts Conditions met - transferred to revenue Conditions still to be met - transferred to liabilities Total capital transfers and grants revenue Total capital transfers and grants - CTBM TOTAL TRANSFERS AND GRANTS REVENUE TOTAL TRANSFERS AND GRANTS - CTBM 2011/12 2012/13 2013/14 Audited Outcome Audited Outcome Audited Outcome 2015/16 Medium Term Revenue & Expenditure Framework Current Year 2014/15 Original Budget Adjusted Budget Full Year Forecast Budget Year Budget Year +1 Budget Year +2 2015/16 2016/17 2017/18 – – – – – – – – – – – – – – – – – – – – – – – – – – – – – – – – – – – – – – – – – – – – – – – – – – – – – – – – – – – – – – – – – – – – – – – – – – – – – – – – – – – – – – – – – – – – – – – – – – – – – – – – – – – – – – – – – – – – – – – – – – – – – – B1 DC9 Frances Baard - Supporting Table SA21 Transfers and grants made by the municipality Description R thousand 2011/12 2012/13 2013/14 Audited Outcome Audited Outcome Audited Outcome 2015/16 Medium Term Revenue & Expenditure Framework Current Year 2014/15 Original Budget Adjusted Budget Full Year Forecast Budget Year Budget Year +1 Budget Year +2 2015/16 2016/17 2017/18 Cash Transfers to other municipalities Insert description Total Cash Transfers To Municipalities: – – – – – – – – – – – – – – – – – – – – – – – – – – – Cash Transfers to Organisations Northern Cape Tourism Authority 135 135 135 135 135 135 135 135 135 Total Cash Transfers To Organisations 135 135 135 135 135 135 135 135 135 Cash Transfers to Entities/Other External Mechanisms Insert description Total Cash Transfers To Entities/Ems' Cash Transfers to other Organs of State Insert description Total Cash Transfers To Other Organs Of State: Cash Transfers to Groups of Individuals Insert description Total Cash Transfers To Groups Of Individuals: TOTAL CASH TRANSFERS AND GRANTS Non-Cash Transfers to other municipalities Dikgatlong Municipality (NC092) Magareng Municipality (NC093) Magareng Municipality (NC093) Roll Over Phokwane Municipality (NC094) Phokwane Municipality (NC094) Roll Over Sol Plaatje Municipality (NC091) District Management Areas Expanded works program Unallocated (Mintenance Fund) – – – – – – – – – 135 135 135 135 135 135 135 135 135 2 647 3 912 – 5 749 – 2 205 2 862 – – 4 322 3 127 – 7 280 – 2 761 240 – – 2 969 6 895 2 500 2 500 – 2 500 – 2 500 – – – 2 500 2 500 2 500 2 500 2 500 2 500 2 500 2 500 2 500 2 500 2 591 2 457 3 061 1 500 5 480 5 000 5 000 5 000 2 500 2 500 – 2 500 – 2 500 – – – – – – 5 480 5 000 5 000 5 000 2 500 2 500 1 989 2 503 2 898 901 2 500 2 500 – 2 500 – 2 500 – – – – – – 5 480 5 000 5 000 5 000 8 000 8 000 8 000 5 000 5 000 5 000 5 000 5 000 5 000 5 000 5 000 5 000 26 021 26 455 30 480 30 480 30 480 39 000 30 000 30 000 3 982 3 000 OPERATING Dikgatlong Municipality (NC092) Magareng Municipality (NC093) Phokwane Municipality (NC094) Sol Plaatje Municipality (NC091) Total Non-Cash Transfers To Municipalities: – – – – 17 375 Non-Cash Transfers to Entities/Other External Mechanisms Insert description Total Non-Cash Transfers To Entities/Ems' – – – – – – – – – – – – – – – – – – Non-Cash Transfers to other Organs of State Insert description Total Non-Cash Transfers To Other Organs Of State: B1 DC9 Frances Baard - Supporting Table SA21 Transfers and grants made by the municipality Description R thousand Non-Cash Grants to Organisations Council Administration Council Municipal Manager Communications Special projects: Finance Employment assistance program Employee wellness programs Information systems Other Infrastructure Projects IDP / PMS Projects Tourism Projects MSIG Projects Special Projects Local Economic Development Environmental Health Projects Community Development GIS Programmes Spatial Planning Disaster Management Disaster emergency Projects Special Programmes & Youth Finance Sprcial Projects: Housing Internal Audit Total Non-Cash Grants To Organisations 2011/12 2012/13 2013/14 Audited Outcome Audited Outcome Audited Outcome 2015/16 Medium Term Revenue & Expenditure Framework Current Year 2014/15 Original Budget 300 24 22 474 24 662 112 – 17 1 488 1 189 1 303 2 154 – 412 – 226 21 30 167 247 – – 12 384 1 505 10 559 150 – 43 1 218 733 1 906 115 – 591 334 698 – 114 – 907 – 3 1 510 978 3 1 490 55 8 871 9 280 7 077 – – 6 731 29 258 – 773 461 570 137 – 72 Adjusted Budget 286 – 15 1 050 100 450 10 9 43 2 171 934 2 450 758 – 1 600 1 319 475 – 200 – 138 350 12 358 Full Year Forecast Budget Year Budget Year +1 Budget Year +2 2015/16 2016/17 2017/18 331 400 – 495 1 719 100 150 7 5 59 3 914 940 348 600 – 47 1 128 100 300 7 5 62 4 877 960 361 200 – 49 1 138 100 300 7 5 64 5 044 1 033 2 879 110 3 023 115 2 925 119 1 000 781 535 600 1 720 1 178 – 805 1 237 – 338 1 286 200 200 550 563 573 124 130 11 188 124 130 11 188 150 – 15 305 114 – 14 289 119 – 13 661 386 – 15 1 050 100 470 10 9 53 2 236 934 86 2 480 588 386 – 15 1 050 100 470 10 9 53 2 236 934 86 2 480 588 1 000 781 535 Groups of Individuals Insert description Total Non-Cash Grants To Groups Of Individuals: – – – – – – – – – TOTAL NON-CASH TRANSFERS AND GRANTS 26 247 35 302 33 531 42 838 41 668 41 668 54 305 44 289 43 661 TOTAL TRANSFERS AND GRANTS 26 382 35 437 33 666 42 973 41 803 41 803 54 440 44 424 43 796 B2 DC9 Frances Baard - Supporting Table SA22 Summary councillor and staff benefits Summary of Employee and Councillor remuneration R thousand Councillors (Political Office Bearers plus Other) Basic Salaries and Wages Pension and UIF Contributions Medical Aid Contributions Motor Vehicle Allowance Cellphone Allowance Housing Allowances Other benefits and allowances Sub Total - Councillors % increase Senior Managers of the Municipality Basic Salaries and Wages Pension and UIF Contributions Medical Aid Contributions Overtime Performance Bonus Motor Vehicle Allowance Cellphone Allowance Housing Allowances Other benefits and allowances Payments in lieu of leave Long service awards Post-retirement benefit obligations Sub Total - Senior Managers of Municipality % increase 2011/12 2012/13 2013/14 Audited Outcome A Audited Outcome B Audited Outcome C Original Budget D Adjusted Budget E 3 139 155 17 1 043 167 3 670 165 17 994 227 3 688 173 17 1 189 248 4 055 202 17 1 402 328 74 4 595 87 5 160 12.3% 107 5 424 5.1% 51 6 055 11.6% 3 233 366 134 2 295 225 68 – – 195 48 18 24 – – – 2 872 (35.0%) 5 646 4 826 811 139 434 464 673 112 – 57 107 6 080 111.7% 209 358 72 33 14 – – – 4 420 2015/16 Medium Term Revenue & Expenditure Framework Current Year 2014/15 Full Year Forecast F Budget Year 2015/16 G Budget Year +1 Budget Year +2 2016/17 2017/18 H I 4 055 202 17 1 402 328 – 51 6 055 – 4 055 202 17 1 402 328 – 51 6 055 – 4 478 200 – 1 321 230 4 702 210 – 1 321 230 4 937 220 – 1 321 230 108 6 337 4.6% 111 6 574 3.7% 114 6 822 3.8% 2 826 811 139 – 464 373 112 – 57 107 – – 4 888 (32.0%) 5 212 914 4 – 440 317 96 6 81 115 26 5 629 987 4 – 440 317 60 6 87 125 28 6 079 1 066 4 – 440 317 60 6 92 135 31 7 188 18.2% 4 826 811 139 – 464 673 112 – 57 107 – – 7 188 – 7 211 47.5% 7 682 6.5% 8 229 7.1% Other Municipal Staff Basic Salaries and Wages Pension and UIF Contributions Medical Aid Contributions Overtime Performance Bonus Motor Vehicle Allowance Cellphone Allowance Housing Allowances Other benefits and allowances Payments in lieu of leave Long service awards Post-retirement benefit obligations Sub Total - Other Municipal Staff % increase 20 870 3 358 954 58 – 1 534 109 495 784 883 141 1 029 30 214 24 934 4 002 1 202 54 371 2 108 144 395 977 1 121 10 1 232 36 551 21.0% 23 613 4 870 1 390 138 – 2 590 183 206 47 1 404 131 360 34 932 (4.4%) 33 643 5 480 1 674 – – 3 112 108 221 1 267 753 193 748 47 199 35.1% 33 643 5 480 1 674 – – 3 112 127 221 1 267 753 193 748 47 218 0.0% 33 643 5 075 1 674 – – 3 112 127 221 1 067 753 193 748 46 613 (1.3%) 36 968 6 920 447 394 – 3 109 97 236 762 818 187 3 49 941 7.1% 39 737 7 571 447 372 – 3 109 97 236 809 882 201 36 53 498 7.1% 42 712 8 254 447 393 – 3 109 97 236 858 950 217 37 57 310 7.1% Total Parent Municipality 39 229 44 583 13.6% 46 436 4.2% 60 443 30.2% 60 462 0.0% 57 557 (4.8%) 63 489 10.3% 67 754 6.7% 72 361 6.8% Board Members of Entities Basic Salaries and Wages Pension and UIF Contributions Medical Aid Contributions Overtime Performance Bonus Motor Vehicle Allowance Cellphone Allowance Housing Allowances Other benefits and allowances Board Fees Payments in lieu of leave Long service awards Post-retirement benefit obligations Sub Total - Board Members of Entities % increase – – – – – B1 – – – – – – – – – – – – DC9 Frances Baard - Supporting Table SA22 Summary councillor and staff benefits Summary of Employee and Councillor remuneration R thousand Senior Managers of Entities Basic Salaries and Wages Pension and UIF Contributions Medical Aid Contributions Overtime Performance Bonus Motor Vehicle Allowance Cellphone Allowance Housing Allowances Other benefits and allowances Payments in lieu of leave Long service awards Post-retirement benefit obligations Sub Total - Senior Managers of Entities % increase Other Staff of Entities Basic Salaries and Wages Pension and UIF Contributions Medical Aid Contributions Overtime Performance Bonus Motor Vehicle Allowance Cellphone Allowance Housing Allowances Other benefits and allowances Payments in lieu of leave Long service awards Post-retirement benefit obligations Sub Total - Other Staff of Entities % increase Total Municipal Entities TOTAL SALARY, ALLOWANCES & BENEFITS % increase TOTAL MANAGERS AND STAFF 2011/12 2012/13 2013/14 Audited Outcome Audited Outcome Audited Outcome 2015/16 Medium Term Revenue & Expenditure Framework Current Year 2014/15 Original Budget Adjusted Budget Full Year Forecast Budget Year 2015/16 Budget Year +1 Budget Year +2 2016/17 2017/18 – – – – – – – – – – – – – – – – – – – – – – – – – – – – – – – – – – – 39 229 34 634 – 44 583 13.6% 39 423 – 46 436 4.2% 41 012 B2 – 60 443 30.2% 54 388 – 60 462 0.0% 54 407 – 57 557 (4.8%) 51 501 – 63 489 10.3% 57 152 – 67 754 6.7% 61 180 – 72 361 6.8% 65 539 DC9 Frances Baard - Supporting Table SA22 Summary councillor and staff benefits Summary of Employee and Councillor remuneration R thousand 2011/12 2012/13 2013/14 Audited Outcome Audited Outcome Audited Outcome B3 2015/16 Medium Term Revenue & Expenditure Framework Current Year 2014/15 Original Budget Adjusted Budget Full Year Forecast Budget Year 2015/16 Budget Year +1 Budget Year +2 2016/17 2017/18 DC9 Frances Baard - Supporting Table SA23 Salaries, allowances & benefits (political office bearers/councillors/senior managers) Salary Disclosure of Salaries, Allowances & Benefits 1. Contributions Allowances No. Rand per annum Councillors Speaker Chief Whip Executive Mayor Deputy Executive Mayor Executive Committee Total for all other councillors Total Councillors Performance In-kind benefits Total Package Bonuses 1. – 2. 404 838 69 564 161 628 489 482 83 669 217 770 2 440 020 1 143 931 4 478 271 115 863 24 183 293 279 772 668 413 023 1 565 089 636 030 – 790 921 – 3 328 551 1 581 137 6 336 639 Senior Managers of the Municipality Municipal Manager (MM) Chief Finance Officer – – – – – – List of each offical with packages >= senior manager Total Senior Managers of the Municipality – – – – – – – – – – – – – – – – – – – – – – – – – – – – – – – – – – – – – A Heading for Each Entity List each member of board by designation Total for municipal entities – TOTAL COST OF COUNCILLOR, DIRECTOR and EXECUTIVE REMUNERATION – – 4 478 271 B1 – 293 279 – 1 565 089 – 6 336 639 DC9 Frances Baard - Supporting Table SA24 Summary of personnel numbers 2013/14 Summary of Personnel Numbers Number Municipal Council and Boards of Municipal Entities Councillors (Political Office Bearers plus Other Councillors) Board Members of municipal entities Municipal employees Municipal Manager and Senior Managers Other Managers Professionals Finance Spatial/town planning Information Technology Roads Electricity Water Sanitation Refuse Other Technicians Finance Spatial/town planning Information Technology Roads Electricity Water Sanitation Refuse Other Clerks (Clerical and administrative) Service and sales workers Skilled agricultural and fishery workers Craft and related trades Plant and Machine Operators Elementary Occupations TOTAL PERSONNEL NUMBERS % increase Budget Year 2015/16 Current Year 2014/15 Positions Permanent employees Contract employees Positions Permanent employees Contract employees Positions Permanent employees Contract employees – – – – – – – – – – – – – – – – – – – – – – – – – – – – – – – – – Total municipal employees headcount Finance personnel headcount Human Resources personnel headcount B1 DC9 Frances Baard - Supporting Table SA25 Budgeted monthly revenue and expenditure R thousand Revenue By Source Property rates Property rates - penalties & collection charges Service charges - electricity revenue Service charges - water revenue Service charges - sanitation revenue Service charges - refuse revenue Service charges - other Rental of facilities and equipment Interest earned - external investments Interest earned - outstanding debtors Dividends received Fines Licences and permits Agency services Transfers recognised - operational Other revenue Gains on disposal of PPE Total Revenue (excluding capital transfers and contrib Expenditure By Type Employee related costs Remuneration of councillors Debt impairment Depreciation & asset impairment Finance charges Bulk purchases Other materials Contracted services Transfers and grants Other expenditure Loss on disposal of PPE Total Expenditure Surplus/(Deficit) Transfers recognised - capital Contributions recognised - capital Contributed assets Surplus/(Deficit) after capital transfers & contributions Taxation Attributable to minorities Share of surplus/ (deficit) of associate Surplus/(Deficit) Medium Term Revenue and Expenditure Framework Budget Year 2015/16 Description July August 89 454 Sept. October 89 454 89 454 89 454 26 627 – – – 27 170 543 543 4 763 528 4 763 528 468 November 89 454 December January 89 454 89 454 26 627 – – 543 27 170 543 4 763 528 4 763 528 4 763 528 468 468 468 337 337 337 4 537 1 832 4 537 1 832 4 537 1 832 February 89 454 March April May June 89 454 89 454 89 454 26 627 – – – 543 27 170 543 543 543 4 763 528 4 763 528 4 763 528 4 763 528 4 763 528 4 763 528 468 468 468 468 468 468 468 337 337 337 337 337 337 337 337 4 537 1 832 4 537 1 832 4 537 1 832 4 537 1 832 4 537 1 832 4 537 1 832 4 537 1 832 4 537 1 832 Budget Year 2015/16 Budget Year +1 Budget Year +2 2016/17 2017/18 – – – – – – – 89 454 – – – – – 26 627 53 60 27 283 – – – – – – – 1 072 5 443 – – – – – 106 509 53 60 113 137 – – – – – – – 1 126 5 648 – – – – – 112 246 55 63 119 138 – – – – – – – 1 171 5 820 – – – – – 118 711 58 66 125 825 4 762 528 3 468 3 111 – 337 – 4 537 1 832 210 15 789 57 152 6 337 3 5 615 3 111 – 4 046 – 54 440 21 980 210 152 895 61 181 6 574 – 5 635 3 173 – 4 048 – 44 424 20 440 221 145 693 65 539 6 822 – 5 655 3 235 – 4 205 – 43 796 21 128 229 150 609 12 464 12 464 12 464 12 464 12 464 12 464 12 464 12 464 12 464 12 464 12 464 14 706 (11 921) (11 921) (11 921) 14 706 (11 921) (11 921) 14 706 (11 921) (11 921) (11 921) 11 495 – – – (39 757) – – – (26 555) – – – (24 784) – – – 14 706 (11 921) (11 921) (11 921) 14 706 (11 921) (11 921) 14 706 (11 921) (11 921) (11 921) 11 495 (39 757) (26 555) (24 784) (11 921) – – – 11 495 – – – (39 757) – – – (26 555) – – – (24 784) 14 706 (11 921) (11 921) (11 921) 14 706 (11 921) B1 (11 921) 14 706 (11 921) (11 921) DC9 Frances Baard - Supporting Table SA26 Budgeted monthly revenue and expenditure (municipal vote) R thousand Revenue by Vote Vote 1 - Executive & Council Vote 2 - Budget & Treasury Vote 3 - Corporate Services Vote 4 - Planning & Development Vote 5 - Project Management & Advisory Services Vote 6 - [NAME OF VOTE 6] Vote 7 - [NAME OF VOTE 7] Vote 8 - [NAME OF VOTE 8] Vote 9 - [NAME OF VOTE 9] Vote 10 - [NAME OF VOTE 10] Vote 11 - [NAME OF VOTE 11] Vote 12 - [NAME OF VOTE 12] Vote 13 - [NAME OF VOTE 13] Vote 14 - [NAME OF VOTE 14] Vote 15 - [NAME OF VOTE 15] Total Revenue by Vote Medium Term Revenue and Expenditure Framework Budget Year 2015/16 Description July 1 223 22 574 158 235 3 145 August Sept. October 543 543 543 27 334 543 543 543 2 148 2 042 2 203 1 839 4 510 2 148 2 042 2 203 1 839 4 510 2 148 2 042 2 203 1 839 4 510 2 148 2 042 2 203 1 839 4 510 November 1 223 22 574 158 235 3 145 December January 543 543 27 334 543 543 2 148 2 042 2 203 1 839 4 510 2 148 2 042 2 203 1 839 4 510 2 148 2 042 2 203 1 839 4 510 February 1 223 22 574 158 235 3 145 March April May June 543 543 543 27 334 543 543 543 2 148 2 042 2 203 1 839 4 510 2 148 2 042 2 203 1 839 4 510 2 148 2 042 2 203 1 839 4 510 2 148 2 042 2 203 1 839 4 510 Budget Year 2015/16 Budget Year +1 Budget Year +2 2016/17 2017/18 1 223 22 031 158 235 3 145 – – – – – – – – – – 26 791 4 891 94 095 630 940 12 581 – – – – – – – – – – 113 137 5 110 101 584 630 960 10 854 – – – – – – – – – – 119 138 5 110 108 035 630 1 033 11 017 – – – – – – – – – – 125 825 25 776 24 499 26 435 22 064 54 121 – – – – – – – – – – 152 895 26 859 24 565 28 126 22 701 43 443 – – – – – – – – – – 145 693 27 801 25 652 29 726 23 179 44 251 – – – – – – – – – – 150 609 Expenditure by Vote to be appropriated Vote 1 - Executive & Council Vote 2 - Budget & Treasury Vote 3 - Corporate Services Vote 4 - Planning & Development Vote 5 - Project Management & Advisory Services Vote 6 - [NAME OF VOTE 6] Vote 7 - [NAME OF VOTE 7] Vote 8 - [NAME OF VOTE 8] Vote 9 - [NAME OF VOTE 9] Vote 10 - [NAME OF VOTE 10] Vote 11 - [NAME OF VOTE 11] Vote 12 - [NAME OF VOTE 12] Vote 13 - [NAME OF VOTE 13] Vote 14 - [NAME OF VOTE 14] Vote 15 - [NAME OF VOTE 15] Total Expenditure by Vote 12 741 12 741 12 741 12 741 12 741 12 741 12 741 12 741 12 741 12 741 12 741 2 148 2 041 2 203 1 839 4 510 – – – – – – – – – – 12 741 Surplus/(Deficit) before assoc. 14 593 (12 198) (12 198) (12 198) 14 593 (12 198) (12 198) 14 593 (12 198) (12 198) (12 198) 14 051 (39 757) (26 555) (24 784) (12 198) – – – 14 051 – – – (39 757) – – – (26 555) – – – (24 784) Taxation Attributable to minorities Share of surplus/ (deficit) of associate Surplus/(Deficit) 14 593 (12 198) (12 198) (12 198) 14 593 (12 198) B1 (12 198) 14 593 (12 198) (12 198) DC9 Frances Baard - Supporting Table SA27 Budgeted monthly revenue and expenditure (standard classification) R thousand Revenue - Standard Governance and administration Executive and council Budget and treasury office Corporate services Community and public safety Community and social services Sport and recreation Public safety Housing Health Economic and environmental services Planning and development Road transport Environmental protection Trading services Electricity Water Waste water management Waste management Other Total Revenue - Standard Medium Term Revenue and Expenditure Framework Budget Year 2015/16 Description July August 23 796 1 223 22 574 508 Sept. October 543 543 543 543 543 543 – – – 158 350 3 030 3 030 23 796 1 223 22 574 508 December January 543 543 543 543 – – 158 350 February 23 796 1 223 22 574 508 March April May June 543 543 543 543 543 543 – – – – – – – – – 158 350 3 030 3 030 – – – – 27 334 31 587 543 543 543 543 27 334 31 587 543 543 543 543 543 543 5 626 2 148 2 042 1 437 893 5 626 2 148 2 042 1 437 893 5 626 2 148 2 042 1 437 893 5 626 2 148 2 042 1 437 893 5 626 2 148 2 042 1 437 893 5 626 2 148 2 042 1 437 893 5 626 2 148 2 042 1 437 893 5 626 2 148 2 042 1 437 893 319 574 319 574 319 574 319 574 319 574 319 574 319 574 319 574 319 574 5 972 5 775 5 972 5 775 5 972 5 775 5 972 5 775 5 972 5 775 5 972 5 775 5 972 5 775 5 972 5 775 5 972 5 775 5 972 5 775 197 – 197 – 197 – 197 – 197 – 197 – 197 – 197 – 197 – 197 – – – – – – – 27 334 543 543 543 543 543 543 5 626 2 148 2 042 1 437 893 5 626 2 148 2 042 1 437 893 5 626 2 148 2 042 1 437 893 319 574 319 574 5 972 5 775 197 – – November 3 030 3 030 – – Budget Year 2015/16 Budget Year +1 Budget Year +2 2016/17 2017/18 23 254 1 223 22 031 – 508 – – 158 350 – 3 030 3 030 – – – – – – – – 26 791 98 986 4 891 94 095 – 2 030 – – 630 1 400 – 12 121 12 121 – – – – – – – – 113 137 106 694 5 110 101 584 – 2 030 – – 630 1 400 – 10 414 10 414 – – – – – – – – 119 138 113 145 5 110 108 035 – 2 030 – – 630 1 400 – 10 650 10 650 – – – – – – – – 125 825 67 512 25 776 24 499 17 238 13 718 – – 6 833 6 885 – 71 665 69 301 – 2 364 – – – – – – 152 895 69 828 26 859 24 565 18 404 13 507 – – 7 203 6 305 – 62 358 59 840 – 2 519 – – – – – – 145 693 72 911 27 801 25 652 19 458 14 288 – – 7 587 6 700 – 63 410 60 730 – 2 681 – – – – – – 150 609 Expenditure - Standard Governance and administration Executive and council Budget and treasury office Corporate services Community and public safety Community and social services Sport and recreation Public safety Housing Health Economic and environmental services Planning and development Road transport Environmental protection Trading services Electricity Water Waste water management Waste management Other Total Expenditure - Standard 12 491 12 491 12 491 12 491 12 491 12 491 12 491 12 491 12 491 12 491 12 491 5 625 2 148 2 041 1 436 3 893 – – 3 319 573 – 5 972 5 775 – 197 – – – – – – 15 490 Surplus/(Deficit) before assoc. 14 843 (11 948) (11 948) (11 948) 14 843 (11 948) (11 948) 14 843 (11 948) (11 948) (11 948) 11 301 (39 757) (26 555) (24 784) (11 948) – 11 301 – (39 757) – (26 555) – (24 784) Share of surplus/ (deficit) of associate Surplus/(Deficit) 14 843 (11 948) (11 948) (11 948) 14 843 (11 948) B1 (11 948) 14 843 (11 948) (11 948) DC9 Frances Baard - Supporting Table SA28 Budgeted monthly capital expenditure (municipal vote) R thousand Multi-year expenditure to be appropriated Vote 1 - Executive & Council Vote 2 - Budget & Treasury Vote 3 - Corporate Services Vote 4 - Planning & Development Vote 5 - Project Management & Advisory Services Vote 6 - [NAME OF VOTE 6] Vote 7 - [NAME OF VOTE 7] Vote 8 - [NAME OF VOTE 8] Vote 9 - [NAME OF VOTE 9] Vote 10 - [NAME OF VOTE 10] Vote 11 - [NAME OF VOTE 11] Vote 12 - [NAME OF VOTE 12] Vote 13 - [NAME OF VOTE 13] Vote 14 - [NAME OF VOTE 14] Vote 15 - [NAME OF VOTE 15] Capital multi-year expenditure sub-total Single-year expenditure to be appropriated Vote 1 - Executive & Council Vote 2 - Budget & Treasury Vote 3 - Corporate Services Vote 4 - Planning & Development Vote 5 - Project Management & Advisory Services Vote 6 - [NAME OF VOTE 6] Vote 7 - [NAME OF VOTE 7] Vote 8 - [NAME OF VOTE 8] Vote 9 - [NAME OF VOTE 9] Vote 10 - [NAME OF VOTE 10] Vote 11 - [NAME OF VOTE 11] Vote 12 - [NAME OF VOTE 12] Vote 13 - [NAME OF VOTE 13] Vote 14 - [NAME OF VOTE 14] Vote 15 - [NAME OF VOTE 15] Capital single-year expenditure sub-total Total Capital Expenditure Medium Term Revenue and Expenditure Framework Budget Year 2015/16 Description July August – – – Sept. October Nov. Dec. January Feb. March April May – – – – – – – – – – 66 66 762 1 179 66 66 762 1 179 66 66 762 1 179 66 66 762 1 179 66 66 762 1 179 66 66 762 1 179 66 66 762 1 179 66 66 762 1 179 66 66 762 1 179 66 66 762 1 179 1 074 1 074 1 074 1 074 1 074 1 074 1 074 1 074 1 074 1 074 1 074 1 074 1 074 1 074 1 074 1 074 1 074 1 074 1 074 1 074 B1 Budget Year 2015/16 June – – – – – – – – – – – – – – – – 66 66 1 524 2 178 – – – – – – – – – – 1 837 1 837 – – – – – – – – – – – – – – – – 728 730 9 143 12 1 967 – – – – – – – – – – 12 580 12 580 Budget Year +1 Budget Year +2 2016/17 2017/18 – – – – – – – – – – – – – – – – – 1 200 135 – – – – – – – – – – – – 1 335 1 335 – – – – – – – – – – – – – – – – – 800 135 – – – – – – – – – – – – 935 935 DC9 Frances Baard - Supporting Table SA29 Budgeted monthly capital expenditure (standard classification) R thousand Capital Expenditure - Standard Governance and administration Executive and council Budget and treasury office Corporate services Community and public safety Community and social services Sport and recreation Public safety Housing Health Economic and environmental services Planning and development Road transport Environmental protection Trading services Electricity Water Waste water management Waste management Other Total Capital Expenditure - Standard Medium Term Revenue and Expenditure Framework Budget Year 2015/16 Description July August Sept. October Nov. Dec. January Feb. March April May 186 66 66 54 – 186 66 66 54 – 186 66 66 54 – 186 66 66 54 – 186 66 66 54 – 186 66 66 54 – 186 66 66 54 – 186 66 66 54 – 186 66 66 54 – 160 122 160 122 160 122 160 122 160 122 160 122 160 122 160 122 160 122 160 122 – 38 – 38 – 38 – 38 – 38 – 38 – 38 – 38 – 38 – 38 – – 1 144 346 346 346 346 346 346 346 346 346 – – 186 66 66 54 797 739 58 – Funded by: National Government Provincial Government Budget Year 2015/16 June 186 66 66 54 7 973 – – 7 391 582 – 160 121 – 39 – – – – – – 8 319 – – B1 2 051 728 730 593 8 770 – – 8 130 640 – 1 759 1 339 – 420 – – – – – – 12 580 – – Budget Year +1 Budget Year +2 2016/17 2017/18 1 335 – 1 200 135 – – – – – – – – – – – – – – – – 1 335 – – 935 – 800 135 – – – – – – – – – – – – – – – – 935 – – DC9 Frances Baard - Supporting Table SA30 Budgeted monthly cash flow R thousand Cash Receipts By Source Property rates Property rates - penalties & collection charges Service charges - electricity revenue Service charges - water revenue Service charges - sanitation revenue Service charges - refuse revenue Service charges - other Rental of facilities and equipment Interest earned - external investments Interest earned - outstanding debtors Dividends received Fines Licences and permits Agency services Transfer receipts - operational Other revenue Cash Receipts by Source Other Cash Flows by Source Transfer receipts - capital Contributions recognised - capital & Contributed assets Proceeds on disposal of PPE Short term loans Borrowing long term/refinancing Increase (decrease) in consumer deposits Decrease (Increase) in non-current debtors Decrease (increase) other non-current receivables Decrease (increase) in non-current investments Total Cash Receipts by Source Cash Payments by Type Employee related costs Remuneration of councillors Finance charges Bulk purchases - Electricity Bulk purchases - Water & Sewer Other materials Contracted services Transfers and grants - other municipalities Transfers and grants - other Other expenditure Cash Payments by Type Other Cash Flows/Payments by Type Capital assets Repayment of borrowing Other Cash Flows/Payments Total Cash Payments by Type NET INCREASE/(DECREASE) IN CASH HELD Cash/cash equivalents at the month/year begin: Cash/cash equivalents at the month/year end: Medium Term Revenue and Expenditure Framework Budget Year 2015/16 MONTHLY CASH FLOWS July August Sept. October November December January February March April May June 26 627 – – – 26 627 – – 26 627 – – – 27 170 543 543 543 27 170 543 543 27 170 543 543 543 – – – – – – – 89 454 – – – – – 26 627 53 27 223 – – (75) – – – – – – 27 148 89 454 89 454 89 454 89 454 89 454 89 454 89 454 89 454 89 454 89 454 89 454 (75) 27 170 543 543 543 27 170 468 543 27 170 543 543 543 4 763 528 259 – – 337 – 3 250 4 366 528 259 – – 337 – 3 250 4 366 528 259 – – 337 – 3 250 4 366 528 259 – – 337 – 3 250 8 731 528 259 – – 337 – 3 250 4 366 528 259 – – 337 – 3 250 4 366 528 259 – – 337 – 3 250 4 366 528 259 – – 337 – 3 250 4 366 528 259 – – 337 – 3 250 4 366 528 259 – – 337 – 3 250 4 366 528 259 – – 337 – 3 250 1 275 10 413 1 275 10 016 1 275 10 016 1 275 10 016 1 275 14 381 1 275 10 016 1 275 10 016 1 275 10 016 1 275 10 016 1 275 10 016 1 275 10 016 959 959 959 959 959 556 959 959 959 959 959 4 366 528 259 – – 337 – 3 250 – 1 275 10 016 10 413 10 975 10 975 10 975 15 340 11 530 10 975 10 975 10 975 10 975 10 975 1 918 556 – 12 490 16 758 90 365 107 122 (10 432) 107 122 96 690 (10 432) 96 690 86 259 (10 432) 86 259 75 827 11 830 75 827 87 657 (11 063) 87 657 76 594 (10 432) 76 594 66 163 16 195 66 163 82 358 (10 432) 82 358 71 926 (10 432) 71 926 61 494 (10 432) 61 494 51 062 14 658 51 062 65 720 B1 Budget Year 2015/16 1 Budget Year +1 Budget Year +2 2016/17 2017/18 1 072 5 443 1 126 5 648 1 171 5 820 106 509 53 113 077 112 246 55 119 075 118 711 58 125 759 (150) (284) (163) 112 927 118 791 125 596 57 152 6 337 3 111 61 181 6 574 3 173 65 539 6 822 3 235 4 046 – 39 000 4 048 – 30 000 4 205 – 30 000 15 305 124 951 14 289 119 263 13 661 123 462 11 509 1 111 1 335 1 173 935 1 235 137 571 121 771 125 632 (24 644) 90 365 65 720 (2 980) 65 720 62 741 (36) 62 741 62 705 DC9 Frances Baard - NOT REQUIRED - municipality does not have entities Description R million Financial Performance Property rates Service charges Investment revenue Transfers recognised - operational Other own revenue Contributions recognised - capital & contributed assets Total Revenue (excluding capital transfers and contrib Employee costs Remuneration of Board Members Depreciation & asset impairment Finance charges Materials and bulk purchases Transfers and grants Other expenditure Total Expenditure Surplus/(Deficit) Capital expenditure & funds sources Capital expenditure Transfers recognised - operational Public contributions & donations Borrowing Internally generated funds Total sources 2011/12 2012/13 2013/14 Audited Outcome Audited Outcome Audited Outcome 2015/16 Medium Term Revenue & Expenditure Framework Current Year 2014/15 Original Budget Adjusted Budget Full Year Forecast Budget Year 2015/16 Budget Year +1 Budget Year +2 2016/17 2017/18 – – – – – – – – – – – – – – – – – – – – – – – – – – – – – – – – – – – – Financial position Total current assets Total non current assets Total current liabilities Total non current liabilities Equity Cash flows Net cash from (used) operating Net cash from (used) investing Net cash from (used) financing Cash/cash equivalents at the year end B1 DC9 Frances Baard - Supporting Table SA32 List of external mechanisms External mechanism Name of organisation Yrs/ Mths Period of agreement 1. Service provided Number B1 Monetary value Expiry date of service of agreement 2. delivery agreement or contract R thousand DC9 Frances Baard - Supporting Table SA33 Contracts having future budgetary implications Description R thousand Parent Municipality: Revenue Obligation By Contract Contract 1 Contract 2 Contract 3 etc Total Operating Revenue Implication Expenditure Obligation By Contract Contract 1 Contract 2 Contract 3 etc Total Operating Expenditure Implication Preceding Years Current Year 2014/15 2015/16 Medium Term Revenue & Expenditure Framework Forecast 2018/19 Forecast 2019/20 Forecast 2020/21 Forecast 2021/22 Forecast 2022/23 Forecast 2023/24 Forecast 2024/25 Total Original Budget Budget Year Budget Year +1 Budget Year +2 2015/16 2016/17 2017/18 Total Contract Value Estimate Estimate Estimate Estimate Estimate Estimate Estimate Estimate – – – – – – – – – – – – – – – – – – – – – – – – – – – – – – – – Capital Expenditure Obligation By Contract Contract 1 Contract 2 Contract 3 etc Total Capital Expenditure Implication – – – – – – – – – – – – – – – – Total Parent Expenditure Implication – – – – – – – – – – – – – – – – – – – – – – – Entities: Revenue Obligation By Contract Contract 1 Contract 2 Contract 3 etc Total Operating Revenue Implication Expenditure Obligation By Contract Contract 1 Contract 2 Contract 3 etc Total Operating Expenditure Implication – – – – – – – – – – – – – – – – – – – – – – Capital Expenditure Obligation By Contract Contract 1 Contract 2 Contract 3 etc Total Capital Expenditure Implication – – – – – – – – – – – – – – – – Total Entity Expenditure Implication – – – – – – – – – – – – – B1 DC9 Frances Baard - Supporting Table SA34a Capital expenditure on new assets by asset class Description 2011/12 Audited Outcome Capital expenditure on new assets by Asset Class/Sub-class R thousand Infrastructure Infrastructure - Road transport 2012/13 2013/14 Audited Outcome Audited Outcome 2015/16 Medium Term Revenue & Expenditure Framework Current Year 2014/15 Original Budget Adjusted Budget Full Year Forecast Budget Year 2015/16 Budget Year +1 Budget Year +2 2016/17 2017/18 – – – – 4 – – – – – – – – – – – – – – – – – – – – – – – – – – – – – – – – – – – – – – – – – – – – – – – – 380 – 159 159 – – – – 159 159 Roads, Pavements & Bridges Storm water Infrastructure - Electricity Generation Transmission & Reticulation Street Lighting Infrastructure - Water 4 Dams & Reservoirs Water purification 4 Reticulation Infrastructure - Sanitation Reticulation Sewerage purification Infrastructure - Other Waste Management Transportation Gas Other Community Parks & gardens Sportsfields & stadia Swimming pools Community halls Libraries Recreational facilities Fire, safety & emergency Security and policing Buses Clinics Museums & Art Galleries Cemeteries Social rental housing Other 4 Heritage assets Buildings Other 4 Investment properties Housing development Other 4 380 – – – – – – – – – – – – – – – – 4 – B1 DC9 Frances Baard - Supporting Table SA34a Capital expenditure on new assets by asset class Description R thousand Other assets General vehicles Specialised vehicles Plant & equipment Computers - hardware/equipment Furniture and other office equipment Abattoirs Markets Civic Land and Buildings Other Buildings Other Land Surplus Assets - (Investment or Inventory) Other 2011/12 2012/13 2013/14 Audited Outcome Audited Outcome Audited Outcome 1 941 3 – 427 245 221 3 236 1 992 – 34 620 1 042 208 3 2015/16 Medium Term Revenue & Expenditure Framework Current Year 2014/15 Original Budget 1 260 602 – 170 474 – – – – – – 382 13 Adjusted Budget Full Year Forecast 3 434 3 976 2 700 525 179 – – – – – 30 – 2 716 635 595 – – – – – 30 Budget Year 2015/16 4 391 – 2 716 624 996 – – – – – 55 – 11 533 4 654 3 400 Budget Year +1 Budget Year +2 2016/17 2017/18 – – – – 479 3 000 Agricultural assets List sub-class – – – – – – – – – Biological assets List sub-class – – – – – – – – – Intangibles Computers - software & programming Other (list sub-class) – – – – – – – – – Total Capital Expenditure on new assets Specialised vehicles Refuse Fire Conservancy Ambulances 1 949 – 3 616 – 1 264 – B2 3 593 4 135 4 391 11 533 – – 2 700 2 716 2 716 3 400 – – 2 700 2 716 2 716 3 400 DC9 Frances Baard - Supporting Table SA34b Capital expenditure on the renewal of existing assets by asset class Description 2011/12 2012/13 Audited Audited Outcome Outcome Capital expenditure on renewal of existing assets by Asset Class/Sub-class Audited Outcome R thousand Infrastructure Infrastructure - Road transport 2015/16 Medium Term Revenue & Expenditure Framework Current Year 2014/15 2013/14 Original Budget Adjusted Budget Full Year Forecast Budget Year Budget Year +1 Budget Year +2 2015/16 2016/17 2017/18 – – – – – – – – – – – – – – – – – – – – – – – – – – – – – – – – – – – – – – – – – – – – – – – – – – – – – – Community Parks & gardens Sportsfields & stadia Swimming pools Community halls Libraries Recreational facilities Fire, safety & emergency Security and policing Buses Clinics Museums & Art Galleries Cemeteries Social rental housing Other – 156 – – – – – – – Heritage assets Buildings Other – – – – – – – – – Investment properties Housing development Other – – – – – – – – – Roads, Pavements & Bridges Storm water Infrastructure - Electricity Generation Transmission & Reticulation Street Lighting Infrastructure - Water Dams & Reservoirs Water purification Reticulation Infrastructure - Sanitation Reticulation Sewerage purification Infrastructure - Other Waste Management Transportation Gas Other 156 B1 DC9 Frances Baard - Supporting Table SA34b Capital expenditure on the renewal of existing assets by asset class Description R thousand 2011/12 2012/13 2013/14 Audited Outcome Audited Outcome Audited Outcome Other assets General vehicles Specialised vehicles Plant & equipment Computers - hardware/equipment Furniture and other office equipment Abattoirs Markets Civic Land and Buildings Other Buildings Other Land Surplus Assets - (Investment or Inventory) Other 433 284 – 9 93 46 2 236 1 780 – 13 434 9 2015/16 Medium Term Revenue & Expenditure Framework Current Year 2014/15 Original Budget 1 289 484 – 13 148 – – – 18 577 – Adjusted Budget 1 586 1 160 – 133 293 Full Year Forecast 1 610 1 160 – 133 317 49 Budget Year Budget Year +1 Budget Year +2 2015/16 2016/17 2017/18 1 179 957 – 84 89 – – – 49 – – – 1 047 600 – 1 335 1 200 – 935 800 – 447 135 135 Agricultural assets List sub-class – – – – – – – – – Biological assets List sub-class – – – – – – – – – Intangibles Computers - software & programming Other (list sub-class) – – – 100 100 100 100 – – – – 1 686 1 710 Total Capital Expenditure on renewal of existing assets 433 Specialised vehicles Refuse Fire Conservancy Ambulances Renewal of Existing Assets as % of total capex Renewal of Existing Assets as % of deprecn" 2 392 – 18.2% 1.9% 1 289 – 39.8% 69.8% – 50.5% 31.8% – 31.9% 31.3% B2 1 179 – 29.3% 31.8% 1 047 – 21.2% 25.2% 1 335 – 8.3% 18.6% 935 – 100.0% 23.7% – 100.0% 16.5% DC9 Frances Baard - Supporting Table SA34c Repairs and maintenance expenditure by asset class Description 2011/12 Audited Outcome Repairs and maintenance expenditure by Asset Class/Sub-class R thousand Infrastructure Infrastructure - Road transport 2012/13 2013/14 Audited Outcome Audited Outcome 2015/16 Medium Term Revenue & Expenditure Framework Current Year 2014/15 Original Budget Adjusted Budget Full Year Forecast Budget Year 2015/16 Budget Year +1 Budget Year +2 2016/17 2017/18 – – – – 4 – – – – – – – – – – – – – – – – – – – – – – – – – – – – – – – – – – – – – – – – – – – – – – – – – 17 40 159 159 – – – – 40 159 159 – – – – – – – – – – – – – – – – Roads, Pavements & Bridges Storm water Infrastructure - Electricity Generation Transmission & Reticulation Street Lighting Infrastructure - Water 4 Dams & Reservoirs Water purification 4 Reticulation Infrastructure - Sanitation Reticulation Sewerage purification Infrastructure - Other Waste Management Transportation Gas Other Community Parks & gardens Sportsfields & stadia Swimming pools Community halls Libraries Recreational facilities Fire, safety & emergency Security and policing Buses Clinics Museums & Art Galleries Cemeteries Social rental housing Other Heritage assets Buildings Other Investment properties Housing development Other 17 1 1 – B1 DC9 Frances Baard - Supporting Table SA34c Repairs and maintenance expenditure by asset class Description R thousand Other assets General vehicles Specialised vehicles Plant & equipment Computers - hardware/equipment Furniture and other office equipment Abattoirs Markets Civic Land and Buildings Other Buildings Other Land Surplus Assets - (Investment or Inventory) Other 2011/12 2012/13 2013/14 Audited Outcome Audited Outcome Audited Outcome 2 313 – 2 313 1 377 348 – 146 337 315 231 2015/16 Medium Term Revenue & Expenditure Framework Current Year 2014/15 Original Budget 1 452 230 – 229 626 – – – 38 – 329 – Adjusted Budget 2 420 391 – 154 1 470 – – – – – 405 – Full Year Forecast 2 500 391 – 154 1 470 80 – – – – 405 Budget Year 2015/16 3 269 391 – 155 1 470 829 – – 26 333 66 Budget Year +1 Budget Year +2 2016/17 2017/18 4 046 483 – 69 2 912 4 048 507 – 71 2 857 4 205 528 – 74 2 967 583 612 636 Agricultural assets List sub-class – – – – – – – – – Biological assets List sub-class – – – – – – – – – Intangibles Computers - software & programming Other (list sub-class) – – – – Total Repairs and Maintenance Expenditure 2 314 Specialised vehicles Refuse Fire Conservancy Ambulances R&M as a % of PPE R&M as % Operating Expenditure 1 174 1 174 1 881 1 881 2 666 2 666 2 666 2 666 846 846 2 569 3 376 5 245 5 325 4 115 – 5.0% 2.2% – 5.4% 2.6% – 7.4% 3.3% – 11.4% 4.0% B2 – 11.4% 4.0% 4 046 – 8.8% 3.4% 4 048 – 8.3% 2.6% 4 205 – 9.1% 2.8% – 10.6% 2.8% DC9 Frances Baard - Supporting Table SA34d Depreciation by asset class Description R thousand Depreciation by Asset Class/Sub-class Infrastructure Infrastructure - Road transport 2011/12 2012/13 2013/14 Audited Outcome Audited Outcome Audited Outcome 2015/16 Medium Term Revenue & Expenditure Framework Current Year 2014/15 Original Budget Adjusted Budget Full Year Forecast Budget Year 2015/16 Budget Year +1 Budget Year +2 2016/17 2017/18 – – – – – – – – – – – – – – – – – – – – – – – – – – – – – – – – – – – – – – – – – – – – – – – – – – – – – – Community Parks & gardens Sportsfields & stadia Swimming pools Community halls Libraries Recreational facilities Fire, safety & emergency Security and policing Buses Clinics Museums & Art Galleries Cemeteries Social rental housing Other – – – – – – – – – Heritage assets Buildings Other – – – – – – – – – Investment properties Housing development Other – – – – – – – – – Roads, Pavements & Bridges Storm water Infrastructure - Electricity Generation Transmission & Reticulation Street Lighting Infrastructure - Water Dams & Reservoirs Water purification Reticulation Infrastructure - Sanitation Reticulation Sewerage purification Infrastructure - Other Waste Management Transportation Gas Other B1 DC9 Frances Baard - Supporting Table SA34d Depreciation by asset class Description R thousand 2011/12 2012/13 2013/14 Audited Outcome Audited Outcome Audited Outcome 2015/16 Medium Term Revenue & Expenditure Framework Current Year 2014/15 Original Budget Adjusted Budget Full Year Forecast Budget Year 2015/16 Budget Year +1 Budget Year +2 2016/17 2017/18 Other assets General vehicles Specialised vehicles Plant & equipment Computers - hardware/equipment Furniture and other office equipment Abattoirs Markets Civic Land and Buildings Other Buildings Other Land Surplus Assets - (Investment or Inventory) Other – – – – – – – – – – – – – – – – – – Agricultural assets List sub-class – – – – – – – – – Biological assets List sub-class – – – – – – – – – Intangibles Computers - software & programming Other (list sub-class) – – – – – – – – – Total Depreciation – – – – – – – – – Specialised vehicles Refuse Fire Conservancy Ambulances – – – – – – – – – B2 DC9 Frances Baard - Supporting Table SA35 Future financial implications of the capital budget Vote Description R thousand Capital expenditure Vote 1 - Executive & Council Vote 2 - Budget & Treasury Vote 3 - Corporate Services Vote 4 - Planning & Development Vote 5 - Project Management & Advisory Services Vote 6 - [NAME OF VOTE 6] Vote 7 - [NAME OF VOTE 7] Vote 8 - [NAME OF VOTE 8] Vote 9 - [NAME OF VOTE 9] Vote 10 - [NAME OF VOTE 10] Vote 11 - [NAME OF VOTE 11] Vote 12 - [NAME OF VOTE 12] Vote 13 - [NAME OF VOTE 13] Vote 14 - [NAME OF VOTE 14] Vote 15 - [NAME OF VOTE 15] List entity summary if applicable Total Capital Expenditure Future operational costs by vote Vote 1 - Executive & Council Vote 2 - Budget & Treasury Vote 3 - Corporate Services Vote 4 - Planning & Development Vote 5 - Project Management & Advisory Services Vote 6 - [NAME OF VOTE 6] Vote 7 - [NAME OF VOTE 7] Vote 8 - [NAME OF VOTE 8] Vote 9 - [NAME OF VOTE 9] Vote 10 - [NAME OF VOTE 10] Vote 11 - [NAME OF VOTE 11] Vote 12 - [NAME OF VOTE 12] Vote 13 - [NAME OF VOTE 13] Vote 14 - [NAME OF VOTE 14] Vote 15 - [NAME OF VOTE 15] List entity summary if applicable Total future operational costs Future revenue by source Property rates Property rates - penalties & collection charges Service charges - electricity revenue Service charges - water revenue Service charges - sanitation revenue Service charges - refuse revenue Service charges - other Rental of facilities and equipment List other revenues sources if applicable List entity summary if applicable Total future revenue Net Financial Implications 2015/16 Medium Term Revenue & Expenditure Framework Budget Year Budget Year +1 Budget Year +2 2015/16 2016/17 2017/18 Forecasts Forecast 2018/19 Forecast 2019/20 Forecast 2020/21 Present value 728 730 9 143 12 1 967 – – – – – – – – – – – 1 200 135 – – – – – – – – – – – – – 800 135 – – – – – – – – – – – – 12 580 1 335 935 – – – – – – – – – – 935 – – – – – – – – – – 12 580 – – 1 335 B1 DC9 Frances Baard - Supporting Table SA36 Detailed capital budget Municipal Vote/Capital project Program/Project description R thousand Project number IDP Goal code 2 Individually Approved (Yes/No) 6 Asset Class Asset Sub-Class Total Project Estimate 3 3 5 2015/16 Medium Term Revenue & Expenditure Framework Prior year outcomes GPS co-ordinates Audited Outcome 2013/14 Current Year 2014/15 Full Year Forecast Budget Year 2015/16 Budget Year +1 2016/17 Budget Year +2 2017/18 – – – – – – – – – Parent municipality: List all capital projects grouped by Municipal Vote Parent Capital expenditure Entities: List all capital projects grouped by Entity Entity A Water project A Entity B Electricity project B Entity Capital expenditure Total Capital expenditure – – B1 – – Project information Ward location New or renewal DC9 Frances Baard - Supporting Table SA37 Projects delayed from previous financial year/s Municipal Vote/Capital project Ref. 1,2 R thousand Parent municipality: List all capital projects grouped by Municipal Vote Project name Project number Asset Class 3 Asset Sub-Class 3 Examples Examples Entities: List all capital projects grouped by Municipal Entity Entity Name Project name B1 GPS co-ordinates 4 Previous target Current Year 2014/15 year to Full Year complete Original Budget Forecast Year 2015/16 Medium Term Revenue & Expenditure Framework Budget Year Budget Year +1 Budget Year +2 2015/16 2016/17 2017/18 SERVICE DELIVERY & BUDGET IMPLEMENTATION PLAN FRANCES BAARD DISTRICT MUNICIPALITY DRAFT SERVICE DELIVERY & BUDGET IMPLEMENTATION PLAN 2015 / 2016 SERVICE DELIVERY AND BUDGET IMPLEMENTATION PLAN 2015-2016 TABLE OF CONTENTS: 1. INTRODUCTION_____________________________________________________________________________________________3 2. CAPITAL WORKS PLAN _____________________________________________________________________________________5 2.1 Three-Year Capital Projects ____________________________________________________________________________________6 2.2 Spatial Development Framework_______________________________________________________________________________ 6 2.3 Spatial Planning Issues_______________________________________________________________________________________ 7 2.4 Capital Projects to category B municipalities for 2015/16 _____________________________________________________________7 3. HIGH-LEVEL SERVICE DELIVERY BREAKDOWN _____________________________________________________________8 4. BUDGET IMPLEMENTATION PLAN FOR 2015/16 ______________________________________________________________16 4.1 Monthly projections of revenue and expenditure by vote ____________________________________________________________16 5. CONCLUSION ______________________________________________________________________________________________20 FRANCES BAARD DISTRICT MUNICIPALITY 2 SERVICE DELIVERY AND BUDGET IMPLEMENTATION PLAN 2015-2016 1. INTRODUCTION The Service Delivery and Budget Implementation Plan (SDBIP) seek to promote municipal accountability and transparency and is an important instrument for service delivery and budget monitoring and evaluation. The SDBIP is a partnership contract between the administration, council and community, which expresses the goals and objectives set by the council as quantifiable outcomes that can be implemented by the administration over the next twelve (12) months. Chapter 1 of the MFMA defines the SDBIP as a detailed plan approved by the mayor of a municipality in terms of section 53(1)(c)(ii) for implementing the municipality’s delivery of services and the execution of its annual budget which must include (as part of the toplayer) the following: (a) Projections for each month: • Revenue to be collected, by source, and • Operational and capital expenditure, by vote. FRANCES BAARD DISTRICT MUNICIPALITY 3 SERVICE DELIVERY AND BUDGET IMPLEMENTATION PLAN 2015-2016 (b) Service delivery targets and performance indicators for each quarter. In terms of National Treasury’s Circular No. 13 the SDBIP must provide a picture of service delivery areas, budget allocations and enable monitoring and evaluation. It specifically requires the SDBIP to include: • Monthly projections of revenue to be collected for each source; • Monthly projections of expenditure (operating and capital) and revenue for each vote; • Quarterly projections of service delivery targets and performance indicators for each vote; • Information for expenditure and delivery; and a • Detailed capital works plan. In terms of sections 69(3) (a) and (b) of the MFMA the accounting officer of a municipality must submit to the mayor within 14 days after the approval of an annual budget, a draft SDBIP for the budget year and drafts of the annual performance agreements as required in terms of section 57(1) (b) of the Municipal Systems Act (MSA) for the municipal manager and all senior managers. Furthermore, according to section 53(1) (c) (ii) and (iii) of the MFMA, the Executive Mayor is expected to approve the SDBIP within 28 days after the approval of the budget. This coincides with the need to table at Council, drafts of the annual performance agreements for the municipal manager and all senior managers as required in terms of section 57(1) (b) of the MSA. The Frances Baard District Municipality’s 2014/15 Medium-term Budget and Integrated Development Plan (IDP) have been approved by Council on 23 March 2015 in terms of the MFMA and the MSA respectively. The process leading to the draft Budget, IDP and business plans, which have an important bearing on the finalization of the SDBIP, includes the following elements: • Departmental operational plans/departmental SDBIPs. These departmental SDBIPs provide the detailed plans and targets according to which the departments’ performance will be monitored. • The departmental SDBIP’s/operational plans contain performance plans of line managers. The performance plans were formulated in terms of the IDP sector plans and the operational mandates relevant to each department. The performance plans forms the basis for the signing of the annual performance agreements of the municipal manager and senior managers. The SDBIP represents the key performance targets as captured across core departments. FRANCES BAARD DISTRICT MUNICIPALITY 4 SERVICE DELIVERY AND BUDGET IMPLEMENTATION PLAN 2015-2016 The structure of the Frances Baard District Municipality’s 2015/16 SDBIP in the table below takes into account the pertinent legal requirements: SECTION Introduction Capital Works Plan High level Service Delivery Breakdown Budget Implementation Plan for 2015/16 DESCRIPTION • Legislative description of the SDBIP • Components of the SDBIP • Three year capital works plan • Spatial Development Framework • A list of key capital projects to be implemented in the budget year broken down according to municipalities • Municipal score card showing KPI’s and targets • • • • Conclusion Monthly projections of revenue to be collected by source Monthly projections of expenditure of operating, and revenue for each vote Monthly projection of capital by vote SDBIP as significant monitoring tool The budget implementation section of the SDBIP is categorised in terms of votes as prescribed by the MFMA. In the case of the FBDM, votes indicate a budget allocation for core administration. • • • • • Executive and Council Budget and Treasury Corporate Services Planning and Development Project Management and Advisory Services 2. CAPITAL WORKS PLAN The capital budget of Frances Baard District Municipality is focused on own capital expenditure needs such as computer equipment, upgrading of buildings, etc. and not so much on infrastructure services. FRANCES BAARD DISTRICT MUNICIPALITY 5 SERVICE DELIVERY AND BUDGET IMPLEMENTATION PLAN 2015-2016 2.1 Three-Year Capital Projects The table below outlines the medium-term capital budget of the Frances Baard District Municipality. Vote Description R thousand 2011/12 2012/13 2013/14 Audited Outcome Audited Outcome Audited Outcome 2015/16 Medium Term Revenue & Expenditure Framework Current Year 2014/15 Original Budget Adjusted Budget Full Year Forecast Budget Year 2015/16 Budget Year +1 2016/17 Budget Year +2 2017/18 Vote 1 - Executive & Council 138 112 59 187 187 189 728 – – Vote 2 - Budget & Treasury 295 1 853 693 1 358 1 365 1 636 730 1 200 800 Vote 3 - Corporate Services 593 874 1 519 3 539 3 700 3 514 9 143 135 135 49 2 558 21 63 459 63 12 – – 1 307 611 261 132 135 168 1 967 – – 2 382 6 008 2 553 5 279 5 845 5 570 12 580 1 335 935 Vote 4 - Planning & Development Vote 5 - Vote 5 - Project Management & Advisory Services Total Capital Expenditure - Vote 2.2 Spatial Development Framework A brief summary of the Spatial Development Framework (SDF) has been provided herewith. It highlights background to the SDF, the main issues identified by the SDF and objectives, strategies and projects formulated to address these spatial challenges. Municipalities are required by the provisions of Section 26(e) of the Municipal Systems Act 2000 to prepare and adopt a Spatial Development Framework (SDF) for their municipal area as part of the Integrated Development Plan. The objectives of Spatial Development Framework are clearly articulated under Section 4 of the Local Government: Municipal Planning and Performance Management Regulations 2001. The White Paper on Spatial Planning and Land Use Management, the Land Use Management Bill of 2007 and the Development Facilitation Act of 1995 are some of the legislation and government policies that gives municipalities the responsibility of preparing and adopting Spatial Development Frameworks for municipalities. The SDF for Frances Baard District Municipality was adopted by Council in December 2007. 2.3 Spatial Planning Issues FRANCES BAARD DISTRICT MUNICIPALITY 6 SERVICE DELIVERY AND BUDGET IMPLEMENTATION PLAN 2015-2016 One of the principal objectives of Spatial Development Framework is the promotion of sustainable human settlement development. However, there are a number of factors in the FBDM region that pose to undermine the sustainable development of the region, namely:• • • • • • • Population increase: All the municipalities in the district with the exception of Phokwane Local Municipality are experiencing an increase in population growth; The urban settlements in FBDM are inefficient and expensive to maintain and live in, because they are not compact and creating infrastructure maintenance burdens to municipalities; Poor local land management problems, caused by poor agricultural practices and mining; The Harts-, the Vaal- and Modder rivers are under endangered conditions; Dwindling flora and fauna as the Vaalbos National Park was de-proclaimed; Mines are poorly rehabilitated as evidenced by various open quarries and pits in the FBDM region; High concentration of crime in urban areas. 2.4 Capital Projects to category B municipalities for 2015/16 Circular 13 of the MFMA calls for the provision of detailed capital works plans to ensure sufficient detail to measure and monitor delivery of infrastructure projects. It has to be appreciated that the breakdown of the capital works plan, is helpful in terms of showing the spread of FBDM’s intervention in its provision of services. This section provides a breakdown of capital expenditure across the Frances Baard District Municipality. The capital projects for 2015/16 are broken down according to category B municipalities in the District. More detail will be provided at a later stage. FRANCES BAARD DISTRICT MUNICIPALITY 7 SERVICE DELIVERY AND BUDGET IMPLEMENTATION PLAN 2015-2016 3. HIGH-LEVEL SERVICE DELIVERY BREAKDOWN The Frances Baard District Municipality is required in terms of the SDBIP, to provide non-financial measurable performance objectives in the form of service delivery targets and other performance indicators. Service delivery targets relate to the level and standard of services being provided to the community. It also includes targets for the reductions in backlogs of basic services according to Circular 13 of the MFMA. The SDBIP provides high level, but condensed public information on service delivery to all stakeholders within and outside the District Municipality. The SDBIP is conceptualized as a layered plan dealing with consolidated service targets and in-year deadlines and linking such targets and deadlines to top management. The Municipal Score Card represents a consolidation of all the FBDM detailed service delivery targets and performance indicators as captured in the operational plans, the performance plans and score cards of the managers in the various departments of the municipality. In terms of the objectives, strategies and projects as listed in the Integrated Development Plan (IDP) and the budget, Frances Baard District Municipality commits itself as follows: 3.1 MUNICIPAL STRATEGIC OBJECTIVES: 1. To provide sustainable municipal services in the district; 2. To implement municipal institutional development and transformation in the district; 3. To promote local economic development in the district; 4. To promote municipal financial viability and management in the district; 5. To promote and implement good democratic governance and public participation in the district. FRANCES BAARD DISTRICT MUNICIPALITY 8 SERVICE DELIVERY AND BUDGET IMPLEMENTATION PLAN 2015-2016 3.2 FBDM PERFORMANCE PLAN / OPERATIONAL PLAN / SCORE CARD - 2015/16 Financial Year: FBDM PERFORMANCE PLAN / SCORE CARD - 2014/15 KEY PERFORMANCE AREA (KPA's) KEY PERFORMANCE INDICATORS (KPI's) Baseline Annual Targets Measure Verification IDP GOALS IDP OBJECTIVES 30/06/2014 2014/15 Unit PoE Quarterly Projections 1st Qtr 2nd Qtr 3rd Qtr 4th Qtr _ _ 100% KPA 1: Sustainable Municipal Infrastructure Development and Basic Service Delivery. 1. Percentage support and assi stance i n i denti fi cati on, pri ori ti sati on and revi ew of projects. Infrastructure needs l i st LM's 100% Approved Al l ocati ons % Compl eti on 2. Percentage support i n the provi si on of potabl e water to househol ds i n the di stri ct. Exi sti ng bul k servi ces 100% Spendi ng of al l ocati on (R 6,25m) Amount % spent Progress Quarterl y Project 10% 30% 70% Reports and R 0,625m R 1,875m R 4,375m spendi ng 100% R 6,25m Exi sti ng faci l i ti es 100% Spendi ng of al l ocati on (R 5,35m) Amount % spent Progress Quarterl y Project 10% 30% 70% Reports and R 0,535m R 1,605m R 3,745m spendi ng 100% R 5,35m 4. Percentage support i n the provi si on 100% Spendi ng Current access of al l ocati on of el ectri ci ty to househol ds i n the di stri ct. (R 1,95m) Amount % spent Progress Quarterl y Project 10% 30% 70% Reports and R 0,195m R 0,585m R 1,365m spendi ng 100% R 1,95m Sub-KPA 1.1: Improved access to sustainable basic 3. Percentage support i n the provi si on services in the district. of sani tati on faci l i ti es to al l househol ds i n the di stri ct. _ 5. Percentage support i n the provi si on of streets and stormwater drai nage to househol ds i n the di stri ct. 80% 100% (R 3.2m) Amount spent Progress Quarterl y Reports and On-si te measurements 20% R 0,64m 40% R 1,28m 70% R 2,24m 100% R 3,2m 6. Percentage support to l ocal 65% 10% i ncrease 75% Progress Spendi ng O&M Quarterl y Reports _ _ _ 75% 0% / New 50% Progress Spendi ng O&M Monthl y Reports / Appl i cati ons _ _ _ 50% 0% / New 100% R 6,41m % Progress Amount spent Monthl y Reports Amount spent 305 711 100% % Number Quarterl y Reports 10% 71 30% 213 60% 426 100% 711 305 711 100% % Number Quarterl y Reports 10% 71 30% 213 60% 426 100% 711 46ha 16ha 100% % Number/ ha Quarterl y Reports 4ha 25% 8ha 50% 12ha 75% 16ha 100% muni ci pal i ti es i n obtai ni ng bl ue drop Sub-KPA 1.1: Improved access to sustainable basic status. services in the district. 7. Percentage support to l ocal muni ci pal i ti es i n obtai ni ng green drop status. 8. Percentage support i n mai ntenance of muni ci pal i nfrastructure i n the di stri ct. Sub-KPA: 1.2 Facilitation of sustainable human settlements. Counci l Resol uti on Project Reports 9. Number of househol ds faci l i tated i n the reducti on of the housi ng backl og. 10. Number of househol ds wi th access to basi c muni ci pal servi ces i n i nformal settl ements. 11. Percentage/ ha. of l and i denti fi ed and acqui red for the establ i shment of human settl tements i n the di stri ct. FRANCES BAARD DISTRICT MUNICIPALITY 10% 30% 60% R 0,641m R 1,923m R 3,846m 100% R 6,41 9 SERVICE DELIVERY AND BUDGET IMPLEMENTATION PLAN 2015-2016 FBDM PERFORMANCE PLAN / SCORE CARD - 2014/15 KEY PERFORMANCE AREA (KPA's) KEY PERFORMANCE INDICATORS (KPI's) Baseline Annual Targets IDP GOALS IDP OBJECTIVES 30/06/2014 2014/15 Measure Verification Unit Quarterly Projections PoE 1st Qtr 2nd Qtr 3rd Qtr 4th Qtr KPA 2: Local Economic Development (LED) 12. Percentage support in the Completed diversification of the agricultural and Feasibility mining sectors in the district. Study 13. Percentage support and 4 facilitation of SMME programmes Programmes through the implementation of the 100% SMME support policy. Sub-KPA: 2.1 Facilitation of 14. Percentage completion of 3 3 / Research completed growth and diversification incentive policies for local municipalities in the district. 100% of the District Economy. 1 15. Percentage support to local Introductory municipalities in the facilitation of workshop EPWP projects in the district. 100% Identified 16. Percentage support to LED Coordination structures in the district. 17. Percentage support in the development of tourism in the L/M's 4 Info Centres 100% of the district. (Programmes & Projects) 18. Percentage facilitation in the Sub-KPA: 2.2 Development establishment of a vibrant 0 - 0% of a vibrant tourism sector destination brand in the district. (a) Main ativities (b) Programmes economy. 19. Number of strategic partnerships 3 established and percentage Assosiations participation in FBDM tourism 65% activities. functional 2 Projects = 100% % Progress Quarterly Reports 2 - 20% 2 - 50% 2 - 75% 2 - 100% 6 Programmes 100% % Progress Quarterly Reports 6 - 25% 6 - 50% 6 - 75% 6 - 100% 3 Policies 100% completed Number / % Quarterly Reports 3 / 25% 3 / 50% 3 / 75% 3 / 100% 2 Workshops 100% Number / % Quarterly Reports 1 / 50% _ 2/ 100% _ 100% % Quarterly Reports 25% 50% 75% 100% 8 Prog - 100% Number 2 Proj - 100% % Compliance Quarterly reports 10 - 25% 10 - 50% 10 - 75% 10 - 100% 4 Activ - 100% Number 1 Proj - 100% % Compliance Quarterly reports 3 Assosiations % 75% functional Functionality Quarterly reports FRANCES BAARD DISTRICT MUNICIPALITY (a) 1 - 25% (a) 2 - 50% (a) 3 - 75% (a) 4 - 100% (b) 1 - 25% (b) 1 - 50% (b) 1 - 75% (b) 1 - 100% 3 / 66% 3 / 70% 3 / 72% 3 / 75% 10 SERVICE DELIVERY AND BUDGET IMPLEMENTATION PLAN 2015-2016 FBDM PERFORMANCE PLAN / SCORE CARD - 2014/15 KEY PERFORMANCE AREA (KPA's) KEY PERFORMANCE INDICATORS (KPI's) Baseline Annual Targets IDP GOALS IDP OBJECTIVES 30/06/2014 2014/15 Measure Verification Unit PoE Quarterly Projections 1st Qtr 2nd Qtr 3rd Qtr 4th Qtr KPA 3: Institutional Development and Transformation. 20. Percentage improvement of 120 Activities municipal health services. (Quality completed of drinking water / Magareng & 100% Dikgatlong)) Sub-KPA 3.1 Environmental 16 21. Percentage improvement of Management. Pogrammes environmental planning and completed management in the district. 100% Sub-KPA 3.2: Disaster Management. 3% Improvement (30 Activities = % = Activities 100%) Quarterly reports 6 - 20% 14 - 46% 22 - 73% 30 - 100% 3% Improvement (8 Programmes % = Activities =100%) Quarterly reports 8 - 25% 8 - 50% 8 - 75% 8 - 100% 22. Percentage disaster management capacity building in 3 local municipalities of the district. Current status 30% 30 Volunteers % Compliance (a) trained & (b) with Training deployed 100% Plan Number of volunteers trained (a)30 100% (b) 25% (b) 50% (b) 75% (b) 100% 23. Percentage (a) development and (b) implementation of a response recovery strategy for the District. New / 0% Develop & % Compliance implement 100% Quarterly reports (a) 50% (a) 100% (b) 10% (b) 20% 24. Percentage implementation of response recovery mechanisms in 3 local municipalities of the district. New 0% 100% % Compliance Implementation Quarterly reports 25% 50% 75% 100% % Compliance with D/M Plan Monthly reports 5% 15% 20% 30% 25. Percentage increase in fire fighting capacity for 3 local municipalities in the District. Current status 30% 60% FRANCES BAARD DISTRICT MUNICIPALITY 11 SERVICE DELIVERY AND BUDGET IMPLEMENTATION PLAN 2015-2016 FBDM PERFORMANCE PLAN / SCORE CARD - 2014/15 KEY PERFORMANCE AREA (KPA's) KEY PERFORMANCE INDICATORS (KPI's) Baseline Annual Targets Measure Verification IDP GOALS IDP OBJECTIVES 30/06/2014 2014/15 Unit PoE Quarterly Projections 1st Qtr 2nd Qtr 3rd Qtr 4th Qtr 25% 50% 75% 100% 1 / 25% 2 / 50% 3 / 75% 4 / 100% KPA 3: Institutional Development and Transformation continue … Sub-KPA 3.2: Disaster Management continue ... Sub-KPA 3.3: Human Resource Development. Sub-KPA 3.4: Records Management. Sub-KPA 3.5: Information Communication Technology. (ICT) 26. Percentage upgrading and improvement of security systems in FBDM. 0% 100% 0 4 / 100% 28. Percentage compliance with HR requirements at FBDM. 0% 100% % Compliance Quarterly reports 100% 100% 100% 100% 29. Percentage compliance with HR capacity building requirements in 3 local municipaities of FBDM district, 0% 100% % Compliance Quarterly reports 100% 100% 100% 100% 82% 90% % Compliance Quarterly reports 83% 85% 87% 90% 90% 94% % Compliance Quarterly reports 91% 92% 93% 94% 32. Percentage maintenance rendered to FBDM buildings for the 2014/15 financial year. 90% 95% % Compliance Maintenance Reports 90% 91% 93% 95% 33. Percentage accessibility to improved ICT infrastructure in FBDM and 3 local municipalities of the district in the 2014/15 f/y. 80% 85% % Improved accessibility Quarterly reports on accessibility 80% 81% 83% 85% 34. Percentage implementation of the ICT Disaster Recovery Plan in FBDM and 3 L/M's for the 2014/15 financial year. 35% 60% % Compliance Quarterly reports 40% 45% 50% 60% 0% 100% % Compliance Quarterly reports 25% 50% 75% 100% 27. Number of health and safety inspections conducted in FBDM according to the OH&S Act. 30. Percentage compliance with the National Archives Act in FBDM and L/M's in the district for the 2014/15 financial year. 31. Percentage of an effective and costefficient office support function rendered to FBDM for 2014/15. 35. Percentage alignment of municipal IT objectives with governance IT principles. % Compliance Quarterly reports Number / % Quarterly reports FRANCES BAARD DISTRICT MUNICIPALITY 12 SERVICE DELIVERY AND BUDGET IMPLEMENTATION PLAN 2015-2016 FBDM PERFORMANCE PLAN / SCORE CARD - 2014/15 KEY PERFORMANCE AREA (KPA's) KEY PERFORMANCE INDICATORS (KPI's) Baseline Annual Targets Measure Verification IDP GOALS IDP OBJECTIVES 30/06/2014 2014/15 Unit PoE Quarterly Projections 1st Qtr 2nd Qtr 3rd Qtr 4th Qtr 25% 50% 75% 100% KPA 3: Institutional Development and Transformation continue … Sub-KPA 3.6: Integrated Development Planning. (IDP) Sub-KPA 3.7: Performance Management. (PMS) Sub-KPA 3.8: Town and Regional Planning. 36. Percentage facilitation of IDP processes in the district for the 2014/15 f/y in compliance with legislation and policies. 5 / 100% 5 / 100% 37. Percentage of 5 IDP's in the district reviewed for the 2014/15 financial year. 5 / 100% 5 / 100% % of IDP reviews completed Quarterly reports / Process Plans 25% 50% 75% 100% 38. Percentage facilitation of the review of sector plans in the district for 2014/15 in terms of legislation. 16 Sector Plans 2 / 100% % Progress Quarterly reports Reviewed Sector Plans 2 / 25% 2 / 50% 2 / 75% 2 / 100% 39. Percentage compliance with the implementation of a fully compliant institutional performance management system in FBDM and the local municipalities in the district. 100% 100% % Compliance Quarterly reports and appraisals 25% 50% 75% 100% 40. Percentage managerial support and capacity building in complying with local government legislation. 100% 100% % Requests addressed Quarterly reports 25% 50% 75% 100% 41. Percentage alignment of PMS governance principles with the performance objectives of the municipality. 100% 100% % Compliance Quarterly reports 25% 50% 75% 100% 42. Percentage facilitation of the development of urban areas in accordance with approved spatial plans. 3 LM's - 100% 100% of new Applications % Support requested Monthly reports / Approved Applications 100% 100% 100% 100% 43. Percentage implementation and review of the spatial development framework of the district. 4 LM's - 100% 100% of new Applications % Support requested Monthly reports 100% 100% 100% 100% 1 Approved layout plan 2 layout plans 100% % Completed Monthly & Quarterly reports + completed plans 50% 100% _ _ 44. Percentage facilitation of the preparation of township establishments in 2 local municipalities.(Phokwane,Dikgatlong) % Credible IDP Quarterly reports processes / Process Plans completed FRANCES BAARD DISTRICT MUNICIPALITY 13 SERVICE DELIVERY AND BUDGET IMPLEMENTATION PLAN 2015-2016 FBDM PERFORMANCE PLAN / SCORE CARD - 2014/15 KEY PERFORMANCE AREA (KPA's) KEY PERFORMANCE INDICATORS (KPI's) Baseline Annual Targets Measure Verification IDP GOALS IDP OBJECTIVES 30/06/2014 2014/15 Unit PoE Quarterly Projections 1st Qtr 2nd Qtr 3rd Qtr 4th Qtr 25% - 50% - 75% 50% 100% 100% 25% 50% 75% 100% 8 / 25% 16/ 50% 10 / 50% 15 / 75% 20 / 100% KPA 3: Institutional Development and Transformation continue … Sub-KPA 3.9: Geographical Information System. (GIS) 45. Percentage implementation of GIS shared services in the district for the 2014/15 financial year. (a) Phokwane / data cleansing. (b) Sol Plaatje/ water infrastructure data. 46. Percentage marketing of GIS as an essential management and planning tool for the 2014/15 financial year. Phase 2 completed Magareng 100% 0% Phase 2 Completed (a)Phokwane activities % Quarterly Reports 100% Completion (b) Sol Plaatje 100% 100% % Compliance Quarterly reports KPA 4: Good Governance and Public Participation. 47. Number of communication activities implemented in order to sustain a positive public opinion about service delivery in the district. 48. Number of communication programmes facilitated to improve on the collaboration of government activities to achieve a "one message" approach in the district. 49. Percentage completion and implementation of a support plan for staff morale and motivation. 50. Percentage assistance and guidance regarding internal risk management procesess in FBDM for the 2014/15 financial year. 51. Percentage compliance with quarterly assessments to evaluate Sub-KPA 4.2: Internal Audit. and contribute to the establishment of effective control procesess in the district. (FBDM & LM's) Sub-KPA 4.1: Communication. 52. Percentage capacity building and support in internal audit within the local municipalities in the district. Number activities Monthly completed Quarterly Reports % progress with activities 8 Projects completed 100% 32 Activities completed 100% 21 Programmes completed 100% 20 Programmes completed 100% Number of programmes completed % progress Quarterly reports 5 / 25% 100% 1 / 100% % Progress Quarterly surveys and reports 25% 50% 75% 100% 0% 100% Monthly activities processed Monthly statements and Reports 100% 100% 100% 100% 0% 100% Monthly / Quarterly I/A reports Monthly / Quarterly I/A reports 100% 100% 100% 100% 0% 100% Monthly / Quarterly I/A reports Monthly / Quarterly I/A reports 100% 100% 100% 100% FRANCES BAARD DISTRICT MUNICIPALITY 24 / 75% 32 /100% 14 SERVICE DELIVERY AND BUDGET IMPLEMENTATION PLAN 2015-2016 4. BUDGET IMPLEMENTATION PLAN FOR 2015/16 In respect of the budget implementation component of the SDBIP, circular 13 requires a breakdown by monthly projections of revenue to be collected for each source and monthly projections of operational and capital expenditure and revenue for each vote. 4.1 Monthly projections of revenue and expenditure by vote The anticipated revenue for the 2015/16 financial year amounts to R112, 507, 000 and the expenditure amounts to R114, 901, 000 The table below provides a summary of the monthly projections for revenue and expenditure per vote. 4.2 Monthly projections: Capital expenditure by vote The FBDM envisages a spending of R12 580 000 on the capital budget for 2015/16 financial year. The Capital Budget will be funded from a combination of surplus cash, grants allocations and other public contributions. This is followed by monthly projections for the 2015/16 financial year for each vote. FRANCES BAARD DISTRICT MUNICIPALITY 15 SERVICE DELIVERY AND BUDGET IMPLEMENTATION PLAN 2015-2016 Opex R000 July Capex R000 Rev R000 Opex R000 August Capex R000 Rev R000 Opex R000 908 228 75 230 224 0 0 611 0 0 0 0 51 0 0 1 1 223 0 0 0 0 0 0 1 250 908 228 75 230 224 0 0 611 0 0 0 0 51 0 0 1 0 0 0 0 0 0 0 0 908 228 75 230 224 0 0 611 0 0 0 0 51 0 0 1 611 1 611 1 0 611 Finance: Revenue & Expenditure Finance: Budget Office Finance: Supply Chain Management Finance: Motor Vehicle Pool 306 816 241 68 9 2 0 50 1 250 21 324 0 0 0 306 816 241 68 9 2 0 50 543 0 0 0 Corporate Services Director: Administration Information Systems Human Resource Management Office support Services Environmental Health Firefighting & Disaster Management 140 345 371 580 197 569 0 37 3 10 35 678 0 0 0 0 0 0 140 345 371 580 197 569 0 37 3 10 35 678 Planning & Development Directorate: Planning IDP / PMS LED Tourism GIS Spatial Planning IDP Management 221 93 510 467 156 325 67 0 0 1 0 0 0 0 235 0 0 0 0 0 0 221 93 510 467 156 325 67 284 3 567 86 574 27 83 0 0 2 545 0 250 350 12 868 986 28 427 VOTE Executive & Council Council Municipal Manager Committee Services & Administration Internal Audit Communications Legal & Risk Political Office - Administration Youth Unit Budget & Treasury Directorate Project Management & Advisory Services Directorate: Infrastructure Development Project Management Services Maintenance of Roads Housing Total by Vote September Capex Rev R000 R000 Opex R000 October Capex R000 Rev R000 Opex R000 0 0 0 0 0 0 0 0 908 228 75 230 224 0 0 611 0 0 0 0 51 0 0 1 0 0 0 0 0 0 0 0 908 228 75 230 224 0 0 611 0 0 0 0 51 0 0 1 1 223 0 0 0 0 0 0 0 908 228 75 230 224 0 0 611 0 0 0 0 51 0 0 1 0 0 0 0 0 0 0 0 1 0 611 1 0 611 1 611 1 0 306 816 241 68 9 2 0 50 543 0 0 0 306 816 241 68 9 2 0 50 543 0 0 0 306 816 241 68 9 2 0 50 0 22 574 0 0 0 306 816 241 68 9 2 0 50 543 0 0 0 0 0 0 0 0 0 140 345 371 580 197 569 0 37 3 10 35 678 0 0 0 0 0 0 140 345 371 580 197 569 0 37 3 10 35 678 0 0 0 0 0 0 140 345 371 580 197 569 0 37 3 10 35 678 0 0 0 0 0 0 140 345 371 580 197 569 0 37 3 10 35 678 0 0 0 0 0 0 0 0 1 0 0 0 0 0 0 0 0 0 0 0 221 93 510 467 156 325 67 0 0 1 0 0 0 0 0 0 0 0 0 0 0 221 93 510 467 156 325 67 0 0 1 0 0 0 0 0 0 0 0 0 0 0 221 93 510 467 156 325 67 0 0 1 0 0 0 0 235 0 0 0 0 0 0 221 93 510 467 156 325 67 0 0 1 0 0 0 0 0 0 0 0 0 0 0 284 3 567 86 574 27 83 0 0 0 0 0 0 284 3 567 86 574 27 83 0 0 0 0 0 0 284 3 567 86 574 27 83 0 0 0 0 0 0 284 3 567 86 574 27 83 0 0 2 545 0 250 350 284 3 567 86 574 27 83 0 0 0 0 0 0 12 868 986 543 12 868 986 543 12 868 986 543 12 868 986 27 177 12 868 986 543 FRANCES BAARD DISTRICT MUNICIPALITY November Capex Rev R000 R000 Opex R000 December Capex Rev R000 R000 16 SERVICE DELIVERY AND BUDGET IMPLEMENTATION PLAN 2015-2016 January VOTE February March April May June Total Opex Capex Rev Opex Capex Rev Opex Capex Rev Opex Capex Rev Opex Capex Rev Opex Capex Rev Opex Capex Rev R000 R000 R000 R000 R000 R000 R000 R000 R000 R000 R000 R000 R000 R000 R000 R000 R000 R000 R000 R000 R000 Council 908 0 0 908 0 1 223 908 0 0 908 0 0 908 0 0 908 0 1 223 10 897 0 4 891 Municipal Manager 228 0 0 228 0 0 228 0 0 228 0 0 228 0 0 228 0 0 2 733 0 0 75 0 0 75 0 0 75 0 0 75 0 0 75 0 0 75 0 0 900 0 0 Vote1: Executive & Council Committee Services & Administration Internal Audit 230 0 0 230 0 0 230 0 0 230 0 0 230 0 0 230 0 0 2 757 0 0 Communications 224 51 0 224 51 0 224 51 0 224 51 0 224 51 0 224 51 0 2 684 610 0 Legal & Risk 0 0 0 0 0 0 0 0 0 0 0 0 0 0 0 0 0 0 0 0 0 Political Office - Administration 0 0 0 0 0 0 0 0 0 0 0 0 0 0 0 0 0 0 0 0 611 1 0 611 1 0 611 1 0 611 1 0 611 1 0 611 1 0 7 330 7 0 1 250 Directorate 611 1 0 611 1 611 1 0 611 1 0 611 1 0 611 1 7 306 9 543 306 9 306 9 543 306 9 543 306 9 543 306 9 0 22 031 7 330 Finance: Revenue & Expenditure 0 22 574 3 668 105 1 250 92 845 Finance: Budget Office 816 2 0 816 2 0 816 2 0 816 2 0 816 2 0 816 2 0 9 792 18 0 Finance: Supply Chain Management 241 0 0 241 0 0 241 0 0 241 0 0 241 0 0 241 0 0 2 894 0 0 68 50 0 68 50 0 68 50 0 68 50 0 68 50 0 68 50 0 815 600 0 Youth Unit Vote2 - Budget & Treasury Finance: Motor Vehicle Pool Vote3: Corporate Services Director: Administration 140 0 0 140 0 0 140 0 0 140 0 0 140 0 0 140 0 0 1 678 0 0 Information Systems 345 37 0 345 37 0 345 37 0 345 37 0 345 37 0 345 37 0 4 142 438 0 Human Resource Management 371 3 0 371 3 0 371 3 0 371 3 0 371 3 0 371 3 0 4 457 36 0 Office support Services 580 10 0 580 10 0 580 10 0 580 10 0 580 10 0 580 10 0 6 961 119 0 Environmental Health 197 35 0 197 35 0 197 35 0 197 35 0 197 35 0 197 35 0 2 364 420 0 Vote: Firefighting & Disaster Management 569 678 0 569 678 0 569 678 0 569 678 0 569 0 0 569 678 158 6 833 7 453 158 FRANCES BAARD DISTRICT MUNICIPALITY 17 SERVICE DELIVERY AND BUDGET IMPLEMENTATION PLAN 2015-2016 January VOTE February March April May June Total Opex Capex Rev Opex Capex Rev Opex Capex Rev Opex Capex Rev Opex Capex Rev Opex Capex Rev Opex Capex Rev R000 R000 R000 R000 R000 R000 R000 R000 R000 R000 R000 R000 R000 R000 R000 R000 R000 R000 R000 R000 R000 221 0 0 221 0 235 221 0 0 221 0 0 221 0 0 221 0 235 2 653 0 940 93 0 0 93 0 0 93 0 0 93 0 0 93 0 0 93 0 0 1 112 0 0 GIS 156 0 0 156 0 0 156 0 0 156 0 0 156 0 0 156 0 0 1 872 0 0 Spatial Planning 325 0 0 325 0 0 325 0 0 325 0 0 325 0 0 325 0 0 3 898 0 0 LED 510 1 0 510 1 0 510 1 0 510 1 0 510 1 0 510 1 0 6 115 12 0 Tourism 467 0 0 467 0 0 467 0 0 467 0 0 467 0 0 467 0 0 5 610 0 0 67 0 0 67 0 0 67 0 0 67 0 0 67 0 0 67 0 0 804 0 0 284 27 0 284 27 2 545 284 27 0 284 27 0 284 27 0 284 27 2 545 327 10 181 3 567 83 0 3 567 83 0 3 567 83 0 3 567 83 0 3 567 83 0 3 567 83 0 3 409 42 798 1 000 86 0 0 86 0 250 86 0 0 86 0 0 86 0 0 86 0 250 1 029 0 0 1 000 Housing 574 0 0 574 0 350 574 0 0 574 0 0 574 0 0 574 0 350 6 885 0 1 400 Total by Vote 12 868 986 543 12 868 986 27 177 12 868 986 543 12 868 986 543 12 868 308 543 12 868 986 26 791 154 419 11 151 113 915 Vote4: Planning & Development Directorate: Planning IDP / PMS IDP Management Vote5: Project Management & Advisory Services Directorate: Infrastructure Development Project Management Services Maintenance of Roads 5. CONCLUSION The SDBIP is a significant intervention tool in the strengthening of democratic governance in the local sphere of government. The SDBIP prescribes that the FBDM’s annual targets be provided in order to assist with implementation and monitoring. Regular reviews would compare targets with actual outcomes and revise future targets as necessary. The SDBIP monitoring of actual revenue targets and spending against the budget will be reported monthly in terms of section 71 of the MFMA. In terms of section 71 of the MFMA, the accounting officer must not later than ten days after the last working day of each FRANCES BAARD DISTRICT MUNICIPALITY 18 SERVICE DELIVERY AND BUDGET IMPLEMENTATION PLAN 2015-2016 month, submit to the Executive Mayor and the relevant provincial treasury a statement on the state of the municipalities’ budget, reflecting the following; • Actual revenue, per revenue source; • Actual borrowings; • Actual expenditure, per vote; • Actual capital expenditure, per vote; • The amount of any allocations received; And explanation of: • Any material variances from what the municipality have projected on revenue by source, and from the municipality’s expenditure projections per vote; • Any material variances from the service delivery and budget implementation plan and; • Any remedial or corrective steps taken or to be taken to ensure that projected revenue and expenditure remain within the municipality’s approved budget. The SDBIP therefore provides an excellent basis for the councilors of the FBDM to monitor the implementation of service delivery programmes and initiatives across the district. The score card in the SDBIP presents a clear mandate to councilors in terms of playing their oversight function. Regular reports are presented to the section 79 committees in terms of the commitments made in the departmental/unit operational plans. Administratively, the SDBIP facilitates proper monitoring of performance by senior management and the municipal manager against set targets. The municipal manager’s commitments as indicated in the score card will enable the Executive Mayor and the Mayoral Committee to monitor the progress of FBDM in terms of implementing programmes and initiatives in the district. Similarly, the municipal manager is being provided with a tool to ensure accountability for all the key performance indicators in the score card of the municipality. SUBMITTED BY: DATE: ______________________ ____________________________ Municipal Manager FRANCES BAARD DISTRICT MUNICIPALITY 19 SERVICE DELIVERY AND BUDGET IMPLEMENTATION PLAN 2015-2016 APPROVED BY: DATE: ______________________ ___________________________ Executive Mayor FRANCES BAARD DISTRICT MUNICIPALITY 20


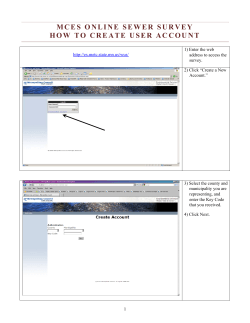


© Copyright 2026