
Economic Impact Report-April 15, 2015
VILLAGE AT SQUAW VALLEY SPECIFIC PLAN ECONOMIC IMPACT AND URBAN DECAY ANALYSIS APRIL 15, 2015 555)University)Ave,)Suite)280)•)Sacramento,)CA)95825 Phone:)l916p)561-0890)•)Fax:)l916p)561-0891 www.goodwinconsultinggroup.net Village at Squaw Valley Specific Plan Economic Impact and Urban Decay Analysis TABLE OF CONTENTS 1. INTRODUCTION ................................................................................................ 1 2. STUDY AREA .................................................................................................... 9 3. OVERVIEW OF TOURISM AND REAL ESTATE MARKETS .............................. 13 4. APPLICABLE RETAIL ANALYSIS.................................................................... 24 5. HOTEL AND CONDO HOTEL ANALYSIS......................................................... 34 PURPOSE OF STUDY ........................................................................................................1 KEY SOURCE MATERIALS ...............................................................................................1 PROJECT DESCRIPTION ....................................................................................................2 TOURISM AND LODGING MARKET ................................................................................13 RESIDENTIAL MARKET .................................................................................................21 COMMERCIAL RETAIL MARKET ....................................................................................22 RETAIL SALES LEAKAGE AND CAPTURE .......................................................................24 POTENTIAL IMPACTS FROM FUTURE SUPPLY ON APPLICABLE RETAIL ..........................29 ECONOMIC IMPACT SUMMARY .....................................................................................32 HISTORICAL AND CURRENT LODGING CONDITIONS ......................................................34 LODGING PROJECTIONS.................................................................................................36 ECONOMIC IMPACT SUMMARY .....................................................................................37 APPENDICES APPENDIX A: APPLICABLE RETAIL ANALYSIS TABLES APPENDIX B: HOTEL AND CONDO HOTEL ANALYSIS TABLES APPENDIX C: SAMPLE PHOTOS BY RETAIL CLUSTER Chapter 1 INTRODUCTION PURPOSE OF STUDY California court cases in recent years involving certain commercial development projects have centered on whether such projects could produce adverse economic impacts that lead to urban decay. The potential urban decay, resulting from new businesses in a proposed project displacing existing businesses in nearby older areas, may be considered an environmental impact within the scope of the California Environmental Quality Act’s (CEQA’s) environmental review. This Economic Impact Analysis (EIA) evaluates the potential economic impacts of the proposed development within the Village at Squaw Valley Specific Plan (VSVSP or Project) on existing businesses and commercial areas in the northwestern Lake Tahoe region to provide a factual basis for CEQA evaluation. Supply and demand dynamics are merged to describe the market depth and potential impacts related to the restaurant, various other retail, and lodging land uses envisioned for the Project. The analysis attempts to demonstrate that either: 1) enough demand will develop over time to warrant some or all of the new Project restaurant, retail, and lodging uses at buildout approximately 25 years into the future, after considering other future supply as well; or 2) enough demand will not materialize in 25 years to support some or all of the new Project, including other future supply, without adversely impacting existing restaurant, retail, and lodging merchants to an extent that could force them out of business. The degree and duration of impacts on existing businesses, to the extent there appear to be any, including the possibility of displacement, are evaluated. If displacement is anticipated, the EIA determines if the closing of these businesses could lead to long-term vacancies, the extent to which such vacancies could result in the deterioration of the buildings where the businesses were located because the buildings could not be re-tenanted or repurposed, and whether they could culminate in adverse physical changes that lead to conditions consistent with blight. KEY SOURCE MATERIALS There is a wealth of comprehensive, relevant, and timely research and literature about the Lake Tahoe area, North Lake Tahoe in particular, and even the Tahoe Basin portion of the North Lake Tahoe area. The EIA references those materials and in many instances integrates sections of them verbatim. The six reports frequently referred to or cited in the EIA, together with their footnote designations, are delineated below: 1 Tahoe Basin Policy Document, Existing Conditions Report, prepared by Dyett & Bhatia for Placer County, September 2013. Village at Squaw Valley Specific Plan Economic Impact & Urban Decay Analysis 1 April 15, 2015 2 3 4 Placer County Travel Industry Assessment and Detailed Economic Impact Estimates, prepared by Dean Runyan Associates for Placer County Office of Economic Development, Placer Valley Tourism, Placer County Visitors Bureau, and North Lake Tahoe Resort Association, March 2009. The Economic Benefits of the North Lake Tahoe/Truckee Transit Vision, prepared by Economic & Planning Systems for North Lake Tahoe Resort Association, November 2014. Market Study for the Bay to Tahoe Basin Recreation and Tourism Travel Impact Study, prepared by Economic & Planning Systems for Wood Rodgers, December 2013. 5 The Economic Significance of Travel to the North Lake Tahoe Area, prepared by Dean Runyan Associates for North Lake Tahoe Resort Association, November 2013. 6 Tahoe Basin Community Plan Economic and Market Analysis, prepared by Economic & Planning Systems for Placer County, July 2013. In addition to these documents, the EIA refers to and incorporates sections of the Village at Squaw Valley Specific Plan Draft Environmental Impact Report (VSVSP Draft EIR), prepared by Ascent Environmental for Placer County, dated April 2015. PROJECT DESCRIPTION The Project is located within the 4,700-acre Squaw Valley in northeastern Placer County, west of State Route (SR) 89 on the California side of the North Lake Tahoe region, approximately nine miles south of Truckee and seven miles northwest of Tahoe City. See the regional location map from the VSVSP Draft EIR on the following page. The Project area encompasses a total of approximately 94 acres, including approximately 85 acres in the main village area on the west side of the valley and an approximately 8.8-acre area referred to as the East Parcel located approximately 1.3 miles east of the main village area along Squaw Valley Road (0.3 miles west of the T-intersection that Squaw Valley Road makes with SR 89). Historically, the Project area has been used for visitor and resident resort facilities, including skier services, parking, lodging, commercial uses, and maintenance facilities. The VSVSP proposes to comprehensively plan development of a world-class, recreationbased, all-season, mountain-resort community consisting of residential and lodging units that would include a mixture of condo hotel, fractional ownership, and timeshare units; additional buildings would be developed for employee housing. The VSVSP would also allow for development of commercial, retail, and recreational uses, including skier services, retail shopping, restaurants and bars, adventure/entertainment facilities, parking, heavy equipment and mountain maintenance facilities, and shipping & receiving services. Other significant land use categories include areas designated to retain the general character of the forest environment and to preserve and restore the natural beauty and ecological resources of the valley, including stream environments and wildlife habitats. A map identifying the proposed land uses and a table Village at Squaw Valley Specific Plan Economic Impact & Urban Decay Analysis 2 April 15, 2015 Exhibit 3-1 Placer County Village at Squaw Valley Specific Plan Project DEIR Regional Location 1 LEGEND VC-C VC-N V-P V-HC V-FR V-CP EC Village Commercial - Core Village Commercial - Neighborhood Village - Parking Village - Heavy Commercial Village - Forest Recreation Village - Conservation Preserve Entrance Commercial 0’ 200’ 400’ 600’ N Table 3-1 Proposed Land Uses Area (acres) Maximum Units Maximum Bedrooms Maximum Density (br/acre) Average Density (br/acre) Maximum Commercial (sf)a Existing Commercial to be Removed (sf) Percent of Plan Area Village Commercial – Core (VC-C) 13.66 517 883 125 85 223,369 54,937 14.6% Village Commercial – Neighborhood (VC-N) 18.47 333 610 71 39 40,364 36,585 19.8% Village – Parking (V-P) 8.79 - - - - - - 9.4% Village – Heavy Commercial (V-HC) 2.85 - - - - 10,000 - 3.1% Developed Area Subtotal 43.77 850 1,493 - - 273,733 91,522 46.9% Village – Forest Recreation (V-FR) 15.40 - - - - - - 16.5% Village – Conservation Preserve (V-CP) 17.78 - - - - - - 19.1% 33.80 - - - - - - 35.5% 7.58 - - - - - - 8.1% 84.53 - - - - 273,733 91,522 90.5% Entrance Commercial (EC)b 7.01 50 150b 300b - 20,000c - 7.5% Village – Conservation Preserve (V-CP) 1.03 - - - - - - 1.1% Roads 0.76 - - - - - - 0.8% Total East Parcel 8.8 50 150 - - 20,000 - 9.4% Total 93.33 900d 1,653 - - 297,733b 91,522 100.0% Land Use Main Village Area Undeveloped Area Subtotal Roads Total Main Village Area East Parcel Notes: br/acre = bedroom per acre; sf = square feet a Includes replacement of existing commercial uses and maintenance facilities. The square footage includes hotel common areas, conference rooms, and similar uses beyond the traditional retail, restaurant, and similar commercial uses. b Employee housing is included in the Entrance Commercial land use area in the East Parcel. Employee housing capacity is reflected as the number of “beds” rather than “bedrooms” as the beds could ultimately be provided in a variety of private room, shared room, and dormitory configurations. These beds could also be contained in a variety of different building or “unit” configurations. Given these conditions, it is not appropriate to convey employee housing capacity in the same unit and bedroom metrics used to describe other housing in the plan area. c Includes 15,000 sf of shipping/receiving and 5,000 sf of market. d Total development within the plan area shall not exceed the maximum units and commercial square footage shown. Source: Squaw Valley Real Estate, LLC 2014 quantifying the proposed land uses, both from the VSVSP Draft EIR, are presented on the prior pages following the regional location map. The proposed land uses will be developed with a pedestrian-oriented, mixed-use, multiconnected, hospitality-focused intention. These uses are intended to integrate amenities that attract visitors in both the winter and summer months, although many of the services and amenities will be available both to resort guests and day-only visitors as well as to members of the broader community. Some of the development goals from the Squaw Valley General Plan Land Use Ordinance cited in the VSVSP Draft EIR include the following: Encourage development of a destination resort Provide a mix of housing types for all segments of the population to contribute to a dynamic year-round community Create a broad range of recreational opportunities to attract vacation-oriented visitors, both summer and winter, to the area to develop a viable year-round community Ensure that Squaw Valley is developed into a top quality, year-round, destination resort As shown on the land use table from the VSVSP Draft EIR, a maximum of 850 residential units in the main village area will be constructed, and a maximum of 50 employee housing units are anticipated on the site of the East Parcel. Of the 850 residential units, the Project applicant is expecting 47 to be timeshare units and 31 to be fractional ownership units; the remaining 772 units are planned to be condo hotel units containing up to 1,323 bedrooms. However, the current unit mix may be subject to change. The economic impact of these condo hotel units on existing hotel, motel, and short-term rental condo units in the North Lake Tahoe/Truckee area is evaluated in this study. Table 1-1 below summarizes the proposed residential development in the main village area. Note that the VSVSP Draft EIR, for purposes of the traffic analysis, assumes 819 condo hotel units and 31 fractional cabins, with no timeshare units. TABLE 1-1 VSVSP MAIN VILLAGE RESIDENTIAL DEVELOPMENT Residential Category Projected Units Projected Bedrooms Condo Hotel Timeshare Fractional Cabins 772 47 31 1,323 77 93 Total 850 1,493 Village at Squaw Valley Specific Plan Economic Impact & Urban Decay Analysis 6 April 15, 2015 Condo hotels are typically defined as a hotel with for-sale condominium units that are privately owned. When owners are not using the unit, they can leverage the marketing and management available through the hotel chain to rent and manage the condo unit as if it were a hotel room. These facilities often have a front desk, daily cleaning, and various on-site amenities and services. Hotel condo units may be “locked off,” which means that, for units consisting of two or more bedrooms, an owner may occupy one of the rooms while the other(s) are locked off and used by overnight guests similar to a hotel room. Fractional ownership can be applied to a wide range of different concepts, but it generally refers to buying a portion (e.g., one twelfth) of an otherwise whole ownership unit, with some programs applying a private residence club model involving a quality management, maximum flexibility of use related to floating times and floating units, and a high level of services and amenities. There is a wide range of timeshare ownership structures, generally categorized as “fixed time,” “floating time,” or “points systems,” and intervals can be either a deeded fee simple interest or a non-deeded interest (i.e., simply the right to use for a specified time). Timeshares are typically purchased in one-week intervals, often with a vast array of exchange opportunities, but are viewed less as real estate and more as a prepaid vacation, whereas fractional units tend to be seen as a replacement for a second home. The Project also includes housing to accommodate 252 beds for employees on the East Parcel. Most of these rooms will be in dormitory-style housing, with some studio units. While the employee housing population would be less transient, overall, than the Village housing population, the nature of the housing suggests demands for goods and services would follow what is typical for a transient population versus a permanent residential population, because the employment would be mostly seasonal. On-site amenities, such as the proposed convenience store on the East Parcel, are anticipated to serve the employee population by providing access to necessities and limiting the need to frequent off-site retailers. Table 1-2 below summarizes the proposed commercial development in the Project. The land use table from the VSVSP Draft EIR outlines multiple categories of planned commercial development totaling up to a maximum of 297,733 new square feet. However, most of this commercial space is not retail space. The maximum amount of new retail space proposed in the Project is 64,740 square feet; after deducting 7,523 square feet of existing retail space that is expected to be demolished, the maximum net new retail space available in the Project is 57,217 square feet. This net retail space is the focus of the economic impact analysis and is further divided into retail categories that include restaurant and drinking places, grocery or market space, and other limited retail stores. Finally, other limited retail involves small format retail such as clothing, local sporting goods, health and personal care, music, and gift stores; it excludes motor vehicle-related retail and large format, “big box” retail categories such as building materials, home furnishings, and general merchandise stores. Village at Squaw Valley Specific Plan Economic Impact & Urban Decay Analysis 7 April 15, 2015 TABLE 1-2 VSVSP NET RETAIL SQUARE FOOTAGE Commercial Category Maximum Square Feet Existing Retail Square Feet To Be Removed Net Retail Square Feet Retail Commercial Restaurant & Drinking Places Grocery/Market (East Parcel) Other Limited Retail 31,120 5,000 28,620 1,595 5,928 29,525 5,000 22,692 Total Retail 64,740 7,523 57,217 Other Commercial Mountain Adventure Camp Fractional Cabins Lodge Ski Services Meeting Space Hotel Common Area Transit Total Commercial Village at Squaw Valley Specific Plan Economic Impact & Urban Decay Analysis 90,000 2,500 75,000 12,000 49,493 4,000 297,733 8 April 15, 2015 Chapter 2 STUDY AREA In its September 2013 report, Dyett & Bhatia (D&B) provides some historical context for development in the North Lake Tahoe area. “The 1960 Winter Olympic Games held in Squaw Valley catapulted Lake Tahoe into the national spotlight, and the Region has been a mecca for winter sports ever since. The 1960 Winter Olympic Games spawned significant uncontrolled expansion of development in north Lake Tahoe. Many of the present-day resorts, hotels, restaurants, and ski lifts located in the Plan Area were built to accommodate the influx of Olympians and fans. Since the Olympic Games in 1960, the population of the entire Tahoe Region has increased over five times, with the most rapid expansion (by more than 70 percent) occurring in the 1970s, as development proceeded virtually unchecked.”1 The Tahoe Regional Planning Agency (TRPA) “adopted its first Regional Plan in 1987 establishing the existing regulations and growth controls seen in the Tahoe Basin today. The 1987 Regional Plan established allocations for various types of development (residential, tourist accommodation, commercial, and recreation). Allocations were used as a growth management tool to ensure that development was consistent with progress toward meeting environmental thresholds.”1 Most of the development in the Tahoe Basin (i.e., TRPA jurisdictional boundaries, which generally extend two to four miles around the lake shore) occurred prior to adoption of the 1987 Regional Plan. “Since 1987 new development has been limited to about 14 percent of total housings units, 6 percent of total commercial floor area, and 0.5 percent of total tourist accommodation units.”1 The vast majority of recent development in the North Lake Tahoe/Truckee area, albeit restrained, has occurred outside TRPA boundaries, particularly in the resort areas. The Town of Truckee is the major center of population and tourism activity in the high-country Nevada County area, and is the largest full-time population and retail trade center in the study area. The North Lake Tahoe/Truckee study area is depicted on the map in Figure 2-1 following this chapter. It comprises one trade area that functions as somewhat of a self-contained, cohesive retail and lodging area, although, of course, there are potential interactions with the South Lake Tahoe area, the Nevada side of the Tahoe Basin (including Crystal Bay and Incline Village), and the Reno/Sparks and Carson City markets. In general, though, this trade area differentiates itself based on major access routes (I-80 vs Hwy 50), northern vs southern sections of Lake Tahoe, political divisions (California vs Nevada), and natural barriers such as the lake and mountain ranges. Furthermore, the capture or leakage of demand from/to areas outside the study area is likely to be at least somewhat offset by the capture or leakage of demand from/to inside the study area. Finally, the specialty, convenience, and local type of retail (i.e., restaurant, grocery/market, and other limited retail) being assessed implies a smaller, rather than larger, retail trade area. Village at Squaw Valley Specific Plan Economic Impact & Urban Decay Analysis 9 April 15, 2015 Major centers of activity are dispersed through the North Lake Tahoe/Truckee study area. The Tahoe Basin areas along the lake compete with Squaw Valley and Alpine Meadows, Martis Valley, Northstar, Truckee, and other mountain communities. As Economic & Planning Systems (EPS) notes in its July 2013 report, they are all “places to visit, work, recreate, shop, and live.”6 The EIA divides the study area into five retail and lodging clusters for purposes of analysis, as follows: Squaw/Alpine West Shore North Shore Northstar Area Truckee Area These clusters are identified on the map in Figure 2-2 (following Figure 2-1), together with the average distance (weighted by retail sales volume for each community within a cluster for the North Shore and West Shore) from the Project. The North Shore includes the communities of Dollar Point, Carnelian Bay, Tahoe Vista, and Kings Beach; the West Shore includes the communities of Tahoe City, Sunnyside, Homewood, and Tahoma; and the Truckee Area includes the Town of Truckee and surrounding areas such as Martis Camp and Lahontan. Northstar at Tahoe has been extracted from the Truckee zip code area and is tracked separately as part of the Northstar Area, which includes the Martis Valley West Parcel potential future development. The five clusters have been developed to reflect logical trade subareas based on a number of factors. First, they represent the most granular level for which data may be aggregated without violating confidentiality provisions or guidelines. Second, they follow major transportation corridors along SR 89, SR 28, and SR 267. Third, they comprise areas that are either inside or outside of the Tahoe Basin, which, if inside, means close proximity to the lake but under TRPA’s regulatory jurisdiction. Finally, they reflect certain demographic and competitive attributes that can serve to distinguish the areas. Village at Squaw Valley Specific Plan Economic Impact & Urban Decay Analysis 10 April 15, 2015 Figure 2-1 Village at Squaw Valley Specific Plan EIA Study Area Study Area Nevada County Placer County Placer County El Dorado County Figure 2-2 Village at Squaw Valley Specific Plan EIA Retail/Lodging ClustersTruckee Legend Distance from Squaw/Alpine: North Shore - 15.7 miles West Shore - 9.5 miles Northstar - 19.0 miles Truckee Area - 12.0 miles Chapter 3 OVERVIEW OF TOURISM AND REAL ESTATE MARKETS TOURISM AND LODGING MARKET The North Lake Tahoe/Truckee area has become a nationally and internationally recognized travel destination. Dean Runyan Associates (Runyan), in its March 2009 study, describes the region as an “iconic alpine lake recreation area” providing a “comprehensive array of outdoor recreation opportunities in a stunning alpine environment. No other location in the far western United States offers the combination of alpine lake setting, visitor amenities, and access.” The study goes on to say that there “is very little that can be added to the scope of offerings available in High Country-North Lake Tahoe; it is simply a world-famous destination.”2 The North Lake Tahoe/Truckee area boasts the highest concentration of ski resorts in North America, but a more complete list of activities that travelers can experience includes the following: Outdoor recreation, with a full range of both winter and summer outdoor sports, such as skiing, snowboarding, cross-country, snowshoeing, snowmobiling, hiking, road cycling, mountain biking, golfing, camping, water skiing and wakeboarding, other boating activities, beach volleyball, camping, fishing, rock climbing, zip lines, and gravitypowered roller coasters. Almost every activity has as its backdrop the deep blue waters of Lake Tahoe or the pristine mountain landscape. Touring and leisure recreation, such as shopping, dining, strolling pedestrian villages, and casino gaming on the Nevada side of the lake. Agri-tourism, including seasonal farmers markets. Heritage experiences, such as small museums and historic sites. Arts, which involve galleries and festivals within the thriving arts community, performance and theater arts venues, and music and concerts in community parks and hotel locations.2 The North Lake Tahoe Resort Association (NLTRA), as well as other tourism and travel marketing organizations, is working to heighten the area’s recognition across the country and across the world. In its March 2009 study, Runyan also emphasizes how critical and effective the work of NLTRA is to the tourism success of the region, regards NLTRA as a model and unsurpassed tourism development entity in the western United States, and encourages continued investment in, and support for, the organization.2 One drawback or complaint about the North Lake Tahoe/Truckee area is that it can become over-crowded during the peak winter and summer seasons, which can be challenging for visitors and local businesses alike, particularly smaller operations. NLTRA is also promoting shoulder season (i.e., off-peak spring and fall periods) events and activities in an attempt to shift a portion Village at Squaw Valley Specific Plan Economic Impact & Urban Decay Analysis 13 April 15, 2015 of the peak business to other less busy times of the year, which could lead to both higher revenue for businesses and lower impacts on the environment.2 EPS, in its November 2014 report, notes that special events and activities can lead to significant visitor populations in the North Lake Tahoe/Truckee area. Popular events such as the Ironman Triathlon, Tough Mudder, cycling’s Amgen Tour of California, Wanderlust Yoga Festival in Squaw Valley, and the Northstar Beer & Bluegrass Festival have helped to fill hotel rooms and spur visitor spending during the shoulder months. EPS further notes that the “athletic events have been especially beneficial to the local area because they fit well within the local culture, are popular with visitors and locals alike, and tend to foster “multiple” visits from competitors as they seek to conduct their training in the high-altitude environment the region offers.”3 Another potential concern is that the travel industry in general can be notoriously volatile due to a vast array of local, national, and international competition, economic conditions, and weather patterns. EPS points out in its December 2013 study that climate change, for example, may be an emerging threat to the ski resort industry, which nationwide has lost more than one billion dollars in revenue due to reduced snowfall and shorter winters, according to a study commissioned by the Natural Resources Defense Fund and Protect Our Winters. Still, according to the National Ski Area Association, skier visits around the country increased 11% during the 2012-13 ski season over the previous season and represented the second highest season on record for skier visits. The ski industry has been growing steadily for 30 years. Also, because the North Lake Tahoe/Truckee area is such a viable and well-regarded tourism destination with topnotch scenic, recreational, and cultural amenities, is situated in close proximity to major metropolitan areas, is promoting its appeal to national and international audiences, and is providing an expanded and creative offering of new events and activities, EPS suggests that “the prospects are strong for steady growth in ski resort-related activity.”4 Various market demand studies and customer profiles for fractional ownership, timeshare, and other resort products indicate that the North Lake Tahoe/Truckee area is primarily a drive-to destination pulling tourist traffic from a number of in-state metropolitan areas. The most prevalent feeder markets have traditionally included the major population centers, or metropolitan areas, of Sacramento, San Francisco, San Jose, and Southern California. All of these areas are within less than a day’s drive to North Lake Tahoe and have historically been top producers for visitor origination, especially during the winter ski season. Secondary markets include Phoenix and Las Vegas, given their proximity and typically hot summer weather; North Lake Tahoe provides weather-based demand from visitors seeking a cooler climate during the summer. These studies and profiles also indicate that approximately two-thirds of North Lake Tahoe resort customers have a household income greater than $100,000. These visitors are likely to stay overnight, as visitor profiles suggest that 65% of visitors spend at least one night, 15% stay only for the day, and the other 20% are local area residents. Confirming this visitor research, EPS notes in its November 2014 report that most visitors to the North Lake Tahoe/Truckee area originate from the regional drive-up markets of the San Francisco Bay Area and Sacramento/Central Valley. Southern California is also a Village at Squaw Valley Specific Plan Economic Impact & Urban Decay Analysis 14 April 15, 2015 sizable and growing market segment. The North Lake Tahoe Visitor Survey, administered during the summer of 2012 by RRC Associates, indicated that 21% of visitors came from the San Francisco-Oakland/San Jose metropolitan area, 12% traveled from international locations, 10% originated from the Los Angeles area, and 8% came from the Sacramento/Central Valley area. 3 Visitors from other parts of California and from other states comprise the remaining 49%. The VSVSP Draft EIR compiles the results of four different in-person and web-based surveys of Squaw Valley guests conducted at various times during 2011. These results are generally consistent with the data from other surveys and research described above. Winter and summer overnight guests came from the same points of origin as noted above. Overnight guest lodging pattern data for various peak, non-holiday, five-day periods from 2010 through 2012 is also analyzed in the VSVSP Draft EIR. The average length of stay is fairly consistently in the two- to three-day range. Also of note, 43% of winter guests and 78% of summer guests took from one to six trips outside Squaw Valley during their stay, and a significant percentage of visitors engaged in dining, drinking, and shopping activities. According to the VSVSP Draft EIR, a variety of transit service options are available to the Project to further facilitate these outside trips, including the following: Tahoe Area Regional Transit (TART), which connects Squaw Valley with Truckee and Tahoe City. The SR 89 route operates year-round on a daily basis from approximately 6am to 6pm. TART also provides other transit services, including the TART Mainline, which operates along SR 28 and SR 89 between Incline Village and Tahoma. This route offers connections with the SR 89 route at the Tahoe City Transit Center. Night Rider, which provides evening service connecting Squaw Valley with North Shore and West Shore locations in both summer and winter. In addition, the Project would implement a Transportation Management Plan (TMP), which, among other things, would consist of the following elements: On-going traffic management along Squaw Valley Road Preferred parking for carpoolers Centrally located transit center and transit services Real-time traffic communication systems In its November 2013 report, Runyan states that tourism is the primary economic driver of the North Lake Tahoe/Truckee area. According to Runyan, visitors traveling just for the day (not staying overnight) constitute approximately 42% of the trips to the North Lake Tahoe/Truckee area. However, Runyan also reports that these day travelers produce only 14% of the visitor spending in the study area; the remaining 86% of the visitor spending is generated by overnight travelers who stay at a variety of lodging types.5 Based on average daily spending derived from visitor survey data provided by RRC Associates and adjusted for annual price changes, Runyan’s Regional Travel Impact Model estimate for total visitor spending, and further analysis conducted by Runyan, it is estimated that Village at Squaw Valley Specific Plan Economic Impact & Urban Decay Analysis 15 April 15, 2015 approximately 2,707,000 overnight visitor-days generated $432 million in overnight visitor spending in 2012, or an average of $160 per person. Day travelers who did not spend any nights during their visit to the North Lake Tahoe area added roughly 436,000 visitor-days in 2012 and spent $126 per person for another $55 million in total visitor spending. Overnight and daytime visitor-days combined amounted to 3,143,000 in 2012, and produced $487 million in total spending for an average of $155 per visitor-day. Runyan also tracked overnight visitor-day accommodations by type of accommodation, and noted that, for the short-term rental units from which a transient occupancy tax is collected, “occupancy rates of roughly 60 and 45 percent are reasonable for commercial lodging establishments and rented condominiums in North Lake Tahoe.”5 It is impossible to precisely ascribe overnight visitor-days between each retail/lodging cluster, but since transient occupancy tax (TOT) rates are the same throughout the North Lake Tahoe/Truckee area (i.e., 10%), the TOT revenue adjusted for average daily room rates can provide a reasonable estimate of the visitation relationships between clusters. For instance, since the North Shore’s average daily room rate (ADR) is low relative to the other areas, its 16% share of TOT nearly doubles to a 30% share of visitor-days. FIGURE 3-1 ALLOCATION OF VISITOR DAYS BY RETAIL CLUSTER TOT Revenues by Retail Cluster Allocation of Visitor Days by Retail Cluster Total visitor spending was also broken down by Runyan into four major categories, including lodging, recreation, food and beverage, and other retail. Other retail includes groceries, Village at Squaw Valley Specific Plan Economic Impact & Urban Decay Analysis 16 April 15, 2015 miscellaneous goods and services, gasoline, and other retail purchases. The data presented by Runyan is shown in Table 3-1 below.5 TABLE 3-1 VISITOR SPENDING IN 2012 Visitor Spending Category Amount Percent of Total Lodging $113 million 23% Recreation $167 million 34% Food & Beverage $118 million 24% $89 million 19% $487 million 100% Other Retail Total The EPS November 2014 report shows the performance of visitor spending in the North Lake Tahoe/Truckee area over the past 10 years, which reveals steady growth at an average annual rate of 4%. The report maintains that such “constant growth is quite remarkable, considering major declines in spending and economic activity associated with the Great Recession in 2007, and points to the North Lake Tahoe area’s popularity, strength, and resiliency as a visitor destination.”3 In its earlier December 2013 study, EPS concludes that visitor-day counts in the North Lake Tahoe/Truckee area are “very strong” and, specifically, that: Visitation in the North Lake Tahoe area is expected to grow at an average annual rate of approximately 3% to 5%. Future increases in visitor spending will likely be similar to previous rates of 3% to 5% per year. As the North Lake Tahoe/Truckee area evolves, its ability to compete for future visitation should improve even beyond where it is now. This evolution could facilitate a short-term “spike” in visitation growth ranging from 5% to 7% per year.4 Runyan categorizes and quantifies traveler accommodations according to the following four types: Hotel/Motel/B&B – approximately 2,000 rooms or units exist within hotels, motels, and bed & breakfast accommodations in the North Lake Tahoe/Truckee area. Transient occupancy tax is collected on the rental of these units. Rented Condo/Home – it is estimated that 1,540 condominiums and related properties are available for rent in the North Lake Tahoe/Truckee area. Transient occupancy tax is also collected from these units for rental periods of less than 30 days. Village at Squaw Valley Specific Plan Economic Impact & Urban Decay Analysis 17 April 15, 2015 Private/Vacation Home – owner-occupied homes not available for short-term rental amount to approximately 14,560. These units are not subject to a transient occupancy tax levy. Campgrounds – there are approximately 500 campground sites available; these campsites are not subject to the transient occupancy tax.5 In its November 2014 report, EPS confirms that there are approximately 2,000 hotel rooms in the North Lake Tahoe/Truckee area. The updated list presented in Table B-1 generally confirms that room inventory. There are approximately 461 hotel rooms in the North Shore, 324 in the West Shore, 727 in Squaw/Alpine, 170 in the Northstar Area, and 478 in the Truckee Area, for a total of 2,160 rooms. The hotels containing these rooms span the full range of price and quality, from generally lower-priced and lower-quality budget hotels with a small roadside motel format in North Shore and West Shore (excluding Granlibakken Resort) to higher-priced and higherquality luxury hotels geared for well-heeled travelers in Squaw Valley and Northstar. Although some hotels in the North Shore and West Shore have been updated, many have not been renovated since their original construction in the 1950s through 1970s (or earlier), and some of the renovations are now decades old; EPS characterized the lodging market in these two areas as “abysmal.”6 Recent photos of a sample of lodging and retail properties in each of the five clusters are presented in Appendix C. According to EPS, a large portion “of the existing hotel stock has become outdated, especially in the Tahoe Basin. There has not been a new hotel developed in the Tahoe Basin since the 1960s. Truckee and the Martis Valley area have experienced an additional 321 hotel rooms within the past decade, and the Olympic Village has not had a new hotel developed since the 178 room Village at Squaw Valley resort was completed in 2002. The commercial lodging properties account for less than 25 percent of visitor trips, reflecting the relatively large supply of rental condominium properties and vacation homes in the rental pool in the area. The existing inventory of lodging properties includes a number of older, outdated properties in need of renovation or replacement to better match the preferences of the destination visitor. Increasing and upgrading commercial lodging, particularly adding full service branded “upscale class” lodging, will be an important component of attracting national and international destination visitors”3 to the Tahoe Basin. In its earlier July 2013 report, EPS states that people visit different parts of the North Shore and West Shore “for an array of reasons, such as lodging, shopping, to attend festivals, farmers’ markets, or other events, or (perhaps most significantly) to access or be near the lake itself. Although Tahoe City, Kings Beach, and the other nearby communities have unique and compelling attributes, various opportunities exist to enhance the visitor experience and to increase the annual visitation and visitor spending captured”6 there. However, these areas “are faced with very powerful competition from nearby areas, such as the walkable village environment with a host of dining, shopping, and recreational amenities at Squaw Valley and Northstar, and the friendly, vibrant, walkable appeal of downtown Truckee.”6 The North Shore and West Shore communities “generally lack a diverse roster of accommodations, a condition that has been well documented. Beyond this, the communities lack the compelling packages of Village at Squaw Valley Specific Plan Economic Impact & Urban Decay Analysis 18 April 15, 2015 retail, services, and recreational amenities that make Northstar, Squaw Valley, and Truckee successful.”6 The aging tourist accommodation property in North Shore and West Shore “consists of hotels, motels, and resorts/timeshares. The majority of tourist accommodation land is located in Tahoe Vista, followed by Kings Beach and Tahoe City. In Tahoe Vista and Kings Beach tourist accommodations are located along SR 28 and consist of one- and two-story motel type buildings. In Tahoe City tourist accommodations are located along SR 28, clustered near the “Wye” and Granlibakken Resort.”1 “Besides the very few upgraded properties, the majority of hotels/motels located around the North Shore of Lake Tahoe was built between the 1950s and the 1970s and are small by today’s hotel standards. With new regulations introduced with the creation of the TRPA, there historically has been less motivation to invest in upgrades of the properties, and while the property owners are enjoying greater property values as the price of land has increased, the profitability of the operation of the hotels/motels has become marginal. Clearly, increased supply of good quality accommodations is an essential component to inject activity on the shore communities.”6 The North Shore and West Shore areas, together, “exist among a very competitive environment for accommodations, as new and compelling products have been constructed in the nearby resort areas of Squaw Valley and Northstar. These resorts have been very successful in creating “village” atmospheres in which visitors can come to experience the high-quality recreational amenities while offering a variety of high-quality dining, shopping, and lodging opportunities in close proximity. The Ritz-Carlton Hotel at Northstar is the preeminent lodging property in the Lake Tahoe Region, offers the only AAA Five Diamond mountain resort in California, and is located among some of the best shopping and dining options in the entire Lake Tahoe Region. Other compelling hotel options such as the Plumpjack Inn at Squaw Valley offer unique, high-end accommodations located adjacent to primary tourism amenities. The town of Truckee presents further competition for lodging and is a compelling draw for visitors who are drawn to its compact, walkable, and vibrant downtown environment, as well as its host of recreational and cultural options nearby. The award-winning Cedar Sport Hotel in Truckee has been cited as an example of a small-scale boutique hotel that caters to the “adventure traveler.” This hotel has been very successful and is forging a new niche among mountain travelers to the Sierra Nevada mountain region. These lodging properties in Northstar, Squaw Valley, and Truckee have been more apt to upgrade or develop new products because they do not have to contend with the additional regulatory layers and other constraints imposed on properties in the basin.”6 However, the area comprising the North Shore and West Shore “offers several amenities these competing resort areas do not, most important of which is access to the lake shore itself. Other studies have estimated the “premium” that adjacency to Lake Tahoe offers can be three- to four-times the value of properties not located on the lake. [South Shore Vision Destination Economic Impact Analysis prepared by Strategic Marketing Group, 2012] However, it is apparent from the lack of investment in existing hotel properties that this premium is not being captured. Village at Squaw Valley Specific Plan Economic Impact & Urban Decay Analysis 19 April 15, 2015 As demonstrated above, most hotel product within the … area is aged and of marginal quality, and while some of these lodging properties are viable and maintain passable occupancy rates, most are mired in a gradual decline toward obsolescence. Meanwhile, the nearby competitors for these properties in areas like Squaw Valley, Northstar, and Truckee have been aggressive in rebuilding and revamping their hotel offerings and adding new hotels with the most contemporary amenities in an all-inclusive resort environment. The [area] does offer many excellent amenities of its own, including an authentic mountain community atmosphere and access to the lake shore itself. However, in order to truly capitalize on these assets, hotel property owners will need to reinvest in their properties (often at substantial expense) in order to bring them up to the standards of today’s hotel traveler. Regional amenities such as shopping/dining options within walking distance and a highly functional transit program will also be critical to their success. Beyond the existing hotel properties, demand is likely to exist for new hotel products located in key premium locations …. The addition of a large-scale flagged hotel would be a major benefit and could be feasible with appropriate public participation. However, a variety of boutique products are potentially feasible, with a minimum size in the range of 75 to 100 rooms, and may be easier to implement given omnipresent concerns regarding massing, visibility, etc. Tahoe City, Kings Beach, and the surrounding areas are well positioned for smaller scale boutique hotels along the lake shore. Indeed, some investment in this arena already is occurring and the fact that existing properties already possess the required development commodities (TAUs) can help defray their cost to develop. Overall, every effort should be made to improve this sector and bring some highly sought-after accommodations to market, as it produces multiple public benefits including TOT, sales tax, and ability to integrate other commercial space (retail and office) as part of a diversification strategy for investors.”6 In fact, according to a Sacramento Business Journal article entitled, “Potential Hotel Development Swap Causing Ire Around Lake Tahoe,” dated December 11, 2014, Placer County is considering the purchase of two hotel properties from private owners in the City of South Lake Tahoe; one property is a 34-room hotel and the other is a 59-room hotel. On February 24, 2015, Placer County approved the acquisition of the 34-room Lake Tahoe Inn. TRPA controls the number of hotel rooms in the Tahoe basin, which has been capped since 1987. TRPA encourages the removal of existing blighted hotel stock, offering two bonus units to public agencies for each unit removed from fragile stream zones and placed instead into town center areas around the lake. Although Placer County has approved the acquisition of the 34-room Lake Tahoe Inn only, the analysis conservatively assumes that Placer County could ultimately purchase and demolish the equivalent of two hotels comprising 93 rooms, located in the Bijou Creek watershed near Zephyr Cove; the properties are assumed to be placed into a restoration conservancy. Placer County would then be authorized to approve development of 279 hotel rooms in town centers such as Tahoe City and Kings Beach. The latest update to the TRPA Regional Plan, adopted by the TRPA Governing Board on December 12, 2012, notes that, at the time of adoption, 342 tourist bonus units were available for allocation. Village at Squaw Valley Specific Plan Economic Impact & Urban Decay Analysis 20 April 15, 2015 RESIDENTIAL MARKET The residential real estate market in the North Lake Tahoe/Truckee area can be bifurcated into two distinct types of uses. As described by EPS in its July 2013 report, there “are local, fulltime residents who occupy residential buildings, work at local businesses (including those at office industrial properties, retail stores, and lodging accommodations), and patronize businesses located across all building classifications. Second are visitors to the area who use residential real estate on a part-time basis, occupy lodging properties, and exert their spending power at businesses located at local, commercial properties (primarily retail) and in other nearby areas. The North Lake Tahoe area (and the Tahoe Region in general) is characterized by a high degree of absentee owners who hold real estate assets but do not use them on a full-time basis.”6 Some of these units are rented to local residents on a full-time basis, while others are used only sporadically and sit vacant for a substantial portion of the year. Figure 3-2 below illustrates the absentee ownership rates for most of the communities in the North Lake Tahoe/Truckee area, as well as the average for the entire area combined. Even accounting for the lower rates in the table, “these rates are still extremely high compared to what would be found in a “typical” residential area. Of note, local business owners repeatedly cite the importance of this market segment, as these residents are typically well-heeled and provide substantial support for local restaurants and high-end boutiques.”6 FIGURE 3-2 ABSENTEE OWNERSHIP RATES IN 2012 100% 88% 90% 79% 80% 86% 70% 60% 50% 82% 83% 64% 60% 52% 50% 40% 30% 20% 10% 0% Carnelian Homewood Bay Kings Beach Olympic Valley Percent Absentee Village at Squaw Valley Specific Plan Economic Impact & Urban Decay Analysis Tahoe City Tahoe Vista Tahoma Truckee Weighted Average 21 April 15, 2015 Kings Beach, located around the intersection of SR 267 and SR 28, and Tahoe City, located around the intersection of SR 89 and SR 28, account for more than 60% of the permanent resident population located within the North Shore and West Shore areas combined. The permanent resident population in these areas has declined over the last decade, while the demand for second homes has intensified. Resident population levels in the entire study area declined by 17% overall between 2000 and 2010, but “have been stable in more recent years and growth restrictions in the Tahoe Basin will prevent substantial increases. However, in portions of the study area beyond the Basin, there remains substantial residential development capacity.”3 “The Town of Truckee does have some proposed tourism amenities that are likely to enhance the town’s visitor appeal … [and] to strengthen the already very popular downtown area, which is slowly and organically filling the “gaps” in the marketplace that may exist and is consistently strengthening its tourism offerings. In addition, there are several development projects that will serve to further strengthen its tourism potential. One prominent proposed development project is known as the Truckee Railyard Master Plan, which, once constructed, is likely to significantly impact the livability and visitor appeal of the town. The Railyard project proposes to add various classes of residential development, office space, retail, a large cinema complex, lodging, and other uses. Although the Railyard Master Plan was approved in 2009, additional entitlements are necessary for construction to commence.”3 With respect to the Tahoe Basin, “residential unit allocations for communities located in the Tahoe Region are outlined in Chapter 50 of the TRPA Code of Ordinances. For 2013, TRPA released up to 130 residential allocations to local governments. After applying Placer County’s percent allocation of 22.45 percent, Placer County’s maximum allocation for 2013 is 29 units. Assuming this allocation remains constant over the next 20 years, Placer County could expect to see a maximum of 580 new units by December 2032. This represents the total estimated amount of residential development that the Plan Area could see over the next 20 years.”1 Projecting to 2040 at the same rate allow for another approximately 250 total units in the North Shore and West Shore areas combined. COMMERCIAL RETAIL MARKET EPS comments in its July 2013 report that commercial real estate submarkets located in the North Lake Tahoe/Truckee area are “unique because they cater to a much more transient population than is typical in a non-tourism area. Traditionally, retail centers serve the surrounding area and are categorized into super-regional, regional, community, and neighborhood centers according to the size of the store, the products they offer, and the size of the geographic radius they serve. However, retail in the Tahoe Basin is much more heavily geared to tourist patrons and does not fit standard classifications or rules of thumb.”6 Recent photos of several lodging and retail properties in each of the five clusters are presented in Appendix C. Almost one half of the commercial land in the North and West Shore areas is located in Tahoe City, with Tahoe Vista and Kings Beach also having large amounts of commercial land. Village at Squaw Valley Specific Plan Economic Impact & Urban Decay Analysis 22 April 15, 2015 “Commercial land uses are generally located adjacent to the SR 28 and SR 89 corridors and consist of office, retail, church, and service commercial uses. Within Tahoe City the majority of commercial land is located near the “Wye” intersection, generally to the west of SR 28 and SR 89. However a few large commercial parcels are located along the shoreline of Lake Tahoe. The majority of retail development in Tahoe City is clustered in “mini-centers” east of SR 28 adjacent to Lake Tahoe. Smaller pockets of commercial land are also located in Dollar Point, Carnelian Bay and Homewood.”1 The North Shore and West Shore areas are “characterized by a large amount of small “strip” retail buildings in the range of 5,000 to 10,000 square feet. Although these types of smaller retail buildings comprise the majority of the retail space … there are three “traditional” grocery-anchored shopping centers, two of which are located in Tahoe City and one in Kings Beach. The quantity of neighborhood shopping centers exceeds what would be found in a typical residential area, supported by spending from outside residents.”6 An analysis of retail spending conducted in earlier studies indicated that the amount of retail in the North Shore and West Shore is approximately adequate to service demand in those areas. “Although the amount of retail appears to be sufficient to serve the [area], the character of much of the retail stock is substandard and does not capture a large portion of resident spending…. The ability to stem this leakage completely is limited, since large-scale big-box retailers are not a preferred building typology for the Basin. However, the notion of an expanded drug/convenience store, expanded grocery prototypes, or other types of small-format retail centers that include a broader range of products may help to provide expanded options for basic goods that are desired by local residents.”6 Currently, the entire North Lake Shore/Truckee area is maintaining a fairly healthy market for leasable retail space, with relatively few vacancies and slightly increasing asking rents. Based on research with local commercial brokers and available listing channels such as LoopNet, the vacancy rate appears to fall within a range of 5% to 10%. In Truckee, for example, reports indicated that the vacancy rate was 11% in 2010, but expectations were that it would fall to approximately 5% by 2014, and that appears to be exactly what happened. Also, the average lease rate in the Tahoe Basin area hovers right around $2.00 per square foot per month, and in the Truckee area is approximately 10% higher than that at roughly $2.20. Village at Squaw Valley Specific Plan Economic Impact & Urban Decay Analysis 23 April 15, 2015 Chapter 4 APPLICABLE RETAIL ANALYSIS RETAIL SALES LEAKAGE AND CAPTURE In order to understand the trade area in which the Project will operate, it is important to first look at the major components of the relevant retail clusters. As described above, five retail clusters are defined for purposes of this analysis, which include the North Shore, West Shore, Alpine/Squaw, Northstar Area, and Truckee Area retail clusters. The supply and demand dynamics occurring in the North Lake Tahoe/Truckee trade area, as well as in each of the retail clusters, reveal information about the flow of retail dollars. The analysis evaluates only three Applicable Retail categories. Applicable Retail refers to only land uses proposed in the Project, which, as described above, include the following: 1. Grocery/Market: Includes grocery stores and convenience markets. 2. Limited Retail Group: Includes clothing and clothing accessories stores as well as the California State Board of Equalization (SBOE) Other Retail group, which comprises categories such as sporting goods, health and personal care, music, and gift stores. 3. Restaurant & Drinking Places: Includes restaurants, bars, and cafes. Major Assumptions and Sources Many sources of data and projections were utilized to develop assumptions and to calculate potential impacts. Major assumptions and their sources include the following: Planned residential and non-residential developments within each retail cluster are based on a list of development projects from VSVSP Draft EIR and information subsequently extrapolated from applicable planning documents for each development project (e.g., EIRs, planning studies, master plans), as well as key source materials described above. Current data regarding the number of households and number of visitor days in each retail cluster are based on data provided by Claritas, the Census Bureau, Placer County, and reports prepared by EPS and Runyan. The projected number of households and number of visitor days in each retail cluster are based on data provided by Claritas, the Census Bureau, Placer County, and reports prepared by EPS and Runyan. Current and projected household income estimates for each retail cluster are averages based on data provided by Claritas, the Census Bureau, Placer County, and reports prepared by EPS and Runyan. These income estimates are presented in 2014 dollars. Village at Squaw Valley Specific Plan Economic Impact & Urban Decay Analysis 24 April 15, 2015 Current and projected average daily visitor spending estimates are based on data from Runyan’s November 2013 study. Annual expenditures per household are based on the percentage of household income spent on retail goods and services pursuant to the U.S. Department of Labor Consumer Expenditure Survey and the Claritas Consumer Spending Patterns Report for each retail cluster. The percentage of household income spent on certain goods was adjusted to reflect the fact that: (i) consumers purchase goods in various retail categories from merchants other than those in the three Applicable Retail categories discussed above; and (ii) consumers purchase goods outside of the five retail clusters included in this analysis. Current retail sales data for each retail cluster within Placer County are estimated based on sales tax data provided by Placer County, while current retail sales data for the Truckee Area retail cluster are estimated based on taxable sales data provided by SBOE. Annual retail sales per square foot estimates for the Applicable Retail categories described above are provided by the Urban Land Institute (ULI). Retail Cluster Analysis By defining retail clusters within the larger trade area, an analysis of the supply and demand dynamics within each retail cluster, as well as the North Lake Tahoe/Truckee trade area, can be conducted. Each cluster generally provides a variety of retail offerings similar to those included in the Project. A map of each retail cluster is shown in Figure 2-2 at the end of Chapter 2. As mentioned above, transportation corridors play an important determinant in drawing a retail cluster. Each retail cluster is connected through Interstate 80, SR 89, SR 28, and/or SR 267. The North Shore cluster is approximately 14 miles southeast of the Project and can be accessed via SR 89 and SR 28. The West Shore cluster is approximately 12 miles southwest of the Project and is reachable via SR 89. The Northstar Area cluster is approximately 19 miles northeast of the Project and can be accessed via SR 89, SR 28, and SR 267, or SR 89, Interstate 80, and SR 267. Finally, the Truckee Area cluster is approximately 12 miles north of the Project and is reachable via SR 89. Demand-Side Analysis The VSVSP Draft EIR compiles a list of future projects that are likely to occur within the projected 25-year buildout horizon of the Project. These projects are located within the North Lake Tahoe/Truckee area and have the potential to interact with the proposed Project, and they fall within one or more of the following four categories: Partially occupied or under construction Received final discretionary approvals Applications have been accepted as complete by local agencies and are currently undergoing environmental review Village at Squaw Valley Specific Plan Economic Impact & Urban Decay Analysis 25 April 15, 2015 Considered likely to be developed, based on historic development patterns (including the rate of development) The Cumulative Project List, as it is referred to in the VSVSP Draft EIR, includes proposed development projects or development areas, but also includes plans and programs to improve ski lifts and various mountain recreation facilities, develop energy production, facilitate habitat preservation, construct or repair transportation improvements, and establish a cross-lake ferry. Only the residential, commercial, and lodging development projects/areas from that list are incorporated into the EIA. Table A-1 in Appendix A presents the revised list, which organizes future development projects by retail cluster. Each project on the list has a corresponding map number, and the location map from the VSVSP Draft EIR showing each project is included on the page following Table A-1. Numerous planning and environmental documents were also reviewed to obtain detailed development projections, including anticipated residential, hotel, and Applicable Retail growth within the five retail clusters. Table A-2 summarizes the projected residential development estimates from Table A-1 and includes additional development anticipated in the North Lake Tahoe/Truckee area based on information from key source materials and the planning and environmental documents that were reviewed. Table A-2 also estimates the number of occupied households by applying existing absentee ownership rates to the number of anticipated housing units. The data suggest that the North Lake Tahoe/Truckee area can expect approximately 10,279 additional housing units through 2040, which will produce approximately 3,896 occupied households. Although the proposed project is anticipated to include up to 900 housing units, it is not expected to generate any occupied households due to the specific type of units proposed (i.e., hotel condo, time share, fractional, and seasonal employee housing). Table A-3 presents current households for each retail cluster as well as cumulative households at buildout of the proposed Project and at buildout of all planned development projects. The number of current households, which totals approximately 13,272, is estimated based on an average of household estimates from Claritas and household estimates from the Census Bureau. In addition to current estimates, two buildout scenarios are evaluated in this analysis. Scenario 1 assumes only the Project is developed (i.e., no other projects are added to current conditions), while Scenario 2 assumes all planned projects, including the proposed Project, are developed and added to current conditions. As discussed above, the Project is not anticipated to produce any occupied households; therefore, the number of households at buildout under Scenario 1 is equal to the number of current households. Scenario 2 is anticipated to produce approximately 3,896 new households, which results in approximately 17,168 households at buildout. Table A-3 also summarizes existing and buildout estimates regarding the number of daily visitors to the North Lake Tahoe/Truckee area. Data provided by Runyan suggest the North Lake Tahoe/Truckee area attracted approximately 3.4 million visitors days in 2014. Current daily visitors are allocated to each retail cluster based on transient occupancy tax collections that have been adjusted for the average daily room rate in each retail cluster, as outlined above. The number of daily visitors to the North Lake Tahoe area is assumed to increase 4% per year, which Village at Squaw Valley Specific Plan Economic Impact & Urban Decay Analysis 26 April 15, 2015 results in approximately 0.8 million new visitor days under Scenario 1 for a total of nearly 4.2 million visitor days. Scenario 2 generates approximately 6.0 million new visitor days, or a total of approximately 9.4 million visitor days at buildout. Future visitor days to the Squaw/Alpine retail cluster are allocated between visitors to the Project area and those to the balance of the Squaw/Alpine cluster based on the anticipated number of lodging rooms. The Project includes approximately 1,323 lodging rooms and the remainder of the Squaw/Alpine cluster includes 620 lodging rooms for a total of 1,946 rooms. As a result, the Project is ascribed approximately 68%, or 0.8 million new visitor days, of the total 1.1 million new visitor days anticipated within the Squaw/Alpine cluster. Table A-4 shows current average household income and visitor spending for each retail cluster and the estimated average household income and visitor spending at buildout. Real income growth is estimated to increase 1.6% per year based on historical wage and Consumer Price Index (CPI) data for the San Francisco Consolidated Metropolitan Statistical Area (CMSA). Average daily spending is conservatively assumed to remain constant for purposes of this analysis. Table A-5 then multiplies the values from the previous two tables together with the appropriate capture rate and percentage of income and visitor spending expended on each Applicable Retail category (i.e., grocery/market, limited retail group, and restaurant & drinking places) to determine the amount of income and visitor spending captured by the North Lake Tahoe/Truckee area. Of the income captured, nearly 18% is estimated to be spent on the three Applicable Retail categories evaluated in this analysis according to the US Department of Labor’s Consumer Expenditure Survey and Claritas’ Consumer Spending Patterns Report. In addition, over 40% of visitor spending is assumed to be expended on the three Applicable Retail categories evaluated in this analysis based on data from the key source materials. Table A-5 estimates the current retail demand broken down by Applicable Retail category as well as the growing demand for the two buildout scenarios. As shown in Table A-5, Applicable Retail demand totals approximately $373.4 million currently, but is expected to grow to $509.2 million under Scenario 1 and $880.5 million under Scenario 2. Supply-Side Analysis The estimated supply of Applicable Retail space, expressed in terms of Applicable Retail sales, is shown in Table A-6. Current Applicable Retail sales are delineated by retail cluster and are based on: (i) sales tax data provided by Placer County for the North Shore, West Shore, Alpine/Squaw, and Northstar Area retail clusters; and (ii) taxable sales data provided by SBOE for the Truckee Area retail cluster. During the course of translating sales tax and taxable sales into retail sales, an adjustment is made for grocery purchases. This adjustment reflects a 35% factor for taxable purchases at grocery stores due to the fact that a majority of grocery purchases are non-taxable. In addition, Applicable Retail sales for the Truckee area assume 10% of nonretail sales are attributable to retail and food spending at hotels. Finally, retail and food spending at hotels for all five retail clusters are assumed to be split 80/20, with 80% at hotel restaurants and bars and the remaining 20% at hotel retail stores, based on hotel industry statistics. Total existing Applicable Retail sales for all five retail clusters are estimated to equal approximately $375.2 million, as shown in Table A-6. Village at Squaw Valley Specific Plan Economic Impact & Urban Decay Analysis 27 April 15, 2015 Leakage Analysis The summary of existing retail market conditions provides some perspective against which to compare the results of the retail demand analysis. A sales capture and leakage analysis assesses the relative strength of the local Applicable Retail sectors by determining whether “leakage” or “capture” of retail sales is occurring in the North Lake Tahoe/Truckee area. Leakage would occur if there were insufficient retail space to meet the shopping needs of local residents and visitors, which would result in retail dollars “leaking” outside the trade area as shoppers go elsewhere to consume the goods and services they demand. On the contrary, capture would occur if there is an excessive amount of retail space to meet the shopping needs of trade area residents and visitors, combined with a lack of retail space in surrounding areas, which would result in retail dollars being “captured” from areas outside the trade area as shoppers from surrounding areas come to the North Lake Tahoe/Truckee area to consume the goods and services they demand. Table A-7 summarizes results of the demand-side analysis for each retail cluster and compares the total current demand for Applicable Retail against the current supply of Applicable Retail. The expected total purchasing power for Applicable Retail goods generated by residents and visitors of the North Lake Tahoe/Truckee area is generally equal to the estimated sales of Applicable Retail goods in the area. Specifically, current supply totals approximately $375.2 million and current demand totals approximately $373.3 million, which produces a net capture of approximately $1.9 million, or less than one percent of total supply. In other words, the amount of Applicable Retail space in the North Lake Tahoe/Truckee area can generally be considered to be in equilibrium. While Table A-7 compares current supply against current demand by retail cluster, Table A-8 compares current supply against current demand by Applicable Retail category. Trade Area Supportable Sales The results of the analysis to determine supportable square footage for Applicable Retail sales in the trade area are presented in Tables A-9.1 through A-9.3. These three tables itemize the existing retail sales for each Applicable Retail category by retail cluster and compare the overall supply against current demand as well as buildout demand under Scenarios 1 and 2. The two buildout scenarios are examined to provide an indication of how supportable sales may change with the Project. As Tables A-9.1 through A-9.3 show, the total purchasing power currently generated in the North Lake Tahoe area for the three Applicable Retail categories evaluated in these tables nearly equals Applicable Retail sales in the North Lake Tahoe area. Due to demographic changes that include real increases in household income above inflation, a growing population that translates into more households, and more visitors, demand for all Applicable Retail sales in the North Lake Tahoe area is projected to exceed the supply for Applicable Retail at buildout under both Scenarios 1 and 2, assuming no new additions to supply. Village at Squaw Valley Specific Plan Economic Impact & Urban Decay Analysis 28 April 15, 2015 POTENTIAL IMPACTS FROM FUTURE SUPPLY ON APPLICABLE RETAIL The retail cluster analysis estimated the amount of Applicable Retail sales that can be supported over time assuming no additions to the supply of existing Applicable Retail categories. This section of the study accounts for the introduction of Applicable Retail from the Project as well as those from other planned development projects in the North Lake Tahoe/Truckee area and presents the potential impacts at buildout for Scenarios 1 and 2 on existing Applicable Retail categories. Table A-10 summarizes the amount of planned Applicable Retail development from Table A-1. The data suggest the North Lake Tahoe/Truckee area can expect approximately 362,000 square feet of new Applicable Retail uses through 2040, which includes approximately 57,000 square feet in the Project and approximately 305,000 square feet outside of the Project. Trade Area Retail Sales Impacts Table A-11 incorporates the results of Tables A-9.1 through A-9.3 and the planned development from Table A-10, presenting the net supportable square feet for the different categories. By adding the estimated amount of new Applicable Retail at buildout of Scenarios 1 and 2, which Applicable Retail category may cause, or add to, an oversupply situation can be determined. None of the Applicable Retail categories are anticipated to produce an oversupply condition at buildout of either Scenario 1 or Scenario 2. However, an oversupply condition may occur in the interim, prior to buildout, if a disproportionate amount of Applicable Retail is developed in the near term because two of the Applicable Retail categories (i.e., Grocery/Market and Restaurant & Drinking Places) are currently in slight oversupply. However, any potential oversupply condition is anticipated to be temporary and not permanent. Impacts on Competing Retail Evaluations regarding the structure of retail market areas and impacts on existing retailers due to the entrance of a new store in a trade area are often based on a gravity model originally developed by William Reilly. Essentially, the gravity model suggests that the relative volume of purchases by consumers at a store (or the frequency of trips, or attraction, to the store) equates directly to the size of the store and inversely to the distance (in terms of driving time) between the store and the consumer. Although the gravity model has become widely used in retail analysis, it has some major weaknesses. First, it was developed in 1929 for rural trade areas where consumers had few opportunities for comparison shopping. Second, by concentrating on floor space and accessibility, the model overlooks price, store image, advertising, shopping ambiance, and other factors that may be equally or nearly as important in selecting a shopping destination. Third, the model does not differentiate between varying types of retail expenditures (e.g., groceries vs. furniture) or the nature of the proposed store (e.g., located in a neighborhood shopping center vs. a super-regional mall). Fourth, the model is based on the notion that shopping trips are generated only from a consumer’s residence, which clearly is not the case, especially for convenience goods such as groceries. Fifth, the model is limited to understanding the relationship between a Village at Squaw Valley Specific Plan Economic Impact & Urban Decay Analysis 29 April 15, 2015 maximum of only two retail establishments. [John McMahan, Property Development, McGrawHill, 1989, pp. 163-164.] After some modifications to Reilly’s gravity model had been proposed, David Huff formulated a probability model in 1964 that can handle the interaction among three or more retail establishments. The Huff model is generally considered the most advanced in the evolution of gravity-oriented models. [Neil Carn, et al, Real Estate Market Analysis, Prentice Hall, 1988, pp. 191-2.] In addition to employing mathematical techniques, an economic impact study inherently must involve a certain degree of judgment based on experience and the specific facts regarding the proposed facility and the marketplace in which it will operate. Rather than rely on the unpredictable results of the original gravity model or even a more advanced version, two straightforward, common-sense methodologies are also used in this study to estimate the economic impacts associated with the Project and all planned development projects. Four models, or approaches, are utilized to estimate the economic impacts on competing retail. These models encompass the four primary factors in determining sales success for the three Applicable Retail categories, and the competitive impacts of one type of store on another: The relationship between supply and demand of competitive stores The sales of competitive stores The strengths and weaknesses of competitive stores The distances between competitive stores The proportional demand model shown in Tables A-12.1 through A-12.3 utilizes the relationship between supply and demand for each retail cluster to estimate net supportable Applicable Retail sales at buildout of Scenarios 1 and 2. For example, in Table A-12.1, net supportable grocery and market retail sales in the Alpine/Squaw retail cluster total approximately $16.9 million at buildout of Scenario 1. Accounting for approximately $2.1 million in additional sales at buildout of Scenario 1 reduces net supportable sales to $14.8 million at buildout of Scenario 1, which translates to an equal amount of additional grocery and market sales to the Squaw/Alpine retail cluster. Tables A-13.1 through A-13.3 present the estimated impacts on Applicable Retail in the five clusters based on the proportional sales model. This model allocates the current net supportable Applicable Retail sales as well as the anticipated sales at buildout of Scenarios 1 and 2 based on the current sales in each retail cluster. For example, in Table A-13.1, grocery and market retail sales in the North Shore retail cluster total approximately $30.0 million, or 22% of the $138.3 million total grocery and market sales in the North Lake Tahoe area. This percentage of the $54.4 million in net supportable sales at buildout of Scenario 1 is allocated to North Shore grocery and market stores, resulting in an estimated increase in sales of approximately $11.8 million. Potential new sales are estimated to rise to approximately $28.3 million at buildout of Scenario 2. The competitive ranking model illustrated in Tables A-14.1 through A-14.3 translates the qualitative competitive advantages and disadvantages of each category’s stores into a Village at Squaw Valley Specific Plan Economic Impact & Urban Decay Analysis 30 April 15, 2015 quantitative ranking. A competitive ranking of 10 indicates that a store cannot do any better, while a ranking of 1 suggests that a retailer cannot do any worse. Based on site inspections and feedback from others, including retail organizations, several criteria as outlined below were used to formulate the rankings: External Factors 1. 2. 3. 4. Is the signage clearly visible from major streets? Is ample parking provided? Is the site located at a major intersection and in an area experiencing high traffic counts? How old is the store and what is its outward appearance? Internal Factors 5. 6. 7. 8. Does the store offer a wide selection of products and competitive prices? Is the store clean and the ambiance inviting? How effective is the store’s customer service? What is the level of marketing and merchandising? As shown in Tables A-14.1 through A-14.3, the new Project retail is assumed to rate highly on all factors, which is a conservative approach that results in more retail sales impact being spread to existing competition. For this reason, all Project stores received a competiveness ranking of 9. The retail sales impacts are allocated based on the relative competitive rankings. For example, North Shore grocery and market retail is rated a 5 (Table A-14.1). This is a lower ranking than that of West Shore grocery and market retail, so the impact on North Shore grocery and market retail is calculated to be more than the impact on West Shore grocery and market retail. The distance model is presented in Tables A-15.1 through A-15.3. This model estimates the impacts on each type of Applicable Retail category in the clusters based on their average proximity to the new Project retail. Since the North Shore and West Shore retail clusters include several smaller communities, the average proximity is calculated using the distance between the Project to each smaller community as well as the amount of taxable sales for each community. For example, the “weighted” average distance between the Project and the North Shore retail cluster is derived by multiplying the distance between the Project and each community (i.e., Carnelian Bay, Dollar Point, Tahoe Vista, and Kings Beach) within the North Shore retail cluster by the proportionate share of taxable sales for each community. First, estimated impacts on the Project’s stores are calculated based on the average retail sales impacts estimated in the prior three models for the Squaw/Alpine cluster. Then, impacts on other retail are calculated based on their relative distance from the Project. A competitor closer to the Project is likely to experience greater impacts than a competitor farther away. For example, North Shore grocery and market retail is on average approximately 15.7 miles from the Project, approximately 1.6 times the distance that West Shore grocery and market retail is from the Project; North Shore grocery and market retail impacts are approximately 60% that of West Shore grocery and market retail (Table A-15.1). Village at Squaw Valley Specific Plan Economic Impact & Urban Decay Analysis 31 April 15, 2015 Average Impacts on Existing Retail and the Project The four models described above in Tables A-12 through A-15 estimate that North Shore grocery and market retail may experience increases in retail sales of 2%, 39%, 50%, or 32% at buildout of Scenario 1; retail sales would rise to 69%, 94%, 120%, or 81% at buildout of Scenario 2. Tables A-16.1 through A-16.3 calculate the assumed impacts on the Project and the retail clusters by utilizing an average of the results from the four models. Average Impacts = + + + ÷ (Impacts due to proportional demand Impacts due to proportional sales Impacts due to competitive rankings Impacts due to distance) 4 Consequently, average impacts are based 25% on distance, 25% on competitive rankings, 25% on proportional demand, and 25% on proportional sales. This formula yields a positive impact on total retail sales for North Shore grocery and market retail of approximately 31% at buildout of Scenario 1, increasing to 91% at buildout of Scenario 2 (Table A-16.1). ECONOMIC IMPACT SUMMARY Table A-17 summarizes the effects, which are expressed as the average percentage impacts, calculated in Tables A-16.1 through A-16.3, of each of the three Applicable Retail categories on the five retail clusters at buildout of the proposed Project as well as at buildout of all planned development projects through 2040. As shown in Table A-17, all Applicable Retail sales impacts are positive, which suggest that sales for each Applicable Retail category in all five retail clusters are anticipated to increase beyond future demand. At buildout of both Scenario 1 (i.e., Project alone) and Scenario 2 (i.e., all planned development including the Project), demand for Applicable Retail will exceed cumulative supply. It does not appear that any negative impacts, even minor adverse impacts, will result in the North Lake Tahoe/Truckee study area due to buildout of additional Project retail or total planned Applicable Retail. Finally, Table A-18 compares the total demand for Applicable Retail at buildout of all planned developments, including the Project, against the total supply of Applicable Retail at buildout. The expected total purchasing power for Applicable Retail goods generated by residents and visitors of the North Lake Tahoe/Truckee area is expected to exceed the estimated sales of Applicable Retail goods in the North Lake Tahoe area at buildout of all planned development projects. Specifically, buildout supply of Applicable Retail sales is estimated to equal approximately $486.9 million and buildout demand is estimated to total approximately $880.5 million, which produces a net leakage of approximately $393.6 million, or 80% of total supply. In other words, the amount Applicable Retail space planned in the North Lake Tahoe/Truckee area is not anticipated to be sufficient to meet future demand. It should be noted that an oversupply condition may occur in the interim, prior to buildout, if a disproportionate amount of Applicable Retail is developed in the near term prior to sufficient demand being established. However, any potential oversupply condition is anticipated to be temporary and not permanent. Village at Squaw Valley Specific Plan Economic Impact & Urban Decay Analysis 32 April 15, 2015 Nonetheless, it is possible that individual merchants could be affected. Each business must be careful to address changing customer requirements over time and to operate as efficiently as possible in order to succeed in a competitive retail market. It may be necessary in the future for certain individual retailers within some of the retail clusters to adjust their operations or make new investments in their properties. Nevertheless, there should be sufficient market demand to support all of the existing and planned Applicable Retail development in the study area. Village at Squaw Valley Specific Plan Economic Impact & Urban Decay Analysis 33 April 15, 2015 Chapter 5 HOTEL AND CONDO HOTEL ANALYSIS HISTORICAL AND CURRENT LODGING CONDITIONS The North Lake Tahoe/Truckee area currently has approximately 36 lodging facilities containing approximately 2,160 rooms with an average room rate of $190 per night, as shown on Table B-1 in Appendix B. Detailed information on lodging facilities is provided by Smith Travel Research, Inc. (STR) and Placer County, including a count of all hotel rooms in the trade area, average historical occupancy rates for the trade area, and average historical daily room rates for the trade area. Additional information regarding specific hotel ratings and daily room rates are based on a survey of existing hotels. A summary of the lodging facilities for each retail cluster is provided in Table 5-1 below: TABLE 5-1 EXISTING HOTEL/MOTEL STATISTICS * Retail Cluster Number of Hotels Number of Rooms Average Daily Rate North Shore 12 416 $97 West Shore 11 324 $166 Squaw/Alpine 4 727 $273 Northstar Area 1 170 $269 Truckee Area 8 478 $142 36 2,160 $190 Hotel Totals/Average * Excludes approximately 1,453 rented condos with an estimated 2,179 rooms. In addition, the North Lake Tahoe/Truckee area includes approximately 1,453 condos that are available for rent that potentially adds another 2,179 rooms. The total number of available rooms in the North Lake Tahoe/Truckee study area is estimated to equal 4,339 rooms. Table B-2 presents hotel/motel historical monthly and annual occupancy rates for the North Lake Tahoe/Truckee area for calendar years 2010 through 2014. Average annual occupancy rates for the study area have ranged from 47% in 2010 to 51% in 2014, with an average occupancy rate of 49% for the 5-year period, as summarized in Figure 5-1 on the following page. Hotel demand in the North Lake Tahoe/Truckee area can fluctuate significantly depending on the season and on the day of the week, with winter and summer seasons and weekends typically being considered peak periods. Table B-3 shows average occupancy rates by day of the week for February, August, and full calendar year 2014. Average occupancy rates range from a low of 41% on Sunday for calendar year 2014 to a high of 89% for a Saturday in August. Village at Squaw Valley Specific Plan Economic Impact & Urban Decay Analysis 34 April 15, 2015 FIGURE 5-1 HISTORICAL HOTEL/MOTEL OCCUPANCY RATES 60% 50% 49% 40% 30% 20% 47% 48% 49% 51% 51% 2010 2011 2012 2013 2014 10% n/a Average Annual Occupancy Rate 5-Year Average Occupancy Rate Table B-4 presents hotel/motel average monthly and annual daily room rates for the North Lake Tahoe/Truckee area for calendar years 2010 through 2014. Average daily room rates for the study area have ranged from $142 per night in 2010 to $171 per night in 2014 with an average rate of $156 per night for the 5-year period, as summarized in Figure 5-2 on the following page. Table B-5 summarizes planned lodging projects based on information from Table A-1. Lodging projects are delineated between traditional hotel developments and condo/resort developments for each retail cluster. The Project is estimated to augment current lodging facilities by approximately 1,323 rooms at buildout. Buildout of all planned developments, including the Project, is anticipated to add approximately 3,856 rooms. The analysis conservatively assumes that all of the proposed condo hotel rooms will participate in a rental program; however, the project proponent is anticipating a 75% participation rate in the rental program. A 75% participation rate would reduce the number of condo hotel rooms available to be rented to visitors and, consequently, reduce the overall supply in the trade area. Over the 2010 to 2015 period, transient occupancy tax (TOT) collections have fluctuated for the North Lake Tahoe/Truckee area. A breakdown of actual and projected TOT collections in the North Lake Tahoe area of Placer County, which includes the North Shore, West Shore, Squaw/Alpine, and Northstar Area retail clusters, and in the Town of Truckee, for fiscal years 2009-10 through 2014-15 is identified in Table B-6. The total hotel and condo room revenue is shown on Table B-7, which is calculated by applying the 10% TOT rate levied in each area to the TOT revenues collected for each fiscal year. Village at Squaw Valley Specific Plan Economic Impact & Urban Decay Analysis 35 April 15, 2015 FIGURE 5-2 HISTORICAL HOTEL/MOTEL AVERAGE DAILY ROOM RATES $180 $160 $156 $140 $120 $100 $80 $60 $154 $164 $171 $142 $148 2010 2011 2012 2013 2014 $40 $20 $0 Average Daily Room Rate 5-Year Average Daily Room Rate LODGING PROJECTIONS Table B-8 identifies future hotel and condo demand by first projecting total lodging room revenues in the North Lake Tahoe/Truckee area at the two buildout scenarios. Hotel and condo room revenue is assumed to increase 4% per year, which corresponds to the annual percentage increase in the number of visitor days anticipated in the North Lake Tahoe/Truckee area. Total hotel and condo room revenue is anticipated to equal approximately $319.4 million at buildout of all planned development projects, or an increase of approximately $199.6 million over current estimates. This incremental increase is allocated between revenues attributable to the Project and those to the rest of the North Lake Tahoe/Truckee area based on the anticipated number of lodging rooms. The Project includes approximately 1,323 lodging rooms, assuming 100% participation in the rental program, and the remainder of the study area includes 2,533 lodging rooms, for a total of 3,856 rooms. As a result, the Project is ascribed approximately 34%, or $68 million in incremental room revenues, of the total $199.6 million in new room revenues anticipated within the North Lake Tahoe area. An average daily room rate of $180 per night is derived using an average rate of $190 per night from the individual hotel/motel survey and an average rate of $171 for calendar year 2014 from STR. Applying the $180 average daily room rate to the existing and projected lodging room revenues under both buildout scenarios produces an estimate of the number of rooms demanded in the North Lake Tahoe/Truckee area. Dividing demand, expressed in terms of the number of supportable rooms, by the current and future supply of hotel and condo rooms in the North Lake Tahoe/Truckee area generates an implied occupancy rate. Village at Squaw Valley Specific Plan Economic Impact & Urban Decay Analysis 36 April 15, 2015 ECONOMIC IMPACT SUMMARY The analysis suggests that the proposed project would not create an overbuilt lodging market. Based on projected supply and anticipated demand, there would be a 50% overall lodging (hotel/motel plus condo rooms) occupancy rate within the North Lake Tahoe/Truckee area at buildout of Scenario 1 (i.e., only the Project is developed). Buildout of Scenario 2 results in an even higher overall occupancy rate of 59%. As discussed above, a 75% participation rate in the rental program would reduce the overall supply of hotel rooms in the trade area and result in a higher implied occupancy rate for each scenario. Since short-term rental condos typically experience much lower occupancy rates than traditional hotels, and because buildout of both scenarios would not increase the supply to a level that would lower occupancy rates to below the current 42% overall average or the 5-year hotel/motel average of 49%, buildout of both scenarios should not create long-term structural vacancies that could lead to urban decay. These results are illustrated in Figure 5-3 below. This does not mean that individual hotels will not be affected. Each business must be well-run and work to satisfy customer needs in order to capture a sustainable share of the hospitality market. Some trade area hotels may need to adjust their operations or make new investments in their properties. Nevertheless, there should be sufficient market demand to support all of the existing and planned hotel rooms in the trade area. FIGURE 5-3 TRADE AREA LODGING OCCUPANCY RATES AT BUILDOUT 70% 60% 50% 49% 42% 40% 30% 59% 50% 20% 10% 0% At Buildout of At Buildout of All Proposed Project Planned Projects Implied Occupancy Rate 5-Year Average Hotel/Motel Occupancy Rate Current Implied Overall Lodging Occupancy Rate Village at Squaw Valley Specific Plan Economic Impact & Urban Decay Analysis 37 April 15, 2015 APPENDIX A APPLICABLE RETAIL ANALYSIS General Assumptions, Methodology, and Summary Tables Table A-1 Village at Squaw Valley Specific Plan Economic Impact and Urban Decay Analysis Draft EIR Cumulative Development List EIR Map Number Project Name Proposed Residential/Hotel Development Dwelling Units (rooms for hotels) Proposed Restaurant/Retail/ Grocery Development (square feet) 1 Truckee Railyard Master Plan Source: Draft Master Plan EIR, November 2008 20 460 100 60 single family multi-family live/work hotel 35,000 Restaurant 35,000 Retail 20,000 Grocery 2 Coldstream Specific Plan Source: Final EIR, March 2014 300 single family 45 affordable housing 100 room hotel 5,000 Restaurant 5,000 Retail 3 Pollard Station -- A Senior Neighborhood Source: Notice of Planning Application Submittal, February 2013 86 lodge 40 2-bdr condos 4 Joerger Ranch Specific Plan Source: Final EIR, January 2015 80 multi-family 15 Martis Camp and Lahontan Area Source: Placer County Assessor's Data Total Truckee Area 856 upscale home unbuilt lots 2,147 Notes The project includes 70,000 sf of restaurant and retail, of which 50% is assumed to be restaurant and 50% retail. The project includes potential for 30,000 sf of retail, office, and lodging. One third is assumed to be restaurant and retail uses, of which 50% is assumed to be restaurant and 50% retail. None 22,250 22,250 44,500 25,500 25,500 Restaurant Retail Grocery Restaurant Retail The project includes 178,000 sf of regional commercial. Buildings larger than 5,000 sf will be grocery, home furnishings/appliances, casual dining, large floor plate general merchandise, and large floor plate office. One half is assumed to be applicable restaurant and retail uses, of which 25% is assumed to be restaurant, 25% retail, and 50% grocery. The project also includes 51,000 sf of lifestyle commercial which may include home furnishings, wine tasting and beverage garden, casual dining, and garden supplies. Approximately 50% is assumed to be restaurant and 50% retail. None 240,000 6 Northstar Highlands Phase II Source: Initial Study & Checklist, July 2013 10 50 386 32 single family units townhomes condos employee housing units 1,000 Restaurant 1,000 Retail The project includes 4,000 sf zoned for commercial uses. One half is assumed to be restaurant and retail uses, of which 50% is assumed to be restaurant and 50% retail. 16 Martis Valley West Parcel Source: Draft Specific Plan, August 2014 760 single family, townhome, cabin, and condo resort units 112 resort recreation units 8,625 Restaurant 8,625 Retail The project includes 34,500 sf of commercial uses. One half is assumed to be restaurant and retail uses, of which 50% is assumed to be restaurant and 50% retail. Total Northstar Area 12 1,350 Homewood Mountain Resort Master Plan Source: Final EIR/EIS, September 2011 221 residential, fractional, and hotel condo 16 townhouse 75 five-star hotel 13 workforce housing Total West Shore Area 325 Source: Placer County, Town of Truckee, Goodwin Consulting Group, Inc. 19,250 6,250 Restaurant 6,250 Retail The project includes 25,000 sf of commercial uses. One half is assumed to be restaurant and retail uses, of which 50% is assumed to be restaurant and 50% retail. 12,500 Page 1 of 2 04/15/2015 Table A-1 Village at Squaw Valley Specific Plan Economic Impact and Urban Decay Analysis Draft EIR Cumulative Development List Continued EIR Map Number Project Name 10 Alpine Sierra Subdivision Source: Notice of Preparation, April 2014 Resort at Squaw Creek Phase 2 Proposed Residential/Hotel Development Dwelling Units (rooms for hotels) 33 single family 28 14 halfplex units Proposed Restaurant/Retail/ Grocery Development (square feet) None 441 resort condo None 16 single family None Squaw Valley Ranch Estates 4 single family None Mancuso 4 single family None Olympic Estates PlumpJack Redevelopment Forecast Development 104 hotel/condo 66 single family 34 resort hotel/condo 2,500 Restaurant 2,500 Retail 14,000 Restaurant 14,000 Retail Total Squaw/Alpine Area (not incl Village at Squaw Valley) 730 33,000 Village at Squaw Valley 850 hotel, condo, fractional, and timeshare 50 employee housing 29,525 Restaurant 22,692 Retail 5,000 Grocery Total Village at Squaw Valley 900 57,217 Total Squaw/Alpine Area (incl Village at Squaw Valley) 1,630 90,217 Total Study Area 5,452 361,967 Source: Placer County, Town of Truckee, Goodwin Consulting Group, Inc. Notes The project includes 10,000 sf zoned for commercial uses. One half is assumed to be restaurant and retail uses, of which 50% is assumed to be restaurant and 50% retail. The project includes 56,000 sf of commercial uses. One half is assumed to be restaurant and retail uses, of which 50% is assumed to be restaurant and 50% retail. Page 2 of 2 04/15/2015 Other CEQA Sections Exhibit 18-1 2 Draft for Internal Review and Deliberation Ascent Environmental Locations of Cumulative Projects Placer County Village at Squaw Valley Specific Plan EIR Table A-2 Placer County Village at Squaw Valley Specific Plan Economic Impact and Urban Decay Analysis Projected Residential Development by Retail Cluster Project Tahoe Basin Homewood Mountain Resort North Shore /1 West Shore /1 Subtotal Squaw / Alpine /2 Alpine Sierra Subdivision Resort at Squaw Creek Phase 2 Olympic Estates Squaw Valley Ranch Estates Mancuso Forecast Development Single Family Resort Hotel/Condo PlumpJack Redevelopment Subtotal Northstar Area Northstar /3 Martis Valley West Parcel Highlands Phase II Subtotal Truckee Area Town of Truckee /4 Martis Camp/Lahontan Subtotal Projected Buildout Total Absentee Rate Estimated Owner-Occupied Households N/A 2032 2032 250 290 290 830 88% 61% 64% 70% 30 113 104 248 N/A N/A N/A N/A N/A 61 441 16 4 4 0% 100% 0% 0% 0% 61 0 16 4 4 N/A N/A N/A 66 34 104 730 0% 100% 100% 79% 66 0 0 151 N/A N/A N/A 620 872 478 1,970 60% 60% 87% 67% 248 349 62 659 2025 N/A 4,993 856 5,849 50% 60% 51% 2,497 342 2,839 Subtotal Proposed Project Proposed Units 9,379 2040 3,896 900 100% 0 10,279 62% 3,896 /1 Assumes 50% of estimated future units are developed in the North Shore, while the remaining 50% are assumed to be developed in the West Shore. These 580 units are assumed to be in addition to the Homewood Mountain Resort units if projected to 2040. /2 Does not include the proposed project. /3 Includes affordable housing, Northstar Village, and Northside projects. /4 Reflects all future residential development, including the specific projects identified in Table A-1, based on the Town of Truckee 2025 General Plan adopted November 2006. Source: Dean Runyan Associates; NLTRA; EPS; Placer County; Town of Truckee; Goodwin Consulting Group, Inc. 04/15/2015 Table A-3 Placer County Village at Squaw Valley Specific Plan Economic Impact and Urban Decay Analysis Retail Cluster Occupied Households & Visitors Current Occupied Households North Shore West Shore Squaw / Alpine Northstar Area Truckee Area Total Households Daily Visitors /2 North Shore West Shore Squaw / Alpine Northstar Area Truckee Area Total Daily Visitors Project Buildout /1 Proposed All Planned Project Projects /3 2,212 2,884 447 264 7,465 13,272 2,212 2,884 447 264 7,465 13,272 2,325 3,018 598 923 10,304 17,168 1,011,525 658,576 640,725 568,971 519,672 3,399,469 1,011,525 658,576 1,414,006 568,971 519,672 4,172,750 2,804,424 1,825,882 1,776,390 1,577,454 1,440,776 9,424,926 /1 Visitors to the North Lake Tahoe area are estimated to equal 3,143,000 visitor days in 2012, which are assumed to increase, on average, 4% per year. The number of visitor days in 2014 is estimated to equal 3,399,469 and grow to 9,424,926 in 2040 (i.e., buildout of the proposed project). /2 Visitors for each retail cluster are based on the ratio of Transient Occupancy Tax collections, adjusted by the average daily room rate in each retail cluster. /3 Includes the proposed project. Source: Claritas; Dean Runyan Associates; NLTRA; Placer County; EPS; Census; Goodwin Consulting Group, Inc. 04/15/2015 Table A-4 Placer County Village at Squaw Valley Specific Plan Economic Impact and Urban Decay Analysis Retail Cluster Mean Household Income & Average Daily Visitor Spending Current Mean Household Income North Shore West Shore Squaw / Alpine Northstar Area Truckee Area Average Daily Visitor Spending North Shore West Shore Squaw / Alpine Northstar Area Truckee Area Project Buildout /1 $74,500 $95,400 $89,600 $124,800 $99,900 $111,200 $142,400 $133,700 $186,200 $149,100 $155 $155 $155 $155 $155 $155 $155 $155 $155 $155 /1 Mean household income is estimated to increase, on average, 1.61% per year in real terms. Source: Claritas; Placer County; Bureau of Labor Statistics; Dean Runyan Associates; Goodwin Consulting Group, Inc. 04/15/2015 Table A-5 Placer County Village at Squaw Valley Specific Plan Economic Impact and Urban Decay Analysis Demand by Applicable Retail Sales Category Applicable Retail Sales Category Current Project Buildout Proposed All Planned Project Projects Occupied Household Spending Grocery / Market Limited Retail Group /1 Restaurant & Drinking Places Subtotal Capture Rate 90% 80% 80% 85% % of Total Income 8.9% 4.3% 4.8% 18.0% $100,820,228 $43,298,575 $47,930,515 $192,049,318 $150,476,517 $64,624,122 $71,537,400 $286,638,039 $198,366,593 $85,191,146 $94,304,617 $377,862,356 Visitor Spending Grocery / Market Limited Retail Group /1 Restaurant & Drinking Places Subtotal Capture Rate 100% 90% 80% 86% % of Total Spending 6.9% 9.2% 24.1% 40.1% $36,169,499 $43,403,399 $101,728,744 $181,301,642 $44,397,017 $53,276,420 $124,869,099 $222,542,537 $100,278,853 $120,334,624 $282,039,895 $502,653,372 $373,350,960 $509,180,576 $880,515,727 Total Household and Visitor Spending /1 Includes clothing and clothing accessories stores as well as the BOE Other Retail group, which includes categories such as sporting goods, health and personal care, music, and gift stores. Source: Bureau of Labor Statistics; Claritas; Dean Runyan Associates; NLTRA; Placer County; Goodwin Consulting Group, Inc. 04/15/2015 Table A-6 Placer County Village at Squaw Valley Specific Plan Economic Impact and Urban Decay Analysis Estimated Applicable Retail Sales by Retail Cluster Retail Cluster Applicable Retail Sales Category Grocery / Market North Shore West Shore Squaw / Alpine Northstar Area Truckee Area Total $29,958,857 $45,596,857 $2,893,429 $141,300 $59,693,451 $138,283,894 $5,671,936 $20,961,350 $6,696,661 $7,501,642 $45,027,809 $85,859,398 Restaurant & Drinking Places $23,789,363 $32,488,941 $20,565,439 $28,858,168 $45,383,413 $151,085,324 Total $59,420,155 $99,047,149 $30,155,529 $36,501,110 $150,104,674 $375,228,616 Limited Retail Group Source: California State Board of Equalization; Claritas; Placer County; Goodwin Consulting Group, Inc. 04/15/2015 Table A-7 Placer County Village at Squaw Valley Specific Plan Economic Impact and Urban Decay Analysis Existing (2014) Applicable Retail Leakage Analysis by Retail Cluster Retail Cluster Demand vs. Supply North Shore /1 West Shore /2 Squaw / Alpine /3 Northstar Area Truckee Area /4 Total Demographics Number of Occupied Households Mean Household Income Blended Capture Rate Income Expenditure on Applicable Retail Categories Number of Visitor Days per Year Average Daily Spending per Visitor Blended Capture Rate Spending Expenditure on Applicable Retail Categories 2,884 $95,400 85% 18.0% 447 $89,600 85% 18.0% 264 $124,800 85% 18.0% 7,465 $99,900 85% 18.0% 13,272 $94,837 85% 18.0% 1,011,525 $155 86% 40.1% 658,576 $155 86% 40.1% 640,725 $155 86% 40.1% 568,971 $155 86% 40.1% 519,672 $155 86% 40.1% 3,399,469 $155 86% 40.1% Total Demand for Applicable Retail $79,091,287 $77,103,292 $40,282,356 $35,371,619 $141,502,406 $373,350,960 Supply of Applicable Retail $59,420,155 $99,047,149 $30,155,529 $36,501,110 $150,104,674 $375,228,616 ($19,671,132) $21,943,857 ($10,126,828) $1,129,491 $8,602,268 $1,877,657 1.03 1.06 1.01 Capture/(Leakage) Ratio of Supply vs. Demand /1 /2 /3 /4 2,212 $74,500 85% 18.0% 0.75 1.28 0.75 Includes the communities of Dollar Point, Carnelian Bay, Tahoe Vista, and Kings Beach. Includes the communities of Tahoe City, Sunnyside, Homewood, and Tahoma Meadows. Includes Squaw Valley and Alpine Meadows. Includes the Town of Truckee and surrounding communities in unincorporated Nevada County and Placer County. Source: California State Board of Equalization; Claritas; Census; Placer County; NLTRA; Town of Truckee; Dean Runyan Associates; Goodwin Consulting Group, Inc. 04/15/2015 Table A-8 Placer County Village at Squaw Valley Specific Plan Economic Impact and Urban Decay Analysis Estimated Current Supply vs. Estimated Current Demand Applicable Retail Sales Category Grocery / Market Estimated Supply Estimated Demand Demand vs. Supply $138,283,894 $136,989,727 $85,859,398 $86,701,974 Restaurant & Drinking Places $151,085,324 $149,659,259 ($1,426,065) 99.1% Total $375,228,616 $373,350,960 ($1,877,657) 99.5% Limited Retail Group /1 ($1,294,167) Demand as % of Supply $842,576 99.1% 101.0% /1 Includes clothing and clothing accessories stores as well as the BOE Other Retail group, which includes categories such as sporting goods, health and personal care, music, and gift stores. Source: California State Board of Equalization; Claritas; Placer County; Goodwin Consulting Group, Inc. 04/15/2015 Table A-9.1 Placer County Village at Squaw Valley Specific Plan Economic Impact and Urban Decay Analysis Analysis of Trade Area Supportable Sales Grocery / Market Demand vs. Supply Current Project Buildout Proposed All Planned Project Projects Demand for Grocery / Market Store Sales Total Annual Sales Potential $136,989,727 $194,873,534 $298,645,446 $29,958,857 $45,596,857 $2,893,429 $141,300 $59,693,451 $138,283,894 $29,958,857 $45,596,857 $2,893,429 $141,300 $59,693,451 $138,283,894 $29,958,857 $45,596,857 $2,893,429 $141,300 $59,693,451 $138,283,894 ($1,294,167) $56,589,640 Existing Supply of Grocery / Market Sales North Shore West Shore Squaw / Alpine Northstar Area Truckee Area Total Existing Supply Net Supportable Sales Source: California State Board of Equalization; Placer County; Goodwin Consulting Group, Inc. $160,361,551 04/15/2015 Table A-9.2 Placer County Village at Squaw Valley Specific Plan Economic Impact and Urban Decay Analysis Analysis of Trade Area Supportable Sales Limited Retail Group Demand vs. Supply Current Project Buildout Proposed All Planned Project Projects $86,701,974 $117,900,543 $205,525,769 $5,671,936 $20,961,350 $6,696,661 $7,501,642 $45,027,809 $85,859,398 $5,671,936 $20,961,350 $6,696,661 $7,501,642 $45,027,809 $85,859,398 $5,671,936 $20,961,350 $6,696,661 $7,501,642 $45,027,809 $85,859,398 Demand for Limited Retail Store Sales Total Annual Sales Potential Existing Supply of Limited Retail Space North Shore West Shore Squaw / Alpine Northstar Area Truckee Area Total Existing Supply Net Supportable Sales $842,576 Source: California State Board of Equalization; Placer County; Goodwin Consulting Group, Inc. $32,041,145 $119,666,372 04/15/2015 Table A-9.3 Placer County Village at Squaw Valley Specific Plan Economic Impact and Urban Decay Analysis Analysis of Trade Area Supportable Sales Restaurant & Drinking Places Demand vs. Supply Current Project Buildout Proposed All Planned Project Projects Demand for Restaurant & Drinking Places Sales Total Annual Sales Potential $149,659,259 $196,406,499 $376,344,512 $23,789,363 $32,488,941 $20,565,439 $28,858,168 $45,383,413 $151,085,324 $23,789,363 $32,488,941 $20,565,439 $28,858,168 $45,383,413 $151,085,324 $23,789,363 $32,488,941 $20,565,439 $28,858,168 $45,383,413 $151,085,324 ($1,426,065) $45,321,175 Existing Supply of Restaurant & Drinking Sales North Shore West Shore Squaw / Alpine Northstar Area Truckee Area Total Existing Supply Net Supportable Sales Source: California State Board of Equalization; Placer County; Goodwin Consulting Group, Inc. $225,259,188 04/15/2015 Table A-10 Placer County Village at Squaw Valley Specific Plan Economic Impact and Urban Decay Analysis Planned Applicable Retail Square Footage by Retail Cluster Retail Cluster Grocery / Market Limited Retail Restaurant / Drinking Total North Shore West Shore Squaw / Alpine /1 Northstar Area Truckee Area Subtotal 0 0 0 0 64,500 64,500 0 6,250 16,500 9,625 87,750 120,125 0 6,250 16,500 9,625 87,750 120,125 0 12,500 33,000 19,250 240,000 304,750 Proposed Project 5,000 22,692 29,525 57,217 69,500 142,817 149,650 361,967 Total Square Feet /1 Excludes proposed project. Source: Town of Truckee; Placer County; Goodwin Consulting Group, Inc. 04/15/2015 Table A-11 Placer County Village at Squaw Valley Specific Plan Economic Impact and Urban Decay Analysis Introduction of Retail into the Trade Area Retail Sales Impacts Current Project Buildout Proposed All Planned Project Projects /1 ($1,294,167) $56,589,640 $160,361,551 5,000 $430 $2,150,000 69,500 $430 $29,885,000 $54,439,640 $130,476,551 $842,576 $32,041,145 $119,666,372 0 -$0 22,692 $250 $5,673,000 142,817 $250 $35,704,250 $842,576 $26,368,145 $83,962,122 $45,321,175 $225,259,188 Grocery / Market Net Supportable Sales Future Estimated Retail Square Feet Estimated Future Retail Sales per Square Foot Future Sales Net Supportable Sales with Future Development 0 -$0 ($1,294,167) Limited Retail Group Net Supportable Sales Future Estimated Retail Square Feet Estimated Future Retail Sales per Square Foot Future Sales Net Supportable Sales with Future Development Restaurant & Drinking Places Net Supportable Sales Future Estimated Retail Square Feet Estimated Future Retail Sales per Square Foot Future Sales Net Supportable Sales with Future Development ($1,426,065) 0 -$0 ($1,426,065) 29,525 $328 /2 $9,695,124 $35,626,051 149,650 $308 $46,092,200 $179,166,988 /1 Includes the proposed project. /2 Weighted average assuming 21% of the proposed square footage related to restaurant and drinking places is a coffee/tea store with average retail sales of $405 per square foot, and the remaining 79% is a restaurant with a liquor license with average retail sales of $308 per square foot. Source: California State Board of Equalization; ULI; Placer County; Town of Truckee; Goodwin Consulting Group, Inc. 04/15/2015 Table A-12.1 Placer County Village at Squaw Valley Specific Plan Economic Impact and Urban Decay Analysis Impacts on Competing Grocery / Market Proportional Demand Model Current Project Buildout Proposed All Planned Project Projects Net Supportable Sales North Shore West Shore Squaw / Alpine Northstar Area Truckee Area Total ($5,996,481) ($16,551,571) $7,131,822 $8,551,476 $5,570,586 ($1,294,167) $506,069 ($5,694,176) $16,938,327 $9,849,864 $34,989,554 $56,589,640 $20,589,457 $8,258,665 $22,411,120 $30,407,715 $78,694,595 $160,361,551 $0 $0 $2,150,000 $0 $0 $2,150,000 $0 $0 $2,150,000 $0 $27,735,000 $29,885,000 $506,069 ($5,694,176) $14,788,327 $9,849,864 $34,989,554 $54,439,640 $20,589,457 $8,258,665 $20,261,120 $30,407,715 $50,959,595 $130,476,551 Future Sales North Shore West Shore Squaw / Alpine Northstar Area Truckee Area Total Net Supportable Sales with Future Development North Shore West Shore Squaw / Alpine Northstar Area Truckee Area Total Net Supportable with Future Development as % of Future Sales 2,532% 437% Annual Sales Impacts North Shore West Shore Squaw / Alpine Northstar Area Truckee Area Total Impact as % of Total Sales North Shore West Shore Squaw / Alpine Northstar Area Truckee Area Source: Goodwin Consulting Group, Inc. ($5,996,481) ($16,551,571) $7,131,822 $8,551,476 $5,570,586 ($1,294,167) $506,069 ($5,694,176) $14,788,327 $9,849,864 $34,989,554 $54,439,640 $20,589,457 $8,258,665 $20,261,120 $30,407,715 $50,959,595 $130,476,551 Estimated Annual Sales $29,958,857 $45,596,857 $2,893,429 $141,300 $59,693,451 2% -12% 511% 6,971% 59% 69% 18% 700% 21,520% 85% 04/15/2015 Table A-12.2 Placer County Village at Squaw Valley Specific Plan Economic Impact and Urban Decay Analysis Impacts on Competing Limited Retail Group Proportional Demand Model Current Project Buildout Proposed All Planned Project Projects Net Supportable Sales North Shore West Shore Squaw / Alpine Northstar Area Truckee Area Total $12,911,831 ($3,088,252) $2,861,679 $896,188 ($12,738,870) $842,576 $15,704,436 $1,574,599 $13,412,818 $1,453,798 ($104,506) $32,041,145 $39,028,266 $17,136,776 $18,734,122 $18,550,506 $26,216,702 $119,666,372 $0 $0 $5,673,000 $0 $0 $5,673,000 $0 $1,562,500 $9,798,000 $2,406,250 $21,937,500 $35,704,250 $15,704,436 $1,574,599 $7,739,818 $1,453,798 ($104,506) $26,368,145 $39,028,266 $15,574,276 $8,936,122 $16,144,256 $4,279,202 $83,962,122 Future Sales North Shore West Shore Squaw / Alpine Northstar Area Truckee Area Total Net Supportable Sales with Future Development North Shore West Shore Squaw / Alpine Northstar Area Truckee Area Total Net Supportable with Future Development as % of Future Sales 465% 235% Annual Sales Impacts North Shore West Shore Squaw / Alpine Northstar Area Truckee Area Total Impact as % of Total Sales North Shore West Shore Squaw / Alpine Northstar Area Truckee Area Source: Goodwin Consulting Group, Inc. $12,911,831 ($3,088,252) $2,861,679 $896,188 ($12,738,870) $842,576 $15,704,436 $1,574,599 $7,739,818 $1,453,798 ($104,506) $26,368,145 $39,028,266 $15,574,276 $8,936,122 $16,144,256 $4,279,202 $83,962,122 Estimated Annual Sales $5,671,936 $20,961,350 $6,696,661 $7,501,642 $45,027,809 277% 8% 116% 19% 0% 688% 74% 133% 215% 10% 04/15/2015 Table A-12.3 Placer County Village at Squaw Valley Specific Plan Economic Impact and Urban Decay Analysis Impacts on Competing Restaurant & Drinking Places Proportional Demand Model Current Project Buildout Proposed All Planned Project Projects Net Supportable Sales North Shore West Shore Squaw / Alpine Northstar Area Truckee Area Total $12,755,782 ($2,304,034) $133,326 ($10,577,155) ($1,433,985) ($1,426,065) $15,847,132 $2,857,634 $24,024,341 ($9,959,893) $12,551,962 $45,321,175 $69,978,350 $38,517,933 $35,637,436 $24,891,075 $56,234,395 $225,259,188 $0 $0 $9,695,124 $0 $0 $9,695,124 $0 $1,925,000 $14,777,124 $2,964,500 $27,027,000 $46,693,624 $15,847,132 $2,857,634 $14,329,217 ($9,959,893) $12,551,962 $35,626,051 $69,978,350 $36,592,933 $20,860,311 $21,926,575 $29,207,395 $178,565,564 Future Sales North Shore West Shore Squaw / Alpine Northstar Area Truckee Area Total Net Supportable Sales with Future Development North Shore West Shore Squaw / Alpine Northstar Area Truckee Area Total Net Supportable with Future Development as % of Future Sales 367% 389% Annual Sales Impacts North Shore West Shore Squaw / Alpine Northstar Area Truckee Area Total Impact as % of Total Sales North Shore West Shore Squaw / Alpine Northstar Area Truckee Area Source: Goodwin Consulting Group, Inc. $12,755,782 ($2,304,034) $133,326 ($10,577,155) ($1,433,985) ($1,426,065) $15,847,132 $2,857,634 $14,329,217 ($9,959,893) $12,551,962 $35,626,051 $69,978,350 $36,592,933 $20,860,311 $21,926,575 $29,207,395 $178,565,564 Estimated Annual Sales $23,789,363 $32,488,941 $20,565,439 $28,858,168 $45,383,413 67% 9% 70% -35% 28% 294% 113% 101% 76% 64% 04/15/2015 Table A-13.1 Placer County Village at Squaw Valley Specific Plan Economic Impact and Urban Decay Analysis Impacts on Competing Grocery / Market Proportional Sales Model Current Net Supportable Sales Future Sales ($1,294,167) Net Supportable Sales with Future Development ($1,294,167) Net Supportable with Future Development as % of Future Sales Annual Sales Impacts Estimated Annual Sales North Shore West Shore Squaw / Alpine Northstar Area Truckee Area Total $29,958,857 $45,596,857 $2,893,429 $141,300 $59,693,451 $138,283,894 Impact as % of Total Sales Estimated Annual Sales North Shore West Shore Squaw / Alpine Northstar Area Truckee Area Source: Goodwin Consulting Group, Inc. $29,958,857 $45,596,857 $2,893,429 $141,300 $59,693,451 ($280,378) ($426,731) ($27,079) ($1,322) ($558,657) ($1,294,167) Project Buildout Proposed All Planned Project Projects $56,589,640 $2,150,000 $160,361,551 $29,885,000 $54,439,640 2,532% $130,476,551 437% $11,794,211 $17,950,583 $1,139,086 $55,627 $23,500,134 $54,439,640 $28,267,416 $43,022,513 $2,730,069 $133,322 $56,323,231 $130,476,551 39% 39% 39% 39% 39% 94% 94% 94% 94% 94% 04/15/2015 Table A-13.2 Placer County Village at Squaw Valley Specific Plan Economic Impact and Urban Decay Analysis Impacts on Competing Limited Retail Group Proportional Sales Model Current Net Supportable Sales Future Sales $842,576 Net Supportable Sales with Future Development $842,576 Net Supportable with Future Development as % of Future Sales Annual Sales Impacts North Shore West Shore Squaw / Alpine Northstar Area Truckee Area Total Impact as % of Total Sales North Shore West Shore Squaw / Alpine Northstar Area Truckee Area Source: Goodwin Consulting Group, Inc. Project Buildout Proposed All Planned Project Projects $32,041,145 $5,673,000 $119,666,372 $35,704,250 $26,368,145 465% $83,962,122 235% $1,741,899 $6,437,407 $2,056,601 $2,303,817 $13,828,420 $26,368,145 $5,546,600 $20,498,157 $6,548,682 $7,335,874 $44,032,808 $83,962,122 Estimated Annual Sales $5,671,936 $20,961,350 $6,696,661 $7,501,642 $45,027,809 $85,859,398 $55,661 $205,703 $65,717 $73,617 $441,878 $842,576 Estimated Annual Sales $5,671,936 $20,961,350 $6,696,661 $7,501,642 $45,027,809 31% 31% 31% 31% 31% 98% 98% 98% 98% 98% 04/15/2015 Table A-13.3 Placer County Village at Squaw Valley Specific Plan Economic Impact and Urban Decay Analysis Impacts on Competing Restaurant & Drinking Places Proportional Sales Model Current Net Supportable Sales Future Sales ($1,426,065) Net Supportable Sales with Future Development ($1,426,065) Net Supportable with Future Development as % of Future Sales Annual Sales Impacts Estimated Annual Sales North Shore West Shore Squaw / Alpine Northstar Area Truckee Area Total $23,789,363 $32,488,941 $20,565,439 $28,858,168 $45,383,413 $151,085,324 Impact as % of Total Sales Estimated Annual Sales North Shore West Shore Squaw / Alpine Northstar Area Truckee Area Source: Goodwin Consulting Group, Inc. $23,789,363 $32,488,941 $20,565,439 $28,858,168 $45,383,413 ($224,543) ($306,657) ($194,113) ($272,387) ($428,365) ($1,426,065) Project Buildout Proposed All Planned Project Projects $45,321,175 $9,695,124 $225,259,188 $46,092,200 $35,626,051 367% $179,166,988 389% $5,609,552 $7,660,921 $4,849,348 $6,804,781 $10,701,448 $35,626,051 $28,211,002 $38,527,539 $24,387,860 $34,221,928 $53,818,658 $179,166,988 24% 24% 24% 24% 24% 119% 119% 119% 119% 119% 04/15/2015 Table A-14.1 Placer County Village at Squaw Valley Specific Plan Economic Impact and Urban Decay Analysis Impacts on Competing Grocery / Market Competitive Ranking Model Current Net Supportable Sales Future Sales ($1,294,167) Net Supportable Sales with Future Development ($1,294,167) Net Supportable with Future Development as % of Future Sales Annual Sales Impacts North Shore West Shore Squaw / Alpine Northstar Area Truckee Area Total Impact as % of Total Sales North Shore West Shore Squaw / Alpine Northstar Area Truckee Area Source: Goodwin Consulting Group, Inc. Project Buildout Proposed All Planned Project Projects $56,589,640 $2,150,000 $160,361,551 $29,885,000 $54,439,640 2,532% $130,476,551 437% $14,960,512 $12,467,093 $8,311,395 $9,350,320 $9,350,320 $54,439,640 $35,856,151 $29,880,126 $19,920,084 $22,410,095 $22,410,095 $130,476,551 Competitive Ranking 5 6 9 8 8 ($355,649) ($296,374) ($197,583) ($222,281) ($222,281) ($1,294,167) Estimated Annual Sales $29,958,857 $45,596,857 $2,893,429 $141,300 $59,693,451 50% 27% 287% 6,617% 16% 120% 66% 688% 15,860% 38% 04/15/2015 Table A-14.2 Placer County Village at Squaw Valley Specific Plan Economic Impact and Urban Decay Analysis Impacts on Competing Limited Retail Group Competitive Ranking Model Current Net Supportable Sales Future Sales $842,576 Net Supportable Sales with Future Development $842,576 Net Supportable with Future Development as % of Future Sales Annual Sales Impacts North Shore West Shore Squaw / Alpine Northstar Area Truckee Area Total Impact as % of Total Sales North Shore West Shore Squaw / Alpine Northstar Area Truckee Area Source: Goodwin Consulting Group, Inc. Project Buildout Proposed All Planned Project Projects $32,041,145 $5,673,000 $119,666,372 $35,704,250 $26,368,145 465% $83,962,122 235% $7,246,208 $6,038,506 $4,025,671 $4,528,880 $4,528,880 $26,368,145 $23,073,560 $19,227,967 $12,818,645 $14,420,975 $14,420,975 $83,962,122 Competitive Ranking 5 6 9 8 8 $231,548 $192,956 $128,638 $144,717 $144,717 $842,576 Estimated Annual Sales $5,671,936 $20,961,350 $6,696,661 $7,501,642 $45,027,809 128% 29% 60% 60% 10% 407% 92% 191% 192% 32% 04/15/2015 Table A-14.3 Placer County Village at Squaw Valley Specific Plan Economic Impact and Urban Decay Analysis Impacts on Competing Restaurant & Drinking Places Competitive Ranking Model Current Net Supportable Sales Future Sales ($1,426,065) Net Supportable Sales with Future Development ($1,426,065) Net Supportable with Future Development as % of Future Sales Annual Sales Impacts North Shore West Shore Squaw / Alpine Northstar Area Truckee Area Total Impact as % of Total Sales North Shore West Shore Squaw / Alpine Northstar Area Truckee Area Source: Goodwin Consulting Group, Inc. Project Buildout Proposed All Planned Project Projects $45,321,175 $9,695,124 $225,259,188 $46,092,200 $35,626,051 367% $179,166,988 389% $9,790,365 $8,158,638 $5,439,092 $6,118,978 $6,118,978 $35,626,051 $49,236,730 $41,030,608 $27,353,739 $30,772,956 $30,772,956 $179,166,988 Competitive Ranking 5 6 9 8 8 ($391,896) ($326,580) ($217,720) ($244,935) ($244,935) ($1,426,065) Estimated Annual Sales $23,789,363 $32,488,941 $20,565,439 $28,858,168 $45,383,413 41% 25% 26% 21% 13% 207% 126% 133% 107% 68% 04/15/2015 Table A-15.1 Placer County Village at Squaw Valley Specific Plan Economic Impact and Urban Decay Analysis Impacts on Competing Grocery / Market Distance Model Current Net Supportable Sales Future Sales ($1,294,167) Net Supportable Sales with Future Development ($1,294,167) Net Supportable with Future Development as % of Future Sales Annual Sales Impacts North Shore West Shore Squaw / Alpine Northstar Area Truckee Area Total Impact as % of Total Sales North Shore West Shore Squaw / Alpine Northstar Area Truckee Area Project Buildout Proposed All Planned Project Projects $56,589,640 $2,150,000 $160,361,551 $29,885,000 $54,439,640 2,532% $130,476,551 437% $9,668,820 $16,038,538 $8,079,603 $7,994,585 $12,658,094 $54,439,640 $24,228,924 $40,190,688 $14,303,758 $20,033,490 $31,719,692 $130,476,551 Miles from Project Center 15.7 9.5 0.0 19.0 12.0 ($750,095) ($1,244,250) $2,302,387 /1 ($620,210) ($981,999) ($1,294,167) Estimated Annual Sales $29,958,857 $45,596,857 $2,893,429 $141,300 $59,693,451 32% 35% 279% 5,658% 21% 81% 88% 494% 14,178% 53% /1 Based on the average retail sales impacts estimated in the Proportional Demand, Proportional Supply, and Competitive Ranking models. Source: Goodwin Consulting Group, Inc. 04/15/2015 Table A-15.2 Placer County Village at Squaw Valley Specific Plan Economic Impact and Urban Decay Analysis Impacts on Competing Limited Retail Group Distance Model Current Net Supportable Sales Future Sales $842,576 Net Supportable Sales with Future Development $842,576 Net Supportable with Future Development as % of Future Sales Annual Sales Impacts North Shore West Shore Squaw / Alpine Northstar Area Truckee Area Total Impact as % of Total Sales North Shore West Shore Squaw / Alpine Northstar Area Truckee Area Project Buildout Proposed All Planned Project Projects $32,041,145 $5,673,000 $119,666,372 $35,704,250 $26,368,145 465% $83,962,122 235% $4,538,415 $7,528,275 $4,607,363 $3,752,552 $5,941,540 $26,368,145 $15,543,437 $25,783,292 $9,434,483 $12,851,965 $20,348,945 $83,962,122 Miles from Project Center 15.7 9.5 0.0 19.0 12.0 ($36,728) ($60,924) $1,018,678 /1 ($30,368) ($48,083) $842,576 Estimated Annual Sales $5,671,936 $20,961,350 $6,696,661 $7,501,642 $45,027,809 80% 36% 69% 50% 13% 274% 123% 141% 171% 45% /1 Based on the average retail sales impacts estimated in the Proportional Demand, Proportional Supply, and Competitive Ranking models. Source: Goodwin Consulting Group, Inc. 04/15/2015 Table A-15.3 Placer County Village at Squaw Valley Specific Plan Economic Impact and Urban Decay Analysis Impacts on Competing Restaurant & Drinking Places Distance Model Current Net Supportable Sales Future Sales ($1,426,065) Net Supportable Sales with Future Development ($1,426,065) Net Supportable with Future Development as % of Future Sales Annual Sales Impacts North Shore West Shore Squaw / Alpine Northstar Area Truckee Area Total Impact as % of Total Sales North Shore West Shore Squaw / Alpine Northstar Area Truckee Area Project Buildout Proposed All Planned Project Projects $45,321,175 $9,695,124 $225,259,188 $46,092,200 $35,626,051 367% $179,166,988 389% $6,011,144 $9,971,223 $6,803,830 $4,970,266 $7,869,588 $35,626,051 $34,570,336 $57,344,915 $13,409,213 $28,584,203 $45,258,321 $179,166,988 Miles from Project Center 15.7 9.5 0.0 19.0 12.0 ($320,200) ($531,144) $109,227 /1 ($264,754) ($419,195) ($1,426,065) Estimated Annual Sales $23,789,363 $32,488,941 $20,565,439 $28,858,168 $45,383,413 25% 31% 33% 17% 17% 145% 177% 65% 99% 100% /1 Based on the average retail sales impacts estimated in the Proportional Demand, Proportional Supply, and Competitive Ranking models. Source: Goodwin Consulting Group, Inc. 04/15/2015 Table A-16.1 Placer County Village at Squaw Valley Specific Plan Economic Impact and Urban Decay Analysis Impacts on Competing Grocery / Market Estimated Average Impacts Current Net Supportable Sales Future Sales ($1,294,167) Net Supportable Sales with Future Development ($1,294,167) Net Supportable with Future Development as % of Future Sales Project Buildout Proposed All Planned Project Projects $56,589,640 $2,150,000 $160,361,551 $29,885,000 $54,439,640 2,532% $130,476,551 437% $9,232,403 $10,190,509 $8,079,603 $6,812,599 $20,124,525 $54,439,640 $27,235,487 $30,337,998 $14,303,758 $18,246,155 $40,353,153 $130,476,551 Annual Sales Impacts (Proportional Demand + Proportional Sales + Competitive Ranking + Distance) ÷ 4 North Shore West Shore Squaw / Alpine Northstar Area Truckee Area Total Impact as % of Total Sales North Shore West Shore Squaw / Alpine Northstar Area Truckee Area Source: Goodwin Consulting Group, Inc. ($1,845,651) ($4,629,731) $2,302,387 $1,926,916 $951,912 ($1,294,167) Estimated Annual Sales $29,958,857 $45,596,857 $2,893,429 $141,300 $59,693,451 31% 22% 279% 4,821% 34% 91% 67% 494% 12,913% 68% 04/15/2015 Table A-16.2 Placer County Village at Squaw Valley Specific Plan Economic Impact and Urban Decay Analysis Impacts on Competing Limited Retail Group Estimated Average Impacts Current Project Buildout Proposed All Planned Project Projects Net Supportable Sales Future Sales $842,576 $32,041,145 $5,673,000 $119,666,372 $35,704,250 Net Supportable Sales with Future Development Net Supportable with Future Development as % of Future Sales $842,576 $26,368,145 465% $83,962,122 235% $7,307,739 $5,394,697 $4,607,363 $3,009,762 $6,048,583 $26,368,145 $20,797,966 $20,270,923 $9,434,483 $12,688,268 $20,770,482 $83,962,122 Annual Sales Impacts (Proportional Demand + Proportional Sales + Competitive Ranking + Distance) ÷ 4 North Shore West Shore Squaw / Alpine Northstar Area Truckee Area Total Impact as % of Total Sales North Shore West Shore Squaw / Alpine Northstar Area Truckee Area Source: Goodwin Consulting Group, Inc. $3,290,578 ($687,629) $1,018,678 $271,038 ($3,050,089) $842,576 Estimated Annual Sales $5,671,936 $20,961,350 $6,696,661 $7,501,642 $45,027,809 129% 26% 69% 40% 13% 367% 97% 141% 169% 46% 04/15/2015 Table A-16.3 Placer County Village at Squaw Valley Specific Plan Economic Impact and Urban Decay Analysis Impacts on Competing Restaurant & Drinking Places Estimated Average Impacts Net Supportable Sales Future Sales Current Project Buildout Proposed All Planned Project Projects ($1,426,065) $45,321,175 $9,695,124 $225,259,188 $46,092,200 $35,626,051 367% $179,166,988 389% $9,314,548 $7,162,104 $7,855,372 $1,983,533 $9,310,494 $35,626,051 $45,499,105 $43,373,999 $21,502,781 $28,876,416 $39,764,333 $179,016,632 Net Supportable Sales with Future Development ($1,426,065) Net Supportable with Future Development as % of Future Sales Annual Sales Impacts (Proportional Demand + Proportional Sales + Competitive Ranking + Distance) ÷ 4 North Shore West Shore Squaw / Alpine Northstar Area Truckee Area Total Impact as % of Total Sales North Shore West Shore Squaw / Alpine Northstar Area Truckee Area Source: Goodwin Consulting Group, Inc. $2,954,786 ($867,104) ($42,320) ($2,839,808) ($631,620) ($1,426,065) Estimated Annual Sales $23,789,363 $32,488,941 $20,565,439 $28,858,168 $45,383,413 39% 22% 38% 7% 21% 191% 134% 105% 100% 88% 04/15/2015 Table A-17 Placer County Village at Squaw Valley Specific Plan Economic Impact and Urban Decay Analysis Summary of Retail Sales Impacts /1 Retail Cluster Grocery / Market Limited Retail Group Project Buildout Proposed All Planned Project Projects Project Buildout Proposed All Planned Project Projects Restaurant & Drinking Places Project Buildout Proposed All Planned Project Projects North Shore +31% +91% +129% +367% +39% +191% West Shore +22% +67% +26% +97% +22% +134% Squaw / Alpine +279% +494% +69% +141% +38% +105% Northstar Area +4,821% +12,913% +40% +169% +7% +100% Truckee Area +34% +68% +13% +46% +21% +88% /1 A positive result indicates the amount that sales are expected to increase; a negative result indicates the amount that sales are expected to decrease. Source: Goodwin Consulting Group, Inc. 04/15/2015 Table A-18 Placer County Village at Squaw Valley Specific Plan Economic Impact and Urban Decay Analysis Applicable Retail Leakage Analysis by Retail Cluster at Project Buildout Demand vs. Supply Project Buildout Demographics Number of Occupied Households Mean Household Income Blended Capture Rate Income Expenditure on Applicable Retail Categories Local Demand 17,168 $144,247 85% 18.0% $377,862,356 Number of Visitor Days per Year Average Daily Spending per Visitor Blended Capture Rate Spending Expenditure on Applicable Retail Categories Visitor Demand 9,424,926 $155 86% 40.1% $502,653,372 Total Demand for Applicable Retail $880,515,727 Supply of Applicable Retail (Including Existing and Proposed) $486,910,066 Capture/(Leakage) ($393,605,661) Ratio of Supply vs. Demand Source: California State Board of Equalization; Claritas; Placer County; Dean Runyan Associates; NLTRA; Census; Town of Truckee; EPS; Goodwin Consulting Group, Inc. 0.55 04/15/2015 APPENDIX B HOTEL AND CONDO HOTEL ANALYSIS General Assumptions, Methodology, and Summary Tables Table B-1 Placer County Village at Squaw Valley Specific Plan Economic Impact and Urban Decay Analysis Trade Area Hotel, Motel, and Rented Condo Supply Location Type Open/ Renovation Date Kings Beach Carnelian Bay Tahoe Vista Kings Beach Tahoe Vista Tahoe Vista Tahoe Vista Tahoe Vista Kings Beach Kings Beach Kings Beach Tahoe Vista Economy Luxury Economy Upper Midscale Upper Midscale Upscale Upscale Upscale Economy Upper Midscale Upper Midscale Upscale Jun 1976 Jun 1972 Sep 2010 Jun 1956 Jun 1950 Jun 1980 Jun 1993 Jun 1925 Jun 1978 Jun 1997 Jun 1965 Jun 1962 3.3 3.5 4.3 4.0 4.0 4.5 4.0 4.5 2.0 2.0 2.0 3.5 3.4 22 32 31 71 27 60 32 20 22 26 90 28 461 $69 $125 $179 $89 $88 $119 $155 $99 $57 $54 $45 $149 $97 Tahoe City Tahoe City Tahoe City Tahoe City Tahoma Tahoe City Tahoe City Tahoe City Tahoe City Tahoma Tahoe City Economy Upscale Upper Upscale Upper Midscale Upscale Upscale Upscale Upscale Upscale Upscale Economy May 2007 Jun 1938 Jun 1975 Jun 1960 Feb 1932 Jun 1997 Jun 1960 Jun 1907 Jun 1981 -Jun 1930 4.0 4.5 3.8 -3.3 3.5 3.0 3.8 2.8 4.5 4.0 3.4 46 22 50 23 20 51 19 23 33 16 21 324 $118 $160 $378 $189 $125 $155 $115 $150 $59 $119 $84 $166 Squaw/Alpine Squaw/Alpine Squaw/Alpine Squaw/Alpine Luxury Luxury Luxury Luxury Jun 1960 Dec 1990 -Jun 2002 3.8 4.0 4.0 3.5 3.9 61 357 131 178 727 $318 $279 $275 $246 $273 Northstar Ritz-Carlton Lake Tahoe Subtotal/Wtg Average Northstar Luxury Dec 2009 4.3 4.3 170 170 $269 $269 Truckee Donner Lake Village Hampton Inn Suites Tahoe Hotel Truckee Tahoe Inn @ Truckee Sunset Inn The Cedar House Sport Hotel Truckee Donner Lodge Truckee Hotel Subtotal/Wtg Average Truckee Truckee Truckee Truckee Truckee Truckee Truckee Truckee Upper Midscale Upper Midscale Upscale Midscale Economy Upscale Upscale Economy Jun 1978 Jun 2005 May 2013 Jun 1999 Jun 1963 May 2006 Jun 2010 -- 3.8 4.3 3.5 3.0 5.0 4.5 3.8 3.0 3.8 64 109 100 42 20 42 64 37 478 $169 $154 $175 $155 -$190 $84 $79 $142 North Shore Big 7 Motel Carnelian Woods Lodge Cedar Glen Lodge Ferrari`s Crown Resort Firelite Lodge Franciscan Lakeside Lodge Mourelatos Lake Resort Rustic Cottage Resort Stevenson`s Holliday Inn Sun N Sand Lodge Tahoe Inn Tahoe Vistana Inn Subtotal/Wtg Average West Shore Americas Best Value Inn Cottage Inn @ Lake Tahoe Granlibakken Resort Lake Of The Sky Motor Inn Meeks Bay Resort & Marina Pepper Tree Inn River Ranch Lodge Sunnyside Resort Tahoe City Inn Tahoma Meadows B&B Cottages Tamarack Lodge Motel Subtotal/Wtg Average Squaw/Alpine Plump Jack Squaw Valley Inn Resort @ Squaw Creek Squaw Valley Lodge Village @ Squaw Valley Subtotal/Wtg Average Star Rating Total Hotel/Motel Rooms Wtg Average Daily Rate Rented Condo Rooms /1 Rooms Average Daily Rates 2,160 $190 Various -- -- -- Total Hotel/Motel & Rented Condo 2,179 -- 4,339 /1 Assumes 1,540 gross units, which are subsequently adjusted to exclude condo units at the Squaw Valley Lodge. The adjusted condo count totals approximately 1,453 rented condos at 1.5 bedrooms per unit. Source: Smith Travel Research, Inc.; Dean Runyan Associates; Placer County; Internet Research on Hotel Rates; Yelp; Trip Advisor; Goodwin Consulting Group, Inc. 04/15/2015 Table B-2 Placer County Village at Squaw Valley Specific Plan Economic Impact and Urban Decay Analysis Historical Hotel/Motel Monthly Occupancy Rates within Trade Area 2010 2011 2012 2013 2014 Average January February March April May June July August September October November December 46% 51% 49% 39% 33% 46% 62% 59% 51% 45% 35% 49% 47% 53% 54% 48% 37% 44% 65% 63% 55% 40% 32% 40% 40% 49% 53% 43% 39% 53% 65% 64% 52% 42% 37% 50% 52% 58% 53% 35% 44% 58% 69% 69% 57% 46% 33% 43% 44% 50% 49% 42% 42% 58% 71% 71% 56% 50% 35% /1 46% /1 46% 52% 52% 41% 39% 52% 67% 65% 54% 45% 35% 46% Average 47% 48% 49% 51% 51% 49% /1 Estimated based on data from prior periods. Source: Smith Travel Research, Inc.; Goodwin Consulting Group, Inc. 04/15/2015 Table B-3 Placer County Village at Squaw Valley Specific Plan Economic Impact and Urban Decay Analysis Daily Hotel/Motel Occupancy Rates within Trade Area Full Year February 2014 August 2014 Sunday Monday Tuesday Wednesday Thursday Friday Saturday 41% 45% 48% 48% 50% 58% 65% 42% 41% 43% 47% 52% 61% 66% 65% 63% 64% 64% 66% 81% 89% Average 51% 50% 70% Source: Smith Travel Research, Inc.; Goodwin Consulting Group, Inc. 04/15/2015 Table B-4 Placer County Village at Squaw Valley Specific Plan Economic Impact and Urban Decay Analysis Historical Hotel/Motel Average Daily Room Rates within Trade Area 2010 2011 2012 2013 2014 Average January February March April May June July August September October November December $177 $190 $157 $122 $97 $115 $147 $140 $123 $118 $105 $209 $178 $192 $165 $142 $105 $119 $156 $147 $131 $107 $111 $223 $181 $206 $172 $139 $115 $131 $153 $150 $135 $114 $119 $235 $211 $236 $193 $118 $111 $130 $167 $166 $144 $120 $121 $249 $225 $225 $185 $140 $121 $142 $178 $177 $140 $128 $127 /1 $261 /1 $195 $210 $174 $132 $110 $127 $160 $156 $135 $118 $117 $235 Average $142 $148 $154 $164 $171 $156 /1 Estimated based on data from prior periods. Source: Smith Travel Research, Inc.; Goodwin Consulting Group, Inc. 04/15/2015 Table B-5 Placer County Village at Squaw Valley Specific Plan Economic Impact and Urban Decay Analysis Planned Lodging Projects by Retail Cluster Condo/Resort Units Hotel Rooms Tahoe Basin Homewood Mountain Resort Placer County /1 Subtotal Total Units % Condo/ Resort Units Average Rooms per Unit Total Condo/ Resort Rooms Total Rooms 75 279 354 221 -221 50% 1.50 166 -166 241 279 520 Squaw/Alpine (Excluding Proposed Project) Resort at Squaw Creek Phase 2 PlumpJack Redevelopment Forecast Development Subtotal ----- 441 104 34 579 100% 100% 100% 1.05 1.00 1.53 464 104 52 620 464 104 52 620 Northstar Martis Valley West Parcel Highlands Phase II Subtotal ---- 872 386 1,258 50% 100% 1.50 1.50 654 579 1,233 654 579 1,233 Truckee Truckee Railyard Master Plan Coldstream Specific Plan Subtotal 60 100 160 ---- ---- 60 100 160 Total (Excluding Proposed Project) 514 2,058 2,019 2,533 -- 772 1,323 1,323 514 2,830 3,342 3,856 Proposed Project Total 100% 1.71 /1 Reflects total rooms from potential swap with the City of South Lake Tahoe, including TRPA bonus units. Source: Placer County; Goodwin Consulting Group, Inc. 04/15/2015 Table B-6 Placer County Village at Squaw Valley Specific Plan Economic Impact and Urban Decay Analysis Trade Area Transient Occupancy Tax Revenues Fiscal Year Ending --> Placer County North Lake Tahoe Area Truckee Total 2010 2011 2012 2013 2014 2015 Est. $8,700,662 $1,431,928 $10,054,110 $1,436,129 $9,734,905 $1,350,699 $11,238,343 $1,718,415 $11,585,872 $1,650,000 $10,333,333 $1,650,000 $10,132,590 $11,490,239 $11,085,604 $12,956,758 $13,235,872 $11,983,333 % Change from Prior Period Source: Placer County; Town of Truckee; Goodwin Consulting Group, Inc. 13% -4% 17% 2% -9% 04/15/2015 Table B-7 Placer County Village at Squaw Valley Specific Plan Economic Impact and Urban Decay Analysis Trade Area Room Revenues Fiscal Year Ending --> Placer County North Lake Tahoe Area Truckee Total 2010 2011 2012 2013 2014 2015 Est. $87,010,000 $14,320,000 $100,540,000 $14,360,000 $97,350,000 $13,510,000 $112,380,000 $17,180,000 $115,860,000 $16,500,000 $103,330,000 $16,500,000 $101,330,000 $114,900,000 $110,860,000 $129,560,000 $132,360,000 $119,830,000 % Change from Prior Period Source: Placer County; Town of Truckee; Goodwin Consulting Group, Inc. 13% -4% 17% 2% -9% 04/15/2015 Table B-8 Placer County Village at Squaw Valley Specific Plan Economic Impact and Urban Decay Analysis Lodging Demand and Absorption Current Trade Area Hotel/Condo Room Revenue Average Annual Increase in Visitor-Days Project Buildout /1 Proposed All Planned Project Projects /2 $119,830,000 4.0% $188,320,000 $319,450,000 Trade Area Room Revenue per Day $328,301 $515,945 $875,205 Estimated Average Daily Room Rate $180 $180 $180 Total Rooms Supportable at 100% Occupancy Rate 1,819 2,859 4,849 Supply Number of Rooms in Existing Hotels/Condos in Trade Area Number of Rooms in New Hotels/Condos in Trade Area Total 4,339 0 4,339 4,339 1,323 5,662 4,339 3,856 8,195 Implied Occupancy Rate 42% 50% 59% /1 Buildout of all planned projects is assumed to occur in 2040. /2 Includes the proposed project. Source: NLTRA; Smith Travel Research, Inc.; Dean Runyan Associates; Goodwin Consulting Group, Inc. 04/15/2015 APPENDIX C SAMPLE PHOTOS BY RETAIL CLUSTER North Shore .................................................... Page 1 West Shore ................................................... Page 12 Squaw/Alpine ............................................... Page 18 Northstar Area ............................................. Page 23 Truckee Area ................................................ Page 26 NORTH SHORE Appendix C – Page 1 of 31 Business: 7 Eleven Street: North Lake Boulevard Business: The Stress Manager; Adventure Smith Explorations; Facial Studio & Wax Bar Street: North Lake Boulevard Appendix C – Page 2 of 31 Business: The Old Post Office Cafe Street: North Lake Boulevard Business: 7 Eleven; Laundroland – Coin of Laundry Street: North Lake Boulevard Appendix C – Page 3 of 31 Business: Jiffy’s Pizza; Feeling Vague Vintage; Transformations Salon Street: North Lake Boulevard Business: El Sancho Taqueria Street: North Lake Boulevard Appendix C – Page 4 of 31 Business: Cedar Glen Lodge Street: North Lake Boulevard Business: Tahoe Vistana Inn Street: North Lake Boulevard Appendix C – Page 5 of 31 Business: Kings Beach Liquor; Boneteria Rosita; Hit the Road; Noah’s Video & Smoke Shop Street: North Lake Boulevard Business: Taco Bell; Tahoe Central Market & Deli; Tahoe Bike & Ski; China Express Take Out Street: North Lake Boulevard Appendix C – Page 6 of 31 Business: Sun n Sand Lodge Street: North Lake Boulevard Business: Watermans Landing – Beach Cafe Street: North Lake Boulevard Appendix C – Page 7 of 31 Business: Fire Lite Lodge Street: North Lake Boulevard Business: Safeway Street: North Lake Boulevard Appendix C – Page 8 of 31 Business: North Shore Ace Hardware Street: Secline Street Business: Ferrari’s Crown Resort Street: North Lake Boulevard Appendix C – Page 9 of 31 Business: Sierra Shirts and Shades Street: North Lake Boulevard Business: Char-Pit Street: North Lake Boulevard Appendix C – Page 10 of 31 Business: Caliente Street: North Lake Boulevard Appendix C – Page 11 of 31 WEST SHORE Appendix C – Page 12 of 31 Business: Tahoe City Kayak; Poppy’s Frozen Yogurt; Zia Lina Ristorante; L. Massage Spa Street: North Lake Boulevard Business: Tahoe Rug Studio; Tahoe T-Shirtery; Bluestone Jewelry, Glass and Art; Kalifornia Jean Bar Street: North Lake Boulevard Appendix C – Page 13 of 31 Business: Pepper Tree Inn Tahoe Street: North Lake Boulevard Business: Tahoe City Inn Street: North Lake Boulevard Appendix C – Page 14 of 31 Business: Save Mart - Supermarket Street: West River Road Business: Tahoe Dave’s Skis & Boards; Bove Blow Dry Bar (Hair Salon); Olympic Bike Shop Street: North Lake Boulevard Appendix C – Page 15 of 31 Business: Safeway; Lakeside Pizza; Lighthouse Spa; Gardtman Skiing International Street: North Lake Boulevard Business: North Lake Tahoe Visitor Center; Willard’s Sport Shop Street: West River Road Appendix C – Page 16 of 31 Business: Granlibakken Street: Granlibakken Road Appendix C – Page 17 of 31 SQUAW/ALPINE Appendix C – Page 18 of 31 Business: Crest Café & Catering; Tahoe Riverfront Realty; Alpine Rental Group Street: Alpine Meadows Road Business: River Ranch Dining Cocktails Street: Alpine Meadows Road & River Road Appendix C – Page 19 of 31 Business: Alpine Meadows Ski Resort Street: Alpine Meadows Road Business: Rocker; The North Face Street: Squaw Valley Road Appendix C – Page 20 of 31 Business: The Villages at Squaw Valley Street: Squaw Valley Road Business: The Village at Squaw Valley Street: Squaw Valley Road Appendix C – Page 21 of 31 Business: High Camp Cable Car Street: Squaw Valley Road Appendix C – Page 22 of 31 NORTHSTAR AREA Appendix C – Page 23 of 31 Business: Northstar Lodge by Welk Resorts Street: North Shore Road Business: Tahoe Mountain Resorts Lodging Street: Northstar Drive Appendix C – Page 24 of 31 Business: The Village Cinemas; Euro Gelato Ice Cream, Sorbet & Italian Gelato; Euro Snack; Kalifornia Jean Bar; Starbucks; Patagonia; TC’s Pub; Ambassador Toys; Shoe; Rubicon Pizza; Specialty Sports Venture; All Fired Up!; The Chocolate Bar; The North Face; Helly Hansen; Freckles Children’s Boutique; Euro Sweets; Mikuni at Northstar; Northstar Logo Company; Ethos Gallery Street: Northstar Drive Business: Tahoe Mountain Resorts Lodging Street: Northstar Drive Appendix C – Page 25 of 31 TRUCKEE AREA Appendix C – Page 26 of 31 Business: Truckee Variety Co.; Kalifornia Jean Bar; Pianeta Ristorante; Past Time Club Street: Donner Pass Road Business: Jiffy’s Pizza; Laundromat; The Back Country; Treat Box Bakery Street: Donner Pass Road Appendix C – Page 27 of 31 Business: Hotel Truckee Tahoe Street: Old Brockway Road Business: JoAnne’s Stained Glass & Gallery; Squeeze In (Breakfast) Street: Donner Pass Road Appendix C – Page 28 of 31 Business: Tree House (Toy Store); Cabona’s (Women’s Clothing Store) Street: Donner Pass Road Business: Lululemon Athletica Street: Donner Pass Road Appendix C – Page 29 of 31 Business: Urban Angels Salon; Coffeebar Street: Jibboom Street Business: Linda’s Nails & Spa Street: Donner Pass Road Appendix C – Page 30 of 31 Business: Rite Aid Pharmacy Street: Donner Pass Road Business: Safeway; Verizon Wireless Street: Donner Pass Road Appendix C – Page 31 of 31


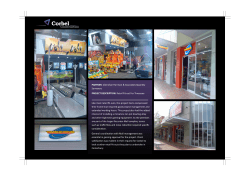
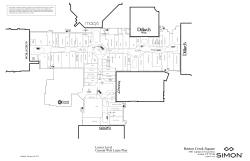

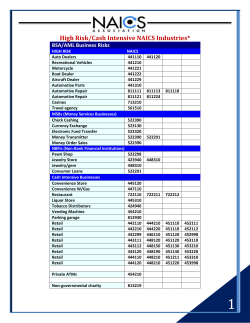

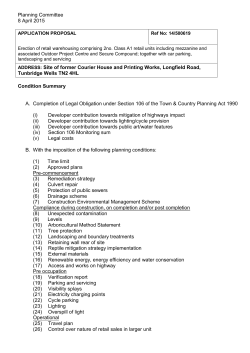

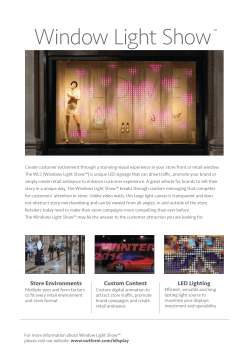
© Copyright 2026