
W O R L D ’ S B... DESERVE EVEN BIGGER SOLUTIONS.
FINANCIAL AND CORPORATE RESPONSIBILITY PERFORMANCE
2012 ANNUAL REPORT
THE
WORLD’S BIGGEST CHALLENGES
DESERVE EVEN BIGGER SOLUTIONS.
{ P OWERFUL ANSWERS }
FINANCIAL HIGHLIGHTS
$106.6
$110.9
$115.8
$33.4
$29.8
$31.5
$0.90
$0.85
$2.20
$2.15
10
11
$2.24
$2.030
$1.925 $1.975
$0.31
10
11
12
CONSOLIDATED
REVENUES
(BILLIONS)
10
11
12
CASH FLOWS
FROM OPERATING
ACTIVITIES
(BILLIONS)
10
11
12
REPORTED
DILUTED EARNINGS
PER SHARE
12
ADJUSTED
DILUTED EARNINGS
PER SHARE
(NON-GAAP)
10
11
12
DIVIDENDS
DECLARED PER
SHARE
C O R P O R AT E H I G H L I G H T S
•$15.3billioninfreecashflow(non-GAAP)
•8.4%growthinwirelessretailservicerevenue
•4.5%growthinoperatingrevenues
•607,000FiOSInternetsubscribernetadditions
•13.2%totalshareholderreturn
•553,000FiOSVideosubscribernetadditions
•3.0%annualdividendincrease
•17.2%growthinFiOSrevenue
•5.9millionwirelessretailconnectionnetadditions
•6.3%growthinEnterpriseStrategicServicesrevenue
•0.91%wirelessretailpostpaidchurn
Note: Prior-period amounts have been reclassified to reflect comparable results.
See www.verizon.com/investor for reconciliations to U.S. generally accepted accounting principles (GAAP) for the non-GAAP financial measures included in this annual report.
In keeping with Verizon’s commitment to protect the environment, this report was printed on paper certified by the Forest Stewardship Council (FSC). By selecting FSC-certified paper, Verizon is
making a difference by supporting responsible forest management practices.
CHAIRMAN’S LETTER
Dear Shareowner,
2012 was a year of accelerating momentum, for Verizon and the communications industry.
The revolution in mobile, broadband and cloud networks picked up steam—continuing to
disrupt and transform huge sectors of our society, from finance to entertainment to
healthcare. To compete and grow in such a dynamic environment requires a commitment to
innovation, a focus on continuous improvement and service excellence, a rigorous attention
to building shareholder value and a deep belief in the social benefits of our empowering
technology.
Over the past year we demonstrated our leadership on all these fronts.
At the core of our growth strategy is our commitment to using our technology to address
the world’s big challenges. How can we improve the lives of our customers? How can
technology make businesses more efficient? How will innovation in healthcare, education
and energy management transform society for the better? As you will see in this report,
Verizon’s networks provide a platform for answering these questions in new and powerful
ways—creating new growth opportunities for our company and expanding our positive
impact on society.
1
SUPERIOR NETWORKS
$75.9
At Verizon we have always believed that innovation in networks is the foundation
$70.2
for growth across the whole industry. Our strength rests on having the best, most reliable
$63.4
wireless, broadband and global Internet networks in the industry, and over the years
we have consistently invested our capital to reinforce and extend our lead and get ahead
of the trends that are driving growth in our industry.
The importance of this strategy has never been more evident than in 2012.
Explosive demand for mobile data is arguably the biggest driver of growth in the technology
industry today. Verizon helped usher in this innovative era in 2010 with the launch of our
10
11
12
4G LTE wireless network, which delivers the speed and capacity required for wireless data
WIRELESS REVENUE
(BILLIONS)
and video, and we have led the industry in deploying this vital resource across the U.S. As of
January 22, 2013, Verizon’s 4G LTE network covered nearly 89 percent of the U.S. population,
and we expect to cover nearly our entire 3G network footprint by the end of this year. To
further support the increased bandwidth necessary for growth in wireless data, we acquired
additional wireless spectrum in 2012 from a consortium of cable companies, putting us in a
87.5
92.2
strong position to capitalize on this growth trend for the foreseeable future.
98.2
We showed the same commitment to building and reinforcing our core assets in our wireline
networks. With data traffic on the Internet backbone multiplying rapidly, we expanded the
capacity of our global Internet network, connecting most of the major cities in the U.S. and
the busiest routes in Europe and Asia with networks that can deliver 100 gigabits per second
(Gbps) speeds. We also continue to redefine our residential broadband network around
fiber with our innovative FiOS network, which takes fiber all the way to customers’ homes.
Not only does FiOS transform our customers’ broadband experience, it also is far more
10
11
efficient than the legacy copper network. FiOS now reaches about two-thirds of our wireline
12
footprint, and we’re systematically upgrading customers from copper to the fiber platform
WIRELESS RETAIL
CONNECTIONS
(MILLIONS)
$125.75
$134.51
that provides better service for them and lower costs for us.
$144.04
2012 TOTAL RETURN
VERIZON
S&P 500
30%
16.0%
13.2%
10%
10
11
12
WIRELESS RETAIL
POSTPAID ARPA
-10%
12/31/11
2
2/29/12
4/30/12
6/30/12
8/31/12
10/31/12
12/31/12
V E R I ZO N CO M M U N I C AT I O N S I N C . 2 0 1 2 A N N UA L R E P O R T
INNOVATIVE PRODUCTS AND SERVICES
5.4
4.8
Building on our cornerstone of network excellence, we are delivering a steady stream of
innovative products that are shifting our center of gravity toward growth markets. Meeting
4.1
customer demand for wireless data and smartphones, we launched dozens of 4G LTE phones
and Internet devices. We revolutionized wireless pricing with our new “Share Everything”
plans, which allow customers to share text, talk and data among up to ten different devices.
This is accelerating the adoption of these new devices and helped push smartphone
penetration to 58 percent by the end of 2012. Our commitment to quality has been
recognized by J. D. Power, which has rated Verizon Wireless number-one in customer service
10
11
12
in four consecutive surveys.
FiOS is proving to be another platform for growth, with its Internet and video services
FiOS INTERNET
SUBSCRIBERS
(MILLIONS)
accounting for 68 percent of consumer wireline revenues. We are leveraging the tremendous
capabilities of fiber-optics with FiOS Quantum, which delivers speeds of up to 300 megabits
per second (Mbps) and was named by PCMag.com the fastest residential broadband service
in the country. With customers connecting an increasing array of computers, game players,
televisions and other devices in the home to their broadband connection, we believe
4.7
4.2
the virtually unlimited capacity of fiber will give us a sustainable competitive edge in the
consumer market.
3.5
In our enterprise business, we are building or acquiring the platforms to ride on our network
that will enable us to deliver the services that global enterprises require. For example,
we acquired two companies in 2011, Terremark and CloudSwitch, that give us a core
competency in the fast-growing market for enterprise cloud and security services. Another
key acquisition is Hughes Telematics, Inc. (HTI), a leading provider of machine-to-machine,
fleet and connected car services. As Internet connectivity is built into electronic equipment,
10
11
12
appliances, buildings and utility grids, new technology solutions are emerging in such fields
as healthcare, energy, transportation and e-commerce. Verizon will use the HTI machine-to-
FiOS VIDEO
SUBSCRIBERS
(MILLIONS)
machine platform to be a big player in these emerging growth markets.
All of these initiatives are transforming our growth profile. Consumer wireline revenues grew
by 3.2 percent for the year—the best in a decade—fueled by double-digit growth in FiOS.
Wireless had 5.9 million retail connection net additions—with fourth-quarter net adds in
$7.6
$8.1
$6.6
retail postpaid the highest in our history—for an industry leading total of 98.2 million retail
connections, and saw total operating revenues increase by 8.1 percent. Despite continuing
economic challenges in global markets, revenues from strategic business services grew by
6.3 percent.
TRANSFORMING THE BUSINESS THROUGH STRATEGIC PARTNERSHIPS
With technology permeating every corner of business and society, no single company can
deliver everything customers want and need without having great partners. At Verizon,
partnerships are a fundamental piece of our growth strategy, helping us branch into new
10
11
12
VERIZON WIRELINE
STRATEGIC SERVICES
REVENUE
(BILLIONS)
markets, stimulate innovation and broaden our geographic reach.
In 2012, we took several major steps to create strategic advantages through collaboration.
3
Today’s customers want to be able to access video content on any screen — TV, personal
$16.5
$16.2
$16.2
computer, tablet or cellphone — wherever and whenever it’s convenient for them.
To address this demand, Verizon Wireless is partnering with the nation’s major cable
companies to deliver video solutions on a national scale across our 4G LTE wireless and cable
networks. We are also using this partnership to encourage content developers
and entrepreneurs to develop innovative mobile video services that we can deliver over
these powerful platforms.
In addition, we’re giving customers more video options through a new venture with
Redbox Automated Retail, LLC, a subsidiary of Coinstar, Inc. Our new service, Redbox Instant
10
11
CAPITAL
EXPENDITURES
(BILLIONS)
12
by Verizon, offers on-demand video streaming powered by Verizon’s cloud computing
technologies and IP networks, supplemented by Redbox’s network of more than 42,000 DVD
rental kiosks nationwide.
More broadly, we are helping to stimulate the innovation process that will drive the
transformative power of mobile and machine-to-machine technologies into new markets.
We have two Innovation Centers in Waltham, Massachusetts and San Francisco, California
where we bring entrepreneurs, developers and partners together with Verizon network
engineers in state-of-the-art laboratories to develop new LTE products and get them to
market quickly. This collaboration with more than 125 different partners is producing an
impressive range of exciting new products, services and applications. We demonstrated
more than 60 of these at the 2013 Consumer Electronics Show, with far-ranging applications
in fields such as public safety, healthcare monitoring, mobile video, energy management and
education (for more information, see the “Powerful Answers” section of this report).
With this focused and aggressive innovation program, we not only increase demand for
Verizon’s network services but also give people the tools for solving problems and enhancing
their lives in exciting new ways.
ADDRESSING THE WORLD’S BIGGEST CHALLENGES
Some of the biggest opportunities for Verizon lie in the intersection between our
empowering technology and our society’s deepest needs. For example, we are expanding in
the field of digital healthcare with a mobile health platform that gives clinicians and patients
a better tool for monitoring patients and managing chronic diseases. Our machine-tomachine solutions are helping to modernize electrical and transportation systems, providing
customers with greater control over their energy use. Going forward, we seek to build
additional vertical capabilities centered on technology solutions in such fields as education,
e-commerce and public safety.
We believe that using our talent and technology to address society’s biggest challenges will
both grow our business and change the world for the better. We call this strategy “Shared
Success,” an integrated approach to growth that drives both our business development and
corporate responsibility efforts. As evidence of our disciplined process, we have developed
metrics for tracking the social impact of our technology on the communities we serve, which
we track in this report (see page 20). To increase the impact of our philanthropic resources,
we have refocused the Verizon Foundation on becoming a channel for innovation and
social change. The Foundation is working with leading nonprofit organizations such as the
Children’s Health Fund to test technology solutions in real-world settings and extend access
to new technology into underserved communities.
4
V E R I ZO N CO M M U N I C AT I O N S I N C . 2 0 1 2 A N N UA L R E P O R T
Just as Verizon’s Innovation Program has become an incubator for new business
solutions in the marketplace, the Verizon Foundation aims to become an incubator for
new social solutions.
CREATING SHAREOWNER VALUE
As focused as we are on using our technology to transform the world, we are equally
driven to transform our own business from the inside out. We have implemented Verizon
Lean Six Sigma, a rigorous process improvement model, to identify areas where we can
streamline how we work and eliminate internal barriers that impede productivity and service
excellence. In just the last 18 months, we have removed $4 billion from our cost structure.
Our 2012 results reflect our fundamental financial strength, our commitment to growing
shareowner value and our success in seizing opportunities in our key strategic growth
areas. Revenues totaled $115.8 billion, up 4.5 percent. We generated $31.5 billion in cash flow
from operating activities, an increase of 5.7 percent. With these healthy cash flows,
we invested $16.2 billion in our networks and paid $5.2 billion in dividends, which included
our 6th dividend increase in as many years. Earnings per common share increased 4.2
percent to $2.24 on an adjusted basis. Overall, Verizon’s total return to shareowners for 2012
was 13.2 percent, as compared with 10.2 percent for the Dow Jones Industrial Average
and 16 percent for the S&P 500.
EMPLOYEE DEDICATION
Being a responsible citizen is at the heart of our business, and can be seen in the
commitment of our employees to providing customers with the best possible
service. Nowhere was that dedication more apparent than in the wake of Superstorm
Sandy, which wreaked havoc on the East Coast of the United States. For months,
our employees worked nearly non-stop to restore communications services, rebuild badly
damaged infrastructure and upgrade our networks against future disasters.
The Verizon Credo says “we run to a crisis.” As usual, Verizon employees came through.
I thank each and every one of them for their dedication to our customers and communities.
I am grateful to our Board of Directors for their strategic guidance and support
in helping us build Verizon to be successful for decades to come. I’m confident about
the trajectory of our business and inspired by our potential for making a difference
in the world. Verizon is in the center of a powerful transformation, and is well
positioned to create long-term value for our customers, shareowners and communities.
Lowell McAdam
Chairman and Chief Executive Officer
Verizon Communications Inc.
5
OUR TEC HNO LO GY
ADVANCED WIRELESS TECHNOLOGY
T H AT P O W E R S O U R L I V E S
Verizon’s 4G LTE network is more than just powerful. It’s rebooting the mobile
landscape and transforming the way we experience the digital world.
Our 4G LTE network has made Verizon the industry leader in highspeed wireless access, creating exciting new opportunities for
mobile applications and streaming media and enabling people to
experience a whole new level of connectivity.
CREATING AN INDUSTRY ECOSYSTEM
To drive 4G LTE deeper into the marketplace and accelerate
growth, we’re using Verizon’s Innovation Centers to inspire, enable
and showcase new wireless solutions. By connecting innovators
with technology in state-of-the-art lab environments, we’re
bringing amazing new products to the marketplace — changing
the way we live, work and play.
From groundbreaking wireless devices to specialized services and
apps, our Innovation Program is creating a wide range of new
services that harness the power of our 4G LTE network. As a result,
the impact of 4G LTE has rippled throughout the tech industry.
At the beginning of 2013, Verizon had about 40 4G LTE-enabled
smartphones, tablets and Internet devices in its lineup, produced
6
by the world’s leading manufacturers. We’re also seeing a new
generation of advanced electronics with LTE connectivity coming
to the market, including video cameras, energy monitors and
medical devices. Through collaboration we’re bringing amazing
new products to the marketplace and changing the way we
communicate.
A TRUE GAME-CHANGER
4G LTE is a true game-changer in today’s wireless world. It can help
kids attend school, even when they physically can’t. It can help
remote workers collaborate with experts and get critical business
information quickly. LTE connections can also help patients in
rural areas get the care they need from doctors and specialists
thousands of miles away.
Verizon’s 4G LTE technology empowers customers in so many ways
that it stretches the limits of what’s possible. It promises to drive
growth in our economy and provide powerful answers to many of
the challenges facing our communities.
V E R I ZO N CO M M U N I C AT I O N S I N C . 2 0 1 2 A N N UA L R E P O R T
FIBER-OPTIC QUALITY
FOR THE CONNECTED HOME
With Verizon FiOS, customers can enjoy picture-perfect TV, unsurpassed Internet speeds
and crystal clear calls. But our all-fiber network technology is much more than that.
FUTURE-PROOF TECHNOLOGY
Verizon’s fiber network was designed to evolve with our customers’
bandwidth needs. We’re using our technology to help people get
more out of life today while providing for the services they’ll need
tomorrow.
The average home today has seven connected devices, such
as computers, high-definition TVs, game players and DVRs, and
that number is increasing. Our FiOS network is able to handle
bandwidth-intensive applications such as 3D video, high-capacity
telework, smart-energy management, security monitors and inhome healthcare that will continue to accelerate the broadband
needs of the digital household.
A QUANTUM LEAP
Connecting all these devices will require even faster speeds
and higher bandwidth, so last year we launched FiOS Quantum,
offering the nation’s fastest download speeds at up to 300 Mbps.
As our customers demand even more innovative, high-bandwidth
applications that challenge today’s top speeds, our network will
be ready. We’re testing connection speeds of up to 1 gigabit
per second (Gbps) so that we can upgrade our services to meet
our customers’ evolving needs.
ENTERTAINMENT ON-THE-GO
Customers are no longer content with watching video only on
a TV, so we’re bringing the same superior HD quality, entertainment content, speed and reliability to our customers on-the-go
using Verizon cloud computing technology. Verizon is collaborating with Redbox to provide an innovative service called
“Redbox Instant by Verizon” that combines our cloud-based
video streaming capabilities with Redbox’s national DVD kiosks.
Verizon’s innovative technology helps customers make the most
out of their connected lives, whether it’s sending large files from
their home office, streaming a 3-D movie into their living room or
enjoying video chats with loved ones halfway around the world.
7
OUR TEC HNO LO GY
EXPANSIVE HIGH-SPEED
GLOBAL CONNECTIVITY
Verizon’s global IP backbone network was built to handle the explosion in Internet
data and video traffic. It’s the global trade route of the 21st century, shipping digital
cargo efficiently around the world.
GLOBAL IP NETWORK
Verizon maintains more than 800,000 miles of high-speed cables—
enough to circle the earth more than 32 times—and we operate in
more than 150 countries on six continents. Our network is one of
the largest wholly owned, facilities-based networks in the world.
We support businesses and government agencies around the
globe securely and reliably, including 98 percent of the Fortune
1000. Verizon's expansive IP footprint and direct interconnections
around the world enable our customers to reach more destinations
directly through our global IP network than through the networks
of any other service provider.
Verizon’s global network technology supports the enormous
growth in Internet video and data traffic, which helps multinational
corporations interconnect their facilities around the world. We also
provide intelligent networking solutions that securely connect
large business and government customers to the data, machines,
and applications they need to be successful. Our residential, small
business and wireless customers also benefit from one of the
8
most-connected IP networks, with a range of Internet solutions that
have local-or wide-area network requirements.
FASTEST COMMERCIAL SPEEDS AVAILABLE
Verizon’s global backbone network continues to grow to meet our
customers’ evolving needs. During the past three years, we have
connected most of the major cities in the U.S. with speeds of 100
Gbps, and we’re upgrading our busiest routes in Europe and the
Asia Pacific region. We expect to double that speed in trials later
this year.
We’re also pushing 100 Gbps into our metro networks, as we
recently did with our fiber central offices in Lower Manhattan,
driving Ethernet speeds even closer to the customer.
Verizon will carry on its heritage of innovation by advancing its
IP platform and the applications that are changing our everyday
lives. Working in collaboration with the countless people and
machines that touch the IP cloud, the sky remains the limit of our
collective imagination.
V E R I ZO N CO M M U N I C AT I O N S I N C . 2 0 1 2 A N N UA L R E P O R T
WORLD-CLASS
C L O U D D ATA C E N T E R S
Verizon’s networked cloud servers can store anything that can be digitized — from movies to healthcare records — and deliver it anywhere in the world.
200 DATA CENTERS AROUND THE WORLD
Verizon expanded into the cloud space in a big way with our
2011 acquisition of Terremark, giving us a network of 200 worldclass cloud data centers around the globe. We now offer cloudbased services in areas such as mobile commerce, security and
healthcare. We’re also able to give entrepreneurs the tools to build
new businesses and services in the cloud on a global scale.
Verizon Terremark cloud services allow businesses to move
applications, processing and storage that previously existed on
the customer’s network into our securely managed network
servers. These services allow users to access the same data and
applications on any connected device, providing enriched, realtime information exactly when and where it’s needed.
This ability transforms the way companies operate by giving them
a radically more efficient way to do business. It means any kind of
content — even things like education, healthcare and government
services — can be delivered anywhere, anytime and on any device.
THE CONNECTED ENTERPRISE
With the rise of the globally connected enterprise, our customers
need intelligent applications that can run on multiple platforms.
We offer mobile workforces constant access to collaboration tools
and back-end systems to be productive and competitive. We also
help organizations securely manage vast amounts of data so they
can turn it into intelligence that leads to new products, services
and revenue streams.
With technology changing so quickly, we help enterprises
minimize capital investment and accelerate innovation cycles.
Our cloud services also spread resources efficiently and reduce
duplicative investments in equipment, making them a key tool
in helping corporations find sustainable solutions to managing a
global enterprise.
Cloud computing changes the way business is done and Verizon
Terremark is changing the cloud with innovative technology that
spans the globe.
9
POWE R F UL ANSWER S
Last year we launched the Verizon
Innovative Learning School program
in 12 schools in underserved areas
across America. Teachers like these
at the Charles Carroll Middle School
received extensive training on
innovative ways of using technology
in the classroom to help increase
student engagement.
HOW CAN WE USE TECHNOLOGY
TO STRENGTHEN OUR SOCIETY?
Verizon’s innovative technology enhances people’s lives. We address critical needs in
our communities and create long-term growth by sharing our success.
SHARING OUR SUCCESS
Verizon has deep roots in the communities we serve. Our networks
are an engine for economic growth, and our products enhance the
relationships that support our society.
Our advanced technology is providing exciting new opportunities
to find powerful answers to some of the enduring challenges
that face our society, such as, how can we transform healthcare?
Is there a better way to manage our energy usage? How can
we give our students a better education? How can we become
more sustainable?
We can now address these questions in innovative ways, using our
wireless and broadband services to help our communities grow.
This creates a sustainable long-term growth strategy — one that
opens new markets for Verizon, provides value for shareowners and
10
helps solve community problems. Our goal is to take our corporate
responsibility to a higher level of social impact, because we believe
that creating a healthy, sustainable society is the best way to create
a healthy, sustainable business.
BUSINESS AND SOCIAL VALUE METRICS
In 2011, we formalized our strategy for creating business and social
value under the mantle of “Shared Success,” a term that derives
from the Verizon Credo. We made strong progress last year. We laid
the groundwork for our “Powerful Answers” campaign, which helps
us identify and accelerate deployment of technology solutions
that create shared value. We developed a process to capture data
that measures the value of our technology to the communities
we serve. We also revised our philanthropic strategy to use our
technology to address the challenges of underserved communities
V E R I ZO N CO M M U N I C AT I O N S I N C . 2 0 1 2 A N N UA L R E P O R T
and accelerate social change in education, healthcare and
energy management.
In the healthcare market, we created metrics for our mHealth
products. In addition to capturing data on business performance
measures such as revenue and market share, the metrics will help
us understand how our products improve patient outcomes. In
2013 we will work with our healthcare customers to apply these
metrics. The information we collect helps our customers measure
improvements in patient care and helps us demonstrate the
effectiveness of our solutions. We will develop similar measures
for our education and energy products.
A FOUNDATION FOR SOCIAL INNOVATION
2012 was a year of transition for the Verizon Foundation as it
revised its strategy to become a channel for social innovation.
Its new focus is on accelerating social change by combining our
advanced technology with its philanthropic resources to address
challenges in education, healthcare and energy management.
The Verizon Foundation’s programs enable us to better understand
how our technology can benefit society and deliver innovative
solutions that transform lives. This is especially true in underserved
communities, which might experience the most benefit and rapid
improvement from the adoption of Verizon’s newest technologies.
INNOVATIVE SOCIAL SOLUTIONS
Our new philanthropic strategy parallels the corporate strategy of
our Innovation Program. Verizon’s LTE Innovation Centers provide
a wide range of companies with opportunities to generate new
ideas, refine concepts and bring breakthrough products to market
through a process that stimulates innovation and change.
Just as these Innovation Centers are incubators for new products
and applications of technology, the Verizon Foundation aims to
become an incubator for new social solutions. It is collaborating
with leading nonprofit organizations to apply our sophisticated
technology and expertise to address some of the most critical
challenges in education, chronic healthcare and energy efficiency.
By partnering with dynamic, forward-thinking organizations to
design programs to address these urgent problems, the Verizon
Foundation is demonstrating how technology can be used to
engineer positive social change, faster and easier.
TRACKING OUR SUCCESS
As a technology incubator, the Verizon Foundation will track
and measure outcomes and improvements at every stage. It
will evaluate the social value of these initiatives, providing new
insight and research into how best to integrate technology into
solving social problems and scale-up results. In this way, we can
demonstrate how our social investments create new technologybased solutions and validate the ability of our products to address
unmet needs.
To learn more about Verizon’s commitment to shared success, visit
our Corporate Responsibility site at http://responsibility.verizon.com.
Verizon funding is bringing mHealth
solutions to Children’s Health Fund
mobile medical clinics, which provide
healthcare to disadvantaged children
in schools and shelters. Virtual care
technology can overcome access
barriers to remotely connect these
patients to needed specialists.
11
POWE R F UL ANSWER S
Verizon teamed up with NantWorks
to create a new medical database
that uses our 4G LTE network and the
cloud to give doctors unprecedented
access to the latest in cancer research
and treatments.
HOW CAN WE TRANSFORM HEALTHCARE?
We have a tremendous opportunity to use Verizon’s innovative technology to address
healthcare in a powerful new way.
This is a transformational moment for digital healthcare. The
barriers to innovation are finally coming down, and our high-speed
network is able to handle the bandwidth demands of securely
sending critical MRIs, X-rays and CAT scans over the Internet.
Our healthcare-specific solutions touch the entire healthcare
ecosystem, from the biggest institutions all the way to the patient.
To maximize this opportunity, we are working with great partners
to bring safe, secure and effective solutions to market.
MANAGING CHRONIC DISEASES
In 2013 we plan to launch our mHealth platform, which will give
clinicians and patients a better tool for managing chronic diseases
such as congestive heart failure and diabetes. Combined with
our cloud platform, we will have a secure, private way for doctors
to monitor patients between check-ups. This will help keep
12
patients healthier, while reducing medical costs for unexpected
trips to the emergency room. We also have a partnership with a
company called NantWorks that uses a combination of connected
supercomputers, genetic analysis and mobile technology to put
the tools for advanced cancer diagnosis and treatment in the hands
of physicians everywhere.
ENABLING MOBILE HEALTHCARE
Verizon has redesigned the medical alert bracelet by adding
technology. Using Verizon’s 4G LTE network in combination with
Near Field Communication technology, a single tap on a medical
band can quickly retrieve vital medical information. Wearers
can add, update and sync critical medical information right
to their bracelets. In a medical emergency, health data can be
communicated even if the wearer can’t share it.
V E R I ZO N CO M M U N I C AT I O N S I N C . 2 0 1 2 A N N UA L R E P O R T
We’re also using our technology to enable better patient outcomes
and control spending on healthcare, especially in underserved
communities. For example, we’ve signed on as the technology
sponsor for a project called the Clinton Health Matters Initiative,
launched by the William J. Clinton Foundation. During the next
three years we’ll go into medically disadvantaged communities
around the country and put better tools for managing health in the
hands of physicians and patients.
The goal is to create new revenue for Verizon while at the same
time transform the delivery of healthcare. Along the way, we
will use our social value metrics to measure our ability to decrease
the cost and increase the quality of care.
CHILDREN’S HEALTH FUND PARTNERSHIP
The Verizon Foundation is partnering with Children's Health Fund
(CHF) to equip mobile pediatric medical units in several key cities
with our fastest mobile data network. We want to increase access
to care for disadvantaged children who are at greater risk for
chronic disease and health problems.
We’re integrating our health-information technology into the CHF
programs, specifically, mobile pediatric medical units that provide
primary care in partnership with a hospital or other medical
affiliate. These units will be equipped with virtual care technology,
which lets pediatricians connect children to specialty care as the
mobile medical clinics visit schools and shelters.
The Verizon-CHF partnership will also be deploying low-cost
technology to improve patient-provider communication
and help patients follow their doctors’ instructions. This is of
particular concern in urban areas where many children are
living in shelters or other temporary environments.
IDENTIFYING NEW OPPORTUNITIES
Partnerships like these—with real-life impact—are designed to
address disparities in healthcare and improve access for those
disproportionately affected by chronic diseases, especially women,
children and seniors. These collaborations will also help us validate
how well our products improve the cost and quality of healthcare.
To learn more about how Verizon is committed to finding new
healthcare solutions, visit our Corporate Responsibility site at
http://responsibility.verizon.com.
InMotion Technology worked with
the Verizon Innovation Center
to develop the first 4G LTE wireless
mobile router, which allows secure
transmission of patient data from
ambulance tablets, EKGs and other
diagnostic tools to emergency
room doctors.
13
POWE R F UL ANSWER S
Networkfleet, a Verizon company, offers
advanced fleet technology solutions
to help businesses monitor their company
vehicles and decrease fuel consumption.
IS THERE A BETTER WAY TO MANAGE
OUR ENERGY USAGE?
From smart homes to connected cars, Verizon technology is giving our customers
innovative tools to address many of our long-term energy challenges.
We see a growing market for digital technologies that give
customers control over their energy management. We’re partnering
with a number of utilities as they transition to remote meter
management. By using cloud-based solutions and “e-meters,”
utilities can provide customers with better information on their
energy usage.
These and other machine-to-machine solutions are being
developed in our LTE Innovation Centers, helping modernize our
electrical and transportation systems and drive greater efficiencies.
ENABLING SMART GRIDS
Digitizing the electrical grid is giving users unprecedented control
over how they consume and manage energy, while it helps
unite producers and consumers of energy into a single, dynamic
energy ecosystem.
14
In Charlotte, N.C., Verizon is working with Duke Energy to create
a more sustainable urban environment in a project known as
“Envision: Charlotte.” Verizon connected the energy systems of 62
buildings in the city’s core using our 4G LTE wireless network.
Real-time data on energy consumption is displayed on interactive
video kiosks throughout the city, along with suggestions
about how to reduce energy use. The goal is to reduce energy
consumption by 20 percent by 2016.
In Worcester, Mass., National Grid is testing the energy system of
the future. Its smart grid pilot, which was developed in partnership
with Verizon and other key parties, is designed to give more than
15,000 customers control over their energy use through advanced
technology. The utility’s goals are to encourage customers to save
energy, while it increases network service reliability and improves
response to power outages.
V E R I ZO N CO M M U N I C AT I O N S I N C . 2 0 1 2 A N N UA L R E P O R T
IMPROVING FUEL EFFICIENCY
Our technology is also helping businesses to manage their
transportation systems. To improve the efficiency of its 350-vehicle
fleet, the Eastern Municipal Water District in Riverside, Calif.,
is working with Networkfleet, a Verizon company. We provide a
wireless fleet-management solution that connects directly to
a vehicle engine’s onboard diagnostic unit, letting fleet managers
remotely monitor engine diagnostics, fault codes and emission
control status. Our solution has already helped reduce fuel use and
carbon emissions.
MACHINE-TO-MACHINE APPLICATIONS
We’ve talked about machine-to-machine (M2M) technology in
theory for a long time, but with the evolution of cloud services and
Verizon’s LTE network, we’re expecting a strong growth in demand
for M2M services. We’re seeing it in smart homes, where the home
is quickly becoming a vital hub on the digital grid. It starts with our
4G LTE wireless technology and a powerful line-up of devices to
provide anywhere, anytime control of everything from lights and
appliances to thermostats and security alarms.
Customers of Lowe’s Iris smart-home system will now be able
to use Verizon’s wireless network for remote monitoring and
management of their homes’ energy and security systems.
Another service powered by Verizon’s wireless network is the
Home Area Network Energy Gateway, a self-installed, smart-grid
solution that lets consumers manage the energy use for pluggedin devices at their home. The Gateway lets users turn appliances on
or off remotely, set schedules and control the temperature from a
smartphone or web browser.
Verizon’s wireless technology is also helping cities be more
efficient. Just-in-time trash collection, a system that sends
collection crews real-time data on the status of city trash and
recycling bins, helps cities work smarter. With this solution,
powered by Verizon with innovators such as BigBelly Solar,
collection can be managed much more efficiently by limiting trips
and covering a larger area with fewer resources, with no
overflows or litter.
We believe broadband and M2M based energy-efficiency solutions
will represent a significant new source of revenue for Verizon
and deliver social value by accelerating the transition to a lowcarbon economy. In 2013 we are developing metrics to measure
the energy efficiency benefits of M2M solutions.
To learn more about how Verizon is committed to finding new
energy solutions, visit our Corporate Responsibility site at
http://responsibility.verizon.com.
Verizon has partnered with Lowe’s
on the Iris smart home system,
allowing customers to use Verizon’s
wireless network to remotely
monitor and manage their homes’
energy and security systems.
15
POWE R F UL ANSWER S
Students at Our Lady of Mt.
Carmel School in Essex, Maryland,
use Verizon 4G LTE-enabled
tablets as part of their instruction.
Studies show that technology in
the classroom helps keep students
engaged and excited about learning.
HOW CAN WE GIVE STUDENTS
A B E T T E R E D U C AT I O N ?
We’re using our advanced mobile and broadband technology to prepare students for
success in the 21st century.
Student achievement in a science, technology, engineering and
math (STEM) curriculum is critical to U.S. economic growth and
competitiveness on the global stage. Studies have shown that the
use of technology in the classroom can improve the way teachers
teach and keep students engaged and excited about learning.
We believe broadband and mobile technologies are the keys
to answering the challenge of driving greater achievement in
American schools as educators reinvent the classroom around
interactive and collaborative methods of instruction.
To personalize the classroom experience, we’re developing
innovative products that adapt our technologies to the needs of
students. We’re building partnerships with education organizations
that embrace the idea of mobility and digital content. We’re
also launching pilot programs with major universities to prepare
college students for teaching careers by integrating technology,
mobile devices, learning systems and cloud computing into their
college curriculum.
16
INNOVATIVE LEARNING SCHOOLS
Last year we launched the Verizon Innovative Learning School
program in 12 schools in underserved areas across America.
Teachers received extensive training on innovative ways to use
technology in the classroom, provided by the International Society
for Technology Education via a grant from the Verizon Foundation.
Samsung donated Galaxy tablets for the program, which started
with a summer workshop and continued with ongoing training
throughout the academic school year.
Schools receive grants ranging from $33,000 to $50,000. Verizon
targeted schools in which at least 40 percent of the students are
eligible for free and reduced lunches.
To determine our impact, we will measure teacher and student
technology proficiency and student achievement. Early results
indicate that teachers are able to individualize instruction
and implement new strategies to better engage students in science
and math. The program will reach as many as 12,000 students
in 24 U.S. schools in 2013.
V E R I ZO N CO M M U N I C AT I O N S I N C . 2 0 1 2 A N N UA L R E P O R T
INNOVATIVE APP CHALLENGE
To encourage students to put their STEM skills to good use, in 2012
we launched the Innovative App Challenge. This competition offers
a rich, project-based learning experience that fosters teamwork
and encourages participation from students regardless of their
academic interests and strengths. Because the teams are judged
only on their innovative app concept, the Challenge encourages
participation from any middle school or high school student who
possesses creativity, imagination and desire to make a difference.
Verizon challenged teams of high school and middle school
students to develop original concepts and designs for a mobile
app that incorporates STEM and addresses a need or problem in
their schools or communities. A panel of judges from business,
industry and academia will select the winners.
Students on the winning teams will receive a Samsung Galaxy
tablet. Team representatives will be invited to present their
winning apps at the 2013 National Technology Student Association
Conference in Orlando, Fla. In addition, each school will receive
a $10,000 grant from the Verizon Foundation to further its STEM
education work. The Verizon Foundation has partnered with MIT
Media Lab to provide training to each of the winning teams to turn
their concepts into actual market-ready apps.
FREE DIGITAL CONTENT
Verizon Thinkfinity.org is an online educational resource with
tens of thousands of free materials designed to help teachers
use technology to increase student engagement and boost
achievement. With Thinkfinity.org, educators can connect and
collaborate through themed groups, blogs and discussions, sharing
resources and best practices that support 21st century teaching
and learning.
The site offers rich, interactive content—including K-12 lesson
plans, in-class activities, webinars, games, podcasts and videos—
developed in partnership with the country’s leading educational
organizations. All content is aligned to state and common core
standards, and everything is easily searchable by grade level,
keyword or subject.
For parents and for afterschool programs, Thinkfinity.org offers
great learning experiences, such as activities and interactive games
that help children practice and master essential skills and concepts.
In 2012 there were more than 35 million visitors to Thinkfinity.org
and its partner sites.
To learn more about how Verizon is committed to finding new
education solutions, visit our Corporate Responsibility site at
http://responsibility.verizon.com.
Verizon Thinkfinity.org is an
online educational resource with
free materials designed to help
teachers use technology to increase
student engagement and boost
achievement. The site offers rich,
interactive content, including
lesson plans, in-class activities and
webinars.
17
POWE R F UL ANSWER S
Jerry Bascom, principal construction
engineer, inspects the solar panels
at Verizon’s mobile switching center
in Fairfield, California. The building,
which is certified by LEED (Leadership
in Energy and Environmental Design),
gets up to 30 percent of its energy
from the panels.
HOW CAN WE BECOME M O R E S U S TA I N A B L E ?
We’re helping the transition to a low-carbon economy by using innovative technology to
minimize our environmental impact.
GREENING THE VERIZON FLEET
During the past five years, we implemented a variety of solutions
to reduce the carbon emissions of our 35,000-vehicle fleet.
These include adopting hybrid and alternative-fuel technologies,
implementing fuel-saving practices such as reduced idling, and
deploying vehicle monitoring systems.
We also have a wireless solution that links location-based services
with the on-board monitoring systems of our vehicles. Information
gathered with this system is transmitted to desktops, tablets or
smartphones and analyzed. This information includes details
on individual vehicle mileage and emissions and allows Verizon
managers to schedule preventative maintenance.
To address the need for more eco-friendly vehicles in our fleet,
we collaborated with VIA Motors to develop an extended-range
electric cargo van that is expected to deliver 100 mpg with nearzero fuel emissions. Per vehicle, that works out to saving 750
gallons of fuel and reducing CO2 emissions by 2.4 metric tons
annually. We are currently testing two of these vans.
WIND-SOLAR TECHNOLOGY
We are testing a new hybrid wind/solar technology as a way to
power cell sites. A trial is under way in Salem, Mass., where Verizon
has teamed up with Wing Power Energy to erect three small wind/
solar turbines on the roof of our building.
18
In a similar effort, Verizon Wireless partnered with the National
Renewable Energy Laboratory to test whether combinations
V E R I ZO N CO M M U N I C AT I O N S I N C . 2 0 1 2 A N N UA L R E P O R T
of solar, wind, battery and generator systems can be efficiently
deployed at remote cell sites. Six cell sites were chosen for this
review, each of which is far from the utility power grid and
currently uses propane generators as the source of power.
NEW ENERGY STANDARDS FOR OUR SUPPLY CHAIN
In 2009, Verizon established a first-of-its-kind requirement for its
network suppliers: new equipment must be at least 20 percent
more energy-efficient than the equipment it replaces.
The initiative set a new standard in the telecom industry. With
suppliers adapting to Verizon’s requirements because of our
size and scope, all telecom companies began using the new,
more energy-efficient components—significantly reducing CO2
emissions and saving millions of dollars in energy costs. We have
since updated these requirements, extending them to cover
additional components.
We broke new ground again in 2012, establishing the rules and
metrics for reducing the carbon emissions in our supply
chain. The process started with assessing our suppliers’
sustainability efforts. An extensive survey tool was sent to 229
suppliers that gathered data on some of the most pressing
challenges in our supply chain: CO2 emissions, solid-waste
management, water usage, packaging and the performance of
subcontractors. We have created a new supply chain
goal to devote 40 percent of our supplier spending to firms that
measure and set targets to reduce carbon emissions by 2015.
To gauge our energy efficiency, we developed a “Carbon Intensity”
metric. It measures the carbon emissions that result from moving
data across our networks. This way we can assess how we are
becoming more efficient even as our business expands. Our goal
is to reduce our intensity by 50 percent over our 2009 baseline.
Since 2009, we have improved our carbon intensity by more than
37 percent. The bottom line is our network energy efficiency
programs have enabled us to increase the data on our network by
50 percent, while only increasing our electricity usage by 2 percent.
REDUCING OUR CUSTOMERS’ CARBON FOOTPRINTS
Verizon joined a number of video service providers and device
manufacturers in a wide-ranging agreement to meet aggressive
energy-efficiency requirements for set-top boxes. The Set-Top Box
Energy Conservation agreement is expected to save $1.5 billion in
annual electricity costs throughout the industry. The agreement
calls for participating companies to ensure that at least 90 percent
of all new set-top boxes purchased and deployed on or after
January 1, 2014, will meet Energy Star 3.0 efficiency levels.
Verizon Wireless gives customers the opportunity to purchase
environmentally-friendly devices—and safely recycle their old
ones. Verizon’s HopeLine® program recycles and refurbishes
used cell phones and accessories to help survivors and victims of
domestic violence. The used gear is collected by mail, at our retail
stores and through community phone drives.
To learn more about how Verizon is committed to finding new
sustainable solutions, visit our Corporate Responsibility site at
http://responsibility.verizon.com.
To address the need for more ecofriendly vehicles in our fleet, we
have collaborated with VIA Motors
to develop an extended-range
electric cargo van that is expected
to deliver 100 mpg with near-zero
fuel emissions.
19
MEASURING SHARED SUCCESS
SOCIAL INNOVATION FUNDING
2012
$55.9M
EDUCATION
$19.5M
CIVIC & COMMUNITY
SUPPORT
$7.7M
EMPLOYEE
ENGAGEMENT
$17.1M
DOMESTIC VIOLENCE
PREVENTION
$7.8M
EDUCATION
$17.5M
SUSTAINABILITY
$3.5M
DOMESTIC VIOLENCE
PREVENTION
$6.2M
2013 PLAN
$67.3M
SUSTAINABILITY
$1.4M
HEALTHCARE
$4.4M
HEALTHCARE
$13.0M
CIVIC & COMMUNITY
SUPPORT
$9.1M
EMPLOYEE ENGAGEMENT
$16.0M
EDUCATION
HEALTHCARE
SUSTAINABILITY
EMPLOYEE ENGAGEMENT
OBJECTIVE
OBJECTIVE
OBJECTIVE
2012 MATCHING GIFTS
Transform teaching and learning
Deploy technology to assist
chronic disease management
Provide tools to foster energy
efficiency
FUNDING
FUNDING
FUNDING
25.0
25.0
$19.5M
12.5
25.0
12.5
2012
0.0
2013
METRICS
●
●
●
Foster technology proficiency
●
●
Raise STEM achievement
●
$1.4M
2012
0.0
2013
2012
Foster technology proficiency
●
●
Decrease vehicle fuel consumption
●
●
Lower carbon emissions
Raise chronic disease
management success rates
●
431
205
5,642
$1.4M matched by the
Verizon Foundation
$1.7M in grants
388
125
381
200
Vehicle Fuels
Building and Other Fuels
37%
Goal: 50% by 2020
12
CO2 / TERABYTE (MONTHLY AVERAGE)
20
$737,000 donated by employees
VERIZON’S CO2 EMISSIONS PROFILE
16%
11
14,547 organizations funded
HURRICANE SANDY RELIEF
Reduce energy consumption
Baseline
10
$13.6 M matched by the
Verizon Foundation
2013
●
Improvement from Baseline
09
46,686 employee gifts
$3.5M
METRICS
Increase access to healthcare
providers
VERIZON’S CARBON EFFICIENCY
30%
●
12.5
METRICS
Increase student engagement
in STEM
451,039 volunteer hours
●
$4.4M
0.0
22,048 participants
●
●
$13.0M
$17.5M
●
20
5,061
5,427
10
11
5,343 Electricity
12
METRIC TONS (THOUSANDS)
To view our complete set of
Corporate Responsibility
Key Performance Indicators
online, go to
responsibility.verizon.com/2012.
V E R I ZO N CO M M U N I C AT I O N S I N C . A N D S U B S I D I A R I E S
SELECTED FINANCIAL DATA
(dollars in millions, except per share amounts)
2012
2011
2010
2009
Results of Operations
Operating revenues
Operating income
Net income (loss) attributable to Verizon
Per common share – basic
Per common share – diluted
Cash dividends declared per common share
Net income attributable to noncontrolling interest
$ 115,846
13,160
875
.31
.31
2.030
9,682
$ 110,875
12,880
2,404
.85
.85
1.975
7,794
$ 106,565
14,645
2,549
.90
.90
1.925
7,668
$ 107,808
15,978
4,894
1.72
1.72
1.870
6,707
$
Financial Position
Total assets
Debt maturing within one year
Long-term debt
Employee benefit obligations
Noncontrolling interest
Equity attributable to Verizon
$ 225,222
4,369
47,618
34,346
52,376
33,157
$ 230,461
4,849
50,303
32,957
49,938
35,970
$ 220,005
7,542
45,252
28,164
48,343
38,569
$ 226,907
7,205
55,051
32,622
42,761
41,382
$ 202,185
4,993
46,959
32,512
37,199
41,592
2008
97,354
2,612
(2,193)
(.77)
(.77)
1.780
6,155
• Significant events affecting our historical earnings trends in 2010 through 2012 are described in “Other Items” in the “Management’s Discussion and Analysis of Financial Condition and Results
of Operations” section.
• 2009 and 2008 data includes severance, pension and benefit charges, merger integration and acquisition costs, dispositions and other items.
Stock Performance Graph
Comparison of Five-Year Total Return Among Verizon, S&P 500 Telecommunications Services Index and S&P 500 Stock Index
Verizon
S&P 500 Telecom Services
S&P 500
$160
$140
Dollars
$120
$100
$80
$60
$40
2007
2008
2009
Data Points in Dollars
2007
2008
Verizon
S&P 500 Telecom Services
S&P 500
100.0
100.0
100.0
81.9
69.5
63.0
2010
2011
At December 31,
2009
2010
85.1
75.8
79.7
104.8
90.1
91.7
2012
2011
2012
123.9
95.9
93.6
140.2
113.4
108.6
The graph compares the cumulative total returns of Verizon, the S&P 500 Telecommunications Services Index, and the S&P 500 Stock Index over a five-year period. It assumes $100 was invested
on December 31, 2007 with dividends (including the value of each respective spin-off ) being reinvested.
21
MANAGEMENT’S DISCUSSION AND ANALYSIS
OF FINANCIAL CONDITION AND RESULTS OF OPERATIONS
OVERVIEW
Verizon Communications Inc. (Verizon or the Company) is a holding companythat,actingthroughitssubsidiariesisoneoftheworld’sleading
providers of communications, information and entertainment products
and services to consumers, businesses and governmental agencies
with a presence in over 150 countries around the world. Our offerings,
designedtomeetcustomers’ demandforspeed,mobility,securityand
control, include voice, data and video services on our wireless and wireline networks. We have two reportable segments, Verizon Wireless and
Wireline. Our wireless business, operating as Verizon Wireless, provides
voiceanddataservicesandequipmentsalesacrosstheUnitedStates
using one of the most extensive and reliable wireless networks. Our wireline business provides consumer, business and government customers
with communications products and services, including voice, broadband
data and video services, network access, long distance and other communications products and services, and also owns and operates one of
the most expansive end-to-end global Internet Protocol (IP) networks.
We have a highly skilled, diverse and dedicated workforce of approximately 183,400 employees as of December 31, 2012.
In recent years Verizon has embarked upon a strategic transformation
as advances in technology have changed the ways that our customers
interact in their personal and professional lives and that businesses
operate. To meet the changing needs of our customers and address the
changing technological landscape, we are focusing our efforts around
higher margin and growing areas of our business: wireless data, wireline
data and Strategic services, including cloud computing services.
Our strategy requires significant capital investments primarily to acquire
wireless spectrum, put the spectrum into service, expand the fiber optic
network that supports our wireless and wireline businesses, maintain
our wireless and wireline networks and develop and maintain significant
advanced database capacity.
In our Wireless business, in 2012 compared to 2011, strong revenue
growth of 8.1% was driven by connection growth and strong demand
for smartphones and Internet data devices. During 2012, we experienced
a 4.3% increase in retail postpaid connections per account compared to
2011, with smartphones representing 58.1% of our retail postpaid phone
base at December 31, 2012.
AsofJanuary22,2013,ourfourth-generation(4G)Long-TermEvolution
(LTE) network has been deployed in 476 markets covering more than 273
millionpeoplethroughoutthecountry,whichisnearly89%oftheU.S.
population. We expect to continue to deploy 4G LTE during 2013 and
by year-end cover nearly our entire existing 3G network footprint. Our
4G LTE network provides higher data throughput performance for data
services at lower cost compared to those offered by 3G technologies. As
of December 31, 2012, nearly 50% of our wireless data traffic was on our
4G LTE network.
In 2012, Verizon Wireless launched the Share Everything plans, which
were made available to both new and existing postpaid customers. These
plans feature domestic unlimited voice minutes, unlimited text, video
and picture messaging and a single data allowance that can be shared
among up to 10 devices connected to the Verizon Wireless network.
Foranadditionalmonthlyaccessfee,ourcustomershavetheoptionof
sharing long distance and roaming minutes among their devices for calls
fromtheUnitedStatesto,andcallswhilewithin,CanadaandMexico.The
ShareEverythingplansalsoincludetheMobileHotspotserviceonour
smartphonesatnoadditionalcharge.TheMobileHotspotserviceallows
acustomertouseournetworktocreateaWi-Finetworkthatcanbeused
byWi-Fienableddevices.InJanuary2013,VerizonWirelessannounced
22
V E R I ZO N CO M M U N I C AT I O N S I N C . A N D S U B S I D I A R I E S
it will begin offering shared data plans for business, with the Share
Everything plans for Small Business and the Nationwide Business Data
Packages and Plans. As of December 31, 2012, Share Everything accounts
represented approximately 23% of our retail postpaid accounts.
In Wireline, during 2012 compared to 2011, revenues were positively
impactedbyhigherrevenuesinConsumerretaildrivenbyFiOSservices.
FiOSrepresentedapproximately65%ofConsumerretailrevenueduring
2012,comparedtoapproximately58%during2011.AstheFiOSproducts mature, we continue to seek ways to increase incremental revenue
and further realize operating and capital efficiencies as well as maximize
profitability. As more applications are developed for this high-speed service,weexpectthatFiOSwillbecomeahubformanagingamultitude
of home services that will eventually be part of the digital grid, including
not just entertainment and communications, but also machine-tomachine communications, such as home monitoring, home health care,
energy management and utilities management.
Also positively impactingWireline’s revenues during 2012 was a 6.3%
increase in Strategic services revenue, which represented 53% of total
Global Enterprise revenues during 2012. However, total Global Enterprise
and Global Wholesale revenues declined as customers continue to be
adversely affected by the economy, resulting in decreased discretionary
spending and delayed purchasing decisions. To compensate for the
shrinking market for traditional voice service, we continue to build our
Wireline segment around data, video and advanced business services—
areas where demand for reliable high-speed connections is growing.
In 2012, we reached agreements with the Communications Workers of
America and the International Brotherhood of Electrical Workers on new,
three-year contracts that cover approximately 43,000 Wireline employees.
The new agreements will expire on August 1, 2015.
During 2012 and 2011, we made several strategic investments to improve
our competitive position:
• In 2012, we completed separate transactions with SpectrumCo, LLC
(SpectrumCo)andCoxTMIWireless,LLCtoacquireAdvancedWireless
Service (AWS) spectrum. We also completed a series of purchase and
exchange transactions for AWS and PCS licenses and a 700 megahertz
(MHz) lower A block license. In addition, during January 2013, we
agreedtosellaportionofour700MHzBblocklicenses,whichupon
receipt of regulatory approval, will result in the completion of our previouslyannouncedopensaleprocessforallofour700MHzlowerA
and B block spectrum licenses. These transactions will allow us to meet
the continued demand for wireless services.
• OnJune1,2012,weagreedtoacquireHUGHESTelematicsforapproximately $12 per share in cash for a total acquisition price of $0.6 billion
andwecompletedtheacquisitiononJuly26,2012.Theacquisitionhas
accelerated our ability to bring more telematics offerings to market for
existingandnewHUGHESTelematicsandVerizoncustomers.
• InFebruary2012,weenteredintoaventurewithRedboxAutomated
Retail,LLC,asubsidiaryofCoinstar,Inc.,tooffercustomersnationwide
access to media rentals through online and mobile content streaming
aswellasphysicalmediarentalsthroughRedboxkiosks.InDecember
2012, the venture introduced its product portfolio, which includes
subscriptionservices,underthenameRedboxInstantbyVerizon.
MANAGEMENT’S DISCUSSION AND ANALYSIS
OF FINANCIAL CONDITION AND RESULTS OF OPERATIONS continued
• In 2011, Verizon Wireless entered into commercial agreements, modified in 2012, with affiliates of Comcast Corporation, Time Warner Cable,
Bright House Networks and Cox Communications Inc. (the cable companies). Through these agreements, the cable companies and Verizon
Wirelessbecameagentstosellcertainofoneanother’sproductsand
services and, over time, the cable companies will have the option, subject to the terms and conditions of the agreements, of selling Verizon
Wireless service on a wholesale basis.
• In 2011, we acquired Terremark Worldwide Inc. (Terremark), a global
provider of information technology infrastructure and cloud services.
This acquisition enhanced our competitive position in managed
hosting and cloud services offerings to business and government
customers globally and is contributing to our growth in revenues.
Additionally, in 2011, we acquired a provider of cloud software technology, which has further enhanced our offerings of cloud services.
We expect our provisioning of cloud services to be instrumental to
our future growth as it allows us to meet the evolving demands of our
customers.
Investing in innovative technology like wireless networks, high-speed
fiber and cloud services has positioned Verizon at the center of the
growth trends of the future. By investing in our own capabilities, we are
also investing in the markets we serve by making sure our communities
have an efficient, reliable infrastructure for competing in the information
economy. We are committed to putting our customers first and being a
responsible member of our communities. Guided by this commitment
and by our core values of integrity, respect, performance excellence and
accountability, we believe we are well-positioned to produce a long-term
return for our shareowners, create meaningful work for ourselves and
provide something of lasting value for society.
expect future growth opportunities will be dependent on expanding the
penetration of our network services, offering innovative wireless devices
for both consumer and business customers and increasing the number
of ways that our customers can connect with our network and services.
In recent years, we have experienced continuing access line losses in our
Wireline segment as customers have disconnected both primary and
secondary lines and switched to alternative technologies such as wireless, VoIP and cable for voice and data services. We expect to continue
to experience access line losses as customers continue to switch to alternate technologies.
Despite this challenging environment, we expect that we will continue to
grow key aspects of our wireline business by providing superior network
reliability, offering innovative product bundles that include high-speed
Internet access, digital television and local and long distance voice services, offering more robust IP products and service, and accelerating our
cloud computing strategy. We will also continue to focus on cost efficiencies to attempt to offset adverse impacts from unfavorable economic
conditions and intense competitive pressure.
During 2012, we purchased a single premium group annuity contract
from The Prudential Insurance Company of America and Prudential
FinancialInc.
Operating Revenue
We expect to experience service revenue growth in our Verizon Wireless
segment in 2013, primarily as a result of continued growth in postpaid
connections driven by increased sales of smartphones and other datacapable devices. We expect that retail postpaid average revenue per
account(ARPA)willcontinuetoincreaseasconnectionsmigratefrom
basic phones to smartphone devices and as the average number of connections per account increases which we expect to be driven by our new
Share Everything plans that allow for the sharing of data among up to 10
devices. We expect that our future service revenue growth will be substantially derived from an increase in the sale and usage of innovative
wireless smartphones and other data-capable devices in addition to our
new pricing structure that will encourage customers to continue adding
data-enabled devices onto existing accounts.
In the sections that follow, we provide information about the important
aspects of our operations and investments, both at the consolidated and
segment levels, and discuss our results of operations, financial position
and sources and uses of cash. In addition, we highlight key trends and
uncertainties to the extent practicable.
During 2012, we experienced an increase in Wireless equipment and other
revenue as a result of sales of new smartphone devices, including our 4G
LTE-capable devices. We expect that continued emphasis on increasing
smartphone penetration will positively impact equipment revenue as
these devices typically carry higher price points than basic phones.
Trends
We expect that competition will continue to intensify with traditional,
non-traditional and emerging service providers seeking increased market
share. We believe that our networks differentiate us from our competitors, enabling us to provide enhanced communications experiences to
our customers. We believe our focus on the fundamentals of running a
good business, including operating excellence and financial discipline,
gives us the ability to plan and manage through changing economic
conditions. We will continue to invest for growth, which we believe is the
key to creating value for our shareowners.
WeexpectFiOSbroadbandandvideopenetrationtopositivelyimpact
our Mass Markets revenue and subscriber base and we also expect
Strategic services revenue to continue to grow as we derive additional
enterprise revenues from cloud, security and other solutions-based services and customers continue to migrate their services to Private IP and
other strategic networking services. We believe the trend in these growth
areas as well as new offerings in telematics and video streaming will help
offset the continuing decline in revenues in our Wireline segment related
to retail voice connection losses as a result of wireless substitution as well
as the continued decline in our legacy wholesale and enterprise markets.
Connection and Operating Trends
In our Wireless segment, we expect to continue to attract and maintain the loyalty of high-quality retail postpaid customers, capitalizing
on demand for data services and bringing our customers new ways of
using wireless services in their daily lives. We expect that future connection growth will continue as we introduce new smartphones, Internet
devices such as tablets and our suite of 4G LTE devices. We believe these
devices will attract and retain higher value retail postpaid connections,
contribute to continued increases in the penetration of data services and
keep our device line-up competitive versus other wireless carriers. We
Operating Costs and Expenses
We anticipate our overall wireless operating costs will increase as a result
of the expected increase in the volume of smartphone sales, which will
result in higher equipment and sales commission costs. In addition, we
expectcontentcostsforourFiOSvideoservicestocontinuetoincrease.
However, we expect to achieve certain cost efficiencies in 2013 and
beyond as data traffic continues to migrate to our lower-cost 4G LTE network and as we continue to streamline our business processes with a
focus on improving productivity and increasing profitability.
23
MANAGEMENT’S DISCUSSION AND ANALYSIS
OF FINANCIAL CONDITION AND RESULTS OF OPERATIONS continued
Capital Expenditures
Our 2013 capital program includes capital to fund advanced networks
and services, including 4G LTE and FiOS, the continued expansion of
our core networks, including our IP and data center enhancements,
maintenance and support for our legacy voice networks and other
expenditures to drive operating efficiencies. The level and the timing of
theCompany’scapitalexpenditureswithinthesebroadcategoriescan
vary significantly as a result of a variety of factors outside our control,
including, for example, material weather events. We are replacing damaged copper wire with fiber-optic cable which will not alter our capital
program but should result in lower maintenance costs. Capital expenditures were approximately $16 billion in 2012 and 2011, respectively. We
believe that we have significant discretion over the amount and timing
of our capital expenditures on a Company-wide basis as we are not subject to any agreement that would require significant capital expenditures
on a designated schedule or upon the occurrence of designated events.
We expect capital expenditures as a percentage of revenue to decline in
2013 from levels in 2012.
Cash Flow from Operations
We create value for our shareowners by investing the cash flows generated by our business in opportunities and transactions that support
continued profitable growth, thereby increasing customer satisfaction
and usage of our products and services. In addition, we have used our
cash flows to maintain and grow our dividend payout to shareowners.
Verizon’sBoardofDirectorsincreasedtheCompany’squarterlydividend
by 3.0% during 2012, making this the sixth consecutive year in which we
have raised our dividend.
Our goal is to use our cash to create long-term value for our shareholders.
We will continue to look for investment opportunities that will help us to
grow the business. When appropriate, we will also use our cash to reduce
our debt levels and to buy back shares of our outstanding common
stock, and Verizon Wireless may make distributions to its partners (see
“CashFlowsfromFinancingActivities”).Therewerenorepurchases of
commonstockduring2012,2011or2010.ThroughFebruary15,2013,
we purchased approximately 3.50 million shares under our current share
buyback authorization.
Other
We do not currently expect that legislative efforts relating to climate
control will have a material adverse impact on our consolidated financial
results or financial condition. We believe there may be opportunities for
companies to increase their use of communications services, including
those we provide, in order to minimize the environmental impact of their
businesses.
24
CONSOLIDATED RESULTS OF OPERATIONS
In this section, we discuss our overall results of operations and highlight
items of a non-operational nature that are not included in our segment
results. We have two reportable segments, Verizon Wireless and Wireline,
which we operate and manage as strategic business units and organize
byproductsandservices.In“SegmentResultsofOperations,”wereview
the performance of our two reportable segments.
Corporate, eliminations and other includes unallocated corporate
expenses such as certain pension and other employee benefit related
costs, intersegment eliminations recorded in consolidation, the results
of other businesses such as our investments in unconsolidated businesses, lease financing and divested operations, and other adjustments
and gains and losses that are not allocated in assessing segment performance due to their non-operational nature. Although such transactions
are excluded from the business segment results, they are included in
reported consolidated earnings. Gains and losses that are not individually
significant are included in all segment results as these items are included
inthechiefoperatingdecisionmaker’sassessmentofsegmentperformance. We believe that this presentation assists users of our financial
statements in better understanding our results of operations and trends
from period to period.
Corporate, eliminations and other during 2010 included a one-time
non-cash adjustment of $0.2 billion primarily to adjust wireless service
revenues. This adjustment was recorded to properly defer previously
recognized wireless service revenues that were earned and recognized
in future periods. The adjustment was not material to the consolidated
financialstatements(see“OtherItems”).Inaddition,theresultsofoperationsrelatedtothedivestitureswecompletedin2010(see“Acquisitions
andDivestitures”)areincludedinCorporate,eliminationsandother,as
follows:
(dollars in millions)
Years Ended December 31,
Impact of Divested Operations
Operating revenues
$
Cost of services and sales
Selling, general and administrative expense
Depreciation and amortization expense
2012
–
–
–
–
2011
$
–
–
–
–
2010
$
2,407
574
665
413
MANAGEMENT’S DISCUSSION AND ANALYSIS
OF FINANCIAL CONDITION AND RESULTS OF OPERATIONS continued
Consolidated Revenues
(dollars in millions)
2012
Years Ended December 31,
Verizon Wireless
Service revenue
Equipment and other
Total
Wireline
MassMarkets
Global Enterprise
Global Wholesale
Other
Total
Corporate, eliminations and other
Consolidated Revenues
$
$
63,733
12,135
75,868
16,702
15,299
7,240
539
39,780
198
115,846
2011
$
$
59,157
10,997
70,154
16,337
15,622
7,973
750
40,682
39
110,875
2012 vs. 2011
2010
$
$
55,629
7,778
63,407
16,256
15,316
8,746
909
41,227
1,931
106,565
Increase/(Decrease)
2011 vs. 2010
$
$
4,576
1,138
5,714
365
(323)
(733)
(211)
(902)
159
4,971
7.7 %
10.3
8.1
2.2
(2.1)
(9.2)
(28.1)
(2.2)
nm
4.5
$
$
3,528
3,219
6,747
6.3 %
41.4
10.6
81
306
(773)
(159)
(545)
(1,892)
4,310
0.5
2.0
(8.8)
(17.5)
(1.3)
(98.0)
4.0
nm - not meaningful
2012 Compared to 2011
The increase in consolidated revenues during 2012 compared to 2011
was primarily due to higher revenues at Verizon Wireless, as well as higher
MassMarketsrevenuesdrivenbyFiOSservicesandincreasedStrategic
services revenues within Global Enterprise at our Wireline segment.
Partially offsetting these increases were lower Global Wholesale and
Global Enterprise Core revenues at our Wireline segment.
VerizonWireless’ revenuesincreasedduring2012comparedto2011due
to growth in both service and equipment and other revenue. Service
revenue increased during 2012 compared to 2011 primarily driven by
higher retail postpaid service revenue, which increased largely as a result
of an increase in retail postpaid connections of 5.1 million in 2012, as well
as the continued increase in penetration of higher priced smartphones.
Retailpostpaidconnectionsperaccountincreasedduring2012compared to 2011 primarily due to the increased use of tablets and other
Internet devices. In 2012, the increase in retail postpaid connection net
additions was primarily due to an increase in retail postpaid and prepaid
connection gross additions and improvements in our retail connections
churn rate. Higher retail postpaid connection gross additions during
2012 primarily reflect the launch of our Share Everything plans coupled
with new device introductions during the second half of 2012.
Equipment and other revenue increased during 2012 compared to 2011
primarily due to an increase in device upgrade fees, regulatory fees and
equipment sales.
Wireline’srevenuesdecreasedduring2012comparedto2011primarily
driven by declines in Global Wholesale, Global Enterprise Core and Other
revenues,partiallyoffsetbyhigherrevenuesinMassMarketsdrivenby
FiOSservicesandhigherrevenuesfromStrategicservices.
MassMarketsrevenuesincreasedduring2012comparedto2011due
totheexpansionofFiOSservices(Voice,InternetandVideo)aswellas
changes in our pricing strategy adopted in 2012, partially offset by the
continued decline of local exchange revenues.
Global Enterprise revenues decreased during 2012 compared to 2011 primarily due to lower local services and traditional circuit-based revenues,
a decline in customer premise equipment revenues and the unfavorable impact of foreign currency translation. This decrease was partially
offset by higher Strategic services revenues, primarily due to growth in
advanced services, such as managed network solutions, contact center
solutions, IP communications and our cloud and data center offerings.
Global Wholesale revenues decreased during 2012 compared to 2011
primarily due to a decline in traditional voice revenues as a result of
decreasedminutesofuse(MOUs)andadeclineindomesticwholesale
connections, partially offset by continuing demand for high-speed digital
data services from fiber-to-the-cell customers upgrading their core data
circuits to Ethernet facilities as well as Ethernet migrations from other
core customers.
Other revenues decreased during 2012 compared to 2011 primarily due
toreducedvolumes,includingformerMCImassmarketcustomerlosses.
2011 Compared to 2010
The increase in consolidated revenues during 2011 compared to 2010
was primarily due to higher revenues at Verizon Wireless, the expansion
ofFiOSservicesandincreasedrevenuesfromStrategicservicesatour
Wireline segment. In addition, the increase during 2011 was partially
offset by the impact of divested operations.
The increase inVerizonWireless’ revenues during 2011 compared to
2010 was primarily due to growth in both service and equipment revenue. Service revenue increased during 2011 compared to 2010 primarily
driven by higher retail postpaid service revenue, which increased as a
result of an increase in retail postpaid connections of 4.3 million in 2011
as well as the continued increase in penetration of higher priced smartphones.Retailpostpaidconnectionsperaccountincreasedduring2011
compared to 2010 primarily due to the increased use of tablets and other
Internet devices.
Equipment and other revenue increased during 2011 compared to 2010
due to an increase in the sales volume of smartphones to new and
upgrading customers.
ThedecreaseinWireline’srevenuesduring2011comparedto2010was
primarily driven by declines in Global Wholesale, and Global Enterprise
Core and Other revenues. The decrease in Global Wholesale revenues
was primarily due to a $0.4 billion decline in international voice revenues
asaresultofdecreasedMOUsintraditionalvoiceproductsasaresult
of increases in voice termination pricing on certain international routes.
Global Enterprise Core revenues declined primarily due to lower customer premise equipment revenues, reflecting our focus on improving
margins by de-emphasizing sales of equipment that are not a part of
an overall enterprise solutions bundle, as well as customers migrating
to next generation IP services. Other Wireline revenue also decreased
primarilyasaresultofformerMCImassmarketcustomerlosses.These
revenue declines were partially offset by continued revenue growth in
Global Enterprise Strategic services, in part due to the inclusion of the
revenuesofTerremark,andinMassMarkets,primarilyduetotheexpansionofFiOSservices(Voice,InternetandVideo),partiallyoffsetbythe
decline of local exchange revenues.
25
MANAGEMENT’S DISCUSSION AND ANALYSIS
OF FINANCIAL CONDITION AND RESULTS OF OPERATIONS continued
Consolidated Operating Expenses
(dollars in millions)
2012
Years Ended December 31,
Cost of services and sales
Selling, general and administrative expense
Depreciation and amortization expense
Consolidated Operating Expenses
$
$
46,275
39,951
16,460
102,686
2011
$
$
45,875
35,624
16,496
97,995
2012 vs. 2011
2010
$
$
44,149
31,366
16,405
91,920
Increase/(Decrease)
2011 vs. 2010
$
$
400
4,327
(36)
4,691
0.9 %
12.1
(0.2)
4.8
$
1,726
4,258
91
6,075
$
3.9 %
13.6
0.6
6.6
Consolidated operating expenses increased during 2012 and 2011 primarilyduetohighernon-operationalcharges(see“OtherItems”)aswell
as increased operating expenses at Verizon Wireless. The changes in consolidated operating expenses during 2011 were also favorably impacted
by divested operations.
growth and the acquisition of Terremark in the second quarter of 2011.
Partially offsetting the increase were lower non-operational charges noted
in the table below, a decrease in access costs resulting primarily from
management actions to reduce exposure to unprofitable international
wholesale routes and declines in overall wholesale long distance volumes.
2012 Compared to 2011
Cost of Services and Sales
Cost of services and sales includes the following costs directly attributable to a service or product: salaries and wages, benefits, materials
and supplies, content costs, contracted services, network access and
transport costs, wireless equipment costs, customer provisioning costs,
computer systems support, costs to support our outsourcing contracts
andtechnicalfacilitiesandcontributionstotheUniversalServiceFund.
Aggregate customer care costs, which include billing and service provisioning, are allocated between Cost of services and sales and Selling,
general and administrative expense.
Selling, General and Administrative Expense
Selling, general and administrative expense increased during 2011 compared to 2010 primarily due to higher severance, pension and benefit
charges and costs caused by storm-related events as well as higher sales
commission expense at our Verizon Wireless segment. Partially offsetting the increase was the absence of merger integration and acquisition
related charges and access line spin-off charges during 2011 and a
decrease in compensation expense at our Wireline segment.
Cost of services and sales increased during 2012 compared to 2011 primarily due to higher cost of equipment sales, increased cost of network
services and increased data roaming, partially offset by a decrease in cost
for data services, a decrease in network connection costs and a decrease
in the cost of long distance at our Verizon Wireless segment. Also contributing to the increase were higher content costs associated with continued
FiOSsubscribergrowthandvendorrateincreases,increasedexpenses
relatedtoourcloudanddatacenteroffering,highercostsrelatedtoFiOS
installation as well as higher repair and maintenance expenses caused by
storm-related events in 2012, partially offset by declines in access costs
and customer premise equipment costs at our Wireline segment.
Selling, General and Administrative Expense
Selling, general and administrative expense includes: salaries and wages
and benefits not directly attributable to a service or product; bad debt
charges; taxes other than income taxes; advertising and sales commission costs; customer billing; call center and information technology costs;
regulatory fees; professional service fees; and rent and utilities for administrative space. Also included are a portion of the aggregate customer
care costs as discussed above.
Selling, general and administrative expense increased during 2012 compared to 2011 primarily due to higher non-operational charges noted in
the table below as well as higher sales commission expense and costs
associated with regulatory fees at our Verizon Wireless segment.
Depreciation and Amortization Expense
Depreciation and amortization expense decreased during 2012 compared to 2011 primarily due to a decrease in depreciable assets at our
Wireline segment, partially offset by an increase in amortization expense
related to non-network software.
2011 Compared to 2010
Cost of Services and Sales
Cost of services and sales increased during 2011 compared to 2010
primarily due to higher cost of equipment sales at our Verizon Wireless
segment, as well as increased costs at our Wireline segment related to
repair and maintenance expenses caused by storm-related events during
2011, higher content costs associated with continued FiOS subscriber
26
Depreciation and Amortization Expense
Depreciation and amortization expense increased during 2011 compared to 2010 as a result of growth in depreciable assets at our Wireless
segment and the acquisition of Terremark in the second quarter of 2011,
partially offset by lower non-operational charges noted in the table
below and amortization expense as a result of a reduction in capitalized
non-network software at our Wireline segment. The change in depreciation and amortization expense was also partially attributable to the
impact of divested operations.
Non-operational Charges
Non-operational charges included in operating expenses (see "Other
Items") were as follows:
(dollars in millions)
2012
Years Ended December 31,
Severance, Pension and Benefit Charges
Cost of services and sales
Selling, general and administrative expense
Merger Integration and Acquisition
Related Charges
Cost of services and sales
Selling, general and administrative expense
Depreciation and amortization expense
Access Line Spin-off Related Charges
Cost of services and sales
Selling, general and administrative expense
Litigation Settlements
Selling, general and administrative expense
Other Costs
Cost of sales and services
Selling, general and administrative expense
Total non-operating charges included in
operating expenses
$
–
7,186
7,186
2011
$
–
5,954
5,954
2010
$
1,723
1,331
3,054
–
–
–
–
–
–
–
–
376
389
102
867
–
–
–
–
–
–
42
365
407
384
–
–
40
236
276
–
–
–
–
–
–
$ 7,846
See“OtherItems”foradescriptionofothernon-operationalitems.
$
5,954
$
4,328
MANAGEMENT’S DISCUSSION AND ANALYSIS
OF FINANCIAL CONDITION AND RESULTS OF OPERATIONS continued
Consolidated Operating Income and EBITDA
Consolidated earnings before interest, taxes, depreciation and amortization expenses (Consolidated EBITDA) and Consolidated Adjusted EBITDA,
which are presented below, are non-GAAP measures and do not purport
to be alternatives to operating income as a measure of operating performance.Managementbelievesthatthesemeasuresareusefultoinvestors
and other users of our financial information in evaluating operating profitability on a more variable cost basis as they exclude the depreciation
and amortization expense related primarily to capital expenditures and
acquisitions that occurred in prior years, as well as in evaluating operating performance in relation to our competitors. Consolidated EBITDA
is calculated by adding back interest, taxes, depreciation and amortization expense, equity in earnings of unconsolidated businesses and other
income and (expense), net to net income.
assumptions. The adjustment has been recognized in the income statement during the fourth quarter or upon a remeasurement event pursuant
to our accounting policy for the recognition of actuarial gains/losses.
Consolidated Adjusted EBITDA is calculated by excluding the effect of
non-operational items and the impact of divested operations from the
calculationofConsolidatedEBITDA.Managementbelievesthatthismeasure provides additional relevant and useful information to investors and
other users of our financial data in evaluating the effectiveness of our
operations and underlying business trends in a manner that is consistentwithmanagement’sevaluationofbusinessperformance.See“Other
Items”foradditionaldetailsregardingthesenon-operationalitemsand
the impact of divested operations.
Consolidated Operating Income
Add Depreciation and amortization
expense
Consolidated EBITDA
Add Non-operating charges included in
operating expenses(1)
Add Deferred revenue adjustment
Less Impact of divested operations(1)
Consolidated Adjusted EBITDA
Operating expenses include pension and benefit related charges based
on actuarial assumptions, including projected discount rates and an estimated return on plan assets. These estimates are updated in the fourth
quarter to reflect actual return on plan assets and updated actuarial
(1) Excludes non-operating charges included in Depreciation and amortization expense.
Itismanagement’sintenttoprovidenon-GAAPfinancialinformationto
enhancetheunderstandingofVerizon’sGAAPfinancialinformation,and
it should be considered by the reader in addition to, but not instead of,
the financial statements prepared in accordance with GAAP. Each nonGAAP financial measure is presented along with the corresponding GAAP
measure so as not to imply that more emphasis should be placed on the
non-GAAP measure. The non-GAAP financial information presented may
be determined or calculated differently by other companies.
(dollars in millions)
2012
2011
2010
$ 13,160
$ 12,880
$ 14,645
16,460
29,620
16,496
29,376
16,405
31,050
7,846
–
–
$ 37,466
5,954
–
–
$ 35,330
4,226
268
(1,168)
$ 34,376
Years Ended December 31,
The changes in Consolidated Operating Income, Consolidated EBITDA
and Consolidated Adjusted EBITDA in the table above were primarily a
result of the factors described in connection with operating revenues
and operating expenses above.
Other Consolidated Results
Equity in Earnings of Unconsolidated Businesses
Equity in earnings of unconsolidated businesses decreased $120 million, or 27.0%, in 2012 compared to 2011 and $64 million, or 12.6%, in 2011 compared to 2010 primarily due to lower earnings from operations at Vodafone Omnitel N.V. and, to a lesser extent, the devaluation of the Euro against
theU.S.dollar.
Other Income and (Expense), Net
Additional information relating to Other income and (expense), net is as follows:
2012
Years Ended December 31,
Interest income
Foreignexchangegains(losses),net
Other, net
Total
$
57
(1)
(1,072)
$ (1,016)
2011
$
$
68
(9)
(73)
(14)
(dollars in millions)
2012 vs. 2011
2010
$
$
92
5
(43)
54
Increase/(Decrease)
2011 vs. 2010
$
(11)
8
(999)
$ (1,002)
(16.2)%
(88.9)
nm
nm
$
$
(24)
(14)
(30)
(68)
(26.1) %
nm
69.8
nm
nm - not meaningful
Other income and (expense), net decreased during 2012 compared to
2011 primarily driven by higher fees of $1.1 billion related to the early
redemptionofdebt(see“OtherItems”).
Other income and (expense), net decreased during 2011 compared to
2010 primarily driven by higher fees related to the early redemption of
debt(see“OtherItems”)andforeignexchangelossesatourinternational
wireline operations, partially offset by gains on sales of short-term
investments.
27
MANAGEMENT’S DISCUSSION AND ANALYSIS
OF FINANCIAL CONDITION AND RESULTS OF OPERATIONS continued
Interest Expense
(dollars in millions)
2012
Years Ended December 31,
2011
Total interest costs on debt balances
Less Capitalized interest costs
Total
$ 2,977
406
$ 2,571
$
Average debt outstanding
Effective interest rate
$ 52,949
5.6%
$ 55,629
5.9%
$
3,269
442
2,827
Total interest costs on debt balances decreased during 2012 compared to 2011 primarily due to a $2.7 billion decrease in average debt
(see“ConsolidatedFinancialCondition”)andalowereffectiveinterest
rate. Capitalized interest costs were lower in 2012 primarily due to our
ongoing deployment of the 4G LTE network.
2012 vs. 2011
2010
$
$
3,487
964
2,523
Increase/(Decrease)
2011 vs. 2010
$
$
(292)
(36)
(256)
(8.9)%
(8.1)
(9.1)
$
$
(6.3) %
(54.1)
12.0
$ 57,278
6.1%
Total interest costs on debt balances decreased during 2011 compared to 2010 primarily due to a $1.6 billion decrease in average debt
(see“ConsolidatedFinancialCondition”)andalowereffectiveinterest
rate. Capitalized interest costs were lower in 2011 primarily due to our
ongoing deployment of the 4G LTE network.
Provision (Benefit) for Income Taxes
(dollars in millions)
2012
Years Ended December 31,
Provision (Benefit) for income taxes
Effective income tax rate
(218)
(522)
304
$
(660)
(6.7)%
2011
$
285
2.7 %
2012 vs. 2011
2010
$
2,467
19.4 %
Increase/(Decrease)
2011 vs. 2010
$
(945)
nm
$ (2,182)
(88.4) %
nm - not meaningful
The effective income tax rate is calculated by dividing the provision
for income taxes by income before the provision for income taxes. Our
effective income tax rate is significantly lower than the statutory federal
income tax rate for all years presented due to the inclusion of income
attributabletoVodafoneGroupPlc.’s(Vodafone)noncontrollinginterestin
the Verizon Wireless partnership within our income before the provision
for income taxes. In 2012, we recorded a tax benefit on income before
the provision for income taxes, which resulted in a negative effective
income tax rate. In this circumstance, including the income attributable
toVodafone’snoncontrollinginterestintheVerizonWirelesspartnership
in our income before the provision for income taxes resulted in our negative effective tax rate being 300.3 percentage points higher during 2012.
In 2011 and 2010, we recorded a tax provision on income before the provision for income taxes and when we include the income attributable to
Vodafone’snoncontrollinginterestintheVerizonWirelesspartnershipin
our income before the provision for income taxes it resulted in our effective income tax rate being 7.9 percentage points lower during 2011 and
29.8 percentage points lower during 2010.
The effective income tax rate for 2012 was (6.7)% compared to 2.7% for
2011. The negative effective income tax rate for 2012 and the decrease
in the provision for income taxes during 2012 compared to 2011 was
primarily due to lower income before income taxes as a result of higher
severance, pension, and benefit charges as well as early debt redemption
costs recorded in the current year.
The effective income tax rate in 2011 decreased to 2.7% from 19.4% in
2010. This decrease was primarily driven by lower income before provision for income taxes as a result of higher pension and benefit charges
recorded in 2011 as well as tax benefits from state valuation allowance
reversals in 2011. The decrease was also due to a one-time, non-cash
income tax charge of $1.0 billion recorded during the three months ended
March31,2010asaresultoftheenactmentofthePatientProtectionand
AffordableCareActandtheHealthCareandEducationReconciliation
Actof2010,bothofwhichbecamelawinMarch2010(collectivelythe
HealthCareAct).UndertheHealthCareAct,beginningin2013,Verizon
andothercompaniesthatreceiveasubsidyunderMedicarePartDto
provide retiree prescription drug coverage will no longer receive a federal income tax deduction for the expenses incurred in connection with
providing the subsidized coverage to the extent of the subsidy received.
Because future anticipated retiree prescription drug plan liabilities and
relatedsubsidiesarealreadyreflectedinVerizon’sfinancialstatements,
this change in law required Verizon to reduce the value of the related tax
benefits recognized in its financial statements in the period during which
the Health Care Act was enacted.
A reconciliation of the statutory federal income tax rate to the effective
income tax rate for each period is included in Note 12 to the consolidated financial statements.
Net Income Attributable to Noncontrolling Interest
Years Ended December 31,
Net income attributable to noncontrolling
interest
(dollars in millions)
2012
$ 9,682
2011
$
7,794
The increases in Net income attributable to noncontrolling interest during
2012 compared to 2011, and 2011 compared to 2010 were due to higher
earnings in our Verizon Wireless segment, which has a 45% noncontrolling partnership interest attributable to Vodafone.
28
2010
$
7,668
Increase/(Decrease)
2011 vs. 2010
2012 vs. 2011
$ 1,888
24.2 %
$
126
1.6 %
MANAGEMENT’S DISCUSSION AND ANALYSIS
OF FINANCIAL CONDITION AND RESULTS OF OPERATIONS continued
SEGMENT RESULTS OF OPERATIONS
We have two reportable segments, Verizon Wireless and Wireline, which we operate and manage as strategic business units and organize by products
and services. We measure and evaluate our reportable segments based on segment operating income. The use of segment operating income is consistentwiththechiefoperatingdecisionmaker’sassessmentofsegmentperformance.
Segment earnings before interest, taxes, depreciation and amortization (Segment EBITDA), which is presented below, is a non-GAAP measure and
doesnotpurporttobeanalternativetooperatingincomeasameasureofoperatingperformance.Managementbelievesthatthismeasureisuseful
to investors and other users of our financial information in evaluating operating profitability on a more variable cost basis as it excludes the depreciation and amortization expenses related primarily to capital expenditures and acquisitions that occurred in prior years, as well as in evaluating
operating performance in relation to our competitors. Segment EBITDA is calculated by adding back depreciation and amortization expense to segment operating income.
Verizon Wireless Segment EBITDA service margin, also presented below, is calculated by dividing Verizon Wireless Segment EBITDA by Verizon Wireless
service revenues. Verizon Wireless Segment EBITDA service margin utilizes service revenues rather than total revenues. Service revenues primarily
exclude equipment revenues in order to reflect the impact of providing service to the wireless customer base on an ongoing basis. Verizon Wireline
EBITDA margin is calculated by dividing Wireline EBITDA by total Wireline revenues. You can find additional information about our segments in Note
13 to the consolidated financial statements.
Verizon Wireless
Our Verizon Wireless segment is primarily comprised of Cellco Partnership doing business as Verizon Wireless. Cellco Partnership is a joint venture
formedinApril2000bythecombinationoftheU.S.wirelessoperationsandinterestsofVerizonandVodafone.Verizonownsacontrolling55%interest
in Verizon Wireless and Vodafone owns the remaining 45%. Verizon Wireless provides wireless communications services across one of the most extensivewirelessnetworksintheUnitedStates.
Weprovidetheseservicesandequipmentsalestoconsumer,businessandgovernmentcustomersintheUnitedStatesonapostpaidandprepaid
basis. Postpaid connections represent individual lines of service for which a customer is billed in advance a monthly access charge in return for a
monthly network service allowance, and usage beyond the allowances is billed monthly in arrears. Our prepaid service enables individuals to obtain
wireless services without a long-term contract or credit verification by paying for all services in advance.
All financial results included in the tables below reflect the consolidated results of Verizon Wireless.
Operating Revenues and Selected Operating Statistics
(dollarsinmillions,exceptARPA)
Increase/(Decrease)
2011 vs. 2010
2012
2011
2010
Retailservice
Other service
Service revenue
Equipment and other
Total Operating Revenues
$ 61,440
2,293
63,733
12,135
$ 75,868
$ 56,660
2,497
59,157
10,997
$ 70,154
$ 53,308
2,321
55,629
7,778
$ 63,407
Connections ('000):(1)
Retailconnections
Retailpostpaidconnections
98,230
92,530
92,167
87,382
87,535
83,125
6,063
5,148
6.6
5.9
4,632
4,257
5.3
5.1
5,917
5,024
4,624
4,252
1,977
2,529
1,293
772
28.0
18.2
2,647
1,723
nm
68.1
1.19%
0.91%
1.26%
0.95%
1.38%
1.02%
$ 144.04
35,057
2.64
$ 134.51
34,561
2.53
$ 125.75
34,268
2.43
9.53
496
0.11
7.1
1.4
4.3
8.76
293
0.10
7.0
0.9
4.1
Years Ended December 31,
Net additions in period ('000):(2)
Retailconnections
Retailpostpaidconnections
ChurnRate:
Retailconnections
Retailpostpaidconnections
Account Statistics:
RetailpostpaidARPA
Retailpostpaidaccounts('000):(1)
Retailpostpaidconnectionsperaccount(1)
2012 vs. 2011
$ 4,780
(204)
4,576
1,138
$ 5,714
$
8.4 %
(8.2)
7.7
10.3
8.1
$
$
$
3,352
176
3,528
3,219
6,747
6.3 %
7.6
6.3
41.4
10.6
(1) As of end of period
(2) Excluding acquisitions and adjustments
nm - not meaningful
29
MANAGEMENT’S DISCUSSION AND ANALYSIS
OF FINANCIAL CONDITION AND RESULTS OF OPERATIONS continued
2012 Compared to 2011
TheincreaseinVerizonWireless’ totaloperatingrevenuesduring2012
compared to 2011 was the result of growth in both service and equipment and other revenue.
2011 Compared to 2010
The increase inVerizonWireless’ total operating revenue during 2011
compared to 2010 was primarily due to growth in both service and
equipment revenue.
Accounts and Connections
Retail (non-wholesale) postpaid accounts represent retail customers
under contract with Verizon Wireless that are directly served and managed by Verizon Wireless and use its branded services. Accounts include
single connection plans, family plans, Share Everything plans and corporate accounts. A single account may receive monthly wireless services
foravarietyofconnecteddevices.Retailconnectionsrepresentourretail
customer device connections. Churn is the rate at which service to a connection is terminated.
Accounts and Connections
Retailconnectionsincreasedduring2011comparedto2010primarily
due to an increase in retail postpaid and prepaid connection gross additions as well as ongoing improvements in our retail connection churn
rate, both of which we believe were primarily the result of the strength
of the devices in our product portfolio, including the Apple iPhone 4
and 4S, and our line-up of 3G and 4G Android and other 4G LTE capable
devices, as well as the reliability of our network.
Retailconnectionsunderanaccountmayincludesmartphones,basic
phones,HomePhoneConnect,HomeFusion,tablets,andotherInternet
devices. We expect to continue to experience retail connection growth
based on the strength of our product offerings and network service
quality.Retailconnectionnetadditionsincreasedduring2012compared
to 2011 primarily due to an increase in retail postpaid and prepaid connection gross additions and improvements in our retail connections
churn rate. Higher retail postpaid connection gross additions during
2012 primarily reflect the launch of our Share Everything plans coupled
with new device introductions during the second half of 2012.
Retail Postpaid Connections per Account
Retailpostpaidconnectionsperaccountiscalculatedbydividingthe
total number of retail postpaid connections by the average number of
retailpostpaidaccountsintheperiod.Retailpostpaidconnectionsper
account increased during 2012 compared to 2011 primarily due to the
increased use of tablets and other Internet devices.
Service Revenue
Service revenue increased during 2012 compared to 2011 primarily
driven by higher retail postpaid service revenue, which increased largely
as a result of an increase in retail postpaid connections of 5.1 million in
2012, as well as the continued increase in penetration of higher priced
smartphones. This increased penetration also contributed to the increase
inourretailpostpaidARPA(theaveragerevenueperaccountfromretail
postpaid accounts).
The increase in retail postpaid ARPA during 2012 compared to 2011
was primarily driven by increases in smartphone penetration and retail
postpaid connections per account. During 2012, we experienced a 4.3%
increase in retail postpaid connections per account compared to 2011,
with smartphones representing 58.1% of our retail postpaid phone base
as of December 31, 2012 compared to 43.5% as of December 31, 2011.
The increase in retail postpaid connections per account is primarily due
to increases in Internet data devices, which represented 9.3% of our retail
postpaid connection base as of December 31, 2012 compared to 8.1%
as of December 31, 2011 primarily due to strong sales of tablets and
Jetpacks™.
Other service revenue decreased during 2012 compared to 2011 primarily as a result of a decrease in third party roaming revenue.
Equipment and Other Revenue
Equipment and other revenue increased during 2012 compared to 2011
primarily due to increases in device upgrade fees, regulatory fees and
equipment sales.
30
Retail Postpaid Connections per Account
Retailpostpaidconnectionsperaccountincreasedduring2011compared to 2010 primarily due to the increased use of tablets and other
Internet devices.
Service Revenue
Service revenue increased during 2011 compared to 2010 primarily
driven by higher retail postpaid service revenue which increased as a
result of an increase in retail postpaid connections of 4.3 million as well
as the continued increase in penetration of higher priced smartphones,
whichalsocontributedtotheincreaseinourretailpostpaidARPA.
The increase in retail postpaid ARPA for 2011 compared to 2010 was
primarily driven by increases in smartphone penetration and in retail
postpaid connections per account. The proportion of our retail postpaid
phone base utilizing smartphones increased to 43.5% as of December
31, 2011 compared to 28.1% as of December 31, 2010 and retail postpaid
connections per account increased by 4.1% during 2011 compared to
2010. The increase in retail postpaid connections per account is primarily
due to increases in Internet data devices, which represented 8.1% of our
retail postpaid connection base as of December 31, 2011 compared to
7.0%asofDecember31,2010primarilyduetostrongsalesofJetpacks.
Other service revenue increased during 2011 compared to 2010 as a
result of year-to-date growth in wholesale and other connections, partially offset by a decrease in third party roaming revenue.
Equipment and Other Revenue
Equipment and other revenue increased during 2011 compared to 2010
due to an increase in the sales volume of smartphones to new and
upgrading customers.
MANAGEMENT’S DISCUSSION AND ANALYSIS
OF FINANCIAL CONDITION AND RESULTS OF OPERATIONS continued
Operating Expenses
Years Ended December 31,
Cost of services and sales
Selling, general and administrative expense
Depreciation and amortization expense
Total Operating Expenses
(dollars in millions)
2012
2011
2010
$ 24,490
21,650
7,960
$ 54,100
$ 24,086
19,579
7,962
$ 51,627
$ 19,245
18,082
7,356
$ 44,683
Cost of Services and Sales
Cost of services and sales increased during 2012 compared to 2011 primarily due to $0.7 billion in higher cost of equipment sales, which was
driven by increased sales of higher cost smartphones, increased cost
of network services and increased data roaming, partially offset by a
decrease in cost for data services, a decrease in network connection costs
due to the ongoing deployment of Ethernet backhaul facilities primarily
targeted at sites upgrading to 4G LTE and a decrease in the cost of long
distance.
Cost of services and sales increased during 2011 compared to 2010
primarily due to higher costs of equipment sales. Cost of equipment
sales increased by $4.9 billion driven by increased sales of higher cost
smartphones,includingApple’siPhone4and4Sandotherdata-capable
devices. In addition, cost of services increased during 2011 due to higher
wireless network costs resulting from an increase in local interconnection
costs related to additional Evolution-Data Optimized (EV-DO) capacity to
meet expected data usage demands as well as an increase in Ethernet
facilities costs that support the 4G LTE network. The increase in cost of
services was also impacted by higher roaming costs incurred in markets
divested during 2010 and increased data roaming. Partially offsetting
these increases was a decrease in costs for long distance and data services and applications.
Increase/(Decrease)
2011 vs. 2010
2012 vs. 2011
$
404
2,071
(2)
$ 2,473
1.7 %
10.6
–
4.8
$
$
Segment Operating Income
Add Depreciation and amortization expense
Segment EBITDA
Segment operating income margin
Segment EBITDA service margin
25.2 %
8.3
8.2
15.5
Selling, General and Administrative Expense
Selling, general and administrative expense increased during 2012 compared to 2011 primarily due to higher sales commission expense in our
indirect channel as well as costs associated with regulatory fees. Indirect
sales commission expense increased $1.3 billion during 2012 compared
to 2011 primarily as a result of increases in the average commission per
unit, as the mix of units continues to shift toward smartphones and more
customers activate data services.
Selling, general and administrative expense increased during 2011 compared to 2010 primarily due to higher sales commission expense in our
indirect channel. Indirect sales commission expense increased $1.2 billion during 2011 compared to 2010 as a result of increases in the average
commission per unit, as the mix of units continues to shift toward data
devices and more customers activate data services, and increased contract renewals in connection with equipment upgrades.
Depreciation and Amortization Expense
Depreciation and amortization expense was essentially unchanged
during 2012 compared to 2011. The increase in depreciation and amortization expense during 2011 compared to 2010 was primarily driven by
growth in depreciable assets.
Segment Operating Income and EBITDA
Years Ended December 31,
4,841
1,497
606
6,944
(dollars in millions)
2012
2011
2010
$ 21,768
7,960
$ 29,728
$ 18,527
7,962
$ 26,489
$ 18,724
7,356
$ 26,080
28.7%
46.6%
26.4%
44.8%
29.5%
46.9%
The changes in the table above during the periods presented were primarily a result of the factors described in connection with operating
revenues and operating expenses above.
Increase/(Decrease)
2011 vs. 2010
2012 vs. 2011
$ 3,241
(2)
$ 3,239
17.5 %
–
12.2
$
$
(197)
606
409
(1.1) %
8.2
1.6
Non-recurringornon-operationalitemsexcludedfromVerizonWireless’
Operating income were as follows:
(dollars in millions)
2012
Years Ended December 31,
Mergerintegrationandacquisition
related charges
Severance, pension and benefit charges
Impact of divested operations
Deferred revenue adjustment
$
$
–
37
–
–
37
2011
$
$
–
76
–
–
76
2010
$
$
867
–
(348)
235
754
31
MANAGEMENT’S DISCUSSION AND ANALYSIS
OF FINANCIAL CONDITION AND RESULTS OF OPERATIONS continued
Wireline
The Wireline segment provides communications products and services including local exchange and long distance voice service, broadband video
anddata,IPnetworkservices,networkaccessandotherservicestoconsumers,smallbusinessesandcarriersintheUnitedStates,aswellastobusinessesandgovernmentcustomersbothintheUnitedStatesandinover150othercountriesaroundtheworld.
Reclassificationshavebeenmadetoreflectcomparableoperatingresultsforthespin-offoftheoperationsincludedintheFrontiertransaction,which
weownedthroughJune30,2010(see“AcquisitionsandDivestitures”).
Operating Revenues and Selected Operating Statistics
Years Ended December 31,
Consumer retail
Small business
MassMarkets
Strategic services
Core
Global Enterprise
Global Wholesale
Other
Total Operating Revenues
Connections ('000):(1)
Total voice connections
Total Broadband connections
FiOSInternetsubscribers
FiOSVideosubscribers
(dollars in millions)
2012
2011
2010
$ 14,043
2,659
16,702
8,052
7,247
15,299
7,240
539
$ 39,780
$ 13,606
2,731
16,337
7,575
8,047
15,622
7,973
750
$ 40,682
$ 13,419
2,837
16,256
6,594
8,722
15,316
8,746
909
$ 41,227
22,503
24,137
26,001
8,795
5,424
4,726
8,670
4,817
4,173
8,392
4,082
3,472
Increase/(Decrease)
2011 vs. 2010
2012 vs. 2011
$
$
437
(72)
365
477
(800)
(323)
(733)
(211)
(902)
(1,634)
125
607
553
3.2 %
(2.6)
2.2
6.3
(9.9)
(2.1)
(9.2)
(28.1)
(2.2)
(6.8)
1.4
12.6
13.3
$
$
187
(106)
81
981
(675)
306
(773)
(159)
(545)
1.4 %
(3.7)
0.5
14.9
(7.7)
2.0
(8.8)
(17.5)
(1.3)
(1,864)
(7.2)
278
735
701
3.3
18.0
20.2
(1) As of end of period
Wireline’srevenuesdecreasedduring2012comparedto2011primarily
driven by declines in Global Wholesale, Global Enterprise Core and Other
revenues, partially offset by higher revenues in Consumer retail driven by
FiOSservicesandhigherrevenuesfromStrategicservices.
Mass Markets
MassMarketsoperationsprovidelocalexchange(basicserviceandenduser access) and long distance (including regional toll) voice services, as
wellasbroadbandservices(includinghigh-speedInternet,FiOSInternet
andFiOSVideo)toConsumerretailandSmallbusinesssubscribers.
2012 Compared to 2011
MassMarketsrevenuesincreasedduring2012comparedto2011primarilyduetotheexpansionofFiOSservices(Voice,InternetandVideo)
as well as changes in our pricing strategy adopted in 2012, partially offset
by the continued decline of local exchange revenues.
We have continued to grow our subscriber base and consistently
improvedpenetrationrateswithinourFiOSserviceareasduring2012.
Also contributing to the increase in revenue from FiOS services were
changes in our pricing strategy adopted in 2012. As of December 31,
2012,weachievedpenetrationratesof37.3%and33.3%forFiOSInternet
and FiOSVideo, respectively, compared to penetration rates of 35.5%
and31.5%forFiOSInternetandFiOSVideo,respectively,atDecember
31, 2011.
MassMarketsrevenueswerenegativelyimpactedbythedeclineoflocal
exchange revenues primarily due to a 6.1% decline in Consumer retail
voice connections resulting primarily from competition and technology
substitution with wireless, VoIP, broadband and cable services. Total voice
connections include traditional switched access lines in service as well
asFiOSdigitalvoiceconnections.TherewasalsoadeclineinSmallbusiness retail voice connections, primarily reflecting challenging economic
conditions, competition and a shift to both IP and high-speed circuits.
32
2011 Compared to 2010
MassMarketsrevenuesincreasedslightlyduring2011comparedto2010
primarilyduetotheexpansionofconsumerandsmallbusinessFiOSservices (Voice, Internet, Video), partially offset by the continued decline of
local exchange revenues.
As we continued to expand the number of premises eligible to order
FiOSservicesandoursalesandmarketingeffortstoattractnewFiOS
subscribers, we continued to grow our subscriber base and consistently
improvedpenetrationrateswithinourFiOSserviceareas.Ourpricing
strategy allows us to provide competitive offerings to our customers and
potential customers. As of December 31, 2011, we achieved penetration
ratesof35.5%and31.5%forFiOSInternetandFiOSVideo,respectively,
comparedtopenetrationratesof31.9%and28.0%forFiOSInternetand
FiOSVideo,respectively,atDecember31,2010.
MassMarketsrevenueswerenegativelyimpactedbythedeclineoflocal
exchange revenues primarily due to a 7.2% decline in total voice connections, which resulted primarily from competition and technology
substitution. Total voice connections include traditional switched access
linesinserviceaswellasFiOSdigitalvoiceconnections.Themajorityof
the decline in total voice connections was sustained in the residential
retail market, which experienced a 7.3% voice connection loss primarily
due to substituting traditional landline services with wireless, VoIP, broadband and cable services. There was also a 5.3% decline in small business
retail voice connections, primarily reflecting challenging economic conditions, competition and a shift to both IP and high-speed circuits.
MANAGEMENT’S DISCUSSION AND ANALYSIS
OF FINANCIAL CONDITION AND RESULTS OF OPERATIONS continued
Global Enterprise
Global Enterprise offers Strategic services including network products
and solutions, advanced communications services, and other core
communications services to medium and large business customers, multinational corporations and state and federal government customers.
Global Wholesale
Global Wholesale provides communications services including data,
voice and local dial tone and broadband services primarily to local, long
distance and other carriers that use our facilities to provide services to
their customers.
2012 Compared to 2011
Global Enterprise revenues decreased during 2012 compared to 2011 primarily due to lower local services and traditional circuit-based revenues,
a decline in customer premise equipment revenues and the unfavorable impact of foreign currency translation. Core services, which consist
of traditional circuit-based services such as frame relay, private line and
AsynchronousTransferMode(ATM)services,declinedcomparedtothe
similar period last year as our customer base continued to migrate to
next generation IP services. The decline in customer premise equipment
revenues reflects our focus on improving margins by continuing to deemphasize sales of equipment that is not part of an overall enterprise
solutions bundle. This decrease was partially offset by higher Strategic
services revenues. Strategic services revenues increased $0.5 billion, or
6.3% during 2012 compared to 2011 primarily due to growth in advanced
services, such as managed network solutions, contact center solutions, IP
communications and our cloud and data center offerings.
2012 Compared to 2011
Global Wholesale revenues decreased during 2012 compared to 2011
primarily due to a decline in traditional voice revenues as a result of
decreasedMOUsanda5.3%declineindomesticwholesaleconnections.
The traditional voice product reductions are primarily due to the continued impact of competitors deemphasizing their local market initiatives
coupled with the impact of technology substitution. Also contributing
to the decline in voice revenues is the elimination of low margin international products and the continuing contraction of market rates due
to competition. Partially offsetting the overall decrease in wholesale revenue was a continuing demand for high-speed digital data services from
fiber-to-the-cell customers upgrading their core data circuits to Ethernet
facilities as well as Ethernet migrations from other core customers. As a
result of the customer upgrades, the number of core data circuits experienced a 9.6% decline compared to the similar periods in 2011. We expect
Global Wholesale revenue to continue to decline approximately 10% per
quarter compared to the similar periods in the prior year, as we believe
that the continued decline in core products will only be partially offset by
growth in Ethernet and IP services.
2011 Compared to 2010
Global Enterprise Core and Other revenues increased during 2011 compared to 2010 primarily driven by higher Strategic services revenues, in
part due to the inclusion of the revenues of Terremark, partially offset by
lower local services and traditional circuit-based revenues and decreased
revenues from the sale of customer premise equipment. Strategic services revenues increased $1.0 billion, or 15.2%, during 2011 compared
to 2010 primarily due to growth in advanced services. Traditional circuitbased services declined compared to the similar period last year as our
customer base continues to migrate to next generation IP services. The
decline in customer premise equipment revenues reflects our focus on
improving margins by de-emphasizing sales of equipment that is not a
part of an overall enterprise solutions bundle.
2011 Compared to 2010
The decrease in Global Wholesale revenues during 2011 compared to
2010 was primarily due to a $0.4 billion decline in international voice revenuesasaresultofdecreasedMOUsintraditionalvoiceproductsasa
result of increases in voice termination pricing on certain international
routes, which negatively impacted volume, and continued rate compression due to competition in the marketplace. Switched access and
interexchangewholesaleMOUsdeclinedprimarilyasaresultofwireless
substitution and connection losses. Domestic wholesale connections as
of December 31, 2011 declined 8.3% from December 31, 2010 due to the
continued impact of competitors deemphasizing their local market initiatives coupled with the impact of technology substitution. Voice and local
loop services declined during 2011 compared to 2010. Partially offsetting the overall decrease in Global Wholesale revenue was a continuing
demand for high-speed digital data services primarily due to fiber-tothe-cell customers upgrading their core data circuits to Ethernet facilities.
As a result of the upgrading customers, the number of DS1/DS3 circuits
experienced a 9.5% decline compared to the similar period in 2010.
Other
Other revenues include such services as local exchange and long distanceservicesfromformerMCImassmarketcustomersandoperator
services. The decrease in revenues from other services during 2012 and
2011wasprimarilyduetoreducedvolumes,includingformerMCImass
market customer losses.
33
MANAGEMENT’S DISCUSSION AND ANALYSIS
OF FINANCIAL CONDITION AND RESULTS OF OPERATIONS continued
Operating Expenses
(dollars in millions)
2012
2011
2010
$ 22,413
8,883
8,424
$ 39,720
$ 22,158
9,107
8,458
$ 39,723
$ 22,618
9,372
8,469
$ 40,459
Years Ended December 31,
Cost of services and sales
Selling, general and administrative expense
Depreciation and amortization expense
Total Operating Expenses
Cost of Services and Sales
Cost of services and sales increased during 2012 compared to 2011,
primarilyduetohighercontentcostsassociatedwithcontinuedFiOS
subscriber growth and vendor rate increases and increased expenses
related to our cloud and data center offerings. Cost of services and sales
wasalsoimpactedbyhighercostsrelatedtoFiOSinstallation,aswellas
higher repair and maintenance expenses caused by storm-related events
in 2012 compared to 2011. The increases were partially offset by a decline
in access costs primarily from management actions to reduce exposure
to unprofitable international wholesale routes and declines in overall
wholesale long distance volumes. Costs related to customer premise
equipment also decreased, which reflects our focus on improving margins by de-emphasizing sales of equipment that are not part of an overall
enterprise solutions bundle.
Cost of services and sales decreased during 2011 compared to 2010
due to a decrease in access costs resulting primarily from management
actions to reduce exposure to unprofitable international wholesale
routes and declines in overall wholesale long distance volumes, as well as
lower pension and other postretirement benefit expenses. The decrease
was partially offset by higher costs related to repair and maintenance
expenses caused by storm-related events during the third quarter of
2011,contentcostsassociatedwithcontinuedFiOSsubscribergrowth
and the acquisition of Terremark in the second quarter of 2011.
Increase/(Decrease)
2011 vs. 2010
2012 vs. 2011
$
$
255
(224)
(34)
(3)
1.2 %
(2.5)
(0.4)
–
$
$
Selling, general and administrative expense decreased during 2011 compared to 2010 primarily due to lower pension and other postretirement
benefits and compensation expense, partially offset by higher costs
caused by storm-related events in the third quarter of 2011, as well as the
acquisition of Terremark in the second quarter of 2011.
Depreciation and Amortization Expense
Depreciation and amortization expense decreased during 2012 compared to 2011 due to a decrease in net depreciable assets. The decrease
was partially offset by an increase in amortization expense related to
non-network software.
Depreciation and amortization expense was effectively flat during 2011
compared to 2010 primarily due to a decrease in amortization expense as
a result of a reduction in capitalized non-network software, partially offset
by an increase in depreciation expense primarily due to the acquisition of
Terremark in the second quarter of 2011.
(dollars in millions)
Increase/(Decrease)
2012
Years Ended December 31,
Segment operating income margin
Segment EBITDA margin
$
60
8,424
$ 8,484
0.2%
21.3%
2011
$
$
959
8,458
9,417
2.4%
23.1%
The changes in Wireline’s Operating income, Segment EBITDA and
Segment EBITDA margin during the periods presented were primarily
a result of the factors described in connection with operating revenues
and operating expenses above.
$
$
768
8,469
9,237
2011 vs. 2010
2012 vs. 2011
2010
$
$
(899)
(34)
(933)
(93.7)%
(0.4)
(9.9)
$
$
24.9%
(0.1)
1.9
191
(11)
180
1.9%
22.4%
Non-recurring or non-operational items excluded from Wireline’s
Operating income were as follows:
(dollars in millions)
2012
Years Ended December 31,
Severance, pension and benefit charges
Access line spin-off related charges
Impact of divested operations
Other costs
$
$
34
(2.0) %
(2.8)
(0.1)
(1.8)
Selling, General and Administrative Expense
Selling, general and administrative expense decreased during 2012 compared to 2011 primarily due to lower allocations related to centralized
administrative functions, and to a lesser extent, lower property and transaction tax expenses and employee costs.
Segment Operating Income and EBITDA
Segment Operating Income
Add Depreciation and amortization expense
Segment EBITDA
(460)
(265)
(11)
(736)
–
–
–
56
56
2011
$
$
–
–
–
–
–
2010
$
$
2,237
79
(408)
–
1,908
MANAGEMENT’S DISCUSSION AND ANALYSIS
OF FINANCIAL CONDITION AND RESULTS OF OPERATIONS continued
OTHER ITEMS
Severance, Pension and Benefit Charges
Early Debt Redemption and Other Costs
During 2012, we recorded net pre-tax severance, pension and benefits
charges of approximately $7.2 billion primarily for our pension and postretirement plans in accordance with our accounting policy to recognize
actuarial gains and losses in the year in which they occur. The charges
were primarily driven by a decrease in our discount rate assumption
used to determine the current year liabilities from 5% at December 31,
2011 to a weighted-average of 4.2% at December 31, 2012 ($5.3 billion)
and revisions to the retirement assumptions for participants and other
assumption adjustments, partially offset by the difference between our
estimated return on assets of 7.5% and our actual return on assets of
10% ($0.7 billion). As part of this charge, we also recorded $1.0 billion
relatedtotheannuitizationofpensionliabilities(see“EmployeeBenefit
PlanFundedStatusandContributions”),aswellasseverancechargesof
$0.4 billion primarily for approximately 4,000 management employees.
During November 2012, we recorded debt redemption costs of $0.8 billion in connection with the purchase of $0.9 billion of the $1.25 billion of
8.95% Verizon Communications Notes due 2039 in a cash tender offer.
During 2011, we recorded net pre-tax severance, pension and benefits
charges of approximately $6.0 billion for our pension and postretirement
plans in accordance with our accounting policy to recognize actuarial
gains and losses in the year in which they occur. The charges were primarily driven by a decrease in our discount rate assumption used to
determine the current year liabilities from 5.75% at December 31, 2010 to
5% at December 31, 2011 ($5.0 billion); the difference between our estimated return on assets of 8% and our actual return on assets of 5% ($0.9
billion); and revisions to the life expectancy of participants and other
adjustments to assumptions.
During 2010, we recorded net pre-tax severance, pension and benefits
charges of $3.1 billion. The charges during 2010 included remeasurement losses of $0.6 billion, for our pension and postretirement plans in
accordance with our accounting policy to recognize actuarial gains and
losses in the year in which they occur. Additionally, in 2010, we reached
an agreement with certain unions on temporary enhancements to the
separation programs contained in their existing collective bargaining
agreements. These temporary enhancements were intended to help
address a previously declared surplus of employees and to help reduce
the need for layoffs. Accordingly, we recorded severance, pension and
benefits charges associated with approximately 11,900 union-represented employees who volunteered for the incentive offer. These charges
included $1.2 billion for severance for the 2010 separation programs
mentioned above and a planned workforce reduction of approximately
2,500 employees in 2011. In addition, we recorded $1.3 billion for pension
and postretirement curtailment losses and special termination benefits
due to the workforce reductions.
The Consolidated Adjusted EBITDA non-GAAP measure presented
in the Consolidated Operating Income and EBITDA discussion (See
“ConsolidatedResultsofOperations”)excludestheseverance,pension
and benefit charges presented above.
During December 2012, we recorded debt redemption costs of $0.3 billion in connection with the early redemption of $0.7 billion of the $2.0
billion of 8.75% Verizon Communications Notes due 2018, $1.0 billion of
4.625%VerizonVirginiaLLCDebentures,SeriesA,dueMarch2013and
$0.75billionof4.35%VerizonCommunicationsNotesdueFebruary2013,
as well as $0.3 billion of other costs.
During November 2011, we recorded debt redemption costs of $0.1 billion in connection with the early redemption of $1.0 billion of 7.375%
Verizon Communications Notes due September 2012, $0.6 billion of
6.875%VerizonCommunicationsNotesdueJune2012,$0.4billionof
6.125%VerizonFloridaInc.DebenturesdueJanuary2013,$0.5billionof
6.125%VerizonMarylandInc.DebenturesdueMarch2012and$1.0billion of 6.875% Verizon New York Inc. Debentures due April 2012.
The Consolidated Adjusted EBITDA non-GAAP measure presented
in the Consolidated Operating Income and EBITDA discussion (See
“ConsolidatedResultsofOperations”)excludestheearlydebtredemption and other costs presented above.
Litigation Settlements
In the third quarter of 2012, we settled a number of patent litigation matters, including cases with ActiveVideo Networks Inc. (ActiveVideo) and
TiVo Inc. (TiVo). In connection with the settlements with ActiveVideo and
TiVo, we recorded a charge of $0.4 billion in the third quarter of 2012 and
will pay and recognize over the next six years an additional $0.2 billion.
The Consolidated Adjusted EBITDA non-GAAP measure presented
in the Consolidated Operating Income and EBITDA discussion (See
“ConsolidatedResultsofOperations”)excludesthelitigationsettlement
costs presented above.
Merger Integration Charges
During 2010, we recorded pre-tax merger integration charges of $0.9
billion primarily related to the Alltel acquisition. These charges were
primarily due to the decommissioning of overlapping cell sites, preacquisition contingencies, handset conversions and trade name amortization.
The Consolidated Adjusted EBITDA non-GAAP measure presented
in the Consolidated Operating Income and EBITDA discussion (See
“ConsolidatedResultsofOperations”)excludesthemergerintegration
charges presented above.
Dispositions
Access Line-Spin-off Related Charges
During 2010, we recorded pre-tax charges of $0.5 billion, primarily for
costs incurred related to network, non-network software and other activitiestoenablethedivestedmarketsinthetransactionwithFrontierto
operate on a stand-alone basis subsequent to the closing of the transaction; professional advisory and legal fees in connection with this
transaction; and fees related to the early extinguishment of debt from the
useofproceedsfromthetransaction(see“AcquisitionsandDivestitures”).
35
MANAGEMENT’S DISCUSSION AND ANALYSIS
OF FINANCIAL CONDITION AND RESULTS OF OPERATIONS continued
Alltel Divestiture Markets
During the second quarter of 2010, we recorded a tax charge of
approximately $0.2 billion for the taxable gain associated with the Alltel
DivestitureMarkets(see“AcquisitionsandDivestitures”).
The Consolidated Adjusted EBITDA non-GAAP measure presented
in the Consolidated Operating Income and EBITDA discussion (See
“ConsolidatedResultsofOperations”)excludestheaccesslinespin-off
andAlltelDivestitureMarketschargespresentedabove.
CONSOLIDATED FINANCIAL CONDITION
(dollars in millions)
Years Ended December 31,
Cash Flows Provided By (Used In)
Operating activities
Investing activities
Financing activities
Increase (Decrease) In Cash and Cash
Equivalents
2012
2011
2010
$ 31,486
(20,502)
(21,253)
$ 29,780
(17,250)
(5,836)
$ 33,363
(15,054)
(13,650)
$ (10,269)
$
$
6,694
4,659
Medicare Part D Subsidy Charges
UnderthePatientProtectionandAffordableCareActandtheHealthCare
andEducationReconciliationActof2010,bothofwhichbecamelawin
March2010(collectivelytheHealthCareAct),beginningin2013,Verizon
andothercompaniesthatreceiveasubsidyunderMedicarePartDto
provide retiree prescription drug coverage will no longer receive a federal income tax deduction for the expenses incurred in connection with
providing the subsidized coverage to the extent of the subsidy received.
Because future anticipated retiree prescription drug plan liabilities and
relatedsubsidiesarealreadyreflectedinVerizon’sfinancialstatements,
this change in law required Verizon to reduce the value of the related
tax benefits recognized in its financial statements in the period during
which the Health Care Act was enacted. As a result, Verizon recorded a
one-time, non-cash income tax charge of $1.0 billion in the first quarter
of 2010 to reflect the impact of this change.
The Consolidated Adjusted EBITDA non-GAAP measure presented
in the Consolidated Operating Income and EBITDA discussion (See
“ConsolidatedResultsofOperations”)excludestheMedicarePartDsubsidy charges presented above.
Deferred Revenue Charges
Corporate, eliminations and other during the periods presented include
a non-cash adjustment of $0.2 billion in 2010, primarily to adjust wireless service revenues. This adjustment was recorded to properly defer
previously recognized wireless service revenues that were earned and
recognized in future periods. The adjustment was recorded during 2010,
which reduced Net income attributable to Verizon by approximately $0.1
billion.
The Consolidated Adjusted EBITDA non-GAAP measure presented
in the Consolidated Operating Income and EBITDA discussion (See
“Consolidated Results of Operations”) excludes the deferred revenue
charges presented above.
We use the net cash generated from our operations to fund network
expansion and modernization, repay external financing, pay dividends,
repurchase Verizon common stock from time to time and invest in new
businesses. Our sources of funds, primarily from operations and, to the
extent necessary, from external financing arrangements, are sufficient
to meet ongoing operating and investing requirements. We expect
that our capital spending requirements will continue to be financed
primarily through internally generated funds. Debt or equity financing
may be needed to fund additional development activities or to maintain an appropriate capital structure to ensure our financial flexibility. Our
cash and cash equivalents are primarily held domestically in diversified
accounts and are invested to maintain principal and liquidity. Accordingly,
we do not have significant exposure to foreign currency fluctuations.
The volatility in world debt and equity markets has not had a significant
impact on our ability to access external financing. Our available external
financing arrangements include the issuance of commercial paper, credit
available under credit facilities and other bank lines of credit, vendor
financing arrangements, issuances of registered debt or equity securities
and privately-placed capital market securities.
On February 7, 2012, we filed a new shelf registration statement for the
issuance of debt or equity securities with an aggregate offering price of
up to $10 billion. In connection with this filing, the previous shelf registration statement was terminated. As of December 31, 2012, the shelf
registration had an aggregate offering price of up to $5.5 billion. We may
also issue short-term debt through an active commercial paper program
and have a $6.2 billion credit facility to support such commercial paper
issuances.
Cash Flows Provided By Operating Activities
Our primary source of funds continues to be cash generated from operations, primarily from Verizon Wireless. Net cash provided by operating
activities during 2012 increased by $1.7 billion compared to 2011 primarily due to higher consolidated earnings, as well as improved working
capital levels, due to timing differences, partially offset by an increase in
pension contributions. Net cash provided by operating activities during
2012 and 2011 included net distributions received from Vodafone
Omnitel of $0.3 billion and $0.4 billion, respectively.
Net cash provided by operating activities during 2011 decreased by $3.6
billion compared to 2010 primarily due to purchases for wireless devices,
cashflowsfromdivestedoperations(see“AcquisitionsandDivestitures”)
and higher pension plan contributions. Net cash provided by operating
activities during 2011 and 2010 included net distributions received from
Vodafone Omnitel of $0.4 billion in each year.
36
MANAGEMENT’S DISCUSSION AND ANALYSIS
OF FINANCIAL CONDITION AND RESULTS OF OPERATIONS continued
Cash Flows Used In Investing Activities
Cash Flows Used In Financing Activities
Capital Expenditures
Capital expenditures continue to be our primary use of capital resources
as they facilitate the introduction of new products and services, enhance
responsiveness to competitive challenges and increase the operating
efficiency and productivity of our networks.
We seek to maintain a mix of fixed and variable rate debt to lower borrowing costs within reasonable risk parameters and to protect against
earnings and cash flow volatility resulting from changes in market conditions. During 2012, 2011 and 2010, net cash used in financing activities
was $21.3 billion, $5.8 billion and $13.7 billion, respectively.
Capital expenditures, including capitalized software, were as follows:
2012
During January 2012, $1.0 billion of 5.875% Verizon New Jersey Inc.
Debenturesmaturedandwererepaid.DuringFebruary2012,$0.8billion of 5.25% Verizon Wireless Notes matured and were repaid. During
July2012,$0.8billionof7.0%VerizonWirelessNotesmaturedandwere
repaid. In addition, during 2012 we utilized $0.2 billion under fixed rate
vendor financing facilities.
(dollars in millions)
Years Ended December 31,
Verizon Wireless
Wireline
Other
Total as a percentage of revenue
2012
$ 8,857
6,342
976
$ 16,175
14.0%
2011
$
8,973
6,399
872
$ 16,244
14.7%
2010
$
8,438
7,269
751
$ 16,458
15.4%
Capital expenditures declined slightly at Verizon Wireless in 2012 compared to 2011 due to the decreased investment in the capacity of our
wireless EV-DO network, partially offset by the increased build-out of our
4G LTE network. Capital expenditures declined slightly at Wireline due to
lower legacy spending requirements.
The increase in capital expenditures at Verizon Wireless during 2011 was
primarily due to the increased investment in the capacity of our wireless EV-DO network, as well as the build-out of our 4G LTE network. The
decrease in capital expenditures at Wireline during 2011 was primarily
due to capital expenditures in 2010 related to the local exchange businessandrelatedactivitiesthatwerespunofftoFrontier,aswellaslower
capitalexpendituresrelatedtothebuild-outofFiOS.
Acquisitions
During 2012, 2011 and 2010, we invested $3.9 billion, $0.2 billion and
$0.8 billion, respectively, in acquisitions of wireless licenses, net. During
2012, 2011 and 2010, we also invested $0.9 billion, $1.8 billion and $0.7
billion, respectively, in acquisitions of investments and businesses, net of
cash acquired.
• During 2012, we paid approximately $3.9 billion net to acquire wireless
licenses primarily to meet future LTE capacity needs and enable LTE
expansion.Additionally,during2012,weacquiredHUGHESTelematics,
aprovideroftelematicsservices,for$0.6billion.See“Acquisitionsand
Divestitures”foradditionaldetails.
• During April 2011, we paid approximately $1.4 billion for the equity of
Terremark, which was partially offset by $0.1 billion of cash acquired
(see“Acquisitions and Divestitures”). See“Cash Flows From Financing
Activities”belowregardingthedebtobligationsofTerremarkthatwere
repaidduringMay2011.Inaddition,during2011,weacquiredvarious
wireless licenses and markets as well as a provider of cloud software
technology for cash consideration that was not significant.
• On August 23, 2010, Verizon Wireless acquired the net assets and
relatedcustomersofsixoperatingmarketsinLouisianaandMississippi
in a transaction with AT&T Inc. for cash consideration of $0.2 billion.
Dispositions
During 2012, we received cash consideration that was not significant
relatedtothesaleofsomeofour700MHzlowerAandBblockspectrum
licenses.WeacquiredtheselicensesaspartofFCCAuction73in2008.
During 2010, we received cash proceeds of $2.6 billion in connection
with the sale of the Alltel Divestiture Markets (see“Acquisitions and
Divestitures”).
Other, net
During 2011, Other, net primarily included proceeds related to the sales
of long-term investments, which were not significant to our consolidated
statements of income.
On November 2, 2012, we announced the commencement of a tender
offer (the Tender Offer) to purchase for cash any and all of the outstanding $1.25 billion aggregate principal amount of 8.95% Verizon
Communications Notes due 2039. In the Tender Offer that was completed November 9, 2012, $0.9 billion aggregate principal amount of the
notes was purchased and $0.35 billion principal amount of the notes
remains outstanding. Any accrued and unpaid interest on the principal
purchased was paid to the date of purchase.
During November 2012, we issued $4.5 billion aggregate principal
amount of fixed rate notes at varying maturities resulting in cash proceeds of approximately $4.47 billion, net of discounts and issuance costs.
The net proceeds were used for general corporate purposes, for the
Tender Offer, and to redeem $0.7 billion of $2.0 billion of 8.75% Verizon
Communications Notes due 2018, $1.0 billion of 4.625% Verizon Virginia
LLC Debentures, Series A due 2013 and $0.75 billion of 4.35% Verizon
Communications Notes due 2013.
In addition, during 2012, various fixed rate notes totaling approximately
$0.2 billion were repaid and any accrued and unpaid interest was paid to
the date of payment.
See“OtherItems”regardingtheearlydebtredemptioncostsincurredin
connection with the aforementioned repurchases and redemptions.
2011
During 2011, proceeds from long-term borrowings totaled $11.1 billion,
which was primarily used to repay outstanding debt, redeem higher
interest bearing debt maturing in the near term and for other general
corporate purposes.
During 2011, $0.5 billion of 5.35% Verizon Communications Notes
matured and were repaid, and we utilized $0.3 billion under fixed rate
vendor financing facilities.
DuringMarch2011,weissued$6.25billionaggregateprincipalamount
of fixed and floating rate notes at varying maturities resulting in cash proceeds of approximately $6.19 billion, net of discounts and issuance costs.
The net proceeds were used for the repayment of commercial paper and
other general corporate purposes, as well as to redeem $2.0 billion aggregate principal amount of telephone subsidiary debt during April 2011.
The debt obligations of Terremark that were outstanding at the time of
its acquisition by Verizon were repaid during the second quarter of 2011.
During November 2011, we issued $4.6 billion aggregate principal
amount of fixed rate notes at varying maturities resulting in cash proceeds of approximately $4.55 billion, net of discounts and issuance costs.
During November 2011, the net proceeds were used to redeem $1.6 billion aggregate principal amount of Verizon Communications notes and
$1.9 billion aggregate principal amount of telephone subsidiary debt.
The remaining net proceeds were used for the repayment of commercial
37
MANAGEMENT’S DISCUSSION AND ANALYSIS
OF FINANCIAL CONDITION AND RESULTS OF OPERATIONS continued
paperandothergeneralcorporatepurposes.See“OtherItems”regarding
the early debt redemption costs incurred in connection with the aforementioned redemptions.
During December 2011, we repaid $0.9 billion upon maturity for the €0.7
billion of 7.625% Verizon Wireless Notes, and the related cross currency
swapwassettled.DuringMay2011,$4.0billionVerizonWirelesstwo-year
fixed and floating rate notes matured and were repaid.
2010
During 2010, Verizon received approximately $3.1 billion in cash in connection with the completion of the spin-off and merger of Spinco (see
“AcquisitionsandDivestitures”).Thisspecialcashpaymentwassubsequently used to redeem $2.0 billion of 7.25% Verizon Communications
Notes due December 2010 at a redemption price of 102.7% of the principal amount of the notes, plus accrued and unpaid interest to the date
of redemption, as well as other short-term borrowings. During 2010,
$0.3 billion of 6.125% and $0.2 billion of 8.625% Verizon New York Inc.
Debentures, $0.2 billion of 6.375% Verizon North Inc. Debentures and
$0.2 billion of 6.3% Verizon Northwest Inc. Debentures matured and were
repaid. In addition, during 2010 Verizon repaid $0.2 billion of floating rate
vendor financing debt.
In 2010, Verizon Wireless exercised its right to redeem the outstanding
$1.0billionofaggregatefloatingratenotesdueJune2011ataredemption price of 100% of the principal amount of the notes, plus accrued
and unpaid interest to the date of redemption. In addition, during 2010,
Verizon Wireless repaid the remaining $4.0 billion of borrowings that were
outstandingundera$4.4billionThree-YearTermLoanFacilityAgreement
withamaturitydateofSeptember2011(Three-YearTermLoanFacility).
As there were no borrowings outstanding under this facility, it was cancelled.
Special Distributions
In November 2012, the Board of Representatives ofVerizonWireless
declared a distribution to its owners, which was paid in the fourth quarter
of 2012 in proportion to their partnership interests on the payment date,
in the aggregate amount of $8.5 billion. As a result, Vodafone received a
cash payment of $3.8 billion and the remainder of the distribution was
received by Verizon.
InJuly2011,theBoardofRepresentativesofVerizonWirelessdeclared
a distribution to its owners, which was paid in the first quarter of 2012
in proportion to their partnership interests on the payment date, in
the aggregate amount of $10 billion. As a result, Vodafone received a
cash payment of $4.5 billion and the remainder of the distribution was
received by Verizon.
Other, net
The change in Other, net financing activities during 2012 compared to
the prior year was primarily driven by higher distributions to Vodafone,
which owns a 45% noncontrolling interest in Verizon Wireless and higher
earlydebtredemptioncosts(see“OtherItems”).ThechangeinOther,net
financing activities during 2011 compared to 2010 was primarily driven
by lower distributions to Vodafone.
Dividends
The Verizon Board of Directors determines the appropriateness of the
level of our dividend payments on a periodic basis by considering such
factors as long-term growth opportunities, internal cash requirements
and the expectations of our shareowners. During the third quarter of
2012, the Board increased our quarterly dividend payment 3.0% to $.515
per share from $.50 per share in the same period of 2011. This is the
sixthconsecutiveyearthatVerizon’sBoardofDirectorshasapproveda
quarterly dividend increase. During the third quarter of 2011, the Board
increased our quarterly dividend payment 2.6% to $.50 per share from
$.4875 per share in the same period of 2010. During the third quarter of
38
2010, the Board increased our quarterly dividend payment 2.6% to $.4875
per share from $.475 per share in the same period of 2009.
During 2012, we paid $5.2 billion in dividends compared to $5.6 billion
in 2011 and $5.4 billion in 2010. As in prior periods, dividend payments
were a significant use of capital resources. While the dividends declared
per common share increased, the total amount of cash dividends paid
decreased during 2012 compared with 2011 as a portion of the dividends
was satisfied through the issuance of common shares from Treasury
stock,asnotedbelow(see“CommonStock”).
Credit Facility
As of December 31, 2012, the unused borrowing capacity under a $6.2
billion three-year credit facility with a group of major financial institutions
was approximately $6.1 billion. On August 13, 2012, we amended our
credit facility primarily to reduce fees and borrowing costs and extend
the maturity date to August 12, 2016. The credit facility does not require
us to comply with financial covenants or maintain specified credit ratings,
and it permits us to borrow even if our business has incurred a material adverse change. We use the credit facility to support the issuance
of commercial paper, for the issuance of letters of credit and for general
corporate purposes.
Net Debt and the Net Debt to Consolidated Adjusted EBITDA ratio are
non-GAAP financial measures that management believes are useful
to investors and other users of our financial information in evaluating
Verizon's leverage. Net Debt is calculated by subtracting cash and cash
equivalents from the sum of debt maturing within one year and longterm debt. For purposes of the Net Debt to Adjusted EBITDA Ratio,
AdjustedEBITDA(See“ConsolidatedResultsofOperations”)iscalculated
forthelast12months.Managementbelievesthispresentationassists
investors in understanding trends that are indicative of future operating
results given the non-operational or non-recurring nature of the items
excluded from the calculation.
Verizon’s ratio of net debt to Consolidated Adjusted EBITDA was 1.3x
at December 31, 2012 and 1.2x at December 31, 2011. Consolidated
Adjusted EBITDA excludes the effects of non-operational items (see
“OtherItems”).
Common Stock
Common stock has been used from time to time to satisfy some of the
funding requirements of employee and shareowner plans, including 24.6
million common shares issued from Treasury stock during 2012, related
to dividend payments, which had an aggregate value of $1.0 billion. On
February3,2011,theBoardofDirectorsreplacedthepreviouslyauthorized share buyback program with a new program for the repurchase of
up to 100 million common shares terminating no later than the close of
businessonFebruary28,2014.TheBoardalsodeterminedthatnoadditional shares were to be purchased under the prior program. Through
February15,2013,wepurchasedapproximately3.50millionsharesunder
this authorization.
There were no repurchases of common stock during 2012, 2011 or 2010.
Credit Ratings
The debt securities of Verizon Communications and its subsidiaries continue to be accorded high ratings by the three primary rating agencies.
Although a one-level ratings downgrade would not be expected to significantly impact our access to capital, it could increase both the cost
of refinancing existing debt and the cost of financing any new capital
requirements. Securities ratings assigned by rating organizations are
expressions of opinion and are not recommendations to buy, sell, or hold
securities. A securities rating is subject to revision or withdrawal at any
time by the assigning rating organization. Each rating should be evaluated independently of any other rating.
MANAGEMENT’S DISCUSSION AND ANALYSIS
OF FINANCIAL CONDITION AND RESULTS OF OPERATIONS continued
Covenants
Our credit agreements contain covenants that are typical for large,
investment grade companies. These covenants include requirements to
pay interest and principal in a timely fashion, pay taxes, maintain insurance with responsible and reputable insurance companies, preserve our
corporate existence, keep appropriate books and records of financial
transactions, maintain our properties, provide financial and other reports
to our lenders, limit pledging and disposition of assets and mergers and
consolidations, and other similar covenants.
We and our consolidated subsidiaries are in compliance with all debt
covenants.
Increase (Decrease) In Cash and Cash Equivalents
Our Cash and cash equivalents at December 31, 2012 totaled $3.1 billion, a $10.3 billion decrease compared to Cash and cash equivalents
at December 31, 2011 for the reasons discussed above. Our Cash and
cash equivalents at December 31, 2011 totaled $13.4 billion, a $6.7 billion
increase compared to Cash and cash equivalents at December 31, 2010
for the reasons discussed above.
As of December 31, 2012, Verizon Wireless cash and cash equivalents and
debt outstanding totaled $0.8 billion and $10.1 billion, respectively.
Free Cash Flow
Free cash flow is a non-GAAP financial measure that management
believesisusefultoinvestorsandotherusersofVerizon’sfinancialinformationinevaluatingcashavailabletopaydebtanddividends.Freecash
flow is calculated by subtracting capital expenditures from net cash
provided by operating activities. The following table reconciles net cash
providedbyoperatingactivitiestoFreecashflow:
(dollars in millions)
Years Ended December 31,
Net cash provided by operating activities
Less Capital expenditures (including
capitalized software)
Free cash flow
We contributed approximately $2.6 billion to the Plan between
September 1, 2012 and December 31, 2012 in connection with the transactionsothatthePlan’sfundingpercentagewouldnotdecreaseasa
result of the transaction.
Employer Contributions
We operate numerous qualified and nonqualified pension plans and
other postretirement benefit plans. These plans primarily relate to our
domestic business units. During 2012 and 2011, we contributed $0.9 billion and $0.4 billion, respectively, to our qualified pension plans, excluding
the pension annuitization discussed above. During 2010, contributions to
our qualified pension plans were not significant. We also contributed $0.2
billion, $0.1 billion and $0.1 billion to our nonqualified pension plans in
2012, 2011 and 2010, respectively.
In an effort to reduce the risk of our portfolio strategy and better align
assets with liabilities, we have shifted our strategy to one that is more
liability driven, where cash flows from investments better match projected benefit payments but result in lower asset returns. We intend to
reduce the likelihood that assets will decline at a time when liabilities
increase (referred to as liability hedging), with the goal to reduce the risk
of underfunding to the plan and its participants and beneficiaries. Based
on the revised strategy and the funded status of the plans at December
31, 2012, we expect the minimum required qualified pension plan contribution in 2013 to be immaterial. Nonqualified pension contributions are
estimated to be approximately $0.1 billion in 2013.
Contributions to our other postretirement benefit plans generally relate
to payments for benefits on an as-incurred basis since the other postretirement benefit plans do not have funding requirements similar to
the pension plans. We contributed $1.5 billion, $1.4 billion and $1.2 billion to our other postretirement benefit plans in 2012, 2011 and 2010,
respectively. Contributions to our other postretirement benefit plans are
estimated to be approximately $1.5 billion in 2013.
2012
2011
2010
$ 31,486
$ 29,780
$ 33,363
Leasing Arrangements
16,175
$ 15,311
16,244
$ 13,536
16,458
$ 16,905
We are the lessor in leveraged and direct financing lease agreements for
commercial aircraft and power generating facilities, which comprise the
majority of our leasing portfolio along with telecommunications equipment, commercial real estate property and other equipment. These
leases have remaining terms of up to 38 years as of December 31, 2012.
In addition, we lease space on certain of our cell towers to other wireless
carriers.Minimumleasepaymentsreceivablerepresentunpaidrentals,
less principal and interest on third-party nonrecourse debt relating to leveraged lease transactions. Since we have no general liability for this debt,
which is secured by a senior security interest in the leased equipment
and rentals, the related principal and interest have been offset against
the minimum lease payments receivable in accordance with GAAP. All
recourse debt is reflected in our consolidated balance sheets.
The changes in free cash flow during 2012, 2011 and 2010 were a result
of the factors described in connection with net cash provided by operating activities and capital expenditures above.
Employee Benefit Plan Funded Status and Contributions
Pension Annuitization
On October 17, 2012, we, along with our subsidiary Verizon Investment
ManagementCorp.,andFiduciaryCounselorsInc.,asindependentfiduciaryoftheVerizonManagementPensionPlan(thePlan),enteredintoa
definitive purchase agreement with The Prudential Insurance Company
ofAmerica(Prudential)andPrudentialFinancial,Inc.,pursuanttowhich
the Plan would purchase a single premium group annuity contract from
Prudential.
On December 10, 2012, upon issuance of the group annuity contract by
Prudential, Prudential irrevocably assumed the obligation to make future
annuity payments to approximately 41,000 Verizon management retirees
whobeganreceivingpensionpaymentsfromthePlanpriortoJanuary1,
2010.Theamountofeachretiree’sannuitypaymentequalstheamount
ofsuchindividual’spensionbenefit.Inaddition,thegroupannuitycontract is intended to replicate the same rights to future payments, such as
survivor benefits, that are currently offered by the Plan.
39
MANAGEMENT’S DISCUSSION AND ANALYSIS
OF FINANCIAL CONDITION AND RESULTS OF OPERATIONS continued
Off Balance Sheet Arrangements and Contractual Obligations
Contractual Obligations and Commercial Commitments
The following table provides a summary of our contractual obligations and commercial commitments at December 31, 2012. Additional detail about
these items is included in the notes to the consolidated financial statements.
(dollars in millions)
Contractual Obligations
Long-term debt(1)
Capital lease obligations(2)
Total long-term debt, including current maturities
Interest on long-term debt(1)
Operating leases(2)
Purchase obligations (3)
Income tax audit settlements(4)
Other long-term liabilities(5)
Total contractual obligations
Total
$ 51,189
298
51,487
32,761
11,841
41,768
52
3,921
$ 141,830
Payments Due By Period
Less than
1 year
1-3 years
3-5 years
$
3,805
64
3,869
2,780
2,038
29,645
–
1,663
$ 39,995
$
8,906
91
8,997
4,818
3,412
7,503
52
2,258
$ 27,040
$
5,417
71
5,488
4,321
2,272
4,162
–
–
$ 16,243
Morethan
5 years
$ 33,061
72
33,133
20,842
4,119
458
–
–
$ 58,552
(1) Items included in long-term debt with variable coupon rates are described in Note 8 to the consolidated financial statements.
(2) See Note 7 to the consolidated financial statements.
(3) The purchase obligations reflected above are primarily commitments to purchase handsets and peripherals, equipment, software, programming and network services, and marketing activities,
which will be used or sold in the ordinary course of business. These amounts do not represent our entire anticipated purchases in the future, but represent only those items that are the subject
ofcontractualobligations.Wealsopurchaseproductsandservicesasneededwithnofirmcommitment.Forthisreason,theamountspresentedinthistablealonedonotprovideareliable
indicator of our expected future cash outflows or changes in our expected cash position (see Note 16 to the consolidated financial statements).
(4) We are not able to make a reliable estimate of when the unrecognized tax benefits balance of $2.9 billion and related interest and penalties will be settled with the respective taxing authorities
until issues or examinations are further developed (see Note 12 to the consolidated financial statements).
(5) Other long-term liabilities include estimated postretirement benefit and qualified pension plan contributions (see Note 11 to the consolidated financial statements).
Guarantees
In connection with the execution of agreements for the sale of businesses and investments, Verizon ordinarily provides representations and
warranties to the purchasers pertaining to a variety of nonfinancial matters, such as ownership of the securities being sold, as well as financial
losses (see Note 16 to the consolidated financial statements).
We guarantee the debentures and first mortgage bonds of our operating
telephone company subsidiaries. As of December 31, 2012, $4.3 billion
principal amount of these obligations remain outstanding. Each guarantee will remain in place for the life of the obligation unless terminated
pursuant to its terms, including the operating telephone company no
longer being a wholly-owned subsidiary of Verizon.
40
We also guarantee the debt obligations of GTE Corporation that were
issuedandoutstandingpriortoJuly1,2003.AsofDecember31,2012,
$1.7 billion principal amount of these obligations remain outstanding
(see Note 8 to the consolidated financial statements).
As of December 31, 2012 letters of credit totaling approximately $0.1 billion, which were executed in the normal course of business and support
several financing arrangements and payment obligations to third parties,
were outstanding (see Note 16 to the consolidated financial statements).
MANAGEMENT’S DISCUSSION AND ANALYSIS
OF FINANCIAL CONDITION AND RESULTS OF OPERATIONS continued
MARKET RISK
We are exposed to various types of market risk in the normal course
of business, including the impact of interest rate changes, foreign currency exchange rate fluctuations, changes in investment, equity and
commodity prices and changes in corporate tax rates. We employ risk
management strategies, which may include the use of a variety of derivatives including cross currency swaps, foreign currency and prepaid
forwards and collars, interest rate swap agreements, commodity swap
and forward agreements and interest rate locks. We do not hold derivatives for trading purposes.
It is our general policy to enter into interest rate, foreign currency and
other derivative transactions only to the extent necessary to achieve our
desired objectives in limiting our exposure to various market risks. Our
objectives include maintaining a mix of fixed and variable rate debt to
lower borrowing costs within reasonable risk parameters and to protect
against earnings and cash flow volatility resulting from changes in market
conditions. We do not hedge our market risk exposure in a manner that
would completely eliminate the effect of changes in interest rates and
foreign exchange rates on our earnings. We do not expect that our net
income, liquidity and cash flows will be materially affected by these risk
management strategies.
Interest Rate Risk
We are exposed to changes in interest rates, primarily on our short-term
debt and the portion of long-term debt that carries floating interest rates.
As of December 31, 2012, substantially all of the aggregate principal
amount of our total debt portfolio consisted of fixed rate indebtedness,
including the effect of interest rate swap agreements designated as
hedges. The impact of a 100 basis point change in interest rates affecting
our floating rate debt would result in a change in annual interest expense,
including our interest rate swap agreements that are designated as
hedges, that is not material. The interest rates on our existing long-term
debt obligations are unaffected by changes to our credit ratings.
The table that follows summarizes the fair values of our long-term debt,
including current maturities, and interest rate swap derivatives as of
December 31, 2012 and 2011. The table also provides a sensitivity analysis of the estimated fair values of these financial instruments assuming
100-basis-point upward and downward shifts in the yield curve. Our sensitivity analysis does not include the fair values of our commercial paper
and bank loans, if any, because they are not significantly affected by
changes in market interest rates.
(dollars in millions)
At December 31, 2012
FairValue
FairValue
assuming
+ 100 basis
point shift
FairValue
assuming
- 100 basis
point shift
Long-term debt and related derivatives
$ 61,045
$ 56,929
$ 65,747
$ 61,870
$ 58,117
$ 66,326
Interest Rate Swaps
We have entered into domestic interest rate swaps to achieve a targeted
mix of fixed and variable rate debt. We principally receive fixed rates and
payvariableratesbasedontheLondonInterbankOfferedRate,resulting
in a net increase or decrease to Interest expense. These swaps are designated as fair value hedges and hedge against changes in the fair value
of our debt portfolio. We record the interest rate swaps at fair value on
our consolidated balance sheets as assets and liabilities. At December
31, 2012 the fair value of these interest rate swaps was not material, and
at December 31, 2011, the fair value was $0.6 billion, primarily included
in Other assets and Long-term debt. As of December 31, 2012, the total
notional amount of these interest rate swaps was $1.3 billion. During
2012, interest rate swaps with a notional value of $5.8 billion were settled.
As a result of the settlements, we received net proceeds of $0.7 billion,
including accrued interest which is included in Other, net operating
activities in the consolidated statement of cash flows. The fair value basis
adjustment to the underlying debt instruments will be recognized into
earnings as a reduction of Interest expense over the remaining lives of
the underlying debt obligations.
Foreign Currency Translation
The functional currency for our foreign operations is primarily the
local currency. The translation of income statement and balance sheet
amountsofourforeignoperationsintoU.S.dollarsisrecordedascumulative translation adjustments, which are included in Accumulated other
comprehensive income in our consolidated balance sheets. Gains and
losses on foreign currency transactions are recorded in the consolidated statements of income in Other income and (expense), net. At
December 31, 2012, our primary translation exposure was to the British
PoundSterling,theEuro,theIndianRupee,theAustralianDollarandthe
JapaneseYen.
Cross Currency Swaps
Verizon Wireless previously entered into cross currency swaps designated
as cash flow hedges to exchange approximately $1.6 billion of British
PoundSterlingandEuro-denominateddebtintoU.S.dollarsandtofix
ourfutureinterestandprincipalpaymentsinU.S.dollars,aswellasto
mitigate the impact of foreign currency transaction gains or losses. A portion of the gains and losses recognized in Other comprehensive income
was reclassified to Other income and (expense), net to offset the related
pretax foreign currency transaction gain or loss on the underlying debt
obligations. The fair value of the outstanding swaps was not material at
December 31, 2012 or December 31, 2011. During 2012 and 2011 the
gains and losses with respect to these swaps were not material.
At December 31, 2011
Long-term debt and related derivatives
41
MANAGEMENT’S DISCUSSION AND ANALYSIS
OF FINANCIAL CONDITION AND RESULTS OF OPERATIONS continued
CRITICAL ACCOUNTING ESTIMATES AND RECENT ACCOUNTING STANDARDS
Critical Accounting Estimates
A summary of the critical accounting estimates used in preparing our
financial statements is as follows:
• Wireless licenses and Goodwill are a significant component of our consolidated assets. Both our wireless licenses and goodwill are treated as
indefinite-lived intangible assets and, therefore are not amortized, but
rather are tested for impairment annually in the fourth fiscal quarter,
unless there are events or changes in circumstances during an interim
period that indicates these assets may not be recoverable. We believe
our estimates and assumptions are reasonable and represent appropriate marketplace considerations as of the valuation date. We do not
believe that reasonably likely adverse changes in our assumptions and
estimates would result in an impairment charge as of our latest impairment testing date. However, if there is a substantial and sustained
adverse decline in our operating profitability, we may have impairment
charges in future years. Any such impairment charge could be material
to our results of operations and financial condition.
Wireless Licenses
The carrying value of our wireless licenses was approximately $77.7
billion as of December 31, 2012. We aggregate our wireless licenses
into one single unit of accounting, as we utilize our wireless licenses
on an integrated basis as part of our nationwide wireless network. Our
wireless licenses provide us with the exclusive right to utilize certain
radio frequency spectrum to provide wireless communication services.
There are currently no legal, regulatory, contractual, competitive, economic or other factors that limit the useful life of our wireless licenses.
Our impairment test consists of comparing the estimated fair value of
our wireless licenses to the aggregated carrying amount as of the test
date. If the estimated fair value of our wireless licenses is less than the
aggregated carrying amount of the wireless licenses then an impairment charge is recognized. Our annual impairment tests for 2012,
2011 and 2010 indicated that the fair value significantly exceeded the
carrying value and, therefore, did not result in an impairment.
We estimate the fair value of our wireless licenses using a direct income
based valuation approach. This approach uses a discounted cash flow
analysis to estimate what a marketplace participant would be willing
to pay to purchase the aggregated wireless licenses as of the valuation
date. As a result we are required to make significant estimates about
future cash flows specifically associated with our wireless licenses,
an appropriate discount rate based on the risk associated with those
estimated cash flows and assumed terminal value and growth rates.
We consider current and expected future economic conditions, current and expected availability of wireless network technology and
infrastructure and related equipment and the costs thereof as well as
other relevant factors in estimating future cash flows. The discount rate
represents our estimate of the weighted-average cost of capital (or
expectedreturn,“WACC”)thatamarketplaceparticipantwouldrequire
as of the valuation date. We develop the discount rate based on our
consideration of the cost of debt and equity of a group of guideline
companies as of the valuation date. Accordingly, our discount rate
incorporates our estimate of the expected return a marketplace participant would require as of the valuation date, including the risk premium
associated with the current and expected economic conditions as of
the valuation date. The terminal value growth rate represents our estimateofthemarketplace’slong-termgrowthrate.
42
Goodwill
At December 31, 2012, the balance of our goodwill was approximately
$24.1 billion, of which $18.2 billion was in our Verizon Wireless segment
and $5.9 billion was in our Wireline segment. Determining whether
an impairment has occurred requires the determination of fair value
of each respective reporting unit. Our operating segments, Verizon
Wireless and Wireline, are deemed to be our reporting units for purposes of goodwill impairment testing. The fair value of Verizon Wireless
significantly exceeded its carrying value and the fair value of Wireline
exceeded its carrying value. Accordingly, our annual impairment tests
for 2012, 2011 and 2010 did not result in an impairment.
The fair value of the reporting unit is calculated using a market
approach and a discounted cash flow method. The market approach
includes the use of comparative multiples to corroborate discounted
cash flow results. The discounted cash flow method is based on the
present value of two components—projected cash flows and a terminal value. The terminal value represents the expected normalized
future cash flows of the reporting unit beyond the cash flows from
the discrete projection period. The fair value of the reporting unit is
calculated based on the sum of the present value of the cash flows
from the discrete period and the present value of the terminal value.
The estimated cash flows are discounted using a rate that represents
our WACC.
MANAGEMENT’S DISCUSSION AND ANALYSIS
OF FINANCIAL CONDITION AND RESULTS OF OPERATIONS continued
• We maintain benefit plans for most of our employees, including, for
certain employees, pension and other postretirement benefit plans.
At December 31, 2012, in the aggregate, pension plan benefit obligations exceeded the fair value of pension plan assets, which will result
in higher future pension plan expense. Other postretirement benefit
plans have larger benefit obligations than plan assets, resulting in
expense. Significant benefit plan assumptions, including the discount
rate used, the long-term rate of return on plan assets and health care
trend rates are periodically updated and impact the amount of benefit
plan income, expense, assets and obligations. A sensitivity analysis of
the impact of changes in these assumptions on the benefit obligations
and expense (income) recorded, as well as on the funded status due to
an increase or a decrease in the actual versus expected return on plan
assets as of December 31, 2012 and for the year then ended pertaining
toVerizon’spensionandpostretirementbenefitplansisprovidedinthe
table below.
Percentage
point
change
Increase
(decrease) at
December 31, 2012*
Pension plans discount rate
+0.50
-0.50
$ (1,350)
1,504
Rate of return on pension plan assets
+1.00
-1.00
(239)
239
Postretirement plans discount rate
+0.50
-0.50
(1,678)
1,886
+1.00
-1.00
(24)
24
+1.00
-1.00
3,251
(2,669)
(dollars in millions)
Rate of return on postretirement plan
assets
Health care trend rates
* In determining its pension and other postretirement obligation, the Company used a
weighted-average discount rate of 4.20%. The rate was selected to approximate the
composite interest rates available on a selection of high-quality bonds available in the
market at December 31, 2012. The bonds selected had maturities that coincided with the
time periods during which benefits payments are expected to occur, were non-callable
and available in sufficient quantities to ensure marketability (at least $0.3 billion par
outstanding).
• Our Plant, property and equipment balance represents a significant
component of our consolidated assets. We record plant, property and
equipment at cost. We depreciate plant, property and equipment on a
straight-line basis over the estimated useful life of the assets. We expect
that a one-year increase in estimated useful lives of our plant, property
and equipment would result in a decrease to our 2012 depreciation
expense of $1.5 billion and that a one-year decrease would result in
an increase of approximately $1.8 billion in our 2012 depreciation
expense.
Recent Accounting Standards
InJuly2012,theaccountingstandardupdateregardingtestingofintangible assets for impairment was issued. This standard update allows
companies the option to perform a qualitative assessment to determine
whether it is more likely than not that an indefinite-lived intangible asset
is impaired. An entity is not required to calculate the fair value of an indefinite-lived intangible asset and perform the quantitative impairment test
unless the entity determines that it is more likely than not the asset is
impaired. We will adopt this standard update during the first quarter of
2013. The adoption of this standard update is not expected to have a
significant impact on our consolidated financial statements.
InFebruary2013,theaccountingstandardupdateregardingreclassifications out of accumulated other comprehensive income was issued. This
standard update requires companies to report the effect of significant
reclassifications out of accumulated other comprehensive income on
the respective line items in our consolidated statements of income if the
amountbeingreclassifiedisrequiredunderU.S.GAAPtobereclassified
initsentiretytonetincome.Forotheramountsthatarenotrequired
underU.S.GAAPtobereclassifiedintheirentiretytonetincomeinthe
same reporting period, an entity is required to cross-reference other disclosuresrequiredunderU.S.GAAPthatprovideadditionaldetailabout
those amounts. We will adopt this standard in the first quarter of 2013.
The adoption of this standard update is not expected to have a significant impact on our consolidated financial statements.
• Our current and deferred income taxes, and associated valuation allowances, are impacted by events and transactions arising in the normal
course of business as well as in connection with the adoption of new
accounting standards, changes in tax laws and rates, acquisitions and
dispositions of businesses and non-recurring items. As a global commercial enterprise, our income tax rate and the classification of income
taxes can be affected by many factors, including estimates of the
timing and realization of deferred income tax assets and the timing
and amount of income tax payments. We account for tax benefits
taken or expected to be taken in our tax returns in accordance with the
accounting standard relating to the uncertainty in income taxes, which
requires the use of a two-step approach for recognizing and measuring
tax benefits taken or expected to be taken in a tax return. We review
and adjust our liability for unrecognized tax benefits based on our best
judgment given the facts, circumstances, and information available at
each reporting date. To the extent that the final outcome of these tax
positions is different than the amounts recorded, such differences may
impact income tax expense and actual tax payments. We recognize
any interest and penalties accrued related to unrecognized tax benefits
in income tax expense. Actual tax payments may materially differ from
estimated liabilities as a result of changes in tax laws as well as unanticipated transactions impacting related income tax balances.
43
MANAGEMENT’S DISCUSSION AND ANALYSIS
OF FINANCIAL CONDITION AND RESULTS OF OPERATIONS continued
ACQUISITIONS AND DIVESTITURES
Spectrum Licenses
During the third quarter of 2012, after receiving the required regulatory approvals, Verizon Wireless completed the following previously
announced transactions in which we acquired wireless spectrum that
will be used to deploy additional fourth-generation (4G) Long Term
Evolution (LTE) capacity:
• Verizon Wireless acquired AWS spectrum in separate transactions with
SpectrumCoandCoxTMIWireless,LLCforwhichitpaidanaggregate
of $3.9 billion at the time of the closings. Verizon Wireless has also
recorded a liability of $0.4 billion related to a three-year service obligation to SpectrumCo’s members pursuant to commercial agreements
executed concurrently with the SpectrumCo transaction.
• Verizon Wireless completed license purchase and exchange transactions with Leap Wireless, Savary Island Wireless, which is majority
owned by LeapWireless, and a subsidiary ofT-Mobile. As a result of
these transactions, Verizon Wireless received an aggregate $2.6 billion
of AWS and PCS licenses at fair value and net cash proceeds of $0.2 billion,transferredcertainAWSlicensestoT-Mobileanda700megahertz
(MHz)lowerAblocklicensetoLeapWireless,andrecordedanimmaterial gain.
HUGHES Telematics, Inc.
OnJune1,2012,weagreedtoacquireHUGHESTelematicsforapproximately $12 per share in cash for a total acquisition price of $0.6 billion
andwecompletedtheacquisitiononJuly26,2012.Asaresultofthe
transaction, HUGHES Telematics became a wholly-owned subsidiary
of Verizon. The consolidated financial statements include the results of
HUGHESTelematics’ operations from the date the acquisition closed.
Uponclosing,werecordedapproximately$0.6billionofgoodwill,$0.1
billionofotherintangibles,andassumedthedebtobligationsofHUGHES
Telematics, which were approximately $0.1 billion as of the date of acquisition, and which were repaid by Verizon. Had this acquisition been
completedonJanuary1,2012or2011,theresultsoftheacquiredoperationsofHUGHESTelematicswouldnothavehadasignificantimpacton
the consolidated net income attributable to Verizon. The acquisition has
accelerated our ability to bring more telematics offerings to market for
existingandnewHUGHESTelematicsandVerizoncustomers.
TheacquisitionofHUGHESTelematicswasaccountedforasabusiness
combination under the acquisition method. The cost of the acquisition
was allocated to the assets and liabilities acquired based on their fair
values as of the close of the acquisition, with the excess amount being
recorded as goodwill.
44
Terremark Worldwide, Inc.
During April 2011, we acquired Terremark for $19 per share in cash.
Closing and other direct acquisition-related costs totaled approximately
$13millionafter-tax.Theacquisitionwascompletedviaa“short-form”
merger under Delaware law through which Terremark became a wholly
ownedsubsidiaryofVerizon.TheacquisitionenhancedVerizon’sofferings
to business and government customers globally.
Telephone Access Line Spin-off
OnJuly1,2010,afterreceivingregulatoryapproval,wecompletedthe
spin-off of the shares of a newly formed subsidiary of Verizon (Spinco) to
VerizonstockholdersandthemergerofSpincowithFrontier.Spincoheld
definedassetsandliabilitiesthatwereusedinVerizon’slocalexchange
businesses and related activities in 14 states. The total value of the transaction to Verizon and its stockholders was approximately $8.6 billion.
Alltel Divestiture Markets
As a condition of the regulatory approvals to complete the acquisition
ofAlltelCorporationinJanuary2009,VerizonWirelesswasrequiredto
divest overlapping properties in 105 operating markets in 24 states (Alltel
DivestitureMarkets).Duringthesecondquarterof2010,AT&TMobility
acquired 79 of the 105 Alltel Divestiture Markets, including licenses
and network assets, for approximately $2.4 billion in cash, and Atlantic
Tele-Network,Inc.acquiredtheremaining26AlltelDivestitureMarkets,
including licenses and network assets, for $0.2 billion in cash.
See Note 2 to the consolidated financial statements for additional information relating to the above acquisitions and divestitures.
MANAGEMENT’S DISCUSSION AND ANALYSIS
OF FINANCIAL CONDITION AND RESULTS OF OPERATIONS continued
OTHER FACTORS THAT MAY AFFECT FUTURE RESULTS
Regulatory and Competitive Trends
Competition and Regulation
Technological, regulatory and market changes have provided Verizon
both new opportunities and challenges. These changes have allowed
Verizon to offer new types of services in an increasingly competitive
market. At the same time, they have allowed other service providers
to broaden the scope of their own competitive offerings. Current and
potential competitors for network services include other telephone
companies, cable companies, wireless service providers, foreign telecommunications providers, satellite providers, electric utilities, Internet service
providers, providers of VoIP services, and other companies that offer networkservicesusingavarietyoftechnologies.Manyofthesecompanies
have a strong market presence, brand recognition and existing customer
relationships, all of which contribute to intensifying competition and may
affectourfuturerevenuegrowth.Manyofourcompetitorsalsoremain
subject to fewer regulatory constraints than us.
We are unable to predict definitively the impact that the ongoing
changes in the telecommunications industry will ultimately have on our
business, results of operations or financial condition. The financial impact
will depend on several factors, including the timing, extent and success
of competition in our markets, the timing and outcome of various regulatory proceedings and any appeals, and the timing, extent and success of
our pursuit of new opportunities.
FCC Regulation
TheFCChasjurisdictionoverourinterstatetelecommunicationsservices
and other matters under the Communications Act of 1934, as amended
(Communications Act). The Communications Act generally provides that
we may not charge unjust or unreasonable rates, or engage in unreasonable discrimination when we are providing services as a common carrier,
and regulates some of the rates, terms and conditions under which we
providecertainservices.TheFCCalsohasadoptedregulationsgoverning
various aspects of our business including: (i) use and disclosure of customer proprietary network information; (ii) telemarketing; (iii) assignment
of telephone numbers to customers; (iv) provision to law enforcement
agencies of the capability to obtain call-identifying information and call
content information from calls pursuant to lawful process; (v) accessibility
of services and equipment to individuals with disabilities; (vi) interconnectionwiththenetworksofothercarriers;and(vii)customers’ abilityto
keep(or“port”)theirtelephonenumberswhenswitchingtoanothercarrier.Inaddition,wepayvariousfeestosupportotherFCCprograms,such
as the universal service program discussed below. Changes to these mandates, or the adoption of additional mandates, could require us to make
changes to our operations or otherwise increase our costs of compliance.
Broadband
TheFCCpreviouslyadoptedaseriesofordersthatimposelesserregulatory requirements on broadband services and facilities than apply to
narrowband or traditional telephone services. With respect to wireline
facilities,theFCCdeterminedthatcertainunbundlingrequirementsthat
apply to narrowband facilities of local exchange carriers do not apply
to broadband facilities such as fiber to the premise loops and packet
switches.Withrespecttoservices,theFCCconcludedthatbothwireline
and wireless broadband Internet access services qualify as largely deregulated information services. Separately, certain of our wireline broadband
services sold primarily to larger business customers were largely deregulated when our forbearance petition was granted. The latter relief has
been upheld on appeal, but is subject to a continuing challenge before
theFCC.
InDecemberof2010,theFCCadoptedso-called“netneutrality”rulesgoverning broadband Internet access services that it describes as intended
to preserve the openness of the Internet. These rules, which took effect
in November 2011 and are subject to a pending appeal, require providers
of broadband Internet access to publicly disclose information relating to
theperformanceandtermsofitsservices.For“fixed”services,therules
prohibit blocking lawful content, applications, services or non-harmful
devices. The rules also prohibit unreasonable discrimination in transmitting lawful traffic over a consumer’s fixed broadband Internet access
service.For“mobile”services,therulesprohibitblockingaccesstolawful
websitesorblockingapplicationsthatcompetewiththeprovider’svoice
orvideotelephonyservices.Therestrictionsaresubjectto“reasonable
networkmanagement.”Therulesalsoestablishacomplaintprocess,and
statethattheFCCwillcontinuetomonitordevelopmentstodetermine
whether to impose further regulations.
Video
TheFCChasabodyofrulesthatapplytocableoperatorsunderTitleVIof
the Communications Act of 1934, and these rules also generally apply to
telephone companies that provide cable services over their networks. In
addition, the Act generally requires companies that provide cable service
overacablesystemtoobtainalocalcablefranchise,andtheFCChas
adopted rules that interpret and implement this requirement.
Interstate Access Charges and Intercarrier Compensation
In2011,theFCCissuedabroadorderchangingtheframeworkforthe
interstate and intrastate switched access per-minute rates that carriers
charge each other for the exchange of voice traffic. The new rules will
gradually reduce to zero the rates that Verizon pays to other carriers and
the rates that Verizon charges other carriers. This order also established
a per-minute intercarrier compensation rate applicable to the exchange
of Voice over IP traffic regardless of whether such traffic is intrastate or
interstate. This order is subject to certain pending reconsideration petitions and appeals.
TheFCC’scurrentrulesforspecialaccessservicesprovideforpricingflexibility and ultimately the removal of services from price regulation when
prescribed competitive thresholds are met. More than half of special
accessrevenuesarenowremovedfrompriceregulation.TheFCCcurrently has a rulemaking proceeding underway to determine whether and
how these rules should be modified.
Universal Service
TheFCChasadoptedabodyofrulesimplementingtheuniversalservice
provisions of the Telecommunications Act of 1996, including provisions
to support rural and non-rural high-cost areas, low income subscribers,
schoolsandlibrariesandruralhealthcare.TheFCC’srulesrequiretelecommunicationscompaniesincludingVerizontopayintotheUniversal
ServiceFund(USF),whichthenmakesdistributionsinsupportoftheprograms.UnderthebroadorderissuedbytheFCCin2011,thefocusofthe
USFwillbegraduallyshiftedfromsupportofvoiceservicestosupportof
broadbandservices.TheFCCisalsocurrentlyconsideringotherchanges
to the rules governing contributions to the fund. Any change in the current rules could result in a change in the contribution that Verizon and
others must make and that would have to be collected from customers,
orintheamountsthattheseprovidersreceivefromtheUSF.
Unbundling of Network Elements
UnderSection251oftheTelecommunicationsActof1996,incumbent
local exchange carriers are required to provide competing carriers with
access to components of their network on an unbundled basis, known
as UNEs, where certain statutory standards are satisfied.The FCC has
adopted rules defining the network elements that must be made available, including criteria for determining whether high-capacity loops,
45
MANAGEMENT’S DISCUSSION AND ANALYSIS
OF FINANCIAL CONDITION AND RESULTS OF OPERATIONS continued
transport or dark fiber transport must be unbundled in individual wire
centers. The Telecommunications Act of 1996 also adopted a cost-based
pricingstandardfortheseUNEs,whichtheFCCinterpretedasallowing
ittoimposeapricingstandardknownas“totalelementlongrunincrementalcost”or“TELRIC.”
Wireless Services
TheFCCregulatesthelicensing,construction,operation,acquisitionand
transfer of wireless communications systems, including the systems that
Verizon Wireless operates, pursuant to the Communications Act, other
legislation,andtheFCC’srules.TheFCCandCongresscontinuouslyconsider changes to these laws and rules. Adoption of new laws or rules
may raise the cost of providing service or require modification of Verizon
Wireless’businessplansoroperations.
To use the radio frequency spectrum, wireless communications systems
mustbelicensedbytheFCCtooperatethewirelessnetworkandmobile
devices in assigned spectrum segments. Verizon Wireless holds FCC
licenses to operate in several different radio services, including the cellular radiotelephone service, personal communications service, wireless
communications service, and point-to-point radio service. The technical
and service rules, the specific radio frequencies and amounts of spectrum
Verizon Wireless holds, and the sizes of the geographic areas it is authorized to operate in, vary for each of these services. However, all of the
licenses Verizon Wireless holds allow it to use spectrum to provide a wide
range of mobile and fixed communications services, including both voice
and data services, and Verizon Wireless operates a seamless network that
utilizesthoselicensestoprovideservicestocustomers.BecausetheFCC
issues licenses for only a fixed time, generally 10 years, Verizon Wireless
mustperiodicallyseekrenewalofthoselicenses.AlthoughtheFCChas
routinelyrenewedallofVerizonWireless’ licensesthathavecomeupfor
renewal to date, challenges could be brought against the licenses in the
future. If a wireless license were revoked or not renewed upon expiration, Verizon Wireless would not be permitted to provide services on the
licensed spectrum in the area covered by that license.
TheFCChasalsoimposedspecificmandatesoncarriersthatoperate
wirelesscommunicationssystems,whichincreaseVerizonWireless’costs.
These mandates include requirements that Verizon Wireless: (i) meet
specific construction and geographic coverage requirements during
the license term; (ii) meet technical operating standards that, among
other things, limit the radio frequency radiation from mobile devices
and antennas; (iii) deploy“Enhanced 911” wireless services that providethewirelesscaller’snumber,locationandotherinformationtoa
state or local public safety agency that handles 911 calls; (iv) provide
roaming services to other wireless service providers; and (v) comply
with regulations for the construction of transmitters and towers that,
among other things, restrict siting of towers in environmentally sensitive locations and in places where the towers would affect a site listed
oreligibleforlistingontheNationalRegisterofHistoricPlaces.Changes
to these mandates could require Verizon Wireless to make changes to
operations or increase its costs of compliance. In its November 4, 2008
orderapprovingVerizonWireless’ acquisitionofAlltel,theFCCadopted
conditions that impose additional requirements on Verizon Wireless in its
provision of Enhanced 911 services and roaming services. Subsequently,
initsAugust23,2012orderapprovingVerizonWireless’ acquisitionof
various spectrum licenses from several cable companies and wireless
carriers,theFCCadoptedconditionsobligatingVerizonWirelesstomeet
specified buildout milestones for the acquired spectrum and to offer
data roaming arrangements.
The Communications Act imposes restrictions on foreign ownership of
U.S.wirelesssystems.TheFCChasapprovedtheinterestthatVodafone
Group Plc holds, through various of its subsidiaries, in Verizon Wireless.
TheFCCmayneedtoapproveanyincreaseinVodafone’sinterestorthe
acquisition of an ownership interest by other foreign entities. In addi46
tion, as part of the FCC’s approval of Vodafone’s ownership interest,
Verizon Wireless, Verizon and Vodafone entered into an agreement with
the U.S. Department of Defense, Department of Justice and Federal
Bureau of Investigation which imposes national security and law enforcement-related obligations on the ways in which Verizon Wireless stores
information and otherwise conducts its business.
Verizon Wireless anticipates that it will need additional spectrum to meet
future demand. It can meet spectrum needs by purchasing licenses or
leasing spectrum from other licensees, or by acquiring new spectrum
licensesfromtheFCC.UndertheCommunicationsAct,beforeVerizon
Wireless can acquire a license from another licensee in order to expand
its coverage or its spectrum capacity in a particular area, it must file an
applicationwiththeFCC,andtheFCCcangranttheapplicationonly
after a period for public notice and comment. This review process can
delay acquisition of spectrum needed to expand services, and can result
in conditions on the purchaser that can impact its costs and business
plans.The Communications Act also requires the FCC to award new
licenses for most commercial wireless services through a competitive
bidding process in which spectrum is awarded to bidders in an auction.
Verizon Wireless has participated in spectrum auctions to acquire licenses
forradiospectruminvariousbands.Mostrecently,VerizonWirelessparticipatedintheFCC’sauctionofspectruminthe700MHzband,andwas
thehighbidderon109licensesinthe700MHzband.TheFCCgrantedall
of those licenses to Verizon Wireless on November 26, 2008.
TheFCCalsoadoptedservicerulesthatwillimposecostsonlicensees
thatacquirethe700MHzbandspectrumeitherthroughauctionorby
purchasing such spectrum from other companies. These rules include
minimum coverage mandates by specific dates during the license terms,
and,forapproximatelyone-thirdofthespectrum,knownasthe“CBlock,”
“open access” requirements, which generally require licensees of that
spectrum to allow customers to use devices and applications of their
choice on the LTE network we are deploying on that spectrum, including
those obtained from sources other than us or our distributors or dealers,
subject to certain technical limitations established by us. Verizon Wireless
holdstheCBlock700MHzlicensescoveringtheentireUnitedStates.In
adoptingits“netneutrality”rulesdiscussedabove,theFCCstatedthat
the new rules operate independently from the“open access” requirements that continue to apply to the C Block licensees.
TheFCCisalsoconductingseveralproceedingstoexploremakingadditional spectrum available for licensed and/or unlicensed use or restricting
spectrumholdings.Mostrecently,onSeptember28,2012,pursuantto
legislationthatCongressenactedinFebruary2012,theFCCbeganaproceeding to consider making available certain spectrum currently used for
television broadcast operations. On that day it also began a proceeding
to consider whether to limit the aggregate amount of spectrum any one
licenseecouldacquireorotherwiseregulatelicensees’spectrumholdings.
State Regulation and Local Approvals
Telephone Operations
State public utility commissions regulate our telephone operations with
respect to certain telecommunications intrastate matters. Our competitive local exchange carrier and long distance operations are lightly
regulated the same as other similarly situated carriers. Our incumbent
local exchange operations (California, Connecticut, Delaware, the District
ofColumbia,Florida,Maryland,Massachusetts,NewJersey,NewYork,
NorthCarolina,Pennsylvania,RhodeIsland,TexasandVirginia)aresubject
to various levels of pricing flexibility, deregulation, detariffing, and service
quality standards. None of the states are subject to earnings regulation.
MANAGEMENT’S DISCUSSION AND ANALYSIS
OF FINANCIAL CONDITION AND RESULTS OF OPERATIONS continued
Video
Companies that provide cable service over a cable system are typically
subject to state and/or local cable television rules and regulations. As
noted above, cable operators generally must obtain a local cable franchise from each local unit of government prior to providing cable service
in that local area. Some states have enacted legislation that enables
cable operators to apply for, and obtain, a single cable franchise at the
state, rather than local, level. To date, Verizon has applied for and received
state-issuedfranchisesinCalifornia,Florida,NewJersey,Texasandthe
unincorporated areas of Delaware. We also have obtained authorizationfromthestatecommissioninRhodeIslandtoprovidecableservice
in certain areas in that state, have obtained required state commission
approvals for our local franchises in New York, and will need to obtain
additional state commission approvals in these states to provide cable
service in additional areas. Virginia law provides us the option of entering
a given franchise area using state standards if local franchise negotiations
are unsuccessful.
Wireless Services
The rapid growth of the wireless industry has led to efforts by some state
legislatures and state public utility commissions to regulate the industry
in ways that may impose additional costs on Verizon Wireless. The
Communications Act generally preempts regulation by state and local
governments of the entry of, or the rates charged by, wireless carriers, but
doesnotprohibitstatesfromregulatingtheother“termsandconditions”
of wireless service. While numerous state commissions do not currently
have jurisdiction over wireless services, state legislatures may decide to
grant them such jurisdiction, and those commissions that already have
authority to impose regulations on wireless carriers may adopt new rules.
CAUTIONARY STATEMENT CONCERNING
FORWARD-LOOKING STATEMENTS
In this report we have made forward-looking statements. These statements are based on our estimates and assumptions and are subject to
risksanduncertainties.Forward-lookingstatementsincludetheinformation concerning our possible or assumed future results of operations.
Forward-looking statements also include those preceded or followed
bythewords“anticipates,”“believes,”“estimates,”“hopes”orsimilarexpressions.Forthosestatements,weclaimtheprotectionofthesafeharborfor
forward-looking statements contained in the Private Securities Litigation
ReformActof1995.
The following important factors, along with those discussed elsewhere
in this report could affect future results and could cause those results to
differ materially from those expressed in the forward-looking statements:
•
•
•
•
•
•
•
State efforts to regulate wireless services have included proposals to
regulate customer billing, termination of service, trial periods for service,
advertising, the use of handsets while driving, reporting requirements
for system outages and the availability of broadband wireless services.
Wireless tower and antenna facilities are also subject to state and local
zoning and land use regulation, and securing approvals for new or modified tower or antenna sites is often a lengthy and expensive process.
•
Verizon Wireless (as well as AT&T and Sprint-Nextel) is a party to an
Assurance of Voluntary Compliance (AVC) with 33 State Attorneys
General.TheAVC,whichgenerallyreflectedVerizonWireless’ practicesat
thetimeitwasenteredintoinJuly2004,obligatesthecompanytodisclose certain rates and terms during a sales transaction, to provide maps
depicting coverage, and to comply with various requirements regarding
advertising, billing, and other practices.
•
•
•
adverseconditionsintheU.S.andinternationaleconomies;
competition in our markets;
material changes in available technology or technology substitution;
disruptionofourkeysuppliers’provisioningofproductsorservices;
changes in the regulatory environments in which we operate, including
any increase in restrictions on our ability to operate our networks;
breaches of network or information technology security, natural disasters, terrorist attacks or significant litigation and any resulting financial
impact not covered by insurance;
an adverse change in the ratings afforded our debt securities by
nationally accredited ratings organizations or adverse conditions in
the credit markets impacting the cost, including interest rates, and/or
availability of financing;
changes in our accounting assumptions that regulatory agencies,
including the SEC, may require or that result from changes in the
accounting rules or their application, which could result in an impact
on earnings;
material adverse changes in labor matters, including labor negotiations, and any resulting financial and/or operational impact;
significant increases in benefit plan costs or lower investments returns
on plan assets; and
the inability to implement our business strategies.
Environmental Matters
During 2003, under a government-approved plan, remediation commenced at the site of a former Sylvania facility in Hicksville, New York
thatprocessednuclearfuelrodsinthe1950sand1960s.Remediation
beyond original expectations proved to be necessary and a reassessment
of the anticipated remediation costs was conducted. A reassessment of
costs related to remediation efforts at several other former facilities was
also undertaken. In September 2005, the Army Corps of Engineers (ACE)
accepted the Hicksville site into the Formerly Utilized Sites Remedial
Action Program. This may result in the ACE performing some or all of the
remediation effort for the Hicksville site with a corresponding decrease
in costs to Verizon. To the extent that the ACE assumes responsibility
for remedial work at the Hicksville site, an adjustment to a reserve previously established for the remediation may be made. Adjustments to
the reserve may also be made based upon actual conditions discovered
during the remediation at this or any other site requiring remediation.
47
V E R I ZO N CO M M U N I C AT I O N S I N C . A N D S U B S I D I A R I E S
REPORT OF MANAGEMENT ON INTERNAL CONTROL OVER
REPORT OF INDEPENDENT REGISTERED PUBLIC ACCOUNTING
FINANCIAL REPORTING
FIRM ON INTERNAL CONTROL OVER FINANCIAL REPORTING
We, the management of Verizon Communications Inc., are responsible
for establishing and maintaining adequate internal control over financial
reporting of the company. Management has evaluated internal control
over financial reporting of the company using the criteria for effective
internal control established in Internal Control–Integrated Framework
issued by the Committee of Sponsoring Organizations of the Treadway
Commission.
To The Board of Directors and Shareowners of Verizon
Communications Inc.:
Management has assessed the effectiveness of the company’s internal
control over financial reporting as of December 31, 2012. Based on this
assessment, we believe that the internal control over financial reporting
of the company is effective as of December 31, 2012. In connection with
this assessment, there were no material weaknesses in the company’s
internal control over financial reporting identified by management.
The company’s financial statements included in this Annual Report
have been audited by Ernst & Young LLP, independent registered public
accounting firm. Ernst & Young LLP has also provided an attestation
report on the company’s internal control over financial reporting.
Lowell C. McAdam
Chairman and Chief Executive Officer
Francis J. Shammo
Executive Vice President and Chief Financial Officer
Robert J. Barish
Senior Vice President and Controller
48
We have audited Verizon Communications Inc. and subsidiaries’ (Verizon)
internal control over financial reporting as of December 31, 2012,
based on criteria established in Internal Control–Integrated Framework
issued by the Committee of Sponsoring Organizations of the Treadway
Commission (the COSO criteria). Verizon’s management is responsible
for maintaining effective internal control over financial reporting, and
for its assessment of the effectiveness of internal control over financial
reporting included in the accompanying Report of Management on
Internal Control Over Financial Reporting. Our responsibility is to express
an opinion on the company’s internal control over financial reporting
based on our audit.
We conducted our audit in accordance with the standards of the Public
Company Accounting Oversight Board (United States). Those standards
require that we plan and perform the audit to obtain reasonable assurance about whether effective internal control over financial reporting
was maintained in all material respects. Our audit included obtaining an
understanding of internal control over financial reporting, assessing the
risk that a material weakness exists, testing and evaluating the design
and operating effectiveness of internal control based on the assessed
risk, and performing such other procedures as we considered necessary
in the circumstances. We believe that our audit provides a reasonable
basis for our opinion.
A company’s internal control over financial reporting is a process designed
to provide reasonable assurance regarding the reliability of financial
reporting and the preparation of financial statements for external purposes in accordance with generally accepted accounting principles. A
company’s internal control over financial reporting includes those policies and procedures that (1) pertain to the maintenance of records that,
in reasonable detail, accurately and fairly reflect the transactions and
dispositions of the assets of the company; (2) provide reasonable assurance that transactions are recorded as necessary to permit preparation of
financial statements in accordance with generally accepted accounting
principles, and that receipts and expenditures of the company are being
made only in accordance with authorizations of management and directors of the company; and (3) provide reasonable assurance regarding
prevention or timely detection of unauthorized acquisition, use, or disposition of the company’s assets that could have a material effect on the
financial statements.
REPORT OF INDEPENDENT REGISTERED PUBLIC ACCOUNTING
FIRM ON FINANCIAL STATEMENTS
Because of its inherent limitations, internal control over financial reporting
may not prevent or detect misstatements. Also, projections of any evaluation of effectiveness to future periods are subject to the risk that controls
may become inadequate because of changes in conditions, or that the
degree of compliance with the policies or procedures may deteriorate.
In our opinion, Verizon maintained, in all material respects, effective
internal control over financial reporting as of December 31, 2012, based
on the COSO criteria.
We also have audited, in accordance with the standards of the Public
Company Accounting Oversight Board (United States), the consolidated
balance sheets of Verizon as of December 31, 2012 and 2011, and the
related consolidated statements of income, comprehensive income, cash
flows and changes in equity for each of the three years in the period
ended December 31, 2012 of Verizon and our report dated February 26,
2013 expressed an unqualified opinion thereon.
Ernst & Young LLP
New York, New York
February 26, 2013
To The Board of Directors and Shareowners of Verizon
Communications Inc.:
We have audited the accompanying consolidated balance sheets of
Verizon Communications Inc. and subsidiaries (Verizon) as of December
31, 2012 and 2011, and the related consolidated statements of income,
comprehensive income, cash flows and changes in equity for each of
the three years in the period ended December 31, 2012. These financial
statements are the responsibility of Verizon’s management. Our responsibility is to express an opinion on these financial statements based on
our audits.
We conducted our audits in accordance with the standards of the Public
Company Accounting Oversight Board (United States). Those standards require that we plan and perform the audit to obtain reasonable
assurance about whether the financial statements are free of material
misstatement. An audit includes examining, on a test basis, evidence
supporting the amounts and disclosures in the financial statements. An
audit also includes assessing the accounting principles used and significant estimates made by management, as well as evaluating the overall
financial statement presentation. We believe that our audits provide a
reasonable basis for our opinion.
In our opinion, the financial statements referred to above present fairly,
in all material respects, the consolidated financial position of Verizon
at December 31, 2012 and 2011, and the consolidated results of its
operations and its cash flows for each of the three years in the period
ended December 31, 2012, in conformity with U.S. generally accepted
accounting principles.
We also have audited, in accordance with the standards of the Public
Company Accounting Oversight Board (United States), Verizon’s internal
control over financial reporting as of December 31, 2012, based on criteria established in Internal Control–Integrated Framework issued by the
Committee of Sponsoring Organizations of the Treadway Commission
and our report dated February 26, 2013 expressed an unqualified opinion
thereon.
Ernst & Young LLP
New York, New York
February 26, 2013
49
V E R I ZO N CO M M U N I C AT I O N S I N C . A N D S U B S I D I A R I E S
CONSOLIDATED STATEMENTS OF INCOME
(dollars in millions, except per share amounts)
2012
2011
2010
$ 115,846
$ 110,875
$ 106,565
46,275
39,951
16,460
102,686
45,875
35,624
16,496
97,995
44,149
31,366
16,405
91,920
Operating Income
Equity in earnings of unconsolidated businesses
Other income and (expense), net
Interest expense
Income Before (Provision) Benefit For Income Taxes
(Provision) Benefit for income taxes
Net Income
13,160
324
(1,016)
(2,571)
9,897
660
$ 10,557
$
12,880
444
(14)
(2,827)
10,483
(285)
10,198
14,645
508
54
(2,523)
12,684
(2,467)
10,217
Net income attributable to noncontrolling interest
Net income attributable to Verizon
Net Income
$
9,682
875
$ 10,557
$
$
Basic Earnings Per Common Share
Net income attributable to Verizon
Weighted-average shares outstanding (in millions)
$
.31
2,853
$
.85
2,833
$
.90
2,830
Diluted Earnings Per Common Share
Net income attributable to Verizon
Weighted-average shares outstanding (in millions)
$
.31
2,862
$
.85
2,839
$
.90
2,833
Years Ended December 31,
Operating Revenues
Operating Expenses
Cost of services and sales (exclusive of items shown below)
Selling, general and administrative expense
Depreciation and amortization expense
Total Operating Expenses
See Notes to Consolidated Financial Statements
50
7,794
2,404
10,198
$
$
$
7,668
2,549
10,217
V E R I ZO N CO M M U N I C AT I O N S I N C . A N D S U B S I D I A R I E S
CONSOLIDATED STATEMENTS OF COMPREHENSIVE INCOME
(dollars in millions)
Years Ended December 31,
2012
Net Income
$ 10,557
Other Comprehensive Income, net of taxes
Foreign currency translation adjustments
Unrealized gain (loss) on cash flow hedges
Unrealized gain (loss) on marketable securities
Defined benefit pension and postretirement plans
Other comprehensive income attributable to Verizon
Other comprehensive income (loss) attributable to noncontrolling interest
Total Comprehensive Income
Comprehensive income attributable to noncontrolling interest
Comprehensive income attributable to Verizon
Total Comprehensive Income
69
(68)
29
936
966
10
$ 11,533
9,692
1,841
$ 11,533
2011
$
$
$
10,198
(119)
30
(7)
316
220
1
10,419
7,795
2,624
10,419
2010
$
$
$
10,217
(171)
89
29
2,451
2,398
(35)
12,580
7,633
4,947
12,580
See Notes to Consolidated Financial Statements
51
V E R I ZO N CO M M U N I C AT I O N S I N C . A N D S U B S I D I A R I E S
CONSOLIDATED BALANCE SHEETS
(dollars in millions, except per share amounts)
2012
At December 31,
Assets
Current assets
Cash and cash equivalents
Short-term investments
Accounts receivable, net of allowances of $641 and $802
Inventories
Prepaid expenses and other
Total current assets
$
Liabilities and Equity
Current liabilities
Debt maturing within one year
Accounts payable and accrued liabilities
Other
Total current liabilities
Long-term debt
Employee benefit obligations
Deferred income taxes
Other liabilities
Equity
Series preferred stock ($.10 par value; none issued)
Common stock ($.10 par value; 2,967,610,119 shares issued in both periods)
Contributed capital
Reinvested earnings (Accumulated deficit)
Accumulated other comprehensive income
Common stock in treasury, at cost
Deferred compensation – employee stock ownership plans and other
Noncontrolling interest
Total equity
Total liabilities and equity
See Notes to Consolidated Financial Statements
52
$
13,362
592
11,776
940
4,269
30,939
209,575
120,933
88,642
215,626
127,192
88,434
3,401
77,744
24,139
5,933
4,128
$ 225,222
$
3,448
73,250
23,357
5,878
5,155
230,461
$
$
Plant, property and equipment
Less accumulated depreciation
Investments in unconsolidated businesses
Wireless licenses
Goodwill
Other intangible assets, net
Other assets
Total assets
3,093
470
12,576
1,075
4,021
21,235
2011
4,369
16,182
6,405
26,956
47,618
34,346
24,677
6,092
–
297
37,990
(3,734)
2,235
(4,071)
440
52,376
85,533
$ 225,222
4,849
14,689
11,223
30,761
50,303
32,957
25,060
5,472
$
–
297
37,919
1,179
1,269
(5,002)
308
49,938
85,908
230,461
V E R I ZO N CO M M U N I C AT I O N S I N C . A N D S U B S I D I A R I E S
CONSOLIDATED STATEMENTS OF CASH FLOWS
(dollars in millions)
Years Ended December 31,
Cash Flows from Operating Activities
Net Income
Adjustments to reconcile net income to net cash provided by operating activities:
Depreciation and amortization expense
Employee retirement benefits
Deferred income taxes
Provision for uncollectible accounts
Equity in earnings of unconsolidated businesses, net of dividends received
Changes in current assets and liabilities, net of effects from acquisition/disposition
of businesses
Accounts receivable
Inventories
Other assets
Accounts payable and accrued liabilities
Other, net
Net cash provided by operating activities
2012
$ 10,557
2011
$
10,198
2010
$
10,217
16,460
8,198
(952)
972
77
16,496
7,426
(223)
1,026
36
16,405
3,988
3,233
1,246
2
(1,717)
(136)
306
1,144
(3,423)
31,486
(966)
208
86
(1,607)
(2,900)
29,780
(859)
299
(313)
1,075
(1,930)
33,363
Cash Flows from Investing Activities
Capital expenditures (including capitalized software)
Acquisitions of investments and businesses, net of cash acquired
Acquisitions of wireless licenses, net
Proceeds from dispositions
Net change in short-term investments
Other, net
Net cash used in investing activities
(16,175)
(913)
(3,935)
–
27
494
(20,502)
(16,244)
(1,797)
(221)
–
35
977
(17,250)
(16,458)
(652)
(786)
2,594
(3)
251
(15,054)
Cash Flows from Financing Activities
Proceeds from long-term borrowings
Repayments of long-term borrowings and capital lease obligations
Increase (decrease) in short-term obligations, excluding current maturities
Dividends paid
Proceeds from sale of common stock
Proceeds from access line spin-off
Special distribution to noncontrolling interest
Other, net
Net cash used in financing activities
4,489
(6,403)
(1,437)
(5,230)
315
–
(8,325)
(4,662)
(21,253)
11,060
(11,805)
1,928
(5,555)
241
–
–
(1,705)
(5,836)
–
(8,136)
(1,097)
(5,412)
–
3,083
–
(2,088)
(13,650)
(10,269)
13,362
$ 3,093
6,694
6,668
13,362
4,659
2,009
6,668
Increase (decrease) in cash and cash equivalents
Cash and cash equivalents, beginning of period
Cash and cash equivalents, end of period
$
$
See Notes to Consolidated Financial Statements
53
V E R I ZO N CO M M U N I C AT I O N S I N C . A N D S U B S I D I A R I E S
CONSOLIDATED STATEMENTS OF CHANGES IN EQUITY
(dollars in millions, except per share amounts, and shares in thousands)
Years Ended December 31,
Common Stock
Balance at beginning of year
Balance at end of year
2012
Shares
2,967,610
2,967,610
$
Amount
2011
Shares
297
297
2,967,610
2,967,610
$
Amount
2010
Shares
297
297
2,967,610
2,967,610
Amount
$
297
297
Contributed Capital
Balance at beginning of year
Telephone access line spin-off (Note 2)
Other
Balance at end of year
37,919
–
71
37,990
37,922
–
(3)
37,919
40,108
(2,184)
(2)
37,922
Reinvested Earnings (Accumulated Deficit)
Balance at beginning of year
Net income attributable to Verizon
Dividends declared ($2.03, $1.975, $1.925) per share
Balance at end of year
1,179
875
(5,788)
(3,734)
4,368
2,404
(5,593)
1,179
7,260
2,549
(5,441)
4,368
Accumulated Other Comprehensive Income (Loss)
Balance at beginning of year attributable to Verizon
Telephone access line spin-off (Note 2)
Adjusted balance at beginning of year
Foreign currency translation adjustments
Unrealized gains (losses) on cash flow hedges
Unrealized gains (losses) on marketable securities
Defined benefit pension and postretirement plans
Other comprehensive income
Balance at end of year attributable to Verizon
1,269
–
1,269
69
(68)
29
936
966
2,235
1,049
–
1,049
(119)
30
(7)
316
220
1,269
(1,372)
23
(1,349)
(171)
89
29
2,451
2,398
1,049
Treasury Stock
Balance at beginning of year
Employee plans (Note 15)
Shareowner plans (Note 15)
Other (Note 9)
Balance at end of year
Deferred Compensation-ESOPs and Other
Balance at beginning of year
Restricted stock equity grant
Amortization
Balance at end of year
Noncontrolling Interest
Balance at beginning of year
Net income attributable to noncontrolling interest
Other comprehensive income (loss)
Total comprehensive income
Distributions and other
Balance at end of year
Total Equity
See Notes to Consolidated Financial Statements
54
(133,594)
11,434
13,119
–
(109,041)
(5,002)
433
498
–
(4,071)
(140,587)
6,982
11
–
(133,594)
(5,267)
265
–
–
(5,002)
(131,942)
347
8
(9,000)
(140,587)
(5,000)
13
–
(280)
(5,267)
308
196
(64)
440
200
146
(38)
308
89
97
14
200
49,938
9,682
10
9,692
(7,254)
52,376
48,343
7,794
1
7,795
(6,200)
49,938
42,761
7,668
(35)
7,633
(2,051)
48,343
$ 85,533
$
85,908
$
86,912
V E R I ZO N CO M M U N I C AT I O N S I N C . A N D S U B S I D I A R I E S
NOTES TO CONSOLIDATED FINANCIAL STATEMENTS
NOTE 1
DESCRIPTION OF BUSINESS AND SUMMARY OF SIGNIFICANT ACCOUNTING POLICIES
Description of Business
Verizon Communications Inc. (Verizon or the Company) is a holding company, which acting through its subsidiaries is one of the world’s leading
providers of communications, information and entertainment products
and services to consumers, businesses and governmental agencies with
a presence in over 150 countries around the world. We have two reportable segments, Verizon Wireless and Wireline. For further information
concerning our business segments, see Note 13.
Use of Estimates
We prepare our financial statements using U.S. generally accepted
accounting principles (GAAP), which require management to make estimates and assumptions that affect reported amounts and disclosures.
Actual results could differ from those estimates.
Verizon Wireless provides wireless communications services across one of
the most extensive wireless networks in the United States (U.S.) and has
the largest third-generation (3G) and fourth-generation (4G) Long-Term
Evolution technology (LTE) networks of any U.S. wireless service provider.
Examples of significant estimates include: the allowance for doubtful
accounts, the recoverability of plant, property and equipment, the
recoverability of intangible assets and other long-lived assets, unbilled
revenues, fair values of financial instruments, unrecognized tax benefits, valuation allowances on tax assets, accrued expenses, pension and
postretirement benefit assumptions, contingencies and allocation of purchase prices in connection with business combinations.
The Wireline segment provides communications products and services
including local exchange and long distance voice service, broadband
video and data, IP network services, network access and other services to
consumers, small businesses and carriers in the United States, as well as
to businesses and government customers both in the United States and
in over 150 other countries around the world.
Revenue Recognition
Multiple Deliverable Arrangements
In both our Verizon Wireless and Wireline segments, we offer products
and services to our customers through bundled arrangements. These
arrangements involve multiple deliverables which may include products,
services, or a combination of products and services.
Consolidation
The method of accounting applied to investments, whether consolidated, equity or cost, involves an evaluation of all significant terms of
the investments that explicitly grant or suggest evidence of control or
influence over the operations of the investee. The consolidated financial
statements include our controlled subsidiaries. For controlled subsidiaries
that are not wholly owned, the noncontrolling interest is included in Net
income and Total equity. Investments in businesses which we do not
control, but have the ability to exercise significant influence over operating and financial policies, are accounted for using the equity method.
Investments in which we do not have the ability to exercise significant
influence over operating and financial policies are accounted for under
the cost method. Equity and cost method investments are included in
Investments in unconsolidated businesses in our consolidated balance
sheets. Certain of our cost method investments are classified as availablefor-sale securities and adjusted to fair value pursuant to the accounting
standard related to debt and equity securities. All significant intercompany accounts and transactions have been eliminated.
On January 1, 2011, we prospectively adopted the accounting standard
updates regarding revenue recognition for multiple deliverable arrangements, and arrangements that include software elements. These updates
require us to allocate revenue in an arrangement using its best estimate
of selling price if neither vendor specific objective evidence (VSOE) nor
third party evidence (TPE) of selling price exists.
Basis of Presentation
We have reclassified certain prior year amounts to conform to the current
year presentation.
Corporate, eliminations and other during the periods presented include
a non-cash adjustment of $0.2 billion in 2010, primarily to adjust wireless service revenues. This adjustment was recorded to properly defer
previously recognized wireless service revenues that were earned and
recognized in future periods. The adjustment was recorded during 2010,
which reduced Net income attributable to Verizon by approximately
$0.1 billion.
Verizon Wireless
Our Verizon Wireless segment earns revenue primarily by providing
access to and usage of its network. In general, access revenue is billed
one month in advance and recognized when earned. Usage revenue
is generally billed in arrears and recognized when service is rendered.
Equipment sales revenue associated with the sale of wireless handsets
and accessories is recognized when the products are delivered to and
accepted by the customer, as this is considered to be a separate earnings process from providing wireless services. For agreements involving
the resale of third-party services in which we are considered the primary
obligor in the arrangements, we record the revenue gross at the time of
the sale. For equipment sales, we currently subsidize the cost of wireless devices. The amount of this subsidy is generally contingent on the
arrangement and terms selected by the customer. The equipment revenue is recognized up to the amount collected when the wireless device
is sold.
Wireline
Our Wireline segment earns revenue based upon usage of its network
and facilities and contract fees. In general, fixed monthly fees for voice,
video, data and certain other services are billed one month in advance
and recognized when earned. Revenue from services that are not fixed in
amount and are based on usage is generally billed in arrears and recognized when service is rendered.
We sell each of the services offered in bundled arrangements (i.e., voice,
video and data), as well as separately; therefore each product or service
has a standalone selling price. For these arrangements revenue is allocated to each deliverable using a relative selling price method. Under this
method, arrangement consideration is allocated to each separate deliverable based on our standalone selling price for each product or service.
These services include FiOS services, individually or in bundles, and High
Speed Internet.
55
NOTES TO CONSOLIDATED FINANCIAL STATEMENTS continued
When we bundle equipment with maintenance and monitoring services,
we recognize equipment revenue when the equipment is installed in
accordance with contractual specifications and ready for the customer’s
use. The maintenance and monitoring services are recognized monthly
over the term of the contract as we provide the services.
Inventories
Inventory consists of wireless and wireline equipment held for sale,
which is carried at the lower of cost (determined principally on either an
average cost or first-in, first-out basis) or market.
Installation related fees, along with the associated costs up to but not
exceeding these fees, are deferred and amortized over the estimated customer relationship period.
Plant and Depreciation
We record plant, property and equipment at cost. Plant, property and
equipment of wireline and wireless operations are generally depreciated
on a straight-line basis.
For each of our segments we report taxes imposed by governmental
authorities on revenue-producing transactions between us and our customers on a net basis.
Leasehold improvements are amortized over the shorter of the estimated
life of the improvement or the remaining term of the related lease, calculated from the time the asset was placed in service.
Maintenance and Repairs
We charge the cost of maintenance and repairs, including the cost of
replacing minor items not constituting substantial betterments, principally to Cost of services and sales as these costs are incurred.
When the depreciable assets of our wireline and wireless operations
are retired or otherwise disposed of, the related cost and accumulated
depreciation are deducted from the plant accounts, and any gains or
losses on disposition are recognized in income.
Advertising Costs
Costs for advertising products and services as well as other promotional
and sponsorship costs are charged to Selling, general and administrative
expense in the periods in which they are incurred (see Note 15).
We capitalize and depreciate network software purchased or developed
along with related plant assets. We also capitalize interest associated with
the acquisition or construction of network-related assets. Capitalized
interest is reported as a reduction in interest expense and depreciated as
part of the cost of the network-related assets.
Earnings Per Common Share
Basic earnings per common share are based on the weighted-average
number of shares outstanding during the period. Where appropriate,
diluted earnings per common share include the dilutive effect of shares
issuable under our stock-based compensation plans.
There were a total of approximately 9 million, 6 million and 3 million stock
options and restricted stock units outstanding included in the computation of diluted earnings per common share for the years ended December
31, 2012, 2011 and 2010, respectively. Outstanding options to purchase
shares that were not included in the computation of diluted earnings
per common share, because to do so would have been anti-dilutive for
the period, were not significant for the year ended December 31, 2012
and included approximately 19 million and 73 million weighted-average
shares for the years ended December 31, 2011 and 2010, respectively.
We are authorized to issue up to 4.25 billion and 250 million shares of
common stock and Series Preferred Stock, respectively.
Cash and Cash Equivalents
We consider all highly liquid investments with a maturity of 90 days or
less when purchased to be cash equivalents. Cash equivalents are stated
at cost, which approximates quoted market value and include amounts
held in money market funds.
Marketable Securities
We have investments in marketable securities, which are considered
“available-for-sale” under the provisions of the accounting standard for
certain debt and equity securities, and are included in the accompanying
consolidated balance sheets in Short-term investments, Investments in
unconsolidated businesses or Other assets. We continually evaluate our
investments in marketable securities for impairment due to declines in
market value considered to be other-than-temporary. That evaluation
includes, in addition to persistent, declining stock prices, general economic and company-specific evaluations. In the event of a determination
that a decline in market value is other-than-temporary, a charge to earnings is recorded for the loss, and a new cost basis in the investment is
established.
56
In connection with our ongoing review of the estimated remaining
average useful lives of plant, property and equipment at our local telephone operations, we determined that there were no changes necessary
for average useful lives for 2012, 2011, and 2010. In connection with our
ongoing review of the estimated remaining average useful lives of plant,
property and equipment at our wireless operations, we determined that
changes were necessary to the remaining estimated useful lives as a result
of technology upgrades, enhancements, and planned retirements. These
changes resulted in increases in depreciation expense of $0.4 billion and
$0.3 billion in 2011 and 2010, respectively. While the timing and extent of
current deployment plans are subject to ongoing analysis and modification, we believe the current estimates of useful lives are reasonable.
Computer Software Costs
We capitalize the cost of internal-use network and non-network software
that has a useful life in excess of one year. Subsequent additions, modifications or upgrades to internal-use network and non-network software
are capitalized only to the extent that they allow the software to perform
a task it previously did not perform. Planning, software maintenance and
training costs are expensed in the period in which they are incurred. Also,
we capitalize interest associated with the development of internal-use
network and non-network software. Capitalized non-network internaluse software costs are amortized using the straight-line method over a
period of 3 to 7 years and are included in Other intangible assets, net
in our consolidated balance sheets. For a discussion of our impairment
policy for capitalized software costs, see “Goodwill and Other Intangible
Assets” below. Also, see Note 3 for additional detail of internal-use nonnetwork software reflected in our consolidated balance sheets.
Goodwill and Other Intangible Assets
Goodwill
Goodwill is the excess of the acquisition cost of businesses over the
fair value of the identifiable net assets acquired. Impairment testing for
goodwill is performed annually in the fourth fiscal quarter. The Company
has the option to perform a qualitative assessment to determine if
the fair value of the entity is less than its carrying value. However, the
Company may elect to perform an impairment test even if no indications
of a potential impairment exist. The impairment test for goodwill uses a
two-step approach, which is performed at the reporting unit level. We
have determined that in our case, the reporting units are our operating
NOTES TO CONSOLIDATED FINANCIAL STATEMENTS continued
segments since that is the lowest level at which discrete, reliable financial and cash flow information is available. Step one compares the fair
value of the reporting unit (calculated using a market approach and/or a
discounted cash flow method) to its carrying value. If the carrying value
exceeds the fair value, there is a potential impairment and step two must
be performed. Step two compares the carrying value of the reporting
unit’s goodwill to its implied fair value (i.e., fair value of reporting unit
less the fair value of the unit’s assets and liabilities, including identifiable
intangible assets). If the implied fair value of goodwill is less than the carrying amount of goodwill, an impairment is recognized.
Intangible Assets Not Subject to Amortization
A significant portion of our intangible assets are wireless licenses that
provide our wireless operations with the exclusive right to utilize designated radio frequency spectrum to provide wireless communication
services. While licenses are issued for only a fixed time, generally ten years,
such licenses are subject to renewal by the Federal Communications
Commission (FCC). Renewals of licenses have occurred routinely and at
nominal cost. Moreover, we have determined that there are currently no
legal, regulatory, contractual, competitive, economic or other factors that
limit the useful life of our wireless licenses. As a result, we treat the wireless
licenses as an indefinite-lived intangible asset. We reevaluate the useful
life determination for wireless licenses each year to determine whether
events and circumstances continue to support an indefinite useful life.
We test our wireless licenses for potential impairment annually. We evaluate our licenses on an aggregate basis using a direct value approach.
The direct value approach estimates fair value using a discounted cash
flow analysis to estimate what a marketplace participant would be willing
to pay to purchase the aggregated wireless licenses as of the valuation
date. If the fair value of the aggregated wireless licenses is less than the
aggregated carrying amount of the licenses, an impairment is recognized.
Interest expense incurred while qualifying activities are performed to
ready wireless licenses for their intended use is capitalized as part of
wireless licenses. The capitalization period ends when the development
is discontinued or substantially complete and the license is ready for its
intended use.
Intangible Assets Subject to Amortization and Long-Lived Assets
Our intangible assets that do not have indefinite lives (primarily customer
lists and non-network internal-use software) are amortized over their
useful lives. All of our intangible assets subject to amortization and longlived assets are reviewed for impairment whenever events or changes in
circumstances indicate that the carrying amount of the asset may not be
recoverable. If any indications were present, we would test for recoverability by comparing the carrying amount of the asset group to the net
undiscounted cash flows expected to be generated from the asset group.
If those net undiscounted cash flows do not exceed the carrying amount,
we would perform the next step, which is to determine the fair value
of the asset and record an impairment, if any. We reevaluate the useful
life determinations for these intangible assets each year to determine
whether events and circumstances warrant a revision in their remaining
useful lives.
For information related to the carrying amount of goodwill by segment,
wireless licenses and other intangible assets, as well as the major components and average useful lives of our other acquired intangible assets,
see Note 3.
Fair Value Measurements
Fair value of financial and non-financial assets and liabilities is defined
as an exit price, representing the amount that would be received to sell
an asset or paid to transfer a liability in an orderly transaction between
market participants. The three-tier hierarchy for inputs used in measuring
fair value, which prioritizes the inputs used in the methodologies of measuring fair value for assets and liabilities, is as follows:
Level 1 – Quoted prices in active markets for identical assets or liabilities
Level 2 – Observable inputs other than quoted prices in active markets
for identical assets and liabilities
Level 3 – No observable pricing inputs in the market
Financial assets and financial liabilities are classified in their entirety based
on the lowest level of input that is significant to the fair value measurements. Our assessment of the significance of a particular input to the fair
value measurements requires judgment, and may affect the valuation of
the assets and liabilities being measured and their placement within the
fair value hierarchy.
Income Taxes
Our effective tax rate is based on pre-tax income, statutory tax rates, tax
laws and regulations and tax planning strategies available to us in the
various jurisdictions in which we operate.
Deferred income taxes are provided for temporary differences in the
bases between financial statement and income tax assets and liabilities. Deferred income taxes are recalculated annually at tax rates then in
effect. We record valuation allowances to reduce our deferred tax assets
to the amount that is more likely than not to be realized.
We use a two-step approach for recognizing and measuring tax benefits
taken or expected to be taken in a tax return. The first step is recognition:
we determine whether it is more likely than not that a tax position will be
sustained upon examination, including resolution of any related appeals
or litigation processes, based on the technical merits of the position. In
evaluating whether a tax position has met the more-likely-than-not recognition threshold, we presume that the position will be examined by
the appropriate taxing authority that has full knowledge of all relevant
information. The second step is measurement: a tax position that meets
the more-likely-than-not recognition threshold is measured to determine
the amount of benefit to recognize in the financial statements. The tax
position is measured at the largest amount of benefit that is greater than
50 percent likely of being realized upon ultimate settlement. Differences
between tax positions taken in a tax return and amounts recognized in
the financial statements will generally result in one or more of the following: an increase in a liability for income taxes payable, a reduction of
an income tax refund receivable, a reduction in a deferred tax asset, or an
increase in a deferred tax liability.
The accounting standard relating to income taxes generated by leveraged lease transactions requires that changes in the projected timing of
income tax cash flows generated by a leveraged lease transaction be recognized as a gain or loss in the year in which the change occurs.
Significant management judgment is required in evaluating our tax positions and in determining our effective tax rate.
Stock-Based Compensation
We measure and recognize compensation expense for all stock-based
compensation awards made to employees and directors based on estimated fair values. See Note 10 for further details.
57
NOTES TO CONSOLIDATED FINANCIAL STATEMENTS continued
Foreign Currency Translation
The functional currency of our foreign operations is generally the local
currency. For these foreign entities, we translate income statement
amounts at average exchange rates for the period, and we translate assets
and liabilities at end-of-period exchange rates. We record these translation adjustments in Accumulated other comprehensive income (loss), a
separate component of Equity, in our consolidated balance sheets. We
report exchange gains and losses on intercompany foreign currency
transactions of a long-term nature in Accumulated other comprehensive
income (loss). Other exchange gains and losses are reported in income.
Employee Benefit Plans
Pension and postretirement health care and life insurance benefits
earned during the year as well as interest on projected benefit obligations are accrued currently. Prior service costs and credits resulting
from changes in plan benefits are generally amortized over the average
remaining service period of the employees expected to receive benefits.
Expected return on plan assets is determined by applying the return on
assets assumption to the actual fair value of plan assets. Actuarial gains
and losses are recognized in operating results in the year in which they
occur. These gains and losses are measured annually as of December
31 or upon a remeasurement event. Verizon management employees
no longer earn pension benefits or earn service towards the company
retiree medical subsidy (see Note 11).
We recognize a pension or a postretirement plan’s funded status as either
an asset or liability on the consolidated balance sheets. Also, we measure
any unrecognized prior service costs and credits that arise during the
period as a component of Accumulated other comprehensive income
(loss), net of applicable income tax.
Derivative Instruments
We have entered into derivative transactions primarily to manage our
exposure to fluctuations in foreign currency exchange rates, interest
rates, equity and commodity prices. We employ risk management strategies, which may include the use of a variety of derivatives including
cross currency swaps, foreign currency and prepaid forwards and collars,
interest rate and commodity swap agreements and interest rate locks. We
do not hold derivatives for trading purposes.
We measure all derivatives, including derivatives embedded in other
financial instruments, at fair value and recognize them as either assets or
liabilities on our consolidated balance sheets. Our derivative instruments
are valued primarily using models based on readily observable market
parameters for all substantial terms of our derivative contracts and thus
are classified as Level 2. Changes in the fair values of derivative instruments not qualifying as hedges or any ineffective portion of hedges are
recognized in earnings in the current period. Changes in the fair values
of derivative instruments used effectively as fair value hedges are recognized in earnings, along with changes in the fair value of the hedged
item. Changes in the fair value of the effective portions of cash flow
hedges are reported in Other comprehensive income and recognized in
earnings when the hedged item is recognized in earnings.
Recently Adopted Accounting Standards
During the first quarter of 2012, we adopted the accounting standard
update regarding the presentation of comprehensive income. This
update was issued to increase the prominence of items reported in other
comprehensive income. The update requires that all nonowner changes
in stockholders’ equity be presented either in a single continuous
statement of comprehensive income or in two separate, but consecutive statements. In connection with the adoption of this standard our
consolidated financial statements include a separate statement of comprehensive income.
58
During the first quarter of 2012, we adopted the accounting standard
update regarding fair value measurement. This update was issued to provide a consistent definition of fair value and ensure that the fair value
measurement and disclosure requirements are similar between U.S. GAAP
and International Financial Reporting Standards. This standard update
also changes certain fair value measurement principles and enhances the
disclosure requirements particularly for Level 3 fair value measurements.
The adoption of this standard update did not have a significant impact
on our consolidated financial statements.
During the first quarter of 2012, we adopted the accounting standard
update regarding testing of goodwill for impairment. This standard
update gives companies the option to perform a qualitative assessment
to first assess whether the fair value of a reporting unit is less than its carrying amount. If an entity determines it is not more likely than not that
the fair value of the reporting unit is less than its carrying amount, then
performing the two-step impairment test is unnecessary. The Company
did not elect to use the qualitative assessment in 2012.
Recent Accounting Standards
In July 2012, the accounting standard update regarding testing of intangible assets for impairment was issued. This standard update allows
companies the option to perform a qualitative assessment to determine
whether it is more likely than not that an indefinite-lived intangible asset
is impaired. An entity is not required to calculate the fair value of an indefinite-lived intangible asset and perform the quantitative impairment test
unless the entity determines that it is more likely than not the asset is
impaired. We will adopt this standard update during the first quarter of
2013. The adoption of this standard update is not expected to have a
significant impact on our consolidated financial statements.
In February 2013, the accounting standard update regarding reclassifications out of accumulated other comprehensive income was issued. This
standard update requires companies to report the effect of significant
reclassifications out of accumulated other comprehensive income on
the respective line items in our consolidated statements of income if the
amount being reclassified is required under U.S. GAAP to be reclassified
in its entirety to net income. For other amounts that are not required
under U.S. GAAP to be reclassified in their entirety to net income in the
same reporting period, an entity is required to cross-reference other disclosures required under U.S. GAAP that provide additional detail about
those amounts. We will adopt this standard in the first quarter of 2013.
The adoption of this standard update is not expected to have a significant impact on our consolidated financial statements.
NOTES TO CONSOLIDATED FINANCIAL STATEMENTS continued
NOTE 2
ACQUISITIONS AND DIVESTITURES
Verizon Wireless
Spectrum Licenses
During the third quarter of 2012, after receiving the required regulatory approvals, Verizon Wireless completed the following previously
announced transactions in which we acquired wireless spectrum that
will be used to deploy additional fourth-generation (4G) Long Term
Evolution (LTE) capacity:
• Verizon Wireless acquired Advanced Wireless Service (AWS) spectrum
in separate transactions with SpectrumCo, LLC (SpectrumCo) and Cox
TMI Wireless, LLC for which it paid an aggregate of $3.9 billion at the
time of the closings. Verizon Wireless has also recorded a liability of
$0.4 billion related to a three-year service obligation to SpectrumCo’s
members pursuant to commercial agreements executed concurrently
with the SpectrumCo transaction.
• Verizon Wireless completed license purchase and exchange transactions with Leap Wireless, Savary Island Wireless, which is majority
owned by Leap Wireless, and a subsidiary of T-Mobile USA, Inc.
(T-Mobile). As a result of these transactions, Verizon Wireless received
an aggregate $2.6 billion of AWS and PCS licenses at fair value and
net cash proceeds of $0.2 billion, transferred certain AWS licenses to
T-Mobile and a 700 megahertz (MHz) lower A block license to Leap
Wireless, and recorded an immaterial gain.
During 2011, Verizon Wireless entered into commercial agreements,
modified in 2012, with affiliates of Comcast Corporation, Time Warner
Cable, Bright House Networks and Cox Communications Inc. (the cable
companies). Through these agreements, the cable companies and
Verizon Wireless became agents to sell certain of one another’s products
and services and, over time, the cable companies will have the option,
subject to the terms and conditions of the agreements, of selling Verizon
Wireless service on a wholesale basis.
Alltel Divestiture Markets
As a condition of the regulatory approvals to complete the acquisition of Alltel Corporation (Alltel) in January 2009, Verizon Wireless was
required to divest overlapping properties in 105 operating markets in
24 states (Alltel Divestiture Markets). During the second quarter of 2010,
AT&T Mobility acquired 79 of the 105 Alltel Divestiture Markets, including
licenses and network assets, for approximately $2.4 billion in cash and
Atlantic Tele-Network, Inc. acquired the remaining 26 Alltel Divestiture
Markets, including licenses and network assets, for $0.2 billion in cash.
During the second quarter of 2010, we recorded a tax charge of approximately $0.2 billion for the taxable gain associated with these transactions.
Other
During 2012, we acquired various other wireless licenses and markets for
cash consideration that was not significant and recorded $0.2 billion of
goodwill as a result of these transactions.
During 2011, we acquired various other wireless licenses and markets for
cash consideration that was not significant.
During 2010, Verizon Wireless acquired the net assets and related
customers of six operating markets in Louisiana and Mississippi in a transaction with AT&T for cash consideration of $0.2 billion. The purchase price
allocation resulted in $0.1 billion of wireless licenses and $0.1 billion in
goodwill.
Merger Integration Charges
During 2010, we recorded pre-tax merger integration charges of $0.9
billion primarily related to the Alltel acquisition. These charges were
primarily due to the decommissioning of overlapping cell sites, preacquisition contingencies, handset conversions and trade name amortization.
During the fourth quarter of 2012, we entered into license exchange
agreements with T-Mobile and Cricket License Company, LLC, a subsidiary of Leap Wireless, to exchange certain AWS licenses. These non-cash
exchanges, which are subject to approval by the Federal Communications
Commission (FCC) and other customary closing conditions, are expected
to close in 2013. The exchange includes a number of intra-market swaps
that will result in more efficient use of the AWS band. As a result of these
transactions, we expect to record an immaterial gain.
On April 18, 2012, we announced plans to initiate an open sale process
for all of our 700 MHz lower A and B block spectrum licenses, subject to
the receipt of acceptable bids. We acquired these licenses as part of FCC
Auction 73 in 2008. On January 25, 2013, Verizon Wireless agreed to sell 39
lower 700 MHz B block spectrum licenses to AT&T Inc. (AT&T) in exchange
for a payment of $1.9 billion and the transfer by AT&T to Verizon Wireless
of AWS (10 MHz) licenses in certain markets in the western United States.
Verizon Wireless also agreed to sell certain lower 700 MHz B block spectrum licenses to an investment firm for a payment of $0.2 billion. These
transactions are subject to approval by the FCC and the Department of
Justice (DOJ). When finalized, the sales will result in the completion of the
open sale process. We expect to deploy the remaining licenses as necessary to meet our own spectrum needs.
59
NOTES TO CONSOLIDATED FINANCIAL STATEMENTS continued
Wireline
HUGHES Telematics, Inc.
On June 1, 2012, we agreed to acquire HUGHES Telematics, Inc. (HUGHES
Telematics) for approximately $12 per share in cash for a total acquisition
price of $0.6 billion and we completed the acquisition on July 26, 2012. As
a result of the transaction, HUGHES Telematics became a wholly-owned
subsidiary of Verizon. The consolidated financial statements include the
results of HUGHES Telematics’ operations from the date the acquisition
closed. Upon closing, we recorded approximately $0.6 billion of goodwill, $0.1 billion of other intangibles, and assumed the debt obligations
of HUGHES Telematics, which were approximately $0.1 billion as of the
date of acquisition, and which were repaid by Verizon. Had this acquisition
been completed on January 1, 2012 or 2011, the results of the acquired
operations of HUGHES Telematics would not have had a significant impact
on the consolidated net income attributable to Verizon. The acquisition
has accelerated our ability to bring more telematics offerings to market for
existing and new HUGHES Telematics and Verizon customers.
The acquisition of HUGHES Telematics was accounted for as a business
combination under the acquisition method. The cost of the acquisition
was allocated to the assets and liabilities acquired based on their fair
values as of the close of the acquisition, with the excess amount being
recorded as goodwill.
Terremark Worldwide, Inc.
During April 2011, we acquired Terremark Worldwide, Inc. (Terremark),
a global provider of information technology infrastructure and cloud
services, for $19 per share in cash. Closing and other direct acquisitionrelated costs totaled approximately $13 million after-tax. The acquisition
was completed via a “short-form” merger under Delaware law through
which Terremark became a wholly owned subsidiary of Verizon. The
acquisition enhanced Verizon’s offerings to business and government
customers globally.
The consolidated financial statements include the results of Terremark’s
operations from the date the acquisition closed. Had this acquisition
been consummated on January 1, 2011 or 2010, the results of Terremark’s
acquired operations would not have had a significant impact on the consolidated net income attributable to Verizon. The debt obligations of
Terremark that were outstanding at the time of its acquisition by Verizon
were repaid during May 2011.
The acquisition of Terremark was accounted for as a business combination under the acquisition method. The cost of the acquisition was
allocated to the assets and liabilities acquired based on their fair values as
of the close of the acquisition, with the excess amount being recorded as
goodwill. The fair values of the assets and liabilities acquired were determined using the income and cost approaches. The income approach
was primarily used to value the intangible assets, consisting primarily of
customer relationships. The cost approach was used, as appropriate, for
plant, property and equipment. The fair value of the majority of the longterm debt acquired was primarily valued based on redemption prices.
The final purchase price allocation presented below includes insignificant
adjustments from the initial purchase price to the values of certain assets
and liabilities acquired.
The following table summarizes the allocation of the acquisition cost to
the assets acquired, including cash acquired of $0.1 billion, and liabilities
acquired as of the acquisition date:
(dollars in millions)
Assets
Current assets
Plant, property and equipment
Goodwill
Intangible assets subject to amortization
Other assets
Total assets
Liabilities
Current liabilities
Debt maturing within one year
Deferred income taxes and other liabilities
Total liabilities
Net assets acquired
Final Purchase
Price Allocation
$
$
221
521
1,211
410
12
2,375
158
748
75
981
1,394
Intangible assets subject to amortization include customer lists which are
being amortized on a straight-line basis over 13 years, and other intangibles which are being amortized on a straight-line basis over a period
of 5 years.
Telephone Access Line Spin-off
On July 1, 2010, after receiving regulatory approval, we completed the
spin-off of the shares of a newly formed subsidiary of Verizon (Spinco)
to Verizon stockholders and the merger of Spinco with Frontier
Communications Corporation (Frontier). Spinco held defined assets
and liabilities that were used in Verizon’s local exchange businesses and
related activities in 14 states. The total value of the transaction to Verizon
and its stockholders was approximately $8.6 billion. The accompanying
consolidated financial statements for the year ended December 31, 2010
include these operations prior to the completion of the spin-off.
During 2010, we recorded pre-tax charges of $0.5 billion, primarily for
costs incurred related to network, non-network software and other activities to enable the divested markets in the transaction with Frontier to
operate on a stand-alone basis subsequent to the closing of the transaction; professional advisory and legal fees in connection with this
transaction; and fees related to the early extinguishment of debt from
the use of proceeds from the transaction.
Other
In February 2012, Verizon entered into a venture with Redbox Automated
Retail, LLC (Redbox), a subsidiary of Coinstar, Inc., to offer customers
nationwide access to media rentals through online and mobile content streaming as well as physical media rentals through Redbox kiosks.
Verizon holds a 65% majority ownership share in the venture and Redbox
holds a 35% ownership share. The venture is consolidated by Verizon
for reporting purposes. In December 2012, the venture introduced its
product portfolio, which includes subscription services, under the name
Redbox Instant by Verizon. The initial funding related to the formation of
the venture is not significant to Verizon.
During 2011, we acquired a provider of cloud software technology for
cash consideration that was not significant.
60
NOTES TO CONSOLIDATED FINANCIAL STATEMENTS continued
NOTE 3
WIRELESS LICENSES, GOODWILL AND OTHER INTANGIBLE ASSETS
Wireless Licenses
Changes in the carrying amount of Wireless licenses are as follows:
(dollars in millions)
Balance at January 1, 2011
Acquisitions (Note 2)
Capitalized interest on wireless licenses
Balance at December 31, 2011
Acquisitions (Note 2)
Capitalized interest on wireless licenses
Reclassifications, adjustments and other
Balance at December 31, 2012
$
72,996
58
196
73,250
4,544
205
(255)
77,744
$
$
Reclassifications, adjustments, and other includes the exchanges of wireless licenses in 2012. See Note 2 (“Acquisitions and Divestitures”) for additional
details.
At December 31, 2012 and 2011, approximately $7.3 billion and $2.2 billion, respectively, of wireless licenses were under development for commercial
service for which we were capitalizing interest costs.
The average remaining renewal period of our wireless license portfolio was 6.1 years as of December 31, 2012 (see Note 1, Goodwill and Other
Intangible Assets – Intangible Assets Not Subject to Amortization).
Goodwill
Changes in the carrying amount of Goodwill are as follows:
(dollars in millions)
Verizon
Wireless
Balance at January 1, 2011
Acquisitions (Note 2)
Balance at December 31, 2011
Acquisitions (Note 2)
Reclassifications, adjustments and other
Balance at December 31, 2012
$
$
$
17,869
94
17,963
209
–
18,172
Wireline
$
$
$
4,119
1,275
5,394
551
22
5,967
Other Intangible Assets
The following table displays the composition of Other intangible assets, net:
Gross
Amount
At December 31,
Customer lists (6 to 13 years)
Non-network internal-use software (3 to 7 years)
Other (2 to 25 years)
Total
$
$
3,556
10,415
802
14,773
$
The amortization expense for Other intangible assets was as follows:
Years
(dollars in millions)
2012
2011
2010
$ 1,540
1,505
1,812
(2,338)
(6,210)
(292)
(8,840)
$
21,988
1,369
23,357
760
22
24,139
$
$
(dollars in millions)
2012
Net
Amount
Accumulated
Amortization
$
Total
$
$
1,218
4,205
510
5,933
Gross
Amount
$
$
3,529
9,536
561
13,626
2011
Net
Amount
Accumulated
Amortization
$
$
(2,052)
(5,487)
(209)
(7,748)
$
1,477
4,049
352
5,878
$
Estimated annual amortization expense for Other intangible assets is as
follows:
Years
2013
2014
2015
2016
2017
(dollars in millions)
$
1,633
1,176
988
790
593
61
NOTES TO CONSOLIDATED FINANCIAL STATEMENTS continued
NOTE 4
Summarized Financial Information
Summarized financial information for our equity investees is as follows:
PLANT, PROPERT Y AND EQUIPMENT
The following table displays the details of Plant, property and equipment,
which is stated at cost:
(dollars in millions)
At December 31,
Land
Buildings and equipment
Central office and other network
equipment
Cable, poles and conduit
Leasehold improvements
Work in progress
Furniture, vehicles and other
Lives (years)
2012
–
15 – 45
$
3 – 15
11 – 50
5 – 20
–
3 – 20
113,262
53,761
5,404
4,126
9,254
209,575
120,933
$ 88,642
Less accumulated depreciation
Total
859
22,909
2011
$
862
21,969
107,322
67,190
5,030
3,417
9,836
215,626
127,192
88,434
$
NOTE 5
INVESTMENTS IN UNCONSOLIDATED BUSINESSES
(dollars in millions)
Equity Investees
Vodafone Omnitel
Other
Total equity investees
Cost Investees
Total investments in
unconsolidated businesses
Ownership
2012
$ 3,516
8,159
$ 11,675
$
Current liabilities
Noncurrent liabilities
Equity
Total liabilities and equity
$ 5,526
5
6,144
$ 11,675
$
Income Statement
Years Ended December 31,
Net revenue
Operating income
Net income
Various
3,720
8,469
$ 12,189
6,123
8
6,058
$ 12,189
(dollars in millions)
2012
2011
2010
$ 10,825
2,823
1,679
$ 12,668
4,021
2,451
$ 12,356
4,156
2,563
NONCONTROLLING INTEREST
Noncontrolling interests in equity of subsidiaries were as follows:
(dollars in millions)
At December 31,
23.1%
Various
2011
Current Assets
Noncurrent Assets
Total Assets
2011
$ 2,200
1,106
3,306
$
95
$ 3,401
2,083
1,320
3,403
Noncontrolling interests in consolidated subsidiaries:
Verizon Wireless
Wireless partnerships and other
2012
2011
$ 51,492
884
$ 52,376
$ 49,165
773
$ 49,938
45
$
3,448
Dividends and repatriations of foreign earnings received from these
investees amounted to $0.4 billion in 2012, $0.5 billion in 2011 and $0.5
billion in 2010. See Note 12 regarding undistributed earnings of our foreign subsidiaries.
Equity Method Investments
Vodafone Omnitel
Vodafone Omnitel N.V. (Vodafone Omnitel) is one of the largest wireless
communications companies in Italy. At December 31, 2012 and 2011,
our investment in Vodafone Omnitel included goodwill of $1.0 billion,
respectively.
Other Equity Investees
We have limited partnership investments in entities that invest in affordable housing projects, for which we provide funding as a limited partner
and receive tax deductions and tax credits based on our partnership
interests. At December 31, 2012 and 2011, we had equity investments in
these partnerships of $0.9 billion and $1.1 billion, respectively. We adjust
the carrying value of these investments for any losses incurred by the
limited partnerships through earnings.
The remaining investments include wireless partnerships in the U.S. and
other smaller domestic and international investments.
62
(dollars in millions)
2012
At December 31,
NOTE 6
Our investments in unconsolidated businesses are comprised of the
following:
At December 31,
Balance Sheet
Wireless Joint Venture
Our Verizon Wireless segment is primarily comprised of Cellco Partnership
doing business as Verizon Wireless (Verizon Wireless). Cellco Partnership
is a joint venture formed in April 2000 by the combination of the U.S.
wireless operations and interests of Verizon and Vodafone. Verizon owns
a controlling 55% interest in Verizon Wireless and Vodafone owns the
remaining 45%.
Special Distributions
In November 2012, the Board of Representatives of Verizon Wireless
declared a distribution to its owners, which was paid in the fourth quarter
of 2012 in proportion to their partnership interests on the payment date,
in the aggregate amount of $8.5 billion. As a result, Vodafone received a
cash payment of $3.8 billion and the remainder of the distribution was
received by Verizon.
In July 2011, the Board of Representatives of Verizon Wireless declared
a distribution to its owners, which was paid in the first quarter of 2012
in proportion to their partnership interests on the payment date, in
the aggregate amount of $10 billion. As a result, Vodafone received a
cash payment of $4.5 billion and the remainder of the distribution was
received by Verizon.
NOTES TO CONSOLIDATED FINANCIAL STATEMENTS continued
NOTE 7
LEASING ARRANGEMENTS
As Lessor
We are the lessor in leveraged and direct financing lease agreements for commercial aircraft and power generating facilities, which comprise the
majority of our leasing portfolio along with telecommunications equipment, commercial real estate property and other equipment. These leases
have remaining terms of up to 38 years as of December 31, 2012. In addition, we lease space on certain of our cell towers to other wireless carriers.
Minimum lease payments receivable represent unpaid rentals, less principal and interest on third-party nonrecourse debt relating to leveraged lease
transactions. Since we have no general liability for this debt, which is secured by a senior security interest in the leased equipment and rentals, the
related principal and interest have been offset against the minimum lease payments receivable in accordance with GAAP. All recourse debt is reflected
in our consolidated balance sheets.
At each reporting period, we monitor the credit quality of the various lessees in our portfolios. Regarding the leveraged lease portfolio, external credit
reports are used where available and where not available we use internally developed indicators. These indicators or internal credit risk grades factor
historic loss experience, the value of the underlying collateral, delinquency trends, and industry and general economic conditions. The credit quality
of our lessees primarily varies from AAA to CCC+. For each reporting period the leveraged leases within the portfolio are reviewed for indicators of
impairment where it is probable the rent due according to the contractual terms of the lease will not be collected. All significant accounts, individually
or in the aggregate, are current and none are classified as impaired.
Finance lease receivables, which are included in Prepaid expenses and other and Other assets in our consolidated balance sheets, are comprised of
the following:
(dollars in millions)
2012
At December 31,
Leveraged
Leases
Direct Finance
Leases
$ 1,253
923
(654)
$ 1,522
Minimum lease payments receivable
Estimated residual value
Unearned income
Total
Allowance for doubtful accounts
Finance lease receivables, net
Prepaid expenses and other
Other assets
$
$
Accumulated deferred taxes arising from leveraged leases, which are
included in Deferred income taxes, amounted to $1.2 billion at December
31, 2012 and $1.6 billion at December 31, 2011.
The following table is a summary of the components of income from
leveraged leases:
(dollars in millions)
2012
Years Ended December 31,
Pretax income
Income tax expense
$
30
12
2011
$
61
24
2010
$
74
32
The future minimum lease payments to be received from noncancelable
capital leases (direct financing and leveraged leases), net of nonrecourse
loan payments related to leveraged leases and allowances for doubtful
accounts, along with expected receipts relating to operating leases for
the periods shown at December 31, 2012, are as follows:
58
6
(10)
54
Total
$ 1,311
929
(664)
$ 1,576
(99)
$ 1,477
$
22
1,455
$ 1,477
2011
Leveraged
Leases
$
$
1,610
1,202
(874)
1,938
Direct Finance
Leases
$
$
119
9
(19)
109
Years
2013
2014
2015
2016
2017
Thereafter
Total
$
$
123
45
52
122
38
931
1,311
Operating
Leases
$
$
184
162
139
114
89
90
778
$
$
$
$
$
1,729
1,211
(893)
2,047
(137)
1,910
46
1,864
1,910
As Lessee
We lease certain facilities and equipment for use in our operations under
both capital and operating leases. Total rent expense under operating
leases amounted to $2.5 billion in 2012, 2011 and 2010, respectively.
Amortization of capital leases is included in Depreciation and amortization expense in the consolidated statements of income. Capital lease
amounts included in Plant, property and equipment are as follows:
(dollars in millions)
2012
At December 31,
Capital leases
Less accumulated amortization
Total
$
$
358
158
200
2011
$
$
362
132
230
The aggregate minimum rental commitments under noncancelable
leases for the periods shown at December 31, 2012, are as follows:
(dollars in millions)
(dollars in millions)
Capital
Leases
Total
Capital
Leases
Years
2013
2014
2015
2016
2017
Thereafter
Total minimum rental commitments
Less interest and executory costs
Present value of minimum lease payments
Less current installments
Long-term obligation at December 31, 2012
$
$
86
67
57
54
44
99
407
109
298
64
234
Operating
Leases
$
2,038
1,840
1,572
1,280
992
4,119
$ 11,841
63
NOTES TO CONSOLIDATED FINANCIAL STATEMENTS continued
NOTE 8
DEBT
Changes to debt during 2012 are as follows:
(dollars in millions)
Debt Maturing
within One Year
$
Balance at January 1, 2012
Proceeds from long-term borrowings
Repayments of long-term borrowings and capital leases obligations
Decrease in short-term obligations, excluding current maturities
Reclassifications of long-term debt
Debt acquired (Note 2)
Other
Balance at December 31, 2012
$
Long-term
Debt
4,849
–
(6,403)
(1,437)
7,062
122
176
4,369
$
$
Total
50,303
4,489
–
–
(7,062)
–
(112)
47,618
$
$
Debt maturing within one year is as follows:
55,152
4,489
(6,403)
(1,437)
–
122
64
51,987
(dollars in millions)
2012
At December 31,
$
Long-term debt maturing within one year
Commercial paper
Total debt maturing within one year
$
2011
3,869
500
4,369
$
2,915
1,934
4,849
$
The weighted-average interest rate for our commercial paper outstanding was 0.4% at December 31, 2012 and 2011, respectively.
Credit Facility
On August 13, 2012, we amended our credit facility to reduce fees and borrowing costs and extend the maturity date to August 12, 2016. As of
December 31, 2012, the unused borrowing capacity under this $6.2 billion four-year credit facility with a group of major financial institutions was
approximately $6.1 billion.
Long-Term Debt
Outstanding long-term debt obligations are as follows:
(dollars in millions)
Interest Rates %
Maturities
Verizon Communications – notes payable and other
0.70 – 3.85
4.35 – 5.50
5.55 – 6.90
7.35 – 8.95
Floating
2013 – 2042
2013 – 2041
2016 – 2041
2018 – 2039
2014
Verizon Wireless – notes payable and other
5.55 – 8.88
2013 – 2018
8,635
9,331
Verizon Wireless – Alltel assumed notes
6.50 – 7.88
2013 – 2032
1,500
2,315
Telephone subsidiaries – debentures
4.75 – 7.00
7.15 – 7.88
8.00 – 8.75
2013 – 2033
2022 – 2032
2019 – 2031
2,045
1,349
880
4,045
1,449
880
Other subsidiaries – debentures and other
6.84 – 8.75
2018 – 2028
1,700
1,700
298
(228)
51,487
3,869
47,618
352
(271)
53,218
2,915
50,303
At December 31,
Capital lease obligations (average rate of 6.3% in 2012 and 2011, respectively)
Unamortized discount, net of premium
Total long-term debt, including current maturities
Less long-term debt maturing within one year
Total long-term debt
64
2012
$
$
11,198
7,062
11,031
5,017
1,000
2011
$
$
6,900
7,832
11,043
6,642
1,000
NOTES TO CONSOLIDATED FINANCIAL STATEMENTS continued
2012
On November 2, 2012, we announced the commencement of a tender
offer (the Tender Offer) to purchase for cash any and all of the outstanding $1.25 billion aggregate principal amount of 8.95% Verizon
Communications Notes due 2039. In the Tender Offer that was completed November 9, 2012, $0.9 billion aggregate principal amount of the
notes was purchased at a price of 186.5% of the principal amount of the
notes (see “Early Debt Redemption and Other Costs” below) and $0.35
billion principal amount of the notes remains outstanding. Any accrued
and unpaid interest on the principal purchased was paid to the date of
purchase.
During November 2012, we issued $4.5 billion aggregate principal
amount of fixed rate notes resulting in cash proceeds of approximately
$4.47 billion, net of discounts and issuance costs. The issuances consisted
of the following: $1.0 billion of 0.70% Notes due 2015, $0.5 billion of 1.10%
Notes due 2017, $1.75 billion of 2.45% Notes due 2022 and $1.25 billion of 3.85% Notes due 2042. During December 2012, the net proceeds
were used to redeem: $0.7 billion of the $2.0 billion of 8.75% Notes due
November 2018 at a redemption price of 140.2% of the principal amount
of the notes (see “Early Debt Redemption and Other Costs” below), $0.75
billion of 4.35% Notes due February 2013 at a redemption price of 100.7%
of the principal amount of the notes and certain telephone subsidiary
debt (see “Telephone and Other Subsidiary Debt” below), as well as for
the Tender Offer and other general corporate purposes. Any accrued and
unpaid interest was paid to the date of redemption.
In addition, during 2012 we utilized $0.2 billion under fixed rate vendor
financing facilities.
2011
During March 2011, we issued $6.25 billion aggregate principal amount of
fixed and floating rate notes resulting in cash proceeds of approximately
$6.19 billion, net of discounts and issuance costs. The issuances consisted
of the following: $1.0 billion of Notes due 2014 that bear interest at a
rate equal to three-month London Interbank Offered Rate (LIBOR) plus
0.61%, $1.5 billion of 1.95% Notes due 2014, $1.25 billion of 3.00% Notes
due 2016, $1.5 billion of 4.60% Notes due 2021 and $1.0 billion of 6.00%
Notes due 2041. The net proceeds were used for the repayment of commercial paper and other general corporate purposes, as well as for the
redemption of certain telephone subsidiary debt during April 2011 (see
“Telephone and Other Subsidiary Debt” below).
During November 2011, we issued $4.6 billion aggregate principal
amount of fixed rate notes resulting in cash proceeds of approximately
$4.55 billion, net of discounts and issuance costs. The issuances consisted
of the following: $0.8 billion of 1.25% Notes due 2014, $1.3 billion of 2.00%
Notes due 2016, $1.9 billion of 3.50% Notes due 2021 and $0.8 billion of
4.75% Notes due 2041. During November 2011, the net proceeds were
used to redeem $1.0 billion of 7.375% Verizon Communications Notes
due September 2012 at a redemption price of 105.2% of principal amount
of the notes, $0.6 billion of 6.875% Verizon Communications Notes due
June 2012 at a redemption price of 103.5% of principal amount of the
notes and certain telephone subsidiary debt (see “Telephone and Other
Subsidiary Debt” below), as well as for the repayment of commercial paper
and other general corporate purposes. Any accrued and unpaid interest
was paid to the date of redemption. In addition, we settled the interest
rate swap with a notional value totaling $1.0 billion related to the $1.0
billion of 7.375% Verizon Communications Notes due September 2012.
During 2011, $0.5 billion of 5.35% Verizon Communications Notes
matured and were repaid and we utilized $0.3 billion under fixed rate
vendor financing facilities.
The debt obligations of Terremark that were outstanding at the time of
its acquisition by Verizon were repaid during the second quarter of 2011.
Verizon Wireless – Notes Payable and Other
Verizon Wireless Capital LLC, a wholly owned subsidiary of Verizon
Wireless, is a limited liability company formed under the laws of Delaware
on December 7, 2001 as a special purpose finance subsidiary to facilitate
the offering of debt securities of Verizon Wireless by acting as co-issuer.
Other than the financing activities as a co-issuer of Verizon Wireless
indebtedness, Verizon Wireless Capital LLC has no material assets, operations or revenues. Verizon Wireless is jointly and severally liable with
Verizon Wireless Capital LLC for co-issued notes.
2012
During February 2012, $0.8 billion of 5.25% Verizon Wireless Notes
matured and were repaid. During July 2012, $0.8 billion of 7.0% Verizon
Wireless Notes matured and were repaid.
2011
During May 2011, $4.0 billion aggregate principal amount of Verizon
Wireless two-year fixed and floating rate notes matured and were repaid.
During December 2011, we repaid $0.9 billion upon maturity for the €0.7
billion of 7.625% Verizon Wireless Notes and the related cross currency
swap was settled.
65
NOTES TO CONSOLIDATED FINANCIAL STATEMENTS continued
Telephone and Other Subsidiary Debt
2012
During January 2012, $1.0 billion of 5.875% Verizon New Jersey Inc.
Debentures matured and were repaid. During December 2012, we
redeemed the $1.0 billion of 4.625% Verizon Virginia LLC Debentures,
Series A, due March 2013 at a redemption price of 101.1% of the principal
amount of the debentures. Any accrued and unpaid interest was paid to
the date of redemption.
In addition, during 2012, various Telephone and Other Subsidiary
Debentures totaling approximately $0.2 billion were repaid and any
accrued and unpaid interest was paid to the date of payment.
2011
During April 2011, we redeemed the $1.0 billion of 5.65% Verizon
Pennsylvania Inc. Debentures due November 15, 2011 at a redemption
price of 102.9% of the principal amount of the debentures; and the $1.0
billion of 6.50% Verizon New England Inc. Debentures due September
15, 2011 at a redemption price of 102.3% of the principal amount of the
debentures. Any accrued and unpaid interest was paid through the date
of redemption.
During November 2011, we redeemed the following debentures: $0.4
billion of 6.125% Verizon Florida Inc. Debentures due January 2013 at a
redemption price of 106.3% of the principal amount of the debentures;
$0.5 billion of 6.125% Verizon Maryland Inc. Debentures due March 2012
at a redemption price of 101.5% of the principal amount of the debentures; and $1.0 billion of 6.875% Verizon New York Inc. Debentures due
April 2012 at a redemption price of 102.2% of the principal amount of
the debentures. Any accrued and unpaid interest was paid through the
date of redemption.
Early Debt Redemption and Other Costs
During November 2012, we recorded debt redemption costs of $0.8 billion in connection with the purchase of $0.9 billion of the $1.25 billion of
8.95% Verizon Communications Notes due 2039 in a cash tender offer.
During December 2012, we recorded debt redemption costs of $0.3 billion in connection with the early redemption of $0.7 billion of the $2.0
billion of 8.75% Verizon Communications Notes due 2018, $1.0 billion of
4.625% Verizon Virginia LLC Debentures, Series A, due March 2013 and
$0.75 billion of 4.35% Verizon Communications Notes due February 2013,
as well as $0.3 billion of other costs.
During November 2011, we recorded debt redemption costs of $0.1 billion in connection with the early redemption of $1.0 billion of 7.375%
Verizon Communications Notes due September 2012, $0.6 billion of
6.875% Verizon Communications Notes due June 2012, $0.4 billion of
6.125% Verizon Florida Inc. Debentures due January 2013, $0.5 billion of
6.125% Verizon Maryland Inc. Debentures due March 2012 and $1.0 billion of 6.875% Verizon New York Inc. Debentures due April 2012.
66
Guarantees
We guarantee the debentures and first mortgage bonds of our operating telephone company subsidiaries. As of December 31, 2012, $4.3
billion principal amount of these obligations remain outstanding. Each
guarantee will remain in place for the life of the obligation unless terminated pursuant to its terms, including the operating telephone company
no longer being a wholly-owned subsidiary of Verizon.
We also guarantee the debt obligations of GTE Corporation that were
issued and outstanding prior to July 1, 2003. As of December 31, 2012,
$1.7 billion principal amount of these obligations remain outstanding.
Debt Covenants
We and our consolidated subsidiaries are in compliance with all debt
covenants.
Maturities of Long-Term Debt
Maturities of long-term debt outstanding at December 31, 2012 are as
follows:
Years
2013
2014
2015
2016
2017
Thereafter
(dollars in millions)
$
3,869
6,809
2,188
4,146
1,342
33,133
NOTES TO CONSOLIDATED FINANCIAL STATEMENTS continued
NOTE 9
FAIR VALUE MEASUREMENTS AND FINANCIAL INSTRUMENTS
The following table presents the balances of assets measured at fair value
on a recurring basis as of December 31, 2012:
(dollars in millions)
Level 1(1)
Assets:
Short-term investments:
Equity securities
Fixed income securities
Other current assets:
Interest rate swaps
Other assets:
Fixed income securities
Cross currency swaps
Total
$
$
310
–
Level 2(2)
$
–
160
Level 3(3)
$
–
–
Total
$
310
160
–
7
–
7
–
–
310
943
153
$ 1,263
–
–
–
943
153
$ 1,573
$
(1) quoted prices in active markets for identical assets or liabilities
(2) observable inputs other than quoted prices in active markets for identical assets and
liabilities
(3) no observable pricing inputs in the market
Equity securities consist of investments in common stock of domestic
and international corporations measured using quoted prices in active
markets.
Fixed income securities consist primarily of investments in municipal
bonds that do not have quoted prices in active markets. For these securities, we use alternative matrix pricing resulting in these debt securities
being classified as Level 2.
Derivative contracts are valued using models based on readily observable
market parameters for all substantial terms of our derivative contracts
and thus are classified within Level 2. We use mid-market pricing for fair
value measurements of our derivative instruments.
We recognize transfers between levels of the fair value hierarchy as of the
end of the reporting period. There were no transfers within the fair value
hierarchy during 2012.
Fair Value of Short-term and Long-term Debt
The fair value of our debt is determined using various methods, including
quoted prices for identical terms and maturities, which is a Level 1 measurement, as well as quoted prices for similar terms and maturities in
inactive markets and future cash flows discounted at current rates, which
are Level 2 measurements. The fair value of our short-term and long-term
debt, excluding capital leases, was as follows:
(dollars in millions)
2012
At December 31,
Short- and long-term debt,
excluding capital leases
Carrying
Amount
$ 51,689
2011
Fair Value
Carrying
Amount
Fair Value
$ 61,552
$ 54,800
$ 64,485
Derivative Instruments
Interest Rate Swaps
We have entered into domestic interest rate swaps to achieve a targeted
mix of fixed and variable rate debt. We principally receive fixed rates and
pay variable rates based on the London Interbank Offered Rate, resulting
in a net increase or decrease to Interest expense. These swaps are desig-
nated as fair value hedges and hedge against changes in the fair value
of our debt portfolio. We record the interest rate swaps at fair value on
our consolidated balance sheets as assets and liabilities. At December
31, 2012 the fair value of these interest rate swaps was not material, and
at December 31, 2011, the fair value was $0.6 billion, primarily included
in Other assets and Long-term debt. As of December 31, 2012, the total
notional amount of these interest rate swaps was $1.3 billion. During
2012, interest rate swaps with a notional value of $5.8 billion were settled.
As a result of the settlements, we received net proceeds of $0.7 billion,
including accrued interest which is included in Other, net operating
activities in the consolidated statement of cash flows. The fair value basis
adjustment to the underlying debt instruments will be recognized into
earnings as a reduction of Interest expense over the remaining lives of
the underlying debt obligations.
Forward Interest Rate Swaps
In order to manage our exposure to future interest rate changes, during
the second quarter of 2012, we entered into forward interest rate swaps
with a notional value of $1.0 billion. We designated these contracts as
cash flow hedges. In November 2012, we settled these forward interest
rate swaps and the pretax loss was not material.
Cross Currency Swaps
Verizon Wireless previously entered into cross currency swaps designated
as cash flow hedges to exchange approximately $1.6 billion of British
Pound Sterling and Euro-denominated debt into U.S. dollars and to fix
our future interest and principal payments in U.S. dollars, as well as to
mitigate the impact of foreign currency transaction gains or losses. A portion of the gains and losses recognized in Other comprehensive income
was reclassified to Other income and (expense), net to offset the related
pretax foreign currency transaction gain or loss on the underlying debt
obligations. The fair value of the outstanding swaps was not material at
December 31, 2012 or December 31, 2011. During 2012 and 2011 the
gains and losses with respect to these swaps were not material.
Prepaid Forward Agreement
During the first quarter of 2009, we entered into a privately negotiated
prepaid forward agreement for 14 million shares of Verizon common
stock at a cost of approximately $0.4 billion. We terminated the prepaid
forward agreement with respect to 5 million of the shares during the
fourth quarter of 2009 and 9 million of the shares during the first quarter
of 2010, which resulted in the delivery of those shares to Verizon.
Concentrations of Credit Risk
Financial instruments that subject us to concentrations of credit risk consist primarily of temporary cash investments, short-term and long-term
investments, trade receivables, certain notes receivable, including lease
receivables, and derivative contracts. Our policy is to deposit our temporary cash investments with major financial institutions. Counterparties
to our derivative contracts are also major financial institutions. The financial institutions have all been accorded high ratings by primary rating
agencies. We limit the dollar amount of contracts entered into with any
one financial institution and monitor our counterparties’ credit ratings.
We generally do not give or receive collateral on swap agreements due
to our credit rating and those of our counterparties. While we may be
exposed to credit losses due to the nonperformance of our counterparties, we consider the risk remote and do not expect the settlement of
these transactions to have a material effect on our results of operations
or financial condition.
67
NOTES TO CONSOLIDATED FINANCIAL STATEMENTS continued
NOTE 10
STOCK-BASED COMPENSATION
Verizon Communications Long-Term Incentive Plan
The Verizon Communications Inc. Long-Term Incentive Plan (the
Plan) permits the granting of stock options, stock appreciation rights,
restricted stock, restricted stock units, performance shares, performance
stock units and other awards. The maximum number of shares available
for awards from the Plan is 119.6 million shares.
Restricted Stock Units
The Plan provides for grants of Restricted Stock Units (RSUs) that generally vest at the end of the third year after the grant. The RSUs granted
prior to January 1, 2010 are classified as liability awards because the
RSUs will be paid in cash upon vesting. The RSUs granted subsequent
to January 1, 2010 are classified as equity awards because the RSUs will
be paid in Verizon common stock upon vesting. The RSU equity awards
are measured using the grant date fair value of Verizon common stock
and are not remeasured at the end of each reporting period. Dividend
equivalent units are also paid to participants at the time the RSU award
is paid, and in the same proportion as the RSU award.
Performance Stock Units
The Plan also provides for grants of Performance Stock Units (PSUs) that
generally vest at the end of the third year after the grant. As defined
by the Plan, the Human Resources Committee of the Board of Directors
determines the number of PSUs a participant earns based on the extent
to which the corresponding performance goals have been achieved
over the three-year performance cycle. The PSUs are classified as liability
awards because the PSU awards are paid in cash upon vesting. The PSU
award liability is measured at its fair value at the end of each reporting
period and, therefore, will fluctuate based on the price of Verizon
common stock as well as performance relative to the targets. Dividend
equivalent units are also paid to participants at the time that the PSU
award is determined and paid, and in the same proportion as the PSU
award. The granted and cancelled activity for the PSU award includes
adjustments for the performance goals achieved.
The following table summarizes Verizon’s Restricted Stock Unit and
Performance Stock Unit activity:
(shares in thousands)
Outstanding January 1, 2010
Granted
Payments
Cancelled/Forfeited
Outstanding December 31, 2010
Granted
Payments
Cancelled/Forfeited
Outstanding December 31, 2011
Granted
Payments
Cancelled/Forfeited
Outstanding December 31, 2012
68
Restricted
Stock Units
19,443
8,422
(6,788)
(154)
20,923
6,667
(7,600)
(154)
19,836
6,350
(7,369)
(148)
18,669
Performance
Stock Units
29,895
17,311
(14,364)
(462)
32,380
10,348
(12,137)
(2,977)
27,614
20,537
(8,499)
(189)
39,463
As of December 31, 2012, unrecognized compensation expense related
to the unvested portion of Verizon’s RSUs and PSUs was approximately
$0.4 billion and is expected to be recognized over approximately
two years.
The RSUs granted in 2012 and 2011, and classified as equity awards,
have weighted-average grant date fair values of $38.67 and $36.38 per
unit, respectively. During 2012, 2011 and 2010, we paid $0.6 billion, $0.7
billion and $0.7 billion, respectively, to settle RSUs and PSUs classified as
liability awards.
Verizon Wireless’ Long-Term Incentive Plan
The Verizon Wireless Long-Term Incentive Plan (the Wireless Plan) provides compensation opportunities to eligible employees of Verizon
Wireless (the Partnership). Under the Wireless Plan, Value Appreciation
Rights (VARs) were granted to eligible employees. As of December
31, 2012, all VARs were fully vested. We have not granted new VARs
since 2004.
VARs reflect the change in the value of the Partnership, as defined in
the Wireless Plan. Similar to stock options, the valuation is determined
using a Black-Scholes model. Once VARs become vested, employees can
exercise their VARs and receive a payment that is equal to the difference
between the VAR price on the date of grant and the VAR price on the
date of exercise, less applicable taxes. All outstanding VARs are fully exercisable and have a maximum term of 10 years. All VARs were granted at
a price equal to the estimated fair value of the Partnership, as defined in
the Wireless Plan, at the date of the grant.
The following table summarizes the assumptions used in the BlackScholes model during 2012:
End of Period
Risk-free rate
Expected term (in years)
Expected volatility
0.19%
0.62
43.27%
NOTES TO CONSOLIDATED FINANCIAL STATEMENTS continued
The risk-free rate is based on the U.S. Treasury yield curve in effect at
the time of the measurement date. Expected volatility was based on
a blend of the historical and implied volatility of publicly traded peer
companies for a period equal to the VARs expected life ending on the
measurement date.
The following table summarizes the Value Appreciation Rights activity:
(shares in thousands)
Outstanding rights, January 1, 2010
Exercised
Cancelled/Forfeited
Outstanding rights, December 31, 2010
Exercised
Cancelled/Forfeited
Outstanding rights, December 31, 2011
Exercised
Cancelled/Forfeited
Outstanding rights, December 31, 2012
VARs
WeightedAverage
Grant-Date
Fair Value
16,591
(4,947)
(75)
11,569
(3,303)
(52)
8,214
(3,427)
(21)
4,766
$
16.54
24.47
22.72
13.11
14.87
14.74
12.39
10.30
11.10
13.89
The following table summarizes information about Verizon’s stock
options outstanding as of December 31, 2012:
Range of
Exercise Prices
$
30.00-39.99
40.00-49.99
Total
WeightedAverage
Stock Options Remaining Life
(in thousands)
(years)
3,273
45
3,318
0.8
0.3
0.8
WeightedAverage
Exercise Price
$
34.58
42.99
34.69
The total intrinsic value for stock options outstanding as of December
31, 2012 is not significant. The total intrinsic value of stock options exercised was $0.1 billion in 2012 and the associated tax benefits were not
significant in 2012, 2011 and 2010. The amount of cash received from
the exercise of stock options was $0.3 billion in 2012, $0.2 billion in 2011
and not significant in 2010. There was no stock option expense for 2012,
2011 and 2010.
During 2012, 2011 and 2010, we paid $0.1 billion, respectively, to settle
VARs classified as liability awards.
Stock-Based Compensation Expense
After-tax compensation expense for stock-based compensation related
to RSUs, PSUs, and VARs described above included in Net income attributable to Verizon was $0.7 billion, $0.5 billion and $0.5 billion for 2012,
2011 and 2010, respectively.
Stock Options
The Plan provides for grants of stock options to participants at an option
price per share of no less than 100% of the fair market value of Verizon
common stock on the date of grant. Each grant has a 10-year life, vesting
equally over a three-year period, starting at the date of the grant. We
have not granted new stock options since 2004.
The following table summarizes Verizon’s stock option activity:
(shares in thousands)
Stock
Options
Outstanding, January 1, 2010
Exercised
Cancelled/Forfeited
Outstanding, December 31, 2010
Exercised
Cancelled/Forfeited
Outstanding, December 31, 2011
Exercised
Cancelled/Forfeited
Outstanding, December 31, 2012
107,765
(372)
(50,549)
56,844
(7,104)
(21,921)
27,819
(7,447)
(17,054)
3,318
WeightedAverage
Exercise
Price
$
44.52
34.51
44.90
44.25
35.00
51.06
41.24
35.20
45.15
34.69
All stock options outstanding at December 31, 2012, 2011 and 2010
were exercisable.
69
NOTES TO CONSOLIDATED FINANCIAL STATEMENTS continued
NOTE 11
EMPLOYEE BENEFITS
We maintain non-contributory defined benefit pension plans for many
of our employees. In addition, we maintain postretirement health care
and life insurance plans for our retirees and their dependents, which
are both contributory and non-contributory, and include a limit on our
share of the cost for certain recent and future retirees. In accordance
with our accounting policy for pension and other postretirement benefits, operating expenses include pension and benefit related charges
based on actuarial assumptions, including projected discount rates and
an estimated return on plan assets. These estimates are updated in the
fourth quarter to reflect actual return on plan assets and updated actuarial assumptions. The adjustment is recognized in the income statement
during the fourth quarter or upon a remeasurement event pursuant to
our accounting policy for the recognition of actuarial gains/losses.
Pension and Other Postretirement Benefits
Pension and other postretirement benefits for many of our employees
are subject to collective bargaining agreements. Modifications in benefits
have been bargained from time to time, and we may also periodically
amend the benefits in the management plans. The following tables
summarize benefit costs, as well as the benefit obligations, plan assets,
funded status and rate assumptions associated with pension and postretirement health care and life insurance benefit plans.
Obligations and Funded Status
At December 31,
2012
(dollars in millions)
Pension
2011
Health Care and Life
2012
2011
Change in Benefit
Obligations
Beginning of year
Service cost
Interest cost
Plan amendments
Actuarial loss, net
Benefits paid
Annuity purchase
Settlements paid
End of Year
$ 30,582
358
1,449
183
6,074
(2,735)
(8,352)
(786)
$ 26,773
$ 29,217
307
1,590
(485)
3,360
(2,564)
–
(843)
$ 30,582
$ 27,369
359
1,284
(1,826)
1,402
(1,744)
–
–
$ 26,844
$ 25,718
299
1,421
–
1,687
(1,756)
–
–
$ 27,369
Change in Plan Assets
Beginning of year
Actual return on plan assets
Company contributions
Benefits paid
Settlements paid
Annuity purchase
End of year
$ 24,110
2,326
3,719
(2,735)
(786)
(8,352)
$ 18,282
$ 25,814
1,191
512
(2,564)
(843)
–
$ 24,110
$ 2,628
312
1,461
(1,744)
–
–
$ 2,657
$
Funded Status
End of year
$ (8,491)
$ (6,472)
$ (24,187)
$ (24,741)
70
2,945
63
1,376
(1,756)
–
–
$ 2,628
(dollars in millions)
2012
At December 31,
Amounts recognized on the
balance sheet
Noncurrent assets
$
236
Current liabilities
(129)
Noncurrent liabilities
(8,598)
Total
$ (8,491)
Amounts recognized in
Accumulated Other
Comprehensive Income
(Pretax)
Prior Service Cost
Total
$
$
181
181
Pension
2011
Health Care and Life
2012
2011
289
(195)
(6,566)
$ (6,472)
$
–
(766)
(23,421)
$ (24,187)
$
$
$
$ (2,247)
$ (2,247)
$
$
$
(3)
(3)
–
(735)
(24,006)
$ (24,741)
(510)
(510)
See Note 12 (“Taxes”) for details regarding the impact of the Patient
Protection and Affordable Care Act and the Health Care and Education
Reconciliation Act of 2010, both of which became law in March 2010.
Beginning in 2013, as a result of federal health care reform, Verizon will
no longer file for the Retiree Drug Subsidy (RDS) and will instead contract
with a Medicare Part D plan on a group basis to provide prescription drug
benefits to Medicare eligible retirees. This change to our Medicare Part D
strategy resulted in the adoption of plan amendments during the fourth
quarter of 2010 which will allow the company to be eligible for greater
Medicare Part D plan subsidies over time.
During 2012, we reached agreements with the Communications Workers
of America and the International Brotherhood of Electrical Workers on
new, three-year contracts that cover approximately 43,000 Wireline
employees. This resulted in the adoption of plan amendments which will
result in lower other postretirement benefit costs in 2013 and beyond.
The accumulated benefit obligation for all defined benefit pension plans
was $26.5 billion and $30.3 billion at December 31, 2012 and 2011,
respectively.
Information for pension plans with an accumulated benefit obligation in
excess of plan assets follows:
(dollars in millions)
At December 31,
Projected benefit obligation
Accumulated benefit obligation
Fair value of plan assets
2012
2011
$ 26,351
26,081
17,623
$ 29,643
29,436
22,916
NOTES TO CONSOLIDATED FINANCIAL STATEMENTS continued
Net Periodic Cost
The following table summarizes the benefit (income) cost related to our
pension and postretirement health care and life insurance plans:
(dollars in millions)
2012
Years Ended December 31,
Service cost
Amortization of prior service cost (credit)
Subtotal
Expected return on plan assets
Interest cost
Subtotal
Remeasurement (gain) loss, net
Net periodic benefit (income) cost
Curtailment and termination benefits
Total
2011
$
358
(1)
357
(1,795)
1,449
11
5,542
5,553
–
$ 5,553
$
307
72
379
(1,976)
1,590
(7)
4,146
4,139
–
$ 4,139
Pension
2010
Health Care and Life
2011
2010
2012
$
359
(89)
270
(171)
1,284
1,383
1,262
2,645
–
$ 2,645
$
353
109
462
(2,176)
1,797
83
(166)
(83)
860
$
777
$
$
299
(57)
242
(163)
1,421
1,500
1,787
3,287
–
3,287
Other pre-tax changes in plan assets and benefit obligations recognized
in other comprehensive (income) loss are as follows:
$
$
305
375
680
(252)
1,639
2,067
758
2,825
386
3,211
(dollars in millions)
Pension
2011
2012
At December 31,
Prior service cost
Reversal of amortization items
Prior service cost
Total recognized in other comprehensive (income) loss (pretax)
Health Care and Life
2012
2011
$
183
$
(485)
$ (1,826)
$
–
$
1
184
$
(72)
(557)
89
$ (1,737)
$
57
57
The estimated prior service cost for the defined benefit pension plan that
will be amortized from Accumulated other comprehensive income (loss)
into net periodic benefit cost over the next fiscal year is not significant.
The estimated prior service cost for the defined benefit postretirement
plans that will be amortized from Accumulated other comprehensive
income (loss) into net periodic benefit (income) cost over the next fiscal
year is $(0.2 billion).
Assumptions
The weighted-average assumptions used in determining benefit obligations follow:
At December 31,
2012
Discount Rate
Rate of compensation increases
4.20%
3.00
The weighted-average assumptions used in determining net periodic
cost follow:
At December 31,
2012
Discount Rate
Expected return on plan assets
Rate of compensation increases
5.00%
7.50
3.00
2011
5.75%
8.00
3.00
Pension
2010
6.25%
8.50
4.00
Pension
2011
5.00%
3.00
2012
5.00%
7.00
N/A
2012
Health Care and Life
2011
4.20%
N/A
2011
5.00%
N/A
Health Care and Life
2010
5.75%
6.00
N/A
6.25%
8.25
N/A
In order to project the long-term target investment return for the total
portfolio, estimates are prepared for the total return of each major asset
class over the subsequent 10-year period. Those estimates are based on
a combination of factors including the current market interest rates and
valuation levels, consensus earnings expectations and historical longterm risk premiums. To determine the aggregate return for the pension
trust, the projected return of each individual asset class is then weighted
according to the allocation to that investment area in the trust’s longterm asset allocation policy.
71
NOTES TO CONSOLIDATED FINANCIAL STATEMENTS continued
The assumed health care cost trend rates follow:
At December 31,
Healthcare cost trend rate assumed for
next year
Rate to which cost trend rate gradually
declines
Year the rate reaches the level it is assumed
to remain thereafter
2012
Health Care and Life
2011
2010
(dollars in millions)
7.00%
7.50%
7.75%
5.00
5.00
5.00
2016
2016
2016
A one percentage point change in the assumed health care cost trend
rate would have the following effects:
(dollars in millions)
One-Percentage Point
Increase
Decrease
Effect on 2012 service and interest cost
Effect on postretirement benefit obligation as of
December 31, 2012
$
$
232
3,251
(187)
Asset Category
Cash and cash equivalents
Equity securities
Fixed income securities
U.S. Treasuries and agencies
Corporate bonds
International bonds
Other
Real estate
Other
Private equity
Hedge funds
Total
Total
Level 1
Level 2
$ 1,618
2,944
$ 1,586
2,469
1,589
2,456
601
210
2,018
1,125
35
140
–
–
464
2,225
461
210
–
–
196
–
–
2,018
5,039
1,807
$ 18,282
–
–
$ 5,355
–
1,249
$ 5,116
5,039
558
$ 7,811
$
32
475
Level 3
$
–
–
(2,669)
Plan Assets
Historically, our portfolio strategy emphasized a long-term equity orientation, significant global diversification, and the use of both public
and private investments. In an effort to reduce the risk of our portfolio
strategy and better align assets with liabilities, we have shifted our
strategy to one that is more liability driven, where cash flows from investments better match projected benefit payments but result in lower asset
returns. We intend to reduce the likelihood that assets will decline at a
time when liabilities increase (referred to as liability hedging), with the
goal to reduce the risk of underfunding to the plan and its participants
and beneficiaries. Both active and passive management approaches are
used depending on perceived market efficiencies and various other factors. Our diversification and risk control processes serve to minimize the
concentration of risk.
While target allocation percentages will vary over time, the company’s
overall investment strategy is to achieve a mix of assets, which allows
us to meet projected benefits payments while taking into consideration
risk and return. The current target allocation for plan assets is designed
so that 70% of the assets have the objective of achieving a return in
excess of the growth in liabilities (comprised of public equities, private
equities, real estate, hedge funds and emerging debt) and 30% of the
assets are invested as liability hedging assets (typically longer duration
fixed income). This allocation will shift as funded status improves to a
higher allocation to liability hedging assets. Target policies will be revisited periodically to ensure they are in line with fund objectives. Due to
our diversification and risks control processes, there are no significant
concentrations of risk, in terms of sector, industry, geography or company names.
Pension and healthcare and life plans assets do not include significant
amounts of Verizon common stock.
72
Pension Plans
The fair values for the pension plans by asset category at December 31,
2012 are as follows:
The fair values for the pension plans by asset category at December 31,
2011 are as follows:
(dollars in millions)
Asset Category
Cash and cash equivalents
Equity securities
Fixed income securities
U.S. Treasuries and agencies
Corporate bonds
International bonds
Other
Real estate
Other
Private equity
Hedge funds
Total
Total
$
1,215
6,829
Level 1
$
1,184
5,704
Level 2
$
31
1,125
Level 3
$
–
–
1,796
2,140
1,163
359
2,158
1,239
65
158
–
–
557
1,886
1,005
359
–
–
189
–
–
2,158
6,109
2,341
$ 24,110
–
–
8,350
54
1,679
6,696
6,055
662
9,064
$
$
$
NOTES TO CONSOLIDATED FINANCIAL STATEMENTS continued
The following is a reconciliation of the beginning and ending balance of pension plan assets that are measured at fair value using significant unobservable inputs:
(dollars in millions)
Corporate Bonds
Balance at January 1, 2011
Actual gain (loss) on plan assets
Purchases and sales
$
Transfers in and/or out
Balance at December 31, 2011
180
(4)
48
(35)
189
12
(14)
9
196
$
Actual gain on plan assets
Purchases and sales
Transfers in
Balance at December 31, 2012
Real Estate
$
$
1,769
258
43
88
$ 2,158
84
(224)
–
$ 2,018
Health Care and Life Plans
The fair values for the other postretirement benefit plans by asset category at December 31, 2012 are as follows:
(dollars in millions)
Asset Category
Cash and cash equivalents
Equity securities
Fixed income securities
U.S. Treasuries and agencies
Corporate bonds
International bonds
Other
Total
Total
$
291
1,753
118
192
189
114
$ 2,657
Level 1
$
13
1,004
80
11
72
$ 1,180
Level 2
$
278
749
38
181
117
114
$ 1,477
Level 3
$
$
–
–
–
–
–
–
–
The fair values for the other postretirement benefit plans by asset category at December 31, 2011 are as follows:
(dollars in millions)
Asset Category
Cash and cash equivalents
Equity securities
Fixed income securities
U.S. Treasuries and agencies
Corporate bonds
International bonds
Other
Other
Total
Total
$
$
281
1,695
85
119
192
210
46
2,628
Level 1
$
$
22
951
58
26
67
–
–
1,124
Level 2
$
$
259
744
27
93
125
210
46
1,504
Level 3
$
$
–
–
–
–
–
–
–
–
The following are general descriptions of asset categories, as well as the
valuation methodologies and inputs used to determine the fair value of
each major category of assets.
Cash and cash equivalents include short-term investment funds, primarily
in diversified portfolios of investment grade money market instruments
and are valued using quoted market prices or other valuation methods,
and thus are classified within Level 1 or Level 2.
Equity securities are investments in common stock of domestic and
international corporations in a variety of industry sectors, and are valued
primarily using quoted market prices or other valuation methods, and
thus are classified within Level 1 or Level 2.
Private Equity
$
5,849
477
(203)
(68)
$ 6,055
146
(1,162)
–
$ 5,039
Hedge Funds
$
$
$
716
(4)
(50)
662
43
(147)
–
558
Total
$
8,514
727
(162)
(15)
$ 9,064
285
(1,547)
9
$ 7,811
Fixed income securities include U.S. Treasuries and agencies, debt obligations of foreign governments and domestic and foreign corporations.
Fixed income also includes investments in collateralized mortgage obligations, mortgage backed securities and interest rate swaps. The fair
value of fixed income securities is based on observable prices for identical or comparable assets, adjusted using benchmark curves, sector
grouping, matrix pricing, broker/dealer quotes and issuer spreads, and
thus is classified within Level 1 or Level 2.
Real estate investments include those in limited partnerships that invest
in various commercial and residential real estate projects both domestically and internationally. The fair values of real estate assets are typically
determined by using income and/or cost approaches or a comparable
sales approach, taking into consideration discount and capitalization
rates, financial conditions, local market conditions and the status of the
capital markets, and thus are classified within Level 3.
Private equity investments include those in limited partnerships that
invest in operating companies that are not publicly traded on a stock
exchange. Investment strategies in private equity include leveraged buyouts, venture capital, distressed investments and investments in natural
resources. These investments are valued using inputs such as trading
multiples of comparable public securities, merger and acquisition activity
and pricing data from the most recent equity financing taking into consideration illiquidity, and thus are classified within Level 3.
Hedge fund investments include those seeking to maximize absolute
returns using a broad range of strategies to enhance returns and provide
additional diversification. The fair values of hedge funds are estimated
using net asset value per share (NAV) of the investments. Verizon has the
ability to redeem these investments at NAV within the near term and
thus are classified within Level 2. Investments that cannot be redeemed
in the near term are classified within Level 3.
Cash Flows
In 2012, we contributed $0.9 billion to our qualified pension plans, $0.2
billion to our nonqualified pension plans and $1.5 billion to our other
postretirement benefit plans, exclusive of the annuitization discussed
below. We expect the qualified pension plan contributions in 2013 to be
immaterial. We anticipate approximately $0.1 billion in contributions to
our non-qualified pension plans and $1.5 billion to our other postretirement benefit plans in 2013.
73
NOTES TO CONSOLIDATED FINANCIAL STATEMENTS continued
Estimated Future Benefit Payments
The benefit payments to retirees are expected to be paid as follows:
(dollars in millions)
Year
2013
2014
2015
2016
2017
2018–2022
Pension Benefits
$
3,487
2,513
2,315
1,782
1,686
6,703
Health Care and Life
$
1,662
1,670
1,665
1,614
1,567
7,174
Savings Plan and Employee Stock Ownership Plans
We maintain four leveraged employee stock ownership plans (ESOP).
Only one plan currently has unallocated shares. We match a certain percentage of eligible employee contributions to the savings plans with
shares of our common stock from this ESOP. At December 31, 2012, the
number of unallocated and allocated shares of common stock in this
ESOP was 711,000 and 64 million, respectively. All leveraged ESOP shares
are included in earnings per share computations.
Total savings plan costs were $0.7 billion in 2012, 2011 and 2010,
respectively.
Pension Annuitization
On October 17, 2012, we, along with our subsidiary Verizon Investment
Management Corp., and Fiduciary Counselors Inc., as independent fiduciary of the Verizon Management Pension Plan (the Plan), entered into a
definitive purchase agreement with The Prudential Insurance Company
of America (Prudential) and Prudential Financial, Inc., pursuant to which
the Plan would purchase a single premium group annuity contract from
Prudential.
On December 10, 2012, upon issuance of the group annuity contract by
Prudential, Prudential irrevocably assumed the obligation to make future
annuity payments to approximately 41,000 Verizon management retirees
who began receiving pension payments from the Plan prior to January 1,
2010. The amount of each retiree’s annuity payment equals the amount
of such individual’s pension benefit. In addition, the group annuity contract is intended to replicate the same rights to future payments, such as
survivor benefits, that are currently offered by the Plan.
We contributed approximately $2.6 billion to the Plan between
September 1, 2012 and December 31, 2012 in connection with the transaction so that the Plan’s funding percentage would not decrease as a
result of the transaction.
74
Severance Benefits
The following table provides an analysis of our actuarially determined
severance liability recorded in accordance with the accounting standard
regarding employers’ accounting for postemployment benefits:
(dollars in millions)
Year
2010
2011
2012
Beginning
of Year
$
1,638
1,569
1,113
Charged to
Expense
$
1,217
32
396
Payments
$ (1,307)
(474)
(531)
Other
$
21
(14)
32
End of Year
$
1,569
1,113
1,010
Severance, Pension and Benefit Charges
During 2012, we recorded net pre-tax severance, pension and benefits
charges of approximately $7.2 billion primarily for our pension and postretirement plans in accordance with our accounting policy to recognize
actuarial gains and losses in the year in which they occur. The charges
were primarily driven by a decrease in our discount rate assumption used
to determine the current year liabilities from a weighted-average of 5% at
December 31, 2011 to a weighted-average of 4.2% at December 31, 2012
($5.3 billion) and revisions to the retirement assumptions for participants
and other assumption adjustments, partially offset by the difference
between our estimated return on assets of 7.5% and our actual return
on assets of 10% ($0.7 billion). As part of this charge, we also recorded
$1.0 billion related to the annuitization of pension liabilities, as described
above, as well as severance charges of $0.4 billion primarily for approximately 4,000 management employees.
During 2011, we recorded net pre-tax severance, pension and benefits
charges of approximately $6.0 billion for our pension and postretirement
plans in accordance with our accounting policy to recognize actuarial
gains and losses in the year in which they occur. The charges were primarily driven by a decrease in our discount rate assumption used to
determine the current year liabilities from 5.75% at December 31, 2010 to
5% at December 31, 2011 ($5.0 billion); the difference between our estimated return on assets of 8% and our actual return on assets of 5% ($0.9
billion); and revisions to the life expectancy of participants and other
adjustments to assumptions.
During 2010, we recorded net pre-tax severance, pension and benefits
charges of $3.1 billion. The charges during 2010 included remeasurement losses of $0.6 billion, for our pension and postretirement plans in
accordance with our accounting policy to recognize actuarial gains and
losses in the year in which they occur. Additionally, in 2010, we reached
an agreement with certain unions on temporary enhancements to the
separation programs contained in their existing collective bargaining
agreements. These temporary enhancements were intended to help
address a previously declared surplus of employees and to help reduce
the need for layoffs. Accordingly, we recorded severance, pension and
benefits charges associated with approximately 11,900 union-represented employees who volunteered for the incentive offer. These charges
included $1.2 billion for severance for the 2010 separation programs
mentioned above and a planned workforce reduction of approximately
2,500 employees in 2011. In addition, we recorded $1.3 billion for pension
and postretirement curtailment losses and special termination benefits
due to the workforce reductions.
NOTES TO CONSOLIDATED FINANCIAL STATEMENTS continued
NOTE 12
TAXES
The components of income before provision for income taxes are as
follows:
(dollars in millions)
2012
Years Ended December 31,
Domestic
Foreign
Total
$ 9,316
581
$ 9,897
2011
2010
9,724
759
$ 10,483
$ 11,921
763
$ 12,684
$
The components of the provision (benefit) for income taxes are as follows:
(dollars in millions)
2012
Years Ended December 31,
Current
Federal
Foreign
State and Local
Total
Deferred
Federal
Foreign
State and Local
Total
Investment tax credits
Total income tax provision (benefit)
$
$
223
(45)
114
292
(553)
10
(403)
(946)
(6)
(660)
2011
$
$
193
25
290
508
276
(38)
(455)
(217)
(6)
285
2010
$
$
(705)
(19)
(42)
(766)
2,945
(24)
316
3,237
(4)
2,467
The following table shows the principal reasons for the difference
between the effective income tax rate and the statutory federal income
tax rate:
Years Ended December 31,
2012
Statutory federal income tax rate
State and local income tax rate, net of
federal tax benefits
Affordable housing credit
Employee benefits including ESOP
dividend
Medicare Part D subsidy charge
Equity in earnings from unconsolidated
businesses
Noncontrolling interest
Other, net
Effective income tax rate
35.0%
35.0%
35.0%
(1.9)
(1.9)
(1.0)
(1.8)
1.4
(1.3)
(1.1)
–
(1.4)
–
(1.2)
6.9
(1.4)
(33.7)
(1.7)
(6.7)%
(1.9)
(23.0)
(3.2)
2.7%
(1.6)
(19.5)
(0.3)
19.4%
2011
2010
The effective income tax rate for 2012 was (6.7)% compared to 2.7% for
2011. The negative effective income tax rate for 2012 and the decrease
in the provision for income taxes during 2012 compared to 2011 was
primarily due to lower income before income taxes as a result of higher
severance, pension, and benefit charges as well as early debt redemption
costs recorded in the current year.
The effective income tax rate in 2011 decreased to 2.7% from 19.4% in
2010. This decrease was primarily driven by lower income before provision for income taxes as a result of higher pension and benefit charges
recorded in 2011 as well as tax benefits from state valuation allowance
reversals in 2011. The decrease was also due to a one-time, non-cash
income tax charge of $1.0 billion recorded during the three months ended
March 31, 2010 as a result of the enactment of the Patient Protection and
Affordable Care Act and the Health Care and Education Reconciliation
Act of 2010, both of which became law in March 2010 (collectively the
Health Care Act). Under the Health Care Act, beginning in 2013, Verizon
and other companies that receive a subsidy under Medicare Part D to
provide retiree prescription drug coverage will no longer receive a federal income tax deduction for the expenses incurred in connection with
providing the subsidized coverage to the extent of the subsidy received.
Because future anticipated retiree prescription drug plan liabilities and
related subsidies are already reflected in Verizon’s financial statements,
this change in law required Verizon to reduce the value of the related tax
benefits recognized in its financial statements in the period during which
the Health Care Act was enacted.
The amounts of cash taxes paid are as follows:
(dollars in millions)
2012
Years Ended December 31,
Income taxes, net of amounts refunded
Employment taxes
Property and other taxes
Total
$
351
1,308
1,727
$ 3,386
2011
$
$
762
1,328
1,883
3,973
2010
$
$
430
1,372
1,963
3,765
75
NOTES TO CONSOLIDATED FINANCIAL STATEMENTS continued
Deferred taxes arise because of differences in the book and tax bases
of certain assets and liabilities. Significant components of deferred tax
assets and liabilities are as follows:
Unrecognized Tax Benefits
A reconciliation of the beginning and ending balance of unrecognized
tax benefits is as follows:
(dollars in millions)
(dollars in millions)
At December 31,
2012
2011
Valuation allowances
Deferred tax assets
$ 13,644
4,819
206
1,050
19,719
(2,041)
17,678
$ 13,119
5,170
224
952
19,465
(2,376)
17,089
Former MCI intercompany accounts receivable basis
difference
Depreciation
Leasing activity
Wireless joint venture including wireless licenses
Other – liabilities
Deferred tax liabilities
Net deferred tax liability
1,275
13,953
1,208
22,171
1,320
39,927
$ 22,249
1,435
13,743
1,569
21,778
1,233
39,758
$ 22,669
Employee benefits
Tax loss and credit carry forwards
Uncollectible accounts receivable
Other – assets
At December 31, 2012, undistributed earnings of our foreign subsidiaries
indefinitely invested outside of the United States amounted to approximately $1.8 billion. The majority of Verizon’s cash flow is generated from
domestic operations and we are not dependent on foreign cash or earnings to meet our funding requirements, nor do we intend to repatriate
these undistributed foreign earnings to fund U.S. operations. Furthermore,
a portion of these undistributed earnings represents amounts that legally
must be kept in reserve in accordance with certain foreign jurisdictional
requirements and are unavailable for distribution or repatriation. As a
result, we have not provided U.S. deferred taxes on these undistributed
earnings because we intend that they will remain indefinitely reinvested
outside of the United States and therefore unavailable for use in funding
U.S. operations. Determination of the amount of unrecognized deferred
taxes related to these undistributed earnings is not practicable.
At December 31, 2012, we had net after tax loss and credit carry forwards
for income tax purposes of approximately $4.6 billion. Of these net after
tax loss and credit carry forwards, approximately $4.0 billion will expire
between 2013 and 2032 and approximately $0.6 billion may be carried
forward indefinitely. The amount of net after tax loss and credit carry
forwards reflected as a deferred tax asset above has been reduced by
approximately $0.1 billion at December 31, 2012 and 2011, respectively,
due to federal and state tax law limitations on utilization of net operating
losses.
During 2012, the valuation allowance decreased approximately $0.3 billion. The balance of the valuation allowance at December 31, 2012 and
the 2012 activity is primarily related to state and foreign tax losses and
credit carry forwards.
76
2012
Balance at January 1,
Additions based on tax positions related to
the current year
Additions for tax positions of prior years
Reductions for tax positions of prior years
Settlements
Lapses of statutes of limitations
Balance at December 31,
$ 3,078
131
92
(415)
100
(43)
$ 2,943
2011
$
3,242
$
111
456
(644)
(56)
(31)
3,078
2010
$
3,400
$
231
476
(569)
(256)
(40)
3,242
Included in the total unrecognized tax benefits at December 31, 2012,
2011 and 2010 is $2.1 billion, $2.2 billion and $2.1 billion, respectively,
that if recognized, would favorably affect the effective income tax rate.
We recognized the following net after tax benefits related to interest and
penalties in the provision for income taxes:
Years Ended December 31,
2012
2011
2010
(dollars in millions)
$
82
60
29
The after-tax accruals for the payment of interest and penalties in the
consolidated balance sheets are as follows:
At December 31,
2012
2011
(dollars in millions)
$
386
470
Verizon and/or its subsidiaries file income tax returns in the U.S. federal
jurisdiction, and various state, local and foreign jurisdictions. As a large
taxpayer, we are under audit by the Internal Revenue Service (IRS) and
multiple state and foreign jurisdictions for various open tax years. The IRS
commenced its examination of the Company’s U.S. income tax returns for
tax years 2007-2009 in the third quarter of 2012. Significant tax examinations are ongoing in Italy and New York City for tax years as early as 2000.
The amount of unrecognized tax benefits will change in the next twelve
months due to the resolution of various income tax matters, including
the resolution of tax litigation in Canada in the first quarter of 2013. An
estimate of the range of the possible change cannot be made until these
tax matters are further developed or resolved. The impacts of the favorable resolution of the Canada litigation will be accounted for in the first
quarter of 2013.
NOTES TO CONSOLIDATED FINANCIAL STATEMENTS continued
NOTE 13
SEGMENT INFORMATION
Reportable Segments
We have two reportable segments, which we operate and manage as
strategic business units and organize by products and services. We measure and evaluate our reportable segments based on segment operating
income, consistent with the chief operating decision maker’s assessment
of segment performance.
Corporate, eliminations and other includes unallocated corporate
expenses, intersegment eliminations recorded in consolidation, the
results of other businesses, such as our investments in unconsolidated
businesses, pension and other employee benefit related costs, lease
financing, as well as the historical results of divested operations and other
adjustments and gains and losses that are not allocated in assessing segment performance due to their non-operational nature. Although such
transactions are excluded from the business segment results, they are
included in reported consolidated earnings. Gains and losses that are not
individually significant are included in all segment results as these items
are included in the chief operating decision maker’s assessment of segment performance.
In order to comply with regulatory conditions related to the acquisition
of Alltel in January 2009, Verizon Wireless divested overlapping properties in 105 operating markets in 24 states during the first half of 2010. In
addition, on July 1, 2010, certain of Verizon’s local exchange business and
related activities in 14 states were spun off (see Note 2). Accordingly, the
historical Verizon Wireless and Wireline results for these operations have
been reclassified to Corporate and Other to reflect comparable segment
operating results.
We have adjusted prior-period consolidated and segment information,
where applicable, to conform to current year presentation.
Our segments and their principal activities consist of the following:
Segment
Description
Verizon Wireless
Verizon Wireless’ communications products and services
include wireless voice and data services and equipment sales,
which are provided to consumer, business and government
customers across the United States.
Wireline
Wireline’s voice, data and video communications products
and enhanced services include local and long distance voice,
broadband Internet access and video, corporate networking
solutions, data center and cloud services and security and
managed network services. We provide these products and
services to consumers in the United States, as well as to carriers,
businesses and government customers both in the United
States and in over 150 other countries around the world.
The reconciliation of segment operating revenues and expenses to consolidated operating revenues and expenses below also includes those
items of a non-recurring or non-operational nature. We exclude from
segment results the effects of certain items that management does not
consider in assessing segment performance, primarily because of their
non-recurring or non-operational nature.
The following table provides operating financial information for our two reportable segments:
(dollars in millions)
2012
External Operating Revenues
Retail service
Other service
Service revenue
Verizon Wireless
$
61,383
2,290
63,673
Wireline
$
–
–
–
Total Segments
$
61,383
2,290
63,673
8,010
4,096
–
–
8,010
4,096
Consumer retail
Small business
Mass Markets
–
–
–
14,043
2,648
16,691
14,043
2,648
16,691
Strategic services
Core
Global Enterprise
–
–
–
8,052
7,240
15,292
8,052
7,240
15,292
Global Wholesale
Other
Intersegment revenues
Total operating revenues
–
–
89
75,868
6,177
508
1,112
39,780
6,177
508
1,201
115,648
Cost of services and sales
Selling, general and administrative expense
Depreciation and amortization expense
Total operating expenses
Operating income
$
24,490
21,650
7,960
54,100
21,768
22,413
8,883
8,424
39,720
60
$
46,903
30,533
16,384
93,820
21,828
Assets
Plant, property and equipment, net
Capital expenditures
$ 142,485
34,545
8,857
84,815
52,911
6,342
$ 227,300
87,456
15,199
Equipment
Other
$
$
77
NOTES TO CONSOLIDATED FINANCIAL STATEMENTS continued
(dollars in millions)
2011
External Operating Revenues
Retail service
Other service
Service revenue
Verizon Wireless
$
Equipment
Other
56,601
2,497
59,098
Wireline
$
–
–
–
Total Segments
$
56,601
2,497
59,098
7,446
3,517
–
–
7,446
3,517
Consumer retail
Small business
Mass Markets
–
–
–
13,605
2,720
16,325
13,605
2,720
16,325
Strategic services
Core
Global Enterprise
–
–
–
7,607
8,014
15,621
7,607
8,014
15,621
Global Wholesale
Other
Intersegment revenues
Total operating revenues
–
–
93
70,154
6,795
704
1,237
40,682
6,795
704
1,330
110,836
Cost of services and sales
Selling, general and administrative expense
Depreciation and amortization expense
Total operating expenses
Operating income
24,086
19,579
7,962
51,627
18,527
22,158
9,107
8,458
39,723
959
46,244
28,686
16,420
91,350
19,486
Assets
Plant, property and equipment, net
Capital expenditures
$
$
147,378
33,451
8,973
$
$
86,185
54,149
6,399
$
$
233,563
87,600
15,372
(dollars in millions)
2010
External Operating Revenues
Retail service
Other service
Service revenue
Verizon Wireless
$
Equipment
Other
53,267
2,321
55,588
Wireline
$
–
–
–
Total Segments
$
53,267
2,321
55,588
4,412
3,341
–
–
4,412
3,341
Consumer retail
Small business
Mass Markets
–
–
–
13,419
2,828
16,247
13,419
2,828
16,247
Strategic services
Core
Global Enterprise
–
–
–
6,602
8,712
15,314
6,602
8,712
15,314
Global Wholesale
Other
Intersegment revenues
Total operating revenues
–
–
66
63,407
7,526
858
1,282
41,227
7,526
858
1,348
104,634
Cost of services and sales
Selling, general and administrative expense
Depreciation and amortization expense
Total operating expenses
Operating income
19,245
18,082
7,356
44,683
18,724
22,618
9,372
8,469
40,459
768
41,863
27,454
15,825
85,142
19,492
Assets
Plant, property and equipment, net
Capital expenditures
78
$
$
138,863
32,253
8,438
$
$
83,849
54,594
7,269
$
$
222,712
86,847
15,707
NOTES TO CONSOLIDATED FINANCIAL STATEMENTS continued
Reconciliation to Consolidated Financial Information
A reconciliation of the segment operating revenues to consolidated operating revenues is as follows:
(dollars in millions)
2012
Years Ended December 31,
Operating Revenues
Total reportable segments
Reconciling items:
Deferred revenue adjustment (see Note 1)
Impact of divested operations
Corporate, eliminations and other
Consolidated operating revenues
$ 115,648
–
–
198
$ 115,846
2011
$
110,836
$
–
–
39
110,875
2010
$
104,634
$
(235)
2,407
(241)
106,565
A reconciliation of the total of the reportable segments' operating income to consolidated Income before provision for income taxes is as follows:
(dollars in millions)
2012
Years Ended December 31,
Operating Income
Total segment operating income
Merger integration and acquisition related charges (see Note 2)
Access line spin-off related charges (see Note 2)
Litigation settlements (see Note 16)
Severance, pension and benefit charges (see Note 11)
Deferred revenue adjustment (see Note 1)
Impact of divested operations (see Note 2)
Other costs (see Note 8)
Corporate, eliminations and other
Consolidated operating income
Equity in earnings of unconsolidated businesses
Other income and (expense), net
Interest expense
Income Before Provision for Income Taxes
$
$
21,828
–
–
(384)
(7,186)
–
–
(276)
(822)
13,160
324
(1,016)
(2,571)
9,897
2011
$
$
19,486
–
–
–
(5,954)
–
–
–
(652)
12,880
444
(14)
(2,827)
10,483
2010
$
$
19,492
(867)
(407)
–
(3,054)
(235)
755
–
(1,039)
14,645
508
54
(2,523)
12,684
A reconciliation of the total of the reportable segments' assets to consolidated assets is as follows:
(dollars in millions)
At December 31,
Assets
Total reportable segments
Corporate, eliminations and other
Total consolidated
2012
$ 227,300
(2,078)
$ 225,222
2011
$
$
233,563
(3,102)
230,461
We generally account for intersegment sales of products and services and asset transfers at current market prices. No single customer accounted for
more than 10% of our total operating revenues during the years ended December 31, 2012, 2011 and 2010. International operating revenues and
long-lived assets are not significant.
79
NOTES TO CONSOLIDATED FINANCIAL STATEMENTS continued
NOTE 14
COMPREHENSIVE INCOME
Comprehensive income consists of net income and other gains and
losses affecting equity that, under GAAP, are excluded from net income.
Significant changes in the components of Other comprehensive income,
net of provision for income taxes are described below.
Accumulated Other Comprehensive Income
The components of Accumulated other comprehensive income were as
follows:
Foreign Currency Translation Adjustments
The change in Foreign currency translation adjustments during 2012,
2011 and 2010 was primarily related to our investment in Vodafone
Omnitel N.V. and was primarily driven by the movements of the U.S.
dollar against the Euro.
At December 31,
Net Unrealized Gains (Losses) on Cash Flow Hedges
During 2012, 2011 and 2010, Unrealized gains (losses) on cash flow
hedges included in Other comprehensive income attributable to noncontrolling interest, primarily reflect activity related to a cross currency
swap (see Note 9). Reclassification adjustments for gains (losses) realized
in net income were not significant.
Net Unrealized Gains (Losses) on Marketable Securities
During 2012, 2011 and 2010, reclassification adjustments on marketable
securities for gains (losses) realized in net income were not significant.
Defined Benefit Pension and Postretirement Plans
The change in Defined benefit pension and postretirement plans of $0.9
billion, net of taxes of $0.6 billion at December 31, 2012 was primarily a
result of plan amendments.
The change in Defined benefit pension and postretirement plans of $0.3
billion, net of taxes of $0.2 billion at December 31, 2011 was primarily a
result of plan amendments.
80
(dollars in millions)
Foreign currency translation adjustments
Net unrealized gain on cash flow hedges
Unrealized gain on marketable securities
Defined benefit pension and postretirement plans
Accumulated Other Comprehensive Income
2012
$
793
88
101
1,253
$ 2,235
2011
$
$
724
156
72
317
1,269
NOTES TO CONSOLIDATED FINANCIAL STATEMENTS continued
NOTE 15
ADDITIONAL FINANCIAL INFORMATION
The tables that follow provide additional financial information related to our consolidated financial statements:
Income Statement Information
(dollars in millions)
2012
Years Ended December 31,
Depreciation expense
Interest costs on debt balances
Capitalized interest costs
Advertising expense
$
14,920
2,977
(406)
2,381
2011
$
14,991
3,269
(442)
2,523
Balance Sheet Information
$
14,593
3,487
(964)
2,451
(dollars in millions)
2012
At December 31,
Accounts Payable and Accrued Liabilities
Accounts payable
Accrued expenses
Accrued vacation, salaries and wages
Interest payable
Taxes payable
$
$
Other Current Liabilities
Advance billings and customer deposits
Dividends payable
Special distribution to noncontrolling interest
Other
$
$
2011
4,740
4,608
5,006
632
1,196
16,182
$
3,554
1,494
–
1,357
6,405
$
Cash Flow Information
$
$
4,194
3,786
4,857
774
1,078
14,689
3,411
1,440
4,500
1,872
11,223
(dollars in millions)
2012
Years Ended December 31,
Cash Paid
Interest, net of amounts capitalized
2010
$
1,971
2011
$
2,629
2010
$
2,433
Common stock has been used from time to time to satisfy some of the funding requirements of employee and shareowner plans, including 24.6 million common shares issued from Treasury stock during 2012, related to dividend payments, which had an aggregate value of $1.0 billion.
81
NOTES TO CONSOLIDATED FINANCIAL STATEMENTS continued
NOTE 16
COMMITMENTS AND CONTINGENCIES
In the ordinary course of business Verizon is involved in various commercial litigation and regulatory proceedings at the state and federal level.
Where it is determined, in consultation with counsel based on litigation
and settlement risks, that a loss is probable and estimable in a given
matter, the Company establishes an accrual. In none of the currently
pending matters is the amount of accrual material. An estimate of the
reasonably possible loss or range of loss in excess of the amounts already
accrued cannot be made at this time due to various factors typical in
contested proceedings, including (1) uncertain damage theories and
demands; (2) a less than complete factual record; (3) uncertainty concerning legal theories and their resolution by courts or regulators; and
(4) the unpredictable nature of the opposing party and its demands.
We continuously monitor these proceedings as they develop and adjust
any accrual or disclosure as needed. We do not expect that the ultimate
resolution of any pending regulatory or legal matter in future periods,
including the Hicksville matter described below, will have a material
effect on our financial condition, but it could have a material effect on
our results of operations for a given reporting period.
During 2003, under a government-approved plan, remediation commenced at the site of a former Sylvania facility in Hicksville, New York
that processed nuclear fuel rods in the 1950s and 1960s. Remediation
beyond original expectations proved to be necessary and a reassessment
of the anticipated remediation costs was conducted. A reassessment of
costs related to remediation efforts at several other former facilities was
also undertaken. In September 2005, the Army Corps of Engineers (ACE)
accepted the Hicksville site into the Formerly Utilized Sites Remedial
Action Program. This may result in the ACE performing some or all of the
remediation effort for the Hicksville site with a corresponding decrease
in costs to Verizon. To the extent that the ACE assumes responsibility
for remedial work at the Hicksville site, an adjustment to a reserve previously established for the remediation may be made. Adjustments to
the reserve may also be made based upon actual conditions discovered
during the remediation at this or any other site requiring remediation.
Verizon is currently involved in approximately 50 federal district court
actions alleging that Verizon is infringing various patents. Most of these
cases are brought by non-practicing entities and effectively seek only
monetary damages; a small number are brought by companies that sell
products and seek injunctive relief as well. These cases have progressed
to various degrees and a small number may go to trial in the coming 12
months if they are not otherwise resolved. In the third quarter of 2012,
we settled a number of patent litigation matters, including cases with
ActiveVideo Networks Inc. (ActiveVideo) and TiVo Inc. (TiVo). In connection with the settlements with ActiveVideo and TiVo, we recorded a
charge of $0.4 billion in the third quarter of 2012 and will pay and recognize over the next six years an additional $0.2 billion.
In connection with the execution of agreements for the sales of businesses and investments, Verizon ordinarily provides representations and
warranties to the purchasers pertaining to a variety of nonfinancial matters, such as ownership of the securities being sold, as well as indemnity
from certain financial losses. From time to time, counterparties may make
claims under these provisions, and Verizon will seek to defend against
those claims and resolve them in the ordinary course of business.
Subsequent to the sale of Verizon Information Services Canada in 2004,
we continue to provide a guarantee to publish directories, which was
issued when the directory business was purchased in 2001 and had a
30-year term (before extensions). The preexisting guarantee continues,
without modification, despite the subsequent sale of Verizon Information
Services Canada and the spin-off of our domestic print and Internet
yellow pages directories business. The possible financial impact of the
82
guarantee, which is not expected to be adverse, cannot be reasonably
estimated as a variety of the potential outcomes available under the
guarantee result in costs and revenues or benefits that may offset each
other. We do not believe performance under the guarantee is likely.
As of December 31, 2012, letters of credit totaling approximately $0.1 billion, which were executed in the normal course of business and support
several financing arrangements and payment obligations to third parties,
were outstanding.
We have several commitments primarily to purchase handsets and
peripherals, equipment, software, programming and network services,
and marketing activities, which will be used or sold in the ordinary course
of business, from a variety of suppliers totaling $41.8 billion. Of this total
amount, $29.6 billion is attributable to 2013, $7.5 billion is attributable to
2014 through 2015, $4.2 billion is attributable to 2016 through 2017 and
$0.5 billion is attributable to years thereafter. These amounts do not represent our entire anticipated purchases in the future, but represent only
those items that are the subject of contractual obligations. Our commitments are generally determined based on the noncancelable quantities
or termination amounts. Purchases against our commitments for 2012
totaled approximately $16 billion. Since the commitments to purchase
programming services from television networks and broadcast stations
have no minimum volume requirement, we estimated our obligation
based on number of subscribers at December 31, 2012, and applicable
rates stipulated in the contracts in effect at that time. We also purchase
products and services as needed with no firm commitment.
NOTES TO CONSOLIDATED FINANCIAL STATEMENTS continued
NOTE 17
QUARTERLY FINANCIAL INFORMATION (UNAUDITED)
(dollars in millions, except per share amounts)
Net Income (Loss) attributable to Verizon(1)
Per SharePer ShareAmount
Basic
Diluted
Quarter Ended
Operating
Revenues
Operating
Income (Loss)
2012
March 31
June 30
September 30
December 31
$ 28,242
28,552
29,007
30,045
$ 5,195
5,651
5,483
(3,169)
$ 1,686
1,825
1,593
(4,229)
$
.59
.64
.56
(1.48)
$
.59
.64
.56
(1.48)
2011
March 31
June 30
September 30
December 31
$ 26,990
27,536
27,913
28,436
$
$
$
.51
.57
.49
(.71)
$
.51
.57
.49
(.71)
4,453
4,892
4,647
(1,112)
1,439
1,609
1,379
(2,023)
Net Income
(Loss)
$ 3,906
4,285
4,292
(1,926)
$
3,264
3,604
3,542
(212)
• Resultsofoperationsforthethirdquarterof2012includeafter-taxchargesattributabletoVerizonof$0.2billionrelatedtolegalsettlements.
• Resultsofoperationsforthefourthquarterof2012includeafter-taxchargesattributabletoVerizonof$5.3billionrelatedtoseverance,pensionandbenefitchargesandearlydebt
redemption and other costs.
• Resultsofoperationsforthethirdquarterof2011includeafter-taxchargesattributabletoVerizonof$0.2billionrelatedtoseverance,pensionandbenefitcharges.
• Resultsofoperationsforthefourthquarterof2011includeafter-taxchargesattributabletoVerizonof$3.5billionrelatedtoseverance,pensionandbenefitchargesandcostsrelatedtothe
early redemption of debt.
(1) Net income (loss) attributable to Verizon per common share is computed independently for each quarter and the sum of the quarters may not equal the annual amount.
83
BOARD OF DIRECTORS
Richard L. Carrión
Chairman, President and Chief Executive Officer
Popular, Inc.
and Chairman, President and Chief Executive Officer
Banco Popular de Puerto Rico
Melanie L. Healey
Group President – North America and Global HSM
Channel
The Procter & Gamble Company
M. Frances Keeth
Retired Executive Vice President
Royal Dutch Shell plc
Robert W. Lane
Retired Chairman and Chief Executive Officer
Deere & Company
Lowell C. McAdam
Chairman and Chief Executive Officer
Verizon Communications Inc.
Sandra O. Moose
President
Strategic Advisory Services LLC
Joseph Neubauer
Chairman
ARAMARK Holdings Corporation
Donald T. Nicolaisen
Former Chief Accountant
United States Securities and Exchange Commission
Clarence Otis, Jr.
Chairman and Chief Executive Officer
Darden Restaurants, Inc.
Hugh B. Price
Visiting Professor and Lecturer
Woodrow Wilson School of Public and
International Affairs, Princeton University
and Non-Resident Senior Fellow
The Brookings Institution
Rodney E. Slater
Partner
Patton Boggs LLP
Kathryn A. Tesija
Executive Vice President, Merchandising and
Supply Chain
Target Corporation
Gregory D. Wasson*
President and Chief Executive Officer
Walgreen Co.
* Gregory D. Wasson was elected to the Board
in 2013.
84
CORPORATE OFFICERS AND
EXECUTIVE LEADERSHIP
Lowell C. McAdam
Chairman and Chief Executive Officer
Francis J. Shammo
Executive Vice President and
Chief Financial Officer
Robert J. Barish
Senior Vice President and Controller
Roy H. Chestnutt
Executive Vice President –
Strategy, Development and Planning
Matthew D. Ellis
Senior Vice President and Treasurer
Roger Gurnani
Executive Vice President and
Chief Information Officer
Holyce E. Hess Groos
Senior Vice President – Operational Excellence
and Process Transformation
William L. Horton, Jr.
Senior Vice President, Deputy General Counsel
and Corporate Secretary
Rose M. Kirk
President – Verizon Foundation
Daniel S. Mead
Executive Vice President and
President and Chief Executive Officer –
Verizon Wireless
Anthony J. Melone
Executive Vice President and
Chief Technology Officer
Randal S. Milch
Executive Vice President – Public Policy and
General Counsel
W. Robert Mudge
President –
Consumer and Mass Business Markets
Marc C. Reed
Executive Vice President and
Chief Administrative Officer
Shane A. Sanders
Senior Vice President – Internal Auditing
Michael T. Stefanski
Senior Vice President – Investor Relations
John G. Stratton
Executive Vice President and President –
Verizon Enterprise Solutions
I N V E S T O R I N F O R M AT I O N
Stock Transfer Agent and Registrar
Questions or requests for assistance regarding changes to or transfers
ofyourregisteredstockownershipshouldbedirectedtoourTransfer
Agent, Computershare Trust Company, N.A. at:
VerizonCommunicationsShareownerServices
c/o Computershare
P.O.Box43078
Providence, RI 02940-3078
Phone:800631-2355
Website: www.computershare.com/verizon
Email:[email protected]
Persons outside the U.S. may call: 781 575-3994
Personsusingatelecommunicationsdeviceforthedeaf(TDD)maycall:
800 952-9245
Shareowner Services
Please contact our Transfer Agent regarding information on the
followingservices:
Online Account Access — Registered shareowners can view account
informationonlineat:www.computershare.com/verizon.
Click on “Create Login” to register. For existing users, click on “Login.”
Direct Dividend Deposit Service—Verizonoffersanelectronicfunds
transfer service to registered shareowners wishing to deposit dividends
directlyintosavingsorcheckingaccountsondividendpaymentdates.
Direct Invest Stock Purchase and Ownership Plan —Verizon offers
adirectstockpurchaseandshareownershipplan.Theplanallows
current and new investors to purchase common stock and to reinvest
thedividendstowardthepurchaseofadditionalshares.Formore
information, go to www22.verizon.com/investor/directinvest.
Electronic Delivery—Verizonisactingtoconservenaturalresources
in a variety of ways. We are proud to offer shareowners an opportunity
tobeenvironmentallyresponsible.Byreceivinglinkstoproxy,annual
report and shareowner materials online, you can help Verizon reduce
theamountofmaterialsweprintandmail.Asathankyouforchoosing
electronic delivery, Verizon will plant a tree on your behalf. It’s fast and
easy,andyoucanchangeyourelectronicdeliveryoptionsatanytime.
Sign up at www.eTree.com/verizon. If your shares are held by a broker,
bankorothernominee,youmayelecttoreceiveanelectroniccopyof
the annual report and proxy materials online at www.proxyvote.com, or
youcancontactyourbroker.
Investor Services
Investor Website — Get company information and news on our
investorwebsite—www.verizon.com/investor.
Email Alerts — Get the latest investor information delivered directly to
you.SubscribetoEmailalertsatourinvestorwebsite.
Stock Market Information
ShareownersofrecordatDecember31,2012:614,409
Verizon (ticker symbol: VZ) is listed on the New York Stock Exchange
andtheNASDAQGlobalSelectMarket.Verizonisalsolistedonthe
London Stock Exchange.
Dividend Information
At its September 2012 meeting, the Board of Directors increased
ourquarterlydividend3.0percent.Onanannualbasis,thisincreased
Verizon’s dividend to $2.06 per share. Dividends have been paid
since1984.
Form 10-K
Toreceiveaprintedcopyofthe2012AnnualReportonForm10-K,
which is filed with the U.S. Securities and Exchange Commission,
contactInvestorRelations:
Verizon Communications Inc.
InvestorRelations
One Verizon Way
BaskingRidge,NJ07920
Phone: 212 395-1525
Corporate Governance
Verizon’s Corporate Governance Guidelines are available on our investor
website—www.verizon.com/investor.
If you would prefer to receive a printed copy by mail, please contact the
AssistantCorporateSecretary:
Verizon Communications Inc.
AssistantCorporateSecretary
140 West Street, 29th Floor
NewYork,NY10007
Printed with
inks containing
soy and/or
vegetable oils
Verizon Communications Inc.
140 West Street
New York, New York 10007
212 395-1000
verizon.com
© 2013. Verizon. All Rights Reserved.
002CSN8269v


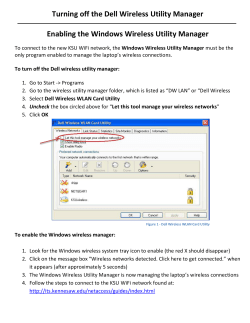


© Copyright 2026