
UK wheat to bread supply chain
Case (Task Julie Smith and David Barling City University London Case Study: UK wheat to bread supply chain (Task 3.5) Study 3.5) Authors – Partner The research leading to these results has received funding from the European Union’s Seventh Framework Programme for research, technological development and demonstration under grant agreement n° 311778 2014 XY To be quoted as: Smith J and Barling D (2014) Glamur project UK wheat to bread supply chain case study. City University London www.glamur.eu 2 Case Study: UK wheat to bread supply chain (Task 3.5) Julie Smith and David Barling – City University London www.glamur.eu 3 Summary 1. Background • The UK wheat to bread case study is part of research being undertaken for GLAMUR WP3 to document global and local aspects of the supply chain. The study maps and analyses the industrial (more global) wheat to bread supply chain and two sub-‐chains with more local characteristics. It includes: i.) analysis of stakeholder knowledge of the supply chains and perceptions of their local and global performance; ii.) using a set of indicators, analysis of biodiversity; technological innovation; nutrition; and information and communication as key factors (attributes) identified for how these chains are interacting, adapting and innovating in the UK; and iii.) collecting data suitable for a comparative analysis with data collected on the Italian wheat to bread chain; • This is one of the UK’s most important food chains and follows the production of wheat and its transformation into flour and bread for retail and consumption. The chain is dominated by intensive wheat cultivation and a concentrated and highly industrialised manufacturing and distribution system that accounts for 80% by volume of production, with three large manufacturers competing for almost 75% of the bread market by value. At the industrial level, bread can be split into 2 key categories: i.) wrapped sliced bread baked by plant bakeries and ii.) ISB (in-‐store bakery) where bread is baked in-‐ store either from scratch or from part-‐baked dough. The vast majority of UK bread is sold by supermarkets, rather than specialist bakers and the chain produces nearly 11 million loaves each day that are sold to 99% of British households. Recent trends in consumer habits and tastes have resulted in declining sales of sliced white bread. In recent years, more local chains have proliferated to meet consumer demand for bread identified with more ‘artisan-‐like’ qualities. 2. Context of the UK case study • Selection of the case study chains: The GLAMUR theoretical framework, where four key dimensions are identified to differentiate local from global, was used to help identify the chains. Three supply chains were selected: a large industrial plant baker -‐ GC (more global); and two smaller chains with local characteristics -‐ an in-‐store bakery -‐ ISB (regional aspects), and a craft bakery chain-‐ CRFT (more local). Interviews were conducted with farmers, grain collectors, millers, bakers and retailers as key stakeholders along each of the chains. Interviewees revealed a range of perceptions about how stakeholders make distinctions between ‘local’ and ‘global’. • Global-‐local issues in the supply chains include: i.) geography distance: all chains have global and local inputs. There was a scale of perceptions about how stakeholders made distinctions between ‘global’ and ‘local’, and reservations about defining ‘local’ purely in terms of distance. ii.) governance: high level of industrial organisation and governance – regulation, assurance schemes and contractual specifications; iii.) resources, knowledge and technologies: technological innovation and research development have led to more integrated and efficient industrial supply chains with some negative impacts at the local level; iv.) identity/role of territory: industrial and ISB chains are increasingly focussed on value added production, with an emerging focus on provenance linked to marketing potential. This mirrors and competes with key characteristics of origin and place that characterise the craft and artisan bakeries in the local chain. • Scope and systems boundaries of the research study: the system boundary was delimited for the scope of the case study research and only accounts for stages in the supply chain up to the point of www.glamur.eu 4 • sale. Although consumers have not been directly interviewed as part of the analysis, stakeholders’ perceptions of their influence were sought. Conceptual maps were used to provide detailed comparisons and demonstrate some of the shared characteristics between the chains. Critical issues include: wheat provenance and climate variation; seed breeding and wheat growing priorities and practices; concentration in the supply chain; GHG emissions; product composition and nutrition; (re-‐) use of traditional baking techniques versus industrial production linked with technological innovation. 3. Research design • Research questions incorporated the critical issues identified and addressed distinctions and connections/interactions between local-‐global chains. • Selection of the attributes: scientifically sound attributes were selected (biodiversity, technological innovation, nutrition and information and communication) that provided data for analysis in the five performance dimensions (economic, social, environmental, health, ethical). • Selection of the indicators: indicators were selected using a process that reviewed evidence for each attribute; the SAFA Guidelines; identified those for which data would be readily available; and to meet the needs of the research questions. • Constructing the indicators: criteria devised for assessment of the indicators was based on integrating analyses determined by stakeholder-‐specific interests and values gathered from the semi-‐ structured interviews, with verifiable analyses from secondary data sources (practice based). • Benchmarking: the values and qualitative descriptions that defined each indicator were benchmarked to set its performance level and rate its sustainability performance. From this a rating of the sustainability performance for each attribute and each individual chain was calculated, and comparisons of performance levels between the global, regional and local chains as a whole were calculated. 4. Methods • Data gathering: methods used for data collection included 16 semi-‐structured interviews with key stakeholders and associated organisations; and review and data from secondary sources. The methodology employed was mindful of the participatory approach and the need to include stakeholder views and perceptions throughout the research process. • Relevant descriptors: were used to provide a contextual baseline and ‘thicken’ the analysis. • Data quality check was carried out. 5. Results • Presentation of data: benchmarked scores of performance were calculated for each indicator. In sum, the local chain appears to perform best for both biodiversity and technological innovation and less well for information and communication. The regional chain scores least well for nutrition. Overall scores for these selected attributes and indicators show the local chain performed best (81.6%), then the global chain (63.3%), and then the regional chain (60.8%). www.glamur.eu 5 Overall scores of performance for attributes in global, regional and local chains info & communicacon biodiversity 100 80 60 40 20 0 global technological innovacon regional local nutricon 6. Discussion: • The methodology was effective for selecting key attributes and sets of indicators to evaluate the specific performance levels in each of the three chains and in providing a set of results for comparison with those of the Italian team. However, data provided by the analysis had some limitations and perhaps the most critical of these relates to the difficulty of assessing global-‐local performance when dealing with the breadth of scope between the large-‐scale industrial chain and the small-‐scale local chain. The methodology did effectively address some limits to its validity through the contextual descriptors and the data quality check. • Each of the attributes and their related indicators were considered using the relevant research question(s) to structure the discussion and identify key issues that emerged from the research findings about how global-‐local wheat to bread chains are innovating, adapting and interacting in the UK. The discussion included perceptions and observations about global-‐local interactions in the chains as expressed by stakeholders interviewed for the study. Some key findings include: • there were key differences between stakeholders in each chain about how they defined ‘global’ and ‘local’; • there is an unresolved debate about delivering biodiversity (environmental performance) and maximising productive output (economic performance) along the global-‐local continuum; • innovative technological practices, coupled with legislation, have positively affected both environmental and economic performance along the global-‐local continuum; • the use of industry oversight and public scrutiny has resulted in a marked decrease in salt content in industrially produced bread but there is a shortage of data in the other chains; • there was evidence of a ‘re-‐balancing’ of the chains as the industrial chain adapts and innovates using key qualities and characteristics associated with the local chain, with a counter-‐balance that is shifting demand towards more local bread, associated with traditional baking techniques; • although the industrial chain can ‘up’ its marketing and deliver new quality messages to consumers, there is a counter-‐balance at the local artisan level where social media (twitter, you tube etc.) is growing exponentially and promoting the local very dynamically, in particular to younger consumers. www.glamur.eu 6 Contents Figures, Tables, Appendices 1. Introduction……………………………………………………………………………………………………………………10 1.1 Structure of the report 1.2 Introduction to the UK wheat to bread supply chain 2. Context of the case study……………………………………………………………………………………………….15 2.1 How the chains were selected 2.1.1 Distinctions between ‘global’ and more ‘local’ wheat to bread supply chains 2.2 Global-‐local issues in the supply chains 2.3 System boundaries, characteristics and mapping 2.4 Quality issues: production and processing 2.5 Critical issues 3. Research Design……………………………………………………………………………………………………………..33 3.1 Research Questions 3.2 Attributes 3.2.1 Checking the 24 attributes 3.2.2 Selection procedure 3.2.3 Selected attributes 3.3 Indicators 4. Methods………………………………………………………………………………………………………………………..50 4.1 Processes used for assessment of the indicators 4.2 Benchmarks: methods used for definition and calculation 4.3 Methods used for data collection 4.4 Participatory approach 5. Results………………………………………………………………………………………………………………………….56 5.1 Presentation of data and scores of performance 5.1.1 Attributes and indicators: global-‐local differences 5.2 Relevant descriptors 5.3 Data quality check 6. Discussion……………………………………………………………………………………………………………………..62 6.1 Methodology: effectiveness and limits to validity 6.2 Addressing the research questions 6.3 Issues for global-‐local chains 6.3.1 Context and performance 6.3.2 Policy context 7. Next steps…………………………………………………………………………………………………………………..…72 8. References……………………………………………………………………………………………………………………..73 9. Appendices…………………………………………………………………………………………………………………...76 www.glamur.eu 7 Figures Figure 1: Model of UK wheat to bread supply chain………………………………………………………………..14 Figure 2: Local chain: East Anglian region………………………………………………………………………………..19 Figure 3: WFSC UK wheat to bread supply chain – global/industrial (GC)…………………………………22 Figure 4: WFSC UK wheat to bread supply chain – regional (ISB)………………………………………………23 Figure 5: WFSC UK wheat to bread supply chain – local (CRFT)…………………………………………………23 Figure 6: Conceptual map of the industrial (more global) chain (GC)………………………………………..29 Figure 7: Conceptual map of ISB (regional) chain (ISB)………………………………………………………………29 Figure 8: Conceptual map of local craft bakery chain (CRFT)……………………………………………………..30 Figure 9: Numbers of stakeholders – global/industrial chain…………………………………………………….30 Figure 10: Numbers of stakeholders – regional ISB chain………………………………………………………….31 Figure 11: Numbers of stakeholders – local craft bakery chain………………………………………………….31 Figure 12: What distinguishes boundaries between global and local wheat-‐to-‐bread chains…….35 Figure 13: UK bread manufacturing: contributions of life cycle stages to carbon footprint……….41 Figure 14: UK Hotspots – bread and rolls…………………………………………………………………………………..42 Figure 15: Benchmarked performance scores for indicators……………………………………………………..57 Figure 16: Distribution of performance across the chains, according to attribute……………………..59 Figure 17: Overall evaluation of attributes across the global, regional and local supply chains…60 Tables Table 1: Market share of UK bread production by value and volume………………………………………..12 Table 2: Stakeholder perceptions of ‘global’ and ‘local’…………………………………………………………….25 Table 3: Construction of the indicators……………………………………………………………………………………..47 Table 4: Synoptic table……………………………………………………………………………………………………………..49 Table 5: Indicator assessment, benchmark definition and calculation……………………………………….52 Table 6: Secondary data (selected sources)………………………………………………………………………………54 Table 7: Scores of performance…………………………………………………………………………………………………56 Table 8: Summary of pedigree matrix scoring for data quality…………………………………………………..62 Appendices 9.1 Figure: Detailed UK wheat to bread supply chain…………………………………………………………77 9.2 Figure: UK flour supply chain……………………………………………………………………………………….78 www.glamur.eu 8 9.3 Details of stakeholders interviewed…………………………………………………………………………….79 9.4 Interview Guide…………………………………………………………………………………………………………..80 9.5 Presentation of data and scores of performance by attribute………………………………………89 9.6 Details of data quality check………………………………………………………………………………………..91 www.glamur.eu 9 1 Introduction The UK wheat to bread case study is part of research being undertaken for GLAMUR WP3 to document global and local aspects of the supply chain. In common with all of the case study research being undertaken in this WP, the research aims to address three over-‐arching questions: 1. What are the key food chain performance issues with regard to a global-‐local comparison? 2. What are the methodological strengths and weaknesses of overall applied pairwise comparative analysis? 3. What are the specific interactions of the food chains under study and the policy settings? Acknowledging that the national context influences and situates how global and local food chain performance is viewed (see GLAMUR WP2 report -‐ Kirwan et al 2014), the UK case study, conducted by City University London, maps and analyses the industrial (more global) wheat to bread supply chain and two sub-‐chains with more local characteristics. The study includes: i.) analysis of stakeholder knowledge of the supply chains and perceptions of their local and global performance; and ii.) using a set of indicators, analysis of biodiversity; technological innovation; nutrition; and information and communication as key factors (attributes) identified for how global-‐local wheat to bread supply chains are adapting and innovating in the UK. This report examines how these attributes and indicators perform in the global-‐local chains, and in which dimensions (i.e. economic, social environmental, health and ethical), with analysis of the underlying factors (e.g. political, legislative, geographical etc.) that influence the performance of the indicators in the respective dimensions. 1.1 Structure of the report The report has six sections, followed by concluding remarks, references and annexes. Section 1 provides a brief introduction to the UK wheat to bread supply chain within the national context; Section 2 contextualizes the case study; Section 3 focuses on the research design; Section 4 presents the research methods; Section 5 details the results; and Section 6 provides a preliminary discussion of the results and methodologies employed. Concluding remarks are www.glamur.eu 10 made, including how the findings contribute to the three over-‐arching research questions, to be explored further in WPs 4, 5 and 6. 1.2 Introduction to the UK wheat to bread supply chain The UK wheat to bread supply chain is dominated by intensive wheat cultivation and a concentrated and highly industrialized manufacturing and distribution system that accounts for 80%1 by volume of production, with three large manufacturers competing for almost 75% of the bread market by value2. At the industrial level, bread can be split into 2 key categories: i.) wrapped sliced bread baked by plant bakeries and ii.) ISB (in-‐store bakery) where bread is baked in-‐store either from scratch or from part-‐baked dough. Wrapped Sliced Bread and ISB Bread have different roles in the market; wrapped slice bread has a longer shelf-‐life (5-‐6 days) and is marketed as more of an ‘everyday’ convenience purchase; whereas ISB bread has a shorter shelf-‐life, has more ‘artisan’ qualities and is marketed as ‘more of a treat’ (Table 1). Unlike other European countries where the industrial sector is often much smaller -‐ for e.g. 35% in France, 19% in Spain3 -‐ the vast majority of UK bread is sold by supermarkets, rather than specialist bakers and the chain produces nearly 11 million loaves each day that are sold to 99% of British households. White bread accounts for 71% of total bread consumption, brown and wholemeal accounts for 22% and other bread is 7% of the total bread market4. Sandwiches are thought to account for 50% of overall bread consumption5. However, recent trends in consumer habits and taste have resulted in declining sales of sliced white bread (a fall of 4.8% by volume of 40 million loaves in 2013) and as a further decline of 20% is predicted by 2017, there is evidence of a move away from the industrially produced white loaf (described by some in the media as ‘demonised’), with the large manufacturers now 1 http://www.bakersfederation.org.uk/the-‐bread-‐industry/about-‐the-‐bread-‐industry.html Accessed 2 December 2013 http://www.bakersfederation.org.uk/the-‐bread-‐industry/about-‐the-‐bread-‐industry.html Accessed 28 January 2014 3 http://www.bakersfederation.org.uk/the-‐bread-‐industry/industry-‐facts/european-‐bread-‐market.html Accessed 3 October 2014. 4 http://www.bakersfederation.org.uk/the-‐bread-‐industry/industry-‐facts/2012-‐01-‐23-‐15-‐53-‐01.html Accessed 3 October 2014 5 http://www.nabim.org.uk/content/1/101/flour-‐-‐-‐bread-‐consumption.html Accessed 28 Jan 2014 2 www.glamur.eu 11 also marketing ‘healthier’ bread with higher fibre content and moving in to other bakery markets that are experiencing growth6. Table 1: Market share of UK bread production by value and volume % by value % by volume Large plant bakers 78 80 In-‐store bakeries 17 17 Master bakers 5 3 100 100 Source: Bakers Federation (http://www.bakersfederation.org.uk/the-‐bread-‐industry/about-‐the-‐bread-‐ industry.html Accessed 28 Jan 2014. Co-‐existing with the dominant, industrialised chain (and dependent on it for some inputs and services) is a comparatively small ‘craft’ chain (or series of chains) characterized by smaller production units, less mechanized and more time-‐consuming manufacturing methods and less inputs and additives to facilitate production (Barling et al 2009). In recent years, more local chains have proliferated to meet consumer demand for bread identified with more ‘artisan-‐like’ qualities. In addition, as Table 1 indicates, specialist breads sold in supermarket and other retail in-‐store bakeries (ISBs) have risen to 17% by volume. Although official figures do not distinguish between plant bakery, ISB and craft/artisan bakeries,7 anecdotal evidence (for example, more media coverage on artisan baking) and analysis of data from the Office for National Statistics indicates that the number of bakery retail businesses is increasing (up 5% from the previous year in 2012). Data from research group Mintel (published in September 2013) that analysed bread consumption in the UK over the past 5 years, found that pre-‐packed bread experienced only 2% growth in value terms in 2012-‐13 (with white bread sales in decline), whereas speciality 6 http://www.marketingweek.co.uk/sectors/food-‐and-‐drink/news/kingsmill-‐launches-‐67m-‐bid-‐to-‐save-‐demonised-‐ white-‐bread/4009716.article Accessed 3 October 2014 7 Official governmental statistics for the number of bakeries in Britain are collected by the Office of National Statistics. The number of businesses involved in the 'Manufacture of bread’ in 2010 was 1,892 (this includes both large and small manufacturers). www.glamur.eu 12 breads, notwithstanding the rising price in wheat, experienced an 8% increase in value terms. However, the Bakers federation considers key opportunities for market growth will be through ‘trading consumers up to higher value products offering health, premium or convenience benefits’8. The stages in bread production for the national chain can be described as follows: at the agricultural stage, globally sourced inputs including seeds, pesticides, fertilizers etc. are used to grow wheat for bread production throughout the UK; there are more than 10,000 significant farmers and the highest wheat yields are in the East of England, with concentrations also in the Midlands, South East, Yorkshire and Humberside and South West regions.9 Usage of home-‐ grown wheat has doubled over the past 40 years and a large number of flours and breads are produced entirely from UK grown wheat and in 2014, it is estimated that almost 2.0 million hectares of wheat will be harvested in the UK.10 As already noted, 80% of UK industrial bread production lies with three key players who have bakeries and depots located throughout England, Wales and Scotland. Grain collection tends to be done on a regional scale where it is dried and held in distribution centres alongside imported wheat from European and global sources, including Germany, Canada, France and the USA. Grain moves on to the next stage of processing and to the milling stage where 31 companies operate 53 large, continuous process, electrically-‐driven roller mills. The four largest companies account for approximately 65% of UK flour production and many of the smaller millers have developed niches ranging from pre-‐packed flours and mixes to those for specific uses such as flours for speciality breads. For white flour in particular, UK flour is often blended with imported wheat flours to get the correct quality and functionality (13% protein, 250s HFN and specific weights 76kg/hl. Source: Nabim) and statutory additives are added in a process known as fortification11 (these do not currently need to be listed on product labels – this is discussed further below in sub-‐section 2.2). Industrial plant bakeries (150 of the large plant bakeries 8 http://www.bakersfederation.org.uk/images/pdfs/media-‐and-‐resources/FS3%20-‐ %20The%20British%20Bakery%20Market%2030-‐10-‐13-‐FINAL.pdf Accessed 23 October 2014 9 http://www.grainchain.com/Resources/11-‐14/WheatInTheUK_11-‐14.pdf Accessed 29 Jan 2014 10 Nabim 2014 figs 11 statutory additives are thiamine (vitamin B1), nicotinic acid, iron and calcium carbonate www.glamur.eu 13 employ more than 100 people12) use flour, yeast, salt, sugar, fats, and additives in the industrial Chorleywood Baking Process (CBP) to bake bread and supply regional depots for onward distribution to supermarket chains that account for 87% of output, with the rest going to smaller retail outlets and the food service sector (although a growing proportion of dough is chilled/frozen for in-‐store supermarket bakeries and other retail outlets). Artisan and craft bakers use the bulk fermentation process (BFP) using traditional methods where dough is left to ferment and rise (with increasing use of sour dough starters) and baked in traditional bread ovens before being sold in independent bakeries (or small chains), or through a range of other local/regional outlets (for more detailed diagrams of these stages in the chain, see Appendices 9.1 and 9.2). Figure 1 provides a simplified flow chart (adapted from FAO 2013) that designates the system boundary for the entire chain. Figure 1: Model of UK wheat to bread supply chain Inputs -‐ global and local, incl seed, ferclizers and other nutrients Farmer Collectors/ grain distributors (incl. transport) Milling Input/ addicve suppliers (improvers, yeast etc.) Bakers Retailer Consumer Waste and spin-‐offs According to the Federation of Bakers, consumption trends in bakery are largely driven by: a) changes in the UK population; b) concerns over healthy eating; c) the need for convenience and) the desire for variety and increased awareness of other cuisines. The average UK household buys just over 80 loaves per year and spends an average of £75.0313. The average price of an 800g sliced white loaf is £1.31 (Office for National Statistics data), although it is possible to buy ‘value’ bread in supermarkets for as little as 47p (in the bread price wars of the early 1990s, supermarkets sold bread as a loss-‐leader, with some selling a loaf of sliced white for as little as 7p14). However, latest data from Mintel (2014) suggests that consumers ‘poor value for money perception’ of sliced white bread ‘does not bode well for the category in the future’ 12 http://www.sustainweb.org/realbread/facts_figures/ Accessed 7 October 2014 http://www.bakersfederation.org.uk/the-‐bread-‐industry/industry-‐facts/2012-‐01-‐23-‐15-‐53-‐01.html Accessed 3 October 2014. 14 http://news.bbc.co.uk/1/hi/business/6441577.stm Accessed 3 October 2014. 13 www.glamur.eu 14 and continuous discounting by the supermarkets poses a long-‐term threat for the market. The Mintel report points out that other operators have used the stages in the supply chain to highlight the processes invested in the product (e.g. in breakfast cereal production) and suggest that this could be a tool to help market value added and boost sales. Although there is evidence from the industrial chain that wheat-‐germ and bran from the milling process may be used for certain breads and cereals, sold as health foods, or blended into wheat feed for animal food 15, bread waste at the consumer level is increasingly in the spotlight and estimates put this as high as 32%16 of all bread bought. 2 2.1 Context of the case study How the chains were selected The GLAMUR theoretical framework, where four key dimensions are identified to differentiate local from global, was used to help identify the chains to be included in the case study research. Relationships between the four dimensions in the framework and stages in the wheat to bread chain are detailed below: i. The physical / geographical distance between production and consumption. Important dimension for: wheat provenance and distance travelled between cultivation, milling, baking and retail. ii. The type of governance and organization of the supply chain (degree of control of “local actors” and “global actors”) Important dimension for: regulation and legislation and level of integration along the chains. iii. The kind of resources, knowledge and technologies employed. Important dimension for: shaping the supply chain, including seed development and innovation in milling and baking techniques. iv. The way supply chain actors shape product identity, including the role of territory. Important dimension for: quality aspects and perception of the role and definition of ‘territory’ 15 http://www.grainchain.com/Resources/11-‐14/ip_wheat-‐into-‐flour-‐the-‐milling-‐process Accessed 11 February 2014 16 http://www.wrap.org.uk/sites/files/wrap/Research%20Bakery%20Report%20final.pdf Accessed 2 December 2013 www.glamur.eu 15 Using this framework, three supply chains were selected: a large industrial plant baker -‐ GC (more global); and two smaller chains with local characteristics -‐ an in-‐store bakery -‐ ISB (regional aspects), and a craft bakery chain-‐ CRFT (more local). These chains were also representative of the main categories of UK bread production, as defined in Table 1. Interviews were conducted with farmers, grain collectors, millers, bakers and retailers as key stakeholders along each of the chains. For confidentiality, codes have been used to protect the identities of the companies that participated and of individual stakeholders who were interviewed (see Appendix 9.3 for more details of stakeholders interviewed). GC – plant bakery: global GC is the largest family-‐owned bakery business in the country, managed by fifth generation family members, and employing around 4,500 people across the UK. The industrial chain is identified as global because although bread produced by GC is sold nationally, with UK supermarkets accounting for at least 80% of market share, the company also incorporates imported wheat (mostly from Canada) and other globally sourced inputs and additives that are used in the Chorleywood Baking Process (CBP). The case study focuses on the production of the traditional, everyday packaged sliced white loaf as GCs major bakery product but this is within the context of the range of breads produced by this plant bakery. Geography/distance Fifty per cent of the wheat is UK sourced by GC under contract from 300 farms with the other half mostly sourced from Canada (400 farms). Efficiencies in the chain have minimized transport distances at the national level and grain (from national and global sources) is delivered to 5 flour mills to ensure regional spread for distribution to 13 plant bakeries and onward distribution to 13 distribution centres located across the UK. The company delivers to 18,500 customer www.glamur.eu 16 retailers weekly, including all the major supermarkets; all GCs retail customers are located within 100 miles of a distribution centre (see Figure 3: sub-‐section 2.3). Governance As one of the largest grocery brands in the UK, control lies with GC who operates just-‐in-‐time systems to maximize value creation in the chain. GC has long-‐term contract commitments to its wheat suppliers (UK -‐12 years and Canada – 15 years) and has a 'Farmers Forum' in order to meet with growers and share ideas and information. Ninety-‐five per cent of the wheat is grown under contract, supplied through a farmer-‐owned cereal marketing co-‐operative, using only specified varieties which yield a specific protein content. GC also works closely with seed developers, with GC1 commenting that ‘genetics makes the loaf at the end of the day.’ Resources, knowledge, technologies GC produces more than 2 million bakery products daily. It has a range of 70 products and 26 of these are wrapped, sliced bread products. The company has made major investments into upgrading and building new bakery plants and upgrading distribution networks and logistics systems; it considers itself one of the most technologically advanced businesses in UK food manufacturing. GC has worked with the Carbon Trust on measuring its carbon footprint to help reduce environmental impacts and with the Waste & Resources Action Programme (WRAP) and is a member of the Roundtable on Sustainable Palm Oil (RSPO) and sourcing sustainable palm oil. Identity In line with other plant bakeries, GC’s range of bread products is packaged and heavily branded, following the trend towards innovative new product development and investment in marketing. Although GC prioritizes short supply chains, marketing does not include mention of the regional sourcing systems that are in place -‐ ensuring the wheat meets quality specifications is the major priority. Rating of the chain by interviewee on a local (score 0) to global (score 10) scale: Score 5 ISB - In-store bakery chain: regional/local ISB is part of a major UK supermarket chain with regional wheat to flour sourcing for onward distribution to 480 in-‐store bakeries that cook a range of breads from scratch. In 2010, ISB www.glamur.eu 17 became the first retailer to use only British flour in its own-‐brand sliced bread and in its in-‐store bakeries. In common with GC, ISB has a national distribution system and bread production also includes inputs/additives that are globally sourced. The case study focuses on the popular range of ‘bloomer’ style white loaves produced by ISB using regional wheat to flour sourcing within this context. Geography/distance Traceability in the supply chain enables a farmer owned, central storage co-‐operative to move 60,000 tonnes of regionally sourced wheat from 500 farms in a specific geographic region (Eastern region, England) to be milled by industrial, family-‐owned millers located 13 miles away in the Midlands. The regionally sourced flour then moves onwards to ISBs’ 13 distribution centres located through-‐out the UK for regional delivery as the supermarket’s own-‐label flour and to 480 of its national stores that bake bread from scratch (see Figure 4: sub-‐section 2.3). Governance By operating nationally, the chain demonstrates links with the industrial chain and minimizing distances is important to maximize efficiencies. ISB operates a closed loop ‘tried and tested’ supply chain where stakeholders -‐ the farmer-‐owned grain storage co-‐operative and regional industrial-‐scale mill -‐ work closely together with ISB to fulfil contractual specifications and quotas and increase economic efficiencies. Resources, knowledge, technologies The chain benefits from investment in advanced technologies. For example, the farmer-‐owned co-‐operative, acknowledging the increasing and exacting standards of the food industry, has invested in its infrastructure and logistics and even with the poor harvest in 2011-‐12 was able to segregate and blend the crops to meet quality specifications. In addition, ISBs Wheat Development Group carries out research into the benefits of new technologies, like for example GPS and precision farming and predicting protein levels in wheat with the added benefit of reducing nitrogen applications. The regional mill also employs latest technological advances including a wheat ‘peeling’ plant for the reduction of mycotoxins, bacteria and toxic heavy metals and collaborates with plant breeders to select and identify new and upcoming varieties of wheat each year. Stakeholders in the chain stress that the chain is very dependent on communication and on monitoring and adapting to changes in the chain; re-‐balancing and www.glamur.eu 18 logistics are key. The supermarket chain that operates ISB is also a member of RSPO and is sourcing sustainable palm oil in the baking process. Identity Guaranteed consistency of the regionally sourced flour has eliminated the need to import flour. ISB uses the national flag as a marketing device in its stores and for on-‐line sales. The supermarket has wider sustainability targets that include doubling the amount of British food sold by 2020, with a focus on its farmer and grower development groups. The stakeholder interviewed for the research (ISB1) stressed the company’s desire to support British farmers and to influence others in the supply base to follow suit. Average rating of the chain by interviewees on a local (score 0) to global (score 10) scale: Score 2. CRFT - craft bakery: local Reflecting observations in the UK national report about the role of local food providing an ‘important rural development contribution, given its potential to add value and for generating business and social innovations in both rural and urban areas’ (Keech et al 2014), the second local chain operates on a smaller more geographically confined scale in the rural region of East Anglia. CRFT is a local high street baker in East Anglia producing a range of cake and bakery products. The case study focuses on bread made from both local organic flour and flour milled in a nearby regional mill as part of a wide range of cakes and breads baked and retailed from the bakery (Figure 2). www.glamur.eu 19 Geography/distance This family-‐owned craft bakery (CRFT) uses local organic flour) that is stone-‐milled, packaged and distributed direct from the farm 12 miles away. Eighty per cent of flour sales from the farm are concentrated within 35 miles of the farm/mill which is the only operational mill for at least 30 miles, and 60% of sales are to local artisan bakers, with the rest concentrated in local supermarkets). Figure 2: Local chain: East Anglian region For other bread products, the bakery also uses flour from a regional family-‐owned flour mill. The mill sources much of the wheat from farmers based within a 25-‐30 mile radius of the historic mill site, including organic wheat to produce organic certified flour varieties. Many of these local farms (30) have supplied the mill for generations and all are members of the Assured Crops Scheme. In addition, family farms owned by the mill and located a few miles away also supply wheat to the mill. In order to improve functionality and meet quality requirements, the wheat is blended with high protein Canadian Red wheat when required and the mill uses one local grain co-‐operative and 1 or 2 local grain merchants. The mill also produces a range of artisan flours. The bakery also makes other breads that require imported specialist flours, yeast and other ingredients that are bought in small quantities, often through middlemen. Bread is sold direct from the shop, although wholesale (within a 14 mile radius) accounts for 40% of turnover (see Figure 5: sub-‐section 2.3). Governance Governance in the chain is more complex as it is not integrated in the same way as the industrial and ISB chains. Interviews with the local organic farmer/miller, regional miller and local bakery stressed the impacts of regulation/standards, including EU subsidies, organic standards and food safety regulation etc., in terms of their own individual businesses rather than the length of the chain. In addition, an organic trader, operating at a more industrial scale, identified the need to counter the challenges posed by imported grains that are not so highly regulated as those grown www.glamur.eu 20 in the UK. Comments reflected the challenges of operating on a small-‐scale within this highly industrialized sector where, for example, middlemen supplying the bakery with small quantities of ingredients can inflate prices and retail is dominated by supermarkets. Resources, knowledge, technologies Perceptions about technology and innovation varied amongst those interviewed depending on their scale of production and position in the chain. For example, the small-‐scale organic farmer found practices associated with being a Soil Association member (as the UK accredited organic body) quite restrictive and was looking to Denmark and Germany where he considered more modern techniques were being used for sustainable farming practices. A stone mill was used to mill the flour on the farm because it ran at slow speeds, thus preventing the flour from overheating and preserving essential nutrients. The milling process was producing fresh flours that contain no preservatives and do not undergo any bleaching processes. The regional more industrial-‐scale mill uses roller milling to produce most of the flour and employs new technologies to improve efficiency and production, including laboratory testing to ensure that the grain meets specifications, and for cleaning and blending. But traditional mill-‐stones, sharpened by hand every three months, were also used to produce some stoneground flours. The craft bakery, as a family-‐run business that has evolved over several decades, felt that its philosophy was based on constant learning and the necessity for progression but this was couched in terms of ‘small steps’ that led to improvements in the baking process and products. Identity Family businesses that have been established over a few generations dominate the chain (farm, miller and bakery) and personal contact was considered very important for doing business; this sense of local business identity combined being progressive with drawing from the past. In addition, the regional mill has a focus on supporting British independent bakeries and local food awards. Stakeholders also stressed the importance of quality. For example, the organic farmer/miller said ‘we are at the upper-‐end of the price bracket – it’s artisan flour for artisan bakers – and that’s what sells it’, and the baker/retailer felt this was one area where the supermarkets could not compete with the skills required for baking hand-‐crafted bread. Fermenting the dough and using traditional methods is a labour and time-‐intensive process that requires a small team to control quality and the bakery states that it is built on ‘the pillars of www.glamur.eu 21 Quality, Community, Value and Family’. Although the craft bakery was very well supported locally, it was also affected by seasonality with sales increasing by 100% from the summer tourist trade. Average rating of the chain by interviewees on a local (score 0) to global (score 10) scale: Score 2. Figures 3, 4 and 5 use the WFSC (World Food System Center) framework to delineate overlaps and differences between the more global, regional and local chains. Figures 3 and 4 demonstrate well the shared regional-‐national flow of processes for milling, distribution and retail for the global (GC) and regional (ISB) chains; whereas the activities of the local (CRFT) chain are concentrated at the local-‐regional levels. The figures also demonstrate inputs from the continental/global level in all three chains. Figure 3: WFSC UK wheat to bread supply chain – global/industrial (GC) www.glamur.eu 22 Figure 4: WFSC UK wheat to bread supply chain – regional (ISB) Figure 5: WFSC UK wheat to bread supply chain – local (CRFT) www.glamur.eu 23 2.2 Global-local issues in the supply chains This sub-‐section briefly discusses the main issues that are emerging from global-‐local debates about the wheat to bread supply chain within the national context; these debates are loosely grouped using the GLAMUR framework. Geography/distance As the discussion about the case studies makes clear (sub-‐section 2.1) all chains have both global and local inputs, but distances between UK wheat to flour production and distribution are minimized as much as possible and these stages of the chain mostly operate at regional (or local) levels regardless of scale. Interviewees revealed a range of perceptions about how stakeholders make distinctions between ‘local’ and ‘global’ (Table 2). The Trade Association interviewee made the point that boundaries vary according to country. In the UK, the local chain can be defined as 30 miles, whereas in the US this could be up to 500 miles. For him, the definition was more about when individuals know each other -‐ meaning that they lived locally to each other and met face-‐to-‐face in their day-‐to-‐day lives. Although he acknowledged that all supply chains are based on some kind of understanding/contract, global chains are paper-‐based and people don’t meet; for him, distance-‐related chains don’t make the same connections. However, and importantly, the wheat to bread supply chains can have ‘a local feel with global characteristics’ as is the case with GCs chain which starts in Canada but incorporates UK chains where grain is grown under contract and the chain has regional characteristics. In addition, organic mills can have local contracts but also import grain from Australia and Canada. ISB stakeholders defined ‘local’ as regional/national but also, reflecting the nature of relationships in this closed-‐loop supply chain, one stakeholder included the ability to respond quickly as an important local characteristic and another defined being global as people ‘pulling together’. In the more local craft chain, some defined ‘local’ as production and consumption within a defined geographic area, but there were also reservations about defining ‘local’ in terms of distance. One stakeholder felt that it is about being ‘more cuddly than a faceless corporation’ and, as another expressed it, ‘geography leads’ but there is a sub-‐set of values that concern consumer emotions. For example, the baker felt that customer perceptions of being ‘local’ focused on www.glamur.eu 24 himself as much as the product, and the role of trust, direct trading relationships with suppliers, and knowing the consumers was essential (see also O’Neill 2014). Table 2: Stakeholder perceptions of ‘global’ and ‘local’ Perceptions of Global GC (global) ISB (regional) CRFT (local) Other (national trade association) Governance Perceptions of Local ‘Anywhere outside UK’ People ‘pulling together’ 50 mile radius -‐ regional/national; -‐ ability to respond quickly. -‐ worldwide food shipping; -‐ can be specific geographic area -‐ less environmentally friendly; -‐ BUT reservations about defining in -‐ transport more important than terms of distance; product. -‐ ‘geography leads’ BUT sub-‐set of values that concern human emotions; -‐ being ‘more cuddly than a faceless corporation’; -‐ tied up with identity of local stakeholder as much as product itself; -‐ direct trading relationships; -‐ knowing the consumers. -‐ tends to be ‘paper-‐based’ and -‐ boundaries vary according to (scale people don’t meet; of) country; -‐ distance-‐related chains don’t make -‐ individuals know each other – live same connection’ (as local) locally/meet face-‐to-‐face. -‐ BUT ‘can have a local feel with global characteristics’. The vast majority of the UK wheat to bread chain operates with a high level of industrial organisation and governance (Barling et al 2009). This stretches from the development of new wheat varieties, to the handling of agricultural chemicals, to the addition of substances added to flour, and to the ingredients permitted in bread (Sharpe et al 2008). Although a consultation in 2013 on the UK Bread and Flour Regulations assessed whether there was still a benefit and need to continue adding calcium, iron, thiamine and niacin to wheat flour, this resulted in a decision to leave the current Regulation unchanged. However, new EU Food Information to the Consumer Regulations (FIR), that come into force from December 2014, means that current exemptions that allow these ingredients not to be labelled, will be revoked. The UK government www.glamur.eu 25 is currently consulting on the implications of this for British industry.17 Alongside these regulations, the wheat chain is also covered by: • • assurance schemes: private regulatory systems defined and policed by stakeholders in the sectors concerned to ensure that the supply base consistently meets specified standards of food safety and quality; contractual specifications: prescribe ingredients, processes and procedures and aim to ensure that stipulated standards of food safety, quality, consistency and product differentiation are met. For example, UK millers (operating at a commercial-‐scale) only purchase wheat that has been ‘assured’ and their trade association has a recommended Code of Practice that describes how millers expect suppliers to provide grain at intake and the checks and tests that need to be undertaken to comply with contractual obligations and food safety requirements18. There are issues at the local level with regard to farm saved seed as the practice has grown over the past 10 years as farms come under financial pressure or use more traditional practices. Royalty payments on farm-‐saved seed are compulsory19 and are linked to royalty rates on certified seed, although certain older varieties are zero-‐rated. However, small farmers, as defined under EU law, are exempt from the requirement to declare and pay for the use of farm-‐saved seed. Although Soil Association accreditation is regarded as important for marketing bread made with organic flour, Sharpe et al (2008) note that it is often hard to distinguish organic and conventional chains beyond the farm gate. The organic chain depends on the conventional chain for some supplies and distribution facilities and the conventional chain also deals in organic goods. Resources, knowledge, and technologies Technological innovation -‐ including not only improved logistics systems and precision technologies etc. but also innovations such as soil and land management practices that support biodiversity, more resource efficient baking processes etc.; research developments -‐ such as new advances in breeding wheat varieties and new thinking on nutritional quality in bread; and https://www.gov.uk/government/uploads/system/uploads/attachment_data/file/308449/bread-flour-statement-ofintention.pdf Accessed 3 October 2014. 18 http://www.nabim.org.uk/events-‐and-‐publications/publications/ Accessed 3 October 2014 19 The right of farmers to save seed of protected varieties and of plant breeders to charge a royalty on farm-‐saved seed became EU law in 1994 and was passed into UK law in 1998 (from BSPB website: http://www.fairplay.org.uk/faq.php Accessed 4 November 2014. 17 www.glamur.eu 26 better knowledge flows/information systems -‐ like for example, in the ISB closed-‐loop supply chain, have all led to more integrated and efficient supply chains at the industrial level. These efficiencies have had some negative impacts at the local level. For example, the organic farmer was unable to compete competitively with large-‐scale organic growers. In addition, the regional mill felt that health and safety regulations mitigated localizing which, in turn, meant heavier transport use. Although stakeholders at the local level acknowledged the need to be ‘as efficient as possible’, social, health and environmental concerns are more apparent at the local level than in the other market-‐driven chains. Identity/ role of territory The industrial and ISB chains are increasingly focussed on value added production, including product differentiation such as quality conventions and identity-‐preserved (IP) attributes in wheat sourcing (Magnan 2011), regional wheat sourcing, and production of more healthy and ‘artisan’ loaves.20 In earlier research, Barling et al (2009: 276) also note how a focus on provenance was emerging in the larger more industrial chains that mirrored some of the key characteristics of origin and place found in the smaller craft or artisan bread chains; they suggest that this new focus was linked to growing awareness of its marketing potential. In this study, the farm’s organic flour in the local chain is an important part of the identity of the craft bakery’s loaves and the baker felt that using local flours helped ‘alleviate global influences’ despite the fact its protein levels do not make it ‘the best flour in the world’ for bread-‐making. However, another small bakery owner resisted the role of territory as part of his identity because his business was driven by high quality, small batch baking rather than by being ‘local’; indeed, many of the ingredients he used were globally sourced. Marketing strategies also reflected the different scales of operation; the more global chains (GC and ISB) have sophisticated websites and powerful communication campaigns, supported by promotions within supermarkets and on-‐line shopping sites. As noted above, this enables them to adapt key marketing messages as consumer habits and concern with healthy diets become 20 See for example, http://www.bakeryinfo.co.uk/news/archivestory.php/aid/11945/Artisan_bread_trend_set_to_stay.html accessed 22 October 2014. www.glamur.eu 27 more prevalent. Without this scale of financial investment, staff and scale of operation, the situation is different at the local level for CRFT where individual stakeholders (farmer, miller, baker) have to rely on significantly fewer marketing resources and reliance on promoting quality attributes through word of mouth and, increasingly, social media. Stakeholders’ perceptions of where they placed their own chain on the local (0) to global (10) scale (see Section 2.1) is revealing. GC scored the industrial scale chain at 5 (mid-‐point) because 50% of the wheat is imported, and stakeholders for ISB and CRFT gave an average score of 2 in their chains. These scores provide a useful indicator for how stakeholders perceive the extent to which the global/local chains are entangled at every level. 2.3 System boundaries, characteristics and mapping The system boundary for the scope of this case study has been delimited and only accounts for stages in the value chain up to the point of sale, this includes: • • Primary processing – inputs (seeds, fertilizers etc.), farm cultivation, grain storage and distribution; Secondary processing – milling of wheat, mixing, proving (ingredients added), baking, slicing and packaging; Tertiary – retail • Although consumers have not been directly interviewed as part of the analysis, stakeholders’ perceptions of their influence have been sought, and aspects related to nutrition form part of the analysis in Section 5, as do issues related to waste and spin-‐offs. Figures 6, 7 and 8 show alternative and more detailed visualisations of the structures of the Industrial bakery chain (GC), the ISB regional chain (ISB) and the local craft bakery chain (CRFT). These provide visual representations of the different stages and show inputs on the global-‐local continuum. Numbers of stakeholders are also identified at the various stages. These mappings also show how the industrial chain (Figure 6) has more centralized, standardized systems that promote efficiencies and economies of scale that move bread to the supermarket, with some of these systems echoed in the ISB (regional) chain which incorporates national delivery systems, www.glamur.eu 28 whereas in the local craft bakery chain (Figure 8) systems are more diverse (as discussed in Section 2.1). Figure 6: Conceptual map of the industrial (more global) chain (GC) Figure 7: Conceptual map of the regional chain (ISB) www.glamur.eu 29 Figure 8: Conceptual map of the local chain (CRFT) Figures 9, 10 and 11 provide more detailed comparisons of the numbers of stakeholders at different stages in each of the chains. This effectively demonstrates some of the shared characteristics between the industrial and ISB chains, where wheat from hundreds of farms is funnelled through a minimal number of grain merchants and mills using supply chain efficiencies and scale of operation. However, the chains diverge at the bakery stage with only 13 industrial plant bakeries supplying 18,500 retail outlets in GCs industrial chain, whereas in the ISB chain, hundreds of retail stores have their own individual scratch bakeries. The depiction is different in the local craft bakery chain (Figure 11) where the chain becomes more fragmented as the local craft bakery operates using both the conventional (regional) chain and the local organic chain. Figure 9: Numbers of stakeholders – plant bakery: global Inputs suppliers farmers UK 300 Canada 400 grain merchants Canada 2 millers UK 5 bakers UK 13 retailers UK 18,500 www.glamur.eu 30 Figure 10: Numbers of stakeholders – ISB: regional Inputs suppliers farmers UK regional 500 grain merchants UK regional 1 millers UK regional mill 1 bakers UK naconal 480 retailers as for bakers Figure 11: Numbers of stakeholders – craft bakery chain: local Inputs suppliers farmers local organic 1 convenconal up to 30 grain merchants -‐ N/A millers local (on farm) 1 Regional 1 cras bakery 1 retails from bakery + local wholesale 2.4 Quality issues: production and processing Initial findings from this study and findings from interviews conducted in City’s previous research (Barling et al 2009) suggest a growing emphasis on quality attributes in both global and local chains. Barling et al (ibid, 273) found there was a tendency for many stakeholders to define quality as a checklist of attributes specified by the client: thus, to an industrial miller, it meant producing flour with the ‘assured functionality’ demanded by his industrial baker clients. To the industrial baker, it meant ‘meeting customer requirements’, as set out in specifications. A mass retailer distinguished between ‘legal compliance and compliance plus’, explaining that quality attributes which were ‘optional’ and added cost, such as some ethical quality attributes, might be included in premium products but excluded from cheaper versions. The earlier study also found that this tendency to standardize quality was more marked in the industrial than the craft chain and notes that “in the industrial chain, consistency was highly valued and producers saw it as their job to eliminate variation. In the craft chain, variation was valued.” With regard to production and processing, the scoping work for this study found that quality attributes were often prioritized over regional/local sourcing such as in the event of a poor www.glamur.eu 31 wheat harvest. For example, when asked about transport distances in GC’s supply chain, GC1 said that there was a tension between shorter routes and the distance travelled to where quality might be; in this case he said, “quality wins over distance”. In addition, acknowledging that markets are increasingly driven by food hygiene requirements, quality standards also drive the farmer-‐owned grain co-‐operative that supplies the ISB chain; the cooperative stressed that quality and efficiency is what drives off competition from cheap imports. For consumers, the earlier study found that quality was variously defined as good flavour and texture, nutritional value, freshness, keeping qualities and ‘naturalness’, and generally incorporated the idea that bread should be produced to reliably high standards (see also Gellynck et al 2009). In addition, Barling et al (2009) found that although bread consumption was shrinking in volume in the UK, there was a shift towards more premium, ethnic or speciality breads, including ‘artisan’ (more expensive) breads. Recent Mintel (2014) findings about consumer perceptions of ‘value-‐for money’ in the UK bread and baked goods sector also highlight how only 33% of those interviewed considered white sliced factory produced bread offered good value for money, with a percentage drop to 27% for ISB sliced white bread. Mintel concludes that this drop in how consumers value white bread does not ‘bode well for the future’. 2.5 Critical issues Sections 1 and 2 and the initial scoping for the full case study identified some critical issues for the UK wheat to bread chain as follows: i.) wheat provenance and climate where, for example, poor weather in 2012 had a heavy impact on the global and UK wheat crops which resulted in poor volumes and quality and more reliance on imports.21 ii.) seed breeding and wheat growing priorities and practices: seed developers and farmers aim to maximise yield and improve disease resistance but there is also increasing recognition of the 21 http://www.theguardian.com/business/2012/dec/04/bread-‐prices-‐uk-‐wheat-‐crop. Accessed 9 December 2014 www.glamur.eu 32 need to balance risk management and cut down GHG emissions (where less nitrogen fertilisers are required) and contribute to biodiversity management. iii.) concentration in the supply chain: industrial output is dominated by three major plant bakeries and retailing is dominated by UK supermarkets. iv.) GHG emissions: LCA studies have highlighted wheat cultivation and consumption as the main CO2 hotspots for industrial bread, including the need to ‘extend’ supply chain analyses beyond retail and consumption to include waste (Espinoza-‐Orias et al 2011). In addition, the energy efficiency of baking techniques, refrigeration and freezing are also issues for GHG emissions, especially in the ISB chain (EU Freshbake report22). v.) product composition and nutrition: is a growing issue for the industrial chain where for example, flour fortification has been under review by the UK government. vi.) increasing (re-‐) use of traditional baking techniques: there are issues related to a decline in bread consumption as consumer habits change, with nutritional value and health concerns becoming more of a priority; this is resulting in both innovation in industrial production to meet demand for more ‘artisan’ bread, and growth in the craft/artisan sector as consumer demand grows for hand-‐crafted loaves associated with ‘localness’ and other quality attributes. 3. Research design 3.1 Research questions This awareness of critical issues in the UK wheat to bread chain (outlined above in sub-‐section 2.4) informed the process for selecting the attributes and indicators (detailed below in sub-‐ sections 3.2 and 3.3). In parallel, and with reference to the over-‐arching research questions (detailed in Section 1), key research questions emerged. These aimed to: incorporate the critical issues that had been identified and address distinctions and connections/inter-‐relationships 22 http://cordis.europa.eu/result/rcn/47299_en.html Accessed 9 December 2014 www.glamur.eu 33 between local-‐global wheat to bread supply chains; to capture key attributes in the five performance dimensions (economic, social, environmental, health, ethical) and in the public, scientific, market, and policy spheres; and to gather data for the indicators. These questions were further refined as the process of selecting the attributes and indicators progressed. The final research questions: 1. How do approaches to biodiversity impact on how global-‐local wheat to bread chains are innovating and adapting? 2. How is technological innovation affecting performance in global-‐local wheat to bread supply chains? 3. To what extent are stakeholders in global-‐local chains making use of traditional production processes and preservation of local knowledge? 4. How are issues related to nutrition impacting on product development and consumer choice in global-‐local chains? 5. To what extent does communication and availability of information benefit stakeholders in global-‐local chains? 3.2 The attributes The critical issues for the UK wheat to bread chain, noted in Section 2.5, built on initial scoping work conducted in the Quick Scan (preliminary observation of the chains, interviews, and literature review). This process began to direct the selection of scientifically sound attributes (and indicators) that are critical to the case study work (SAFA Guidelines, FAO 2013). In addition, the UK and Italian teams met in Rome and agreed that the following criteria were key factors for making distinctions between global and local in the wheat to bread chain: source of wheat, size of the market, technological innovation, governance, and intention to be local/global (Figure 12). www.glamur.eu 34 Figure 12: what distinguishes the boundaries between global and local wheat to bread chains source of wheat intencon to be global/local governance size of market technological innovacon 3.2.1 Checking the 24 attributes The UK team then went on to consider this initial evidence in the light of the full set of 24 attributes that had emerged at the end of WP2 as the performance criteria matrix for assessment and comparison of food chains (Kirwan et al 2014). In addition, the Quick Scan and previous research conducted by City University (see for e.g. Sharpe et al 2008) had provided evidence that some of the 25 country-‐specific attributes, identified by the UK national report in WP2 were important factors in the way that UK wheat to bread chains are innovating and adapting. For example, in the industrial chain there was an emphasis on transparency, resource use, efficiency, affordability, food safety, communication along the chain and technical innovation, and in the more local chain, issues of trustworthiness, food miles (transport), biodiversity and nutritional quality rise to the surface. 3.2.2 Selection procedure From this analysis, using the list of attributes identified in WP2, a provisional list of attributes emerged (highlighted in bold) with specific relevance for the case study -‐ this covered all five performance dimensions: www.glamur.eu 35 Affordability Creation and distribution of added value Technological innovation Governance Efficiency Profitability/competitiveness Connection Resilience Food waste Information and communication Food security Consumer behaviour Territoriality Labour relations Resource use Pollution Biodiversity Nutrition Food safety Traceability Animal welfare Responsibility Fair Trade From this initial list of attributes that had emerged from the initial scoping and consultation with key stakeholders along the chains, the UK team also considered important secondary sources of evidence (qualitative and quantitative) to help with the final selection of attributes and identify criteria for evaluation. This included: previous research on the wheat to bread chain conducted by City University (Sharpe et al 2008; Barling et al 2009); Department of Food and Rural Affairs (Defra) Statistics and studies on wheat and bread conducted for Defra’s Green Food Project (2012); relevant EU-‐project research (see for e.g. http://www.breadshare.co.uk/project.htm); and, more specific to the environmental dimension, LCA studies on bread (see for eg. Espinoza-‐ Orias et al 2011), data from the Carbon Trust (2012) on energy efficiency, and data from WRAP (2013) on waste. The UK and Italian teams then worked together to identify a set of common attributes that had emerged from these initial context-‐specific analyses in each country. From this, the teams concluded that: biodiversity, technological innovation, nutrition, and information and www.glamur.eu 36 communication would provide global-‐local comparisons at every stage of the chain in order to make country comparisons in the next stage of research (WP4) and cover relevant spheres and performance dimensions: • biodiversity is associated with the initial inputs (seeds etc.) and farming (sphere: scientific; performance dimension: environmental); • technological innovation with seed development, farming, storage, milling, baking and distribution/retail (spheres: market and scientific; performance dimensions: economic and environmental); • nutrition with farming, milling, baking, retailing and the consumer (spheres: public, scientific and policy; performance dimension: health); • information and communication is associated with farming, milling, baking, retailing and the consumer (spheres: public, market; performance dimension: social). It was noted that the attributes selected did not directly incorporate the ethical dimension as defined by the WP2 framework. However, ethical concerns were woven in as part of the analyses for the attributes; this is expanded below. Evidence supporting: Biodiversity Definition of biodiversity in the UK wheat to bread supply chains The WP2 report states that biodiversity “… refers to the ability of food supply chains to preserve the stock of natural resources […]Biodiversity creates some conflicts. Essentially there is a divide between technological and traditional perspectives.” In the UK context, the WP2 national report also notes that biodiversity appears as a relatively low priority in UK food chain discourse where environmental debates tend to focus on availability of energy resources and of land, and about the implications of climate change. However, the topic is more contested in relation to efforts by land managers and NGOs to protect particular species or habitats, especially with regard to GM technology. At the policy level, recent work by DEFRA’s Green Food Project Wheat Sub-‐ Group (2012(a.)) talks in terms of sustainable intensification; this involves: www.glamur.eu simultaneously raising yields, increasing the efficiency with which inputs are used, and reducing the negative environmental impacts of food production. It requires economic and social changes to recognise the multiple outputs required of land 37 managers, farmers and other food producers and a redirection of research to address a more complex set of goals than just increasing yield (Foresight, 2011). The WP2 national report also notes that ‘sustainable intensification is a prominent pre-‐ occupation of the policy sphere in the UK and illustrates the acceptance and promotion by policy makers of scientific-‐technological solutions to global food supply chain challenges. The definition of biodiversity within the UK wheat sector as the key component in the wheat to bread chain (the UK had a total wheat area of 1.96Mha in 2014, up 22% on 2013 (AHDB/HGCA planting and variety survey 2014) -‐ is defined within these concepts and analyses, supported by the idea of taking a ‘systems approach’ to agriculture in order to achieve improvements in yield, environmental outcomes and resource use efficiency; thus, inputs (seed development, nutrients, fertilizers and pesticides) and wheat farming practices, are key stages in the global/ local chains for the biodiversity attribute. Why biodiversity is important in the chain The largest environmental impacts from bread are associated with the primary production end of the industrial supply chain. Starting at the beginning of the chain, seed development is regulated by the EU and then the UK incorporates further tests for seed varieties to be included on the country’s national Recommended List. This List is produced by the UK cereals advisory body, the Home Grown Cereals Association (HGCA), where traits desired by growers and processors, such as yield or suitability for breadmaking, or by policy makers, such as disease resistance (to enable less pesticide use) are prioritized; eight seed-‐breeding companies in the UK have wheat programmes but only one is UK owned. In 2014, the annual Recommended List contained 40 wheat varieties. Seven varieties, including two for spring wheat (Group 1) account for 95% of UK bread production, preferred for their high levels of appropriate quality proteins that meet performance specifications for flours (the current industry standard is 13%) and baking performance. However, current farming practices need high levels of nitrogen-‐based fertilizers to ensure high yields and the required protein levels are reached in wheat production which has major impacts on the environment, including www.glamur.eu 38 water quality, air quality, GHG emissions, ecosystems, biodiversity and soil quality. Current research aims to develop new breeds that make more efficient use of nitrogen and others, for example, advocate precision agriculture as an important way of improving nutrient use efficiency (and reduce the amount of nitrogen fertilizer required). This also requires improved farm management practices, including integrated farm management, so that more land is farmed under environmental management schemes. In 2012, nearly 7 million hectares were under entry-‐level type schemes (68% of available land in England; 26 % in Wales; and 7% in Scotland) with less than 3.4 million hectares under higher-‐level or targeted agri-‐environmental agreements.23 As discussed under ‘Governance’ in global-‐local chains (sub-‐section 2.2), the practice of using farm-‐saved seed has grown over the past 10 years or so in the UK but has more particular resonance at the global level where the practice increases agricultural biodiversity and helps farmers and researchers find varieties of crops that grow better in different regions, especially as the impacts of climate change become evident24. There is controversy over whether sustainable intensification should rely on improved commercial wheat varieties (including GM) or on agro-‐ecological methods that include better crop management, crop rotation and soil fertility (Bonny, 2014). For example, acknowledging that wheat populations are a valuable source of diverse genetic resources, research has been looking at how varieties can be best utilized by farmer-‐breeders to create locally adapted varieties and breeds that are adapted to site specific conditions (known as participatory plant breeding)25. In addition, Andrew Whitley (2009) argues that advancing the functional properties of wheat has completely over-‐ridden considerations of ‘nutritional quality’ which were much higher in the precursors to modern wheat, like, for example, varieties such as einkorn, emmer and spelt. Critical points – possible indicators • crop breeding to enable sustainable intensification in farming and resource 23 http://jncc.defra.gov.uk/page-‐4242 Accessed 23 October 2014 http://foodtank.com/news/2013/07/fifteen-‐seed-‐saving-‐initiatives-‐protecting-‐biodiversity-‐for-‐future-‐generati Accessed 4 November 2014 24 25 http://www.organicresearchcentre.com/manage/authincludes/article_uploads/annual_producers_conference/201 4/Fradgley_PPB.pdf Accessed 20 October 2014 www.glamur.eu 39 • • • efficiency in the chain; farm environmental management schemes/eco-‐system management for enhanced biodiversity protection; locally-‐adapted, including farm-‐saved/heritage/organic wheat varieties versus commercial wheat varieties; better flows of information along the chain to change behaviour and improve biodiversity -‐ commercial advice to farmers tends to focus on productivity, whilst public advice tends to focus on the environment. Evidence supporting: Technological Innovation Definition of technological innovation in the UK wheat to bread supply chains The WP2 report states that technological innovation “represents the applications of advancements in scientific knowledge in farming, food manufacturing and transportation, which are or could significantly affect food chain performance.” In the UK context, the WP2 national report also notes that, “technological innovation is a pre-‐eminent scientific strategy to protect food security by extending the productive capacity of nature, reducing environmental impacts of the food chain and helping consumers adapt their dietary patterns […] A change in government and cuts in public spending have resulted in a stronger emphasis on supporting industry-‐led innovation”. As discussed under the attribute biodiversity, wheat production impacts on the environment in a number of ways which are being addressed through bio-‐tech and genetic innovations and through better agro-‐ecological farming practices, but the milling and baking processes, distribution and retail (and ultimately consumption and waste) also add to these impacts; thus farming, milling, baking and distribution are key stages in the chains for the attribute technological innovation. Why technological innovation is important in the chains A recent report by the DEFRA Green Food project on bread (DEFRA 2012 (b):2) states that the largest environmental impacts for the industrial wheat to bread chain occur at the primary end of the supply chain, where almost 40% of GHG emissions come from wheat production. However, it goes on to note that post-‐farm gate, “environmental and economic savings can be made by focusing on energy efficiency, transport and packaging impacts, and influencing consumer behaviour,” and that resource use efficiency (primarily energy use) provides the main www.glamur.eu 40 opportunity for improvement in bread manufacture. There have been life cycle assessment (LCA) studies that highlight issues connected to resource use efficiency in the industrial chain (see Espinoza-‐Orias et al 2011) and other studies highlight first (figure 13), how life cycle stages contribute to the carbon footprint of bread, and second (figure 14) how identifying these ‘hotspots’ can be used to target waste reduction in the chain. Figure 13: UK bread manufacturing: contributions of life cycle stages to carbon footprint (from Green Food Project: Bread sub-‐group report, DEFRA, July 2012) www.glamur.eu 41 Figure 14: UK Hotspots – bread and rolls (from Hotspots, opportunities and initiatives: Bread and Rolls, Product Sustainability Forum (WRAP), May 2013. Further work on the industrial baking sector by the Carbon Trust26 also considered how the industry could significantly reduce its CO2 emissions by improving the efficiency of sector-‐ specific manufacturing processes, including improving the combustion efficiency of ovens and recovering the heat loss from ovens. In addition, the scoping work and more detailed case study work for this project have indicated that although more sophisticated transport and logistics systems in the industrial and regional bread chains have cut down transport distances, the number of individual small suppliers delivering to rural businesses has increased. Finally, although there is no detailed data on consumer use, evidence suggests that bread use in the home contributes to a quarter of the total impacts from energy use through toasting, freezing, refrigeration etc. (Espinoza-‐Orias et al 2011). 26 https://www.carbontrust.com/media/206476/ctg034-‐bakery-‐industrial-‐energy-‐efficiency.pdf Accessed 23 October 2014 www.glamur.eu 42 In addition, as highlighted in sub-‐section 2.5, the rise in ‘artisan’ and craft bread sales has resulted in a growing interest in the use (and re-‐use) of traditional baking techniques. This includes not only traditional baking processes but also innovation and adaptation by the industrial sector like for example, the introduction of sour dough processes to produce bread with more ‘artisan’ like qualities in supermarket ISBs. Critical points – possible indicators • • • • technological innovation to optimize resource use efficiency and minimize losses, including storage of wheat; reduction of CO2 emissions by improving the efficiency of sector-‐specific manufacturing processes, especially energy usage in baking processes; (re-‐)use of traditional baking techniques; information flows/knowledge transfer along the chains to support take-‐up of new and innovative technologies. Evidence supporting: Nutrition Definition of nutrition in the UK wheat to bread supply chains The WP2 report states that nutrition is “principally concerned with the nutritional qualities associated with food in terms of its composition and ability to contribute towards physical health and well-‐being.” It also concludes that “(t)he nutrition attribute in many respects offers a critical point of differentiation for local food chains, with most national studies reporting that local/shorter food chains are generally superior in terms of enabling access to fresher and more seasonal foods. Larger transportation and storage burdens associated with global chains, especially for fresh food commodities, are seen as affecting nutritional quality”. In the national context, the WP2 report uses the attribute ‘nutritional quality’ and, in this definition notes that “foods may be understood to be of low nutritional quality (when they contain) high levels of fat, sugar or salt”. It adds that “global discussions are associated with how technological innovations and product development can tailor nutritional qualities in foods to the economic and cultural circumstances of different countries.” The definition of nutrition in the wheat to bread chains is defined within this contextual analysis. Nutritional quality concerns the protein quality in the wheat, how the wheat is milled (i.e. what proportion of the nutrients remain/are removed by the process), and the usage/impacts of the range of additives that are integral to the baking process. In common with the findings in WP2, www.glamur.eu 43 the attribute is also strongly linked with consumer behaviour, including attitudes and perceptions related to health and healthy diet; thus farming, milling, baking, retailing and consumption are key stages in the chains for the attribute nutrition. Why nutrition is an important attribute in the chains There is a wealth of evidence and data on product composition for the wheat to bread chain in the UK. Data drawn from the National Diet and Nutrition Survey (NDNS) suggests that bread still contributes more than 10% of the UK populations’ daily intake of protein, thiamine, niacin, folate, zinc, iron, copper and magnesium; 20% of fibre and calcium intakes; and more than 25% of manganese intake (O’Connor, 2012). White bread remains the most commonly consumed bread (nearly 60%), although this is declining (DEFRA figures 2000-‐2010 show an average 39% decrease per person). The milling process for the industrial production of white flour results in nutrient loss from the grain because of the loss of bran (fibre and phenolic compounds which mostly go to animal feed) and germ (composed of vitamins, minerals, fats and some protein). As previously mentioned, the UK Bread and Flour Regulations (FLR) 1998, requires the nutrient content of white and brown bread to be restored by fortification (iron, calcium, thiamine and niacin) in-‐line with the nutrient content of wholemeal flour where milling does not remove these nutrients. Mention was also made in sub-‐section 2.2 of a consultation in 2013 on the FLR Regulations to assess whether there was still a benefit and need to continue adding these nutrients; this resulted in a decision to leave the current Regulation unchanged. However, new EU Food Information to the Consumer Regulations (FIR), that come into force from December 2014, means that current exemptions that allow these ingredients not to be labelled, will be revoked. According to trading standards advice27, “bread, including white bread, which contains any of the following types of additives: antioxidants; sweeteners; colours; flavour enhancers; flavourings; preservatives; flour treatment agents must have a notice that clearly and conspicuously tells customers which of those types of additives are present” (see Real Bread Campaign report (2010)28 for earlier discussion on additives and labelling in ISB bread). Bread is the largest contributor of salt to the UK diet and a recent voluntary initiative within the 27 http://www.tradingstandards.gov.uk/cgi-‐bin/glos/bus1item.cgi?file=*BADV620-‐1001.txt#tsi2 Accessed 23 October 2014. 28 http://www.sustainweb.org/pdf/are_supermarket_bloomers_pants.pdf Accessed 23 October 2014 www.glamur.eu 44 industrial bread sector has resulted in a progressive reduction towards meeting the 1g/100g target. In a recent study of packaged supermarket bread, Brinsden et al (2013) found a reduction of 20% in bread surveyed between 2001 and 2011. There is also a range of literature on issues connected with nutritional value and health that also incorporate ethical concerns; such issues concern, for example, the use of enzymes and big increases in the amount of yeast used in the industrial process to speed up metabolic reaction, to the apparent increase in gluten intolerance amongst the population over the past 20 years, to the return to sourdough cultures in traditional/’artisan’ baking and more use of organic and stone ground flours that remain high in natural nutrients (see for example: Whitley, 2009). Critical points – possible indicators • nutritional qualities (product composition including fibre, fat, salt); • impacts of traditional versus industrial processes on nutritional value. Evidence supporting: Information and communication Definition of information and communication in the UK wheat to bread supply chains The WP2 report states that information and communication relates to the market and the idea that “there needs to be a constant flow of information, and that actors need to be able to access this [information] in order to improve their engagement with the market and develop a risk strategy;” and, in addition, the WP2 definition also refers to the consumer, including “the amount and quality of information that is communicated to consumers together with the product being sold, so that they are able to make a more informed purchasing decision.” In the national context, the WP2 report does not use the communication and information attribute but focuses on related attributes; namely, connectivity and transparency -‐ and these add to the scope of the WP2 definition. For example, connectivity makes more specific reference to the personal relationships that underline many food chains within their local contexts, including the quantity and quality of those relationships; and transparency highlights the importance of product and operational integrity, including how open food chain operations are to independent scrutiny at specific points of supply chain interactions (e.g. between supplier and retailer), and in being able to provide assurances for consumers that food is safe and trustworthy. www.glamur.eu 45 The definition of information and communication in the wheat to bread chains is defined within this contextual analysis. This acknowledges that how stakeholders communicate – and whether this is beyond the first tier – makes a difference to how well the supply chain operates, adapts and innovates. In addition, the quality and depth of information available to consumers influences their decision-‐making and purchasing behaviour; thus farming, milling, baking, retailing and consumption are key stages in the chains for the attribute communication and information. Why information and communication is an important attribute in the chains Communication between stakeholders along the chain may enable economic efficiencies to be made (that can in turn affect affordability), lower environmental impacts, and improve the nutritional quality of final bread products. Likewise, when information is made publically available, this can impact on consumer behaviour by addressing ethical issues associated with greater transparency/traceability for the chain including labelling, building trust in company operations and the product, and by encouraging more healthy and sustainable eating. These are ideas that both UK local and global wheat to bread chains share in common but because of scale, different approaches are taken. For example, Section 2 highlighted how just-‐in time systems in the global chain, the closed loop supply chain at the regional level, and the more localized, personal relationships in the smaller-‐scale craft chain affected how well the supply chains performed. In addition, there is evidence that public information is used as an important marketing tool in all three chains. Company websites and, increasingly, social media play crucial roles in how the UK wheat to bread chains get their message across to consumers. Critical points: possible indicators • communication between stakeholders along the chain; • communication beyond first tier; • level and accessibility of publicly available information. 3.3 The indicators Once the attributes had been selected, constructing the indicators involved four key stages. First, the critical points/possible indicators identified when reviewing the evidence for each attribute (see above -‐ sub-‐section 3.2.2) were prioritised; these highlighted important aspects www.glamur.eu 46 for identifying differences/similarities between local-‐global chains that had emerged from interviews conducted with stakeholders and from current literature reviews, including LCA studies on the wheat to bread chain. Second, working with the Italian team, indicator selection was guided by the SAFA list of indicators (FAO 2013) and the list compiled by GLAMUR project partners. This followed the requirement to select comparable qualitative and quantitative performance indicators to cover the five dimensions and ensure key stakeholders were involved at every stage of the chain. Third, awareness that other practical considerations were critical for data collection and analysis, the team also chose indicators, after formal/informal consultation with field experts, for which data would be readily available at each stage in the chain. Fourth, indicators were selected in order to meet the needs of the research questions. Table 3 details the indicators selected and provides details of their construction process. This includes a brief definition of each attribute, the selection methodology for relevant indicators (participatory, literature review etc.), the final indicators selected (and agreed with Italy), and the source used. It should be noted that there was awareness that some of the indicators selected linked to other attributes. For example, those selected for technological innovation also link to resource use, pollution etc. However, in the light of the other evidence presented, the team chose what they considered to be the attribute and indicators with the strongest link to the specific case study under consideration in order to provide the best means of rating each indicator bearing in mind the geographic/ environmental, social, political and economic context of the UK wheat to bread local-‐global chains, to carry out the comparative study with Italy, and to answer the research questions posed. www.glamur.eu 47 Table 3: Construction of the indicators Brief attribute description (cf. Comparative Report) Attribute Biodiversity “… refers to the ability of food supply chains to preserve the stock of natural resources […]Biodiversity creates some conflicts. Essentially there is a divide between technological and traditional perspectives.” Selection methodology Evidence from assessment of biodiversity attribute; interviews and literature review; SAFA list; advice from Italian expert; data availability; relevant for research questions 1,2,3,4. Evidence from assessment of biodiversity attribute; interviews and literature review; SAFA list; informal advice from UK experts; data availability; relevant for research questions 1,2,3,4. Technological innovation Nutrition “represents the applications of advancements in scientific knowledge in farming, food manufacturing and transportation, which are or could significantly affect food chain performance.” Evidence from assessment of technological innovation attribute; interviews and literature review; SAFA list; informal advice from UK experts; data availability; relevant for research questions 1,2,3,4. “principally concerned with the nutritional qualities associated with food in terms of its composition and ability to contribute towards physical health and wellbeing.” Evidence from assessment of nutrition attribute; interviews and literature review; advice from UK experts; data availability; relevant for research questions 2,3,4,5 “..relates to the market […]idea that there needs to be a constant flow of information and that actors need to be able to access this in order to improve their engagement with the market and develop a risk strategy.” “…refers to the amount and quality of information that is communicated to consumers together with the product being sold, so that they are able to make a more informed purchasing decision.” Evidence from assessment of information and communication attribute; interviews and literature review; informal advice from UK experts; data availability; relevant for research questions 3,4,5 Indicators selected Source of indicator and SAFA code (if applicable) -‐ locally adapted varieties and breeds SAFA (E4.3.3) -‐ on farm eco-‐system management at national level SAFA adapted (E4.1.2) -‐ innovation to reduce GHG emissions SAFA adapted (E5.2.2) SAFA adapted (E5.3.2) -‐ innovation to reduce waste reduction and disposal -‐ metrics in place to support sustainable packaging -‐ use/re-‐use of traditional production processes and preservation of local knowledge -‐ salt content SAFA adapted (E5.1.1) GLAMUR GLAMUR -‐ fat content GLAMUR Information and communication communication between stakeholders along chain -‐ availability of information to consumers GLAMUR GLAMUR www.glamur.eu 48 Table 4 summarizes: the dimension of each attribute; the brief definition of each attribute (taken from the WP2 reports); the indicators selected; the relevant research questions for each indicator; and introduces the data collection methods which are expanded below in Section 4: Methods. Table 4: Synoptic table Dimension Attribute environmental Biodiversity economic and environmental Technological innovation Health Nutrition Social www.glamur.eu Information and communication Brief attribute description (cf. Comparative Report) “… refers to the ability of food supply chains to preserve the stock of natural resources […]Biodiversity creates some conflicts. Essentially there is a divide between technological and traditional perspectives.” “represents the applications of advancements in scientific knowledge in farming, food manufacturing and transportation, which are or could significantly affect food chain performance.” “principally concerned with the nutritional qualities associated with food in terms of its composition and ability to contribute towards physical health and wellbeing.” “..relates to the market […]idea that there needs to be a constant flow of information and that actors need to be able Indicators - locally adapted varieties and breeds (SAFA E4.3.3); Research questions 1,2,3,4 • “Desk based” research: documentation and literature review • Interviews with farmers, grain merchants, millers, bakers. 1,2,3,4 • “Desk based” research: documentation and literature review • Interviews with farmers, grain merchants, millers, bakers 2,3,4,5 • “Desk based” research: documentation and literature review • Interviews with farmers, grain merchants, millers, bakers, retailers. 3,4,5 • “Desk based” research: documentation and literature review, including web-sites. • Interviews with farmers, grain merchants, millers, - on farm ecosystem management at national level (within UK/Italy) - innovation to reduce GHG emissions - innovation to reduce waste reduction and disposal - metrics in place to support sustainable packaging - (re-)use of traditional production processes and preservation of local knowledge - salt content - fat content -communication between stakeholders along chain Data collection methods 49 to access this in order to improve their engagement with the market and develop a risk strategy.” “…refers to the amount and quality of information that is communicated to consumers together with the product being sold, so that they are able to make a more informed purchasing decision.” 4. 4.1 - availability of information to consumers bakers, retailers. Methods Processes used for assessment of the indicators The SAFA Guidelines (FAO, 2013: 48) describe performance based and practice based indicators as follows: • • Performance based indicators are focused on the results of compliance with an objective and can measure the performance of an operation, identify trends and communicate results; and Practice-‐based indicators are focused on prescribing the necessary tools and systems required to be in place, best practices. These indicators are process rather than outcome-‐oriented […] The cause-‐effect between a given practice and a result is however never precise; […] Thus, one can assume that a practice may yield a desired result but with a substantial margin of error. Although the UK team was aware the SAFA Guidelines state that “performance-‐based indicators are more relevant and effective than practice-‐based indicators in demonstrating performance and impacts”, those selected included a mixture of both types of indicators. Practice based indicators were more suitable to the largely qualitative data collection methods, including the participatory approach employed, and, echoing IATP (Kleinschmit et al, 2014), it was acknowledged that food systems operating at the local level are often not in a position to provide detailed data sets. Thus, criteria devised for assessment of the indicators was based on integrating analyses determined by stakeholder-‐specific interests and values gathered from the semi-‐structured interviews, with verifiable analyses from secondary data sources (practice based), and, for the attribute nutrition, assessment was based on the degree of compliance with national nutritional guidelines and the indicators were performance based.29 29 These are issues also being tackled in tool development for the integration of social/socio-‐economic aspects into life cycle assessment (LCA) (see Smith and Barling, 2014) www.glamur.eu 50 In addition, the values and qualitative descriptions that helped define each indicator were benchmarked to set the performance level and rate its sustainability performance. From this a rating of the sustainability performance for each attribute and each individual chain was calculated, and comparisons of performance levels between the global, regional and local chains as a whole were calculated; this process is described below in sub-‐section 4.2 4.2 Benchmarks: methods used for their definition and calculation As previously described the need for additional advice (formal and informal) was also sought from experts for benchmarking the indicators. However, the team combined these opinions with knowledge gained from interview data from stakeholders in the earlier scoping work for the full case study, and with data from review of relevant scientific studies. For example, data from the Consensus on Action for Salt and Health (CASH) was used to help determine low and high values for benchmarking salt, and recommended national guidelines for fat levels in food were used to determine benchmarks for fat levels in white bread. The team tried to factor in the influence of policies on performance and other underlying factors, like, for example, the UK’s Climate Change Act, introduced in 2008 and its impact on GHG emissions (as one of the indicators for technological innovation) over the past 6 years. In addition, the benchmark for ‘traditional production processes’ (technological innovation) was defined by the team’s earlier research study i.e. the bulk fermentation process (BFP) using traditional methods where dough is left to ferment and rise (with increasing use of sour dough starters) and bake in traditional bread ovens (see sub-‐section 1.2). Table 5 presents the processes used for the assessment of how each indicator is defined, including the relevant stages of the chain to which it applies, and presents the benchmarks adopted for each indicator, including the low-‐high performance values used for calculation purposes. www.glamur.eu 51 Table 5: Indicator assessment, benchmark definition and calculation Attribute Biodiversity Indicator Definition -‐ locally adapted Standard commercial varieties only (1); current practice includes deliberate use of varieties adapted to local conditions to assist biodiversity (2); current practice includes deliberate use of heritage/traditional varieties as part of planned biodiversity measures (3). i.) Farmers growing to minimum EU standards; ii) membership of recognized environmental management schemes. varieties and breeds -‐ on farm eco-‐ system management at national level Technological innovation -‐ innovation to reduce GHG emissions -‐ innovation to reduce waste reduction and disposal -‐ metrics in place to support sustainable packaging Nutrition -‐ use/re-‐use of traditional production processes and preservation of local knowledge -‐ salt content -‐ fat content Information & communication GHG mitigation practices implemented within past 6 years in: i.) wheat production and storage; ii.) milling; iii.) baking processes; iv.) distribution systems. Timescale based on introduction of new UK legislation introduced in 2008. Waste reduction & disposal innovations within past 6 years in: i.) wheat production and storage; ii.) milling iii.) baking processes; iv.) retail/distribution systems. Bread packaging: non-‐recyclable (0); part of packaging is recyclable (1); all recyclable packaging (2);recyclable packaging from responsibly sourced materials (3); recyclable packaging from responsibly sourced materials and recycling instructions (4). Practical use of traditional production processes and preservation of local knowledge. UK voluntary salt reduction target (FSA)) is salt content of white bread per 100g -‐ ≤1.0g/100g . ≥ 1.5g (0); 1.5 -‐ ≥ 1.00g (1); 0.5 -‐ 1.00g (2); ≤ 0.5g (3). UK national guidelines definition for low fat fat content is 3g or less per 100g. ≥ 3g (0); 3g-‐ ≥1 (1); 1g-‐ 0 (2). -‐ communication between stakeholders along chain i.) communication between stakeholders confined to first tier (1); ii.) communication beyond first tier (2). -‐ availability of information to consumers i.) meets legal requirements (1); ii.) exceeds legal requirements via enterprise-‐related materials (e.g. web-‐site, product labelling) (2); iii.) evidence of provision of information that exceeds legal minimum via whole supply chain mechanisms (e.g. traceability systems) (3). www.glamur.eu Unit Stages of chain Benchmark Low High Qualitative. Practice based indicator Successive qualitative targets. 1-‐3 categories available Target values. No/yes. Scoring range 0 -‐ 2 Target values. No/yes. Scoring range 0 -‐ 4 Qualitative. Practice based indicator Target values. No/yes. Scoring range 0 -‐ 4 0 4 Successive qualitative targets. 0 -‐ 4 categories available 0 4 Target values. No/yes. Scoring range 0 -‐ 1 0 1 Target range. ≥ 1.5g -‐ ≤ 0.5g ≥ 1.5g Qualitative. Practice based indicator Qualitative. Practice based indicator Initial inputs (seeds etc.) and farming Farming Qualitative. Practice based indicator Seed development, farming, storage, milling, baking and distribution/ retail Qualitative Practice based indicator Qualitative. Practice based indicator 3 0 2 0 4 Qualitative. Practice based indicator g/100g. Performanc e based indicator g/100g Performanc e based indicator 1 Farming, milling, baking, retailing and the consumer Target range. ≥ 3g ≥ 3g -‐ ≤1g Farming, milling, baking, retailing and the consumer Successive qualitative targets. 1-‐2 categories available Successive qualitative targets. 1 -‐ 3 categories available 52 ≤ 0.5g ≤1g 1 2 1 3 4.3 Methods used for data collection Phase 1 For the initial scoping for the case study, a set of questions was constructed for conducting semi-‐structured interviews use in the initial scoping interviews with stakeholders in the identified chains (i.e. global, regional and local) and covered the following areas: • • • • brief description of interviewees work and position in the supply chain; details of supply chain; global and local aspects, including the key dimensions; details of any assessments carried out and data availability re: energy-‐use etc. Six semi-‐structured interviews took place with key stakeholders and, using the snowballing technique, others were identified in the relevant chains for interviews in the next stage of the research. Phase 2 Building on the initial scoping work, the City team went back to those interviewed in Phase 1 and interviewed others identified in this first phase. Ten semi-‐structured interviews took place with key stakeholders (farmers, grain merchants, millers, bakers, retailers) in the global, regional and local chains, plus the director of the Flour Millers’ Association (see Appendix 9.3 for details of those interviewed and 9.4 for the Interview Guide30). These interviews built on the initial scoping work to map and analyse the chains and collected primary data (mostly qualitative) on the attributes: biodiversity; technological innovation; nutrition, and communication and information. In addition, to ensure that stakeholders had been drawn as fully as possible into the selection procedure for the attributes, a decision was also made to ask interviewees along the chains what they thought had been missed as part of the data collection process. This avoided trying to define each attribute for each stakeholder, but ensured that data had been gathered on anything that had been missed in the selection of shared attributes. To supplement primary data collection, company websites (not detailed because of confidentiality) and a range of documentation and literature on existing studies was reviewed in order to gather data from secondary sources. This included company business/sustainability plans and published performance records; trade association websites; UK government and EU 30 City University Ethical approval on the basis of maintaining interviewee anonymity using relevant coding system www.glamur.eu 53 reports/policy documents; reports and analysis from campaigning groups; and UK national statistics on diet and nutrition. (Table 6 provides an indication of key secondary data sources consulted). Table 6: Secondary data (key sources) Attribute Biodiversity Indicators -‐ locally adapted varieties and breeds; -‐ on farm eco-‐system management at national level Source National Association of British and Irish Flour Millers (NABIM) HGCA (UK crop management and seed cost calculator for purchased and farm saved seed) ADAS – work on sustainable crop m’gement/green grain Department for Environment, Food and Rural Affairs (DEFRA): guidance on farm saved seed BSPB – British Society of Plant Breeders DEFRA: Green Food project: sub-‐ group wheat DEFRA: Joint Nature Conservation Committee (JNCC) Natural England European Commission: EIP-‐AGRI Technological innovation -‐ innovation to reduce GHG emissions; -‐ innovation to reduce waste reduction and disposal; -‐ metrics in place to support sustainable packaging; -‐ (re-‐)use of traditional production processes and preservation of local knowledge Federation of Bakers National Association of British and Irish Flour Millers (NABIM) DEFRA Waste and Action Resources Programme (WRAP -‐ campaigning group on waste) Carbon Trust Global protocol on packaging sustainability Nutrition www.glamur.eu -‐ salt content; -‐ fat content CASH – Consensus action on salt and health Association of Bakery Ingredient Manufacturers (ABIM) Documents/URL http://www.nabim.org.uk/nabim/ http://www.hgca.com/hgca.aspx and http://www.hgca.com/hgca/scc/default2.as p http://www.adas.co.uk/Home/Sustainablec ropmanagement/tabid/245/Default.aspx https://www.gov.uk/farm-‐saved-‐seed http://www.plantbreedingmatters.com/ind ex.php https://www.gov.uk/government/uploads/ system/uploads/attachment_data/file/695 74/pb13795-‐greenfoodproject-‐ wheatsubgroup.pdf http://jncc.defra.gov.uk/page-‐6189 http://publications.naturalengland.org.uk/p ublication/2798159?category=45001 http://ec.europa.eu/eip/agriculture/sites/a gri-‐eip/files/eip-‐ agri_fact_sheet_organic_farming_web.pdf http://www.bakersfederation.org.uk/ http://www.nabim.org.uk/nabim/ https://www.gov.uk/government/uploads/ system/uploads/attachment_data/file/695 72/pb13797-‐greenfoodproject-‐ breadsubgroup.pdf http://www.wrap.org.uk/sites/files/wrap/P roduct-‐focused%20report%20v5_3.pdf http://www.wrap.org.uk/content/reducing-‐ household-‐bakery-‐waste-‐0 https://www.carbontrust.com/media/2064 76/ctg034-‐bakery-‐industrial-‐energy-‐ efficiency.pdf http://www.greenerpackage.com/metrics_ standards_and_lca/global_packaging_proje ct_releases_sustainability_measurement_s ystem http://www.actiononsalt.org.uk/ http://www.abim.org.uk/ 54 Craft Bakers Association (CBA) Real Bread Campaign National Diet and Nutrition Survey Information and communication -‐ communication between stakeholders along chain; -‐ availability of information to consumers ‘Ethical traceability in the UK Wheat to bread chain’ EU leader project: Feasibility of establishing a collaborative supply chain for using organic Scottish wheat for bread making BBC news article: A tale of two breads http://www.craftbakersassociation.co.uk/ http://www.sustainweb.org/realbread/ https://www.gov.uk/government/statistics /national-‐diet-‐and-‐nutrition-‐survey-‐results-‐ from-‐years-‐1-‐to-‐4-‐combined-‐of-‐the-‐rolling-‐ programme-‐for-‐2008-‐and-‐2009-‐to-‐2011-‐ and-‐2012 Sharpe et al, 2008; Barling et al 2009 http://www.breadshare.co.uk/project.htm http://www.bbc.co.uk/news/magazine-‐ 20527294 4.4 Methods of participatory checklist used The methodology employed has been mindful of the participatory approach and the need to include stakeholder views and perceptions throughout the research process. As Pain (2004: 652) points out, the keystone of participatory research is that it involves ‘those conventionally 'researched' in some or all stages of research, from problem definition through to dissemination and action’. This began in Phase 1 with input via interviews with stakeholders along the supply chains and this was important for the initial mapping, helping to balance the underlying relations of power in the more global industrial chain against input from those in the more local chains which, as ‘alternatives’, can be prone to subordination. This was then deepened and fine-‐ tuned in Phase 2, including input from other relevant stakeholders, for example, TA1 in the trade association for UK flour millers (sub-‐section 2.3). Thus, the interviews with stakeholders – that were context specific – were important for helping to unravel the multiple connections between issues and processes by interrogating different perceptions and fore-‐fronting local conditions and knowledge (descriptors) in the global, regional and local chains. This, in turn, ensured that stakeholders helped drive the process to identify key stages in the supply chains and the attributes and indicators selected. www.glamur.eu 55 5. Results The results are presented in three sub-‐sections. The first sub-‐section (5.1) presents the data and scores of performance and then considers the global-‐local differences between the attributes and indicators and overall performance scores. The second (5.2) presents the descriptors, and highlights how underlying factors (e.g. political, legislative, geographical etc.) influenced the performance of the attributes/indicators in the respective dimensions, and the third sub-‐section (5.3) presents the data-‐quality check. 5.1 Presentation of data and scores of performance The benchmarked scores of performance towards more sustainable practice in each of the chains appear in the following table (Table 7). Details of the raw data used for calculating the benchmark percentages are provided in Appendix 9.5. Table 7: Scores of performance for global, regional and local wheat to bread supply chains Attribute Indicator Biodiversity locally adapted varieties and breeds Technological innovation Definition on farm eco-‐system management at national level innovation to reduce GHG emissions innovation to reduce waste reduction and disposal metrics in place to support sustainable packaging use/re-‐use of traditional production processes and preservation of local knowledge www.glamur.eu Standard commercial varieties only (1); current practice includes deliberate use of varieties adapted to local conditions to assist biodiversity (2); current practice includes deliberate use of heritage/traditional varieties as part of planned biodiversity measures (3). i.) Farmers growing to minimum EU standards; ii) membership of recognized environmental management schemes. GHG mitigation practices implemented within past 6 years in: i.) wheat production and storage; ii.) milling; iii.) baking processes; iv.) distribution systems. Timescale based on introduction of new UK legislation introduced in 2008. Waste reduction & disposal innovations within past 6 years in: i.) wheat production and storage; ii.) milling iii.) baking processes; iv.) retail/distribution systems. Bread packaging: non-‐recyclable (0); part of packaging is recyclable (1); all recyclable packaging (2); recyclable packaging from responsibly sourced materials (3); recyclable packaging from responsibly sourced materials and recycling instructions (4). Practical use of traditional production processes and preservation of local knowledge. Unit Benchmark (low-‐high perf’nce) Global score (%) Regional score (%) Qualitative Qualitative 33% 33% 100% No/yes 50% 100% 100% No/yes 75% 100% 75% No/yes 100% 100% 100% 50% 0% 50% 0% 0% 100% 1-‐3 Qualitative Local score (%) Qualitative Qualitative Qualitative 0 -‐ 4 No/yes 56 Nutrition salt content fat content Information & communicati on communication between stakeholders along chain availability of information to consumers UK voluntary salt reduction target (FSA)) is salt content of white bread per 100g -‐ ≤1.0g/100g . ≥ 1.5g (0); 1.5 -‐ ≥ 1.00g (1); 0.5 -‐ 1.00g (2); ≤ 0.5g (3). UK national guidelines definition for low fat fat content is 3g or less per 100g. ≥ 3g (0); 3g-‐ ≥1 (1); 1g-‐ 0 (2). i.) communication between stakeholders confined to first tier (1); ii.) communication beyond first tier (2). i.) meets legal requirements (1); ii.) exceeds legal requirements via enterprise-‐related materials (e.g. web-‐site, product labelling) (2); iii.) evidence of provision of information that exceeds legal minimum via whole supply chain mechanisms (e.g. traceability systems) (3). g/100g g/100g ≥ 1.5g to ≤ 0.5g ≥ 3g to ≤1g Qualitative 1-‐2 1 -‐ 3 Qualitative 75% 25% 75% 50% 50% 50% 100% 100% 100% 100% 100% 66% 5.1.1 Attributes and indicators: global-local differences Figure 15 shows the global, regional and local performance percentage scores for each indicator in each of the chains (benchmarked scores are shown in the two last columns of Table 7). There follows a brief analysis of how the performance of the indicators varied between the global, regional and local chains. Some of the observations and anomalies are discussed in more detail as part of the discussion in Section 6. Figure 15: Benchmarked performance scores for indicators in each chain NB. 0% scores do not register. 120% 100% 80% 60% 40% Global 20% Regional 0% Local www.glamur.eu 57 Biodiversity (environmental) The local chain performed well for both biodiversity indicators. The difference was most marked for the indicator locally adapted seeds which is to be expected as the local organic farm practices seed saving and has been re-‐planting heritage varieties that have adapted to the land over a number of years. The regional chain also performed well for the indicator that assessed eco-‐system management. The results suggest that indicators related to biodiversity are likely to score better in more local chains. Technological innovation (environmental and economic) There was a mixed set of results for technological innovation. All three chains did well for innovative practices to reduce waste, and the regional chain scored best for reducing GHG emissions as there was evidence of this being applied at every stage of the chain studied. This suggests that innovative practice, coupled with legislation, has impacted from the global to the local. However, results for sustainable packaging revealed less progress; for example, the clear film packaging used in the ISB chain showed no indication that it was recyclable. Although the rise in ‘artisan’ and craft bread sales has resulted in a growing interest in the use (and re-‐use) of traditional baking techniques where, understandably, the local craft chain scored highly, there was no clear evidence of the practical use of traditional production processes or of preservation of local knowledge that was leading to improved sustainable performance within the more industrialised chains. Nutrition (health) Both the global and local chains performed at the same level for salt and fat content/100g in white bread. However, in the regional chain (for which a comparable, substitute bread was used), performance was less good for salt content which was in excess of 1g/100g -‐ the UK’s voluntary salt reduction target. The performance scores for the fat content of all types of white bread across the chains were good and fell below the UK’s national guidelines that propose 3g or less per 100g as an indication of low fat content in foodstuffs. Information & communication (social) All three chains scored well for the attribute information and communication, although the results show a poorer performance for the local chain with regard to availability of information to customers. This could be explained, in part, by the ability of the large-‐scale chains to finance www.glamur.eu 58 more sophisticated marketing techniques to inform/persuade customers about the value of their bread rather than relying on ‘word of mouth’. Overall performance scores Overall scores for these selected attributes and indicators show the local chain performed best (81.6%), then the global chain (63.3%), and then the regional chain (60.8%). Figure 16 shows the distribution of performance scores for the indicators according to the selected attributes for each chain. Scores that stand out include how the local chain performs best for both biodiversity and technological innovation and less well for information and communication. The regional chain scores least well for nutrition. Figure 16: Distribution of performance across the chains according to attribute 100% 90% 80% 70% 60% 50% 40% 30% 20% 10% 0% Local Regional Global Figure 17 provides an overall evaluation of the attributes for each of the chains and graphically demonstrates the local chain’s higher performance for biodiversity and technological innovation, the higher performance scores for information and communication for the global and regional chains and the comparable nutrition scores for the global and local chains, with the regional chain scoring less well. www.glamur.eu 59 Figure 17: Overall evaluation of attributes across the global, regional and local supply chains biodiversity 100 80 60 40 20 info & communicacon 0 global technological innovacon regional local nutricon 5.2 Relevant descriptors As highlighted through-‐out the report, it was important to factor in relevant descriptors (e.g. political, legislative, geographical, scale, technological etc.) that defined the context of the global-‐local UK wheat to bread supply chain performance assessment. The overall context of the case study (Section 2) provided a contextual ‘baseline’ that was cross-‐cutting and highlighted the influence and affects of the underlying intention to be local/global and the overriding effects of governance and legislation in all the chains. There were also a number of descriptors (and other attributes that were not selected) that were inter-‐twined with, and influenced decisions about, how the performance assessments of the selected attributes and indicators were defined. For example, resource use efficiency and food waste were issues that were intimately connected with the selected attributes for biodiversity and technological innovation, including how identifying ‘hotspots’ in the chain can be used to improve energy efficiency and target waste reduction (figures 13 and 14). In addition, other descriptors associated with www.glamur.eu 60 connectivity/transparency, traceability and food safety had particular resonance as part of the performance assessment for nutrition and information and communication. These contextual descriptors were driving forces, influenced by stakeholder perceptions and practices, that shaped and pressurized how the global-‐local chains were adapting and innovating and, ultimately, enriched how the performance assessment, using the selected attributes and indicators, was ‘measured’; this is discussed further in Section 6. 5.3 Data quality check Details of the data quality check for each indicator in each supply chain (global, regional and local) using the pedigree matrix (Ciroth 2012) are shown in Appendix 9.6. The main point to make is that the check rated the data at a consistently high quality; most data scored quality level A (the highest level) and the lowest scored quality level C (mid point in the A-‐E range). Where data dipped below A, the explanations were either that primary data was not provided from the stakeholders and secondary data sources had to be used, or that data for a similar product was used as companies/enterprises in the supply chain were unable or unwilling to supply the data required. Table 8 summarises the data: www.glamur.eu 61 Table 8: Summary of pedigree matrix ‘scoring’ for data quality (see Appendix 9.6 for full analysis) Indicator -‐ locally adapted varieties and breeds -‐ on farm eco-‐system management at national level -‐ innovation to reduce GHG emissions -‐ innovation to reduce waste reduction and disposal -‐ metrics in place to support sustainable packaging -‐ use/re-‐use of traditional production processes and preservation of local knowledge -‐ salt content -‐ fat content -‐ communication between stakeholders along chain -‐ availability of information to consumers Global chain Regional Chain Local chain A A A B B A A A A A A A A A A A A A A B C A B C A A A A A A 6. Discussion Section 6 first discusses the methodology (6.1), including how well the setting of the attributes, indicators and benchmarks used for analysis of the global-‐local chains worked within their specific dimensions (i.e. economic, social, environmental, health and ethical) and how the supporting methodological framework countered some of the limits to validity. The second sub-‐ section (6.2) examines the more specific details of the research findings under each individual attribute, using the research questions to structure the analysis. Sub-‐section 6.3 discusses issues related to the context and performance of the global-‐local chains and pulls out key points from the analysis and sub-‐section 6.4 returns to Glamur’s overarching research questions (as detailed in Section 1), including the role of policy. Finally, some key issues for the comparative work with Italy in WP4 are highlighted in Section 7. www.glamur.eu 62 6.1 Methodology: effectiveness and limits to validity The methodology was effective for selecting key attributes and sets of indicators to evaluate the specific performance levels in each of the three chains and in providing a set of results for comparison with those of the Italian team. Data provided by the performance analysis had some limitations, although these were countered, to a degree, by the contextual descriptors (sub-‐ section 5.2) and the data quality check (sub-‐section 5.3). Perhaps the most critical limitation of the methodology related to the difficulty of assessing global-‐local performance when dealing with the breadth of scope between the large-‐scale industrial chain and the small-‐scale local chain, and this is returned to in sub-‐section 6.3. Other more specific limitations that related to the performance assessment included: i.) the majority of the data gathered was qualitative and developing robust and meaningful ‘scoring’ to assess this was based upon the researcher’s interpretation which inevitably is somewhat subjective; ii.) data analysis only evaluated the attributes and indicators within the specific dimensions that were identified by the Multi-‐criteria Performance Matrix in the WP2 comparative report; for example, biodiversity within environment, nutrition within health etc. Because of this, the evaluation had specific effects on the ‘scoring’ for each chain (global, regional and local) and, importantly, did not directly incorporate how the attribute and indicators might ‘score’ under the panoply of all the performance dimensions (economic, environmental, health, social and ethical). This meant that other externalities were not directly incorporated into the analysis -‐ for example, economic, ethical or social impacts under biodiversity; iii.) scoring the indicators in this way meant that it was not possible to take full advantage of the participatory approach adopted by the case study methodology. For example, this did not take into account the full range of views expressed by stakeholders about how they perceived these attributes and indicators from their own position in each chain; and iv.) benchmarking was also constructed to reflect one specific performance dimension; for example, the indicator salt content in bread, under the attribute nutrition was benchmarked for www.glamur.eu 63 health, using the UK’s voluntary salt reduction target; benchmarking each indicator across all of the performance dimensions would have provided a more in-‐depth set of results, and addressed all aspects of sustainability. However, there were a couple of safeguards that were built in to the performance assessment that helped support the methodology and addressed some of these limits to its validity. The first was the use of the descriptors (see sub-‐section 5.2). This awareness of the contextual background, which was reaffirmed at each stage of the study, helped frame the more specific results of the performance analysis. (This is returned to as part of the discussion in 6.2 and 6.3). The second support measure was the data quality check (table 7). This provided an important way of demonstrating that the majority of data used in the analyses was recent (within the last 3 years, and mostly within the past 12 months) primary data from interview data with key stakeholders along the chains, or secondary data that originated directly from the participating enterprises in the UK national context. Also, the quality check took into account that data was based on small samples, and the ‘score’ also indicated when data had been substituted, and from what source, when primary data was not available; for example, salt and fat content values for the nutrition indicators in the local chain had to be taken from equivalent organic, white bread products -‐ and in this case, the data quality check scored ‘C’. 6.2 Addressing the research questions Each of the attributes and their related indicators are considered in more detail below, using the relevant research question(s) to structure the discussion and identify key issues that emerge from the research findings about how global-‐local wheat to bread chains are innovating, adapting and interacting in the UK. The discussion weaves in the contextual descriptors and includes perceptions and observations about global-‐local interactions in the chains as expressed by stakeholders interviewed for the study. www.glamur.eu 64 Biodiversity (environmental dimension) RQ: How do approaches to biodiversity impact on how global-local wheat to bread chains are innovating and adapting? The more local wheat to bread chains performed best in this study when benchmarked for biodiversity indicators within the environmental performance dimension, suggesting that stakeholders in these chains accorded more priority to seed sourcing (linked to biodiversity) and eco-‐system management. For example, the use of heritage varieties, locally adapted seeds, Organic Entry Level Stewardship (OELS-‐ eco-‐system management) and Soil Association standards were much in evidence in the local, organic chain, and UK farms supplying the regional mill (that supplied larger quantities of flour on a more commercial basis to the local chain) were members of the Assured Crops Scheme, and the mill produced and sold stoneground conservation grade flours. However, the interviews did highlight some contradictions. For example, although the craft baker suggested that the farm’s organic flour was an important part of how consumers appreciated the identity of his loaves, in contrast, the farm manager felt it was bakers, not consumers, who were driving demand for his flour as they were in local competition with each other and always looking for a point of difference. These contextual descriptors suggest that adding social and economic performance dimensions to the analysis would have added more insight into the overall performance of the chains for the attribute biodiversity. As evidence from other studies (see sub-‐section 3.2.2) shows that the largest environmental impacts for bread come from industrial-‐scale wheat growing practices and principally from the application of nitrogen fertilisers, this is not to suggest that the industrial chain is ignoring these issues and . Comments from stakeholders in the more global chains and information on company websites describe research and development that aims to improve sustainable practice, including biodiversity management. For example, at the regional level, the ISB chain came under the supermarkets’ Sustainability Plan and had more than 2000 suppliers in Farmer and Grower Development Groups. This included a Wheat Development Group, investigating new technologies to measure nitrogen status of milling wheat under ‘real life’ conditions, and www.glamur.eu 65 the implementation of a Supplier Sustainability Scorecard scheme that aimed to reduce impacts on the environment. Thus approaches to biodiversity highlight a tension between technological innovation in the more global chain and reliance on more traditional farming practices in the local chain. This suggests that there is an unresolved debate about delivering biodiversity (environmental performance) and maximising productive output (economic performance) along the global-‐local continuum. As one of the stakeholders involved with the more global chains summed up when he said: “sometimes it’s a balance between the practical use of herbicides etc. or appropriate use of land management. We now have a greater understanding of land management and this is generating innovation that may not be a quick technical fix. It may just be about a slight change in practice” (TA1). Technological innovation (environmental and economic dimensions) RQ: How is technological innovation affecting performance in global-‐local wheat to bread supply chains? RQ: To what extent are stakeholders in global-‐local chains making use of traditional production processes and preservation of local knowledge? Performance of the chains for the attribute technological innovation was assessed in both environmental and economic dimensions and provides a more rounded set of results. The results for reduction in GHG emissions and waste were benchmarked using the last 6 years as a timescale to coincide with the UK’s Climate Change Act (2008). Results suggest that innovative practice, coupled with legislation, has positively affected both environmental and economic performance along the global-‐local continuum. At the industrial scale, the global and ISB chains were driven by both industry and internal energy saving targets, and published company performance figures to show reductions in CO2 emissions, including improved transport logistics, carbon footprinting, investments in green technology, and recycling heat loss from in-‐ store bakeries; as GC1 summed up, “any business looks at saving energy for economic reasons.” As was noted earlier, the value of the participatory approach means that interview data collected at the local level, enabled an assessment to be made where published data was not available because of the scale of operation. Using this approach to gather data, the local chain www.glamur.eu 66 also performed well; for example, the organic farm only uses green manure; the organic farm and craft bakery have installed solar panels; and by sourcing UK wheat from within a 30-‐mile radius, the regional mill minimizes transport distances; although the local baker pointed out that they made a ‘negative carbon footprint’, due to the number of vans delivering small amounts to the bakery each week. However, there were also contradictions in the data, suggesting that the results would be more robust if the other dimensions (social, health and ethical) were also factored in; for example, one stakeholder in the ISB chain suggested that: “Consumers have little idea about what goes in to a loaf of bread and the current climate means that cost is the major concern. Maybe five years ago carbon footprinting concerned them, now the focus is on health and food waste and shopping more regularly for less” (ISB3). In addition, although the ISB chain did not score for the indicator practical use of traditional production processes and preservation of local knowledge, it should be noted that the supermarket does train bakery staff in bread-‐making processes in be-‐spoke facilities run by the flour milling company. Thus, it could be argued that the company was making some (re-‐)use of traditional baking techniques and knowledge, although the extent is limited by the use of industrialised processes. Nutrition (health dimension) RQ: How are issues related to nutrition impacting on product development and consumer choice in global-local chains? The choice of indicators was partly informed by the availability of data for the nutrition attribute and because reducing salt and fat content are identified as key to progressing healthy diets in the UK; for example, the high salt content in bread (as the largest contributor of salt to the UK diet) is being addressed by the industry using a voluntary salt reduction target of equal or less than 1g per 100g, this provided an obvious benchmark for assessing the performance level. The performance assessment provides an interesting set of results because the use of industry oversight and public scrutiny has resulted in a marked decrease in salt content in industrially www.glamur.eu 67 produced bread (see Brinsden et al 2013), and although the Food Standards Agency (FSA) has developed some tools to help craft bakers calculate the salt content in their own bread production, much less data is available as labelling (and packaging) is not the norm. This is an interesting observation because, on this indicator it does not as the WP2 comparative report suggests, provide a critical point of differentiation for local food chains. However, these indicators preclude looking at the use of artificial additives in the industrial baking process and it could be argued this is not a complete assessment of the performance level with regard to nutrition and health. Artificial additives are a subject of contention between the industrial and craft/artisan bread chains, essential to speed up the large-‐scale CBP baking process and maintain the requisite protein levels for industrial production and thus enabling bakery plants to use a higher proportion of home-‐grown wheat, but also eliminating many of the natural nutrients in the process. It is not yet known what the implications are for already declining white bread sales after the introduction of new EU legislation after December 2014 on labelling and consumer information (as discussed in sub-‐section 3.1.1) when all additives (including fortification) will need to be clearly stated. Thus, it could be argued, that a more complete assessment would include both additional indicators on additives and assessment within the social dimension, in order to factor in consumer choice. Information and communication (social dimension) RQ: To what extent does communication and availability of information benefit stakeholders in global-local chains? The performance levels for the attribute Information and communication took place in the social dimension, using qualitative indicators to assess communication between the stakeholders and how much information was made available to consumers. Although this provided an interesting set of results, assessment in all dimensions would have provided more in-‐depth analysis. For example, analysis and mapping of governance aspects for all three chains as part of the contextual background showed how supply chain efficiencies (economic dimension) were a key priority in the global and regional chains, whereas, although stakeholder www.glamur.eu 68 communication was just as strong in the local chain, it operated on a different scale that did not prioritise economic efficiencies in the same way. In addition, there was a contradiction when it came to the assessment on the availability of information to consumers, where the local chain scored less well. This reflected the inability of small-‐scale operations to invest in sophisticated marketing and company websites but did not factor in the importance of ‘word of mouth’ and particularly, social media which small craft and artisan bakeries and local producers increasingly rely on for promoting their businesses and messages. 6.3 Issues for global-local chains 6.3.1 Context and performance The Glamur project is addressing three overarching research questions. The first two ask, What are the key food chain performance issues with regard to a global-‐local comparison? and What are the specific interactions of the food chains under study and the policy settings? As previously detailed (sub-‐section 5.2), certain issues formed a contextual ‘baseline’ that was cross-‐cutting and highlighted the influence and affects of the underlying intention to be local/global and the overriding effects of governance and legislation. These began to emerge from the mapping of the global, regional and local chains in Section 2. Using the four dimensions to distinguish global from local, this began to unpick how all chains included global and local inputs – for example, imported wheat, additives and ingredients -‐ and also began to demonstrate closer connections between the global and regional chains, associated with their industrial scale of production and supply chain efficiencies. Likewise, ethical dimensions emerged that were associated with good environmental practice, food security and ethical transparency in the chains. In addition, critical issues (sub-‐section 2.5) highlighted how performance issues related to: wheat provenance (and the effects of climate); seed breeding and wheat growing priorities and practices; concentration in the supply chain; GHG emissions; product composition and nutrition; and increasing (re-‐) use of traditional baking techniques were impacting on how all the chains were adapting and innovating and were key factors that influenced the boundaries between the global and local www.glamur.eu 69 chains. However, this part of the analysis also identified some key difference between how stakeholders, according to their position in each chain, defined ‘global’ and ‘local’. Some in the global chains expressed how global chains can have ‘a local feel with global characteristics’ (as is the case with GCs chain which starts in Canada but incorporates UK chains), and where organic flour mills have local contracts but also import grain from Australia and Canada. In addition, ISB stakeholders defined ‘local’ as regional/national but, reflecting the nature of relationships in this closed-‐loop supply chain, this also included the ability to respond quickly, with people ‘pulling together’. In the more local craft chain, some defined ‘local’ as production and consumption within a defined geographic area, but there were also reservations about defining ‘local’ in terms of distance. These observations were factored in to how the analysis was approached and interpreted in the second stage using the attributes and indicators. The second stage of analysis also demonstrated how, at many levels, performance issues across the specific dimensions were the same for all of the chains -‐ for example, innovations to reduce waste along each chain (technological innovation); fat content (nutrition) in the types of bread under consideration; and for communication between stakeholders along each chain (information and communication). However, more detailed consideration of the results (see sub-‐section 6.2) that adopted the participatory approach and incorporated the interview data more fully, began to reveal a ‘re-‐balancing’ of the chain along the global-‐local continuum as the industrial sector addresses declining white bread sales as consumer choice and dietary habits experience a shift towards more healthy and ‘artisan’ options and the regional (ISB) chain and craft chain (CRFT) experience an up-‐lift. However, this re-‐balancing may be a one-‐way street, as the dominant industrial chain adapts and innovates using key qualities and characteristics associated with the local chain, like for example, sour-‐dough methods of production, ‘localness’ and quality ingredients related to provenance. In the UK context, where socio-‐economic ‘lock-‐in’ to the industrial chain is already so dominant (supported by issues of governance, including assurance standards and contractual specifications) it is unclear what the outcome will be for performance in the environmental, www.glamur.eu 70 health, social and ethical dimensions. However, it is important to also consider the socio-‐cultural implications. Consumers have also been ‘locked-‐in’ to limited choice (as the vast majority of bread is industrially produced) and cultural and dietary habits are associated with this type of bread. As consumer choice and habits change, and demand for bread that is more ‘healthy’ increases, there could be a counter-‐balance which shifts demand towards more local bread, associated with traditional baking techniques. In addition, although the industrial chain has finance available to ‘up’ their marketing and deliver new quality messages to consumers, there is an interesting counter-‐balance at the local artisan level where social media (twitter, you tube etc) is growing exponentially and promoting the local very dynamically, in particular to younger consumers. In this instance, perhaps socio-‐cultural ‘lock-‐in’ (and the associated performance dimensions of health and ethics), although once dependent on industrial dominance, might be under threat from the growth of social media and the acuity of artisan and local bakeries to build their niche markets. 6.3.2 Policy context Specific interactions between the chains and the policy context highlight the importance of EU subsidies and payments at the farm level that act as an incentive to improve biodiversity and implement eco-‐system management schemes at industrial to small-‐scale levels. For example, at the local level, the organic farmer said, ‘EU legislation does not impinge directly – but it does as part of the wider farm scheme because of EU subsidies’. The interviews probed this further when stakeholders were asked whether they agreed or disagreed with the statement: ‘public policies have led to better environmental procedures for growing wheat’. The responses suggested that this was a ‘grey’ area in all the chains. Although most agreed that legislation had helped up to a point, this was tinged with reservations. These ranged from one stakeholder (local chain) who felt that some policy could be counter-‐productive, to another (regional chain) who felt that some legislation was led by opinion rather than science and that ‘enhancing the environment has to be done by working with industry’, and another (regional chain) who felt that the intention was there, but the outcomes were unclear. There were also obvious differences and pre-‐occupations between those who were part of a policy framework that had been principally devised to regulate the industrial food sector at EU www.glamur.eu 71 level where sophisticated systems were in place to meet regulations and standards such as, hygiene and food safety, and those in the local system, operating within short food supply chains (SFSCs) where localness and quality were considered a major point of difference. It will be interesting to see the effects of the new EU rural development policy (2014-‐20) that recognises the challenges that farmers and producers face in adding value to their products, with proposals that have a specific focus on better integration of primary producers through quality schemes and reform for the promotional policy for agricultural products, including new labelling schemes. However, these efforts to promote the local are juxtaposed with the new EU Food Information to the Consumer Regulations (FIR), that came into force in December 2014, this means that fortifying ingredients added to UK flours must now be labelled and the effects of this regulatory change on global, regional and local chains is still unknown. 7. Next steps From this analysis, it could be argued that the global-‐local continuum of the UK wheat to bread chain is re-‐balancing as the chains interact, innovate and adapt. Thus, key issues emerging for the comparative work with Italy, which looks at the third overarching question, What are the methodological strengths and weaknesses of overall applied pairwise comparative analysis? could include: • how socio-‐economic and socio-‐cultural ‘lock-‐in’ affects the ability of the wheat to bread chains to adapt and innovate at global and local levels; • more detailed comparison of how chains are ‘re-‐balancing’ in both countries – we have a good contrast with the Italian chain starting from the opposite end of the spectrum – what are the impacts of adaptation and change? Are both chains meeting somewhere in the middle? www.glamur.eu 72 8. References Abécassis, J., David, C., Fontaine, L., Taupier-‐Létage, B. and Viaux, P (2008) A multidisciplinary approach to improve the quality of organic wheat-‐bread chain. 16th IFOAM Organic World Congress, Modena, Italy, June 16-‐20, 2008. Archived at http://orgprints.org/view/projects/conference.html Barling, D., Sharpe R. and Lang T. (2009) Traceability and ethical concerns in the UK wheat-‐bread chain: from food safety to provenance to transparency, International Journal of Agricultural Sustainability, 7 (4): 261-‐278. Bonny, S. (2014) Taking stock of the Genetically Modified seed sector worldwide: market, stakeholders and process. Food Security 4(6): 525-‐545. Brinsden, H.C., He, F.J., Jenner, K.H. and MacGregor, G.A. (2013) Surveys of the salt content in UK bread: progress made and further reductions possible. BMJ Open, 3:e002936. doi:10.1136/bmjopen-‐2013-‐002936 Carbon Trust (2011) Industrial Energy Efficiency Accelerator: Guide to the industrial bakery sector. Accessed 23 October 2014 at https://www.carbontrust.com/media/206476/ctg034-‐ bakery-‐industrial-‐energy-‐efficiency.pdf Cassidy, E.S., West, P.C., Gerber, J.S. and Foley, J.A. (2013) Redefining agricultural yields: from tonnes to people nourished per hectare. Environ. Res. Lett. 8 034015 doi:10.1088/1748-‐ 9326/8/3/034015 Ciroth, A. E. (2012) Refining the pedigree matrix approach in ecoinvent: Towards empirical uncertainty factors (http://www.greendelta.com/fileadmin/Pedigree_report_final_May2012.pdf) Accessed 10 December 2014. Clarke, N., Cloke, P., Barnett, C. and Malpass, A. (2008) The spaces and ethics of organic food. Journal of Rural Studies 24: 219-‐230. Defra (2012(a.)) Green Food Project: Wheat Sub Group Report -‐ Themes, Tensions and Recommendations. July 2012. Department for the Environment, Food and Rural Affairs: London. Defra (2012(b.)) Green Food Project: Bread Sub Group Report. July 2012. Department for the Environment, Food and Rural Affairs: London. Espinoza-‐Orias, N., Stchnothe, H., Azapagic, A. (2012) The carbon footprint of bread, The International Journal of Life Cycle Assessment, 16, 4: 351-‐365. FAO (2013) SAFA Guidelines. Natural Resources Management and Environment Department. FAO: Rome. www.glamur.eu 73 Foresight (2011) The Future of Food and Farming. Final Project Report. The Government Office for Science: London. Gellynck, X., Kühne, B., Van Bockstaele, F., Van de Walle, D. and Dewettinck, K. (2009) Consumer perception of bread quality. Appetite 53: 16-‐23. Keech,D., Kirwan, J., Maye, D. and Bhundoo, D. (2014) GLAMUR WP2 -‐ National level report – United Kingdom. Countryside and Community Research Institute. University of Gloucester, UK. Kirwan, J., Maye, D., Bundhoo, D., Keech, D. and Brunori, G. (2014) GLAMUR WP2 -‐ Scoping / framing general comparative report on food chain performance (deliverable 2.3). Countryside and Community Research Institute, University of Gloucestershire, UK. Kleinschmit, J., Barker, E., Keeney, D. et al (2014) Measuring success: local food systems and the need for new indicators. IATP. Lambert, J.L., Le-‐Bail A., Zuniga, R. et al (2009) The attitudes of European consumers toward innovation in bread: Interests of the consumers towards selected quality attributes. Journal of Sensory Studies 24: 204-‐219. Mintel (2014) ‘Bread and baked goods’. Mintel Report. Magnan, A. (2011) Bread in the economy of qualities: The creative reconstitution of the Canada-‐ UK commodity chain for wheat. Rural Sociology 76(2): 197–228. O’Connor, A. (2012) An overview of the role of bread in the UK diet. Nutrition Bulletin 37(3): 193-‐212. O’Neill, K. (2014) Situating the ‘alternative’ within the ‘conventional’: local food experiences from the East Riding of Yorkshire, UK. Journal of Rural Studies 35: 112-‐122. Pain, R. (2004) Social geography: participatory research. Progress in Human Geography 28 (5): 652-‐663. Pearson, D., Henryks, J., Trott, A., Jones, P., Parker, G., Dumaresc, D. and Dyball, R. (2011) Local food: understanding consumer motivations in innovative retail formats. British Food Journal 113 (7): 886-‐899. SACN (Scientific Advisory Committee on Nutrition) (2012) Nutritional implications of repealing the UK bread and flour regulations. pp. 1–30. Available at: http://www.sacn.gov.uk/pdfs/ sacn1202_bread_and_flour_regulations.pdf Accessed 23 October 2014. Searchinger, T., Hanson, C., and Lacape, J.M (2014) “Crop Breeding: Renewing the Global Commitment.” Working Paper, Installment 7 of Creating a Sustainable Food Future. Washington, www.glamur.eu 74 DC: World Resources Institute. Available online at http://www.worldresourcesreport.org. Sharpe, R., Barling D, and Lang, T. (2008) “Ethical Traceability in the UK Wheat-‐Flour-‐Bread Chain” in Coff C, Barling D, Korthals M and Nielson T eds. (2008) Ethical traceability and communicating food. Dordrecht, Springer: 125-‐165. Smith, J. and Barling, D. (2014). Social impacts and life cycle assessment: proposals for methodological development for SMEs in the European food and drink sector. International Journal of Life Cycle Assessment, 19(4): 944-‐949. Sonnino, R. and Griggs-‐Trevarthen, C. (2013) A resilient social economy? Insights from the community food sector in the UK. Entrepreneurship and Regional Development, 25 (3-‐4): 272-‐ 292. Spackman, P. (12th May 2009) Food Chain: Strong demand for local food. Farmers’ Weekly: Sutton. Whitley, A. (2009) Bread Matters: why and how to make your own. Fourth Estate: London. www.glamur.eu 75 Appendices www.glamur.eu 76 T R A C E A B IL IT Y A N D E T H IC A L C O N C E R N S IN T H E U K W H E A T – B R E A D C H A IN 2 6 5 F ig u r e 1 U K w h e a t – flo u r – b r e a d c h a in S o u r c e : M in te l, 2 0 0 5 ; D e fr a , 2 0 0 6 , 2 0 0 7 ; F A B , 2 0 0 6 ; N a b im , 2 0 0 6 a ,b ; F o B , 2 0 0 7 . N o te : m t ¼ m illio n to n n e s . 9.1: Detailed UK wheat to bread supply chain (source: Sharpe et al 2008) IN T E R N A T www.glamur.eu IO N A L J O U R N A L O F A G R IC U L T U R A L S U S T A IN A B IL IT Y 7 ( 4 ) 2 0 0 9 , P A G E S 2 6 1 – 2 7 8 77 9.2: Flour supply chain in the UK (source: Espinoza-‐Orias, 2011 from NABIM 2008) www.glamur.eu 78 9.3: Details of stakeholders interviewed Job of interviewee Function in chain Position in chain Global chain Senior manager responsible for supply chain from wheat to flour (GC1) ISB chain Senior Director (ISB1) Large industrial baker Wheat to bread Farmer owned, central storage co-‐operative Technical manager (ISB2) Technical manager (ISB3) Local craft bakery chain Farm manager (CRFT1) Organic wheat trader (CRFT2) Owner/director (CRFT3) Owner/baker (CRFT4) Industrial mill Grain handler/ farmer co-‐ operative Miller Supermarket In-‐store bakery Retailer Organic farm growing wheat and milling flour on-‐site Key organic wheat grain handlers Farmer/miller/ retailer Grain merchants Regional mill Traditional High Street family-‐run bakery (operating since 1940s). Flour Millers’ Association Miller Craft baker/retailer Associated Director Trade Association (TA1) www.glamur.eu Members’ association 79 9.4 Interview Guide GLAMUR Project: what distinguishes a ‘global’ from a ‘local’ food supply chain? Interview Guide and questions for UK case study: wheat to bread supply chain Introduction The Centre for Food Policy, City University London is a project partner in the EU-funded GLAMUR project. This is examining what distinguishes a ‘global’ from a ‘local’ food supply chain. As part of the research, the Centre for Food Policy is conducting a case study of UK wheat to bread supply chains and is attempting to map and analyse the industrial (more global) chain and two subchains with more local characteristics. We would like to include [details of stakeholder] in the study because we are particularly interested in how you perceive the differences between global and local aspects of the wheat to bread supply chain. The interview takes about 30 minutes and asks about your knowledge of the supply chain focussing on your own role and position in the chain, and on your perceptions of local and global aspects of the supply chain. The interview concludes with a set of questions about biodiversity; technological innovation and nutritional value. These factors emerged as important in our earlier scoping work and we feel that more in-depth analysis will provide valuable insights into how global and local wheat to bread supply chains are adapting and innovating in the UK. At the end of the interview we ask for your response to a set of short statements and there is also an opportunity for you to ask questions and suggest any additional factors that you consider important. We hope that you find this research interesting and that your participation will not only provide an opportunity to improve your own knowledge but also offer new insights and potential marketing opportunities. We should add that data collected in the UK will be used for comparative analysis with data collected in Italy, thus providing further insights within the European context. Data collected will be kept anonymous and written feedback will be provided at the end of the research process. Thank you for your participation! The Centre for Food Policy team www.glamur.eu 80 Confidential Name: Company/ farm: Job title: Section 1 – Mapping the wheat to bread supply chain 1.1 Please briefly describe your work and personal position in the wheat to supply chain bread 1.2 Please briefly describe your market (scale/segment/geographic reach etc. 1.3 What do you think are the main factors that make you successful in this market? Section 2 – Local and global aspects of the supply chain 2.1 To help us map how the industrial (more global) and local wheat to bread supply chains differ (or overlap), please consider the diagram below that models the stages in the supply chain - and provide feedback on the following: a.) Do all these stages apply to your supply chain? If any stages do NOT apply, please provide details. b.) What are important intermediate stages not shown in the model? www.glamur.eu 81 c.) Are there any stages that present particular challenges for maintaining your own position in the chain? MODEL of WHEAT TO BREAD SUPPLY CHAIN Inputs -‐ global and local, incl seed, ferclizers and other nutrients c.) Inputs -‐ global and local, incl seed, ferclizers and other nutrients Farmers Collectors/ grain distributors Millers Bakers Retailers Consumers Please mark any stages in the chain where more knowledge/information benefit your business. Please provide details. Farmers Collectors/ grain distributors Millers Bakers Retailers Consumers Waste and spin-‐offs would Waste and spin-‐offs d.) Please mark any transport distances between stages in your supply chain that you are aware of. Inputs -‐ global and local, incl seed, ferclizers and other nutrients www.glamur.eu Farmers Collectors/ grain distributors Millers Bakers Retailers Consumers Waste and spin-‐offs 82 e.) With which stakeholders do you have direct trading relationships? Please below Stakeholders Input suppliers (seeds, fertilizers, etc.) Farmers Collectors/grain merchants Millers Input/additive suppliers (improvers, vitamins, yeast etc.) Bakers Retailers Consumers Waste services Others: please specify mark Direct trading relationship f.) Do you own other companies in the supply chain? 2.2 What do you perceive as the main differences between a local and global supply chain? 2.3 What do you perceive as more local aspects of your own wheat to bread supply chain? 2.4 www.glamur.eu What do you perceive as more global aspects of your own wheat to bread supply chain? 83 2.5 If all food chains were placed on a gradient from local (1) to global (10), where would your own supply chain be situated? 1 2 3 4 5 6 7 8 9 (very local) 10 (globalized) Section 3 – Evaluation of biodiversity; technological innovation and nutritional value. 3.1 Biodiversity Indicator 1: wheat - locally adapted varieties and breeds (farmers, merchants, millers, bakers) 3.1.1 Do you grow/process and/or bake with flour, from locally adapted wheat varieties and breeds? Please supply details (including when blending occurs). 3.1.2 Who do you perceive is important for setting the demand for the use of locally adapted (or other) varieties and breeds? 3.1.3 Does the consumer play a role in your decision-making? If so, how? Indicator 2: Saving of seeds and breeds (farmers only) 3.1.4 Do you currently practice seed-saving? If yes, please briefly describe why and supply details, including number of hectares used for growing wheat. If no, have you considered seed-saving – and what were your reasons for deciding against it? www.glamur.eu 84 3.1.5 Does the consumer play a role in your decision-making? If so, how? Indicator 3: on farm eco-system management (farmers only) 3.1.6 Do you have systems to help manage natural resources and enhance biodiversity in place on your farm? (plants, insects, wildlife/bird species diversity etc.) Who instigated them? 3.1.7 What has been the influence of government regulation/incentives for managing biodiversity? Has this impacted on your own practical knowledge and practice for wheat growing? 3.1.8 How does implementation affect operating efficiency, profits, business 3.1.9 Who do you perceive is important for setting the standards for resource management for wheat growers? 3.1.10 Do you think about how your wheat farming practices impact on the fertility and profitability for future generations? image? natural lands’ 3.1.11 Does the consumer play a role in your decision-making? If so, how? www.glamur.eu 85 3.2 Technological Innovation Indicator 1: Technologies to minimize losses (farmers, seed merchants, millers) 3.2.1 Which technologies do you employ to minimize losses? (for example, use of wheat species to improve efficiency/functionality of flour) 3.2.2 Who do you perceive is important for setting the standards for technological innovation to minimize losses? 3.2.3 Does the consumer play a role in your decision-making? If so, how? Indicator 2: Investment and innovation in baking processes (bakers) 3.2.4 Have you invested in new technologies to improve the efficiency (economic and/or environmental) of your baking processes? (for example, reduction of GHG emissions/energy use). 3.2.5 Who do you perceive is important for setting the demand for technological innovation to improve efficiency? 3.2.3 Does the consumer play a role in your decision-making? If so, how? www.glamur.eu 86 3.3 Nutrition Indicator 1: nutritional qualities (composition) 3.3.1 How do you define nutritional qualities for your product? How do you maintain/improve them? 3.3.2 Who do you perceive is important for setting the demand for nutritional quality? 3.3.3 Does the consumer play a role in your decision-making? If so, how? Indicator 2: Nutritional value (health and well-being) (bakers, retailers) 3.3.4 How do you define nutritional value? Does it differ between price segments? 3.3.5 Do you think that consumers relate price to nutritional value? Or do their purchasing decisions prioritise other concerns? If so, what are they? www.glamur.eu 87 Do you agree/disagree with the following statements? a. wheat growing needs to be combined with more mixed farming to maximise environmental benefits agree/disagree b. public policies have led to better environmental procedures for growing wheat agree/ disagree c. implementing more sustainable practices is an added financial cost agree/disagree d. changing consumption habits mean that bread sales are in overall decline agree/disagree e. technological innovation is addressing increased consumer demand for healthy and speciality breads agree/disagree more Please use the box below to suggest any other factors (excluding biodiversity, technological innovation and nutritional value) that you consider important in your supply chain. Thank you. www.glamur.eu 88 9.5 Presentation of data and scores of performance by attribute 1. Biodiversity Indicator 1: locally adapted varieties and breeds Standard commercial varieties only (1); current practice includes deliberate use of varieties adapted to local conditions to assist biodiversity (2); current practice includes deliberate use of heritage/traditional varieties as part of planned biodiversity measures (3) Benchmark: Successive qualitative targets. 1-‐3 categories available. Low 1: High 3 Results: actual (benchmarked) Global: 1 (33%); Regional: 1 (33%); Local: 3 (100%) Indicator 2: on farm eco-‐system management at national level i.) Farmers growing to minimum EU standards; ii) membership of recognized environmental management schemes. Benchmark: Target values. No/yes. Scoring range 0 – 2 Results: actual (benchmarked) Global: 1 (50%); Regional: 2 (100%); Local: 2 (100%) Total scores for Biodiversity (raw data): Global 2; Regional 3; Local 5 2. Technological innovation Indicator 1: innovation to reduce GHG emissions; GHG mitigation practices implemented within past 6 years in: i.) wheat production and storage; ii.) milling; iii.) baking processes; iv.) distribution systems. Benchmark: Target values. No/yes. Scoring range 0 -‐ 4 Results: actual (benchmarked) Global: 3 (75%); Regional: 4 (100%); Local: 3 (75%) Indicator 2: innovation to reduce waste reduction and disposal Waste reduction & disposal innovations within past 6 years in: i.) wheat production and storage; ii.) milling iii.) baking processes; iv.) retail/distribution systems. Benchmark: Target values. No/yes. Scoring range 0 -‐ 4 Results: actual (benchmarked) Global: 4 (100%); Regional: 4 (100%); Local: 4 (100%) Indicator 3: metrics in place to support sustainable packaging Bread packaging: non-‐recyclable (0); part of packaging is recyclable (1); all recyclable packaging (2);recyclable packaging from responsibly sourced materials (3); recyclable packaging from responsibly sourced materials and recycling instructions (4). Benchmark: Successive qualitative targets. 0 -‐ 4 categories available Results: actual (benchmarked) Global: 2 (50%); Regional: 0 (0%); Local: 2 (50%) Indicator 4: use/re-‐use of traditional production processes and preservation of local knowledge Practical use of traditional production processes and preservation of local knowledge. Benchmark: Target values. No/yes. Scoring range 0 -‐ 1 Results: actual (benchmarked) Global: 0 (0%); Regional: 0 (0%); Local: 1 (100%) Total scores for technological innovation (raw data): Global 9; Regional 8; Local 10 www.glamur.eu 89 3. Nutrition Indicator 1: salt content ≥ 1.5g (0); 1.5 -‐ ≥ 1.00g (1); 0.5 -‐ 1.00g (2); ≤ 0.5g (3). Benchmark: Target range. ≥ 1.5g -‐ ≤ 0.5g Results: actual (benchmarked) Global: 2 (1g/100g -‐ GC white medium sliced loaf-‐ from label 8 Dec 2014): (75%); Regional: 1 (1.38g/100g -‐ ISB white bloomer equivalent loaf) (25%); Local: 2 (0.63g/100g – craft/artisan equivalent white organic loaf)(75%) Indicator 2: fat content ≥ 3g (0); 3g-‐ ≥1 (1); ≤1g (2). Benchmark: Target range. ≥ 3g -‐ ≤1g Results: actual (benchmarked) Global: 1(1.9g/100g -‐ GC white medium sliced loaf-‐ from label 8 Dec 2014 (50%); Regional: 1 (2g/100g -‐ ISB white bloomer equivalent loaf) (50%); Local: 1 (2.4g/100g – craft/artisan equivalent white organic loaf (50%) Total scores for Nutrition (raw data): Global 3; Regional 2; Local 3 4. Information and communication Indicator 1: Communication between stakeholders along chain i.) communication between stakeholders confined to first tier (1); ii.) communication beyond first tier (2) Benchmark: Successive qualitative targets. 1-‐2 categories available Results: actual (benchmarked) Global: 2 (100%); Regional: 2 (100%); Local: 2 (100%) Indicator 2: Availability of information to consumers i.) meets legal requirements (1); ii.) exceeds legal requirements via enterprise-‐related materials (e.g. web-‐site, product labelling) (2); iii.) evidence of provision of information that exceeds legal minimum via whole supply chain mechanisms (e.g. traceability systems) (3) Benchmark: Successive qualitative targets. 1 -‐ 3 categories available Results: actual (benchmarked) Global: 3 (100%); Regional: 3 (100%); Local: 2 (66%) Total scores for Information and Communication (raw data): Global 5; Regional 5; Local 4 Summary of scores for attributes (raw data) Attribute Biodiversity Technological innovation Nutrition Information & Communication Total www.glamur.eu Global 2 9 3 5 Regional 3 8 2 5 Local 5 10 3 4 19 18 22 90 9.6 Details of data quality checks using the pedigree matrix G -‐ Global chain (GC); R -‐ Regional chain (ISB); L -‐ Local chain (LC) 1. Biodiversity Criterion Score (DQI) Distance (DQD = 1-‐DQI) Reliability Quantitative of source data Qualitative data Completeness Temporal correlation Geographical correlation DQG 5 1 0 Verified primary data base on measurements (or reported in a survey) G, R. L . L Primary data based on survey/interview with qualified representative Representative data from all sites relevant for the SC considered over an adequate period. G. R. L G.R. L. Less than 3 yrs of difference for the time period of dataset G. R.L G R.L Data from area under study DQI 4 0.8 0.2 Verified secondary data based on measurement of primary data based on qualified estimated G. R. Verified secondary data based on qualified sample Representative data from >50% of sites relevant for SC considered, over an adequate period Less than 6 yrs Further technological correlation G, R, L. G. R ,L Data from enterprises, processes and materials under study Average data from lger area in which the area under study is included Data from processes and materials under study (i.e. identical technology) but different enterprises DGI 3 0.6 0.4 Non-‐verified secondary data partly based on qualified estimates DQI 2 0.4 0.6 Qualified estimated (e.g. by industrial expert) DQI 1 Non-‐verified secondary data partly based on qualified estimates G.R. L. Representative data from only some sites (less than 50%) OR more than 50% but only for short periods Less than 10 yrs Qualified estimated (e.g. by industrial expert) Non-‐qualified estimate or non-‐verified secondary data G. R. L. Representative data from only one site relevant for SC considered or some sites but only for short periods Less than 15 yrs Representativeness of data is unknown or data from a small number of sites and from short periods. Age of data unknown or more than 15 yrs of difference to the time period of the dataset 0, 0 Data from area with similar production conditions. Data from area with slightly similar production conditions Data from unknown or distinctly different area 0, 0 Data from processes and materials under study but from different technology Data on related processes or materials Data on related processes on laboratory scale or from different technology 0, 0 Total Quality Class 0.2 0.8 Non-‐qualified estimate or non-‐verified secondary data 0.4 (G,R,L) 0.8 (G,R) 0.6 (L) A B (GR) A(L) Indicator 1 Locally adapted varieties and breeds G, R, L Indicator 2 On-‐farm eco system management at national (UK) level G,R,L www.glamur.eu Score 0 0.2 (G,R) 0 (L) 0.4 0.6 91 2. Technological innovation Criterion Score (DQI) Distance (DQD = 1-‐DQI) Reliability Quantitative of source data Qualitative data Completeness Temporal correlation Geographical correlation DQG 5 1 0 Verified primary data base on measurements (or reported in a survey) L.L. G.R.L. Primary data based on survey/interview with qualified representative Representative data from all sites relevant for the SC considered over an adequate period. G. R.L. G. R. L. G. R. L.G. Less than 3 yrs of difference for the time period of dataset G. R. L. G. R. L. G. R. L.G. Data from area under study DQI 4 0.8 0.2 Verified secondary data based on measurement of primary data based on qualified estimated G. R. G. R. G. Verified secondary data based on qualified sample G. R. L. G.R. L. G.R. L. G. Representative data from >50% of sites relevant for SC considered, over an adequate period Less than 6 yrs DGI 3 0.6 0.4 Non-‐verified secondary data partly based on qualified estimates DQI 2 0.4 0.6 Qualified estimated (e.g. by industrial expert) DQI 1 Non-‐verified secondary data partly based on qualified estimates Representative data from only some sites (less than 50%) OR more than 50% but only for short periods Qualified estimated (e.g. by industrial expert) Non-‐qualified estimate or non-‐verified secondary data Representative data from only one site relevant for SC considered or some sites but only for short periods Representativeness of data is unknown or data from a small number of sites and from short periods. 0.2 0.2 0.2 0.2 Less than 10 yrs Less than 15 yrs Age of data unknown or more than 15 yrs of difference to the time period of the dataset 0 0 0 0 Data from area with similar production conditions. Data from area with slightly similar production conditions Data from unknown or distinctly different area 0 0 0 0 Data from processes and materials under study but from different technology Data on related processes or materials Data on related processes on laboratory scale or from different technology 0 0 0 0 Total Quality Class 0.4(G,R) 0.2 (L) 0.4(G,R) 0.2 (L) 0.2 0.4 A A A A Further technological correlation G.R. L. G. R. L. G. R. L. G. Data from enterprises, processes and materials under study Average data from lger area in which the area under study is included Data from processes and materials under study (i.e. identical technology) but different enterprises 0.2 0.8 Non-‐qualified estimate or non-‐verified secondary data Score 0.2(G,R) 0 (L) 0.2(G,R) 0(L) 0 0.2 Indicator 1 Innovation to reduce GHG emissions G, R, L Indicator 2 Innovation to reduce waste reduction & disposal G,R,L Indicator 3 Metrics in place to support sustainable packaging for bread G,R,L Indicator 4 (Re-‐)use of traditional production processes and preservation of local knowledge G,R,L www.glamur.eu 92 3. Nutrition Criterion Score (DQI) Distance (DQD = 1-‐DQI) Reliability Quantitative of source data Qualitative data DQG 5 1 0 Verified primary data base on measurements (or reported in a survey) G. G. Primary data based on survey/interview with qualified representative DQI 4 0.8 0.2 Verified secondary data based on measurement of primary data based on qualified estimated R. R. L.L. Verified secondary data based on qualified sample DGI 3 0.6 0.4 Non-‐verified secondary data partly based on qualified estimates DQI 2 0.4 0.6 Qualified estimated (e.g. by industrial expert) DQI 1 Non-‐verified secondary data partly based on qualified estimates Qualified estimated (e.g. by industrial expert) Non-‐qualified estimate or non-‐ verified secondary data Representativeness of data is unknown or data from a small number of sites and from short periods. Completeness G. G. Representative data from all sites relevant for the SC considered over an adequate period. Representative data from >50% of sites relevant for SC considered, over an adequate period Representative data from only some sites (less than 50%) OR more than 50% but only for short periods Temporal correlation G.R. L. G. R. L. Less than 3 yrs of difference for the time period of dataset G. G. Data from area under study Less than 6 yrs Less than 10 yrs R. R. L .L. Representative data from only one site relevant for SC considered or some sites but only for short periods Less than 15 yrs R.R. L.L. Data from area with similar production conditions. Data from area with slightly similar production conditions L.L. Data from processes and materials under study but from different technology Geographical correlation Further technological correlation G. G. Data from enterprises, processes and materials under study Average data from lger area in which the area under study is included R.R. Data from processes and materials under study (i.e. identical technology) but different enterprises 0.2 0.8 Non-‐qualified estimate or non-‐ verified secondary data Score 0 (G) 0.2(R,L) 0 (G) 0.2(R.L.) 0(G) 0.6 (R.L) 0 0.6 (R,L) Age of data unknown or more than 15 yrs of difference to the time period of the dataset Data from unknown or distinctly different area 0 0 Data on related processes or materials Data on related processes on laboratory scale or from different technology 0(G) 0.2(R.) 0.4 (L.) 0(G) 0.2(R.) 0.4 (L) Total Quality Class 0 (G) 1.4 (R.) 1.6 (L.) 0 (G) 1.4 (R.) 1.6 (L.) A A (G, G) B.B. (R,R) C .C (L,L) 0(G) 0.4 (R.L) 0(G) 0.4(R.L.) Indicator 1 -‐ Salt content : G, R, L Indicator 2 -‐ Fat content: G,R,L www.glamur.eu 93 4. Information and communication Criterion Score (DQI) Distance (DQD = 1-‐DQI) Reliability Quantitative of source data Qualitative data Completeness Temporal correlation Geographical correlation Further technological correlation DQG 5 1 0 Verified primary data base on measurements (or reported in a survey) G.R.L. Primary data based on survey/interview with qualified representative G.R.L. G.R.L. Representative data from all sites relevant for the SC considered over an adequate period. G.R.L. G.R.L. Less than 3 yrs of difference for the time period of dataset G.R.L. G.R.L. Data from area under study G.R.L. G.R.L. Data from enterprises, processes and materials under study DQI 4 0.8 0.2 Verified secondary data based on measurement of primary data based on qualified estimated G.R.L. Verified secondary data based on qualified sample Representative data from >50% of sites relevant for SC considered, over an adequate period Less than 6 yrs Average data from lger area in which the area under study is included Data from processes and materials under study (i.e. identical technology) but different enterprises DGI 3 0.6 0.4 Non-‐verified secondary data partly based on qualified estimates DQI 2 0.4 0.6 Qualified estimated (e.g. by industrial expert) DQI 1 Non-‐verified secondary data partly based on qualified estimates Representative data from only some sites (less than 50%) OR more than 50% but only for short periods Less than 10 yrs Qualified estimated (e.g. by industrial expert) Non-‐qualified estimate or non-‐verified secondary data Representative data from only one site relevant for SC considered or some sites but only for short periods Less than 15 yrs Representativeness of data is unknown or data from a small number of sites and from short periods. Age of data unknown or more than 15 yrs of difference to the time period of the dataset 0 0 Data from area with similar production conditions. Data from area with slightly similar production conditions Data from unknown or distinctly different area 0 0 Data from processes and materials under study but from different technology Data on related processes or materials Data on related processes on laboratory scale or from different technology 0 0 Total Quality Class Indicator 1 Communication between stakeholders along chain G, R, L Indicator 2 Availability of information to consumers G,R,L 0.2 0.8 Non-‐qualified estimate or non-‐verified secondary data 0 0 00 AA www.glamur.eu Score 0 0.2 94
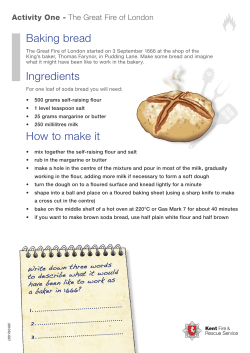
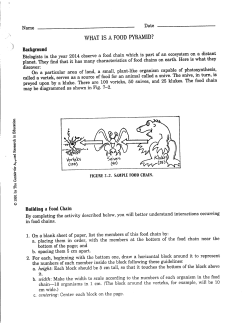


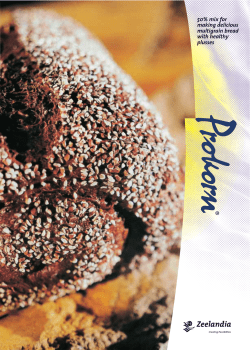
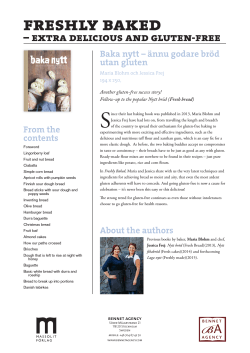
© Copyright 2026