
p-BIRNBAUM SAUNDERS DISTRIBUTION: APPLICATIONS TO RELIABILITY AND
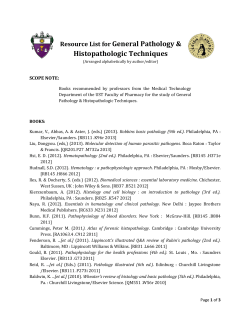
V.M.Chacko, Mariya Jeeja P V, Deepa Paul – p-BIRNBAUM SAUNDERS DISTRIBUTION: APPLICATIONS TO RELIABILITY AND ELECTRONIC BANKING
HABITS
RT&A # 01 (36)
(Vol.10) 2015, March
p-BIRNBAUM SAUNDERS DISTRIBUTION: APPLICATIONS TO
RELIABILITY AND ELECTRONIC BANKING HABITS
1
V.M.Chacko, 2Mariya Jeeja P V and 3Deepa Paul
1,2
Department of Statistics
St.Thomas College, Thrissur
Kerala-680001
e-mail:[email protected]
3
Department of Commerce
Goverment College, Kuttanellur, Thrissur
Kerala-680014
ABSTRACT
Birnbaum and Saunders (1969) introduced a two-parameter lifetime distribution which has been used quite successfully
to model a wide variety of univariate positively skewed data. Diaz-Garcia and Leiva-Sanchez proposed a generalized
Birnbaum Saunders distribution by using an elliptically symmetric distribution in place of the normal distribution. In
this paper, we construct a new distribution, say p-Birnbaum-Saunders distribution, by introducing a new parameter ‘p’,
which influences both Skewness and Kurtosis. The deviation from the behaviour of Birnbaum and Saunders distribution
can be accommodated in the new p-Birnbaum Saunders (p-BS) distribution. Different properties of this distribution are
obtained. Most of the data from Reliability and Banking sector is having skewness and their frequency curve is from
among the class of p-BS distribution. A data set from internet banking sector is considered.
1
INTRODUCTION
There are many distributions for modeling lifetime data. Among the known parametric
models, the most popular are the Birnbaum-Saunders, Gamma, lognormal and the Weibull
distributions. Sometimes, these are not appropriate for a given data. The two-parameter BirnbaumSaunders (BS) distribution was originally proposed by Birnbaum and Saunders [1969] as a failure
time distribution for fatigue failure caused under cyclic loading. It considered only the material
specimens which are subjected to fluctuating stresses by a periodic loading. Size of stress and crack
are random.
Although the BS distribution was originally proposed as a failure time distribution for fatigue
failure under the assumption that the failure is due to development and growth of a dominant crack,
a more general derivation was provided by Desmond [1985] based on a biological model. Desmond
[1985] also strengthened the physical justification for the use of this distribution by relaxing the
assumptions made originally by Birnbaum and Saunders [1969]. Some recent work on the BS
distribution can be found in Balakrishnan et al. [2007], Chang and Tang [1993,1994], Dupuis and
Mills [1998], From and Li [2006], Lemonte et al. [2007], Rieck [1995,1999], Ng et al. [2003,2006],
Owen [2006] and Xie and Wei [2007]. A review of different developments on the BS distribution
until 1995 can be found in the book by Johnson et al. [1995].
The objective of this work is to study the behavior of Birnbaum Saunders distribution with one
more relevant parameter. Not to argue its particular merits in applications over other distributions.
It is a reasonable generalization. We study some behavior of the Birnbaum-Saunders distribution
with one more parameter p, which influence both skewness and kurtosis strongly.
70
V.M.Chacko, Mariya Jeeja P V, Deepa Paul – p-BIRNBAUM SAUNDERS DISTRIBUTION: APPLICATIONS TO RELIABILITY AND ELECTRONIC BANKING
HABITS
RT&A # 01 (36)
(Vol.10) 2015, March
The paper is arranged as follows. Section 2 discussed basic definition of Birnbaum Saunders
distribution. Section 3 introduced, a new distribution, p-Birnbaum Saunders distribution and studied
some of its properties. Maximum likelihood estimation is given in section 4. Application to
reliability analysis and Banking Habits are given at the section 5. Conclusion is given in last
section.
2
BIRNBAUM SAUNDERS DISTRIBUTION
We considered the Birnbaum-Saunders data. It shows departure from the normality with s skewness
and peaked frequency curve. Distribution function of Birnbaum-Saunder distribution is
𝟏
𝒕
𝑭(𝒕, 𝜶, 𝜷) = 𝑵 ( 𝝃 ( )) , 𝒕 > 𝟎
𝜶
𝜷
𝒕
where N(.) is the Normal distribution evaluated at 𝝃 (𝜷) = [(𝒕/𝜷)𝟏/𝟐 − (𝒕/𝜷)−𝟏/𝟐 ], α>0 and β>0.
The parameters α and β are the shape and scale parameters, respectively. Moreover, β is the median
of the BS distribution. Consider the histogram of BS data and Normal curve drawn through it.
Table 1. Histogram of Birnbaum Saunders Data
The inference on this plot is this: It is a skewed data on positive axis. Mean of the
distribution is placed left to the Normal mean. Curve is more peaked than Normal. Left and right
tails have slight positive mass. Tail thickness is more than that of Normal tail. Existence of
moments can be ensured. Flatness is very low.
From the above inference we can make some reasonable conclusions. The actual distribution
will be positively skewed. Peakedness may vary with situation of varying stresses. But asymmetry
still remains. Either Birnbaum Saunders, log-Normal, skew-Normal, Weibull etc distributions can
be chosen as an approximate model.
71
V.M.Chacko, Mariya Jeeja P V, Deepa Paul – p-BIRNBAUM SAUNDERS DISTRIBUTION: APPLICATIONS TO RELIABILITY AND ELECTRONIC BANKING
HABITS
RT&A # 01 (36)
(Vol.10) 2015, March
But for the correctness in model selection, think about the smooth frequency curve drawn
through the histogram. What will be the function, having desirable distributional properties, that
suits our objective? Can we generalize Birnbaum Saunders distribution to approach more accuracy
in probability calculation? Choosing a suitable frequency curve is an important area of research of
distribution theory. A plausible model can be attained by aattaching one more parameter to the
Birnbaum Saunders distribution. We observed the behavior with different values of parameters.
3
p-BIRNBAUM SAUNDERS DISTRIBUTION
𝒕
𝒕
Use 𝝃𝒑 (𝜷) = [(𝒕/𝜷)𝒑 − (𝒕/𝜷)−𝒑 ] instead of 𝝃 (𝜷) = [(𝒕/𝜷)𝟏/𝟐 − (𝒕/𝜷)−𝟏/𝟐 ] in BS
distribution.
It gives us more suitable flexible model for the data. We define p-Birnbaum Saunders distribution
as follows
𝟏
𝒕
𝐹(𝑡, 𝜶, 𝜷, 𝒑) = 𝑵 ( 𝝃𝒑 ( )) , 𝒕 > 0
𝜶
𝜷
Probability density function is
𝟏
𝟏
𝟐
𝟐
𝜷 𝟏−𝒑
𝜷 𝟏+𝒑 −𝟏/𝟐𝜶𝟐 [(𝜷𝒕 )𝒑+(𝜷𝒕)𝒑−𝟐]
𝒇(𝒕, 𝜶, 𝜷, 𝒑) =
[( )
+ ( ) ]𝒆
,𝒕 > 𝟎
𝒕
𝜶𝜷𝒑√𝟐𝝅 𝒕
𝟏
Here α is the shape parameter and β is the scale parameter. The parameter p governs both shape and
scale. For all values of α the PDF is unimodal. Mode cannot be obtained in explicit form, it has to
be obtained by solving a non-linear equation in α. Clearly, the median is at β, for all α. Table 2,
table 3 and table 4 give the shape of probability density function for various values of parameters.
probability density function
p-Birnbaum Saunders
p=0.1,alpha=0.5, beta=1
p=0.4,alpha=0.5, beta=1
p=0.5,alpha=0.5, beta=1
p=0.6,alpha=0.5, beta=1
p=0.9,alpha=0.5, beta=1
Table 2. Probability density function of p-Birnbaum Distribution, alpha=0.5 and beta=1
72
V.M.Chacko, Mariya Jeeja P V, Deepa Paul – p-BIRNBAUM SAUNDERS DISTRIBUTION: APPLICATIONS TO RELIABILITY AND ELECTRONIC BANKING
HABITS
RT&A # 01 (36)
(Vol.10) 2015, March
p-Birnbaum Saunders
probability density function
"p=0.1, alpha=1.5,
beta=1"
"p=0.4, alpha=1.5,
beta=1"
"p=0.5, alpha=1.5,
beta=1"
"p=0.6, alpha=1.5,
beta=1"
"p=0.9, alpha=1.5,
beta=1"
Table 3. Probability density function of p-Birnbaum Distribution, alpha=2 and beta=1
probability density function
p-Birnbaum Saunders
p=0.1, alpha=2, beta=1
p=0.4, alpha=2, beta=1
p=0.5, alpha=2, beta=1
p=0.6, alpha=2, beta=1
p=0.9, alpha=2, beta=1
Table 4. Probability density function of p-Birnbaum Distribution, alpha=2 and beta=1.
73
V.M.Chacko, Mariya Jeeja P V, Deepa Paul – p-BIRNBAUM SAUNDERS DISTRIBUTION: APPLICATIONS TO RELIABILITY AND ELECTRONIC BANKING
HABITS
RT&A # 01 (36)
(Vol.10) 2015, March
•
All these models have slight skewness and departure from symmetric Normal distribution. They are
defined on positive axis. Peakedness changes with p. p-is a parameter which control both flatness
and skewness (Shape).
Let X = 1/2[(t/β)1/p -(t/β)-1/p ] then
𝜶𝟐
𝑿~𝑵(𝟎, )
𝟒
Using this transformation Expectation, variance, skewness and kurtosis can be obtained.
𝟏 𝒑
𝑬(𝑻) = 𝜷𝑬 (𝑿 + (𝑿𝟐 − 𝟏)𝟐 )
If p=2, we get
If p=2, we get
𝑬(𝑻) = 𝜷(𝟏 + 𝜶𝟐 /𝟐)
𝑽(𝑻) = (𝜷𝜶)𝟐 (𝟏 + 𝟓𝜶𝟐 /𝟒)
(𝟏𝟏𝜶𝟐 + 𝟔)
𝜷𝟏 (𝑻) = (𝟒𝜶)
(𝟓𝜶𝟐 + 𝟒)𝟑
𝟐
𝜷𝟐 (𝑻) = 𝟑 + 𝟔(𝜶)𝟐
(𝟗𝟑𝜶𝟐 + 𝟒𝟏)
(𝟓𝜶𝟐 + 𝟒)𝟐
3.1 properties of p-Birnbaum Saunders distribution
We obtained two important properties of p-Birnbaum Saunders distribution.
𝟏
𝒕
𝟏
𝒕
Theorem 1: If T has life distribution p-BS, 𝑭(𝒕, 𝜶, 𝜷, 𝒑) = 𝑵 (𝜶 𝝃𝒑 (𝜷)) , 𝒕 > 𝟎 then its
reciprocal 1/T has 𝑭(𝒕, 𝜶, 𝜷−𝟏 , 𝒑) distribution.
Proof: Using transformation, we can obtain the required result.
Theorem 2: If T has life distribution p-BS, 𝑭(𝒕, 𝜶, 𝜷, 𝒑) = 𝑵 (𝜶 𝝃𝒑 (𝜷)) , 𝒕 > 𝟎 then kT has
𝑭(𝒕, 𝜶, 𝒌𝜷 , 𝒑) distribution.
Proof: Using transformation, we can obtain the required result.
4. MAXIMUM LIKELIHOOD ESTIMATION
The log likelihood function is
𝒏
𝟏
𝟏
𝒕𝒊
𝒕𝒊
𝒍𝒐𝒈𝑳 = −𝒏𝒍𝒐𝒈𝜶 − 𝒏𝒍𝒐𝒈𝜷 − 𝒏𝒍𝒐𝒈𝒑 + ∑{− 𝒍𝒐𝒈(𝟐𝝅) − 𝜶−𝟐 𝝃𝒑 ( ) + 𝒍𝒐𝒈𝝃′ 𝒑 ( )}
𝟐
𝟐
𝜷
𝜷
𝒊=𝟏
Then,
74
V.M.Chacko, Mariya Jeeja P V, Deepa Paul – p-BIRNBAUM SAUNDERS DISTRIBUTION: APPLICATIONS TO RELIABILITY AND ELECTRONIC BANKING
HABITS
RT&A # 01 (36)
(Vol.10) 2015, March
All these three equations are non-linear, we need to use numerical procedure to solve it.
5. APPLICATIONS TO RELIABILITY AND ELECTRONIC BANKING HABITS
The motivation of this work is coming from the fatigue failure data given in Birnbaum and
Saunder (1969). Also many real situations in banking sector shows the behaviour of the p-Birnbaum
Saunders distribution.
Deepa Paul (2012) conducted a survey of Banking habits in the usage of internet banking, ATM,
mobile banking and branch banking. Some variables have the property specified in Theorem 1 and
Theorem 2. Variables in five point likert scale are dii, diii, and div, where dii=Technology enabled
services are quick to use than visiting the bank branch personally, diii= ATM saves much time,
div= ATMs are more accurate than human tellers.
Histogram of dii
Histogram of diii
Normal
Normal
16
Mean
StDev
N
14
10
12
Frequency
12
8
6
2.809
1.313
47
10
8
6
4
4
2
0
Mean
StDev
N
16
2
0
1
2
3
dii
4
5
6
0
0
1
2
3
4
5
diii
Histogram of div
Normal
20
Mean
StDev
N
15
Frequency
Frequency
14
18
3.128
1.312
47
10
5
0
75
0
1
2
3
div
4
5
2.851
1.285
47
V.M.Chacko, Mariya Jeeja P V, Deepa Paul – p-BIRNBAUM SAUNDERS DISTRIBUTION: APPLICATIONS TO RELIABILITY AND ELECTRONIC BANKING
HABITS
RT&A # 01 (36)
(Vol.10) 2015, March
All these histograms shows departure from normality and more suitable for p-Birnbaum Saunders
distribution.
6. CONCLUSIONS
This three parameter distribution is more plausible model for the distribution of fatigue failure.
Moreover the shape of density curve with various skewness and kurtosis provide a well defined
class of life distributions useful in reliability and social sciences. Snedecor’s F distribution has the
property that reciprocal is also F, similar property holds for p-Birnbaum Saunders distribution.
ACKNOWLEDGEMENTS: This work has been presented at National Level Conference on
Interdisciplinary realms of Statistics, Jan 9-10, 2015.
REFERENCES
1. Balakrishnan, N., Leiva, V., Lopez, J. (2007), "Acceptance sampling plans from trun-cated
life tests based on the generalized Birnbaum-Saunders distribution", Communications in
Statistics Simulation and Computation, vol. 36, 643-656.
2. Birnbaum, Z. W. and Saunders, S. C. (1969). \A new family of life distribution", Journal of
Applied Probability, vol. 6, 319-327.
3. Birnbaum, Z. W. and Saunders, S. C. (1969). \Estimation for a family of life distributions
with applications to fatigue", Journal of Applied Probability, vol. 6, 328-347.
4. Chang, D. S. and Tang, L. C. (1993). Reliability bounds and critical time for the Birnbaum
Saunders distribution", IEEE Transactions on Reliability, vol. 42, 464-469.
5. Chang, D. S. and Tang, L. C. (1994). Percentile bounds and tolerance limits for the
Birnbaum Saunders distribution", Communications in Statistics Theory and Methods, vol.
23, 2853-2863.
6. Desmond, A. F. (1985). Stochastic models of failure in random environments", Canadian
Journal of Statistics, vol. 13, 171-183.
7. Deepa Paul (2012) A study on the Banking Habits of People of Kerala, Ph.D. Thesis,
University of Calicut.
8. Dupuis, D. J. and Mills, J. E. (1998). \Robust estimation of the Birnbaum Saunders
distribution", IEEE Transactions on Reliability, vol. 47, 88-95.
9. Li, L.X. (2006). "Estimation of the parameters of the Birnbaum-Saunders distribution",
Communications in Statistics Theory and Methods, vol. 35, 2157-2169.
10. Johnson, N. L., Kotz, S. and Balakrishnan, N. (1995). Continuous Univariate Distributions,
Vol. 2, Second edition, John Wiley & Sons, New York.
11. Lemonte, A.J., Cribari-Neto, F., Vasconcellos, K.L.P. (2007). Improved statistical inference
for the two-parameter Birnbaum-Saunders distribution", Computational Statistics and Data
Analysis, vol. 51, 4656-4681.
12. Ng, H. K. T., Kundu, D. and Balakrishnan, N. (2003). \Modified moment estimation for the
two-parameter Birnbaum-Saunders distribution", Computational Statistics & Data Analysis,
vol. 43, 283-298.
13. Ng, H. K. T., Kundu, D. and Balakrishnan, N. (2006). " Point and interval estimation for the
two-parameter Birnbaum-Saunders distribution based on Type-II censored samples",
Computational Statistics & Data Analysis, vol 50, 3222-3242.
14. Owen, W.J. (2006). "A new three-parameter extension to the Birnbaum-Saunders distribution" IEEE Transactions on Reliability, vol. 55, 475-479.
15. Rieck, J. R. (1995). Parametric estimation for the Birnbaum{Saunders distribution based on
symmetrically censored samples", Communications in Statistics Theory and Methods, vol.
24, 1721-1736.
76
V.M.Chacko, Mariya Jeeja P V, Deepa Paul – p-BIRNBAUM SAUNDERS DISTRIBUTION: APPLICATIONS TO RELIABILITY AND ELECTRONIC BANKING
HABITS
RT&A # 01 (36)
(Vol.10) 2015, March
16. Rieck, J. R. (1999). A Moment-generating function with application to the Birnbaum
Saunders distribution", Communications in Statistics Theory and Methods, vol. 28, 22132222.
17. Xie, F.C. and Wei, B.C. (2007). \Diagnostics analysis for log-Birnbaum-Saunders regression models", Computational Statistics & Data Analysis, vol. 51, 4692-4706.
77


© Copyright 2026