
notes to the financial statements
Haw Par Corporation Limited
annua l re p o rt 20 14
1
Corporate Profile
16
Five-Year Financial Summary
111
Major Products & Services
2
Chairman’s Statement
17
Share Price & Trading Volume
112
Statistics of Shareholdings
6
Board of Directors
18
Operations Review
114
Notice of Annual General Meeting
10
Corporate Information
26
People & The Community
11
Management Listing
30
Financial Review
12
Key & Senior Executives
33
Corporate Governance Report 2014
14
Group Financial Highlights
44
Statutory Reports & Financial Statements
15
Financial Calendar
110
Group Offices
Proxy Form
CORPORATE PROFILE
Haw Par Corporation Limited has been listed on The Singapore Exchange
since 1969.
Headquartered in Singapore, the Group’s core healthcare and leisure
businesses promote healthy lifestyles through its healthcare products and
oceanariums.
Haw Par’s healthcare products are manufactured and marketed under its
various established brands - Tiger Balm and Kwan Loong. Tiger Balm, a
renowned ointment is used worldwide to invigorate the body as well as
to relieve aches and pains. Its product extensions such as Tiger Balm
Medicated Plaster, Tiger Balm Joint Rub, Tiger Balm Neck and Shoulder
Rub, Tiger Balm Mosquito Repellent Patch and Tiger Balm ACTIVE range
cater to the lifestyle needs of a new health-conscious generation.
The Group owns and operates two oceanariums, namely Underwater World
Singapore at Sentosa and Underwater World Pattaya in Thailand.
The Group also has interests in investment properties and manages its
own portfolio of investments in securities.
The Group’s primary corporate strategy is to expand its core healthcare and
leisure businesses through product extensions under its own established
brands, form strategic alliances with partners in various key markets and
explore acquisition of compatible businesses. It also aims to manage
efficiently its portfolio of investments in properties and securities to achieve
a reasonable return.
Core Operations
Healthcare
Investments
Haw Par Healthcare Limited
Tiger Balm (Malaysia) Sdn. Bhd.
Xiamen Tiger Medicals Co., Ltd
Haw Par Investment Holdings Private
Limited
Straits Maritime Leasing Private
Limited
Pickwick Securities Private Limited
Haw Par Equities Pte Ltd
Haw Par Trading Pte Ltd
M & G Maritime Services Pte. Ltd.
Haw Par Capital Pte Ltd
Haw Par Securities (Private) Limited
Haw Par Brothers International
(H.K.) Limited
Haw Par Pharmaceutical Holdings
Pte. Ltd.
Leisure
Haw Par Leisure Pte Ltd
Underwater World Singapore Pte Ltd
Underwater World Pattaya Ltd
Property
Haw Par Properties (Singapore)
Private Limited
Haw Par Centre Private Ltd
Setron Limited
Haw Par Land (Malaysia) Sdn. Bhd.
Associated Companies
Hua Han Bio-Pharmaceutical Holdings
Limited
UIC Technologies Pte Ltd
annual report 2014
1
chairman’s statement
+9%
TURNOVER S$154.2M
During 2014, a number of significant events
adversely impacted the world economy and
businesses in Asia. In particular, travel mishaps
and currency devaluations both negatively affected
tourist sentiments. Singapore recorded its first
drop in tourist arrival since 2009. Wage pressures
remained high amidst tight labour constraints
especially in South East Asia. Inflationary pressure
however eased as commodities went down, led
by a slide in oil prices.
I am pleased to report however that the Group
turnover increased 9% to $154.2m with strong
contribution from the sale of Healthcare products.
Profit from operations increased 16% to $112.0m
(2013: $96.6m) due mainly to higher profit from
Healthcare and increases in investment income.
Total earnings for the financial year ended 31
December 2014 increased 10% to $118.8m
(2013:$107.9m).
Besides the increased turnover in Healthcare,
lower costs of raw materials, as well as favourable
foreign exchange rates, helped to improve
margins. Profits increased 31% to $33.9m (2013:
2
Haw Par Corporation Limited
$25.9m). Leisure revenue was $15.6m, which
was 24% lower than the previous year, due to
declining visitorship and competition. Property
was affected by lower occupancy rate with a
profit of $12.4m (2013: $13.4m).
Highlights of Operations
Healthcare recorded higher sales, based on
sales of new products that were launched over
the past years. The Company benefited from the
trusted products that it makes and markets. New
products like the Tiger Balm Mosquito Repellant
products have been well received by the markets.
Leisure was affected by declining visitorship
and competition from newer attractions both
in Singapore and Thailand. Underwater World
Singapore focused on different customer segments
to differentiate itself from the competition.
Underwater World Pattaya was affected by
lower tourist arrivals. Upgrading of facilities and
displays were progressively done to maintain the
competitiveness of Underwater World in Pattaya.
+10%
PROFIT AFTER TAX S$118.8M
Dividend
Acknowledgement
The Board recommends a final tax-exempt (onetier) dividend of 14 cents per share. Together
with the interim dividend of 6 cents paid in
September, the total dividend per share for the
financial year ended 31 December 2014 is 20
cents per share.
On behalf of the Board, I would like to welcome
Mr Gn Hiang Meng, our new independent
director, who was appointed to the Board in
August 2014. Mr Gn brings with him more than
30 years of investment banking and hospitality
industry experience. His skills and experience
will complement the Board’s expertise and
contribute to the diversity of skills and overall
effectiveness of the Board.
2015 Business Outlook and Strategy
Many factors in the markets we operate in can
dampen future growth. The Group continues
to seek more productive ways of managing its
businesses. Healthcare is well positioned to see
growth in key Asian markets. Leisure will continue
to meet challenges from intense competition
both in Singapore and Thailand.
The Group continues to seek new investments
to add to our core businesses.
On behalf of the Board, I would also like to
thank all stakeholders including our customers,
business associates and shareholders for their
unwavering support and, management and staff
for their commitment and dedication.
I would also like to express my most sincere
gratitude to my fellow Board members for their
wise counsel and guidance in the past year.
Wee Cho Yaw
Chairman
annual report 2014
3
主席致辞
+9%
营业额1亿5,420万元
2014 年,许多事件对世界经济和亚洲的
企业造成不利影响。特别是航空事故和
货币贬值对旅游业带来冲击。新加坡自
2009 年以来入境游客数量首次下降。东
南亚地区仍受劳动力紧缺造成的薪资压
力影响。然而,油价引领的大宗商品价
格下跌,使得通胀压力有所缓解。
游客人数下降与竞争激烈,收入为1,560
万元,较上年下降24%。物业受出租率
较低的影响,盈利为1,240万元(2013
年:1,340万元)。
集团的营业额增长9%,达到1亿5,420
万元,其中来自保健产品销售的贡献突
出。营业盈利增长16%,达到1亿1,200
万元(2013年:9,660万元),主要受
益于保健业务较高的盈利和投资收入的
增加。截至2014年12月31日,总计财年
税后净盈利增加了10%,达到1亿1,880
万元(2013 年:1亿790万元)。
近几年來推出的新产品促进了保健业务
的销售额增加。业务增长也得益于本公
司制造和营销产品的良好声誉。虎标驱
蚊贴等新产品受到市场的欢迎。
保健业务除了营业额增加,原料成本
较低以及有利的汇率有助于提高盈利
率。盈利增长了31%,达到3,390万元
(2013年:2,590万元)。休闲业务因
4
Haw Par Corporation Limited
营运重点摘要
新加坡和泰国休闲业务受游客数量下降
以及新开放旅游景点的竞争影响。新加
坡海底世界仍专注于不同的客户群,以
便实现差异化竞争优势。芭堤雅海底世
界在旅游人数下降的情况下,受到影
响。另一方面,芭堤雅海底世界逐步完
成了对设施与展示的翻新,以便保持景
点的竞争力。
+10%
除税后盈利1亿1,880万元
股息
鸣谢
董事局建议派发年終(单一)免税股息
每股14分。加上九月派发的中期股息每
股6分,截至2014年12月31日财年的每
股总计股息为20分。
本人代表董事局欢迎鄞宪民先生,他于
2014年8月受委任为独立董事。鄞先生
拥有30多年的投资银行和酒店业经验。
鄞先生的丰富经验有助于扩大董事局的
专业领域视野,为董事局的整体效能做
出贡献。
2015年业务展望及策略
在本集团营运的市场,有许多因素可能
抑制未来的增长。本集团将继续寻求更
高效率的管理方式。保健业务的良好
定位将有助于实现在亚洲关键市场的增
长。集团在新加坡和泰国的休闲业务将
继续面对激烈的竞争。
本集团将继续寻求新的投资机会,增加
集团的核心业务。
本人谨此代表董事局感谢客户、商业伙
伴和股东对本集团坚定不移的支持,以
及管理层和全体员工对工作的全力投入
和贡献。
本人也对董事局同仁过去一年提供的真
知灼见和指导致以谢意。
黄祖耀
主席
annual report 2014
5
Board of directors
WEE CHO YAW
Non-Executive Chairman
WEE EE LIM
President & CEO
SAT PAL KHATTAR
Independent Director
HWANG SOO JIN
Independent Director
Dr Wee Cho Yaw, aged 85, has been Chairman of the Company and of the Haw
Par Group since 1978. He was appointed to the Board on 31 October 1975 and
was last re-appointed on 28 April 2014. He is the Chairman of the Investment
Committee and a member of the Remuneration and Nominating Committees.
Mr Wee Ee Lim, aged 53, joined the
Group in 1986 and became President
& CEO of Haw Par Corporation Limited
in 2003. He was appointed to the
Board on 23 March 1994 and was
last re-elected on 24 April 2013. Mr
Wee is a member of the Investment
Committee. He has been closely involved
in the management and growth of the
Group over the last 28 years.
Mr Sat Pal Khattar, aged 72, was a
founding partner and later consultant
in Messrs KhattarWong with over
40 years’ experience in the legal
profession. He was appointed to the
Board on 1 January 1977 and was
last re-appointed on 28 April 2014.
He is Chairman of the Remuneration
and Nominating Committees.
Mr Hwang Soo Jin, aged 79, is a
chartered insurer with more than 50
years of business experience. He was
appointed to the Board on 28 October
1986 and was last re-appointed on
28 April 2014. He is a member of the
Audit and Remuneration Committees.
A career banker with more than 50 years’ experience in the banking industry, Dr
Wee is Chairman Emeritus and Advisor of United Overseas Bank Limited and Far
Eastern Bank Limited. He chairs the boards of United Overseas Insurance Limited,
UOL Group Limited, Pan Pacific Hotels Group Limited, United Industrial Corporation
Limited, Marina Centre Holdings Private Limited and Wee Foundation.
He was Chairman of United International Securities Limited from 1973 till 2013
and of Singapore Land Limited from 1996 till 2014.
He is Honorary President of the Singapore Federation of Chinese Clan Associations,
Singapore Hokkien Huay Kuan and Singapore Chinese Chamber of Commerce
& Industry.
He is a Director of United Industrial
Corporation Limited, UOL Group Limited
and Hua Han Bio-Pharmaceutical
Holdings Limited (a company listed
on the Hong Kong Stock Exchange)
and Wee Foundation.
Dr Wee received Chinese high school education and was conferred Honorary Degree
of Doctor of Letters by National University of Singapore in 2008 and by Nanyang
Technological University in August 2014. He is currently the Pro-Chancellor of
Nanyang Technological University.
He was a Director of Pan Pacific Hotels
Group Limited from 2006 till 2013
and of Singapore Land Limited from
1999 till August 2014.
Dr Wee was conferred the Businessman Of The Year award twice at the Singapore
Business Awards in 2001 and 1990. He received the inaugural Credit Suisse-Ernst
& Young Lifetime Achievement Award in 2006 for his outstanding achievements in
the Singapore business community and The Asian Banker’s Lifetime Achievement
Award in 2009. For his contributions to the community and to education, Dr Wee
received in 2011 the Distinguished Service Order, Singapore’s highest National
Day Award.
He holds a Bachelor of Arts (Economics)
degree from Clark University, USA.
He is the Chairman and Director
of Khattar Holdings Pte Ltd Group
of Companies which is principally
engaged in investments. He is also
a Director of the Institute of South
Asian Studies.
He was Chairman of Guocoland Limited
from 1990 till 2012, Director of Guoco
Group Limited from 1991 till 2012
and that of GuocoLeisure Limited
from 2009 till 2012.
He was also Chairman of the Board
of Trustees of the Singapore Business
Federation and Member of Presidential
Council for Minority Rights till 2012
after completing various terms.
Mr Hwang is the Chairman Emeritus,
Director and Senior Advisor of Singapore
Reinsurance Corporation Ltd, a Director
of United Industrial Corporation Limited
and United Overseas Insurance Limited.
He was a Director of Singapore Land
Limited from 2003 till August 2014.
He is a Chartered Insurer of the
Chartered Insurance Institute, UK,
an advisor to the ASEAN Insurance
Council, an Honorary Fellow of The
Singapore Insurance Institute and a
Justice of the Peace.
He holds a LLM degree and LLB
(Hons) degree from the University
of Singapore.
He was presented the SICCI-DBS
Singapore-India Business Award in
2009 and was bestowed the Padma
Shri award by the President of India
in 2011.
6
Haw Par Corporation Limited
annual report 2014
7
Board of directors
Lee Suan Yew
Independent Director
WEE EE-chao
Non-Executive Director
Chew Kia Ngee
Independent Director
Peter Sim Swee Yam
Independent Director
Gn Hiang Meng
Independent Director
Han Ah Kuan
Executive Director
Dr Lee Suan Yew, aged 81, is a
medical practitioner with over 50
years’ experience. He was appointed
to the Board on 18 December 1995
and was last re-appointed on 28 April
2014. He is a member of the Audit
and Nominating Committees.
Mr Wee Ee-chao, aged 60, is a nonexecutive and non-independent director.
He was appointed to the Board on 8
July 2003 and was last re-elected on
25 April 2012.
Dr Chew Kia Ngee, aged 69, is a
Chartered Accountant with about
40 years’ experience in the public
accounting profession. He was appointed
to the Board on 11 May 2011 and was
last re-elected on 28 April 2014. He
was appointed the Chairman of the
Audit Committee in 2013.
Mr Peter Sim, aged 59, is a practising
lawyer and Director of Sim Law Practice
LLC and has more than 30 years of
legal practice. He was appointed to
the Board on 11 May 2011 and was
last re-elected on 28 April 2014.
Mr Gn Hiang Meng, aged 67, is a
Non-Executive Independent Director.
He was appointed to the Board on 13
August 2014. He is also presently an
advisor to Cairnhill Group Holdings
Pte Ltd and has more than 30 years
of investment banking and hospitality
industry experience.
Mr Han Ah Kuan, aged 66, joined
the Group in 1991 as the General
Manager of Haw Par Healthcare
Limited (“HPH”) and was appointed
as a director of HPH in 1995. He was
appointed to the Board on 28 January
2005 and was last re-elected on 24
April 2013. He is a member of the
Investment Committee.
Dr Lee is an independent Director of
K1 Ventures Limited.
He was appointed Justice of the Peace
in 1998. Dr Lee was President of the
Singapore Medical Council for 4 years
(2000 – 2004) and was also Chairman
of the Singapore National Medical
Ethics Committee (2007 and 2008).
For his numerous public services, he
was awarded the Public Service Star
in 1991 and Public Service Star (Bar)
in 2002.
He holds a M.B.B. Chir. degree from
the University of Cambridge and MRCP
and FRCP from the Royal College of
Physicians, Glasgow.
8
Haw Par Corporation Limited
Mr Wee is the Chairman and Managing
Director of UOB-Kay Hian Holdings
Limited. He is a Director of UOL Group
Limited and Wee Foundation. He also
manages Kheng Leong Company (Private)
Limited which is involved in real estate
development and investments.
He was a Director of Pan Pacific Hotels
Group Limited from 2006 till 2013.
He holds a Bachelor of Business
Administration degree from The
American University, Washington
DC, USA.
He is a board member of the Singapore
Eye Foundation and a member of the
audit committee of Kong Meng San
Phor Kark See Monastery.
He was the Chairman and Independent
Director of AusGroup Ltd from 2006
till November 2014.
He holds a Bachelor of Economics
(Honours) degree from the University
of Malaya, a Master of Commerce
from the University of Melbourne and
a PhD in Business and Management
from the University of South Australia.
He is a Fellow of the Institute of
Chartered Accountants in Australia,
CPA Australia and the Institute of
Singapore Chartered Accountants.
Mr Sim is currently an Independent
Director of Lum Chang Holdings Ltd,
Marco Polo Marine Ltd and Mun Siong
Engineering Ltd. He sits on the Board
of Young Men’s Christian Association
(YMCA) of Singapore and the Singapore
Heart Foundation.
He was a Director of Pacific Healthcare
Holdings Ltd from 2005 till 2011, and
that of British and Malayan Trustees
Limited from 1997 till 2013 and
Latitude Tree International Group Ltd
from 2011 till January 2014.
He holds a degree in law from the
then University of Singapore (now
known as the National University
of Singapore).
He was awarded the Pingat Bakti
Masyarakat in 2000 and Bintang
Bakti Masyarakat in 2008.
Mr Gn was a senior banker with the
United Overseas Bank Group for 28
years. He was the Deputy President
of UOL Group prior to his retirement
in 2007.
He holds a Bachelor of Business
Administration (Hons) degree from
the University of Singapore.
He is currently a Non-Executive and
Independent Director of Centurion
Corporation Limited, Koh Brothers
Group Limited, Tee International
Limited and SingHaiyi Group Limited.
He was a Non-Executive and Independent
Director of United International
Securities Limited from 2011 till 2013.
Mr Gn holds a Bachelor of Business
Administration (Honours) degree from
the National University of Singapore.
annual report 2014
9
corporate information
management listing
Directors
Remuneration Committee
Corporate Office
Wee Cho Yaw
Chairman (Non-Executive)
Sat Pal Khattar
Chairman
Wee Ee Lim
President & Chief Executive Officer
Wee Ee Lim
President & Chief Executive Officer
Wee Cho Yaw
Han Ah Kuan
Executive Director
Sat Pal Khattar
Independent Director
Hwang Soo Jin
Independent Director
Lee Suan Yew
Independent Director
Wee Ee-Chao
Non-Executive Director
Chew Kia Ngee
Independent Director
Peter Sim Swee Yam
Independent Director
Gn Hiang Meng
Independent Director
Han Ah Kuan
Executive Director
Audit Committee
Chew Kia Ngee
Chairman
Hwang Soo Jin
Lee Suan Yew
Investment Committee
Wee Cho Yaw
Chairman
Hwang Soo Jin
Company Secretary
Zann Lim
Auditors
PricewaterhouseCoopers LLP
Yee Chen Fah (From 2013)
Audit Partner-in-charge
Registrar
Boardroom Corporate & Advisory
Services Pte Ltd
50 Raffles Place #32-01
Singapore Land Tower
Singapore 048623
Tel
: 6536 5355
Fax : 6536 1360
401 Commonwealth Drive
#03-03 Haw Par Technocentre
Singapore 149598
Tel
: 6337 9102
Fax
: 6336 9232
Website: www.hawpar.com
Reg. No: 196900437M
Investor relations
Han Ah Kuan
Email: [email protected]
Sat Pal Khattar
Chairman
Wee Cho Yaw
Zann Lim
Chief Financial Officer &
Group Company Secretary
Shiu Siew Leng
Group Internal Audit Manager
Chris Lee
Legal Counsel
Alvin Chiew
Group Finance Manager
George Giang
Group Human Resource Manager
Ng Wah Tong
Deputy General Manager
(Manufacturing)
Song Teng Soo
Group Finance Manager
Aninthaya Soonsatham
Country Manager
(Thailand & Indochina)
Jenny Lam
Country Manager
(Hong Kong & Macau)
Ben Song
Country Manager
(China)
Vijay Arora
Country Manager
(India)
Paul Chow Say Suan
Head, Asset Management
Evelyn Tan
Country Manager
(Malaysia)
Lee Tang Ling
Corporate Communications Manager
Yap Yee Sah
Brand Manager
Tan Quee Kim
Corporate Secretarial Manager
Tey Chee Tiong
Regional Manager
Registered Office
Wee Ee Lim
Nominating Committee
Tarn Sien Hao
Group General Manager
Leisure
Healthcare
Han Ah Kuan
Executive Director
Goh Bee Leong
Director & General Manager
(Manufacturing)
Jasmin Hong
General Manager
(Marketing)
Keeth Chua
Deputy General Manager
(Marketing)
Joyce Lum
Regional Manager
Fion Pang
Regional Manager
Tarn Sien Hao
Director, Leisure
Kwek Meng Tiam
Regional General Manager, Leisure
Peter Chew
General Manager,
Underwater World Singapore
Kelvin Whang
General Manager,
Underwater World Pattaya
Anthony Chang
Curator,
Underwater World Singapore
Grace Ng
Director (Sales & Marketing),
Underwater World Singapore
Desmond Tung
Finance Manager,
Underwater World Singapore
Property
Tarn Sien Hao
Director, Property
Betty Khoo
Group Finance Manager
P. Tamilmahran
Facilities Manager
Felicia Low
Regional Manager
Soh Wee Kuan
Production Manager
Ling Chiew Eng
Manager
(Quality and Regulatory Compliance)
Tai Voon San
Director & Plant Manager, Malaysia
Kow Mui Lick
Senior Manager
(Quality and Regulatory Affairs)
Lee Suan Yew
10
Haw Par Corporation Limited
annual report 2014
11
key & senior executives
Tarn Sien Hao
Group General Manager
Joined the Group in 2001 as Deputy General
Manager (Corporate Development) and was
promoted to the position of General Manager
(Corporate Development) in 2005 and General
Manager (Corporate Development and Property
Division) in 2010. Appointed to the present
position in 2012.
Holds a Master of Business Administration from
the University of Dubuque.
Zann Lim
Chief Financial Officer &
Group Company Secretary
Joined the Group in 2006 as Group Finance
Manager and promoted to Group Financial
Controller & Group Company Secretary in 2008.
Promoted to present position in 2013.
Holds a Master of Business Administration from
INSEAD and Tsinghua University. A member of
the Institute of Singapore Chartered Accountants.
Shiu Siew Leng
Group Internal Audit Manager
Joined the Group in 1991 as Internal Auditor and
promoted to Assistant Internal Audit Manager
in 2003 and Internal Audit Manager in 2008.
Promoted to the present position in 2012.
Holds a Bachelor’s Degree in Accountancy from
the National University of Singapore. A member of
the Institute of Singapore Chartered Accountants.
12
Haw Par Corporation Limited
Goh Bee Leong
Director & General Manager (Manufacturing),
Healthcare
Jasmin Hong
General Manager (Marketing),
Healthcare
Peter Chew
General Manager,
Underwater World Singapore
Joined Haw Par Healthcare in 1977 as Quality
Control Pharmacist. Promoted to present position
in 2006.
Joined Haw Par Healthcare in 2004 as Deputy
General Manager (Marketing). Promoted to current
position in 2014.
Holds a Bachelor of Science (Pharmacy) from
the University of Singapore.
Holds a Bachelor of Commerce degree from the
University of Melbourne.
Joined Underwater World Singapore in 1994
as Front Office Executive. Seconded to PGF
Golf Driving Range in 1998 as Range Manager.
Returned to Underwater World Singapore as a
Senior Marketing Executive in 2000. Promoted
to Assistant Director (Sales & Marketing) in
2007 and to Deputy General Manager in 2010.
Promoted to current position in 2012.
Kow Mui Lick
Senior Manager (Quality & Regulatory Affairs),
Healthcare
Keeth Chua
Deputy General Manager (Marketing),
Healthcare
Joined Haw Par Healthcare in 1991 as QC /
Laboratory Manager and promoted to Senior
Manager (QC & QA) in 2007. Appointed to present
position in 2011.
Joined Haw Par Healthcare in 2011 as Deputy
General Manager (Marketing).
Holds a Bachelor of Science (Chemistry) from
the University of Singapore.
Ng Wah Tong
Deputy General Manager (Manufacturing),
Healthcare
Joined Haw Par Healthcare in 2009 as Production
Manager, promoted to Manufacturing Manager
in 2012. Promoted to present position in 2013.
Holds a Bachelor of Science (Pharmacy) from
the National University of Singapore.
Holds a Bachelor of Business in Business
Administration from the Royal Melbourne Institute
of Technology.
Holds a General Certificate of Education – Ordinary
Level.
Anthony Chang
Curator,
Underwater World Singapore
Joined Underwater World Singapore and appointed
to his current position as Curator in 2009.
Kwek Meng Tiam
Regional General Manager,
Leisure
Holds a Master of Science Degree from Capella
University.
Joined Underwater World Singapore in 1991
as Maintenance Superintendent. Promoted to
Operations Director in 2002 and General Manager
of Underwater World Singapore Pte Ltd in 2005.
Promoted to current position in 2010.
Kelvin Whang
General Manager,
Underwater World Pattaya
Holds a Bachelor of Arts in Business Studies,
The Open University, UK.
Joined Underwater World Pattaya in 2008 as
Marketing Manager. Promoted to his present
position in 2011.
Attended college education at Dominion College,
Ontario.
annual report 2014
13
group financial highlights
Financial Highlights
Turnover
$154.2M
TuRNOvER (%)
2014
Profit Before Tax
Assets
$127.0M
PROFIT CONTRIBuTION (%)
2014
$2.8B
+9.2%
TURNOVER
Group turnover increased 9.2% from $141.2 million to $154.2 million
mainly from Healthcare. Profits from operations increased 15.9%
to $112.0 million contributed by Healthcare and higher investment
income. Profit after tax increased 10.1% to $118.8 million mainly
due to higher profitability from Healthcare, higher investment income
and higher share of results from associated companies.
Healthcare contributed a higher percentage of the Group’s turnover
from 73.3% in 2013 to 79.3% in 2014 from higher sales in key
Asian markets. Percentage of profit contribution to the Group from
Healthcare also increased from 23.9% in 2013 to 26.6% in 2014
due to higher profitability from the division and decrease in profit
from Leisure and Property.
Percentage of the Group’s total assets employed by Healthcare,
Leisure and Property decreased compared to prior year. Increase in
assets employed was mainly due to higher market valuation of the
Group’s Investment portfolio.
ASSETS EMPLOyED (%)
2014
Financial Position
Shareholders’ funds increased by 14.8% to $2,807.5 million mainly
due to the higher market valuation of the Group’s available-for-sale
financial assets and profits from operating divisions.
+10.1%
PROFIT AFTER TAX
Healthcare79.3
Leisure
10.1
Property10.6
Healthcare26.6
Leisure
2.0
Property9.7
Investment61.7
Healthcare3.7
Leisure
2.0
Property7.8
Investment86.5
2013
2013
2013
Healthcare73.3
Leisure
14.5
Property12.2
14
Haw Par Corporation Limited
Healthcare23.9
Leisure
3.5
Property12.4
Investment60.2
Healthcare4.0
Leisure
2.4
Property8.4
Investment85.2
The Group ended the financial year with net cash balances of $223.1
million, after dividend payments of $43.8 million. Cash generated
by operating activities was $58.1 million in 2014.
Dividends
A second & final dividend of 14 cents per share is being proposed at
the coming Annual General Meeting. Together with the interim dividend
of 6 cents paid in September 2014, the total dividend per share for
the financial year ended 31 December 2014 is 20 cents per share.
Financial calendar
DateEvent
14 May 2014
Announcement of 2014 1st quarter results
13 August 2014
Announcement of 2014 2nd quarter results
4 September 2014
Payment of 2014 first and interim dividend
13 November 2014
Announcement of 2014 3rd quarter results
27 February 2015
Announcement of 2014 full-year audited results
8 April 2015
Announcement of Notice of Annual General Meeting
28 April 2015
46th Annual General Meeting
25 May 2015
Proposed books closure date for dividend entitlement
4 June 2015
Proposed payment of 2014 second and final dividend
annual report 2014
15
five-year financial summary
Results ($’000)
Group turnover
Profit from operations
- Healthcare
- Leisure
- Property
- Investment
- Unallocated expenses
Associates’ contribution
Fair values gains/(losses) on
investment properties
Profit before taxation
Profit attributable to equity holders
of the Company
2014
2013
2012
2011
2010
154,222
111,976
33,885
2,513
12,377
66,850
(3,649)
11,917
3,075
141,176
96,574
25,871
3,776
13,395
57,002
(3,470)
8,039
10,664
139,349
84,526
17,155
11,881
12,925
48,587
(6,022)
19,308
23,492
132,675
77,816
15,643
(1,893)
13,138
55,691
(4,763)
8,656
(97)
129,761
84,806
16,157
12,585
12,336
48,993
(5,265)
23,521
15,436
126,968
118,825
115,277
107,919
127,326
119,965
86,375
79,808
123,763
115,099
earnings per share and net dividend per share
cents
60.00
50.00
40.00
30.00
20.00
10.00
Per share
Earnings (cents)
Dividend net (cents)
Dividend cover (times)
Statement of Financial Position
($’000)
Shareholders’ funds
Non-controlling interests
Property, plant and equipment
Investment properties
Associated companies
Available-for-sale financial assets
(“AFS”)
Intangible assets & other long term
assets
Other net current assets
(excluding AFS)
Long term liabilities
Net assets
54.3
20.0
2.7
49.4
20.0
2.5
55.1
18.0
3.1
36.6
18.0
2.0
52.9
18.0
2.9
2,807,465
2,807,465
2,444,721
2,444,721
2,253,217
2,253,217
1,788,970
1,788,970
1,951,892
7,756
1,959,648
33,187
225,249
137,690
2,311,492
35,758
222,139
119,097
1,934,728
37,947
211,545
114,484
1,815,844
37,865
187,039
100,468
1,421,681
43,848
181,642
91,702
1,574,861
11,379
11,605
11,718
11,717
11,944
0
2010
2011
2012
–Earnings per share
2013
2014
–Net Dividend per share
Trading Volume, Share Price & Net assets per share
Share price /
Net assets per share
$
Trading Volume ’000
6,000
14.00
12.00
5,000
10.00
4,000
152,312
174,968
110,968
65,429
100,016
(63,844)
2,807,465
(53,574)
2,444,721
(49,289)
2,253,217
(35,229)
1,788,970
(44,365)
1,959,648
Statistics
Return on equity (%)
Net assets per share ($)
Debt/Equity (%)
Number of shareholders
8.00
3,000
6.00
2,000
4.2
12.82
2.0
20,039
4.4
11.18
1.0
20,316
5.3
10.34
1.0
20,821
4.5
8.21
0.7
21,216
5.9
8.97
21,454
4.00
1,000
2.00
0
Employees
Number of employees
Group turnover per employee ($’000)
Pre-tax profit# per employee ($’000)
#
0
2010
469
329
264
437
323
239
414
337
251
408
325
212
471
276
230
–
share price
2011
2012
2013
2014
–Net assets per share
Excludes fair value changes on investment properties.
16
Haw Par Corporation Limited
annual report 2014
17
Operations Review
Healthcare
Left:
Tiger Balm - Promoting active living through supporting marathons
Leisure
Property
Investments
Below & right:
Tiger Balm Ambassadors - Singapore’s National Sprinter Dipna
Lim Prasad and the professional flatland BMX Rider Terry Adams
from the United States
Above:
2014 Tiger Balm Wellness Campaign
in Taiwan launched by Celebrity Trainer
Eddie Pan
In alignment with our strategic directions
to widen the consumer franchise, we offer
a broader spectrum of consumer appeals
through a wider product range.
Apart from the higher sales, earnings for the year
benefitted significantly from lower raw material
costs; the strengthening of US currency and the
upward price adjustments for some of our markets.
We faced difficulties during 2014 due to adverse
economic conditions in Europe and the decline
of Chinese tourist visits to Singapore and some
other markets, brought about by the air disasters.
We continued to build our Tiger Balm Plaster and
Tiger Balm Neck & Shoulder Rub business in
Singapore and Hong Kong with new TV campaigns
that generated awareness and promoted wider
consumer usage. We also launched a new TV
18
Haw Par Corporation Limited
officially appointed Dipna Lim-Prasad, Singapore’s
National sprinter as the brand ambassador for
our sub-brand Tiger Balm ACTIVE. Through our
sponsorship we did our bit for Dipna so that
she could train full-time for the 2015 South
East Asian Games (SEA Games). Similarly, we
appointed BMX rider Terry Adams as the Tiger
Balm ambassador for the United States.
The good sales growth achieved in 2014 was
mainly propelled by higher sales in certain Asian
markets. Sales contributions increased for our
non-ointment products, particularly, Plasters,
Neck & Shoulder Rub and Mosquito Repellent
Patch. This is in line with our strategic directions
to widen the consumer franchise by offering a
broader spectrum of consumer appeals through
a wider product range. In 2014 we launched the
Tiger Balm Neck & Shoulder Rub in Australia.
The dengue threats in Singapore and Malaysia
continued unabated and we saw our Tiger Balm
Mosquito Repellent Patch sales soared.
The new advertisements for the Tiger Balm Neck & Shoulder Rub
and the Tiger Balm Plaster with a modern execution
campaign in India through Medifacts Healthcare
Information Advertising using a spokesperson to
promote the benefits and uniqueness of Tiger Balm.
Having experienced the success in promoting
our products through sports and encouraging
healthy living, we continued to sponsor various
marathons and keep-fit campaigns. During the
year we participated in marathons in Germany,
France, the United Kingdom, Singapore and
Hong Kong. Our strategy is to selectively sponsor
marathons where there are mass participation
and wide publicity. In February 2014, Tiger Balm
Tiger Balm products being classified by most
countries’ health authorities under pharmaceutical
means our new product’s road to launch tends
to be a long-drawn one as we comply with strict
and stringent measures of each market.
We have been relentlessly taking active action to
combat counterfeits and passing off infringements
to our famous Tiger Mark in some of our markets.
We deem it critical that we protect our IP rights
for us to stay as a credible worldwide respected
brand.
Our outlook for our business in 2015 remains
cautiously optimistic as much of the difficulties we
face now seem to be unresolved. The economic and
political woes along with the latest high security
threats in many of the markets we compete in
are still looming.
annual report 2014
19
Tiger Balm availability worldwide
europe
Andorra
Austria
Belgium
Bosnia
Croatia
Denmark
Estonia
Finland
France
Germany
Gibraltar
Hercegovina
Holland
Hungary
Ireland
Latvia
Liechtenstein
Lithuania
Luxembourg
Macedonia
Malta
Norway
Portugal
Serbia
Slovenia
Spain
Sweden
Switzerland
United Kingdom
asia
Brunei
Cambodia
China
Hong Kong
India
Indonesia
Japan
Laos
Macau
Malaysia
America
Bahamas
Brazil
Canada
Jamaica
Mexico
Suriname
Trinidad & Tobago
USA
africa
middle east
Kenya
Malawi
Mauritius
Bahrain
Iran
Israel
Kuwait
Oman
Qatar
Saudi Arabia
UAE
Yemen
Myanmar
Nepal
Pakistan
Philippines
Singapore
South Korea
Sri Lanka
Taiwan
Thailand
Vietnam
australasia
Australia
New Caledonia
New Zealand
Papua New Guinea
Manufacturing Facilities
20
Haw Par Corporation Limited
annual report 2014
21
Operations Review
Healthcare
Left:
A record-breaking Underwater Magic Show
celebrating Chinese New Year at Underwater
World Singapore
Leisure
Below:
Underwater World Pattaya putting up a
marine-themed mascot performance that
enthrals the audience
Property
Investments
Above:
Pink dolphins and fur seals entertaining crowds at the Dolphin
Lagoon in Underwater World Singapore
Baby Pink Dolphin Splish swimming by its mother’s side at the
Dolphin Lagoon in Underwater World Singapore
The Leisure Division demonstrates its
resilience through staying nimble in the
rapidly changing tourism landscape.
Underwater World Singapore
In 2014, Underwater World Singapore (UWS)
continued to operate in a demanding tourism
environment characterised by intense competition
from existing attractions and new entrants to the
scene. The situation was exacerbated by the series
of air accidents in the region that happened in
the year, leading to faltering tourist numbers in
Singapore, which adversely affected a number
of UWS’ tourist markets, further impacting its
overall performance.
Despite the unfavourable market conditions,
UWS demonstrated its resilience through staying
nimble in the rapidly changing tourism landscape.
Focusing on its strategy to grow and expand its
market share amongst the tour group segment,
UWS executed with precision effective pricing
strategies that helped to offset the negative impact.
Curating a uniquely ‘UWS’ experience for guests
remains a priority. Chinese New Year took on an
entirely new spin this year as UWS broke the
record for staging Singapore’s first underwater
22
Haw Par Corporation Limited
magic performance as certified by the Singapore
Book of Records. From gold ingots to red packets,
every trick was brilliantly crafted by the illusionist
and infused with classical Chinese New Year
elements. The event made headlines in the news.
In November 2014, the first public appearance of
the pink dolphin calf born in UWS also captured
media attention. Only five months old, the adorable
baby dolphin endeared itself to the public and
drew 220 submissions in a naming poll. The
announcement of the winning name – Splish –
was celebrated with the UWS Underwater Santa
dressed in a pink scuba-diving Santa suit feeding
sharks and rays. During the year-end holidays,
the public had the opportunity to meet Baby Pink
Dolphin Splish and Pink Santa.
2015 will be as challenging as 2014 with
mounting competitive pressure from new attractions
opened in the last quarter of 2014 and others
slated to open next year both locally and in the
neighbouring countries. Distinguishing UWS from
its competitors through the emphasis on pink
dolphins and dolphin interaction programmes as
well as its positioning as an intimate, boutique
aquarium will continue to be a focus area. UWS will
leverage its partnerships with trade intermediaries
to further strengthen its market and mindshare in
group travel, and to expand UWS’ reach to new
market segments.
Underwater World Pattaya
Located at one of the world’s popular tourist
destinations, Underwater World Pattaya (UWP)
has been drawing visitors both locally and from
around the world. The main features of the
oceanarium include four interactive zones, a
state-of-the-art jellyfish display zone and three
signature underwater tunnels that provide visitors
with an up-close experience with sharks and rays
and a wide spectrum of tropical freshwater and
marine animals found in Thailand and around
the region.
The business operation in 2014, however, was
affected by unrest in Thailand, which led to
holidaymakers changing travelling plans and
avoiding Thailand. Every effort was made to
improve the local visitorship through promoting
UWP’s exhibits and education programmes at
local trade shows and presentations to schools.
Through maintaining close working relationships
with foreign trade partners and scaling up
participation in overseas trade fairs, UWP was
able to enhance awareness in foreign markets
and promote ticket sales.
Competing attractions recently opened in Pattaya
and within its vicinity are also posing serious
threats to UWP. To address the competition, UWP
strengthened its appeal through rejuvenating
its offerings and boosting its visibility in media
outlets, such as advertorials in magazines and
appearances in television programmes, extending
its reach to targeted audience both local and
overseas.
During the Songkran Festival, underprivileged
children were invited to UWP on 11 April
2014 for the preview of a new oceanarium
adventure specially designed for the school
holidays. Beginning with a conservation-themed
performance titled “Saving Clowny, Sharky and
Benny - the Ray” played by everyone’s favourite
marine mascots, the programme continued
with an educational oceanarium tour where
the children interacted with aquatic animals
and learnt about them. The event was reported
on popular television stations and news sites,
as well as on social media, and captured the
attention of travellers.
In the coming year, UWP will continue to operate
in a challenging market, facing direct and indirect
competition from other aquariums, upcoming
new attractions and revamped existing ones in
the region. To set itself apart from competitors,
UWP will strive to innovate and enhance visitor
experience. Marketing and sales efforts will be
stepped up to bolster UWP’s market share.
Notwithstanding the difficult conditions prevailing
in the tourism market, UWP’s prospects are deemed
to be encouraging given its prime location.
annual report 2014
23
Operations Review
Healthcare
Leisure
Property
Investments
Left & above:
Haw Par Glass Tower and Haw Par Centre – two adjacent office buildings located in Clemenceau Avenue, a stone’s
throw away from the heart of Singapore’s Orchard Road
Right:
Haw Par Technocentre – a light industrial building located in Commonwealth Drive in Singapore
Initiatives carried out to attract
quality tenants are expected to
elevate the portfolio yield towards
the later part of 2015.
The Group’s investment property portfolio comprises
45,816 square metres of commercial and industrial
space in Singapore, Malaysia and Hong Kong.
Singapore
Haw Par Centre and Haw Par Glass Tower are two
office buildings conveniently located in Clemenceau
Avenue with a total lettable area of 13,567 square
metres. Haw Par Technocentre is a light industrial
building located in Commonwealth Drive with a
total lettable area of 15,700 square metres. In
2014, the properties in Clemenceau Avenue and
Commonwealth Drive achieved 100% and 72%
occupancy respectively. The increase in the supply
of industrial space caused a downward pressure
on the occupancy rate of Haw Par Technocentre.
Take-up rate was slow despite a step-up effort to
secure prospective tenants.
24
Haw Par Corporation Limited
Malaysia
Investments
Menara Haw Par, a freehold commercial building
located in Kuala Lumpur’s Golden Triangle along
Jalan Sultan Ismail, has a net lettable area of
16,074 square metres. With the persistent oversupply of office space in Kuala Lumpur, the
building’s occupancy averaged at 66% for the year.
With approvals from the local authorities recently
obtained, the building’s frontage improvement
plan is scheduled for commencement in 2015.
Occupancy is anticipated to improve with a more
appealing frontage.
The group has substantial investments in various
securities that are actively managed under the
guidance of the Investment Committee.
These strategic investments have provided the
Group with a stable source of recurring dividend
income and financial strength over the years.
The key investments in the Group include:
Investment
Portfolio Profile
No. of Shares
2014
2013
Hong Kong
Three office/industrial units at Westlands Centre,
Quarry Bay, which provide a lettable area of 475
square metres, were fully leased during the year.
The performance of our properties was slightly
behind that of the previous year. With an increased
supply in some segments which we operate, the
challenge in achieving a healthy commitment
level in these segments is expected to continue
into 2015. Nevertheless, with the good locations
at which our properties are situated, together
with our expertise in tenancy management, any
potential negative impact will likely be mitigated.
Fair Value
2014
2013
$’000
$’000
Gross
Investment Income
2014
2013
$’000
$’000
Quoted Equity Securities
United Overseas Bank Limited 69,692,097 67,952,169
1,707,456
1,443,304
51,312
47,567
UOL Group Limited
42,760,918 41,428,805
297,616
256,030
8,285
6,214
United Industrial
Corporation Limited
68,197,350 67,558,000
228,461
200,647
2,027
2,027
annual report 2014
25
People & The Community
Community
Right:
Participants at the 2014 Avon Walk for
Breast Cancer held in the United States of
which Tiger Balm was one of the sponsors
Environment
Left & above:
Rural villagers receiving Tiger Balm Ointment as part
of the medical aid given out at the Cambodia Medical
Mission in November 2014
Right:
The first-ever Pink Santa at Underwater World Singapore
sharing high-fives with children from the Care Corner
Family Service Centre in December 2014
Haw Par Group has a long history of
giving back to the communities in
which we operate.
UWS invited 20 families under the care of the
Centre to join a unique pink Christmas celebration
in December in commemoration of the naming of
the UWS Pink Dolphin calf born in July. Parents
and children were treated to a special appearance
of the first-ever Pink Underwater Santa feeding
sharks and rays in the Underwater Tunnel.
COMMUNITY
Our founders began the tradition of giving back to
the community, which continues to the present.
In 2014, Haw Par Group responded to the call for
support from the Chemical Industries Employees’
Union (affiliated to the National Trade Union
Congress of Singapore) and contributed to the
Union’s Education and Hardship Fund, which
provides scholarships, bursaries and relief grants
for needy union members and their families.
As a family-friendly oceanarium set up in 1991,
Underwater World Singapore (UWS) has been the
place where family memories were made. In support
of the Care Corner Family Service Centre’s cause
to offer a safety net for vulnerable families and
to enrich the quality of family life in Singapore,
26
Haw Par Corporation Limited
In September, UWS partnered Make-A-Wish
Foundation to bring happiness to 5-year-old
Irfan from Malaysia who was suffering from a
life-threatening disease. His wish to visit UWS
with his family was granted with the UWS team
going all out to make his visit a memorable one.
At Underwater World Pattaya (UWP) in Thailand,
bringing happiness to children was also the
focus for this year’s charity visit. To celebrate
the Songkran Festival in a meaningful way, the
team at UWP pulled out all the stops to make the
oceanarium adventure for 40 children from the
Anti-Human Trafficking and Child Abuse Center
(ATCC) exciting and magical. In addition to the
regular oceanarium tour, UWP put up a fun-filled
mascot performance with a marine theme for
the children.
Haw Par Group continued to extend care and
comfort to those in need at the fringes of society
in regions where the company conducts business.
In November 2014, Tiger Balm supported the
Cambodia Medical Mission organised by the
Lutheran World Mission (LWM) for the second
year. Many of the rural poor in Cambodia struggle
to meet their basic needs. With typically only
one paddy crop a year from their fields and few
income alternatives, many rural families could
barely make ends meet. The LWM medical
mission provided free medical consultation,
treatment and medications to the rural poor in
Cambodia. Volunteers observed that some 80%
of the villagers suffer severe body aches due to
the daily backbreaking work tending to the fields
and the Tiger Balm Ointment was much sought
after at the mobile clinics.
Closer to home in Singapore, we supported
numerous charities and causes with sponsorships
of Tiger Balm products. Among the numerous
charities that benefitted were nursing homes for
the elderly such as St Luke’s Hospital and St
Luke’s Eldercare, Christalite Methodist Home,
St Theresa’s Home and Bright Hill Evergreen
Home, as well as ground-up initiatives to reach
out to the elderly such as the Grandparents’ Day
celebration organised by volunteers from the Thye
Hua Kwan’s Get Movin’ for Charity movement
and the Annual Medical Review for needy elderly
conducted by the National University of Singapore
Pharmaceutical Society.
Promoting health and wellness is an important
focus area for Tiger Balm. This year, we sponsored
charity walks and runs such as the Avon Walk in
the United States that supports breast cancer
research and the Yellow Ribbon Run in Singapore
which provides social support for ex-offenders. To
promote active living, We also provided sponsorship
for a wide range of community sports projects,
among which included the Basketball Battle @
Velocity, the Pilates Fitness Campaign, the NTUC
Zumba Fitness 2014, the NUS Cyclohunt 2014
(a night cycling race), BodyCombat 2014 (a gym
challenge) and the Singapore Paintball Series.
annual report 2014
27
People & The Community
Community
Environment
Left & above:
Haw Par – a sponsor of the Malayan Tiger Exibit at the
Night Safari of Singapore and the Leopard Exhibit at
the Singapore Zoo since 1995 and 1986 respectively
Right:
The Pink Dolphin calf, Splish, born at Underwater World
Singapore in July 2014
Haw Par, as a responsible global citizen, has been contributing towards
environmental protection and conservation
ENVIRONMENT
Committed to fulfilling our role as a responsible
global citizen, the Haw Par Group has been
contributing in various ways towards environmental
protection and conservation. We support the
United Nations Decade for Biodiversity.
Over the years, we have been supporting efforts
to promote the conservation of the tiger and the
leopard, which are among the most endangered
species on Earth. A number of projects in several
countries including India, Germany, the United
Kingdom and the United States have received
assistance from the Haw Par Group towards
tiger conservation. In Singapore, we have been
sponsoring the Tiger exhibit at the Night Safari
and the Leopard exhibit at the Singapore Zoo since
1995 and 1986 respectively, as our contribution
towards wildlife conservation education.
28
Haw Par Corporation Limited
In the United Kingdom, Tiger Balm partnered Born
Free Foundation to raise funds and awareness of the
plight of the tiger, of which there are only 3,500
left worldwide. The Born Free Foundation takes
action worldwide to rescue and care for vulnerable
animals, and to promote wildlife conservation
through activities that inspire everyone to respect
the wild. Created by Tiger Balm, the ‘Born to Run’
Campaign conducted via mainstream and social
media platforms succeeded in assembling 101
runners dressed as tigers to run in the popular
British 10K London Run in July, sending out
the tiger conservation message in a unique way,
generating publicity for the cause and made a
lasting impression.
In July, Underwater World Singapore (UWS)
welcomed the birth of a healthy pink dolphin calf,
Splish, with a sense of pride. The first successful
birth of a Pink Dolphin at UWS was in 2002,
which was also the world’s first successful and
documented birth of the Pink Dolphin or IndoPacific Humpback Dolphin (Sousa chinensis) at
a marine park. Pink dolphins are born grey and
become pink as they age. To promote public
awareness of this unique marine animal, the UWS
Marine Mammal Trainers conducted educational
sessions during the December School Holidays
on how they provided gynaecological care for the
mother dolphin and kept 24-hour vigils watching
over the mother dolphin and the calf after birth,
and how the mother dolphin nurses its calf.
Like many other marine mammals, pink dolphins
in the wild face numerous threats to their survival
such as pollution, loss of feeding habitats due
to coastal development, collisions with boats
and getting entangled and drowning in fishing
lines and nets. The Pink Dolphin is listed in the
Convention on International Trade in Endangered
Species (CITES) Appendix 1 and is classified
as ‘Endangered’ in the Red List of Threatened
Animals of Singapore. As one of the few facilities
in the world that is home to this rare species of
dolphin, UWS has been supporting research on
pink dolphins and hosted visits from institutions
such as the Chinese Academy of Sciences in
August this year.
Entering the 11th year of participation in the
Corporate and School Partnership Programme (CASP)
organised by the National Environment Agency of
Singapore, UWS continued its collaboration with
Keming Primary School as part of the UWS Blue
Mission – Inspire, Educate, Conserve. Benefitting
from the partnership, Keming Primary School
achieved the Gold Award for Green Schools in
2013. In April this year, UWS and Keming Primary
School were invited by the Singapore’s Ministry
of Education (MOE) to share their experience on
the successful partnership at the Annual MOE
Excel Festival - a platform for celebrating exciting,
innovative practices in education.
In 2014, we continued to pledge our support for
‘Earth Hour 2014 – Be a Superhero for the Planet’.
At UWS, façade lights were switched off during
the Earth Hour and the conservation message
– “Reduce, Reuse, Recycle” was incorporated
in the signage and the commentary for all the
daily shows and feeding sessions, encouraging
visitors to take action against climate change
and environmental destruction. Marine Biologists
at the UWS Curatorial Department also offered
insights on environmental issues in their ‘Do
One Thing for the Environment’ column in the
newsletters for staff, encouraging all to do their
part for Mother Earth.
annual report 2014
29
Financial Review
Overview
Group revenue at $154.2 million was 9.2%
higher than 2013, with Healthcare reporting
an 18.1% growth in revenue. Profits from both
Healthcare and Investments grew 31.0% and
17.5% respectively. Group earnings increased
10.1% to $118.8 million due to higher profitability
from Healthcare, higher investment income and
higher share of results from associated companies.
With net higher earnings registered for the year,
earnings per share increased to 54.3 cents (2013:
49.4 cents). Net assets per share increased to
$12.82 (2013: $11.18) with the increase in
earnings and higher market valuations of availablefor-sale financial assets.
67.3
70.0
Return on Assets Employed
80.0
1,000
905
800
40.0
30.0
1,134
66.0
50.0
40.0
1,200
60.0
50.0
600
30.0
33.9
20.0
25.9
10.0
20.0
400
14.7 17.3
14.5
11.5 12.1
11.3
200
0
13.4 12.4
0
America
Europe
Middle East
Asia
2014
2013
10.0
3.8 2.5
0
Healthcare
35.0
In 2014, the Group’s ROA maintained at 4.6%,
from higher profitability of Healthcare, offset by
decrease in profit from Leisure and Property. ROA
of Healthcare division improved from 25.6% to
32.7%. The decline in ROA of Leisure to 4.4%
is attributable to lower visitorship and intense
competition. ROA of Property decreased to 5.6%
from the net increase in fair value of investment
properties and decrease in profit from lower
occupancy rate. ROA of Investment increased
slightly to 3.1%, consistent with the higher
dividend income received during the year and
larger asset base due to higher market valuations.
2014
2013
Leisure
Property
Investments
2014
Return on Assets Employed (%)
The Group applies a Return of Assets Employed
(“ROA”) measure to evaluate the performance
of its business operations. The ROA measures
profitability of assets utilised by the various
operations.
Haw Par Corporation Limited
Visitorship of Aquariums (’000)
78.3
70.0
57.3
60.0
2013
30
Healthcare Sales by Region ($m)
Segment Profits Before Interest Expense and Tax ($m)
Healthcare
Leisure
Healthcare’s revenue of $122.2 million increased 18.1%
compared to prior year. Higher sales in key markets during
the year also resulted in higher revenue contribution
especially from Asian countries. Operating profits continued
to grow 31% above 2013 to $33.9 million as lower cost
of raw materials and favourable foreign currency rate
helped to improve margins.
The number of visitors to the aquariums declined by 20.2%
with weaker tourist sentiments and intense competition at
the Oceanariums in the Group. Leisure contributed a lower
revenue of $15.6 million in 2014 compared to $20.5
million in 2013. Continuous upgrading of facilities and
displays at UWP are done to maintain competitiveness.
Property (Building Occupancy Rates)
Investments (Cost vs Fair Value) ($m)
100%
32.7
97.5
2,500
85.0
74.5
80%
30.0
2,000
60%
1,500
20.0
40%
1,000
15.0
20%
500
10.0
5.0
0
0%
6.3
4.6 4.6
Group
2,311.5
1,934.7
66.1
25.6
25.0
2014
2013
Healthcare
4.4
Leisure
2013
3.0 3.1
Property
0
Singapore Properties
6.3 5.6
Investments
2014
602.8
513.3
Others
2013
2014
2013
Cost
2014
Fair Value
Property
Investments
Property was affected by a lower occupancy rate.
Rental revenue contributed by Property decreased
4.7% to $16.4 million and profit from its operations
decreased 7.6% to $12.4 million. Property also recorded
a lower net fair value gain of investment properties of
$3.1 million (2013: $10.7 million).
Investment income increased 10.4% from 2013 due to
higher dividends received from our investment portfolio.
The fair value of the Group’s investment portfolio increased
from $1,934.7 million as of 31 December 2013 to
$2,311.5 million as of 31 December 2014 mainly due to
the increase in share prices of main equity investments. A
net unrealized gain of $279.8 million arising from changes
in the fair value of investments has been recorded in the
fair value reserve account in 2014.
annual report 2014
31
Corporate Governance Report 2014
CORPORATE GOVERNANCE REPORT
Haw Par Corporation Limited (the “Company, together with its subsidiaries, the “Group”) is committed to upholding good
corporate governance practices in line with the principles and guidelines of the Code of Corporate Governance 2012 (the
“Code”). The following sections describe the Group’s corporate governance practices and structures that were in place during
the financial year ended 31 December 2014 (“FY 2014”).
BOARD MATTERS
Board’s Conduct of its Affairs
The principal responsibilities of the Board include:
•
•
•
•
•
approving strategic plans and annual budgets;
approving major funding, investment and divestment proposals;
ensuring that management establishes and maintains a sound system of internal controls, risk management, financial
reporting and statutory compliance in order to safeguard shareholders’ interests and the Group’s assets;
reviewing the performance of management in attaining agreed goals and objectives; and
approving the announcement of financial results and declaring dividends.
All Board members bring their judgement and breadth of diversified knowledge and experience to bear on issues of strategy,
performance, resources (including sustainability issues) and standards of conduct.
The Board meets at least four times a year to review the performance and business strategy of the Group. Meetings are
scheduled in advance. Ad-hoc meetings can be called when there are important and urgent matters requiring the Board’s
consideration. Board approval in writing is sometimes needed in between scheduled meetings.
The Group has adopted internal guidelines which set out specific matters requiring Board approval. These written guidelines
also include financial and non-financial limits of authority given to management to facilitate operational efficiency. Under
the guidelines, Board approval is required for material transactions such as joint ventures, mergers and acquisitions, as well
as adoption and amendment of Group risk management policy.
The Board has delegated specific responsibilities to four Board Committees, which are the Audit, Nominating, Remuneration
and Investment Committees.
ANNUAL REPORT 2014
33
CORPORATE GOVERNANCE REPORT (CONTINUED)
The Board held four meetings during the year. Directors can attend Board and Board Committee meetings by telephone
conference if they are unable to attend in person. The attendance of Directors at Board and Board Committee meetings held
in the financial year ended 31 December 2014 is as follows:
Table 1:
Number of meetings attended in FY2014
Name
Wee Cho Yaw
(Non-executive / non-independent)
Wee Ee Lim (1)
(Executive / non-independent)
Sat Pal Khattar
(Non-executive / independent)
Chew Kia Ngee
(Non-executive / independent)
Hwang Soo Jin
(Non-executive / independent)
Lee Suan Yew
(Non-executive / independent)
Wee Ee-chao
(Non-executive / non-independent)
Peter Sim Swee Yam
(Non-executive / independent)
Han Ah Kuan
(Executive / non-independent)
Gn Hiang Meng(3)
(Non-executive / independent)
Number of meetings held in FY2014
Board
Audit
Committee
Nominating
Committee
Remuneration
Committee
Investment
Committee
4(2)
N/A
1
1
5(2)
4
4
N/A
1
5
4
N/A
1(2)
1(2)
N/A
4
4(2)
N/A
N/A
N/A
4
3
N/A
1
N/A
4
4
1
N/A
N/A
2
N/A
N/A
N/A
N/A
4
N/A
N/A
N/A
N/A
4
N/A
N/A
N/A
5
1
4
NA
4
NA
1
NA
1
NA
5
Notes:
(1)Mr Wee Ee Lim was in attendance to provide management’s perspective at the meetings of the Audit and Remuneration Committees although he is not a member
of either Board Committee.
(2)Denotes chairman of the Board / Board Committee
(3)Mr Gn Hiang Meng was appointed as non-executive independent director on 13 August 2014.
Directors are appointed by way of formal letters of appointment which set out their duties and obligations. The Company has
an orientation programme for newly appointed directors. The programme is tailored according to the profile and experience
of new directors. It includes training in areas such as operational knowledge or accounting updates, duties as directors and
how to discharge those duties as well as meetings with key personnel to understand the Group’s businesses, governance
practices, strategic plans and objectives. Site visits are conducted as needed. The Company arranges and funds the training
of directors, if needed. Directors are continuously updated on developments in the regulatory and business environment
affecting the Group.
34
HAW PAR CORPORATION LIMITED
CORPORATE GOVERNANCE REPORT (CONTINUED)
Board Composition and Guidance
The Board considers its present size of ten directors appropriate for the current scope and nature of the Group’s operations.
The Articles of Association of the Company allow for a maximum of 15 directors. The Nominating Committee (“NC”) has
reviewed the composition of the present Board and is satisfied that the Directors, as a group, possess core competencies in
accounting, finance, management experience, strategic planning and the necessary industry knowledge.
The NC, having regard to the Code’s guidance for assessing independence, has determined that the majority of Directors
on the Board, being six of the Non-executive Directors, namely Mr Sat Pal Khattar, Dr Lee Suan Yew, Mr Hwang Soo Jin,
Dr Chew Kia Ngee, Mr Peter Sim and Mr Gn Hiang Meng, are independent directors, as indicated in Table 1 above, and that
they have maintained their independence throughout the year.
Such Non-executive independent Directors have no relationships or connections which are likely to interfere, or could reasonably
be perceived to interfere, with their independent business judgement with a view to the best interests of the Company. They
are not substantial shareholders and are independent from the substantial shareholders of the Company.
The Non-executive independent Directors are not immediate family members of a 10% shareholder of the Company and were
not directly associated with a 10% shareholder of the Company in the current or immediate past financial year. They and
their immediate family members did not have any financial dealings with the Group whether in the current or immediate past
financial year, nor are or were they or any of their immediate family members, during the current or immediate past financial
year, a substantial shareholder of, or a partner in (with 10% or more stake), or an executive officer of, or a director of, any
organisation to which the Group made, or from which the Group received, significant payments or material services (including
auditing, banking, consulting and legal services) in the current or immediate past financial year. Also, neither they nor any
of their immediate family members were in the past three financial years employed by the Group.
Although three of the directors, namely Mr Sat Pal Khattar, Dr Lee Suan Yew and Mr Hwang Soo Jin, have served as nonexecutive directors for more than nine years each, the NC and the Board are of the view that their length of service does not
compromise their objectivity in the discharge of their duties. Notes of Board and Board Committee meetings show that each
of the three Directors continues to express his individual independent viewpoints. Accordingly, the NC and the Board have
determined that Mr Sat Pal Khattar, Dr Lee Suan Yew and Mr Hwang Soo Jin can continue to be designated as independent
directors.
The Board will continue to look for new members who can serve the Board as older members step down in order to facilitate
renewal of the Board.
Chairman and Chief Executive Officer
There is a clear division of the role and responsibilities between the Non-executive Chairman of the Board (“Chairman”) and
the Chief Executive Officer (“CEO”), who is the son of the Chairman. The Chairman’s principal role is to lead and guide the
Board. The scope of responsibilities and limits of authority of the CEO are set out in a written mandate. The CEO executes
the strategic directions set by the Board and is responsible for the Group’s day-to-day operations. Although the Chairman and
CEO are related, the Board is of the opinion that it is not necessary to appoint a lead independent director. Shareholders can
approach any independent director for assistance through the Company Secretary, if he has any issues that affect shareholders
generally.
ANNUAL REPORT 2014
35
CORPORATE GOVERNANCE REPORT (CONTINUED)
Nominating Committee
The NC comprises three members, namely, Mr Sat Pal Khattar, Dr Wee Cho Yaw and Dr Lee Suan Yew. The majority of the
NC, including the chairman of the NC, Mr Sat Pal Khattar, are independent directors.
The principal responsibilities of the NC are to:
•
•
•
•
•
•
appoint and re‑appoint directors and key executives, including the CEO;
review the composition of the Board and Board Committees;
perform succession planning;
assess the independence of directors;
evaluate the performance of the Board and Board Committees; and
review training and professional development programmes for directors.
Each year, the NC reviews the composition of the Board as part of its succession planning. Suitable candidates are identified
through personal and professional networks and the NC reviews each candidate through an objective and comprehensive
process. When assessing potential candidates, the NC takes into account the existing Board composition, the candidate’s
background, qualification, experience, time commitment and his/her ability to contribute to the Board’s collective skills,
knowledge and experience.
The NC makes annual recommendations to the Board on the re-appointment of directors having regard to their competencies,
commitment, contributions and performance on a qualitative basis. Each year, one-third of the Board retires from office by
rotation and may submit themselves for re-election. Directors who are above the age of 70 are subject to annual re-appointment
at the AGM. New directors submit themselves for re-election at the AGM immediately following their appointment by the Board.
In its review of the directors’ ability to commit time to the Company’s affairs, the NC has taken into account whether a limit on
the number of other listed boards directors could sit on was necessary. The NC decided that it was not necessary to prescribe
a limit on the number of other boards that Directors of the Company sit on. Although some directors have multiple board
representations and principal commitments, none of them had more than six listed companies’ directorships and the NC is
satisfied that each director has devoted sufficient time and attention to the Company’s affairs to adequately and competently
carry out his duties as a Director of the Company. For a full list of each director’s directorships and principal commitments,
please refer to the “Board of Directors” section of this Annual Report.
Board Performance
The NC evaluated and assessed the effectiveness of the Board’s performance as a whole, taking into consideration, amongst
other matters, the Board’s discharge of its principal responsibilities, earnings of the Group, return on equity and the share
price performance of the Company over a five‑year period. The NC is of the opinion that the Board as a whole has performed
well during the year and that the Chairman and each director have contributed to the overall effectiveness of the Board.
The NC evaluated and reviewed the performance of the Board Committees (except the NC itself). It is satisfied with the
matters dealt with by the Board and Board Committees and the frequency of such deliberations.
The Chairman of the Board and the Chairman of the NC evaluated the collective performance, commitment and contribution
of all directors based on each director’s attendance and contribution at Board meetings. They also reviewed the contribution
of the Executive Directors and are of the view that the performance of each of them has been satisfactory.
36
HAW PAR CORPORATION LIMITED
CORPORATE GOVERNANCE REPORT (CONTINUED)
Access to Information
Directors have unfettered access and timely information on the Group’s financials and operations. Comprehensive information
including strategic, financials, key operational and compliance matters is provided to directors on a monthly/quarterly basis
to enable them to make informed decisions. Matters requiring the Board’s decision are generally sent to directors at least five
working days prior to Board meetings. Board meetings for each year are scheduled at least three months in advance while
urgent Board meetings, if needed, are scheduled at least five days in advance save in exceptional circumstances. The Board
is also provided with opportunities to meet with managers and heads of divisions, as needed to understand the businesses
of the Group.
Directors have separate, independent and unrestricted access to the Company Secretary for assistance. The Company
Secretary attends all Board and Board Committee meetings and ensures that board procedures are followed and the rules
and regulations applicable to the Board are complied with. The Company Secretary is responsible for ensuring information
flows between the Board and Board Committees and between senior management and non-executive directors, advising the
Board on all governance matters, as well as facilitating orientation and professional development as required. Directors may
take independent professional advice, if necessary and with the approval of the Chairman, at the Company’s expense, to carry
out their duties. Under the Articles of Association of the Company, the decision to appoint or remove the Company Secretary
rests with the Board as a whole.
REMUNERATION MATTERS
Procedures for Developing Remuneration Policies
The Remuneration Committee (“RC”) comprises three members, namely Mr Sat Pal Khattar, Dr Wee Cho Yaw and Mr Hwang
Soo Jin. The majority of the RC, including the chairman of the RC, Mr Sat Pal Khattar, are independent directors. All the
members of the RC are non-executive directors. The RC is supported by the Group Human Resource and/or external consultants
if needed. During the year, the RC did not use the services of any external consultant.
The principal responsibilities of the RC include:
a)
b)
c)
d)
in consultation with the Chairman of the Board, reviewing and recommending to the Board for its endorsement, a
framework of remuneration for the Board and the key executives of the Company;
determining the specific remuneration packages of each executive director;
reviewing and approving the remuneration packages for key executives; and
administering the Company’s share option scheme.
During the year, the RC reviewed the amount of directors’ fees to be recommended for shareholders’ approval to the nonexecutive directors. It also assessed the performance of and determined all aspects of remuneration for the executive directors,
and reviewed the remuneration packages for key executives and share options to eligible staff and the terms thereof.
The RC has reviewed the Group's obligations arising in the event of termination of the Executive Directors' and key executives'
service contracts, to ensure that such service contracts contain fair and reasonable termination clauses.
ANNUAL REPORT 2014
37
CORPORATE GOVERNANCE REPORT (CONTINUED)
Level and Mix of Remuneration and Disclosure on Remuneration
The RC takes into consideration current industry norms on compensation and adopts a remuneration policy in line with industry
practices. None of the Non-executive Directors have any service contract or consultancy agreement with the Company. Nonexecutive Directors, including the Chairman of the Board, are paid directors’ fees which comprise a basic fee and additional
fees for serving on Board Committees. The RC recommends directors’ fees to the Board for endorsement prior to submission
to shareholders for approval at each annual general meeting. The Company’s share option scheme allows for grants of share
options to non-executive directors. To date, the Non-executive Directors have not been granted any share option.
The Group remunerates its employees at market competitive levels, commensurate with their performance and contribution
to the long-term interests and success of the Group. The remuneration package comprises fixed and variable compensation,
provident fund and share options (for eligible employees). A variable bonus scheme is in place. Key management in the
Group is rewarded by share options, taking into consideration working capital efficiency, productivity, current year earnings
and long-term sustainability and growth of the respective businesses and their contribution thereto.
In the annual review of the remuneration of the Executive Directors, the RC takes into consideration performance of the
individuals and comparative remuneration of similarly placed persons in the market. The performance criteria include
achievement of financial objectives using financial indicators such as overall profitability and return on assets over a period of
time. Their remuneration is reviewed annually by the RC and include a variable bonus component which is performance‑based.
Share options are granted to the Executive Directors and eligible key executives, based on their performance during the year.
These share options are granted at market price around the date of grant and can only be exercised after a vesting period
of usually one year to ensure that employees’ interest gel with the longer term performance of the Group. In the event of
misconduct on the part of a participant in the share option scheme, the RC may in its absolute discretion treat any outstanding
option as lapsed and null and void. More information on the Haw Par Corporation Group 2002 Share Option Scheme can be
found in the Directors’ Report and Note 25(b) to the financial statements.
Disclosure of Remuneration
The details of the remuneration of each Director for FY 2014 are as follows:
Table 2:
Name
Wee Ee Lim
Han Ah Kuan
Wee Cho Yaw
Sat Pal Khattar
Hwang Soo Jin
Lee Suan Yew
Chew Kia Ngee
Peter Sim Swee Yam
Gn Hiang Meng
Wee Ee-chao
Directors’
Fees(1)
$’000
–
–
82
56
51
51
56
36
14
36
Base or fixed
salary
$’000
667
291
–
–
–
–
–
–
–
–
Variable bonus
$’000
550
214
–
–
–
–
–
–
–
–
Benefit-in-kind
and others
$’000
85
115
–
–
–
–
–
–
–
–
(1)Directors’ fees are subject to shareholders’ approval at the forthcoming annual general meeting on 28 April 2015.
38
HAW PAR CORPORATION LIMITED
Total
$’000
1,302
620
82
56
51
51
56
36
14
36
Share options
granted
No. of shares
–
66,000
–
–
–
–
–
–
–
–
CORPORATE GOVERNANCE REPORT (CONTINUED)
Remuneration of Key Executives
The remuneration of each of the top six senior executives of the Group (who are not Directors), in no order of quantum sum,
is as follows:
Table 3:
Name / Position
$250,000 - $500,000
Goh Bee Leong, GM – Manufacturing
Jasmin Hong, GM – Marketing
Keeth Chua, DGM – Marketing
Kwek Meng Tiam, Regional GM
Tarn Sien Hao, Group GM
Zann Lim, CFO
Base or fixed
salary
%
54
57
60
77
60
58
Variable bonus
%
33
31
28
6
23
27
Benefit-in-kind
and others
%
13
12
12
17
17
15
Total
%
100
100
100
100
100
100
Share options
granted
No. of shares
35,000
33,000
20,000
26,000
33,000
33,000
The total remuneration paid/accrued to the top six senior executives is about $1,963,000.
The aggregate amount of termination, retirement and post‑employment benefits that may be granted to Directors, the CEO
and the top six key management personnel is around $500,000.
There is no employee (other than the CEO) who is an immediate family member of a Director or the CEO. A relative of the
CEO, Mr Kelvin Whang, who is the General Manager of Underwater World Pattaya, received annual remuneration of between
$150,000 to $200,000.
ACCOUNTABILITY AND AUDIT
Accountability
The Board provides shareholders with a balanced and clear assessment of the Group’s performance through announcements of
its quarterly and full-year results. Internal guidelines are in place to comply with legislative and requlatory requirements and
Management provides the Investment Committee with monthly management accounts of the Group, to enable the Investment
Committee to review, monitor and highlight to the Board any material information which may have a material impact on the
Group’s performance and prospects.
Risk Management and Internal Controls
The Group has established a formal risk management framework across the entire organisation to provide a structured approach
for managing risks. The framework enables management to have a formal structure in risk management assessment. The
framework is designed to ensure that risks are identified, assessed, monitored and effectively managed. It is in line with the
best practices as contained in the Risk Governance Guidance for Listed Boards, issued by the Corporate Governance Council
in May 2012.
The Risk Management Committee is chaired by the CEO and comprises an Executive Director, the Chief Financial Officer
(“CFO”), the Internal Audit Manager and Group General Manager. It performs the following roles:
•
•
•
•
•
•
oversees the development of risk management policies;
provides overall leadership, vision, framework and direction for risk management;
promotes a risk management culture through human resources, use of technology and organisation structure;
monitors the effectiveness of risk management and makes refinements as and when necessary;
ensures that any risks are properly addressed; and
reports to the AC and the Board twice a year on risk management activities and attestation undertaken (if any).
ANNUAL REPORT 2014
39
CORPORATE GOVERNANCE REPORT (CONTINUED)
Risks are analysed and assessed in terms of risk impact and risk likelihood. Risk impact includes financial, operational
(business interruption), regulatory/legal and reputational impact. Risk likelihood includes both quantitative and qualitative
appraisals and classified as ‘Low’, ‘Moderate’, ‘High’ and ‘Critical’. Management evaluates the options and controls needed
to deal with identified risks, depending on the risk impact, likelihood and related costs and benefits. The AC monitors the
Risk Management Committee’s activities on behalf of the Board.
Risks are broadly categorised as follows:
Strategic risks
These include most of the inherent risks of each operating unit and the relevant macro-environment such as competition
and epidemic outbreak risks. All such risks are reported to the AC and the Board. Measures taken to reduce risks include
diversifying either geographically or in product offerings, putting in place business continuity plans and ensuring sufficient
insurance coverage for various types of risks.
Operational risks
These relate to day-to-day operations and include effective and efficient use of the Group’s resources. Operational risks include
security threats, employee attrition and brand protection. The general manager of each operating unit implements policies
and procedures to monitor such risks.
Compliance risks
Each operating unit is subject to various degrees of regulatory controls, particularly the Healthcare division. Compliance with
local laws and regulations in various geographical locations is monitored by the operating unit and the functional departments
in Singapore.
Financial risks
Financial risks are mitigated by using appropriate hedging instruments when necessary and actively managing foreign exchange
and credit exposures. Further details on managing financial risks are disclosed in Note 26 on Page 96 of the Annual Report.
The operations of the Group do not require complex use of information technology or data. Thus the risks in this area are
not material.
The Board reviews the adequacy and effectiveness of the Company's risk management and internal control systems, including
financial, operational, compliance and information technology controls.
For the year under review, the Board has received assurances from the CEO and the CFO:
(a)
(b)
that the financial records have been properly maintained and the financial statements give a true and fair view of the
Company’s operations and finances; and
that the Company’s risk management and internal control systems are adequate and effective in all material respects
as at 31 December 2014.
Based on work performed by the internal and external auditors and reviews undertaken by the Risk Management Committee
and the AC, the Board, with the concurrence of the AC, is satisfied that the internal controls addressing financial, operational,
compliance and information technology risks, and risk management systems and processes were adequate and effective for
the Group as at 31 December 2014.
The Group’s internal controls and risk management systems provide reasonable, but not absolute, assurance that the Group
will not be adversely affected by any reasonably foreseeable event. The Board recognises that no system of internal controls
and risk management can provide absolute assurance.
40
HAW PAR CORPORATION LIMITED
CORPORATE GOVERNANCE REPORT (CONTINUED)
Audit Committee (“AC”)
The AC comprises three members, namely, Dr Chew Kia Ngee, Mr Hwang Soo Jin and Dr Lee Suan Yew, all of whom are
Non-executive independent Directors. The chairman of the AC, Dr Chew Kia Ngee, is a senior accountant with over 40 years’
experience in the profession. Mr Hwang Soo Jin is a seasoned financial professional and has over 40 years of financial
management expertise.
The principal responsibilities of the AC include:
•
•
•
•
•
•
•
•
•
•
•
reviewing the audit plans with the internal and external auditors;
reviewing the audit report of the external auditors and the results of the internal audit procedures;
recommending the appointment, re-appointment and removal of external auditors and approving the compensation
and terms of engagement of the external auditors;
reviewing annually the independence and objectivity of the external auditors, the cost effectiveness of the audit,
and the nature and extent of non-audit services;
approving the hiring, removal and evaluation of the performance of Group Internal Audit Manager;
ensuring that the internal audit function is adequately resourced and has appropriate standing within the Group;
reviewing the adequacy of the internal audit function annually;
reviewing the Group’s quarterly and full‑year results and annual financial statements prior to approval by the Board,
and the appropriateness and consistency of accounting principles and policies adopted across the Group, including
significant financial reporting issues and judgements;
reviewing the adequacy and effectiveness of the Company’s system of internal controls, including accounting controls,
and addressing financial, operational, compliance and information technology risks and risk management processes;
reviewing interested person transactions; and
reviewing whistle-blowing reports.
The AC has full authority to investigate any matter concerning issues of internal controls, suspected fraud or irregularity. It
has full access to the management and may invite any staff to attend its meetings. The AC adopts key principles from the
“Guidebook for Audit Committee in Singapore”, issued by the Audit Committee Guidance Committee in Singapore in 2008
and updated in 2014.
During the year, the AC held four meetings during which it performed its responsibilities as required under its charter and as
set out above. It met the external and internal auditors separately in the absence of management and noted that there was
no adverse feedback.
In reviewing non-audit services, the AC is satisfied that amount of non-audit services were not material and would not impair
the independence of the external auditors. The AC has confirmed that the Company has complied with Rule 712 and Rule
715/716 of the Singapore Exchange Securities Trading Limited (“SGX-ST”) Listing Manual which set out the requirements
on the appointment of the auditor. The AC has recommended to the Board the re-appointment of PricewaterhouseCoopers
LLP as the Group’s auditor for the ensuing year. The aggregate amount of fees paid to PricewaterhouseCoopers LLP for FY
2014 was $399,000. The breakdown of fees paid for audit and non-audit services were $393,000 and $6,000 respectively.
The AC members are continuously updated by management and auditors on changes to accounting standards and issues
which have a direct impact on financial statements, compliance with legislation and accounting-related matters.
Whistle‑Blowing Policy
The Group has in place a whistle-blowing policy and process under which employees may report to the AC any improprieties or
suspected wrong-doing by management or other staff without fear of reprisal. All reports received are accorded confidentiality
and independently investigated by the whistle‑blowing unit, comprising the Group Human Resource Manager and Group
Internal Audit Manager. Details of the whistle‑blowing policy are posted on the Company’s intranet. New employees are
briefed on the policy during their orientation.
ANNUAL REPORT 2014
41
CORPORATE GOVERNANCE REPORT (CONTINUED)
Internal Audit
The Company has an internal audit (“IA”) department which is staffed with professionally qualified personnel. The Group
Internal Audit Manager reports directly to the Chairman of the AC on audit matters and to the CEO on administrative matters.
The appointment and removal of the Group Internal Audit Manager rests with the Chairman of the AC.
The IA function follows the Standards for the Professional Practice of Internal Auditing set by the Institute of Internal Auditors.
The IA adopts strict procedures in reporting its audit findings to the management and the AC.
The role of the IA function is to render support to the AC in ensuring that the Group maintains a sound system of internal
controls by performing regular monitoring and testing of key controls and procedures, reviewing operational and financial
activities and undertaking investigations as requested by the AC.
The IA department submits its internal audit plan to the AC for approval at the beginning of each year. Internal audit reviews
are carried out on all significant business units in the Group and a summary of findings and recommendations is discussed
during each AC meeting. The IA has unfettered access to the AC and to all documents, reports, properties and personnel for
the purposes of its audit. The AC is of the view that the IA function is adequately resourced and staffed with persons with
relevant qualifications and experience and has appropriate standing within the Company.
Shareholders Rights and Communication with Shareholders
The Group is guided by an investor relations policy that aims to promote regular, effective and fair communication with
shareholders. Communication of relevant announcements of the Group is generally made through annual reports, press
releases, SGXNET announcements and its corporate website at www.hawpar.com. The Company’s Annual Report is sent in a
CD-ROM to all shareholders and posted on the Group’s website. Hard copies of the Annual Report are available on request.
A dedicated communications channel with the Investor Relations Department is available to shareholders and can be reached
via email at [email protected]. The Investor Relations Department is required to respond to shareholders’ queries
in a timely and effective manner. When matters requiring shareholders’ meetings are to be held, notices are published in
newspapers and reports or circulars are sent in a timely manner to all shareholders. Shareholders will be informed of the rules,
including voting procedures, which govern the shareholders’ meetings. Resolutions of all general meetings of shareholders
are conducted by electronic poll.
The Company holds regular meetings with research analysts, fund managers and institutional investors to review the Company’s
performance and provide investors with a better understanding of the Group’s businesses.
Conduct of Shareholder Meetings
The Group encourages the attendance of shareholders at general meetings, which are always held at a central location in
Singapore. At such general meetings, shareholders are invited to raise questions on any matter that needs clarification. The
Chairman and the other Directors (in particular, the chairpersons of the AC, NC and RC) as well as the external auditor are
present at general meetings to address queries from shareholders on matters affecting the Group and the conduct of external
audit. Key management personnel are also present at such general meetings to respond to queries from shareholders.
The reception after each general meeting of shareholders provides an opportunity for shareholders to informally communicate
their views and expectations to the Company’s representatives.
Separate resolutions on each issue are tabled at such general meetings. The Company allows shareholders who hold shares
through nominees to attend general meetings as observers.
42
HAW PAR CORPORATION LIMITED
CORPORATE GOVERNANCE REPORT (CONTINUED)
OTHER GOVERNANCE PRACTICES
Investment Committee
The Investment Committee (“IC”) is headed by the Chairman of the Board and comprises two Executive Directors. The IC
meets bi-monthly to review the performance of the Group’s investments, funding requirements and key strategic issues of
each operating unit. As directed by the Board, the IC receives and reviews monthly the Group’s finances.
Interested Person Transactions
Management reports all interested person transactions to the AC. The Group does not have any general mandate from
shareholders pursuant to Rule 920 with regard to interested person transactions. The following are details of interested
person transaction during the year:
Name of Interested Person
Wee Ee Lim
Aggregate value of all Interested Person Transaction during 2014
(excluding transactions less than $100,000)
$787,200
During the financial year, Mr Wee who is a nominee director in an associated company, was granted shares options by an
associated company. Upon exercising the share options, the shares were sold to the Group at cost.
Material Contracts
Except as disclosed on page 91 (Note 22 - Related Party Transactions) of the Annual Report, there were no other material
contracts entered into by the Company or its subsidiaries involving the interests of the CEO, any director or controlling
shareholder of the Company.
Dealings in Securities
The Group adopts best practices with respect to dealings in securities set out in Rule 1207(19) of the Listing Manual of the
SGX-ST. It has a policy which prohibits its officers from dealing in the securities of the Company during the period commencing
two weeks before the announcement of the financial results for each of the first three quarters and one month before the
announcement of the full‑year results. The Company Secretary issues guidelines periodically to directors and employees to
remind them of the prohibitions in dealing with the Company’s securities on short-term considerations or while in possession
of material unpublished price-sensitive information, and to comply with the insider trading laws at all times. The Group
refrains from commenting in any way on the status of the current quarter’s financials and operations or giving guidance on
future earnings estimates, during the period before announcement of the financial results.
ANNUAL REPORT 2014
43
STATUTORY REPORTS & FINANCIAL STATEMENTS
45
Directors’ Report
53
Statements of Financial Position
49
Statement By Directors Pursuant to Section 201(15)
54
Consolidated Statement of Changes in Equity
50
Independent Auditor’s Report
56
Consolidated Statement of Cash Flows
51
Consolidated Income Statement
57
Notes to the Financial Statements
52
Consolidated Statement of Comprehensive Income
44
HAW PAR CORPORATION LIMITED
DIRECTORS’ REPORT
For the financial year ended 31 December 2014
The Directors present their report to the members together with the audited financial statements of the Group for the
financial year ended 31 December 2014 and the statement of financial position of the Company as at 31 December 2014.
DIRECTORS
The Directors of the Company in office at the date of this report are as follows:
Wee Cho Yaw Wee Ee Lim Sat Pal Khattar
Hwang Soo Jin
Lee Suan Yew
Wee Ee-chao
Chew Kia Ngee
Peter Sim
Gn Hiang Meng
Han Ah Kuan (Chairman)
(President & Chief Executive Officer)
(Executive Director)
ARRANGEMENTS TO ENABLE DIRECTORS TO ACQUIRE SHARES AND DEBENTURES
Neither at the end of the financial year, nor at any time during the financial year, was the Company a party to any arrangement
whose object was to enable the Directors to acquire benefits by means of the acquisition of shares, warrants, share options
in, or debentures of, the Company or any other body corporate, other than pursuant to the Haw Par Corporation Group
2002 Share Option Scheme (“2002 Scheme”).
DIRECTORS’ INTERESTS IN SHARES OR DEBENTURES
The Directors holding office at 31 December 2014 had no interests in the shares, warrants, share options in, or debentures
of, the Company and/or its subsidiaries as recorded in the register of Directors’ shareholdings kept by the Company under
Section 164 of the Companies Act, except as follows:
Direct interest as at
1.1.2014 31.12.2014 21.1.2015
Deemed interest as at
1.1.2014 31.12.2014 21.1.2015
Interest in the Company’s ordinary shares
Wee Cho Yaw
Wee Ee Lim
Sat Pal Khattar
Hwang Soo Jin
Wee Ee-chao
Han Ah Kuan
1,092,373
437,192
–
55,000
13,826
66,000
1,092,373
437,192
–
75,000
13,826
92,000
1,092,373
437,192
–
75,000
13,826
92,000
74,612,505 75,812,505 75,812,505
69,885,353 71,085,353 71,085,353
96,219
96,219
96,219
–
–
–
70,018,951 71,218,951 71,218,951
–
–
–
Options to subscribe for the Company’s ordinary shares
(Under the 2002 Scheme)
Han Ah Kuan
144,000
114,000
114,000
–
–
–
By virtue of Section 7 of the Companies Act (Cap. 50), Wee Cho Yaw, Wee Ee Lim and Wee Ee-chao, who by virtue of their
interest of not less than 20% in the issued capital of the Company, are also deemed to have an interest in the shares of
the various subsidiary companies held by the Company.
ANNUAL REPORT 2014
45
DIRECTORS’ REPORT (CONTINUED)
For the financial year ended 31 December 2014
DIRECTORS’ CONTRACTUAL BENEFITS
Since the end of the previous financial year, no Director has received or has become entitled to receive benefits required to
be disclosed by Section 201(8) of the Companies Act, by reason of a contract made by the Company or a related corporation
with the Director or with a firm of which he is a member or with a company in which he has a substantial financial interest
except those disclosed in Note 22 to the financial statements.
SHARE OPTIONS
Haw Par Corporation Group 2002 Share Option Scheme
The 2002 Scheme was approved by members of the Company at an Extraordinary General Meeting held on 22 May 2002.
The extension of the duration of the 2002 Scheme for a further period of 5 years to 2017 was approved by members of the
Company at the Annual General Meeting held on 20 April 2011. The 2002 Scheme is granted to key executives personnel
and directors (including non-executive directors) of the Company and the maximum life-span of exercising the options is
10 years. The exercise price of the options is determined at the average of the last dealt price of the Company’s ordinary
shares as quoted on the Singapore Exchange Securities Trading Limited for five market days immediately preceding the
date of the grant. The options are exercisable beginning on the first anniversary from the date when the options are granted
or the second anniversary if the options are granted at a discount to the market price. Once the options are vested, they
are exercisable for a period of four years. The options may be exercised in full or in part in respect of 1,000 shares or any
multiple thereof, on the payment of the exercise price. The Group has no legal or constructive obligation to repurchase
or settle the options in cash. The share option scheme size shall not exceed 15% of the total number of issued shares of
the Company on the day preceding grant date and exercise prices are allowed to be set at discounts of up to 20% to their
market price.
The number of unissued ordinary shares of the Company covered by the options in relation to the 2002 Scheme outstanding
at the end of the financial year was as follows:
Date of grant
1.3.2010
1.3.2011
1.3.2012
4.3.2013
3.3.2014
Balance at 31.12.2014
36,000
85,000
67,000
303,000
512,000
1,003,000
Number of shares covered by the options
Exercise price
$5.86
$6.09
$5.95
$7.27
$8.55
Exercise period
1.3.2011 – 28.2.2015
1.3.2012 – 29.2.2016
1.3.2013 – 28.2.2017
4.3.2014 – 3.3.2018
3.3.2015 – 1.3.2019
In 2014, options to subscribe for 526,000 unissued shares in the Company at the exercise price of $8.55 per share were
granted and accepted under the 2002 Scheme. Options in respect of 4,972,000 have been granted and accepted since
the adoption of the scheme on 22 May 2002. No options have been granted at a discount to the market price of shares
of the Company. Further information can be found in Note 25 to the financial statements.
During the financial year, options to subscribe for 14,000 unissued shares were cancelled and 298,000 shares were issued
by virtue of the exercise of options. The market price on the dates of exercise ranged from $8.10 to $8.89.
46
HAW PAR CORPORATION LIMITED
DIRECTORS’ REPORT (CONTINUED)
For the financial year ended 31 December 2014
SHARE OPTIONS (CONTINUED)
Other information required by the Singapore Exchange Securities Trading Limited (Pursuant to Listing Rule 852 of the
Listing Manual)
(1)
The Share Option Scheme of the Company is administered by the Remuneration Committee, comprising the following
Directors:
Sat Pal Khattar (Chairman)
Wee Cho Yaw
Hwang Soo Jin
(2)
The details of options granted to the Directors of the Company under the 2002 Scheme are as follows:
Aggregate
Aggregate
Aggregate
number
number
number
of shares
Aggregate
Number
of shares
of shares
comprised
number
of shares
comprised
comprised
in options
of shares
comprised
in options
in options
that have
comprised
in options
granted since
exercised since
expired since
in options
granted
commencement
commencement
commencement
outstanding
during the
of scheme to
of scheme to
of scheme to
as at
Name of Director
financial year
31.12.2014
31.12.2014
31.12.2014
31.12.2014
Wee Ee Lim
Han Ah Kuan
–
66,000
48,000
569,000
48,000
407,000
–
48,000
–
114,000
(3)
No options are granted to controlling members of the Company and/or their associates (as defined in the Listing
Manual of Singapore Exchange Securities Trading Limited).
(4)
No participant has received 5% or more of the total number of options available under the share option scheme.
(5)
No options have been granted at a discount to the market price of shares of the Company for the financial year
ended 31 December 2014.
(6)
Options granted by the Company do not entitle the holders of the options, by virtue of such options, any right to
participate in any share issue of any other company in the Group.
ANNUAL REPORT 2014
47
DIRECTORS’ REPORT (CONTINUED)
For the financial year ended 31 December 2014
AUDIT COMMITTEE
The Audit Committee comprises three members, all of whom are independent non-executive Directors. The members of
the Audit Committee are as follows:
Chew Kia Ngee (Chairman)
Hwang Soo Jin
Lee Suan Yew
In accordance with Section 201B(5) of the Companies Act, the Audit Committee has reviewed with the Company’s internal
auditors their audit plan and the scope and results of their internal audit procedures. The Committee has also reviewed with
the Company’s independent auditor, PricewaterhouseCoopers LLP, their audit plan, their evaluation of the system of internal
accounting controls, their audit report on the statement of financial position of the Company and the consolidated financial
statements of the Group for the financial year ended 31 December 2014 and the assistance given by the management
of the Group to them. The statement of financial position of the Company and the consolidated financial statements of
the Group, as well as the independent auditor’s report on the same, have been reviewed by the Committee prior to their
submission to the Board of Directors.
The Committee has recommended to the Board of Directors the re-appointment of PricewaterhouseCoopers LLP as
independent auditor of the Company, at the forthcoming Annual General Meeting of the Company.
INDEPENDENT AUDITOR
PricewaterhouseCoopers LLP has expressed its willingness to accept re-appointment as independent auditor of the Company
and a resolution proposing its re-appointment will be submitted at the forthcoming Annual General Meeting.
On behalf of the Directors
Wee Cho Yaw
Chairman
Wee Ee Lim
President & Chief Executive Officer
Singapore,
27 February 2015
48
HAW PAR CORPORATION LIMITED
STATEMENT BY DIRECTORS PURSUANT TO SECTION 201(15)
For the financial year ended 31 December 2014
In the opinion of the Directors:
(a)
the statement of financial position of the Company and the consolidated financial statements of the Group as set
out on pages 51 to 109 are drawn up so as to give a true and fair view of the state of affairs of the Company and
of the Group as at 31 December 2014 and of the results, changes in equity and cash flows of the Group for the
financial year then ended; and
(b)
at the date of this statement, there are reasonable grounds to believe that the Company will be able to pay its debts
as and when they fall due.
On behalf of the Directors
Wee Cho Yaw
Chairman
Wee Ee Lim
President & Chief Executive Officer
Singapore,
27 February 2015
ANNUAL REPORT 2014
49
INDEPENDENT AUDITOR’S REPORT
TO THE MEMBERS OF HAW PAR CORPORATION LIMITED
For the financial year ended 31 December 2014
REPORT ON THE FINANCIAL STATEMENTS
We have audited the accompanying financial statements of Haw Par Corporation Limited (the “Company”) and its subsidiaries
(the “Group”) set out on pages 51 to 109, which comprise the consolidated statement of financial position of the Group
and statement of financial position of the Company as at 31 December 2014, the consolidated income statement, the
consolidated statement of comprehensive income, the consolidated statement of changes in equity and the consolidated
statement of cash flows of the Group for the year then ended, and a summary of significant accounting policies and other
explanatory information.
Management’s Responsibility for the Financial Statements
Management is responsible for the preparation of financial statements that give a true and fair view in accordance with
the provisions of the Singapore Companies Act (the “Act”) and Singapore Financial Reporting Standards, and for devising
and maintaining a system of internal accounting controls sufficient to provide a reasonable assurance that assets are
safeguarded against loss from unauthorised use or disposition; and transactions are properly authorised and that they
are recorded as necessary to permit the preparation of true and fair profit and loss accounts and statements of financial
position and to maintain accountability of assets.
Auditor’s Responsibility
Our responsibility is to express an opinion on these financial statements based on our audit. We conducted our audit in
accordance with Singapore Standards on Auditing. Those standards require that we comply with ethical requirements and
plan and perform the audit to obtain reasonable assurance about whether the financial statements are free from material
misstatement.
An audit involves performing procedures to obtain audit evidence about the amounts and disclosures in the financial
statements. The procedures selected depend on the auditor’s judgement, including the assessment of the risks of material
misstatement of the financial statements, whether due to fraud or error. In making those risk assessments, the auditor
considers internal control relevant to the entity’s preparation of financial statements that give a true and fair view in order
to design audit procedures that are appropriate in the circumstances, but not for the purpose of expressing an opinion
on the effectiveness of the entity’s internal control. An audit also includes evaluating the appropriateness of accounting
policies used and the reasonableness of accounting estimates made by management, as well as evaluating the overall
presentation of the financial statements.
We believe that the audit evidence we have obtained is sufficient and appropriate to provide a basis for our audit opinion.
Opinion
In our opinion, the consolidated financial statements of the Group and the statement of financial position of the Company
are properly drawn up in accordance with the provisions of the Act and Singapore Financial Reporting Standards so as
to give a true and fair view of the state of affairs of the Group and of the Company as at 31 December 2014, and of the
results, changes in equity and cash flows of the Group for the year ended on that date.
REPORT ON OTHER LEGAL AND REGULATORY REQUIREMENTS
In our opinion, the accounting and other records required by the Act to be kept by the Company and by those subsidiaries
incorporated in Singapore, of which we are the auditors, have been properly kept in accordance with the provisions of the Act.
PricewaterhouseCoopers LLP
Public Accountants and Chartered Accountants
Singapore,
27 February 2015
50
HAW PAR CORPORATION LIMITED
CONSOLIDATED INCOME STATEMENT
For the financial year ended 31 December 2014
The Group
Note
Revenue
Cost of sales
Gross profit
Other income
Distribution and marketing expenses
General and administrative expenses
Finance expenses
Profit from operations
Share of results of associated companies and gain on dilution of investment in
associated company (net)
Fair value gains on investment properties (net)
Profit before taxation
Taxation
2013
$’000
154,222
(63,983)
141,176
(61,214)
90,239
69,420
(37,079)
(10,181)
(423)
79,962
59,442
(31,729)
(10,834)
(267)
111,976
96,574
10
11,917
3,075
8,039
10,664
6
126,968
(8,143)
115,277
(7,358)
118,825
107,919
54.3 cents
54.3 cents
49.4 cents
49.4 cents
3
4
Profit for the financial year, net of tax
Earnings per share attributable to equity holders of the Company
- Basic
- Diluted
2014
$’000
8
The accompanying notes form an integral part of these financial statements.
ANNUAL REPORT 2014
51
CONSOLIDATED STATEMENT OF COMPREHENSIVE INCOME
For the financial year ended 31 December 2014
The Group
Note
Profit for the financial year, net of tax
2014
$’000
2013
$’000
118,825
107,919
283,208
113,912
Other comprehensive income, after tax, that may be reclassified
subsequently to profit or loss:
Fair value gains on available-for-sale financial assets (net)
Reclassification of fair value gain on disposal of available-for-sale financial assets
(3,400)
–
5,664
2,770
57
3,877
Other comprehensive income for the financial year, net of tax
285,529
120,559
Total comprehensive income for the financial year
404,354
228,478
Currency translation differences on consolidation of foreign entities (net)
Share of associated company’s other comprehensive income through equity
accounting
The accompanying notes form an integral part of these financial statements.
52
HAW PAR CORPORATION LIMITED
STATEMENTS OF FINANCIAL POSITION
As at 31 December 2014
Note
2014
$’000
The Group
2013
$’000
The Company
2014
2013
$’000
$’000
ASSETS
Non-current assets
Property, plant and equipment
Investment properties
Investment in subsidiaries
Investment in associated companies
Available-for-sale financial assets
Deferred income tax assets
Intangible assets
9
10
11
12
13
20
14
33,187
225,249
–
137,690
1,842,662
263
11,116
2,250,167
35,758
222,139
–
119,097
1,537,531
489
11,116
1,926,130
–
–
381,957
2,895
330
–
–
385,182
–
–
381,957
2,895
357
–
–
385,209
Current assets
Available-for-sale financial assets
Inventories
Trade and other receivables
Cash and bank balances
13
15
16
17
468,830
10,720
19,911
224,666
724,127
397,197
9,711
22,671
210,267
639,846
–
–
121,464
194,270
315,734
–
–
85,064
185,581
270,645
2,974,294
2,565,976
700,916
655,854
39,066
7,587
56,332
102,985
36,996
6,901
23,784
67,681
72,286
283
56,332
128,901
115,564
186
23,784
139,534
63,844
63,844
53,574
53,574
–
–
–
–
166,829
121,255
128,901
139,534
2,807,465
2,444,721
572,015
516,320
248,722
887,171
1,671,572
2,807,465
246,848
812,182
1,385,691
2,444,721
248,722
319,762
3,531
572,015
246,848
266,219
3,253
516,320
Total assets
LIABILITIES
Current liabilities
Trade and other payables
Current income tax liabilities
Borrowings
Non-current liabilities
Deferred income tax liabilities
18
19
20
Total liabilities
NET ASSETS
EQUITY
Equity attributable to equity holders of the Company
Share capital
Retained profits
Other reserves
Total equity
21
The accompanying notes form an integral part of these financial statements.
ANNUAL REPORT 2014
53
CONSOLIDATED STATEMENT OF CHANGES IN EQUITY
For the financial year ended 31 December 2014
<–––––––––––––––––––––– Attributable to equity holders of the Company ––––––––––––––––––––––>
Foreign
Share
currency
Share Statutory
Capital
option Fair value translation Retained
Total
capital reserve 1 reserve 2 reserve 3
reserve
reserve
profits
equity
$’000
$’000
$’000
$’000
$’000
$’000
$’000
$’000
2014
Balance at 1 January 2014
246,848
2,109
16,815
1,874
–
–
–
–
–
–
1,874
Expensing of share options
(Note 25)
–
–
–
305
–
–
–
305
Transfer from retained profits
to statutory reserve
–
47
–
–
–
–
(47)
Dividends paid (Note 7)
–
–
–
–
–
–
(43,789)
(43,789)
Total comprehensive income for the financial year
–
–
–
1,942
279,808
3,779
118,825
404,354
Balance at 31 December 2014
248,722
2,156
16,815
Issue of share capital
The accompanying notes form an integral part of these financial statements.
54
HAW PAR CORPORATION LIMITED
4,828 1,368,797
7,075 1,648,605
(6,858) 812,182 2,444,721
(3,079)
–
887,171 2,807,465
CONSOLIDATED STATEMENT OF CHANGES IN EQUITY (CONTINUED)
For the financial year ended 31 December 2014
<–––––––––––––––––––––– Attributable to equity holders of the Company ––––––––––––––––––––––>
Foreign
Share
currency
Share Statutory
Capital
option Fair value translation Retained
Total
capital reserve 1 reserve 2 reserve 3
reserve
reserve
profits
equity
$’000
$’000
$’000
$’000
$’000
$’000
$’000
$’000
2013
Balance at 1 January 2013
243,114
2,010
16,815
3,734
–
–
–
–
–
–
3,734
Expensing of share options
(Note 25)
–
–
–
241
–
–
–
241
Transfer from retained profits
to statutory reserve
–
99
–
–
–
–
(99)
Dividends paid (Note 7)
–
–
–
–
–
–
(40,949)
(40,949)
Total comprehensive income/
(expense) for the financial
year
–
–
–
(34) 113,912
6,681
107,919
228,478
Balance at 31 December 2013
246,848
2,109
16,815
4,828 1,368,797
Issue of share capital
1
2
3
4,621 1,254,885 (13,539) 745,311 2,253,217
(6,858)
–
812,182 2,444,721
The statutory reserve is legally required to be set aside in the countries of incorporation of certain subsidiaries. Those laws restrict the
distribution and use of the reserve.
The capital reserve relates to non-distributable profits arising from sale of long term investments according to certain subsidiaries’ Articles
of Association and share premium arising from issue of shares by certain subsidiaries.
The share option reserve relates to share option scheme of the Company and its associated companies.
The accompanying notes form an integral part of these financial statements.
ANNUAL REPORT 2014
55
CONSOLIDATED STATEMENT OF CASH FLOWS
For the financial year ended 31 December 2014
The Group
Note
Cash flows from operating activities:
Profit before tax
Adjustments for:
Gross dividend income from quoted equity investments
Share of results of associated companies and gain on dilution
of investment in associated company (net)
Depreciation of property, plant and equipment
Gain on disposal of available-for-sale financial assets
Fair value gains on investment properties (net)
Interest income
Finance expenses
Expensing of share options
Write-back of unclaimed dividends
Loss on disposal and write-off of property, plant and equipment
Inventories written off
Allowance for impairment of receivables
Impairment in value of available-for-sale financial assets
Currency translation gains
Operating profit before working capital changes
(Increase)/decrease in inventories
(Increase)/decrease in trade and other receivables
Increase/(decrease) in trade and other payables
Cash generated from operations
Investment income received
Interest income received
Net taxation paid
Net cash provided by operating activities
Cash flows from investing activities
Dividends from associated companies
Purchase of property, plant and equipment
Improvements to investment properties
Proceeds from disposal of property, plant and equipment
Proceeds from disposal of available-for-sale financial assets
Purchase of available-for-sale financial assets
Purchase of additional stake in an associated company
Net cash (used in)/provided by investing activities
Cash flows from financing activities
Payment of dividends to members of the Company
Proceeds from issue of share capital
Interest expense paid
Repayment of borrowings
Bank deposits pledged
Proceeds from borrowings
Net cash used in financing activities
Net increase in cash and cash equivalents
Cash and cash equivalents at beginning of the financial year
Effects of currency translation on cash and cash equivalents
Cash and cash equivalents at end of the financial year
The accompanying notes form an integral part of these financial statements.
56
HAW PAR CORPORATION LIMITED
4
9
4
10
4
25
5
15
5
5
9
10
13
13
22(c)
7
21
17
17
2014
$’000
2013
$’000
126,968
115,277
(62,566)
(56,663)
(11,917)
5,415
(3,400)
(3,075)
(1,434)
423
305
(278)
108
98
1
–
(512)
50,136
(1,107)
(2,292)
2,380
49,117
14,880
1,176
(7,059)
58,114
(8,039)
5,378
–
(10,664)
(868)
267
241
(246)
73
54
39
200
(89)
44,960
335
1
(991)
44,305
56,663
827
(7,184)
94,611
5,452
(2,530)
(339)
7
9,494
(47,742)
(1,574)
(37,232)
5,775
(2,576)
(978)
2
–
–
–
2,223
(43,789)
1,874
(427)
(12,413)
56
47,746
(6,953)
(40,949)
3,734
(273)
–
(6)
–
(37,494)
13,929
208,606
526
223,061
59,340
149,460
(194)
208,606
NOTES TO THE FINANCIAL STATEMENTS
For the financial year ended 31 December 2014
These notes form an integral part of and should be read in conjunction with the accompanying financial statements.
1.GENERAL
Haw Par Corporation Limited (the “Company”) is incorporated and domiciled in Singapore and is listed on the
Singapore Exchange. The address of its registered office is as follows:
401 Commonwealth Drive
#03-03 Haw Par Technocentre
Singapore 149598
The Company is the owner of the “Tiger” trademarks and is the holding company of the Group.
The principal activities of the Company are licensing of the “Tiger” trademarks and owning investments for long
term holding purposes.
The principal activities of the Group are as follows:
(a)
(b)
(c)
2.
manufacturing, marketing and trading healthcare products;
providing leisure-related goods and services; and
investing in properties and securities.
SIGNIFICANT ACCOUNTING POLICIES
(a)
Basis of preparation
The financial statements have been prepared in accordance with Singapore Financial Reporting Standards
(“FRS”). The financial statements have been prepared under the historical cost convention, except as disclosed
in the accounting policies below.
The preparation of financial statements in conformity with FRS requires management to exercise its judgement
in the process of applying the Group’s accounting policies. It also requires the use of certain critical accounting
estimates and assumptions. The areas involving a higher degree of judgement or complexity, or where
assumptions and estimates are significant to the financial statements are disclosed in Note 2(y).
Interpretations and amendments to published standards effective in 2014
On 1 January 2014, the Group adopted the new or amended FRS and Interpretations to FRS (“INT FRS”)
that are mandatory for application for the financial year. Changes to the Group’s accounting policies have
been made as required, in accordance with the transitional provisions in the respective FRS and INT FRS.
ANNUAL REPORT 2014
57
NOTES TO THE FINANCIAL STATEMENTS (CONTINUED)
For the financial year ended 31 December 2014
2.
SIGNIFICANT ACCOUNTING POLICIES (CONTINUED)
(a)
Basis of preparation (continued)
The adoption of these new or amended FRS and INT FRS did not result in substantial changes to the accounting
policies of the Group and the Company and had no material effect on the amounts reported for the current
or prior financial years except for the following:
FRS 112 Disclosures of Interests in Other Entities
The Group has adopted the above new FRS on 1 January 2014. The amendment is applicable for the annual
period beginning on or after 1 January 2014. It sets out the required disclosures for entities reporting under
the new FRS 110 Consolidated Financial Statements and FRS 111 Joint Arrangements, and replaces the
disclosure requirements currently found in FRS 27 (revised 2011) Separate Financial Statements and FRS
28 (revised 2011) Investments in Associates and Joint Ventures.
The adoption of FRS 112 does not have any material impact on the accounting policies of the Group. The
Group has applied FRS 112 retrospectively and has incorporated the additional required disclosures into the
financial statements.
(b)
Revenue recognition
Revenue comprises the fair value of the consideration received or receivable for the sale of goods and
rendering of services, in the ordinary course of the Group’s activities, net of goods and services tax, rebates
and discounts, and after eliminating sales within the Group. Revenue is recognised as follows:
(1)
Sale of goods
Revenue from sale of goods is recognised when a Group entity has transferred to the customer the
significant risks and rewards of the ownership of the goods, and collectibility of the related receivables
is reasonably assured.
(2)
Rendering of services
Revenue from services is recognised upon rendering of services.
(3)
Interest income
Interest income is recognised on a time proportion basis using the effective interest method.
(4)
Dividend income
Dividend income from subsidiaries, associated companies and available-for-sale financial assets is
recognised when the right to receive payment is established.
(5)
Rental income
Rental income from operating leases on investment properties is recognised on a straight-line basis
over the lease term when collectability of the related receivable is reasonably assured.
58
HAW PAR CORPORATION LIMITED
NOTES TO THE FINANCIAL STATEMENTS (CONTINUED)
For the financial year ended 31 December 2014
2.
SIGNIFICANT ACCOUNTING POLICIES (CONTINUED)
(c)
Group accounting
(1)
Subsidiaries
(i)
Consolidation
Subsidiaries are all entities over which the Group has control. The Group controls an entity
when the Group is exposed to, or has rights to, variable returns from its involvement with the
entity and has the ability to affect those returns through its power over the entity including
those entities which the Group has less than 50% equity interest.
Subsidiaries are consolidated from the date on which control is transferred to the Group. They
are de-consolidated from the date on which control ceases.
In preparing the consolidated financial statements, transactions, balances and unrealised gains
on transactions between group entities are eliminated. Unrealised losses are also eliminated
but are considered an impairment indicator of the asset transferred. Accounting policies of
subsidiaries have been changed where necessary to ensure consistency with the policies adopted
by the Group.
(ii)Acquisitions
The acquisition method of accounting is used to account for business combinations by the Group.
The consideration transferred for the acquisition of a subsidiary or business comprises the fair
value of the assets transferred, the liabilities incurred and the equity interests issued by the
Group. The consideration transferred also includes the fair value of any contingent consideration
arrangement and the fair value of any pre-existing equity interest in the subsidiary.
Acquisition-related costs are expensed as incurred.
Identifiable assets acquired and liabilities and contingent liabilities assumed in a business
combination are, with limited exceptions, measured initially at their fair values at the acquisition
date.
On an acquisition-by-acquisition basis, the Group recognises any non-controlling interest in
the acquiree at the date of acquisition either at fair value or at the non-controlling interest’s
proportionate share of the acquiree’s net identifiable assets.
The excess of the consideration transferred, the amount of any non-controlling interest in the
acquiree and the acquisition-date fair value of any previous equity interest in the acquiree over
the fair value of the net identifiable assets acquired is recorded as goodwill. Please refer to Note
2(e)(1) for the Group’s accounting policy on goodwill on acquisition of subsidiaries.
Please refer to Note 2(g) for the Company’s accounting policy on investments in subsidiaries
and associated companies.
ANNUAL REPORT 2014
59
NOTES TO THE FINANCIAL STATEMENTS (CONTINUED)
For the financial year ended 31 December 2014
2.
SIGNIFICANT ACCOUNTING POLICIES (CONTINUED)
(c)
Group accounting (continued)
(1)
Subsidiaries (continued)
(iii)
Disposals
When a change in the Company’s ownership interest in a subsidiary results in a loss of control over
the subsidiary, the assets and liabilities of the subsidiary including any goodwill are derecognised.
Amounts previously recognised in other comprehensive income in respect of that entity are also
reclassified to profit or loss or transferred directly to retained earnings if required by a specific Standard.
Any retained equity interest in the entity is remeasured at fair value. The difference between the
carrying amount of the retained interest at the date when control is lost and its fair value is recognised
in profit or loss.
(2)
Associated companies
Associated companies are entities over which the Group has significant influence, but not control,
generally accompanying a shareholding of between and including 20% and 50% of the voting rights.
Where the Group holds less than 20% of voting rights, the Group evaluates the extent of significant
influence to determine if it should still regard the entity as an associated company. Investments in
associated companies are accounted for in the consolidated financial statements using the equity
method of accounting less impairment losses, if any. Investments in associated companies in the
consolidated statement of financial position include goodwill (net of accumulated impairment loss)
identified on acquisition, where applicable. Please refer to Note 2(e)(1) for the Group’s accounting
policy on goodwill.
(i)
Acquisitions
Investments in associated companies are initially recognised at cost. The cost of an acquisition
is measured at the fair value of the assets given, equity instruments issued or liabilities incurred
or assumed at the date of exchange, plus costs directly attributable to the acquisition. Goodwill
on associated companies represents the excess of the cost of acquisition of the associate over
the Group’s share of the fair value of the identifiable net assets of the associate and is included
in the carrying amount of the investments.
(ii)
Equity method of accounting
In applying the equity method of accounting, the Group’s share of its associated companies’
post-acquisition profits or losses are recognised in profit or loss and its share of post-acquisition
other comprehensive income is recognised in other comprehensive income. These post-acquisition
movements and distributions received from the associated companies are adjusted against the
carrying amount of the investments. When the Group’s share of losses in an associated company
equals or exceeds its interest in the associated company, including any other unsecured noncurrent receivables, the Group does not recognise further losses, unless it has legal or constructive
obligations to make or has made payments on behalf of the associated company. If the associated
company subsequently reports profits, the Group resumes recognising its share of those profits
only after its share of the profits equals the share of losses not recognised.
Unrealised gains on transactions between the Group and its associated companies are eliminated
to the extent of the Group’s interest in the associated companies. Unrealised losses are also
eliminated unless the transaction provides evidence of an impairment of the asset transferred.
The accounting policies of associated companies have been changed where necessary to ensure
consistency with the accounting policies adopted by the Group.
60
HAW PAR CORPORATION LIMITED
NOTES TO THE FINANCIAL STATEMENTS (CONTINUED)
For the financial year ended 31 December 2014
2.
SIGNIFICANT ACCOUNTING POLICIES (CONTINUED)
(c)
Group accounting (continued)
(2)
Associated companies (continued)
(iii)Disposals
Gains and losses arising from partial disposals or dilutions in investments in associated companies
in which significant influence is retained are recognised in profit or loss.
Investments in associated companies are derecognised when the Group loses significant influence.
If the retained equity interest in the former associated company is a financial asset, the retained
equity interest is measured at fair value. The difference between the carrying amount of the
retained interest at the date when significant influence is lost and its fair value is recognised
in profit or loss.
Please refer to Note 2(g) for the Company’s accounting policy on investments in subsidiaries
and associated companies.
(d)
Property, plant and equipment
(1)
Leasehold land and buildings
Leasehold land and buildings are stated at cost less accumulated depreciation and accumulated
impairment losses (Note 2(h)(2)).
(2)
Plant and equipment
Plant and equipment are stated at cost less accumulated depreciation and accumulated impairment
losses (Note 2(h)(2)).
(3)
Components of costs
The cost of an item of property, plant and equipment includes its purchase price and any cost that is
directly attributable to bringing the asset to the location and condition necessary for it to be capable
of operating in the manner intended by management. The projected cost of dismantlement, removal
or restoration is also included as part of the cost of property, plant and equipment if the obligation for
dismantlement, removal or restoration is incurred as a consequence of acquiring or using the asset.
(4)
Depreciation
Depreciation is calculated using a straight-line method to allocate the depreciable amounts of property,
plant and equipment over their estimated useful lives as follows:
Leasehold land and buildings
Plant and equipment
-
-
50 years or over the term of the lease, whichever is shorter
4 to 10 years
Construction-in-progress assets are not depreciated until they are brought to use. Fully depreciated
assets are retained in the financial statements until they are no longer in use.
The residual values, estimated useful lives and depreciation method of property, plant and equipment
are reviewed, and adjusted as appropriate, at each financial year-end to ensure that the method and
period of depreciation are consistent with the expected pattern of economic benefits from items of
property, plant and equipment. The effects of any revision are recognised in the profit or loss for the
financial year in which the changes arise.
ANNUAL REPORT 2014
61
NOTES TO THE FINANCIAL STATEMENTS (CONTINUED)
For the financial year ended 31 December 2014
2.
SIGNIFICANT ACCOUNTING POLICIES (CONTINUED)
(d)
Property, plant and equipment (continued)
(5)
Subsequent expenditure
Subsequent expenditure relating to property, plant and equipment that has already been recognised
is added to the carrying amount of the asset only when it is probable that future economic benefits
associated with the item will flow to the Group and the cost of the item can be measured reliably. All
other repair and maintenance expense is recognised in the profit or loss when incurred.
(6)
Disposal
On disposal of an item of property, plant and equipment, the difference between the net disposal
proceeds and its carrying amount is recognised in the profit or loss.
(e)
Intangible assets
(1)
Goodwill
Goodwill on acquisitions of subsidiaries and business on or after 1 January 2010 represents the excess
of the consideration transferred, the amount of any non-controlling interest in the acquiree and the
acquisition-date fair value of any previous equity interest in the acquiree over the fair value of the
identifiable net assets acquired.
Goodwill on acquisition of subsidiaries and businesses prior to 1 January 2010 and on acquisition of
associated companies represents the excess of the cost of the acquisition over the fair value of the
Group’s share of their identifiable net assets at the date of acquisition.
Goodwill on subsidiaries is recognised separately as intangible assets and carried at cost less accumulated
impairment losses.
Goodwill on associated companies is included in the carrying amount of the investments.
Gains and losses on the disposal of subsidiaries and associated companies include the carrying
amount of goodwill relating to the entity sold, except for goodwill arising from acquisitions prior to
1 January 2001. Such goodwill was adjusted against retained profits in the year of acquisition and is
not recognised in profit or loss on disposal.
(2)Trademarks
Trademarks are stated at cost less accumulated amortisation and accumulated impairment losses (Note
2(h)(2)). Amortisation is calculated using the straight line method to allocate the cost of trademarks over
a period not exceeding 20 years. These have been fully amortised as at the end of the reporting period.
(3)
Deferred expenditure
Deferred expenditure comprises technology fee paid in advance and clinical trial expenses, which are
recognised as assets as they generate future economic benefits. Technology fee expense paid in advance
for the use of a third party’s technology is amortised using the straight line method over a 5-year period
or the period of the contract with the third party, whichever is shorter. Clinical trial expenses incurred
for product registrations are amortised using the straight line method over a 5-year period.
The amortisation period and amortisation method of intangible assets other than goodwill are reviewed at least
at each financial year-end. The effects of any revision are recognised in profit or loss when the changes arise.
62
HAW PAR CORPORATION LIMITED
NOTES TO THE FINANCIAL STATEMENTS (CONTINUED)
For the financial year ended 31 December 2014
2.
SIGNIFICANT ACCOUNTING POLICIES (CONTINUED)
(f)
Investment properties
Investment properties of the Group, principally comprising office and industrial buildings, are held for longterm rental yields and/or capital appreciation and are not substantially occupied by the Group.
Investment properties are classified as non-current assets, initially recognised at cost and subsequently
carried at fair value, determined annually by independent professional valuers on the highest-and-best-use
basis. Changes in fair values are recognised in profit or loss.
Investment properties are subject to renovations or improvements at regular intervals. The cost of major
renovations and improvements is capitalised as additions and the carrying amounts of the replaced components
are written off to profit or loss. The cost of maintenance, repairs and minor improvements is charged to profit
or loss when incurred.
On disposal of an investment property, the difference between the net disposal proceeds and the carrying
amount is recognised in profit or loss.
(g)
Investments in subsidiaries and associated companies
Investments in subsidiaries and associated companies are stated at cost less accumulated impairment losses
(Note 2(h)(2)) in the Company’s statement of financial position. On disposal of investments in subsidiaries
and associated companies, the difference between net disposal proceeds and the carrying amount of the net
investments is recognised in profit or loss.
(h)
Impairment of non-financial assets
(1)
Goodwill
Goodwill, recognised separately as an intangible asset, is tested annually for impairment and whenever
there is any indication that the goodwill may be impaired.
For the purpose of impairment testing of goodwill, goodwill is allocated to each of the Group’s cash
generating units (“CGU”) expected to benefit from synergies of the business combination.
An impairment loss is recognised when the carrying amount of CGU, including the goodwill, exceeds
the recoverable amount of the CGU. Recoverable amount of the CGU is the higher of the CGU’s fair
value less cost to sell and value-in-use.
The total impairment loss of a CGU is allocated first to reduce the carrying amount of goodwill allocated
to the CGU and then to the other assets of the CGU pro-rata on the basis of the carrying amount of
each asset in the CGU.
An impairment loss on goodwill is recognised in profit or loss and is not reversed in a subsequent period.
(2)Intangible assets, Property, plant and equipment and Investments in subsidiaries and associated
companies
Intangible assets, property, plant and equipment and investments in subsidiaries and associated
companies are reviewed for impairment whenever there is any objective evidence or indication that
these assets may be impaired.
ANNUAL REPORT 2014
63
NOTES TO THE FINANCIAL STATEMENTS (CONTINUED)
For the financial year ended 31 December 2014
2.
SIGNIFICANT ACCOUNTING POLICIES (CONTINUED)
(h)
Impairment of non-financial assets (continued)
(2)Intangible assets, Property, plant and equipment and Investments in subsidiaries and associated
companies (continued)
For the purpose of impairment testing of these assets, recoverable amount (i.e. the higher of the fair
value less cost to sell and value in use) is determined on an individual asset basis unless the asset
does not generate cash inflows that are largely independent of those from other assets. If this is the
case, recoverable amount is determined for the CGU to which the asset belongs.
If the recoverable amount of the asset (or CGU) is estimated to be less than its carrying amount, the
carrying amount of the asset (or CGU) is reduced to its recoverable amount.
The difference between the carrying amount and recoverable amount is recognised as an impairment
loss in profit or loss.
An impairment loss for an asset other than goodwill is reversed if, and only if, there has been a
change in the estimates used to determine the asset’s recoverable amount since the last impairment
loss was recognised. The carrying amount of an asset other than goodwill is increased to its revised
recoverable amount, provided that this amount does not exceed the carrying amount that would have
been determined (net of accumulated amortisation or depreciation) had no impairment loss been
recognised for the asset in prior years.
A reversal of impairment loss for an asset other than goodwill is recognised in profit or loss.
(i)
Financial assets
(1)
Classification
The Group classifies its investments in financial assets in the following categories: loans and receivables,
available-for-sale and at fair value through profit or loss. The classification depends on the nature
of the asset and the purpose for which the assets have been acquired. Management determines the
classification of its financial assets at initial recognition.
(i)
Loans and receivables
Loans and receivables (excluding prepayments) are non-derivative financial assets with fixed or
determinable payments that are not quoted in an active market. They are presented as current
assets, except those maturing later than 12 months after the end of the reporting period which
are classified as non-current assets.
(ii)
Financial assets, available-for-sale
Financial assets, available-for-sale are non-derivatives that are either designated in this category
or not classified in any of the other categories.
64
HAW PAR CORPORATION LIMITED
NOTES TO THE FINANCIAL STATEMENTS (CONTINUED)
For the financial year ended 31 December 2014
2.
SIGNIFICANT ACCOUNTING POLICIES (CONTINUED)
(i)
Financial assets (continued)
(2)
Recognition and derecognition
Regular way purchases and sales of financial assets are recognised on trade-date - the date on which
the Group commits to purchase or sell the asset.
Financial assets are derecognised when the rights to receive cash flows from the financial assets have
expired or have been transferred and the Group has transferred substantially all risks and rewards of
ownership.
On disposal of a financial asset, the difference between the net sale proceeds and its carrying amount
is recognised in profit or loss. Any amount in other comprehensive income and accumulated in the
fair value reserve relating to that asset is reclassified to profit or loss.
(3)
Initial measurement
Financial assets are initially recognised at fair value plus transaction costs.
(4)
Subsequent measurement
Available-for-sale financial assets are subsequently carried at fair value. Loans and receivables are
subsequently carried at amortised cost using the effective interest method.
Changes in fair values of available-for-sale equity securities (i.e. non-monetary items) denominated in
foreign currencies are recognised in other comprehensive income and accumulated in the fair value
reserve, together with the related currency translation differences. Dividend income on available-forsale equity securities is recognised separately in profit or loss and in accordance with Note 2(b)(4).
(5)
Impairment
The Group assesses at the end of each reporting period whether there is objective evidence that a
financial asset or a group of financial assets is impaired and recognises an allowance for impairment
when such evidence exists.
(i)
Loans and receivables
Significant financial difficulties of the debtor, probability that the debtor will enter bankruptcy,
and default or significant delay in payments are objective evidence that these financial assets
are impaired.
The carrying amount of these assets is reduced through the use of an impairment allowance
account which is calculated as the difference between the carrying amount and the present value
of estimated future cash flows, discounted at the original effective interest rate. When the asset
becomes uncollectible, it is written off against the allowance account. Subsequent recoveries
of amounts previously written off are recognised against the same line item in profit or loss.
The allowance for impairment loss account is reduced through profit or loss in a subsequent
period when the amount of impairment loss decreases and the related decrease can be objectively
measured. The carrying amount of the asset previously impaired is increased to the extent that
the new carrying amount does not exceed the amortised cost had no impairment been recognised
in prior periods.
ANNUAL REPORT 2014
65
NOTES TO THE FINANCIAL STATEMENTS (CONTINUED)
For the financial year ended 31 December 2014
2.
SIGNIFICANT ACCOUNTING POLICIES (CONTINUED)
(i)
Financial assets (continued)
(5)
Impairment (continued)
(ii)
Financial assets, available-for-sale
In addition to the objective evidence of impairment described in Note 2(i)(5)(i), a significant
or prolonged decline in the fair value of an equity security below its cost is considered as an
indicator that the available-for-sale financial asset is impaired.
If any evidence of impairment exists, the cumulative loss that was previously recognised in
other comprehensive income is reclassified to profit or loss. The cumulative loss is measured as
the difference between the acquisition cost (net of any principal repayments and amortisation)
and the current fair value, less any impairment loss previously recognised as an expense. The
impairment losses recognised as an expense on equity securities are not reversed through profit
or loss.
(j)
Inventories
Inventories are carried at the lower of cost and net realisable value. Cost is determined on a weighted average
basis. The cost of finished goods and work-in-progress comprises raw materials, direct labour, other direct costs
and related production overheads (based on normal operating capacity) but exclude borrowing costs. Net realisable
value is the estimated selling price in the ordinary course of business, less estimated costs of completion
and applicable variable selling expenses.
(k)
Operating leases
(1)
When a group company is the lessee:
Leases of property, plant and equipment where a substantial portion of the risks and rewards of ownership
is retained by the lessor are classified as operating leases. Payments made under operating leases (net
of any incentives received from the lessor) are recognised in profit or loss on a straight-line basis over the
period of the lease.
When an operating lease is terminated before the lease period has expired, any payment required to
be made to the lessor by way of penalty is recognised as an expense in the period in which termination
takes place.
(2)
When a group company is the lessor:
Leases of investment properties to third parties where the Group retains substantially all risks and rewards
incidental to ownership of the leased assets are classified as operating leases.
Rental income from operating leases (net of any incentives given to lessees) is recognised in profit or loss
on a straight-line basis over the lease term.
When an operating lease is terminated before the lease period has expired, any payment required to
be made by the lessee by way of penalty is recognised as an income in the period in which termination
takes place, provided collection is reasonably assured.
66
HAW PAR CORPORATION LIMITED
NOTES TO THE FINANCIAL STATEMENTS (CONTINUED)
For the financial year ended 31 December 2014
2.
SIGNIFICANT ACCOUNTING POLICIES (CONTINUED)
(l)
Trade and other payables
Trade and other payables represent liabilities for goods and services provided to the Group prior to the end
of financial year which are unpaid. They are classified as current liabilities if payment is due within one year
or less (or in the normal operating cycle of the business if longer). Otherwise, they are presented as noncurrent liabilities.
Trade and other payables are initially recognised at fair value, and subsequently measured at amortised cost,
using the effective interest method.
(m)
Income taxes
Current income tax for current and prior periods are recognised at the amounts expected to be paid to or
recovered from the tax authorities, using the tax rates and tax laws that have been enacted or substantively
enacted by the end of the reporting period.
Deferred income tax are recognised for all temporary differences arising between the tax bases of assets and
liabilities and their carrying amounts in the financial statements except when the deferred income tax arise
from the initial recognition of goodwill or an asset or liability in a transaction that is not a business combination
and at the time of the transaction, affects neither accounting nor taxable profit or loss.
Deferred income tax liability is recognised on temporary differences arising on investments in subsidiaries and
associated companies, except where the timing of the reversal of the temporary difference can be controlled and
it is probable that the temporary difference will not reverse in the foreseeable future.
Deferred income tax asset is recognised to the extent that it is probable that future taxable profit will be available
against which the deductible temporary differences and tax losses can be utilised.
Deferred income tax is measured:
(i)
at the tax rates that are expected to apply when the related deferred income tax asset is realised or
the deferred income tax liability is settled, based on tax rates and tax laws that have been enacted or
substantively enacted by the end of the reporting period; and
(ii) based on the tax consequence that would follow from the manner in which the Group expects, at the
end of the reporting period, to recover or settle the carrying amounts of its assets and liabilities, except
for investment properties. Investment property measured at fair value is presumed to be recovered
entirely through sale.
Current and deferred income taxes are recognised as income or expenses in profit or loss for the period, except
to the extent that the tax arises from a business combination or a transaction, which is recognised directly in
equity. Deferred tax arising from a business combination is adjusted against goodwill on acquisition.
The Group accounts for investment tax credits (for example, productivity and innovative credit) similar to
accounting for other tax credits where deferred tax asset is recognised for unused tax credits to the extent that
it is probable that future taxable profit will be available against which the unused tax credit can be utilised.
ANNUAL REPORT 2014
67
NOTES TO THE FINANCIAL STATEMENTS (CONTINUED)
For the financial year ended 31 December 2014
2.
SIGNIFICANT ACCOUNTING POLICIES (CONTINUED)
(n)
Employee benefits
(1)
Defined contribution plans
Defined contribution plans are post-employment benefit plans under which the Group pays fixed
contributions into separate entities such as Central Provident Fund on a mandatory, contractual or
voluntary basis. The Group has no further payment obligations once the contributions have been paid.
(2)
Share-based compensation
The Group operates an equity-settled, share-based compensation plan. The fair value of the employee
services received in exchange for the grant of the options is recognised as an expense in profit or loss
with a corresponding increase in share option reserve within equity over the vesting period. The total
amount to be recognised over the vesting period is determined by reference to the fair value of the
options granted on the date of grant. Non-market vesting conditions are included in the estimation of
the number of shares under options that are expected to become exercisable on vesting date. At the
end of each reporting period, the Group revises its estimates of the number of shares under options
that are expected to become exercisable on vesting date and recognises the impact of the revision
of estimates in profit or loss, with a corresponding adjustment to the share option reserve over the
remaining vesting period.
(o)
Hedging activities
The Group documents at the inception of the transaction the relationship between the hedging instruments
and hedged items, as well as its risk management objective and strategies for undertaking various hedge
transactions. The Group also documents its assessment, both at hedge inception and on an ongoing basis, of
whether the derivatives designated as hedging instruments are highly effective in offsetting changes in fair
value or cash flows of the hedged items. A non-derivative financial asset or non-derivative financial liability
may be designated as a hedging instrument for a hedge of a foreign currency risk.
The fair value changes on the hedged item resulting from currency risk are recognised in profit or loss. The
fair value changes on the portion of the hedging instrument designated as fair value hedges are recognised
in profit or loss within the same line item as the fair value changes from the hedged item.
(p)
Fair value estimation
The fair values of current financial assets and liabilities, carried at amortised cost, are assumed to approximate
their carrying amounts.
The fair values of financial instruments traded in active markets (such as exchange-traded and over-thecounter securities and derivatives) are based on quoted market prices obtained from stock exchange at the
end of the reporting period. The quoted market prices used for financial assets held by the Group are the
current bid prices; the appropriate quoted market prices for financial liabilities are the current asking prices.
The fair values of financial instruments that are not traded in an active market are determined by using
valuation techniques. The Group uses a variety of methods such as estimated discounted cash flow analyses.
68
HAW PAR CORPORATION LIMITED
NOTES TO THE FINANCIAL STATEMENTS (CONTINUED)
For the financial year ended 31 December 2014
2.
SIGNIFICANT ACCOUNTING POLICIES (CONTINUED)
(q)
Currency translation
(1)
Functional and presentation currency
Items included in the financial statements of each entity in the Group are measured using the currency
of the primary economic environment in which the entity operates (“the functional currency”). The
consolidated financial statements of the Group are presented in Singapore Dollar, which is the Company’s
functional currency.
(2)
Transactions and balances
Transactions in a currency other than the functional currency (“foreign currency”) are translated into
the functional currency using the exchange rates prevailing at the dates of transactions. Currency
translation differences resulting from the settlement of such transactions and from the translation of
monetary assets and liabilities denominated in foreign currencies at the closing rates at the end of
the reporting period are recognised in profit or loss, except for currency translation differences on the
net investment in foreign operations, borrowings in foreign currencies and other currency instruments
designated and qualifying as net investment hedges for foreign operations, which are included in other
comprehensive income and accumulated in the foreign currency translation reserve within equity.
When a foreign operation is disposed of or any borrowings forming part of the net investment of the
foreign operation are repaid, a proportionate share of the accumulated translation differences is
reclassified to profit or loss, as part of the gain or loss on disposal.
Non-monetary items that are measured at fair values in foreign currencies are translated using the
exchange rates at the date when the fair values are determined. Currency translation differences on
non-monetary items whereby gains or losses are recognised in other comprehensive income, such as
equity investments classified as available-for-sale financial assets are included in the fair value reserve.
(3)
Translation of Group entities’ financial statements
The results and financial position of Group entities (none of which has the currency of a hyperinflationary
economy) that are in functional currencies different from the presentation currency are translated into
the presentation currency as follows:
(i)
Assets and liabilities are translated at the closing rates at the reporting date;
(ii)
Income and expenses are translated at average exchange rates (unless this average is not a
reasonable approximation of the cumulative effect of the rates prevailing on the transaction
dates, in which case, income and expenses are translated at the dates of the transactions); and
(iii)
All resulting currency exchange differences are recognised in other comprehensive income and
accumulated in currency translation reserve within equity. These currency translation differences
are reclassified to profit or loss on disposal or partial disposal of the entity giving rise to such
reserve.
Goodwill and fair value adjustments arising from the acquisition of a foreign entity on or after 1 January
2005 are treated as assets and liabilities of the foreign entity and translated at the closing rates at the
date of the end of the reporting date. For acquisitions prior to 1 January 2005, the exchange rates at
the dates of the acquisition are used.
ANNUAL REPORT 2014
69
NOTES TO THE FINANCIAL STATEMENTS (CONTINUED)
For the financial year ended 31 December 2014
2.
SIGNIFICANT ACCOUNTING POLICIES (CONTINUED)
(r)
Segment reporting
Operating segments are reported in a manner consistent with the internal reporting provided to the management
committee and Investment Committee whose members are responsible for allocating resources and assessing
performance of the operating segments.
(s)
Cash and cash equivalents
For purpose of presentation in the consolidated statement of cash flows, cash and cash equivalents include
cash and bank balances, deposits with financial institutions, bank overdrafts, if any and excludes bank deposits
pledged as security. For cash subjected to restriction, assessment is made on the economic substance of the
restriction and whether they meet the definition of cash and cash equivalents.
(t)
Share capital
Ordinary shares are classified as equity. Incremental costs directly attributable to the issuance of new ordinary
shares are deducted against the share capital account. When the Company’s ordinary shares are repurchased,
the weighted average cost of each share is written off against the share capital, with the remaining amounts
written off against the retained earnings of the Company.
(u)
Dividends
Final dividends to the Company’s members are recognised when the dividends are approved by the members.
(v) Government grants
Grants from the government are recognised as a receivable at their fair value when there is reasonable assurance
that the grant will be received and the Group will comply with all the attached conditions.
Government grants receivable are recognised as income over the periods necessary to match them with the
related costs which they are intended to compensate on a systematic basis. Government grants relating to
expenses are shown separately as other income.
(w)
Financial guarantees
The Company had issued corporate guarantees to banks for credit facilities of its subsidiaries. These guarantees
are financial guarantee contracts as they require the Company to reimburse the banks if the subsidiaries fail
to make principal or interest payments when due in accordance with terms of their credit facilities.
Financial guarantee contracts are initially recognised at their fair values plus transaction costs in the Company’s
statement of financial position.
Financial guarantee contracts are subsequently amortised to profit or loss over the period of the subsidiaries’
borrowings, unless it is probable that the Company will reimburse the bank for an amount higher than the
unamortised amount. In this case, the financial guarantee contracts shall be carried at the expected amount
payable to the bank in the Company’s statement of financial position.
70
HAW PAR CORPORATION LIMITED
NOTES TO THE FINANCIAL STATEMENTS (CONTINUED)
For the financial year ended 31 December 2014
2.
SIGNIFICANT ACCOUNTING POLICIES (CONTINUED)
(x)
Borrowings
Borrowings are presented as current liabilities unless the Group has an unconditional right to defer settlement
for at least 12 months after the end of the reporting period, in which case, they are presented as non-current
liabilities.
Borrowings are initially recognised at fair value (net of transaction costs) and subsequently carried at amortised
cost. Any difference between the proceeds (net of transaction costs) and the redemption value is recognised
in profit or loss over the period of the borrowings using the effective interest method.
Borrowing costs are recognised in profit or loss using the effective interest method.
(y)
Critical accounting estimates and judgements
Estimates, assumptions and judgements are continually evaluated and are based on historical experience and
other factors, including expectations of future events that are believed to be reasonable under the circumstances.
The Group makes estimates and assumptions concerning the future. The resulting accounting estimates
will, by definition, seldom equal to the related actual results. The estimates and assumptions that have a
significant risk of causing a material adjustment to the carrying amounts of assets and liabilities within the
next financial year are discussed below.
(1)
Investment in Hua Han Bio-Pharmaceutical Holdings Limited (“HHBP”)
Management has assessed the level of influence that the Group has on HHBP (Note 28) and determined
that it has significant influence even though its shareholding is below 20 per cent because of its
representations on the board of HHBP, to participate and influence all major decisions relating to the
relevant activities of HHBP. Consequently, this investment has been classified as an associate.
(2)
Impairment of property, plant and equipment The Group tests annually whether property, plant and equipment have suffered any impairment, in
accordance with the accounting policy stated in Note 2(h)(2). The recoverable amounts of these assets
and where applicable, cash-generating units, have been determined based on value-in-use calculations.
These calculations require the use of estimates. Based on the calculations, the estimated recoverable
amount is higher than the carrying amount of property, plant and equipment (Note 9), hence no
impairment is considered necessary.
Based on the sensitivity analysis performed, any reasonable change in the key assumptions would not
result in any impairment adjustments.
ANNUAL REPORT 2014
71
NOTES TO THE FINANCIAL STATEMENTS (CONTINUED)
For the financial year ended 31 December 2014
3.REVENUE
Revenue of the Group represents invoiced sales and services, and rental income but excludes dividend income,
interest income and intra-group transactions.
The Group
2014
2013
$’000
$’000
Sale of goods
Rendering of services
Rental income
4.
125,554
12,281
16,387
154,222
107,933
16,046
17,197
141,176
OTHER INCOME
The Group
2014
2013
$’000
$’000
Gross dividend income from quoted equity investments
Gain on disposal of available-for-sale financial assets
Interest income
Miscellaneous income
62,566
3,400
1,434
2,020
69,420
56,663
–
868
1,911
59,442
During the financial year, approximately $47,686,000 of dividend income was received as non-cash available-forsale financial assets in lieu of dividends.
72
HAW PAR CORPORATION LIMITED
NOTES TO THE FINANCIAL STATEMENTS (CONTINUED)
For the financial year ended 31 December 2014
5.
NATURE OF EXPENSES
The Group
2014
2013
$’000
$’000
Purchase of inventories
Changes in inventories
Sales and marketing expenses
Employee benefits (Note 25(a))
Depreciation of property, plant and equipment (Note 9)
Utilities
Repair and maintenance
Property tax
Auditors’ remuneration:
- Auditor of the Company:
- audit fees
- non-audit fees
- overprovision of audit fees in respect of prior year
- Other auditors:
- audit fees
- non-audit fees
Professional and legal fee
Trademark expenses
Impairment in value of available-for-sale financial assets
Loss on disposal and write-off of property, plant and equipment
Inventories written off
Allowance for impairment of receivables
Foreign exchange gain, net
38,200
(1,107)
37,093
28,781
23,410
5,415
3,466
3,443
1,720
37,385
389
37,774
25,052
21,548
5,378
3,778
3,307
2,355
394
6
(1)
382
3
(1)
29
27
630
397
–
108
98
1
(96)
30
25
592
403
200
73
54
39
(135)
6.TAXATION
The Group
2014
2013
$’000
$’000
Tax expense attributable to profit is made up of:
Current taxation
Current year:
- Singapore
- Overseas
(Over)/under provision in respect of previous years:
- Singapore
- Overseas
6,412
2,347
8,759
(638)
(71)
(709)
ANNUAL REPORT 2014
5,532
2,013
7,545
29
(163)
(134)
73
NOTES TO THE FINANCIAL STATEMENTS (CONTINUED)
For the financial year ended 31 December 2014
6.TAXATION (CONTINUED)
The Group
2014
2013
$’000
$’000
Deferred taxation
Origination and reversal of temporary differences:
- Singapore
-Overseas
Under provision in respect of previous years:
- Singapore
-Overseas
(147)
177
30
(163)
(95)
(258)
9
54
63
27
178
205
8,143
7,358
The tax expense on accounting profit differs from the amount that would arise using the Singapore standard rate
of income tax due to the following:
Profit before taxation
Share of results of associated companies and gain on dilution of investment in
associated company (net)
Profit before taxation and share of results of associated companies and gain
on dilution of investment in associated company (net)
Taxation at applicable Singapore tax rate of 17% (2013: 17%)
Adjustments:
- Tax rate difference in subsidiaries
- Withholding taxes
- Tax effect of expenses not deductible for tax purposes
- Tax effect of income not subject to tax
- Tax rebates and exemptions
- Utilisation of previously unrecognised deferred taxes
- Deferred income tax asset not recognised
- (Over)/under provision in respect of previous years
Taxation expense
2014
$’000
2013
$’000
126,968
115,277
(11,917)
(8,039)
115,051
107,238
19,559
18,230
324
1,081
938
(11,884)
(752)
(508)
31
(646)
8,143
420
646
1,002
(11,787)
(450)
(806)
32
71
7,358
There is no tax charge/credit relating to the component of other comprehensive income except for fair value gains/
(losses) on available-for-sale financial assets for which the deferred tax relating to it is disclosed in Note 20 to the
financial statements.
74
HAW PAR CORPORATION LIMITED
NOTES TO THE FINANCIAL STATEMENTS (CONTINUED)
For the financial year ended 31 December 2014
7.
DIVIDENDS PAID
The Group
and the Company
2014
2013
$’000
$’000
Ordinary dividends paid:
Final exempt 2013 dividend of 14 cents per share (2013: Final 2012 dividend
of 13 cents per share)
Interim exempt 2014 dividend of 6 cents per share (2013: 6 cents per share)
Dividend per share (net of tax)
30,652
27,829
13,137
43,789
13,120
40,949
20 cents
19 cents
The Directors recommend a final tax exempt one-tier dividend of 14 cents per share, amounting to approximately
$30.7 million to be paid for the financial year ended 31 December 2014 (2013: 14 cents per share amounting to
$30.6 million). These financial statements do not reflect this dividend, which will be accounted for in the shareholders’
equity as an appropriation of retained profits in the financial year ending 31 December 2015.
In accordance to Articles of Association (Article 134) of the Company, unclaimed dividends for more than 6 years
are written back.
8.
EARNINGS PER SHARE
The Group
2014
2013
$’000
$’000
Earnings for the financial year
118,825
107,919
’000
’000
218,883
119
218,538
112
219,002
218,650
Earnings per share attributable to equity holders of the Company
- Basic
54.3 cents
49.4 cents
- Diluted
54.3 cents
49.4 cents
Weighted average number of ordinary shares for calculation of
basic earnings per share
Dilution adjustment for share options
Adjusted weighted average number of shares for calculation of
diluted earnings per share
ANNUAL REPORT 2014
75
NOTES TO THE FINANCIAL STATEMENTS (CONTINUED)
For the financial year ended 31 December 2014
8.
EARNINGS PER SHARE (CONTINUED)
Basic earnings per share is calculated by dividing the net profit attributable to equity holders of the Company by
the weighted average number of ordinary shares outstanding during the financial year.
The diluted earnings per share is adjusted for the effects of all dilutive potential ordinary shares. The Company has
one category of dilutive potential ordinary shares which is share options. A calculation is carried out to determine
the number of shares that could have been issued at fair value (determined as the average annual market share
price of the Company’s shares) based on the monetary value of the subscription rights attached to outstanding
share options. The number of shares calculated is compared with the number of shares that would have been issued
assuming the exercise of the share options. The difference is added to the denominator as an issuance of ordinary
shares for no consideration. No adjustment is made to net profit (numerator).
9.
PROPERTY, PLANT AND EQUIPMENT
Leasehold
land and
buildings
$’000
Plant
and
equipment
$’000
Total
$’000
The Group
Cost
At 1 January 2014
Additions
Disposals/write-offs
Currency translation differences
At 31 December 2014
44,556
61
(70)
548
45,095
55,469
2,469
(617)
202
57,523
100,025
2,530
(687)
750
102,618
Accumulated depreciation and impairment losses
At 1 January 2014
Charge for 2014
Disposals/write-offs
Currency translation differences
At 31 December 2014
23,471
1,904
(50)
239
25,564
40,796
3,511
(522)
82
43,867
64,267
5,415
(572)
321
69,431
19,531
13,656
33,187
Net book value
At 31 December 2014
76
HAW PAR CORPORATION LIMITED
NOTES TO THE FINANCIAL STATEMENTS (CONTINUED)
For the financial year ended 31 December 2014
9.
PROPERTY, PLANT AND EQUIPMENT (CONTINUED)
Leasehold
land and
buildings
$’000
Plant
and
equipment
$’000
Total
$’000
The Group
Cost
At 1 January 2013
Additions
Disposals/write-offs
Currency translation differences
At 31 December 2013
44,152
160
(45)
289
44,556
53,341
2,416
(553)
265
55,469
97,493
2,576
(598)
554
100,025
Accumulated depreciation and impairment losses
At 1 January 2013
Charge for 2013
Disposals/write-offs
Currency translation differences
At 31 December 2013
21,651
1,980
(24)
(136)
23,471
37,895
3,398
(499)
2
40,796
59,546
5,378
(523)
(134)
64,267
21,085
14,673
35,758
Net book value
At 31 December 2013
Included in leasehold land and buildings is land use rights amounting to $1,085,000 (2013: $1,059,000).
10.
INVESTMENT PROPERTIES
The Group
2014
$’000
2013
$’000
Beginning of financial year
Improvements
Fair value gains on investment properties recognised in profit or loss (net)
Currency translation differences
End of financial year
222,139
339
3,075
(304)
225,249
211,545
978
10,664
(1,048)
222,139
At valuation:
Freehold and 999-year leasehold properties
Leasehold properties
47,149
178,100
47,039
175,100
The Group’s investment properties consist of both commercial and industrial properties. Investment properties are
mainly leased to third parties under operating leases (Note 24(b)).
The Group engages external, independent and qualified valuers to determine the fair value of the Group’s properties
at the end of every financial year based on the properties’ highest and best use. Discussions on the valuation
processes, key inputs applied in the valuation approach and the reasons for the fair value changes are held amongst
the Group’s property manager, the chief financial officer and the independent valuer annually.
ANNUAL REPORT 2014
77
NOTES TO THE FINANCIAL STATEMENTS (CONTINUED)
For the financial year ended 31 December 2014
10.
INVESTMENT PROPERTIES (CONTINUED)
Fair value changes of investment properties amounted to gains of $3,075,000 (2013: $10,664,000). These fair
value changes are non-cash in nature.
The following amounts are recognised in profit or loss:
The Group
2014
2013
$’000
$’000
Rental income (Note 3)
Direct operating expenses arising from investment properties
that generated rental income
16,387
17,197
(4,882)
(4,757)
Certain investment properties valued at approximately $178,100,000 (2013: $175,100,000) are pledged to the
banks as security for bank credit facilities (Note 19).
Fair value hierarchy
The following table illustrates the fair value measurement hierarchy of the Group’s investment properties:
Fair value measurements using
Quoted prices
in active
markets
(Level 1)
$’000
Significant
observable
inputs
(Level 2)
$’000
Significant
unobservable
inputs
(Level 3)
$’000
Total
$’000
Recurring fair value measurement for:
31 December 2014
Commercial properties
Industrial properties
Total
–
–
–
–
9,514
9,514
148,435
67,300
215,735
148,435
76,814
225,249
31 December 2013
Commercial properties
Industrial properties
Total
–
–
–
38,291
8,748
47,039
107,800
67,300
175,100
146,091
76,048
222,139
Description
Level 2 fair values of the Group’s properties have been generally derived using the investment method cross referenced
with the direct sales comparison approach, where there have been recent transactions of similar properties in similar
locations in an active market. The cross reference revealed no significant variation in valuation. The most significant
input into the direct sales comparison approach is selling price per square metre. Level 3 fair values of the Group’s
properties have been derived using the income capitalisation approach which the valuers have also cross referenced
with that obtained under the sales comparison approach. Sales prices of comparable properties in close proximity
are adjusted for differences in key attributes such as property size, age, tenure, condition of buildings, availability
of carparking facilities, dates of transaction and prevailing market conditions. The most significant input into the
income capitalisation valuation approach is capitalisation rate.
Under Level 3 fair value measurement, the fair value of the investment properties was calculated using a capitalisation
rate ranging from 5.25% to 7% (2013: 5.3% to 6.25%) for commercial properties and 7% (2013: 7%) for Industrial
properties. An increase in capitalisation rate will result in a decrease to the fair value of an investment property.
78
HAW PAR CORPORATION LIMITED
NOTES TO THE FINANCIAL STATEMENTS (CONTINUED)
For the financial year ended 31 December 2014
10.
INVESTMENT PROPERTIES (CONTINUED)
Reconciliation of fair value measurements categorised within Level 3:
Commercial
properties
$’000
Industrial
properties
$’000
2014
Beginning of financial year
Transfer to Level 3
Improvements
Fair value gains/(losses) recognised in profit or loss
End of financial year
107,800
37,635
28
2,972
148,435
67,300
–
85
(85)
67,300
2013
Beginning of financial year
Improvements
Fair value gains recognised in profit or loss
End of financial year
99,700
46
8,054
107,800
67,300
–
–
67,300
There were no changes in valuation techniques during the year.
The Group’s policy is to recognise transfers into and out of fair value hierarchy levels as of the date of the event or
change in circumstances that caused the transfer.
The details of the Group’s investment properties are as follows:
Tenure of land
Independent
valuer
Investment properties
Description
Valuation date
Haw Par Glass Tower
178 Clemenceau Avenue
Singapore 239926
9-storey office building on a land
area of 899 square metres. The
lettable area is 3,316 square
metres.
99-year lease
from 2 June
1970
DTZ
Debenham Tie
Leung (SEA)
Pte Ltd
31 December
2014
Haw Par Centre
180 Clemenceau Avenue
Singapore 239922
6-storey office building on a land
area of 2,464 square metres. The
lettable area is 10,251 square
metres.
99-year
lease from 1
September
1952
DTZ
Debenham Tie
Leung (SEA)
Pte Ltd
31 December
2014
Haw Par Technocentre
7-storey industrial building on a
401 Commonwealth Drive land area of 8,131 square metres.
Singapore 149598
The lettable area is 15,700 square
metres.
99-year lease
from 1 March
1963
DTZ
Debenham Tie
Leung (SEA)
Pte Ltd
31 December
2014
Menara Haw Par
Lot 242, Jalan Sultan
Ismail, 50250
Kuala Lumpur
Malaysia
32-storey office building on a land
area of 2,636 square metres and a
parcel of commercial land of 1,294
square metres. The lettable area
of the building is 16,074 square
metres.
Freehold
DTZ Nawawi
Tie Leung
Property
Consultants
Sdn Bhd
31 December
2014
Westlands Centre
Units 1405-1407
Westlands Centre
20 Westlands Road
Quarry Bay
Hong Kong
3 units of office/industrial space
with a lettable area of 475 square
metres.
999-year lease DTZ
Debenham Tie
Leung Limited
31 December
2014
ANNUAL REPORT 2014
79
NOTES TO THE FINANCIAL STATEMENTS (CONTINUED)
For the financial year ended 31 December 2014
11.
INVESTMENT IN SUBSIDIARIES
The Company
2014
2013
$’000
$’000
Equity investments at cost:
Unquoted, at written down cost
Allowance for impairment in value
Beginning and end of financial year
421,095
(39,138)
381,957
421,095
(39,138)
381,957
Details of significant subsidiaries are shown in Note 28.
12.
INVESTMENT IN ASSOCIATED COMPANIES
The Company
2014
2013
$’000
$’000
Equity investment at cost
2,895
2,895
Set out below is the associated company of the Group as at 31 December 2014, which, in the opinion of the
Directors, is material to the Group. The associated company as listed below have share capital consisting solely of
ordinary shares, which are held directly by the Group.
Name of company
Hua Han Bio-Pharmaceutical
Holdings Limited (“HHBP”)
Country of incorporation
Principal activities
% of ownership interest
Cayman Islands
Investment holding
14.4
HHBP is an investment holding company with subsidiaries which operate mainly in the People’s Republic of China
and its principal activity is that of manufacturing and sale of pharmaceutical products, trading of pharmaceutical
products and the research and development of pharmaceutical products.
HHBP is listed on the Hong Kong Stock Exchange. The fair value at the end of the reporting period is $229,893,000
(2013: $118,090,000). This is based on its quoted bid price as at 31 December 2014 and the exchange rate of
$1 = HK$5.92 (2013: $1 = HK$6.17).
The Group’s investment in HHBP has a carrying amount denominated in Hong Kong dollars with a Singapore-dollars
equivalent of $134,208,000 (2013: $115,845,000).
There are no contingent liabilities relating to the Group’s interest in the associated company.
80
HAW PAR CORPORATION LIMITED
NOTES TO THE FINANCIAL STATEMENTS (CONTINUED)
For the financial year ended 31 December 2014
12.
INVESTMENT IN ASSOCIATED COMPANIES (CONTINUED)
Set out below are the summarised financial information for HHBP.
Summarised statement of financial position
As at 31 December
2014
2013
$’000
$’000
Current assets
Includes:
- Cash and cash equivalents
566,068
568,658
342,941
399,756
Current liabilities
Includes:
- Financial liabilities (excluding trade and other payables)
(78,481)
(94,416)
(39,781)
(56,638)
Non-current assets
490,377
330,286
Non-current liabilities
Includes:
- Financial liabilities
- Other liabilities
(9,918)
(11,036)
–
(9,918)
(5)
(11,031)
Non-controlling interests
(35,401)
(32,852)
Net assets
932,645
760,640
Summarised statement of comprehensive income
For the year ended
31 December
2014
2013
$’000
$’000
Revenue
264,495
337,181
Expenses includes:
- Depreciation and amortisation
(8,618)
(7,724)
Profit before taxation
90,690
57,579
(26,628)
(14,911)
64,062
42,668
466
25,335
64,528
68,003
Taxation
Profit for the year, net of tax
Other comprehensive income for the year, net of tax
Total comprehensive income for the year
ANNUAL REPORT 2014
81
NOTES TO THE FINANCIAL STATEMENTS (CONTINUED)
For the financial year ended 31 December 2014
12.
INVESTMENT IN ASSOCIATED COMPANIES (CONTINUED)
The financial year end for HHBP is 30 June. The above summarised statements of financial position and comprehensive
income were presented based on the audited accounts for the year ended 30 June 2014 and unaudited six months
results to 31 December 2014 as announced on the overseas stock exchange, adjusted for differences in accounting
policies between the Group and the associated company.
Reconciliation of summarised financial information
As at 31 December
2014
2013
$’000
$’000
Net assets
At 1 January
760,640
681,560
64,062
42,668
Other comprehensive income
466
25,335
Dividends received/receivable
–
Profit for the year
(65,439)
Other transactions with owners
70,526
54,839
Currency translation differences
36,951
21,677
At 31 December
932,645
760,640
Interest in associated company (2014: 14.39%; 2013: 15.23%)
134,208
115,845
3,482
3,252
137,690
119,097
Add:
Carrying value of other associated company
Carrying value of Group’s interest in associated companies
For the year ended
31 December
2014
2013
$’000
$’000
Dividends received/receivable from HHBP
–
10,335
Investments in associated companies at 31 December 2014 include intangible assets of $1,853,000 (2013:
$1,880,000).
Details of associated companies are set out in Note 28.
82
HAW PAR CORPORATION LIMITED
NOTES TO THE FINANCIAL STATEMENTS (CONTINUED)
For the financial year ended 31 December 2014
13. AVAILABLE-FOR-SALE FINANCIAL ASSETS
The Group
2014
2013
$’000
$’000
Beginning of financial year
Additions
Fair value gains/(losses) recognised in other
comprehensive income
Impairment in value of available-for-sale financial assets
Disposals
Currency translation differences
End of financial year
Less: Non-current portion
Current portion
1,934,728
95,428
The Company
2014
2013
$’000
$’000
1,815,844
–
293,610
118,329
–
(200)
(9,494)
–
(2,780)
755
2,311,492 1,934,728
(1,842,662) (1,537,531)
468,830
397,197
357
–
401
–
(27)
–
–
–
330
(330)
–
(44)
–
–
–
357
(357)
–
Available-for-sale financial assets are analysed as follows:
The Group
2014
2013
$’000
$’000
Quoted investments
Unquoted investments
2,311,062
430
2,311,492
1,934,251
477
1,934,728
The Company
2014
2013
$’000
$’000
–
330
330
–
357
357
The quoted investments are mainly listed in Singapore (Note 26(a)).
During the financial year, approximately $47,686,000 (2013: Nil) of additions were non-cash and shares obtained
in lieu of dividends.
Certain available-for-sale financial assets valued at $205,499,000 (2013: $182,189,000) are pledged as security
for bank credit facilities (Note 19).
ANNUAL REPORT 2014
83
NOTES TO THE FINANCIAL STATEMENTS (CONTINUED)
For the financial year ended 31 December 2014
14.
INTANGIBLE ASSETS
The Group
2014
2013
$’000
$’000
Goodwill on consolidation
Trademarks and deferred expenditure
11,116
–
11,116
11,116
–
11,116
The Company
2014
2013
$’000
$’000
–
–
–
–
–
–
(a)
Goodwill on consolidation
The Group
2014
2013
$’000
$’000
Cost
Balance at beginning and end of financial year
11,116
11,116
Impairment test for goodwill
The goodwill is allocated to the healthcare division of the Group, which is regarded as a cash-generating
unit (“CGU”).
During the financial year, the Group has determined that there is no impairment of its CGU containing the
goodwill. The recoverable amount (i.e. higher of value-in-use and fair value less costs to sell) of the CGU is
determined on the basis of value-in-use calculations. These calculations incorporate cash flow projections
by management covering a five-year period.
Key assumptions used for value-in-use calculations:
Discount rate Growth rate 7.0% (2013: 6.7%)
0.0% (2013: 0.0%)
These assumptions have been used for the analysis of the CGU. The discount rate used is pre-tax and reflects
specific risks relating to the healthcare division. Based on the sensitivity analysis performed, any reasonable
change in the key assumptions would not result in any impairment adjustments.
84
HAW PAR CORPORATION LIMITED
NOTES TO THE FINANCIAL STATEMENTS (CONTINUED)
For the financial year ended 31 December 2014
14.
INTANGIBLE ASSETS (CONTINUED)
(b)
Trademarks and deferred expenditure
Trademarks
$’000
Deferred
expenditure
$’000
–
–
The Group
Net book value
2014 and 2013
Beginning and end of financial year
At 31 December 2014 and 2013:
Cost
Less: Accumulated amortisation
Net book value
3,200
(3,200)
–
1,400
(1,400)
–
Trademarks
$’000
The Company
Net book value
2014 and 2013
Beginning and end of financial year
–
At 31 December 2014 and 2013:
Cost
Less: Accumulated amortisation
Net book value
2,000
(2,000)
–
The Company and its wholly-owned subsidiary, Haw Par Brothers International (HK) Ltd ("HPBIHK") own the
"Tiger" (Cost: $2.0 million) and "Kwan Loong" ("Double Lion") (Cost: HK$5.58 million) trademarks respectively.
The Company and HPBIHK (together "the Licensors"), licensed to Haw Par Healthcare Limited ("HPH"),
another wholly-owned subsidiary, the exclusive right to manufacture, distribute, market and sell "Tiger" and
"Kwan Loong" products worldwide until 31 December 2037 and can be renewable for a further period of 25
years on terms to be mutually agreed between the Licensors and HPH.
ANNUAL REPORT 2014
85
NOTES TO THE FINANCIAL STATEMENTS (CONTINUED)
For the financial year ended 31 December 2014
15.INVENTORIES
The Group
2014
2013
$’000
$’000
181
5,612
4,927
10,720
Trading stocks
Manufacturing stocks
Finished stocks
Total
220
5,797
3,694
9,711
The cost of inventories recognised as expense and included in “Cost of sales” amounted to $37,093,000 (2013:
$37,774,000).
During the financial year, the Group recognised inventories written off of $98,000 (2013: $54,000). The inventories
written off have been included in "Cost of sales" in profit or loss.
16.
TRADE AND OTHER RECEIVABLES
The Group
2014
2013
$’000
$’000
Trade receivables
Less: Allowance for impairment of receivables
Trade receivables (net)
Advances to subsidiaries
Other receivables
Less: Allowance for impairment of other receivables
Other receivables (net)
Total
17,175
(8)
17,167
–
2,744
–
2,744
19,911
The Company
2014
2013
$’000
$’000
14,259
(8)
14,251
2,393
–
2,393
2,045
–
2,045
–
8,435
(15)
8,420
118,648
423
–
119,071
82,842
177
–
83,019
121,464
85,064
22,671
Other receivables mainly comprise of other debtors and deposits of approximately $1,982,000 (2013: dividend
receivable from an associated company of approximately $4,960,000 and other debtors and deposits of approximately
$3,040,000).
Advances to subsidiaries by the Company are non-trade, unsecured, interest-free and are repayable on demand. The
carrying values of the advances approximate their fair values.
The carrying amounts of trade and other receivables approximate their fair values.
86
HAW PAR CORPORATION LIMITED
NOTES TO THE FINANCIAL STATEMENTS (CONTINUED)
For the financial year ended 31 December 2014
17.
CASH AND BANK BALANCES
The Group
2014
2013
$’000
$’000
Short term bank deposits
Cash at bank and on hand
197,306
27,360
224,666
189,737
20,530
210,267
The Company
2014
2013
$’000
$’000
186,493
7,777
194,270
183,011
2,570
185,581
The carrying amounts of cash and bank balances approximate their fair values.
Included in the cash and bank balances are bank deposits and cash on hand amounting to $5,398,000 (2013:
$4,659,000) which is less freely remittable for use by the Group because of currency exchange restrictions.
Cash and cash equivalents included in the consolidated statement of cash flows comprise the following:
The Group
2014
2013
$’000
$’000
224,666
(1,605)
223,061
Cash and bank balances (as above)
Less: Bank deposits pledged for banking facilities
Cash and cash equivalents per consolidated statement of cash flows
18.
210,267
(1,661)
208,606
TRADE AND OTHER PAYABLES
The Group
2014
2013
$’000
$’000
Trade payables
Other payables and accruals
Advances from subsidiaries
2,921
36,145
–
39,066
3,098
33,898
–
36,996
The Company
2014
2013
$’000
$’000
–
2,420
69,866
72,286
–
2,503
113,061
115,564
Other payables and accruals mainly comprise of accrued advertisement and promotion expenses, and accrued
employee compensation.
The carrying values of trade and other payables approximate their fair values.
Advances from subsidiaries are non-trade, unsecured, interest free and are repayable on demand.
ANNUAL REPORT 2014
87
NOTES TO THE FINANCIAL STATEMENTS (CONTINUED)
For the financial year ended 31 December 2014
19.BORROWINGS
The Group
and the Company
2014
2013
$’000
$’000
Current
Bank borrowings
56,332
23,784
The bank borrowings of the Group and the Company are exposed to interest rate changes and contractual repricing
in less than 6 months from the balance sheet date for both financial years.
Bank borrowings and credit facilities of the Group are secured over certain available-for-sale financial assets (Note
13) and certain investment properties (Note 10).
The carrying value of bank borrowings approximates its fair value.
20.
DEFERRED INCOME TAXATION
Deferred income tax assets and liabilities are offset when there is a legally enforceable right to set off current income
tax assets against current income tax liabilities and when the deferred income taxes relate to the same fiscal authority.
The amounts, determined after appropriate offsetting, are shown on the statement of financial position as follows:
The Group
2014
2013
$’000
$’000
Deferred income tax assets
- to be recovered within 12 months
Deferred income tax liabilities
- to be settled within 12 months
- to be settled after more than 12 months
88
HAW PAR CORPORATION LIMITED
(263)
(263)
(489)
(489)
The Company
2014
2013
$’000
$’000
–
–
–
–
387
63,457
63,844
346
53,228
53,574
–
–
–
–
–
–
63,581
53,085
–
–
NOTES TO THE FINANCIAL STATEMENTS (CONTINUED)
For the financial year ended 31 December 2014
20.
DEFERRED INCOME TAXATION (CONTINUED)
The movements in the deferred income tax account are as follows:
The Group
2014
2013
$’000
$’000
The Company
2014
2013
$’000
$’000
Beginning of financial year
53,085
48,687
–
–
Tax charged to fair value reserve:
- changes in fair value
10,402
4,417
–
–
93
93
1
63,581
(53)
(53)
34
53,085
–
–
–
–
–
–
–
–
Tax charged/(credited) to profit or loss:
-others
Currency translation differences
End of financial year
Deferred income tax assets are recognised for tax losses carried forward to the extent that realisation of the related
tax benefits through future taxable profits is probable. The Group has unrecognised deferred income tax assets arising
from tax losses of $22.5 million (2013: $22.7 million) at the end of the reporting period. These tax losses can be
carried forward and used to offset against future taxable income subject to meeting certain statutory requirements
by those companies in their respective countries of incorporation. These tax losses have no expiry date except for
an amount of $135,000 which will expire between 2016 and 2019.
Deferred income tax liabilities of $118,000 (2013: $170,000) have not been recognised for the withholding and
other taxes that will be payable on the earnings of overseas subsidiaries when remitted to the holding company.
These undistributed profits amount to $824,000 (2013: $1,230,000) at the balance sheet date.
The Group’s and Company’s deferred tax liabilities have been computed based on the corporate tax rate and tax
laws prevailing at the end of the reporting period.
ANNUAL REPORT 2014
89
NOTES TO THE FINANCIAL STATEMENTS (CONTINUED)
For the financial year ended 31 December 2014
20.
DEFERRED INCOME TAXATION (CONTINUED)
The Group
The movements in the deferred income tax assets and liabilities (prior to offsetting of balances within the same tax
jurisdiction) during the financial year are as follows:
Deferred income tax liabilities
2014
Beginning of financial year
Charged to equity:
- changes in fair value
Credited to profit or loss:
-others
Currency translation differences
End of financial year
2013
Beginning of financial year
Charged to equity:
- changes in fair value
Credited to profit or loss:
-others
Currency translation differences
End of financial year
Fair value
changes
on current
available-forsale financial
assets
$’000
Accelerated
tax
depreciation
$’000
Total
$’000
52,124
1,450
53,574
10,402
–
10,402
–
–
62,526
(134)
2
1,318
(134)
2
63,844
47,707
1,582
49,289
4,417
–
4,417
–
–
52,124
(133)
1
1,450
(133)
1
53,574
Deferred income tax assets
Provisions
$’000
90
Tax losses
$’000
Total
$’000
2014
Beginning of financial year
Charged to profit or loss
Currency translation differences
End of financial year
(368)
167
–
(201)
(121)
60
(1)
(62)
(489)
227
(1)
(263)
2013
Beginning of financial year
Charged to profit or loss
Currency translation differences
End of financial year
(402)
24
10
(368)
(200)
56
23
(121)
(602)
80
33
(489)
HAW PAR CORPORATION LIMITED
NOTES TO THE FINANCIAL STATEMENTS (CONTINUED)
For the financial year ended 31 December 2014
21.
SHARE CAPITAL
The Group and the Company
2014
Beginning of financial year
Issue of 298,000 ordinary shares by virtue of exercise of
share options (Note 25(c))
End of financial year
2013
Beginning of financial year
Issue of 609,000 ordinary shares by virtue of exercise of
share options (Note 25(c))
Issue of 19,871,519 bonus shares by virtue of one
bonus share for every ten existing ordinary shares
End of financial year
Number
of shares
’000
Amount
$’000
218,664
246,848
298
218,962
1,874
248,722
198,184
243,114
609
3,734
19,871
218,664
–
246,848
All issued ordinary shares are fully paid. There is no par value for these ordinary shares.
The holders of ordinary shares are entitled to receive dividends as and when declared by the Company. All ordinary
shares carry one vote per share without restriction.
Please refer to Note 25(b) for details of share options.
22.
RELATED PARTY TRANSACTIONS
In addition to other related party information disclosed elsewhere in the financial statements, the following
transactions have been carried out between the Group and its related parties at terms agreed between the parties
during the financial year:
(a)
Share options granted to key management
The aggregate number of share options granted and accepted by the key management of the Group during
the financial year is 246,000 (2013: 224,000). The share options have been granted on the same terms
and conditions as those offered to the other employees of the Company (Note 25(b)). The aggregate number
of share options granted to the key management of the Group outstanding as at the end of the financial year
is 502,000 (2013: 420,000).
ANNUAL REPORT 2014
91
NOTES TO THE FINANCIAL STATEMENTS (CONTINUED)
For the financial year ended 31 December 2014
22.
RELATED PARTY TRANSACTIONS (CONTINUED)
(b)
Key management’s remuneration
The key management’s remuneration includes fees, salary, bonus, commission and other emoluments (including
benefits-in-kind) computed based on the cost incurred by the Group and the Company, and where the Group or
Company do not incur any costs, the value of the benefit. The key management’s remuneration is as follows:
The Group
2014
2013
$’000
$’000
Directors’ fees, salaries and other short-term employee benefits
Employer’s contribution to Central Provident Fund and other
defined contribution plans
Share options granted
4,288
3,752
96
162
4,546
90
128
3,970
Total compensation to Directors of the Company included in the above amounted to $2,304,000 (2013:
$2,130,000).
(c)
Purchase of shares in an associated company
In the current financial year, an Executive Director and a key management personnel, who are nominee directors
in an associated company, were granted share options by the associated company. Upon exercising the share
options, the shares were sold by the nominee directors to the Group at cost of approximately $1,574,000.
23.
CONTINGENT LIABILITIES
Contingent liabilities relating to guarantees are:
The Company
2014
2013
$’000
$’000
In respect of guarantees given to banks in connection
with facilities granted to subsidiaries
68
68
24.COMMITMENTS
(a)
Capital commitments
The Group
2014
2013
$’000
$’000
Capital commitments authorised and contracted
but not provided for in the consolidated
financial statements
340
746
The Company
2014
2013
$’000
$’000
–
–
The capital commitments above relate to construction of/purchases of property, plant and equipment and
improvements to investment properties.
92
HAW PAR CORPORATION LIMITED
NOTES TO THE FINANCIAL STATEMENTS (CONTINUED)
For the financial year ended 31 December 2014
24.COMMITMENTS (CONTINUED)
(b)
Operating lease commitments
As a lessee
The Group leases certain offices, warehouses, and other premises under non-cancellable lease arrangements.
Certain premises are further sub-leased to third parties under non-cancellable sub-lease agreements.
The Group
2014
2013
$’000
$’000
Lease rental expense
Sub-lease rental income recognised in consolidated
income statement
958
(1,219)
1,113
(1,043)
Future minimum rentals payable under non-cancellable operating leases contracted for as of 31 December
but not recognised as liabilities are as follows:
The Group
2014
2013
$’000
$’000
Within one year
Between one year and five years
After five years
568
1,521
1,476
3,565
560
1,842
1,712
4,114
As a lessor
The Group owns certain investment properties, which are tenanted under non-cancellable lease arrangements.
Future minimum rentals receivable under non-cancellable operating leases contracted for as of 31 December
but not recognised as receivables are as follows:
The Group
2014
2013
$’000
$’000
Within one year
Between one year and five years
13,716
10,086
23,802
ANNUAL REPORT 2014
14,399
14,108
28,507
93
NOTES TO THE FINANCIAL STATEMENTS (CONTINUED)
For the financial year ended 31 December 2014
25.
EMPLOYEE BENEFITS
The Group
2014
2013
$’000
$’000
(a)
Staff costs (including Executive Directors):
- salaries, bonuses and other costs
- employer’s contribution to Central Provident Fund
and other defined contribution plans
- expensing of share options
21,469
19,743
1,636
305
23,410
1,564
241
21,548
Key management’s remuneration is disclosed in Note (22(b)).
(b)
The Company operates the Haw Par Corporation Group 2002 Share Option Scheme (“2002 Scheme”). The
2002 Scheme was approved by members of the Company on 22 May 2002 and further extended to 2017
on 20 April 2011.
The 2002 Scheme grants non-transferable options to selected employees and includes the participation by the
non-executive directors. The maximum life-span of exercising the options is 10 years (exercise period). The
options are exercisable beginning on the first anniversary from the date when the options are granted or the
second anniversary if the options are granted at a discount to the market price under the 2002 Scheme. The
options may be exercised in full or in part in respect of 1,000 shares or any multiple thereof, on the payment
of the exercise price. The Group has no legal or constructive obligation to repurchase or settle the options in
cash. The exercise price is equivalent to the average of the last dealt price for the share for five market days
immediately before the offer date (“market price”) at the time of grant and can be set at discounts of up to
20% to the market price under the 2002 Scheme.
During the financial year, options for 526,000 (2013: 438,000) shares were granted to qualifying employees
on 3 March 2014 (“2014 Options”) (2013: 4 March 2013 (“2013 Options”)). The fair value of the options
granted using the Trinomial valuation model is approximately $323,000 (2013: $264,000). The significant
inputs into the model are exercise price of $8.55 (2013: $7.27) at the grant date, standard deviation of
expected share price returns of 13% (2013: 14%), 5-year option life and annual risk-free interest rate of
0.3% (2013: 0.2%) per annum. The volatility measured at the standard deviation of expected share price
returns is based on statistical analysis of daily share prices over a historical period that matches the period
to expiry of the options. The 2014 Options are exercisable from 3 March 2015 and expire on 1 March 2019
(2013 Options exercisable from 4 March 2014 and expire on 3 March 2018).
(c)
Information with respect to share options granted under the 2002 Scheme is as follows:
Number of shares
2014
2013
Under 2002 Scheme:
Outstanding at beginning of the financial year
Granted
Cancelled/ Expired/ Not accepted
Exercised
Outstanding at end of the financial year
Exercisable at end of the financial year
94
HAW PAR CORPORATION LIMITED
789,000
526,000
(14,000)
(298,000)
1,003,000
986,000
438,000
(26,000)
(609,000)
789,000
491,000
365,000
NOTES TO THE FINANCIAL STATEMENTS (CONTINUED)
For the financial year ended 31 December 2014
25.
EMPLOYEE BENEFITS (CONTINUED)
(c)
Information with respect to share options granted under the 2002 Scheme is as follows: (continued)
Details of share options granted during the financial year:
Expiry date
Exercise price
Aggregate proceeds if shares are issued ($’000)
2014
2013
1.3.2019
$8.55
$4,497
3.3.2018
$7.27
$3,184
Movement in the number of unissued ordinary shares under option and their exercise prices are as follows:
Date of grant
Number of shares covered by the options
Balance at
beginning
of financial
Balance
year or date
Cancelled/
at end of
of grant Expired/ Not
financial
(if later)
accepted
Exercised
year
Exercise
price
Exercise period
2014
2.3.2009
30,000
–
(30,000)
–
$3.71
2.3.2010 – 1.3.2014
1.3.2010
44,000
–
(8,000)
36,000
$5.86
1.3.2011 – 28.2.2015
1.3.2011
150,000
–
(65,000)
85,000
$6.09
1.3.2012 – 29.2.2016
1.3.2012
141,000
–
(74,000)
67,000
$5.95
1.3.2013 – 28.2.2017
4.3.2013
424,000
–
(121,000)
303,000
$7.27
4.3.2014 – 3.3.2018
3.3.2014
526,000
1,315,000
(14,000)
(14,000)
–
512,000
(298,000) 1,003,000
$8.55
3.3.2015 – 1.3.2019
3.3.2008
198,000
(12,000)
(186,000)
–
$6.47
3.3.2009 – 2.3.2013
2.3.2009
30,000
–
30,000
$3.71
2.3.2010 – 1.3.2014
1.3.2010
104,000
–
(60,000)
44,000
$5.86
1.3.2011 – 28.2.2015
1.3.2011
289,000
–
(139,000)
150,000
$6.09
1.3.2012 – 29.2.2016
1.3.2012
365,000
–
(224,000)
141,000
$5.95
1.3.2013 – 28.2.2017
4.3.2013
438,000
1,424,000
–
(609,000)
424,000
789,000
$7.27
4.3.2014 – 3.3.2018
2013
(14,000)
(26,000)
–
ANNUAL REPORT 2014
95
NOTES TO THE FINANCIAL STATEMENTS (CONTINUED)
For the financial year ended 31 December 2014
26.
FINANCIAL RISK MANAGEMENT
Financial risk factors
The Group’s activities expose it to market risk (including currency risk, price risk and interest rate risk), liquidity
risk and credit risk. The Group’s overall risk management strategy seeks to minimise adverse effects from the
unpredictability of financial markets on the Group’s financial performance.
The Board of Directors is responsible for setting the objectives and underlying principles of financial risk management
for the Group. The Investment Committee then establishes the detailed policies, such as authority levels, oversight
responsibilities, risk identification and measurement, exposure limits and hedging strategies, in accordance with
the objectives and underlying principles approved by the Board of Directors.
Regular reports that contain the Group’s exposure to each type of financial risks are submitted to Investment Committee.
(a)
Market risk
The Group is exposed to market risk, including primarily changes in currency exchange rates and market
prices of securities.
(1) Foreign currency risk
The Group operates in Asia and through distributors in other parts of the world, with its principal
operations in Singapore. Entities in the Group regularly transact in currencies other than their respective
functional currencies (“foreign currencies”). Currency risk arises when transactions are denominated
in foreign currencies such as United States Dollar (“USD”), Hong Kong Dollar (“HKD”), Euro and
Japanese Yen (“JPY”) (2013: USD, HKD and Euro).
In addition, the Group is also exposed to currency translation risks arising from its foreign currency
denominated net financial assets, which are not significant.
The Group manages its foreign currency exposures by a policy of matching, as far as possible, receipts
and payments in each individual currency. The surplus of convertible currencies are either further
matched with future foreign currency requirements or exchanged for Singapore Dollar.
The Group also has available forward contract facilities to hedge future foreign exchange exposure.
The foreign currency exposure of the Group’s net investment in overseas subsidiaries is managed under
the guidance of the Investment Committee.
96
HAW PAR CORPORATION LIMITED
NOTES TO THE FINANCIAL STATEMENTS (CONTINUED)
For the financial year ended 31 December 2014
26.
FINANCIAL RISK MANAGEMENT (CONTINUED)
(a)
Market risk (continued)
(1) Foreign currency risk (continued)
The Group’s currency exposure of financial assets/liabilities net of those denominated in the respective
entities’ functional currency based on the information provided to key management is as follows:
USD
$’000
HKD
$’000
Euro
$’000
JPY
$’000
Others
$’000
Total
$’000
Group
At 31 December 2014
Cash and cash equivalents and
available-for-sale financial assets 24,049
Trade and other receivables
9,077
Trade and other payables
(3,292)
Borrowings
(14,662)
Add: Firm Commitments
8,601
Currency exposure on financial assets
and liabilities
23,773
113
–
(2,984)
–
–
1,008 48,246
1,420
–
(2,846)
(272)
– (41,670)
2,207
(394)
16,547 89,963
533 11,030
(800) (10,194)
– (56,332)
(10) 10,404
(2,871)
1,789
5,910
16,270
44,871
USD
$’000
HKD
$’000
Euro
$’000
Others
$’000
Total
$’000
29,283
5,956
(2,415)
(23,784)
2,612
6,026
4,964
(3,017)
–
–
245
1,230
(2,859)
–
1,738
11,652
7,973
At 31 December 2013
Cash and cash equivalents and
available-for-sale financial assets
Trade and other receivables
Trade and other payables
Borrowings
Add: Firm Commitments
Currency exposure on financial
assets and liabilities
354
1,377 36,931
170 12,320
(678) (8,969)
– (23,784)
(109)
4,241
760
20,739
The Company does not have material foreign currency exposure as at 31 December 2014 and 2013
except for certain amounts due to a subsidiary of $8,085,000 (2013: $8,098,000) and fixed deposits
of $nil (2013: $5,994,000) denominated in Hong Kong Dollar, and borrowings of $56,332,000 (2013:
$23,784,000) denominated in United States Dollar and Japanese Yen (2013: United States Dollar only).
ANNUAL REPORT 2014
97
NOTES TO THE FINANCIAL STATEMENTS (CONTINUED)
For the financial year ended 31 December 2014
26.
FINANCIAL RISK MANAGEMENT (CONTINUED)
(a)
Market risk (continued)
(1) Foreign currency risk (continued)
A 10% (2013: 10%) weakening of Singapore Dollar against the following currencies at reporting date
would increase/(decrease) profit or loss by the amounts shown below, with all other variables including
tax rate being held constant:
USD
$’000
HKD
$’000
Euro
$’000
JPY
$’000
Others
$’000
Total
$’000
1,463
–
1,726
1,503
Group
At 31 December 2014
Profit or loss, after tax
Other comprehensive income
552
845
(233)
–
(34)
–
(22)
658
USD
$’000
HKD
$’000
Euro
$’000
Others
$’000
Total
$’000
369
456
850
–
(114)
–
93
–
1,198
456
At 31 December 2013
Profit or loss, after tax
Other comprehensive income
A 10% (2013: 10%) strengthening of Singapore Dollar against the above currencies would have had
the equal but opposite effect on the above currencies to the amounts shown above, on the basis that
all other variables remain constant.
(2)
Market price risk
The Group has substantial investments carried at fair value of $2,311.5 million (2013: $1,934.7
million) held in various forms of securities as of 31 December 2014 and have been accounted for in
accordance with the accounting policy stated in Note 2(i). These securities are mainly listed in Singapore.
The fair value of financial instruments traded in active markets (such as available-for-sale securities)
is based on quoted market prices at the end of the reporting period. The quoted market price used for
financial assets held by the Group is the current bid price. These instruments are categorised as Level
1 under the fair value hierarchy as set out in the relevant accounting standard.
98
HAW PAR CORPORATION LIMITED
NOTES TO THE FINANCIAL STATEMENTS (CONTINUED)
For the financial year ended 31 December 2014
26.
FINANCIAL RISK MANAGEMENT (CONTINUED)
(a)
Market risk (continued)
(2)
Market price risk (continued)
The market price risk associated with these investments is the potential loss in fair value resulting from
the decrease in market prices of securities. If prices for equity and debt securities listed in Singapore
and elsewhere change by 10% (2013: 10%) with all other variables including tax rate being held
constant, the equity and other comprehensive income will be affected by:
Group
2014
$’000
Listed in Singapore
- increased by
- decreased by
Listed overseas
- increased by
- decreased by
2013
$’000
216,104
(216,104)
183,938
(183,938)
7,136
(7,136)
2,835
(2,835)
The above excludes investments in associated companies that could be traded in an active market but
are accounted for in accordance with the accounting policies stated in Note 2(c).
The Group’s investments are managed under the guidance of the Investment Committee.
(3)
Interest rate risk
The Group has insignificant financial assets or liabilities that are exposed to interest rate risks except for
bank borrowings. The Company periodically reviews its liabilities and monitors interest rate fluctuations
to ensure that the exposure to interest rate risk is within acceptable levels.
The Group does not expect to incur material losses or gains due to changes in interest rate of the
bank borrowings.
(b) Liquidity risk
As at 31 December 2014, the Group has available cash and short term bank deposits totalling $223.1 million
(2013: $208.6 million). The cash and deposits, together with the available unutilised credit facilities are
expected to be sufficient to meet the funding requirements of the Group’s operations.
The Group does not have any material financial liabilities maturing more than 12 months from 31 December
2014.
ANNUAL REPORT 2014
99
NOTES TO THE FINANCIAL STATEMENTS (CONTINUED)
For the financial year ended 31 December 2014
26.
FINANCIAL RISK MANAGEMENT (CONTINUED)
(c) Credit risk
Credit risk refers to the risk that a counterparty will default on its contractual obligations resulting in financial
loss to the Group.
The maximum exposure of the Group and the Company to credit risk in the event that the counterparties fail
to perform their obligations as of 31 December 2013 in relation to each class of recognised financial assets
is the carrying amount of those assets as indicated in the statements of financial position with the exception
that the Company has the following additional exposure to credit risk:
The Company
2014
2013
$’000
$’000
Corporate guarantees provided to banks on subsidiaries’ obligations
68
68
The Group’s and Company’s major classes of financial assets that are subject to credit risk are short-term
bank deposits and trade receivables.
It is the Group’s policy to transact with creditworthy counterparties. In addition, the granting of material
credit limits to counterparties is reviewed and approved by senior management. The Group does not expect
to incur material credit losses on its financial assets or other financial instruments.
(i)
Financial assets that are neither past due nor impaired
Short-term bank deposits that are neither past due nor impaired are mainly deposits with banks with
high credit-ratings assigned by international credit rating agencies. Trade receivables that are neither
past due nor impaired are substantially companies with a good collection track record with the Group.
(ii)
Financial assets that are past due and/or impaired
There is no other class of financial assets that is past due and/or impaired except for trade receivables.
The age analysis of trade receivables past due but not impaired is as follows:
The Group
2014
2013
$’000
$’000
Past due within 1 month
Past due 1 to 3 months
1,688
6
1,694
320
8
328
There is $8,000 (2013: $23,000) trade and other receivables that are individually determined to be
impaired and the movement of the related allowance for impairment are as follows:
2014
$’000
Beginning of financial year
Allowance made during the year
Allowance utilised
End of financial year
10 0
HAW PAR CORPORATION LIMITED
23
1
(16)
8
2013
$’000
345
39
(361)
23
NOTES TO THE FINANCIAL STATEMENTS (CONTINUED)
For the financial year ended 31 December 2014
26.
FINANCIAL RISK MANAGEMENT (CONTINUED)
(d) Capital risk
In managing capital, the Group’s objectives are to safeguard its ability to continue as a going concern and to
maintain an optimal capital structure so as to maximise shareholder value. In order to maintain or achieve an
optimal capital structure, the Group may adjust the amount of dividend payment, return capital to members,
buy back issued shares or obtain new borrowings.
Management monitors capital based on ability of the Group to generate sustainable profits and availability of
retained profits for dividend payments to members. The Group’s overall strategy remains unchanged from 2013.
The Group and the Company are in compliance with all externally imposed capital requirements for the
financial years ended 31 December 2013 and 2014.
(e) Financial instruments by category
The financial instruments of the Group and of the Company include the following:
Note
The Group
2014
2013
$’000
$’000
The Company
2014
2013
$’000
$’000
Financial Assets
Available-for-sale financial assets
Trade and other receivables
Cash and bank balances
13
16
17
2,311,492
19,911
224,666
2,556,069
1,934,728
22,671
210,267
2,167,666
330
121,464
194,270
316,064
357
85,064
185,581
271,002
Financial Liabilities
Trade and other payables
Borrowings
18
19
39,066
56,332
95,398
36,996
23,784
60,780
72,286
56,332
128,618
115,564
23,784
139,348
ANNUAL REPORT 2014
101
NOTES TO THE FINANCIAL STATEMENTS (CONTINUED)
For the financial year ended 31 December 2014
27.
SEGMENTAL REPORTING
At 31 December 2014, the Group is organised into the following main business segments:
•
•
•
•
Manufacturing, marketing and trading of healthcare products;
Provision of leisure-related goods and services;
Property rental; and
Investments in securities.
Healthcare division principally manufactures and distributes topical analgesic products under the “Tiger Balm”
and “Kwan Loong” brand.
Leisure division provides family and tourist oriented leisure alternatives mainly in the form of oceanariums.
Property division owns and leases out several investment properties in the Asia region.
Investment division engages in investing activities, mainly in quoted and unquoted securities in Asia region.
Inter-segment transactions are determined on an arm’s length basis. Unallocated costs represent corporate expenses.
Segment assets consist primarily of available-for-sale financial assets, investment properties, property, plant and
equipment, intangible assets, inventories, receivables, and cash and bank balances. Segment liabilities comprise
operating liabilities and exclude tax liabilities. Capital expenditure on non-current assets comprises additions to
investment properties, property, plant and equipment, intangible assets and investment in associated companies.
The Group evaluates performance on the basis of profit or loss from operations before tax expenses and management
fees charged internally and exclude non-recurring gains and losses.
The Group accounts for inter-segment sales and transfers as if the sales or transfers were to third parties, ie. at
current market prices.
The Group’s reportable segments are strategic and distinct business units reporting to key group management.
They are managed separately because each business targets different customers and carry different business risk.
10 2
HAW PAR CORPORATION LIMITED
NOTES TO THE FINANCIAL STATEMENTS (CONTINUED)
For the financial year ended 31 December 2014
27.
SEGMENTAL REPORTING (CONTINUED)
(a)
Reportable segments
Healthcare
products
$’000
Leisure
products
and
services
$’000
Property
rental Investments Eliminations Consolidated
$’000
$’000
$’000
$’000
122,231
9
–
444
–
122,684
15,604
–
–
389
–
15,993
16,387
702
–
886
–
17,975
–
–
1,434
66,267
39,437
107,138
2,170
3,183
4
58
33,885
2,513
12,377
106,710
2014
Sales to external customers
Inter-segment sales
Interest income
Other income
Inter-segment other income
Total revenue and other income
Depreciation
Segment profit
–
(711)
–
–
(39,437)
(40,148)
154,222
–
1,434
67,986
–
223,642
–
5,415
(39,437)
116,048
Finance expense
Unallocated expenses
Profit from operations
Share of results of associated
companies and gain on
dilution of investment in
associated company (net)
Fair value gain on investment
properties
Taxation
(423)
(3,649)
111,976
–
–
–
11,917
–
11,917
–
–
3,075
–
–
3,075
(8,143)
Earnings for the financial year
Segment assets
Deferred income tax assets
Total assets per statement of
financial position
Expenditures for segment noncurrent assets
- Additions to property, plant
and equipment
- Investment properties
improvements
Segment liabilities
Current income tax liabilities
Deferred income tax liabilities
Total liabilities per statement
of financial position
118,825
69,150
21,122
227,417 2,964,844
(308,502) 2,974,031
263
2,974,294
2,114
293
6
117
–
2,530
–
2,114
–
293
339
345
–
117
–
–
339
2,869
27,604
3,143
5,564
61,762
(2,675)
95,398
7,587
63,844
166,829
ANNUAL REPORT 2014
103
NOTES TO THE FINANCIAL STATEMENTS (CONTINUED)
For the financial year ended 31 December 2014
27.
SEGMENTAL REPORTING (CONTINUED)
(a)
Reportable segments (continued)
Healthcare
products
$’000
Leisure
products
and
services
$’000
Property
rental Investments Eliminations Consolidated
$’000
$’000
$’000
$’000
103,488
11
–
398
–
103,897
20,491
–
–
367
–
20,858
17,197
640
–
885
–
18,722
–
–
868
56,924
30,370
88,162
1,987
3,369
4
18
25,871
3,776
13,395
87,639
2013
Sales to external customers
Inter-segment sales
Interest income
Other income
Inter-segment other income
Total revenue and other income
Depreciation
Segment profit
–
(651)
–
–
(30,370)
(31,021)
–
(30,370)
Finance expense
Unallocated expenses
Profit from operations
Share of results of associated
companies and gain on
dilution of investment in
associated company (net)
Fair value gain on investment
properties
Taxation
Expenditures for segment
non-current assets
- Additions to property, plant
and equipment
- Investment properties
improvements
Segment liabilities
Current income tax liabilities
Deferred income tax liabilities
Total liabilities per statement
of financial position
10 4
HAW PAR CORPORATION LIMITED
5,378
100,311
(267)
(3,470)
96,574
–
–
–
8,039
–
8,039
–
–
10,664
–
–
10,664
(7,358)
Earnings for the financial year
Segment assets
Deferred income tax assets
Total assets per statement of
financial position
141,176
–
868
58,574
–
200,618
107,919
62,303
22,944
223,620 2,580,372
(323,752) 2,565,487
489
2,565,976
1,930
570
5
71
–
2,576
–
1,930
–
570
978
983
–
71
–
–
978
3,554
25,522
3,451
5,284
28,887
(2,364)
60,780
6,901
53,574
121,255
NOTES TO THE FINANCIAL STATEMENTS (CONTINUED)
For the financial year ended 31 December 2014
27.
SEGMENTAL REPORTING (CONTINUED)
(b)
Geographical Information
Revenues(i)
$’000
Non-current
assets(ii)
$’000
2014
Singapore
Other Asian countries
Other countries
Total
38,510
71,750
43,962
154,222
206,243
200,999
–
407,242
2013
Singapore
Other Asian countries
Other countries
Total
42,444
61,199
37,533
141,176
204,736
183,374
–
388,110
(i)
(ii)
Revenues are attributable to countries in which the customer is located.
Non-current assets, which include property, plant and equipment, investment properties, investment in associated
companies and intangible assets, are shown by the geographical area where the assets are located.
There was no individual country from “Other Asian countries” and “Other countries” which individually
contributed more than 20% of the Group’s revenue or non-current assets, except for Other Asian countries
non-current assets which includes investment in associated company located in Hong Kong of a carrying
amount of $134,208,000 as disclosed in Note 12.
Revenue or non-current asset contribution from one single country is disclosed separately if it exceeded 20%
of the Group’s revenue or non-current assets, respectively.
(c) Major customers
Revenues of approximately $66,005,000 (2013: $53,191,000) were contributed from three groups of
external customers (2013: three groups). These revenues are attributable to the sale of Healthcare products
in Singapore and other Asian countries.
ANNUAL REPORT 2014
105
NOTES TO THE FINANCIAL STATEMENTS (CONTINUED)
For the financial year ended 31 December 2014
28.
SIGNIFICANT COMPANIES IN THE GROUP
Name of Company
Country of
incorporation
Principal activities
Effective equity
interest held
by Group
2014
2013
%
%
Subsidiaries
Healthcare products
Singapore
Manufacturing, marketing and
distributing healthcare products
under licence
100.0
100.0
* Tiger Balm (Malaysia) Sdn. Bhd. +
Malaysia
Manufacturing, marketing and
distributing pharmaceutical
products
100.0
100.0
* Xiamen Tiger Medicals Co., Ltd. ++
The People’s
Republic of China
Manufacturing, marketing and
distributing pharmaceutical
products
100.0
100.0
Haw Par Healthcare Limited
Leisure products and services
Haw Par Leisure Pte Ltd
Singapore
Investment holding
100.0
100.0
* Underwater World Singapore
Pte Ltd
Singapore
Owning and operating
oceanariums
100.0
100.0
* Underwater World Pattaya Ltd +
Thailand
Owning and operating
oceanariums
100.0
100.0
Haw Par Properties (Singapore)
Private Limited
Singapore
Property development and
owning and letting properties
100.0
100.0
Haw Par Centre Private Ltd
Singapore
Property development and
owning and letting properties
100.0
100.0
Setron Limited
Singapore
Property development and
owning and letting properties
100.0
100.0
* Sovereign Sports Limited ++
Hong Kong
Owning and leasing of
properties
100.0
100.0
Haw Par Land (Malaysia)
Sdn. Bhd. +
Malaysia
Investment in properties and
letting out of office space
100.0
100.0
Property
10 6
HAW PAR CORPORATION LIMITED
NOTES TO THE FINANCIAL STATEMENTS (CONTINUED)
For the financial year ended 31 December 2014
28.
SIGNIFICANT COMPANIES IN THE GROUP (CONTINUED)
Country of
incorporation
Principal activities
Effective equity
interest held
by Group
2014
2013
%
%
Haw Par Capital Pte Ltd
Singapore
Investment holding
100.0
100.0
Haw Par Equities Pte Ltd
Singapore
Investment holding
100.0
100.0
Haw Par Investment Holdings Private
Limited
Singapore
Investment holding
100.0
100.0
Haw Par Pharmaceutical Holdings Pte. Ltd.
Singapore
Investment holding
100.0
100.0
Haw Par Securities (Private) Limited
Singapore
Investment holding
100.0
100.0
Haw Par Trading Pte Ltd
Singapore
Investment holding
100.0
100.0
M & G Maritime Services Pte. Ltd.
Singapore
Investment holding
100.0
100.0
Pickwick Securities Private Limited
Singapore
Investment holding
100.0
100.0
Straits Maritime Leasing Private Limited
Singapore
Investment holding
100.0
100.0
Hong Kong
Investment holding and
licensing of “Kwan Loong”
trademark
100.0
100.0
Singapore
Provision of management
support services
100.0
100.0
Singapore
Investment holding
40.0
40.0
Cayman
Islands
Investment holding
14.4
15.2
Name of Company
Investments
* Haw Par Brothers International (H.K.)
Limited ++
Haw Par Management Services Pte. Ltd.
Associated companies
UIC Technologies Pte Ltd
* Hua Han Bio-Pharmaceutical Holdings
Limited #
ANNUAL REPORT 2014
107
NOTES TO THE FINANCIAL STATEMENTS (CONTINUED)
For the financial year ended 31 December 2014
28.
SIGNIFICANT COMPANIES IN THE GROUP (CONTINUED)
Notes
29.
(i)
Companies indicated with a (*) are indirectly held by Haw Par Corporation Limited.
(ii)
Companies indicated with a (+) are audited by PricewaterhouseCoopers member firms outside Singapore.
(iii)
Companies indicated with a (++) are audited by other firms. These foreign-incorporated companies are not
considered as significant foreign-incorporated subsidiaries under the Singapore Exchange Securities Trading
Limited - Listing Rules. Accordingly, Rule 716 of the Listing Manual has been complied with.
(iv)
The company indicated with a (#) is listed on an overseas stock exchange and audited by other firm of auditors.
The Group has determined that it has significant influence even though its shareholding is below 20 per cent
because of its representations on the board of the company, to participate and influence any major decisions
relating to the relevant activities of the company.
(v)
All the above subsidiaries and associated companies operate in their respective countries of incorporation
except Hua Han Bio-Pharmaceutical Holdings Limited which operates mainly in the People’s Republic of
China.
NEW ACCOUNTING STANDARDS AND FRS INTERPRETATIONS AND AMENDMENTS
Below are the mandatory standards and interpretations to existing standards that have been published, and are
relevant for the Group’s accounting periods beginning on or after 1 January 2015 or later periods and which the
Group has not early adopted:
•
FRS 102 Share-based Payment (effective for annual periods beginning on or after 1 July 2014)
The amendment clarifies the definition of vesting condition and separately defines ’performance condition’
and ’service condition’. The Group will apply this amendment from 1 January 2015, but this is not expected
to have any significant impact on the financial statements of the Group.
•
FRS 103 Business Combinations (effective for annual periods beginning on or after 1 July 2014)
The standard is amended to clarify that an obligation to pay contingent consideration which meets the definition
of a financial instrument is classified as a financial liability or as equity, on the basis of the definitions in
FRS 32 Financial instruments: Presentation. The standard is further amended to clarify that all non-equity
contingent consideration, both financial and non-financial, is measured at fair value at each reporting date,
with changes in fair value recognised in profit and loss.
The standard is also amended to clarify that FRS 103 does not apply to the accounting for the formation of
any joint arrangement under FRS 111. The amendment also clarifies that the scope exemption only applies
in the financial statements of the joint arrangement itself.
The Group will apply this amendment for business combinations taking place on/after 1 January 2015.
10 8
HAW PAR CORPORATION LIMITED
NOTES TO THE FINANCIAL STATEMENTS (CONTINUED)
For the financial year ended 31 December 2014
29.
NEW ACCOUNTING STANDARDS AND FRS INTERPRETATIONS AND AMENDMENTS (CONTINUED)
•
FRS 40 Investment Property (effective for annual periods beginning on or after 1 July 2014)
The standard is amended to clarify that FRS 40 and FRS 103 are not mutually exclusive. The guidance in
FRS 40 assists preparers to distinguish between investment property and owner-occupied property. Preparers
also need to refer to the guidance in FRS 103 to determine whether the acquisition of an investment property
is a business combination.
The Group will apply this amendment for acquisition of investment property taking place on/after 1 January
2015.
•
FRS 108 Operating Segments (effective for annual periods beginning on or after 1 July 2014)
The standard is amended to require disclosure of the judgements made by management in aggregating
operating segments. This includes a description of the segments which have been aggregated and the
economic indicators which have been assessed in determining that the aggregated segments share similar
economic characteristics.
The standard is further amended to require a reconciliation of segment assets to the entity’s assets when
segment assets are reported.
This amendment will not result in any changes to the Group’s accounting policies but will require more
disclosures in the financial statements.
30.
AUTHORISATION OF FINANCIAL STATEMENTS
These financial statements are authorised for issue in accordance with a resolution of the Board of Directors of Haw
Par Corporation Limited on 27 February 2015.
ANNUAL REPORT 2014
109
GROUP OFFICES
CORPORATE OFFICE
LEISURE
PROPERTY & INVESTMENTS
HAW PAR CORPORATION LIMITED
HAW PAR LEISURE PTE LTD
401 Commonwealth Drive
#03-03 Haw Par Technocentre
Singapore 149598
Tel
: 6337 9102
Fax
: 6336 9232
Website: www.hawpar.com
401 Commonwealth Drive
#03-03 Haw Par Technocentre
Singapore 149598
HAW PAR PROPERTIES
(SINGAPORE) PRIVATE LIMITED
401 Commonwealth Drive
#03-03 Haw Par Technocentre
Singapore 149598
Tel : 6337 9102
Fax : 6336 9232
HEALTHCARE
HAW PAR HEALTHCARE LIMITED
401 Commonwealth Drive
#03-03 Haw Par Technocentre
Singapore 149598
Tel
: 6337 9102
Fax
: 6262 3436
Website: www.tigerbalm.com
TIGER BALM (MALAYSIA) SDN. BHD.
PLO 95 No.6
Jalan Firma 1/1
Tebrau Industrial Estate
81100 Johor Bahru
Malaysia
XIAMEN TIGER MEDICALS CO., LTD
289 Yang Guang West Road
Hai Cang District
Xiamen City, Zipcode 361027
The People’s Republic of China
11 0
HAW PAR CORPORATION LIMITED
UNDERWATER WORLD SINGAPORE PTE
LTD
80 Siloso Road, Sentosa
Singapore 098969
Tel : 6275 0030
Fax : 6275 0036
Email : [email protected]
Website: www.underwaterworld.com.sg
UNDERWATER WORLD PATTAYA LTD
22/22 Moo 11,
Sukhumvit Road,
Nongprue, Banglamung,
Chonburi 20260
Thailand
Tel : 66 3875 6879
Fax : 66 3875 6977
Website:
www.underwaterworldpattaya.com
HAW PAR LAND (MALAYSIA)
SDN. BHD.
9th Floor, Menara Haw Par
Jalan Sultan Ismail
50250, Kuala Lumpur
Malaysia
Tel : 03 2070 1855
Fax : 03 2070 6078
HAW PAR SECURITIES (PRIVATE)
LIMITED
401 Commonwealth Drive
#03-03 Haw Par Technocentre
Singapore 149598
MAJOR PRODUCTS & SERVICES
As at 31 December 2014
HEALTHCARE PRODUCTS
PROPERTIES
TIGER BRAND PRODUCTS
HAW PAR CENTRE
Tiger
Tiger
Tiger
Tiger
Tiger
Tiger
Tiger
Tiger
Tiger
Tiger
Tiger
Tiger
Tiger
Tiger
Tiger
Tiger
Tiger
Tiger
Tiger
180 Clemenceau Avenue
Singapore 239922
• Six-storey commercial building
• Leasehold
Remaining Lease: 37 years
Balm Ointment,
Balm Soft,
Balm Plaster,
Indomethacin Plaster,
Balm Muscle Rub,
Balm Liniment,
Balm Oil,
Balm Mosquito Repellent Spray,
Balm Mosquito Repellent Patch,
Balm Mosquito Repellent Lotion,
Balm Arthritis Rub,
Balm Joint Rub,
Balm Neck & Shoulder Rub,
Balm Neck & Shoulder Rub Boost,
Balm Back Pain Patch,
Balm Ultra Thin Patch,
Balm® ACTIVE Muscle Gel,
Balm® ACTIVE Muscle Rub,
Balm® ACTIVE Muscle Spray
HAW PAR GLASS TOWER
178 Clemenceau Avenue
Singapore 239926
• Eight-storey commercial building
• Leasehold
Remaining Lease: 55 years
HAW PAR TECHNOCENTRE
401 Commonwealth Drive
Singapore 149598
• Seven-storey industrial building
• Leasehold
Remaining Lease: 48 years
KWAN LOONG BRAND PRODUCTS
MENARA HAW PAR
Kwan Loong Medicated Oil,
Kwan Loong Refresher
LEISURE FACILITIES
Lot 242, Jalan Sultan Ismail
50250 Kuala Lumpur,
Malaysia
• Thirty-two storey commercial building
• Freehold
OCEANARIUMS
WESTLANDS CENTRE
UNDERWATER WORLD SINGAPORE*
80 Siloso Road, Sentosa
Singapore 098969
• Aquarium building
• Leasehold
Remaining Lease: 3 years
Unit 1405-1407
Westlands Centre
20 Westlands Road
Quarry Bay, Hong Kong
• Office & industrial units
• 999-year lease
UNDERWATER WORLD PATTAYA*
HAW PAR TIGER BALM BUILDING*
22/22 Moo 11,
Sukhumvit Road,
Nongprue, Banglamung,
Chonburi 20260 Thailand
• Aquarium building
• Leasehold
Remaining Lease: 7 years
with an option to renew: 10 years
2 Chia Ping Road
Singapore 619968
• Nine-storey industrial building
• Leasehold
Remaining Lease: 15 years
XIAMEN TIGER MEDICALS CO. LTD*
No. 289 Yang Guang West Road
Hai Cang District
Xiamen City 361027
The People’s Republic of China
• Three-storey industrial building
• Leasehold
Remaining Lease: 44 years
*Properties used by operations are included in Property, Plant and Equipment
ANNUAL REPORT 2014
111
STATISTICS OF SHAREHOLDINGS
As at 9 March 2015
DISTRIBUTION OF SHAREHOLDINGS
SIZE OF SHAREHOLDINGS
NO. OF
SHAREHOLDERS
%
NO. OF SHARES
%
1 - 99
100 - 1,000
1,001 - 10,000
10,001 - 1,000,000
1,000,001 AND ABOVE
TOTAL
10,153
4,985
4,138
711
13
20,000
50.77
24.92
20.69
3.55
0.07
100.00
316,314
1,716,769
12,326,295
28,476,398
176,170,397
219,006,173
0.15
0.78
5.63
13.00
80.44
100.00
TWENTY LARGEST SHAREHOLDERS
NO.
NAME
NO. OF SHARES
%
1
2
3
4
5
6
7
8
9
10
11
12
13
14
15
16
17
18
19
20
WEE INVESTMENTS PTE LTD CITIBANK NOMINEES SINGAPORE PTE LTD DBS NOMINEES (PRIVATE) LIMITED TYE HUA NOMINEES (PTE) LTD
UOB KAY HIAN PRIVATE LIMITED UNITED OVERSEAS INSURANCE LIMITED - SHF WAH HIN & CO PTE LTD
UNITED OVERSEAS BANK NOMINEES (PRIVATE) LIMITED
HSBC (SINGAPORE) NOMINEES PTE LTD
DBSN SERVICES PTE. LTD. C Y WEE & CO PTE LTD
SG INVESTMENTS PTE LTD WEE CHO YAW
RAFFLES NOMINEES (PTE) LIMITED SINGAPORE REINSURANCE CORPORATION LTD - SHAREHOLDERS LEE BOON LEONG
HO HAN LEONG CALVIN
TAN PROPRIETARY (PTE) LTD
DB NOMINEES (SINGAPORE) PTE LTD CHUA WEE KENG TOTAL
58,991,496
46,446,865
18,299,157
17,435,534
15,235,109
4,274,600
3,652,655
2,848,360
2,798,025
1,835,350
1,643,148
1,617,000
1,092,373
814,399
776,800
670,215
550,440
473,000
456,326
440,140
180,350,992
26.94
21.21
8.36
7.96
6.96
1.95
1.67
1.30
1.28
0.84
0.75
0.74
0.50
0.37
0.35
0.31
0.25
0.22
0.21
0.20
82.37
FREE FLOAT
Based on the information available to the Company as at 9 March 2015, approximately 40% of the issued ordinary shares
of the Company is held by the public and therefore, the Company has complied with Rule 723 of the SGX-ST Listing
Manual which requires at least 10% of equity securities (excluding preference shares and convertible equity securities)
in a class that is listed at all times held by the public.
11 2
HAW PAR CORPORATION LIMITED
STATISTICS OF SHAREHOLDINGS (CONTINUED)
As at 9 March 2015
SUBSTANTIAL SHAREHOLDERS AS AT 9 MARCH 2015
NO. OF SHARES HELD
DIRECT
DEEMED
Wee Cho Yaw
Wee Ee Cheong
Wee Ee Lim
Wee Ee-chao
Wee Investments Private Limited
Supreme Island Corporation
First Eagle Investment Management, LLC
United Overseas Bank Limited
1,092,373
128,857
437,192
13,826
58,991,496
12,085,601
–
–
75,688,900
72,761,881
71,084,787
71,217,705
–
–
30,661,129
21,708,537
TOTAL
76,781,273
72,890,738
71,521,979
71,231,531
58,991,496
12,085,601
30,661,129
21,708,537
%
35.06 (1), (2), (3)
33.28 (1), (2), (4)
32.66 (1)
32.52 (1), (5)
26.93
5.52
14.00 (7)
9.91 (8)
(1)
Messrs Wee Cho Yaw, Wee Ee Cheong, Wee Ee Lim and Wee Ee-chao are deemed to be interested in the shares held by Wee Investments
Private Limited, Supreme Island Corporation and Kheng Leong Co Pte Ltd.
(2)
Messrs Wee Cho Yaw and Wee Ee Cheong are deemed to have an interest in the shares held by C.Y. Wee & Co Pte Ltd.
(3)
Dr Wee Cho Yaw is deemed to have an interest in the shares held by UOL Group Limited.
(4)
Mr Wee Ee Cheong is deemed to have an interest in the shares held by E.C. Wee Pte Ltd.
(5)
Mr Wee Ee-chao is deemed to have an interest in the shares held by Protheus Investment Holdings Pte Ltd.
(6)
Kheng Leong Co Pte Ltd, C.Y. Wee & Co Pte Ltd, UOL Group Limited, E.C. Wee Pte Ltd and Protheus Investment Holdings Pte Ltd are not
substantial shareholders of the Company.
(7)
First Eagle Investment Management, LLC is an U.S. investment adviser, holding the shares on behalf of its clients. One of its mutual funds,
First Eagle Overseas Fund holds 25,512,113 shares amounting to a shareholding of 11.64%.
(8)
United Overseas Bank Limited is deemed to have an interest in 17,433,937 shares held by Tye Hua Nominees (Pte) Limited and 4,274,600
shares held by United Overseas Insurance Limited - SHF.
ANNUAL REPORT 2014
113
NOTICE OF ANNUAL GENERAL MEETING
NOTICE IS HEREBY GIVEN that the Forty-Sixth Annual General Meeting of the Company will be held at Parkroyal on Pickering,
William Pickering Ballroom, Level 2, 3 Upper Pickering Street, Singapore 058289 on Tuesday, 28 April 2015 at 3.00 p.m.
to transact the following business:
AS ORDINARY BUSINESS
Resolution 1
To receive and adopt the Directors’ Report and Audited Financial Statements for the financial year ended
31 December 2014 together with the Auditor’s Report thereon.
Resolution 2
To declare a Second & Final Tax-Exempt Dividend of 14 cents per share for the financial year ended 31
December 2014.
To re-appoint the following Directors, who are retiring pursuant to Section 153(6) of the Companies Act, Cap. 50, to hold
office until the next Annual General Meeting of the Company:
Resolution 3
Dr Wee Cho Yaw
Dr Wee Cho Yaw will, upon re-appointment, continue as Chairman of the Board and Investment Committee
and a member of the Nominating Committee and Remuneration Committee of the Company.
Resolution 4
Dr Lee Suan Yew
Dr Lee Suan Yew will, upon re-appointment, continue as a member of the Nominating Committee of the
Company. Dr Lee is considered as an independent Director.
Resolution 5
Mr Hwang Soo Jin
Mr Hwang Soo Jin will, upon re-appointment, continue as a member of the Audit Committee and Remuneration
Committee of the Company. Mr Hwang is considered as an independent Director.
Resolution 6
Mr Sat Pal Khattar
Mr Sat Pal Khattar will, upon re-appointment, continue as Chairman of the Nominating Committee and
Remuneration Committee of the Company. Mr Khattar is considered as an independent Director.
To re-elect the following Directors, who are retiring by rotation pursuant to Article 98 of the Company’s Articles of Association:
Resolution 7
Mr Wee Ee-chao
Resolution 8
Mr Han Ah Kuan
Mr Han Ah Kuan will, upon re-election, continue as a member of the Investment Committee.
Resolution 9 Mr Wee Ee Lim
Mr Wee Ee Lim will, upon re-election, continue as a member of the Investment Committee.
11 4
HAW PAR CORPORATION LIMITED
NOTICE OF ANNUAL GENERAL MEETING (CONTINUED)
To re-elect the following Director, who is retiring pursuant to Article 103 of the Company’s Articles of Association:
Resolution 10
Mr Gn Hiang Meng
Mr Gn Hiang Meng will, upon re-election, be appointed as a member of the Audit Committee of the Company.
Mr Gn is considered as an independent Director.
Resolution 11 To approve Directors’ fees of $381,808 for the financial year ended 31 December 2014 (2013: $382,367).
Resolution 12 To re-appoint Messrs PricewaterhouseCoopers LLP as Auditor of the Company to hold office until the
conclusion of the next Annual General Meeting and to authorise the Directors to fix their remuneration.
AS SPECIAL BUSINESS
To consider and, if thought fit, pass the following ordinary resolutions:
Resolution 13
That pursuant to Section 161 of the Companies Act, Cap. 50, approval be and is hereby given to the Directors
to offer and grant options to employees (including executive Directors) and non-executive Directors of the
Company and/or its subsidiaries who are eligible to participate in the Haw Par Corporation Group 2002 Share
Option Scheme that was extended for another five years from 6 June 2012 to 5 June 2017 by shareholders
at the Annual General Meeting on 20 April 2011 (“2002 Scheme”), and in accordance with the rules of
the 2002 Scheme, and to allot and issue from time to time such number of shares in the Company as may
be required to be issued pursuant to the exercise of options under the 2002 Scheme, provided that the
aggregate number of shares to be issued pursuant to this resolution shall not exceed five per cent (5%) of
the total number of issued shares of the Company from time to time.
Resolution 14
That pursuant to Section 161 of the Companies Act, Cap. 50, the Articles of Association of the Company
and the listing rules of the Singapore Exchange Securities Trading Limited (“SGX-ST”), approval be and is
hereby given to the Directors to:
(a)
(i) issue shares in the Company (whether by way of rights, bonus or otherwise); and/or (ii) make or
grant offers, agreements or options (collectively, “Instruments”) that might or would require shares to
be issued, including but not limited to the creation and issue of (as well as adjustments to) warrants,
debentures or other instruments convertible into shares, at any time and upon such terms and conditions
and for such purposes and to such persons as the Directors may in their absolute discretion deem fit;
and
(b)
(notwithstanding the authority conferred by this resolution may have ceased to be in force) issue
shares in pursuance of any Instrument made or granted by the Directors while this resolution was in
force,
provided that:
(1)
the aggregate number of shares to be issued pursuant to this resolution (including shares to be
issued in pursuance of Instruments made or granted pursuant to this resolution) shall not exceed
fifty per cent (50%) of the Company’s total number of issued shares (excluding treasury shares), of
which the aggregate number of shares to be issued other than on a pro-rata basis to members of the
Company (including shares to be issued in pursuance of Instruments made or granted pursuant to
this resolution) shall not exceed fifteen per cent (15%) of the total number of issued shares of the
Company (excluding treasury shares);
ANNUAL REPORT 2014
115
NOTICE OF ANNUAL GENERAL MEETING (CONTINUED)
Resolution 14 (continued)
(2)
(subject to such manner of calculation as may be prescribed by the SGX-ST) for the purpose of
determining the aggregate number of shares that may be issued under this resolution, the total number
of issued shares (excluding treasury shares) shall be based on the total number of issued shares
(excluding treasury shares) in the capital of the Company at the time this resolution is passed after
adjusting for any new shares arising from the conversion or exercise of any convertible securities or
share options or vesting of share awards which are outstanding or subsisting at the time this resolution
is passed, and any subsequent bonus issue, consolidation or subdivision of the Company’s shares;
(3)
in exercising the authority conferred by this resolution, the Company shall comply with the provisions
of the listing rules of the SGX-ST for the time being in force (unless such compliance has been waived
by the SGX-ST) and the Articles of Association of the Company; and
(4)
(unless revoked or varied by the Company in general meeting) the authority conferred by this resolution
shall continue in force until (i) the conclusion of the next Annual General Meeting or (ii) the date by
which the next Annual General Meeting is required by law to be held, whichever is the earlier.
NOTES TO RESOLUTIONS 2, 3 to 10, 13 and 14
Resolution 2
Together with the interim tax-exempt dividend of 6 cents per share paid on 4 September 2014 and subject
to shareholders’ approval of the second & final tax-exempt dividend of 14 cents per share, the total taxexempt dividend for the financial year ended 31 December 2014 will be 20 cents per share. (2013: 20
cents tax-exempt).
Subject to shareholders’ approval of the second & final tax-exempt dividend, the Share Transfer Books and
Register of Members of the Company will be closed* on 25 May 2015 at 5.00 p.m., and the second & final
tax-exempt dividend will be payable on 4 June 2015.
*Duly completed transfers received in respect of ordinary shares of the Company by the Company’s Share
Registrar, Boardroom Corporate & Advisory Services Pte Ltd at 50 Raffles Place, #32-01, Singapore Land
Tower, Singapore 048623 up to 5.00 p.m. on 25 May 2015 will be registered to determine shareholders’
entitlement to the proposed second & final tax-exempt dividend, and shareholders whose securities accounts
with The Central Depository (Pte) Limited are credited with shares as at 5.00 p.m. on 25 May 2015 will be
entitled to such proposed dividend.
Resolutions
3 to 10
Resolution 13
11 6
Key information on the Directors, including their date of first appointment, date of last re-appointment
and other directorships and principal commitments, can be found in the “Board of Directors” section of
the Annual Report.
is to empower the Directors to allot and issue shares pursuant to the 2002 Scheme which was approved at
the Extraordinary General Meeting of the Company on 22 May 2002 and extended for another five years by
shareholders at the Annual General Meeting of the Company on 20 April 2011. A copy of the Rules of the
2002 Scheme is available for inspection by shareholders during normal business hours at the registered
office of the Company at 401 Commonwealth Drive, #03-03 Haw Par Technocentre, Singapore 149598.
Shareholders who are eligible to participate in the Scheme shall abstain from voting.
HAW PAR CORPORATION LIMITED
NOTICE OF ANNUAL GENERAL MEETING (CONTINUED)
Resolution 14 is to empower the Directors to issue shares and to make or grant instruments (such as warrants, debentures
or other securities) convertible into shares, and to issue shares in pursuance of such instruments from the
date of the Annual General Meeting of the Company until the date of the next Annual General Meeting of
the Company, unless such authority is earlier revoked or varied by the shareholders of the Company at a
general meeting. The aggregate number of shares which the Directors may issue (including shares to be
issued pursuant to convertibles) under ordinary resolution 14 must not exceed 50% of the total number of
issued shares (excluding treasury shares) with a sub-limit of 15% for issues other than on a pro rata basis.
For shareholders’ information, this 15% limit is lower than the 20% presently permitted under the listing
rules of the SGX-ST. For the purpose of determining the aggregate number of shares that may be issued,
the total number of issued shares (excluding treasury shares) will be calculated as described.
Notes:
(1)
A member entitled to attend and vote at the meeting is entitled to appoint one or two proxy/proxies to attend and
vote in his/her stead. A proxy need not be a member of the Company.
(2)
To be effective, the Proxy Form must be deposited at the registered office of the Company at 401 Commonwealth
Drive, #03-03 Haw Par Technocentre, Singapore 149598, not less than 48 hours before the time set for holding
the meeting.
By Order of the Board
Zann Lim
Company Secretary
Singapore
8 April 2015
ANNUAL REPORT 2014
117
This page has been intentionally left blank.
PROXY FORM
IMPORTANT:
1. For investors who have used their CPF monies to buy shares of Haw Par
Corporation Limited, this annual report is forwarded to them at the request
of their CPF Approved Nominees and is sent solely FOR INFORMATION ONLY.
2. This Proxy Form is not valid for use by CPFIS investors and shall be ineffective
for all intents and purposes if used or purported to be used by them.
HAW PAR CORPORATION LIMITED
(Incorporated in the Republic of Singapore)
Company Registration Number: 196900437M
3. CPFIS Investors who wish to vote should contact their CPF Approved Nominees.
PERSONAL DATA PRIVACY:
By submitting an instrument appointing a proxy(ies) and/or representative(s), the
member accepts and agrees to the personal data privacy set out in Note 10 behind.
FORTY-SIXTH ANNUAL GENERAL MEETING
(BEFORE COMPLETING THIS FORM, PLEASE READ THE NOTES BEHIND.)
Number of shares held:
Scrip-based
Scripless
I/We, __________________________________________________________________________________________ (Name)
______________________________________________________ (NRIC/Passport Number/Company Registration Number)
of ____________________________________________________________________________________________ (Address)
_________________________________________________________________________________________ (Telephone Number)
being a member/members of the Company, hereby appoint:
NAME
ADDRESS
NRIC/PASSPORT NO.
PROPORTION OF
SHAREHOLDINGS (%)
(a)
And/or (delete as appropriate)
(b)
as my/our proxy/proxies to attend and vote for me/us and on my/our behalf at the Forty-Sixth Annual General Meeting
of the Company to be held on Tuesday, 28 April 2015 at 3.00 p.m. and at any adjournment thereof.
(Please indicate with a “X” in the spaces provided whether you wish your votes to be cast for or against the Ordinary
Resolutions as set out in the Notice of Annual General Meeting. In the absence of specific directions, your proxy/proxies may
vote or abstain as he/she may think fit.)
NO.
RESOLUTION
Ordinary Business
1
Adoption of Financial Statements and Reports of the Directors and Auditors
2
Declaration of Second & Final Dividend
3
Re-appointment of Dr Wee Cho Yaw
4
Re-appointment of Dr Lee Suan Yew
5
Re-appointment of Mr Hwang Soo Jin
6
Re-appointment of Mr Sat Pal Khattar
7
Re-election of Mr Wee Ee-chao
8
Re-election of Mr Han Ah Kuan
9
Re-election of Mr Wee Ee Lim
10
Re-election of Mr Gn Hiang Meng
11
Approval of Directors’ fees
12
Re-appointment of PricewaterhouseCoopers LLP as Auditors
Special Business
13
Authority to issue shares (Share Options)
14
Authority to issue shares (General)
Dated this ________ day of _________ 2015
_______________________________________
Signature(s) or Common Seal of Member(s)
FOR
AGAINST
Notes:
1.
Please insert at the top right hand corner of this Proxy Form the number of scrip-based shares in the Company
registered in your name in the Register of Members and the number of scripless shares in the Company entered
against your name in the Depository Register maintained by The Central Depository (Pte) Limited (“CDP”) in respect
of the shares in your securities account with CDP. If no number is inserted, this Proxy Form shall be deemed to
relate to all the shares held by you.
2.
A member entitled to attend and vote at the meeting is entitled to appoint one or two proxy/proxies to attend and
vote in his/her stead. A proxy need not be a member of the Company.
3.
A member is not entitled to appoint more than two proxies to attend and vote on his/her behalf. Where a member
appoints two proxies, the appointments shall be invalid unless he/she specifies the proportion of his/her shareholding
(expressed as a percentage of the whole) to be represented by each proxy.
4.
The sending of a Proxy Form by a shareholder does not preclude him/her from attending and voting in person at the
Annual General Meeting if he/she finds that he/she is able to do so. In such event, the relevant Proxy Form will be
deemed to be revoked.
5.
To be effective, this Proxy Form must be deposited at the registered office of the Company at 401 Commonwealth
Drive, #03-03 Haw Par Technocentre, Singapore 149598, not less than 48 hours before the time set for holding
the meeting.
6.
This Proxy Form must be signed by the appointor or by his/her attorney. In the case of a corporation, this form must
be executed under its common seal or signed by its duly authorised attorney or officer. In the case of joint holders,
all holders must sign this form.
7.
Any alteration made in this Proxy Form should be initialled by the person who signs it.
8.
The Company shall be entitled to reject this Proxy Form if it is incomplete, improperly completed or illegible or
where the true intentions of the appointor is not ascertainable from the instructions of the appointor specified in
the form. In the case of members whose shares are entered against their names in the Depository Register, the
Company may reject any proxy form lodged if such members are not shown to have the corresponding number of
shares in the Company entered against their names in the Depository Register as at 48 hours before the time set
for holding the meeting or the adjourned meeting, as appropriate.
9.
Agent banks acting on the requests of the CPFIS investors who wish to attend the Annual General Meeting as
observers are requested to submit in writing, a list with details of the investors’ names, NRIC/Passport numbers,
addresses and number of shares held. The list, signed by an authorised signatory of the Agent Bank, should reach
the Company’s Registrar, Boardroom Corporate & Advisory Services Pte Ltd at 50 Raffles Place, #32-01 Singapore
Land Tower, Singapore 048623, not less than 48 hours before the time set for holding the meeting.
10.
By submitting an instrument appointing a proxy(ies) and/or representative(s) to attend, speak and vote at the Annual
General Meeting and/or any adjournment thereof, a member of the Company (i) consents to the collection, use and
disclosure of the member’s personal data by the Company (or its agents) for the purpose of the processing and
administration by the Company (or its agents) of proxies and representatives appointed for the Annual General Meeting
(including any adjournment thereof) and the preparation and compilation of the attendance lists, minutes and other
documents relating to the Annual General Meeting (including any adjournment thereof), and in order for the Company
(or its agents) to update its scrip holders’ information (if applicable) and to comply with any applicable laws, listing
rules, regulations and/or guidelines (collectively, the “Purposes”), (ii) warrants that were the member discloses the
personal data of the member’s proxy(ies) and/or representative(s) to the Company (or its agents), the member has
obtained the prior consent of such proxy(ies) and/or representative(s) for the collection, use and disclosure by the
Company (or its agents) of the personal data of such proxy(ies) and/or representative(s) for the Purposes, and (iii)
agrees that the member will indemnify the Company in respect of any penalties, liabilities, claims, demands, losses
and damages as a result of the member’s breach of warranty.
Haw Par Corporation Limited
(Incorporated in the Republic of Singapore)
Company Registration Number: 196900437M
401 Commonwealth Drive
#03-03 Haw Par Technocentre
Singapore 149598
Tel: 6337 9102 Fax: 6336 9232
www.hawpar.com
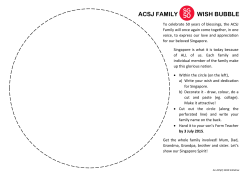
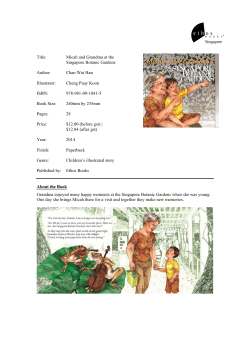


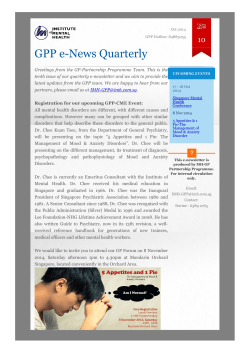
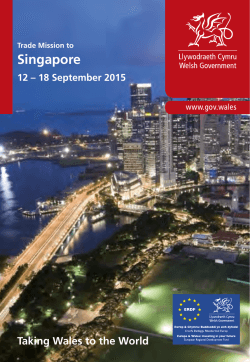
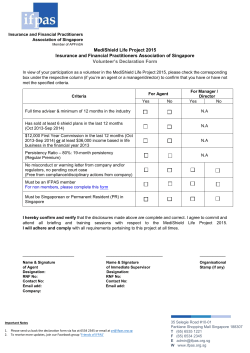


© Copyright 2026