
Trust Board - Public - Healthwatch Central West London
TRUST BOARD AGENDA – PUBLIC 25 March 2015 11.45 – 13.00 Clarence Wing Boardroom, St Mary’s Hospital Agenda Number 1 1.1 1.2 1.3 1.4 1.5 2 2.1 2.2 2.3 2.4 3 3.1 3.2 4 4.1 4.2 4.3 4.4 5 5.1 5.2 5.3 6 6.1 7 Presenter Administrative Matters Chairman’s opening remarks & apologies Board member’s declarations of interests Minutes of the meeting held on 28 January 2015 Record of items discussed at Part II board meeting 28 January 2015 Action Log Operational items Patient Story Chief Executive’s Report Operational Report & Integrated Performance Scorecard Finance Performance Report Items for decision NHS Trust Development Authority selfcertifications • Compliance • Board Statement Elimination of mixed sex wards (EMSA) declaration Items for discussion Annual operating plan and budget Annual research review presentation (2014) CQC report Trust Engagement survey (no 6) and NHS annual staff survey Board committee reports Quality Committee To note the report of the meeting of 11 February & 4 March 2015 Audit, Risk & Governance Committee To note the report of the meeting of 11 March 2015 Finance & Investment Committee To note the oral report of the meeting of 19 March 2015 Items for information Francis report Any other business Timing Paper Chairman Chairman Chairman Chairman Oral Oral 1 2 Chairman 3 Director of Nursing Chief Executive Chief Operating Officer Interim Chief Financial Officer 4 5 6 Interim Chief Financial Officer 8 Chief Operating Officer 9 Interim Chief Financial Officer Director, AHSC Director of Nursing Director of People & OD 10 Committee Chair 14 Committee Chair 15 Committee Chair 16 Director of Nursing 17 7 11 12 13 8 Questions from the Public relating to agenda items 9 Date of next meeting 27 May 2015, 11:00-13:00, Oak Suite, W12 Conference Centre, Hammersmith Hospital, London W12 0HS Trust Board - Public: 25 March 2015 Agenda No: 1.3 Paper No: 1 MINUTES OF THE TRUST BOARD MEETING IN PUBLIC 1.30pm – 3.00pm Wednesday 28 January 2015 Clarence Wing Boardroom, St Mary’s Hospital Present: Sir Richard Sykes Sir Gerald Acher Dr Rodney Eastwood Jeremy Isaacs Sir Anthony Newman Taylor Sarika Patel Andreas Raffel Dr Tracey Batten Alan Goldsman Prof Chris Harrison Steve McManus Prof Janice Sigsworth In attendance: Jan Aps Michelle Dixon Ian Garlington Kevin Jarrold Prof Dermot Kellerher Jayne Mee Mr and Mrs Hurst Dr Bob Klaber Pippa Nightingale 1 1.1 1.2 1.3 1.4 Chairman Deputy Chairman Non-Executive Director Non-Executive Director Non-Executive Director Non-Executive Director Non-Executive Director Chief Executive Officer Interim Chief Financial Officer Medical Director Chief Operating Officer Director of Nursing Trust Company Secretary (Minutes) Director of Communications Director of Strategy Chief Information Officer Vice President (Health), Imperial College Director of People and Organisation Parents of a service user (2.1 only) Consultant paediatrician (3.1 only) Head of Midwifery (3.1 only) General business Chairman’s opening remarks The Chairman welcomed Board members, staff and members of the public to the meeting, particularly welcoming Mr Alan Goldsman to his first Trust Board meeting as Interim Chief Financial Officer. The Chairman noted the successful and interesting formal opening of the Surgical Innovation Centre (a world leader in solving healthcare problems, developing new techniques, and training surgeons to spread their use) earlier that day by HRH, the Prince of Wales, commenting it demonstrated one of the strengths of the alignment of the Trust and Imperial College. Apologies for absence No apologies for absence had been received. Board members’ declarations of interest and conflicts of interest There were no new declarations or conflicts of interests declared at the meeting. It was noted that the register now recorded that Dr Batten had been appointed a Trustee of the Point of Care Foundation. Minutes of the meeting held on 26 November 2014 The minutes were agreed as an accurate record, with the following further amendment to the July minutes: • 3.2: The Board noted that Imperial College is supportive of the proposals for ICHT service reorganisation provided that the costs of re-provision of University activities Action Page 1 of 6 Trust Board - Public: 25 March 2015 1.5 1.6 2 2.1 2.2 Agenda No: 1.3 Paper No: 1 are met fully by the NHS. The Trust has included such costs in the preferred option of the business case. Matters arising and action log The board noted that the Quality Committee had received a detailed presentation on A&E performance which had included trend information. The Board noted the updates to the action log. Minor amendment to governance arrangements The Board approved Dr Eastwood becoming a member of the Finance and Investment Committee. Operational items Patient story The Chairman welcomed Mr and Mrs Hurst to the Trust Board meeting, who provided a compelling and positive story of the experiences that their son, Nicolas had as a paediatric diabetic patient at the Trust. Now in his late teens, he was transitioning from paediatrics services to adult services, which was raising issues of parental engagement during this time, and suggested further thought needed to be given to developing the appropriate levels of communication, both for patient and family. The Board acknowledged the opportunity to further improve information to parents about dealing with urgent care issues and the clarity as to how patient information would be shared with changing care teams. The Chairman thanked Mr and Mrs Hurst for sharing their experience with Board members. The board noted the patient story. Chief Executive’s report Dr Batten particularly highlighted the following items: • The Trust had been disappointed to receive an overall rating of ‘requires improvement’ in the final report (issued in December 2014) following the Chief Inspector of Hospitals’ visit. However, the report was extremely constructive in setting out the Trust’s challenges, notably in outpatients, and acknowledging the areas of excellent performance, in stroke and trauma services and the delivery of compassionate care. The Board noted that this would delay the Foundation Trust application by approximately 12 months. • The Trust had been awarded the lead health provider role (subject to contract) for the tri-borough Community Independence Service (CIS), to be financed through the Better Care Fund. This would offer the Trust the opportunity to develop integrated services, and would commence on 1 April 2015. • The results of the fifth staff engagement survey in December 2014 had shown a continued increase in response rate (now at 49%). It was pleasing to note the way in which the survey had developed; there was a real sense that the staff were using this as a communication channel. It was noted that staff were showing great resilience in the face of enormous operational pressures. The challenge now was to enable a step-change in engagement scores, and divisions had been asked to make ‘one big difference’ in response to feedback from the survey. • ICHT had recently been successful in bidding to become an NHS Genomics Medicine Centre, in partnership with the Royal Marsden, Royal Brompton & Harefield and Chelsea & Westminster NHS Foundation Trusts. • The appointment of Ms Clare Parker as the accountable officer of Central London, West London, Hammersmith & Fulham, Hounslow and Ealing (CWHHE) Clinical Commissioning Groups. In response to a question from Dr Raffel, Mr Jarrold noted that reporting data quality had returned to the pre-Cerner go-live levels, and work continued to ensure that the impact of data quality issues on income were minimised by end-March. The trialling of an electronic medical record was progressing well. Page 2 of 6 Trust Board - Public: 25 March 2015 2.3 2.4 Agenda No: 1.3 Paper No: 1 The Board noted the report. Operational report and integrated performance scorecard Mr McManus presented the operational report and integrated performance scorecard together, noting that the scorecard, having been in place for 12 months, was under review, and a revised scorecard would be presented in the new financial year. Board members would be involved in this review. He particularly highlighting the following items: • Infection control: no cases of MRSA since November 2014, and C difficile cases appeared to have stabilised, but there had been 60 cases year to date against an annual threshold of 66 cases. • A&E performance: whilst significant challenges remained, the Trust had seen steady improvement in performance during January, as a result of additional capacity, and focused clinical and management attention. In response to questions from Mr Isaacs and Dr Raffel, Mr McManus outlined that both patient flow and capacity were being addressed to improve the patient experience, and confirmed that poor performance at any of the Trust sites would be highlighted to the Board in the revised scorecard. • Proposed industrial action: the strike called by a number of unions had been cancelled; thanks were extended to those staff who had volunteered to undergo training to act as paramedic staff. • Stroke scanning: the apparent change to the timeliness of scanning of stroke patients would be investigated. • Safe staffing report: Prof Sigsworth noted that nurse fill rates appeared particularly low in a small number of areas, and these were being addressed; she confirmed that staffing in all areas was subject to risk-assessment on each shift with robust escalation arrangements in place to ensure that safe patient care was provided at all times. Rolling nurse recruitment was underway, with 37 offers having been made the previous week; medicine vacancy levels were planned to be at 5% by the end of March 2015. • Process for introducing new procedure / drugs: Prof Harrison confirmed there was a clear clinical effectiveness pathway for the introduction of new procedures and drugs. Information on the testing for Troponin levels for all suspected heart attack patients would be provided to Board members. • Theatre efficiency: a ‘deep dive’ on theatre efficiency would be presented to the Board at the March meeting. • Cancer pathways: the Trust was working with partners to improve patient pathways, particularly supporting referring hospitals in developing better diagnostic workup and scheduling arrangements. The board noted the operational report and performance scorecard. Finance Performance Report Mr Goldsman reported that the Trust had reported a year to date (YTD) surplus position of £5.9m, but noted that this included the budgeted Project Diamond income of £17.3m, now considered at high risk of not being received. The balanced position had been achieved by a series of non-recurrent income sources, and the underlying run-rate was one of deficit, particularly in relation to expenditure on temporary staffing. The focus for the operational departments was on delivering the final quarter at a run-rate that achieved planned income and expenditure. Non-Executive Directors particularly noted that the £24m overspend on staff did not appear to reflect activity growth and required to be understood and addressed, and that the Trust had not achieved the budgeted cost improvement plan. Mr Goldsman confirmed that the Executive Committee was committed to producing a robust and deliverable budget for the Trust for 2015-16, which was welcomed by NonExecutive Directors; a deliverable budget needed to be set, and managers needed to take accountability for the delivery of that budget. The Board noted the finance performance report. SMcM SMcM CH SMcM Page 3 of 6 Trust Board - Public: 25 March 2015 3 3.1 3.2 3.3 3.4 4 4.1 Agenda No: 1.3 Paper No: 1 Items for Decision Values, behaviour and promise project Ms Dixon introduced the project which aimed to help develop an organisational culture where staff felt they were part of a shared endeavour to achieve a compelling vision and to be able to reflect this in all interactions with external audiences. Dr Klaber and Ms Nightingale (as part of the Horizon personal development programme) outlined how this would focus on values and behaviours through staff and patient engagement. The Board welcomed the staff-led initiative and offered their personal support to the project, noting that the challenge would be to embed the change in a way that it would transfer forward into new cohorts of staff. The Board approved the proposed values, behaviour and promise project. 2014 Emergency Preparedness, Resilience and Response (EPRR) assurance process Mr McManus presented the report, which sought to ensure that the Board had an awareness and understanding of the arrangements in place in respect of the Trust’s emergency preparedness, resilience and response arrangements. The Trust had achieved 55 green and 11 amber ratings in the assurance assessment, resulting in an assessment of ‘substantial assurance. A detailed action plan had been developed to address the areas of amber rating. SMcM The Board asked for a presentation on progress against the action plan at their July meeting. The Board noted: • The revised 2014-15 EPRR assurance process and standards • The outcome of the ICHT 2014 EPRR assurance assessment • Those areas where improvement was required (demonstrated by amber rating) and the action plan in place to address. NHS Trust Development Authority self-certifications Mr Goldsman presented the self-certifications, seeking retrospective approval from the board, noting that there had been no material changes. In future the Board would be asked to approve one month retrospectively and the currently month’s proposed submissions to improve timeliness and oversight of the self-certifications. The Board ratified the self-certifications. Standing Orders Mrs Aps outlined that the review of the Standing Orders had been commenced as part of foundation trust authorisation preparation and contained only minor, mainly style, amendments. Further suggested amendments had been received from Dr Raffel and Mr Garlington which would be included. Revised Standing Financial Instructions had been approved by the Audit, Risk and Governance (ARG) Committee, a revised Schedule of Reserved Powers would be presented to the Board and the Schedule of Delegated Authorities would be presented to the ARG Committee, following review. The Board approved the Standing Orders. Items for Discussion CQC Inspection - follow up and action plan Prof Sigsworth confirmed that the action plan to address issues identified during the CQC inspection had been approved by the Executive Committee, ratified by the Quality Committee, submitted to the CQC, and a response was awaited. The Quality Committee would review progress in implementing the action plan on behalf of the Board, the Executive Committee would have a detailed reporting mechanism, and internal audit would also provide scrutiny on progress. It was noted that the actions in the safety domain were on track for completion and had shorter timescales than some of the responsiveness domain actions which would require more substantial change to achieve. Much of the delivery would be in partnership with other organisations, who had pledged Page 4 of 6 Trust Board - Public: 25 March 2015 4.2 5 5.1 5.2 5.3 5.3 6 6.1 Agenda No: 1.3 Paper No: 1 commitment to this at the Quality Summit in December. The action plan would be a key part of the revised quality strategy. The Trust would redouble efforts to deliver quality care to patients and their families, learning lessons from those services recognised as delivering good and outstanding care (end of life, children’s, stroke, trauma). In response to a question from the Chairman, Prof Sigsworth outlined that the CQC may return in the short term to inspect completion of compliance actions, but would not undertake a full inspection until at least October 2015. The Board welcomed the thorough approach to action planning, whilst acknowledging that implementing the action plan and preparing for a future inspection would be resource intensive. The Board noted the CQC action plan. Research Review for 2014 Prof Chris Harrison presented the research review, highlighting three points: • Biomedical Research Centre (BRC), noting the preparation for re-designation. • Research Excellence Framework (REF), noting the excellent performance in 2014. • NWL Clinical Research Network, noting that this was now hosted by the Trust. The Board noted the annual research review, and that Prof Jonathan Weber would CH/JW provide a more detailed update at the March Board. Board Committee Items Quality Committee Professor Sir Anthony Newman Taylor noted that assurance had been received in relation to surgical rotas at Charing Cross; the Committee considered that the arrangements and future plans significantly reduced the risk to which the Trust had been exposed. The Board noted the report of the meeting on 14 January 2015. Audit, Risk & Governance Committee Sir Gerald Acher particularly highlighted the significant improvement in the corporate risk register, noting that there was further work to ensure this improvement was evident in all levels of the Trust (this would be reviewed by internal audit). He also noted the improvements in Cerner data quality position, and reflected the positive manner in which the electronic clinical documentation was being welcomed in gynaecology. The Board noted the report of the meeting on 10 December 2014. Finance & Investment Committee Ms Patel noted that she had cancelled the meeting as, due to unavailability, the meeting would have been non-quorate; there had been no decision items on the agenda. As chair of the Committee, she had met with Mr Goldsman and Mr McManus to discuss the agenda items. The Board received the minutes of the meeting on 20 November 2014. Foundation Trust Programme Board Dr Eastwood highlighted the improved QGAF score from Grant Thornton, and that the committee had considered that the ‘pause’ in foundation trust process provided an opportunity to embed CQC compliance, renew the Quality Strategy and embed revised governance processes. The Board noted the report and received the minutes of the meeting on 10 December 2014 and received the minutes of the meeting on 18 November 2014. Items for information Report of items discussed at confidential Trust Board 26 November & 17 December 2014 Mrs Aps reported that wherever possible, decisions made and items discussed in confidential session of the Trust Board would be reported at the public Trust Board. The Board noted the report. Page 5 of 6 Trust Board - Public: 25 March 2015 7 8 9 Agenda No: 1.3 Paper No: 1 Any other business There were no items of any other business. Questions from the public relating to Agenda items In response to a question from the public, Mr Garlington confirmed that there would be no change in patient eligibility for patient transport, but that the Department of Health criteria would be more consistently applied. A member of the public requested further details as to the services which were planned longer term on the Charing Cross Hospital site. Dr Batten explained that the Trust was awaiting the outcome of the Keogh review of emergency services, but that current plans included outpatient, chemotherapy and diagnostic services. It was proposed that radiotherapy services be consolidated at the Hammersmith Hospital site but if demand warranted, a spoke would be considered at the Charing Cross Hospital site. Date and time of next meeting The next meeting would be held on Wednesday 25 March 2015, Clarence Wing boardroom. Page 6 of 6 Trust Board - Public: 25 January 2015 Agenda No: 1.4 Paper No: 2 Trust Board - Public Agenda Item 1.4 Title Record of items discussed at the confidential Trust Board 28 January and extraordinary Trust Board 4 March 2015 Report for Noting Report Author Jan Aps, Trust Company Secretary Responsible Executive Director Tracey Batten, Chief Executive Executive Summary: Decisions taken during the confidential sessions of a trust board are reported (where appropriate) at the next trust board held in public. Those issues of note and decisions taken at the trust board’s confidential meeting held on 28 January and extraordinary board on 4 March 21015 are outlined below: • Project Diamond income: Given that the 2014/15 budgeted figure of £17m remained unconfirmed, the Board agreed that the month 10 financial position would be adjusted to reflect the income currently confirmed (£4m). • Shaping a healthier future (SaHF) outline business case: the Board approved the addendum to the submission, which included minor amendments to one of the options. • Dalton review & NHS five year forward view: the Board noted the close alignment of the national direction to the Trust’s strategic plans. • Planned Tariff submission: the Board agreed that a joint position would be taken with other Shelford Group/ Project Diamond trusts in requesting that further tariff options be examined in addition to the two which had been offered. Recommendation to the Board: The Trust Board is asked to note the report. Page 1 of 1 Trust Board - Private: 25 March 2015 Agenda No: 1.3 Paper No: 3 TRUST BOARD MEETING IN PUBLIC ACTION LOG Action Meeting date & minute number Responsible Integrated performance scorecard To review scorecard, including board members, and implement revised scorecard for May Trust Board 28 January 2015 2.3 Steve McManus Integrated performance scorecard To investigate the apparent change to the timeliness of scanning stroke patients Integrated performance scorecard To confirm the Troponin testing arrangements for male and female suspected heart attack patients A&E performance The January performance report would include a trend analysis on A&E activity and performance 28 January 2015 2.3 Steve McManus 28 January 2015 2.3 Chris Harrison 26 Nov 2014 2.3 Steve McManus Status Update (where action not completed) Under development; review at April seminar. Revised scorecard in May. COMPLETED. Reported to Quality Committee 11 February. The information would be provided in May. COMPLETED. Reported at Quality Committee Page 1 of 2 Trust Board - Private: 25 March 2015 Agenda No: 1.3 Paper No: 3 FORWARD PLAN AGENDA ITEMS FROM BOARD DISCUSSIONS Report due Report subject Meeting at which item requested Responsible March 2015 Clinical research A presentation on the Trust’s research activities following annual report presented by Prof Harrison Theatres efficiency To provide a ‘deep dive’ in actions to improve theatre efficiency 28 January 2015 4.2 Chris Harrison (Jonathan Weber) 28 January 2015 2.3 Steve McManus On-line performance scorecard Demonstration of the Qlik view scorecard (This would be presented as part of the presentation of the performance report) Cost improvement programme: quality impact assessment An annual summary of post-implementation reports to be submitted to the Board for review Emergency preparedness, resilience and response (EPRR) To present progress against action plan to address ‘amber’ ratings Leadership development Consideration to be given to implementing a Trust-based graduate training scheme 26 November 2014 2.3 Steve McManus 28 May 2014 4.2 Chris Harrison 28 January 2015 3.2 27 November 2013 3.4.2 Steve McManus Audit, Risk & Governance Committee in April with an update to Trust Board in May. May 2015 May 2015 July 2015 September 2015 Jayne Mee Page 2 of 2 Trust Board - Public: 25 March 2015 Agenda No: 2.1 Paper No: 4 Trust Board - Public Agenda Item 2.1 Title Patient Story: Implementing the #hellomynameis initiative Report for Noting Report Author Guy Young, Deputy Director of Patient Experience Responsible Executive Director Janice Sigsworth, Director of Nursing Executive Summary: Patient stories are seen as a powerful method of bringing the experience of patients to the Board. Their purpose is to support the framing of patient experience as an integral component of quality alongside clinical effectiveness and safety. This month the Board will be informed about a national campaign related to staff introducing themselves to patients (#hellomynameis) and how Imperial College Healthcare is responding to this. Recommendation to the Board: The Board is asked to note the work ICHT is doing in relation to #hellomynameis Trust strategic objectives supported by this paper: • To achieve excellent patient experience and outcomes, delivered efficiently and with compassion. Page 1 of 2 Trust Board - Public: 25 March 2015 Agenda No: 2.1 Paper No: 4 Patient Story Background The use of patient stories at board and committee level is increasingly seen as positive way of reducing the “ward to board” gap, by regularly connecting the organisation’s core business with its most senior leaders. The perceived benefits of patient stories are: • To raise awareness of the patient experience to support Board decision making • To triangulate patient experience with other forms of reported data • To support safety improvements • To provide assurance in relation to the quality of care being provided (most stories will feature positive as well as negative experiences) and that the organisation is capable of learning from poor experiences • To illustrate the personal and emotional sequelae of a failure to deliver quality services, for example following a serious incident The #hellomynameis campaign The #hellomynameis campaign is a national initiative led by Dr Kate Granger and endorsed by the Chief Nurse of England and the Department of Health, as well as many major public figures. Over 90 NHS Trusts now actively promoting this campaign. Kate Granger is an NHS doctor who started the #hellomynameis campaign shortly after she was diagnosed with a rare and aggressive form of cancer three years ago. The doctor who informed her that her cancer had spread did not introduce himself to her. She also noticed that a failure of staff to introduce themselves was common and that this was not a good experience for the patients Her twitter campaign reminds staff to go back to basics, build trust and make a vital human connection with patients by, at the very least, saying who they are. She has also maintained a powerful and moving blog about her experiences: https://drkategranger.wordpress.com/ Imperial College Healthcare NHS Trust launched ‘my name is’ as part of a cancer patient experience work in 2014. This is now being being further refined as a result of an improvement project that was undertaken. The Executive Committee has recently approved changes to the name badges worn by staff and an amendment to the Dress Code and Uniform Policy to ensure that staff wear their name badges to support the #hellomyname is principles. In addition the #hellomynameis initiative is promoted in the corporate welcome programme for new starters to the trust and will be woven into a developing customer care programme. Recommendation to the Board: The Board is asked to note the work ICHT is doing in relation to #hellomynameis Page 2 of 2 Trust Board - Public: 25 March 2015 Agenda No: 2.2 Paper No: 5 Trust Board - Public Agenda Item 2.2 Title Chief Executive’s Report Report for Noting Report Author Dr Tracey Batten, Chief Executive Responsible Executive Director Dr Tracey Batten, Chief Executive Executive Summary: This report outlines the key strategic priorities for Imperial College Healthcare NHS Trust (ICHT) and provides an environmental scan of the opportunities and threats facing the Trust. Recommendation to the Board: The Board is asked to note this report. Trust strategic objectives supported by this paper: • To achieve excellent patient experience and outcomes, delivered efficiently and with compassion. • To educate and engage skilled and diverse people committed to continual learning and improvement. • As an Academic Health Science Centre, to generate world leading research that is translated rapidly into exceptional clinical care. • To pioneer integrated models of care with our partners to improve the health of the communities we serve. Page 1 of 6 Trust Board - Public: 25 March 2015 Agenda No: 2.2 Paper No: 5 Key Strategic Priorities 1. Ealing Maternity The Trust has confirmed its commitment to proceeding with the Ealing Maternity services transfer of 1000 births/101 neonates per annum; on the condition that this is supported by commissioners within a sustainable financial sum and long term contract arrangements. NHS England have now outlined their assurance process for stage one. This recommends that before Ealing CCG make a decision on the timing of the planned service transitions further assurance is sought on confirmation of staffing, estates work completion timelines, details of the maternity booking service and details of the gynaecology model of care at Ealing Hospital. It is anticipated that further work will need to take place on operational readiness before a decision on the timing for the transfer of maternity services is made. 2. Cerner Implementation The implementation of Phase two which involves the deployment of the Cerner emergency department and theatres modules has gone live to schedule. Hammersmith Hospital and Queen Charlotte and Chelsea Hospital theatres successfully took Surginet (the theatre solution) live on Monday 9 March with St Mary’s and Western Eye following on the 16th March and Charing Cross a week later. The Emergency Departments at St Mary’s, Western Eye and Charing Cross all went live with Firstnet (the Cerner emergency department module) on Tuesday 10 March. Together these represent a significant expansion of the system involving nearly 1,000 additional users. The pilots for the use of Cerner clinical documentation in Gynaecology and Elderly Care for inpatients and outpatients have continued to go well with doctors, nurses and allied health professionals now recording their interactions with patients into the Cerner digital record rather than the paper medical record. Building on the lessons learned from the pilot areas, detailed plans for roll out across the whole organisation are now being developed including piloting and roll out of electronic prescribing. The data quality issues that arose from the implementation of the Cerner Patient Administration System have largely been resolved and are now being managed through the routine business as usual processes with a continuing focus on the 18 week referral to treatment data. Planning for the move of the Cerner system from the BT data centre to the Cerner data centre in September continues to track to the agreed plan. 3. Financial Sustainability For month eleven, the Trust recorded a deficit of £1.3m against a planned deficit of £2.3m, a positive variance of £1.0m. Year to date, the Trust is reporting a deficit of £4.7m, an adverse variance against the plan of £14.4m. This includes the reduction in planned income from Project Diamond of £12.1m YTD. The year end forecast is now for a breakeven position at the retained surplus level given the full year anticipated reduction in Project Diamond funding of £13.2m. NHS contracts are still under negotiation for the 15/16 year. There is a significant gap between Trust and CCG offers; as of 17 March 2015 there is still no offer from NHS England for specialised services. April has been set aside for contract mediation in the likely event contracts cannot be signed by the end of March. The annual business plan is now due by 14 May 2015. Page 2 of 6 Trust Board - Public: 25 March 2015 Agenda No: 2.2 Paper No: 5 4. Operational performance A&E performance against the 95 per cent four hour waiting time target improved during February 2015, with the Trust achieving 95 per cent during the last week in the month. During this week, there was particular focus as the Trust operated a ‘Breaking the Cycle’ week. Lessons learned from this week are being rolled out across the Trust with particular focus on the more effective escalation of barriers; continuing to enable discharges before noon; and having a greater focus on working with other providers to enable suitable patients to continue their care in community settings or in their local hospital. The Trust is expected to under deliver the Referral To Treatment (RTT) standards in both February and March 2015. This is a planned under delivery following agreement by the Trust Development Authority (TDA) to focus on patients with incomplete pathways. The Trust has achieved its target to reduce the number of incomplete RTT pathways to 7,000 by the end of February and is on target to 5,000 by the end of March (submitted on 17 April). 5. Care certificate The Care Certificate was developed to provide a minimum training standard that is to be achieved by all patient facing healthcare support workers in nursing, midwifery and the allied health professions within the first 12 weeks of employment in this role. Delivery of the Care Certificate is required for all staff employed after the 1st April 2015. All healthcare support workers already employed by the Trust will need to be compliant by April 2020. Once the new starters programme has been established, a plan for training the existing healthcare support workers will begin. 6. Nursing and midwifery revalidation From December 2015 all nurses and midwives will be required to ‘Revalidate’ every three years in order to continue to practise. Revalidation aims to improve public protection by ensuring that nurses and midwives remain fit to practise throughout their careers. ICHT is now planning to revalidate 3000+ nurses and midwives. 7. Patient services centre The Patient Service Centre (PSC) project aims to improve patient and staff experience by consolidating switchboard and booking services for outpatients and elective surgery within a centralised contact centre, potentially at Charing Cross Hospital. In order to propose a preferred option for moving forward, the project’s revised outline business case (OBC) will be presented to the Trust Board in May. Pending the Board’s consideration, the preferred option will be developed into a full business case to be submitted to the Trust Board in July. This is part of the wider re design of our administrative processes to support the quality of patient care with a particular focus on the outpatient improvements we identified with the CQC. 8. Community Independence Service (CIS) The Trust has been appointed as Lead Health Provider (LHP) for the tri-borough CIS and, working closely with the Lead Social Care provider, has made significant progress: - A programme team has been appointed to deliver the agreed work programme for the 2015-16 transitional year - The governance model for the programme has been agreed, including a Chief Executive level partnership board Page 3 of 6 Trust Board - Public: 25 March 2015 - Agenda No: 2.2 Paper No: 5 Clinical engagement has commenced, including site visits to the existing services An investment plan is being developed for the service, focusing on service hours extension and increasing capacity Commenced development of a recruitment plan to ensure consistent capacity in line with projected additional activity for the transition year. Before go live, the key priorities are: - To finalise the LHP contract with commissioners and to develop the management model for our relationship with our health sub-contractors and partners - To finalise the key performance indicators (KPIs) and reporting requirements for the service - To finalise a formal communications and engagement strategy - To review existing clinical governance arrangements for the service - To agree the technical specification and implementation plan for SystmOne as the shared patient record system. At present, the programme is on track for a successful go live on 1st April 2015 and delivery of the planned benefits. 9. Stakeholder Engagement Our programme of regular contact meetings with external partners has continued focusing particularly on the clinical strategy and future engagement plans, plus other key issues such as the performance of our urgent and emergency care services and the CQC inspection. The Chief Executive continued regular contact with local MPs in February and March and a series of meetings with Healthwatch Central West London have also taken place. The executive team attended Hammersmith & Fulham Council’s health overview and scrutiny committee in both January and February to discuss A&E performance and the CQC inspection report. In March the Trust’s comprehensive action plan in response to the CQC inspection was also discussed at the Royal Borough of Kensington and Chelsea’s health scrutiny committee to update the committee on a range of Trust issues. A group of Westminster City councillors also visited St Mary’s Hospital to discuss the CQC action plan in March. Further stakeholder meetings are planned although we will be taking into account the requirements of the pre-election period which starts on 30 March. 10. Senior Leadership team Interviews for the substantive Chief Financial Officer role have taken place this month. Sadly Jayne Mee has announced that she will be stepping down as Director of People and Organisation Development in June to pursue a portfolio management career. The recruitment for a new Director of People and Organisational Development is in progress and Jayne will be helping with this process. Professor Naresh Kikkeri has been substantively appointed as the divisional director of the investigative sciences and clinical support division. The leadership forum will be held on Monday 23 March with the top 100 leaders from across ICHT. The session will be used as an opportunity to engage colleagues in; the Page 4 of 6 Trust Board - Public: 25 March 2015 Agenda No: 2.2 Paper No: 5 development of the strategic positioning for the organisation; the development of the quality strategy and quality improvement methodology; and to build on and articulate the organisational values, behaviours and promise. Key Strategic Issues 1. Imperial College Faculty of Medicine senior leadership team Imperial College announced Gavin Screaton’s appointment as the new Dean of the Faculty of Medicine on 27 February. He took up his position on 1 March in succession of Dermot Kelleher. Dermot Kelleher, Vice President (Health), has been appointed as the new Dean of the Faculty of Medicine at the University of British Columbia, Canada, taking up his position on 1 September 2015. The College will now begin the search for a successor to Dermot as Vice President (Health). 2. TDA senior leadership team David Flory, Chief Executive of the NHS Trust Development Authority has announced his decision to step down from his post at the General Election in May 2015. Bob Alexander, currently Director of Finance, will be interim Chief Executive, with Elizabeth O’Mahony stepping up to the role of Director of Finance. 3. New care models vanguard North West London (NWL) submitted an expression of interest (EOI) to NHS England in the new models of care programme on behalf of the NWL Pioneer Partners in February 2015. NHS England confirmed on 10 March that the NWL tri-borough EOI has not been selected to be part of the first vanguard cohort. Imperial, however, has separately registered its interest to support the connecting care for children, CC4C (paediatric) new models of care vanguard application and discussions are on-going. 4. Diabetes prevention NHS England, Public Health England (PHE) and Diabetes UK have launched a major national initiative to prevent illness by unveiling the first ever at-scale National NHS Diabetes Prevention Programme. The joint initiative aims to significantly reduce the four million people in England otherwise expected to have type 2 diabetes by 2025. England will be the first country to implement a national evidence-based diabetes prevention programme at scale, delivering on the commitment set out in the NHS Forward View and PHE’s Evidence into Action last year. Seven CCG ‘demonstrator’ sites across the country have been selected to take part in the initial phase of the programme during which they will see more patients, monitor and test their local programmes to help co-design and implement the national programme. PHE is also working with ICHT on a bespoke weight loss pilot scheme for NHS staff which could provide a blue print for national roll out. The pilot scheme offers the Trust’s 10,000 staff an opportunity to access expert help from a range of dieticians, clinicians and the weight management company MoreLife. 5. The Code – professional standards of practice and behaviour for nurses and midwives The new Nursing and Midwifery Council code of practice for nurses and midwives has been updated following a public consultation, and will go live on 31st March 2015. The Page 5 of 6 Trust Board - Public: 25 March 2015 Agenda No: 2.2 Paper No: 5 Code has been updated to reflect changes in healthcare and society and includes new requirements such as duty of candour, raising concerns, taking action in an emergency and social media use. 6. Shape of caring report The Shape of Caring report, led by Lord Willis and commissioned by Health Education England (HEE), was published in mid-March and reviewed the future of nursing and healthcare assistant education and training. The report outlined a number of proposals for a structured career path for nurses and healthcare assistants. The proposals include: • A review of education funding by HEE to secure a multi-professional approach to training; • A one year formal preceptorship for newly qualified nurses in their chosen specialty; • more general training in the first two years of a nursing degree, including mental health; • The creation of a clinical membership and fellowship model for nurses as they progress in their careers; • Creation of doctoral training centres to encourage more academic nursing research; • A review of the four branches of nursing and the creation of a new “community nursing” field; • Making the care certificate a mandatory requirement for all HCAs; • A new advanced HCA role at pay band 3 with a nationally recognised and standardised curriculum based on NMC standards; • Changes to make it easier for advanced HCAs to access undergraduate nurse training; and • An annual student nurse survey and exit interviews for those leaving to help identify and tackle high attrition rates. HEE and the Nursing and Midwifery Council have accepted the recommendations but will launch a three month consultation following the report’s publication. ICHT is currently assessing the impact of the report. 7. Budget 2015 Please see appendix one for a summary of the Chancellor of Exchequer’s 2015 budget relating to health and social care. Recommendation to the Board: The Board is asked to note this report. Page 6 of 6 Chief Executive's report - Appendix 1 BUDGET 2015 - HEALTH The Chancellor of the Exchequer has today (18th March) delivered his sixth and final budget, which sets out the coalition’s tax and spending plan, in what is his final budget statement before the general election on May 7th. OVERALL HEALTH BUDGET Reiterated that the Government has increased the health budget in real terms in every year of this Parliament Reiterated Government announcement in the Autumn Statement 2014 of £2 billion additional funding for frontline NHS services in 2015-16, that will be added to the NHS’s baseline funding in future years to help meet growing demand, improve services and kick-start the transformation set out in the NHS’s 5YFV – however, the Red Book does stress the need to find significant annual efficiency savings in order to meet demand and maintain good quality patient care MENTAL HEALTH Mr Osborne detailed in his speech “in this Budget, we are providing funding a major expansion of mental health services for children and those suffering from maternal mental illness… those who suffer from these illnesses have been forgotten for too long” Ongoing commitment to parity of esteem between physical and mental health From April 2015, there will be new access and waiting times standards introduced for key mental health services Announcement of £1.25 billion package of investment for mental, in addition to the £150 million announced in Autumn 2014 for young people with eating disorders and pilots testing new ways to support those with mental health problems to return to work £1 billion over the next 5 years to start new access standards, which will see over 110,000 more children cared for over the next Parliament £118 million by 2018-19 to complete the roll-out of the Children and Young People’s Increasing Access to Psychological Therapies (CYP IAPT) programme, ensuring that there are talking therapists in every part of the country £75 million over the next 5 years to give the right care to women who experience mental ill health during the perinatal or antenatal period The Department for Education will also provide an additional £1.5 million towards piloting joint training for designated leads in Child and Adolescent Mental Health Services (CAMHS) and schools to improve access to mental health services for children and young people Budget 2015 announces a package of measures to improve employment outcomes for people with mental health conditions - starting from early 2016, the government will provide online Cognitive Behavioural Therapy (CBT) to 40,000 Employment and Support Allowance and Jobseeker’s Allowance claimants and individuals being supported by Fit for Work From summer 2015, the Government will begin to co-locate Improving Access to Psychological Therapies (IAPT) therapists in over 350 Jobcentres, to provide integrated employment and mental health support to claimants with common mental health conditions £8.4 million over the next 5 years to allow the NHS across England to enhance current mental health and support services to veterans PROCUREMENT Interim findings from Lord Carter’s work as Chair of the NHS Procurement and Efficiency Board show that action in a number of areas, including procurement, pharmacy and property, could deliver significant savings that the NHS could recycle back into frontline care, e.g. local savings of up to £5 million a year have been found in one Trust alone by improving contract management and engaging with suppliers to find ways to resist cost increases INTEGRATION The Red Book states “the £5.3 billion Better Care Fund (BCF)is helping people to benefit from joined up health and social care” – building on this reform, the Budget announced the government is exploring he cost-effectiveness of options to integrate spending around some of the most vulnerable groups of people, including: o Taking the next steps on from the BCF to continue to join up services for people with health and social care needs, and learning from Greater Manchester’s experience following their recent landmark agreement to bring together commissioning of around £6 billion of local health and social care budgets o Improving the links between health and employment support for people who are unable to work because of a health condition o Learning from the roll out of Fit for Work and the mental health pilots agreed as part of the Growth Deals and at Autumn Statement 2014 Exploring whether improving housing can help people with care needs stay in their homes longer and reduce costs to the NHS Launch of two pilot projects in Leeds City Region and Greater Manchester in 2015-16, to trial local sharing initiatives in health and social care LIFE SCIENCES Commitment to £20 million to Health North, which will build on the strength of health science in the North, to enable better care for patients and promote innovation through analysis of data on the effectiveness of different drugs, treatments and health pathways £40 million of strategic science and innovation investments to ensure the UK is a global leader in emerging markets and technologies, including a research hub to develop application for Internet of Things technologies in healthcare and social care Near doubling of funding for UK Trade and Investment activities in China, including a focus on healthcare and life sciences sector Reinvestment of up to £30 million from the sale of Medical Research Council assets to support research at the Francis Crick Institute, with matched funding from Cancer Research UK and the Wellcome Trust OTHER ITEMS OF NOTE Announced funds for new helicopters for the Essex & Herts, East Anglian, Welsh and Scottish air ambulances, and for the Lucy Air Ambulance that transports children requiring urgent care Refunding of VAT to blood bike charities, following a public campaign on the matter Set aside £1 million to help buy defibrillators for public places, including schools, and support the training of their use to save more lives Beer duty is being cut by 1p a pint for the third year running, duty on cider and spirits such as Scotch whisky will be cut by 2% and wine duty will be frozen The full Budget can be read here. Trust Board - Public: 25 March 2015 Agenda No: 2.3 Paper No: 6a Trust Board - Public Agenda Item 2.3 Title Operational Report Report for Monitoring/Noting Report Author Steve McManus, Chief Operating Officer Responsible Executive Director Steve McManus, Chief Operating Officer Executive Summary: This is a regular report to the Board and outlines the key operational headlines that relate to the reporting month of February 2014. Recommendation to the Board: The Board is asked to note the contents of this report. Trust strategic objectives supported by this paper: • To achieve excellent patient experience and outcomes, delivered efficiently and with compassion. • To educate and engage skilled and diverse people committed to continual learning and improvement. • As an Academic Health Science Centre, to generate world leading research that is translated rapidly into exceptional clinical care. • To pioneer integrated models of care with our partners to improve the health of the communities we serve. Page 1 of 12 Trust Board - Public: 25 March 2015 Agenda No: 2.3 Paper No: 6a Title : Operational Report Purpose of the report: Regular report to the Board on Operational Performance Introduction: This report relates to activity within M11 (February) 2014/15. A. Shadow Monitor compliance Foundation Trust governance risk rating (shadow): Amber Rationale: The Trust under-delivered on the RTT standards, one of the eight cancer standards and the 4 hour A&E waiting time standard B. Safety Mortality Rates & Incidents Mortality Rates: • The Trust’s HSMR for Q2 2014-15 is 80.83, which is higher than the Q1 figure of 70.97. This is due to the HSMR for August being within expected range for the first time this year. HSMR for September however showed a return to low relative risk, with early data for Q3 showing the lowest HSMR for the year to date; • Two procedure group mortality alerts were reported in September and October 2015. These will be followed up by the divisions and will be reported in the Quality report. Deaths in Low risk diagnostic groups: • For the most recent months (September and October 2014) the data shows that there were fewer deaths observed than expected in low risk diagnostic groups when adjusted for case mix. Serious Incidents (SIs) & Never Events: • 19 SIs were reported in February 2015, the year to date total is 137, which exceeds last year’s total of 129. However, when compared with the NRLS Cluster peer data, overall harm as a consequence of incidents remains low, while reporting rates are increasing,. • No never events were reported in February. Safety Thermometer: • The Trust’s Safety thermometer ‘harm free care’ rate remains above the threshold at 96.7% VTE: • The scorecard data for VTE indicators is not currently available. There were no Incidences of harm to children due to failure to monitor or medication errors causing serious harm reported in February 2015. Page 2 of 12 Trust Board - Public: 25 March 2015 Agenda No: 2.3 Paper No: 6a Infection Prevention & Control Meticillin resistant Staphylococcus aureus bloodstream infections (MRSA BSI): • To date six cases of MRSA BSI have been allocated to the Trust (one case in April, two cases in May, one case in October, November and December). • In February two further cases of MRSA BSI occurred, these have initially been allocated to the Trust (post 48 hour specimens). PIRs for both cases are currently being undertaken within the division of medicine; the final allocation will be made once the PIRs are completed. Clostridium difficile infections: • Eight cases of C. difficile were allocated to the Trust for February 2015. • The annual objective for the Trust is 65 for 2014/15; at the end of February 2015 we reported 70 cases attributed to the Trust. • The provisional definition of a lapse in care associated with toxin positive C. difficile disease within ICHT is described as a) non-compliance to the ICHNT antibiotic policy or b) If the patient shared a ward with another patient who was symptomatic and later found to be C. difficile positive (with the same ribotype). A sample of Trust attributable C. difficile cases from Quarters one, two and three has been subject to a collaborative review with the CCG. • In Quarter one, two cases were felt to be due to a potential lapse in care (one due to non compliance with antibiotic policy and one having had contact with another patient with C. difficile). In Quarter two there was one case felt to be due to a potential lapse in care (having had contact with another patient with C. difficile). There were no lapse of care cases identified in Q3. • The IP&C team monitor the time to isolation for all cases of C. difficile; during Q3, seven of the 15 cases were not isolated with the two hour time period. Meticillin sensitive Staphylococcus aureus bloodstream infections (MSSA BSI): • There have been 27 Trust attributable cases for this financial year compared to 33 this time last year (FY 2013/14); of the 27 cases, eight were line related. • The IP&C team undertake reviews of all Trust attributable cases of MSSA BSIs, findings and subsequent learning are discussed with divisional and clinical teams and any device related BSIs are discussed at the line safety committee. Escherichia coli bloodstream infections (E. coli BSI): • There have been 69 Trust attributable cases for this financial year compared to 74 this time last year (FY 2013/14). Adult ICU CLABSI: • The 12 month rolling CLABSI rate for all three adult ICUs is 0.8 per 1000 catheter line days the ECDC mean is 3.1 per 1000 catheter line days. • The have been Zero episodes of CLABSI in Jan and Feb 2015 in a period which saw approximately 1900 catheter days. Surgical Site Infection (SSI): Orthopaedics • The Trust average SSI rate for Knee replacement is 0.3%, and 0 per cent for Hip replacement for FY 2014-15. Zero SSIs have been identified in 65 knee replacement Page 3 of 12 Trust Board - Public: 25 March 2015 Agenda No: 2.3 Paper No: 6a and 43 hip replacement procedures; the National average (PHE) SSI rate is 0.6 per cent for both procedures. Cardiothoracic • The Trust average SSI rate for CABG is 1.8 per cent and 0.4 per cent for non-CABG for FY 2014-15. One superficial incisional SSI has been identified out of 89 CABG procedures in the current quarter (Jan-Mar 2015) and zero SSIs have been identified in 39 non-CABG, the National average (PHE) SSI rate is 4.5 per cent for CABG and 1.2 per cent for non-CABG. Carbapenemase Producing Organisms: • The total for 2014/15 until the end of February 2015 is 41. • In line with the guidance issued by PHE and NHS England, an action plan is in place to ensure that the tool kit is embedded into practice. • We continue to send risk factor information relating to each (PHE reference lab confirmed) CPO case to Public Health England. Dementia A summary of the latest report of the audit of carers of patients with dementia is included in appendix 2. It is a requirement for the national CQUIN for this to be shared with the Board. C. Patient Centeredness Friends and Family Test Inpatient FFT response rates continue to be above the CQUIN threshold and it looks very likely that that the 40 per cent month 12 threshold will be achieved. The A&E FFT response rate remains below the Q3 threshold despite the setting of daily response targets and overview at the divisional performance meeting. At the beginning of March a temporary administrator was bought in by the central patient experience team with the sole aim of collecting FFT responses from patients. This has had an immediate and significant impact with estimated daily response rates in the region of 30 per cent, although this still may not be sufficient to achieve and overall Q4 response rate of 20 per cent. The patient experience tem will continue to monitor daily and feed results to departmental managers. Complaints & PALS Complaints and PALS enquiries seem to have increased again in February. As the full dataset is not available at the time of writing it is not possible to identify any key themes although in January there was a marked increase in the appointments, delays and cancellations category. D. Effectiveness Stroke Indicators: • The indicators for stroke are above the threshold for Q3, with 100 per cent of potentially eligible patients thrombolysed within 45 Minutes. Page 4 of 12 Trust Board - Public: 25 March 2015 Agenda No: 2.3 Paper No: 6a E. Efficiency Performance against some of the key efficiency measures is reported in the Integrated Performance Scorecard. Both elective and non-elective length of stay has remained above threshold and higher than previous quarters within 2014/15. Elective length of stay was 3.89 days in February against a threshold of less than 3.5 days. The data presented on elective efficiency metrics in the Integrated Performance Report suggest that that the elective pathway has extended in recent months. Further analysis is needed to explore the reasons behind this. Non-elective length of stay was 4.92 in February against a threshold of less than 4.5 days. Theatre utilisation was 76.44 per cent. This is below the internal threshold of greater than 80% but an improvement from the previous two months and better than the same period last year. The Trust’s Did Not Attend (DNA) rate has continued to decrease, for both first outpatient and follow up appointments, following the resumption of the text messaging reminder service for patients at the end of September. F. Timeliness Accident and Emergency Performance against the standard for 95 per cent of Emergency Department patients to be seen within four hours remained challenged in February 2015. However, the Trust achieved 95 per cent during the last week in February. During this week, there was particular focus as the Trust operated a ‘Breaking the Cycle’ week. Lessons learned from this week are being rolled out across the Trust with particular focus on discharges before noon. Inpatient bed capacity remains under review, with Divisions developing plans to allow for flexing capacity down during the Summer months to provide efficiencies. Actions for the resilience plan are reviewed weekly at the Trust winter operational group, the A&E meeting and at Executive Committee as well as through daily and weekly performance review meetings with local commissioners. Referral to treatment (RTT) Data for January RTT performance is due to be submitted on Wednesday 18th March. The Trust is expected to under deliver the RTT standards in both February and March 2015. This is a planned under delivery following agreement by the Trust Development Authority (TDA) to focus on data validation of patients still waiting for treatment, rather than data validation of those patients who have already had their treatment. The Trust is on target with its trajectory to reduce the number of incomplete RTT pathways to 7,000 by the end of February (submitted on 18th March) and to 5,000 by the end of March (submitted on 17th April). In addition to improvements to Cerner workflow and resolving technical issues affecting reporting, the Trust has invested in a team, through funding from the TDA, to support on-site training to staff to support them to use Cerner without inadvertently entering erroneous data. Page 5 of 12 Trust Board - Public: 25 March 2015 Agenda No: 2.3 Paper No: 6a Cancer In March, performance is reported for the cancer waiting times standards in January. In January the Trust achieved seven of the eight cancer standards. In January the Trust failed to meet the 62-day GP referral to first treatment standard. It is expected that the Trust will also under-deliver the standard in February. Performance for patients treated so far in March suggests in month delivery in March of the 62-day GP referral to first treatment standard. However, it is unlikely that this will be enough to mitigate January and February performance to achieve the standard for quarter 4 as a whole. Work has begun with under performing clinical teams to address pathway delays that have contributed to this performance position in order to return to achieving all eight standards from the first quarter of 2015/16. The Trust recovered performance against the 62-day screening standard after failing to meet the standard in December and Quarter 3. Diagnostic waiting times The Trust did not meet the standard for patients having a diagnostic test within six weeks in February. 1.4 per cent of patients were waiting longer than six weeks at the end of February The speciality that contributed the highest number of breaches was cystoscopy. Remedial action to reduce the number of patients awaiting diagnostic tests is expected to be completed in March 2015, with longer term capacity issues to be reviewed. G. Equity Nothing to report. H. People PEOPLE & ORGANISATION DEVELOPMENT Engagement Survey Our 6th Engagement Survey ran in January and February 2015. We achieved our best response rate to date at 55 per cent, with one division - Surgery, Cancer & Cardiovascular achieving a 70 per cent response rate. This is a notable increase on the 23 per cent response rate we achieved when we ran the survey for the first time 18 months ago. The overall engagement score has increased to 41 per cent from 37 per cent in the previous survey. This is the most significant increase we have seen to date. 56 per cent respondents reported that they believe that action will be taken as a result of the survey, and in response to a new question, 50 per cent believed that action has been taken as a result of previous surveys. The results are being communicated across the Trust and action plans being developed. Performance and Development Review Our rates for PDR are now 96 per cent for Bands 7-9 and 90 per cent for bands 2-6. We are now preparing for the new PDR cycle which commences on 1 April for everyone on agenda for change contracts: band 7-9 PDRs must be completed by June and band 2-6 PDRs must be completed by September. We have recently evaluated the new PDR process. We received 1200 responses to an online survey: 90 per cent managers said the new PDR Page 6 of 12 Trust Board - Public: 25 March 2015 Agenda No: 2.3 Paper No: 6a process will help them improve the motivation of their team and 80 per cent of reviewees stated that their PDR had been an improvement on the previous years. In March we will run focus groups and more in-depth evaluation to help determine how best to tailor our support for managers in 2015. Mandatory Training A major focus in January and February has been the implementation of WIRED 2, the new reporting tool for mandatory training. The tool goes live from mid-March. Wellbeing Week Our second Wellbeing Week takes place in the week commencing 23rd March. We will include a few favourites from last year including our £1 curry lunch, stress testing, smoking cessation, smoothie bikes and massage. We also have a few new things on offer, including travel health advice, and Unilever will run a health check stand with tests on Cardiac Risk, BP, BMI Cholesterol and Blood Glucose. We will also use the week to re-launch the Bike User Group, promote our weight management programme and to promote My Benefits and our Make a Difference recognition scheme. Challenge 2015 As part of Challenge 2015 we are running a steps challenge. 175 people in 31 teams are participating. The challenge runs for six weeks with our people being asked to take as many steps as possible each day. There will be prizes for the top individual and team steppers and for the biggest individual and team improvers from week 1 to week 6. A league table will be published on our facebook page. Ebola Three of our employees have now been assessed by occupational health following their return from Ebola voluntary deployment. One laboratory worker and two front line clinical staff. None have been diagnosed with Ebola. We have another employee currently on deployment and several volunteers awaiting deployment. As the situation improves in affected areas it is not certain that all those currently trained for deployment will be required. Enabling managers to access people data The final development phase of the ‘Your People’ management application for Qlikview is underway with user testing currently taking place. The application will provide managers with a single place to access core information about their people and will be rolled out over the coming months. My Benefits In March the Trust launched its My benefits intranet site, a one-stop-shop which enables people to see at a glance what the Trust offers in terms of core benefits, voluntary benefits, discounts and lifestyle benefits. The site, which includes an extensive question and answer section, can be viewed at http://source/ywl/mybenefits/voluntarybenefits/index.htm. Since launching the car salary sacrifice scheme on 3 February we have approved nine orders. The home electronics scheme continues to be very popular with a record number of orders in February following a payslip attachment in January. In February we approved 168 orders bringing the total to 442 since the scheme’s launch in November. Page 7 of 12 Trust Board - Public: 25 March 2015 Agenda No: 2.3 Paper No: 6a Developing market sensitive supplements The Trust has a number of hard to recruit specialist areas which are heavily reliant on agency staff. In order to promote greater workforce stability and reduce labour costs in these areas we are developing a framework to enable departmental managers to use a portion of the agency premia they currently incur to fund well designed market sensitive supplements such as golden hellos and recruitment & retention premia to make direct employment more attractive. The directorate organised a well-attended People & Organisation Development Forum on 26 February at which managers discussed both the design principles for the framework and how they might use market sensitive supplements in their areas. Employee Relations Advisory Service At the end of February the number of live cases logged with the Employee Relations Advisory Service was 187 of which 108 related to sickness absence, 51 to misconduct and 20 to poor performance. The length of time it takes to manage cases continues to drop with the average annual reduction in time from incident to disciplinary hearing at 45 per cent. Imperial Careers Microsite A new careers website to promote the roles on offer at the Trust was launched on 4 March. http://inspiringcareers.imperial.nhs.uk. The site is the result of a creative initiative to establish a unique recruitment brand for the Trust to help attract new candidates and showcase our organisation in the employment market. The focus of the brand is ‘inspiration’ and positions us as a forward-thinking organisation on a journey to transform healthcare through innovation in patient care, education and research. The brand was developed with input from recent recruits and colleagues from around the organisation. To give the site an authentic feel, the vast majority of the images used are photos taken of our people on location at our sites. The new website also highlights the benefits everyone receives when joining the Trust, alongside all the opportunities for continued learning, development and career progression. The recruitment team is working closely with the communications department to develop appropriate social media campaigns to attract people to the site. The Chairman’s Award There were a total of 14 submissions received for the Chairman’s Award on the theme of engaging for success. The Chairman and Director of P&OD will be visiting the four shortlisted teams in March and April. The communications team will video the shortlisted teams in preparation for annual award ceremony which is due to be held in June. HEALTH & SAFETY Health and Safety Policy Statement A draft health and safety policy statement has been developed by the head of health and safety and agreed in principle by Tracey Batten, Chief Executive. The policy is the cornerstone of the Trust’s health and safety management systems and is designed to demonstrate compliance with legal requirements and continual improvement in all areas of health and safety management. The policy will be available on the source and displayed on local health and safety noticeboards, communicated through relevant training and communication channels, and shall be kept under regular review. Page 8 of 12 Trust Board - Public: 25 March 2015 Agenda No: 2.3 Paper No: 6a Divisions/Corporate Functions Health and Safety Committees New Health and Safety Committees have been set up for divisions and corporate functions. These have been well attended and there is a definite appetite to improve health and safety management and compliance across the Trust. Main feedback from committee members was focused around quality of face to face training, risk assessments, health and safety induction & information for new starters, fire warden training and provisions of first aiders. All the above are in the Trust Health and Safety Action Plan and are also within the new Department Safety Coordinator training which starts March 2015. Joint Trade Unions Health and Safety Committee The First Joint Trade Unions Health and Safety Committee took place 23 Feb and was attended by representatives from Unite & Unison. Issues and discussions included risk assessments, accident reporting and investigations, safety culture and accountability. Meetings will continue every three months and information fed into Strategic Health and Safety Committee. The health and safety team requested more attendance and representation from the trade union side. Risk Profiling Exercise Risk profiles have been completed for: - Private Patients Estates Women’s and Children’s Investigative Sciences Surgery & Cancer Corporate Functions Medicine Directorate will be completed early March and the final summary will be compiled for ExCo and Strategic Health and Safety Committee. The top risks (e.g. fire, manual handling, slips/trips/falls etc.) will be included within the Trust Risk Register and monitored in accordance with the Trust governance processes. HSE Contact with Trust The Health and Safety Executive (HSE) has been in contact with the Trust regarding two separate incidents: 1. The Trust reported a dangerous occurrence to the HSE via RIDDOR on 17 February 2015 involving potential employee exposure to a hazardous biological fungus within the microbiology lab. HSE contacted Head of Health and Safety via telephone asking for more information regarding the incident and nature of exposure. Investigation undertaken and findings fed back to HSE. No further action likely. 2. HSE contacted Trust via email regarding unsafe vehicle movements in and around loading area at Hammersmith Hospital. Head of Health and Safety made contact with HSE Inspector to gather more information and provide assurances that the Trust took its health and safety responsibilities seriously. Task group set up (3 March) by Head of Health and Safety involving H&S managers, estates, security, stores and Imperial College advisors. Identified improvements that can be made to vehicle and pedestrian routes, in addition to reducing the overall risk. Project plan in progress and follow up meetings to take place. HSE will be updated on findings and progress. Page 9 of 12 Trust Board - Public: 25 March 2015 Agenda No: 2.3 Paper No: 6a Accidents 3 RIDDOR Reportable Accidents during February • SMH – Crushed finger in door – fractured figure • HH – Slipped on icy path – fractured arm • CXH – Oxygen cylinder fell on foot – fractured toe Total RIDDOR reportable accidents from April 2014 – Feb 2015 = 14 1 RIDDOR Reportable Dangerous Occurrence during February • CXH – Potential exposure to hazardous fungus – no injuries or illness Total RIDDOR reportable dangerous occurrences from April 2014 – Feb 2015 = 4 Violence and aggression: Violence and aggression continues to be the biggest cause of workplace incidents and further work is underway with security, wards and A&E to develop and implement prevention, intervention and control strategies. Health and Safety Recruitment • • • Damian London has joined as Health and Safety Manager (Strategy and Systems) Interviews have taken place for Health and Safety Manager (BioScience). We are currently interviewing for Head of Health and Safety position SAFE NURSE/MIDWIFE STAFFING In February, the Trust reported the following for the average staffing fill rate: - Above 95 per cent for registered nursing/midwifery staff during the day and night - Above 85 per cent for care staff during the day - Above 95 per cent for care staff during the night Please refer to Appendix 1 for ward level detail. The month of February saw an overall improvement in fill rate performance for registered nursing staff. During February there were some ward areas where the fill rate was below 85 per cent, particularly in relation to unregistered staff during the day. Key reasons for this are: - An increased vacancy rate for band 2-6 staff - Supplying staff from the division of surgery to support the additional capacity in medicine which has led to those staff needing to be back filled through bank and agency. - Small numbers of unfilled shifts in some areas e.g. Weston ward which has shown a bigger impact on the overall fill rate for that area. - Lack of availability of temporary staff to fill shifts, for example, on Aleck Bourne Ward. In Page 10 of 12 Trust Board - Public: 25 March 2015 Agenda No: 2.3 Paper No: 6a this area, any short term risk is mitigated by midwives undertaking the care required. Longer term, the implementation of birth rate plus and the associated increase in the establishment will address this issue. - An increase in the acuity of patients which has resulted in additional staff to support not only general acuity but also those patients who require specialling. For example on Joseph Toynbee, the fill rate for care staff during the day reflects shifts for one healthcare assistant (required for specialling a patient) that could not be filled. To mitigate any risk, other healthcare assistants on the ward were deployed to look after the patient. Going forward, a detailed review of quality and safety metrics and pathways for Joseph Toynbee ward will be undertaken led by the Medial Director’s office. On these occasions senior nurses have made decisions to mitigate any risk to patient safety by undertaking the following: - Reviewing staffing on a daily basis - Ward managers and sisters working clinically but are therefore not always able to supervise care. - Adjusting the occupancy to ensure patient needs are met by the staff that are available - Redeploying staff from other areas, where possible. Divisional Directors of Nursing have confirmed that the levels of care provided during February were safe, effective and caring. I. Finance Please see finance report. J. Education A scorecard for education is under development. This will be reported quarterly to ExCo, with the next report in May. K. Research Local Clinical Research Network: North West London has recruited 28,821 patients according to figures available in the Open Data Platform as of 12th March 2015. We are currently 19 per cent ahead of target and projected recruitment is estimated as 29,598 by the end of the year. Funding allocations have been confirmed by Department of Health and NW London has been awarded £12,552,503 based on average recruitment in the region over the last two years. This is a decrease of £273k from last year but was a smaller than expected decrease. We are awaiting confirmation on whether research capability funding will be awarded and expect notification within the next two months. We are currently working with our partners to produce annual business and operational plans. NIHR Imperial Biomedical Research Centre (BRC): Page 11 of 12 Trust Board - Public: 25 March 2015 Agenda No: 2.3 Paper No: 6a The formation of the new (virtual) Institute of Translational Medicine and Therapeutics (ITMAT) is underway to provide provide focused support for the acceleration of fundamental discoveries into improvements in human health and economic benefit. A full brief was presented to the AHSC Research Committee on 10 March 2015, and a call for project applications will be launched this week. The existing BRC Theme budgets have been mapped to the new Theme / ITMAT structure, within the 15/16 funding envelope provided by ICHT Finance. NHS Genomic Medicine Centre: Contract negotiations for initiating the Genomic Medicine Centre (GMC) are in the final stages. Following a site visit to ascertain operational readiness, the initial focus will be on rare diseases with cancer samples phasing in around May / June. Trust IT and Information Governance departments are engaged in establishment of the required GMC systems and the capital award has been confirmed at £802,000 for the GMC in 15/16. Performance in Initiating & Delivering Clinical Research Studies: The 2014/15 Q3 return was submitted to NIHR in January, measuring ICHT performance a) in initiating clinical trials within 70 days, and b) delivering to time and target. The data in the scorecard for Q3 is estimated. For a) we estimate performance approaching 70 per cent demonstrating continuing improved performance. For b) we expect to continue ‘topping the table’ of research-active large NHS Trusts. Our Q2 performance (recently validated by NIHR) confirms the upward trajectory of ICHT performance. ICHT also recruited more patients to NIHR Portfolio studies in 2014 compared to the previous year, and has increased the number of commercial studies hosted. Recommendation to the Board: The Board is asked to note the contents of this report. Page 12 of 12 February 2015 Monthly planned Nursing/Midwife staffing hours versus Nursing/Midwife staffing hours actually worked Appendix 1 Day Night Registered Nurses/Midwives Division Hospital Site Name Ward Name Medicine Medicine Medicine Medicine Medicine Medicine Medicine Medicine Medicine Medicine Medicine Medicine Medicine Medicine Medicine Medicine Medicine Medicine Medicine Medicine Medicine Medicine Medicine Medicine Medicine Medicine Medicine Medicine Medicine Surgery and Cancer/Clinical Haem Surgery and Cancer/Clinical Haem Surgery and Cancer/Clinical Haem Surgery and Cancer/Clinical Haem Surgery and Cancer/Clinical Haem Surgery and Cancer/Clinical Haem Surgery and Cancer/Clinical Haem Surgery and Cancer/Clinical Haem Surgery and Cancer/Clinical Haem Surgery and Cancer/Clinical Haem Surgery and Cancer/Clinical Haem Surgery and Cancer/Clinical Haem Surgery and Cancer/Clinical Haem Surgery and Cancer/Clinical Haem Surgery and Cancer/Clinical Haem Surgery and Cancer/Clinical Haem Surgery and Cancer/Clinical Haem Surgery and Cancer/Clinical Haem Surgery and Cancer/Clinical Haem Surgery and Cancer/Clinical Haem Surgery and Cancer/Clinical Haem Surgery and Cancer/Clinical Haem Women and Children's Women and Children's Women and Children's Women and Children's Women and Children's Women and Children's Women and Children's Women and Children's Women and Children's Women and Children's Women and Children's Women and Children's Charing Cross Hospital - RYJ02 Charing Cross Hospital - RYJ02 Charing Cross Hospital - RYJ02 Charing Cross Hospital - RYJ02 Charing Cross Hospital - RYJ02 Charing Cross Hospital - RYJ02 Charing Cross Hospital - RYJ02 Charing Cross Hospital - RYJ02 Charing Cross Hospital - RYJ02 Charing Cross Hospital - RYJ02 St Mary's Hospital (HQ) - RYJ01 St Mary's Hospital (HQ) - RYJ01 Hammersmith Hospital - RYJ03 Hammersmith Hospital - RYJ03 St Mary's Hospital (HQ) - RYJ01 Hammersmith Hospital - RYJ03 Hammersmith Hospital - RYJ03 St Mary's Hospital (HQ) - RYJ01 Hammersmith Hospital - RYJ03 Hammersmith Hospital - RYJ03 St Mary's Hospital (HQ) - RYJ01 Hammersmith Hospital - RYJ03 Charing Cross Hospital - RYJ02 St Mary's Hospital (HQ) - RYJ01 Hammersmith Hospital - RYJ03 St Mary's Hospital (HQ) - RYJ01 St Mary's Hospital (HQ) - RYJ01 St Mary's Hospital (HQ) - RYJ01 St Mary's Hospital (HQ) - RYJ01 Charing Cross Hospital - RYJ02 Charing Cross Hospital - RYJ02 Charing Cross Hospital - RYJ02 Charing Cross Hospital - RYJ02 Charing Cross Hospital - RYJ02 Hammersmith Hospital - RYJ03 Hammersmith Hospital - RYJ03 Hammersmith Hospital - RYJ03 Hammersmith Hospital - RYJ03 St Mary's Hospital (HQ) - RYJ01 St Mary's Hospital (HQ) - RYJ01 Hammersmith Hospital - RYJ03 Hammersmith Hospital - RYJ03 Charing Cross Hospital - RYJ02 Hammersmith Hospital - RYJ03 St Mary's Hospital (HQ) - RYJ01 St Mary's Hospital (HQ) - RYJ01 St Mary's Hospital (HQ) - RYJ01 Charing Cross Hospital - RYJ02 St Mary's Hospital (HQ) - RYJ01 Hammersmith Hospital - RYJ03 St Mary's Hospital (HQ) - RYJ01 St Mary's Hospital (HQ) - RYJ01 Queen Charlotte's Hospital - RYJ04 St Mary's Hospital (HQ) - RYJ01 Queen Charlotte's Hospital - RYJ04 St Mary's Hospital (HQ) - RYJ01 St Mary's Hospital (HQ) - RYJ01 St Mary's Hospital (HQ) - RYJ01 Queen Charlotte's Hospital - RYJ04 St Mary's Hospital (HQ) - RYJ01 St Mary's Hospital (HQ) - RYJ01 Queen Charlotte's Hospital - RYJ04 Hammersmith Hospital - RYJ03 10 North Ward 11 South Ward 4 South Ward 5 South Ward 5 West Ward 8 South Ward 8 West Ward 9 North Ward 9 South Ward 9 West Ward Almroth Wright Ward AMU C8 Ward Christopher Booth Ward Douglas Ward SR Dewardener Ward Fraser Gamble Ward Grafton Ward Handfield Jones Ward John Humphrey Ward Joseph Toynbee Ward Kerr Ward Lady Skinner Ward Manvers Ward Peters Ward Lewis Lloyd Samuel Lane Ward Thistlewaite Ward Witherow Ward 10 South Ward 6 North Ward 6 South Ward 7 North Ward 7 South Ward A6 CICU A7 Ward & CCU A8 Ward A9 Ward Albert Ward Charles Pannett Ward D7 Ward Dacie Ward Intensive Care CXH Intensive care HH Intensive Care SMH Major Trauma Ward Patterson Ward Riverside Valentine Ellis Ward Weston Ward Zachary Cope Ward Aleck Bourne 2 Ward Birth Centre QCCH Birth Centre SMH Edith Dare Postnatal Ward GRAND UNION WARD GREAT WESTERN WD Lillian Holland Ward Neo Natal NICU PICU QCCH labour Victor Bonney Ward Total Monthly Planned Staff Hours 1829.5 2667.5 1466 1757.5 2332.5 1682 1290.5 2630.5 1718.5 1288 1811 1243.5 1707.5 1870.25 1830.5 1351.5 1264 1101 1339.5 1310.5 1262 1441 1014 1391.5 1085 1356.67 1514 1525.75 1078.5 2053 2026.5 1219 1857 1779 3429.5 1994 1525.25 1451.8 1722.5 2345.5 1313 1532.5 4485.75 4094 3651.25 1764.5 1216.5 2832.5 2513.5 1443.5 2145 4203.25 875.5 966 2096.5 1911.5 2350 1124 3669.75 1909 3438.75 4098.45 1977.25 Total Monthly Actual Staff Hours 1717.5 2477 1412.5 1757.5 2206 1652.5 1288.32 2453.5 1649.5 1227.5 1742.5 1184.95 1627 1814.5 1742.5 1255.5 1145.25 1084 1278.8 1234 1207.5 1347.5 999.5 1391.5 1071.75 1316.67 1458.5 1502.08 1025 1885.5 1833 1134.17 1774 1639 3352.3 1926.67 1452.5 1359.8 1666 2199 1313 1510 4439.75 4065.91 3608.94 1600.5 1160 2288.8 2364.5 1381 2047.42 4065.19 875.5 944.5 2059 1729.5 2244 980.5 3663 1837.5 3045.25 3903.45 1898.73 Care Staff % Filled 93.88% 92.86% 96.35% 100.00% 94.58% 98.25% 99.83% 93.30% 95.90% 95.30% 96.20% 95.29% 95.20% 97.00% 95.19% 92.90% 90.61% 98.46% 94.50% 94.16% 95.68% 93.51% 98.57% 100.00% 98.78% 97.05% 96.33% 98.45% 95.04% 91.84% 90.45% 93.04% 95.53% 92.13% 97.75% 96.62% 95.23% 93.66% 96.72% 93.75% 100.00% 98.53% 98.97% 99.31% 98.84% 90.71% 95.36% 80.80% 94.07% 95.67% 95.45% 96.72% 100.00% 97.77% 98.21% 90.48% 95.49% 87.23% 99.82% 96.25% 88.56% 95.24% 96.03% Total Monthly Planned Staff Hours 391 460 943 0 851 1343.5 1064.5 925.5 920 816.5 1115.5 480.5 667 632.5 12 0 1262.75 963.67 979 768.5 838 957.5 333.5 644 674.5 693.5 655.5 779.08 682 702.5 640 636.5 712.5 771 0 387 747.5 437 1094.25 659 264 250.5 841 529 643.5 375 333.5 1377 653 276 621 1419.5 203 11.5 1203 0 241.5 446.5 136 299 0 782.75 477.75 Registered Nurses/Midwives Total Monthly Actual Staff Hours % Filled 391 368 836.5 0 736 1270 1025 828.5 759 782 920 402 665.5 471.5 12 0 1165.25 892.17 811.5 685.5 575 801 331.5 632.5 660.5 632.5 627.5 652.58 609.5 604.47 508.5 636.5 655.5 654 0 295 655.5 379.5 956.25 632.5 261.5 229.5 841 529 643.5 287.5 293.95 1234.5 515 276 506 935.33 195.5 11.5 1089 0 241.5 446.5 136 299 0 695.25 382 100.00% 80.00% 88.71% 100.00% 86.49% 94.53% 96.29% 89.52% 82.50% 95.77% 82.47% 83.70% 99.70% 74.55% 100.00% 100.00% 92.28% 92.58% 82.90% 89.20% 68.60% 83.66% 99.40% 98.21% 97.92% 91.20% 95.73% 83.76% 89.37% 86.05% 79.45% 100.00% 92.00% 84.82% 100.00% 76.23% 87.69% 86.84% 87.39% 95.98% 99.05% 91.62% 100.00% 100.00% 100.00% 76.67% 88.14% 89.65% 78.87% 100.00% 81.48% 65.89% 96.31% 100.00% 90.52% 100.00% 100.00% 100.00% 100.00% 100.00% 100.00% 88.82% 79.96% Total Monthly Planned Staff Hours 1034 2254 966 1598.5 1838.5 989 966 1920.5 966 644 1380 1082 1598.5 966 1713.5 1288 954.5 966 977.5 655.5 1104 1012 644 1391.5 644 896 1092 1081 632.5 1391.5 977.5 885.5 1299.5 943 3243 1702 1161.5 1115.5 966 1748 627 935 4351 4225.5 3554.5 1426 644 1311 1736.5 913 1851.5 3542 632.5 667 1633 1794 2024 644 3703 1943.5 3369.5 3565 920 Total Monthly Actual Staff Hours 1023.5 2196.5 931.5 1598.5 1769.5 954.5 931.5 1876.5 966 642.5 1357 978.5 1541 966 1690.5 1242 944.5 931.5 954.5 655.5 1092.5 989 644 1357 634 884.5 1080.5 1081 632.5 1355 954.5 875 1276.5 931.5 3192.5 1692.5 1012 1092.5 921 1736.5 627 913 4282 4225.5 3544.5 1413.5 633.5 1219 1656 913 1829 3458.92 632.5 644 1621.5 1667.5 1943.5 632.5 3691.5 1909 2944.17 3450.5 920 Care Staff % Filled 98.98% 97.45% 96.43% 100.00% 96.25% 96.51% 96.43% 97.71% 100.00% 99.77% 98.33% 90.43% 96.40% 100.00% 98.66% 96.43% 98.95% 96.43% 97.65% 100.00% 98.96% 97.73% 100.00% 97.52% 98.45% 98.72% 98.95% 100.00% 100.00% 97.38% 97.65% 98.81% 98.23% 98.78% 98.44% 99.44% 87.13% 97.94% 95.34% 99.34% 100.00% 97.65% 98.41% 100.00% 99.72% 99.12% 98.37% 92.98% 95.36% 100.00% 98.78% 97.65% 100.00% 96.55% 99.30% 92.95% 96.02% 98.21% 99.69% 98.22% 87.38% 96.79% 100.00% Total Monthly Planned Staff Hours 401 460 805 0 736 1046.5 966 310.5 999 931.5 814.4166667 402.5 644 322 34.5 0 1057.5 644 654.75 769.75 655.5 701.5 632.5 644 345 736 655.5 598 885.5 80.5 655.5 115 678.5 368 0 356.5 262.5 391 1115.5 644 297 0 506 184 460 345 322 552 483 11 701.5 1288 322 276 644 0 299 322 92 253 0 644 287.5 Total Monthly Actual Staff Hours % Filled 389.5 448.5 782 0 690 1021.17 943 309 976 931.5 814.42 379.5 586.5 322 34.5 0 1034 644 654.75 746.75 621 701.5 631.75 621 333.5 736 655.5 563.5 851 69 644 115 644 320 0 310.5 239.5 391 1092.5 620 295.09 0 506 172.5 460 310.5 322 552 425.5 0 690 1180.48 310.5 276 644 0 299 322 92 253 0 620 276 97.13% 97.50% 97.14% 100.00% 93.75% 97.58% 97.62% 99.52% 97.70% 100.00% 100.00% 94.29% 91.07% 100.00% 100.00% 100.00% 97.78% 100.00% 100.00% 97.01% 94.74% 100.00% 99.88% 96.43% 96.67% 100.00% 100.00% 94.23% 96.10% 85.71% 98.25% 100.00% 94.92% 86.96% 100.00% 87.10% 91.24% 100.00% 97.94% 96.27% 99.36% 100.00% 100.00% 93.75% 100.00% 90.00% 100.00% 100.00% 88.10% 0.00% 98.36% 91.65% 96.43% 100.00% 100.00% 100.00% 100.00% 100.00% 100.00% 100.00% 100.00% 96.27% 96.00% Appendix 2 Dementia Care and CQUIN at Imperial – Supporting Carers of Patients with Dementia The Dementia Care Team has been in place in the Trust since December 2012, primarily to ensure Imperial College Healthcare NHS Trust (ICHT) meets the requirements dementia CQUIN (Commissioning for Quality and Innovation) but also to improve dementia care across the Trust. Imperial College Healthcare NHS Trust has signed up to the Dementia Action Alliance to signify its strong commitment to improving the lives of people with dementia. To support this aim and meet the requirements of one of this year’s CQUIN indicators, the Dementia Care Team has implemented a strengthened dementia training programme across the Trust. Supporting Carers of People with Dementia There are four national CQUIN goals for 2014/15. The national Dementia CQUIN goal consists of 3 indicators, the details and requirements of these indicators are as follows: 1. Find, Assess, Investigate and Refer (FAIR): this indicator is a composite of dementia screening, risk assessment and onward referral for specialist diagnosis for patients aged 75 years and over admitted as an emergency (all elements have a 90% target) 2. Clinical Leadership: Providers must confirm a named lead clinician and a planned training programme for dementia to be delivered in-year. 3. Supporting Carers of People with Dementia: This indicator requires the completion of a monthly audit of carers to test whether they feel supported. The content of the audit is to be agreed with local commissioners. Findings from these audits are to be reported to the Board two times in the year. To meet the requirements of the third indicator, the Dementia Care Team, with input from stakeholders both internal and external to the Trust, has devised an audit questionnaire to be given to carers of patients with dementia at least 24-48 hours prior to discharge. Audit of Carers of Patients with Dementia The audit is currently being piloted on five wards (one admission ward, three care of the elderly wards and one rehabilitation ward) and is to be rolled out to other wards once established. The questionnaire consists of five questions and can be completed either alone, face-toface, or over the phone. The questions focus, as required, on whether the carer felt supported during the stay in hospital of the patient for whom they are caring, and whether Page 1 of 6 Appendix 2 they received sufficient information regarding patient diagnosis, physical health and discharge care planning. There is also a ‘free text’ box at the end of the questionnaire where carers can provide additional comments. The audit responses and findings will be collated monthly and reported to the board biannually. A total of eighty responses have been collected so far. A copy of the questionnaire is attached at the end of this report. Support for Carers from the Dementia Care Team Carers Drop in Sessions The Dementia Care Team have been running drop in sessions for carers across all three sites. The sessions at Charing Cross and Hammersmith have been running since early January 2015, and the Hammersmith sessions have been running since end of February 2015. The sessions are run weekly, in private offices, where carers of people with dementia can come and see a specialist dementia nurse for advice, support and signposting. There has been 9 attendees across the sites, and all have felt supported and spoke positively of the service. Carers Passports Our Trust offers all Carers, a passport. The carer’s passport is a scheme which hopes to improve the level of care provided to patients who stay in hospital and makes life easier for them during their stay. Staff are expected to give carers a card when their loved one is admitted to the ward. The passport enables carers to have access to the person they care for at any time during the day or night and also outside of conventional hospital visiting hours. The holder of a Carer’s Passport should be seen as a partner in the planning and delivery of care by the Trust Staff. Patients who are likely to have carers include those with learning disabilities, dementia and physical disabilities. Other people who may be appropriate could be relatives of those receiving palliative care. As a part of this scheme, our Trust is supporting ‘John’s Campaign’ (www.johnscampaign.org) who are campaigning for the right to stay with people with dementia in hospital. Page 2 of 6 Appendix 2 Pre-assessment Clinic Support The Dementia Care Team has created Dementia Packs that are handed out to people with dementia and their carers during pre-assessment clinics. These packs have information on what can happen following an operation for people with dementia. There is support and advice Initial findings The monthly breakdown of responses is presented in the table below. 58% of surveys were completed by telephone, 30% were completed face-to-face and for the remaining 12% the carer completed the questionnaire alone. Year 2013 2014 Grand Total Month October November December January February March April May June July August September October November December Total Responses 9 3 11 9 6 9 12 3 0 6 5 2 1 1 3 80 The key question in relation to the CQUIN indicator is question 2: During the patient’s admission in hospital, do you feel that you have been supported in relation to their existing diagnosis of dementia? 62% of recipients said that yes, they felt supported. The responses to this question are presented in the graph below. Of the 80 respondents, 47 reported that health professionals (HCP) spoke to them about the patient’s diagnosis of dementia (question 3). Of those 47 respondents, 37 stated that they had received sufficient information. 51% of respondents stated they had received enough information in relation to how patients’ physical health impacts on their dementia (question 4). In terms of discharge planning and onward care, 60% (or 48 out of 80) of carers surveyed stated they were involved in this process and provided with information about services (question 5). Page 3 of 6 Appendix 2 Proportion of carers who felt supported 9% 7% Yes No 23% 61% Don’t Know No Opinion Of those carers who felt supported, 74% (or 35 out of 47 respondents) stated they had been spoken to by a health professional in relation to the patient’s dementia, whereas of the 18 respondents who stated they did not feel supported, 5(or 28%) had been spoken to by a health professional. In addition to the five core questions in the audit questionnaire, respondents are also given the opportunity to provide additional comments. A selection of these comments is presented below. “This is a very difficult time. It's hard to know what to think with all the decisions that need to be made” “Excellent care at hospital. I’m learning from the Nurses/Healthcare staff how to manage agitation in my relative with dementia by observing them” “Staff are very patient and try to keep her [the patient] calm” “I found the nurses to be helpful, they showed empathy on Witherow ward” “Really good with him. Brilliant. They understand what he's got. He likes the staff and gets on with them” “Not enough staff to look after all these people” Where appropriate, any ‘negative’ comments that are received are being relayed to the services in question. Page 4 of 6 Appendix 2 Next steps The Dementia Care Team has developed a Carer’s Pack consisting of useful information for carers of people with dementia. This pack is now available on The Source for staff to access and also available on the Trust’s website. A hard copy can also be purchased through the Trust eProcurement program. The Dementia Care Team will work to increase the amount of Carers Questionnaires being completed. Unfortunately due to changes in staffing (junior doctors rotating) the collection of questionnaires has been sporadic. This will be addressed in the following ways: • • • The Dementia Care Team will liaise with Ward Managers and Therapists, and gain support from the CQUIN team to increase the amount collected. The Dementia Care team will be working with The Alzheimer’s Society Side by Side Project which will be appointing a Community Support Manager within the trust; the team will ask the community support manager to provide some support for the carer’s audit. The team have developed an annual benchmark tool to evaluate dementia care in the trust and this includes a carer’s questionnaire which has to be completed by two carers. It is envisaged that this will also increase the number of responses. The audit will continue throughout the year, with subsequent findings being reported to the Trust Board on a twice-yearly basis. Conclusion Collecting the Carer’s Questionnaires continues to be a challenge, however the new initiatives outlined above should increase the number of carers feeding back about care. The Dementia Care team have significantly increased the support available to carers of patients with dementia through the initiatives outlined in this report and early signs show that this has been very well received by carers. Page 5 of 6 Appendix 2 The Audit Questionnaire Page 6 of 6 Trust Board - Public: 25 March 2015 Agenda No: 2.3 Paper No: 6b Trust Board - Public Agenda Item 2.3 Title Integrated Performance Scorecard Report for Monitoring Report Author Steve McManus, Chief Operating Officer Responsible Executive Director Steve McManus, Chief Operating Officer Executive summary: This is a regular report to the Trust Board that outlines the key headline performance indicators from Monitor, CQC, and TDA frameworks as well as a number of contractual indicators as well as some that have internally generated. This report is designed to be reviewed in conjunction with the Operational Report. Recommendation to the Board: The Board is asked to note the contents of the Integrated Performance Scorecard. Trust strategic objectives supported by this paper: To achieve excellent patient experience and outcomes, delivered efficiently and with compassion. • To educate and engage skilled and diverse people committed to continual learning and improvement. • As an Academic Health Science Centre, to generate world leading research that is translated rapidly into exceptional clinical care. • To pioneer integrated models of care with our partners to improve the health of the communities we serve. Page 1 of 2 Trust Board - Public: 25 March 2015 Agenda No: 2.3 Paper No: 6b Title : Integrated Performance Scorecard Purpose of the report: The Trust Board is asked to note the contents of the Integrated Performance Scorecard. The Integrated Performance Scorecard brings together finance, people and quality metrics. The quality metrics are subdivided into the 6 quality domains as defined in the Trust Quality Strategy. The indicators for each domain have been specifically selected and agreed by the quality domain leads as those that the Trust Board should be sighted on. Regulatory reforms There are no new regulatory reforms for the Board to note. Leading/lagging indicators Leading indicators are those where future performance may be affected e.g. patients referred via the two week wait suspected cancer route will be reported under the 62 day standard if diagnosed with cancer, or VTE risk assessment rates could have a direct impact on clinical outcomes. Lagging indicators are those where the final outcome is reported e.g. mortality rates or 30 day readmission rates. Source framework The source framework is cited for each of the published indicators. This is highlighted within the scorecard e.g. Monitor, CQC, NTDA, contractual or internally generated. Recommendation to the Board: The Board is asked to note the contents of the Integrated Performance Scorecard. Page 2 of 2 Trust Board Performance Report Report Period Month 11 (to end February 2015) Trust Board Wednesday 25th March 2015 Table of Contents Summary Page 5 Mortality Page 6 Patient Safety 1.2 Infection Control, Incidents, Safety Thermometer and VTE Page 7 Feedback (Friends and Family Test, Complaints, Compliments, Environment, Patient Experience and Safeguarding) Page 8 Effectiveness 3.1 Stroke care Page 9 Efficiency 4.1 Productivity Page 10 Timeliness 5.1 Elective Access, A&E & Other Access Measures Page 11 Timeliness 5.2 Cancer Access Waiting Times Page 12 Dementia, Mixed Sex Accommodation and Safeguarding Training Levels Page 13 People Domain Overview Summary Page 14 People 7.1 Turnover,Sickness and Training Compliance Page 15 People 7.2 Appendix Page 16 People 7.3 Staffing: Nursing, midwifery and care staff Page 17 People 7.4 Health and Safety Compliance Page 18 Finance Domain Overview Summary Page 19 Finance 8.1 Turnover,Sickness and Training Compliance Page 20 Finance 8.2 Activity performance against plans commissioned by NWL CCG Page 21 Finance 8.2 Activity performance against plans commissioned by Non NWL CCG Page 22 Finance 8.3 Activity performance against plans commissioned by NHSE Page 23 Finance 8.4 Activity performance against plans commissioned by OTHER Page 24 Research and Education Domain Overview Summary Page 25 Reasearch and Development Compliance Page 26 Finance Summary Research and Education Glossary Page 4 Quality Domain Overview Summary People Summary Finance CQC Quality Summary Equity 6.1 Workforce Page 3 Patient Safety 1.1 Patient Centeredness 2.1 Quality Principles Shadow Foundation Trust Performance Framework Research and Education Summary Research and Education 9.1 Definitions 12.1 Definitions Page 27-33 Shadow Foundation Trust Performance Framework Quality - Month 11 (February 2015) Finance - Continuity of Services Risk Rating - Month 11 (February 2015) 79.5% in month ; 76% YTD 62 DW Cancer is reported one month in arrears 18Wa 18Wn 31 DW Capital Servicing Capacity Liquidity Ratio 2WWUR 18Wi Turnover C-Diff A&E4h LAS 2014/2015 Area Finance Indicator Threshold 3 3 Capital Servicing Capacity Liquidity Ratio Continuity of Services Risk Rating Access 90% 95% 92% 93% 93% 96% 98% 94% 94% 90% 85% 95% 18 weeks referral to treatment - admitted 18 weeks referral to treatment - non admitted 18 weeks referral to treatment - incomplete pathway 2 week wait from referral to date first seen all urgent referrals 2 week wait from referral to date first seen breast cancer 31 days standard from diagnosis to first treatment 31 days standard to subsequent Cancer Treatment - Drug 31 days standard to subsequent Cancer Treatment - Radiotherapy 31 days standard to subsequent Cancer Treatment - Surgery 62 day wait for first treatment from NHS Screening Services referral 62 day wait for first treatment from urgent GP referral A&E maximum waiting times 4 hours Outcomes 65 Clostridium Difficile (C-Diff) Post 72 Hours Governance Risk Rating * Quarter’s failing because one month has failed Pg 3 Threshold met Some areas of concern Threshold NOT met Data not available Trust Board Report Month 11 Q1 Performance to date 14/15 Q2 Q3 3 4 3 4 QTD 3 4 3 4 4 4 88.87% 94.66% *92.15% 93.70% 88.40% 97.40% 99.60% 97.60% 96.90% 91.00% 85.40% 95.86% 25 83.88% 94.35% 87.14% 94.90% 93.10% 97.60% 100.00% 99.30% 95.30% 93.90% 85.20% 95.47% 20 83.97% 91.59% 81.41% 94.60% 94.80% 97.00% 100.00% 100.00% 95.70% 88.40% 85.40% 91.17% 15 85.87% 88.43% 83.18% 93.00% 94.00% 96.00% 100.00% 100.00% 94.60% 96.30% 77.10% 91.81% 10 Qtr 1 15/16 Forecast Qtr 2 15/16 Qtr 3 15/16 Care Quality Commission (CQC) Rating as at December 2014 Qualitative Intellegence - Whistle blowing Alerts People: Staffing - Composite risk rating of ESR items relating to staff turnover CQC Safety: Never Events Safety: Avoidable Infections - Cdiff 79.5% in month ; 76% YTD People: Staff Survey - KF10 Percentage staff receiving health & safety training in the last 12 monts Safety: Avoidable Infections - MRSA Safety: Deaths in low risk diagnostic groups Effectiveness: PROMS - PROMS Knee - Compositeof knee related PROMS indicators (01-Apr-13 to 01-Mar-14) LAS Safety: Patient Safety Incidents Proportion of reported patient safety incidents that are harmful Patient Centredness: Overall experience Safety: Central Alerting System (CAS) Safety: Reporting culture Consistency of reporting to NRLS Safety: Venous Thromboembolism Safety: Maternity and Women's health - Maternity outlier alert Safety: Mortality Trust - Summary Hospital Mortality Indicator (SHMI) Safety: Mortality Trust - Hospital Standardised Mortality Rate (HSMR) No evidence of Risk Pg 4 Trust Board Report Month 11 Risk Elevated Risk Quality Domain Overview Hospital Standardised Mortality Rate (HSMR) Safety Patient Centredness FFT – Inpatient (response rate) Summary Hospital Mortality Indicator (SHMI) VTE Risk Assessments Safeguarding Referrals FFT – A&E (response rate) Harm Free Care (Safety Thermometer) 79.5% in month ; 76% YTD Number of Dr Foster alerts PEX – Respect and dignity question Serious Incidents Deaths in low risk diagnostic groups Never Events Turnover FFT – Maternity (response rate) PLACE – annual score MRSA Number of complaints received by the Trust LAS CDiff Domain Lead: Steve McManus Effectiveness Efficiency Theatre Utilisation Rate Hospital Appointment Cancellations (hospital instigated) Average Length of Stay - Elective DNA - follow-up appointment* Stroke : Number of patients scanned within 1 hour of arrival at hospital Stroke: Number of potentially eligible patients thrombolysed Average Length of Stay - Non Elective DNA - first appointment* Day Case Rate Pre Op Length of Stay Post Op Length of Stay Day of Surgery Admission Timeliness 18 weeks referral to treatment non admitted 62 day wait for first treatment from urgent GP referral 62 day wait for first treatment from NHS screening services referral A&E maximum waiting times 4 hours Percentage Cancelled Operations rebooked within 28 days 31 days standard to subsequent Cancer Treatment Radiotherapy Pg 5 Equity Dementia : Find, assess, refer Patients detained under the MH Act 18 weeks referral to treatment incomplete pathway 31 days standard to subsequent Cancer Treatment - Surgery 31 days standard to subsequent Cancer Treatment - Drug 18 weeks referral to treatment admitted 2 week wait from referral to date first seen breast cancer Percentage Non Clinical Cancelled Operations 2 week wait from referral to date first seen all urgent referrals Threshold met Have Data - NO Threshold Threshold NOT met Data not available Trust Board Report Month 11 Mixed sex accommodation Female Genital Mutilation Safeguarding training levels for adults Safeguarding Training Levels Children Trust - Level 3 Safeguarding Training Levels Children Trust - Level 2 Safeguarding Training Levels Children Trust - Level 1 Quality Principles - Patient Safety 1.1 Mortality 2013/2014 Indicator Leading Frequency Mortality Indicators Hospital Standardised Mortality Rate (HSMR)* Summary Hospital Mortality Indicator (SHMI)* - Quarterly Quarterly Performance in 2014/15 Forecast Qtr2 Q1 Q2 Q3 Q4 70.63 70.30 70.97 67.17 80.80 70.30 0.00 73.10 0.00 2014/15 Q3 2014/15 Q4 Qtr 2 14/15 YTD Qtr 3 14/15 Qtr 4 14/15 Source Framework CQC CQC * Dr Fosters data is 4 months in arrears Indicator Leading Frequency Dr Foster Alerts Number of Dr Foster mortality alerts* Deaths in low risk diagnostic groups Number of deaths in low risk diagnostic groups* Performance in Qtr2 Oct-13 13/14 Current Month Oct-14 Performance Current 2014/15 2014/15 Q1 Q2 Qtr 2 14/15 YTD Forecast Qtr 3 14/15 Qtr 4 14/15 Source Framework - Quarterly 1 11 2 3 4 2 0 9 CQC - Quarterly 2 9 2 7 6 2 0 15 CQC * Dr Fosters data is 4 months in arrears Summary Hospital Mortality Indicator (SHMI) 95 90 85 80 75 70 65 60 Relative risk Relative risk Hospital Standardised Mortality Rate (HSMR) 100 95 90 85 80 75 70 65 60 QtrYear Actual Shelford QtrYear London Number of deaths in low risk diagnostic groups (February 2014 - October 2014 ) 12 12 10 10 8 8 Relative risk Relative risk Dr Foster Mortality Alerts (February 2014 - October 2014 ) 6 4 6 4 2 2 0 0 Month Actual Actual Month Actual Relative risk refers to the ratio of observed deaths divided by the risk adjusted expected deaths in a given metric, multiplied by 100. On this basis, a figure of 100 represents the NHS England average for a metric. Anything lower than 100 means the relative risk is lower than expected. than expected. Deaths in low risk diagnosis group is the relative risk for the combined 200 diagnosis groups that have low mortality outcomes. In Hospital Mortality - "various" conditions covers the combined mortality risk for similar diagnosis groups in a specialty (e.g. vascular, haematological). This metric has been developed to replicate the CQC composite mortality indicators wherever possible. This is based on the diagnosis of admission. Dr Foster rebases data every 12 months to ensure that performance data reflects a trust's relative performance against NHS standards (HSMR, or Relative Risk for instance). This remodelling is done against the last full financial year of data. This means that if the performance across the NHS for stroke mortality improves, this may mean rebasing makes a trusts stroke relative risk rises. Pg 6 Trust Board Report Month 11 Quality Principles - Patient Safety 1.2 Infection Control, Incidents, Safety Thermometer and VTE Performance in 2013/14 Indicator Leading Frequency Infection Control* MRSA Clostridium Difficile (C-Diff) Post 72 Hours Incidents* Never Events Serious Incidents Safety Thermometer* Harm Free Care (Safety Thermometer) VTE VTE Risk Assessments Feb-14 Qtr4 Current Month Q1 Q2 Q3 Q4 YTD Source Framework 0 0 2 11 2 8 3 25 0 20 3 15 2 10 8 70 TDA, CQC Mon, TDA, CQC - Monthly Monthly 0 n/a 0 11 1 26 0 19 2 20 1 38 0 47 0 34 3 139 TDA, CQC TDA, CQC - Monthly >90% 97.3% 96.0% 96.70% 95.78% 96.87% 96.21% 96.56% 96.34% TDA, CQC Monthly >95% 96.9% 96.8% 95.30% 95.92% 97.02% 98.56% 96.33% CQC, Contractual Month98.56% 11 data not yet available Clostridium Difficile (C-Diff) 2 1 0 Actual Serious Incidents 20 12 10 Serious Incidents 3 Clostridium Difficile (C-Diff) Post 72 Hours 8 6 4 2 0 100% % patients harm free 3 2 1 0 Actual Threshold 5 Month Threshold Harm Free Care Never Events 4 10 Actual Month Threshold 5 15 0 % patients VTE risk assessed MRSA Qtr 2 15/16 0 <65 p/a 4 Never Events Qtr 1 15/16 Monthly Monthly MRSA Pg 7 Qtr 4 14/15 - 5 Month Forecast Threshold * Includes Private Patients Month Performance Current Year To Date 95% 90% 85% Month Actual Trust Board Report Month 11 Shelford London Threshold 99% Actual VTE Risk Assessment 98% 97% 96% 95% 94% Month 11 data not yet available 93% Month Actual Threshold Quality Principles - Patient Centredness 2.1 Feedback (Friends and Family Test, Complaints, Compliments, Environment, Patient Experience and Safeguarding) Performance in 2013/14 Indicator Leading Frequency Friends & Family Test Inpatients Net Promoter Score (FFT) Inpatients Net Promoter Response Rate A&E Net Promoter Score (FFT) A&E Net Promoter Response Rate Maternity Net Promoter Score (FFT) Maternity Net Promoter Score Response Rate Complaints & Compliments* Number of complaints received Environment PLACE - Cleanliness PLACE - Food PLACE - Privacy, Dignity & Well being PLACE - Facilities Patient Experience (LQ36) Have you been treated with dignity and respect by staff on this ward? Safeguarding Safeguarding Adults : Referrals per month Performance Current Year To Date Qtr 4 14/15 Forecast Qtr 1 Qtr 2 15/16 15/16 Threshold Feb-14 Qtr4 Current Month Q1 Q2 Q3 Q4 YTD >50 >25% >50 >15% >50 >15% 69 44.97% 66 30.04% n/a n/a 69 32.30% 64 18.83% n/a n/a 71 44.66% 48 15.10% 46 44.00% 71 41.86% 56 22.10% 62 31.47% 71 39.00% 50 17.57% 42 24.87% 69 41.00% 50 17.60% 64 28.00% 70 42.55% 50 15.35% 50 45.70% 70 40.97% 51 18.41% 55 31.31% Contractual Monthly Monthly Monthly Monthly Monthly Monthly Source Framework Contractual Contractual Contractual - Monthly <100 81 223 101 313 293 309 196 1111 CQC - Annually Annually Annually Annually >95% >84% >82% >83% 99.03% 80.91% 88.60% 89.22% Aug-13 Aug-13 Aug-13 Aug-13 98.19% 77.75% 87.26% 88.18% n/a n/a n/a n/a 98.19% 77.75% 87.26% 88.18% n/a n/a n/a n/a n/a n/a n/a n/a 98.19% 88.18% 77.75% 87.26% tbc tbc tbc tbc - Monthly >85% 96.41% 96.38% 95.4% 96.28% 97.12% 96.14% 95.68% 96.36% CQC - Monthly n/a 37 105 45 109 134 105 90 438 CQC 75 45% 40% 65 35% 60 30% 55 25% 50 20% 45 15% 40 10% 35 5% 30 0% 75 30% 70 65 25% 60 20% 55 50 15% 45 10% 40 5% 35 30 0% Threshold Number of referrals Safeguarding Adults : Referrals per month Pg 8 45% 70 40% 65 35% 60 30% 55 25% 50 20% 45 15% 40 10% 35 5% 30 0% Actual Trust Board Report Month 11 100% 95% Score Number of complaints Annual score Actual 50% 75 Patient Experience : Respect & Dignity 100% 95% 90% 85% 80% 75% 70% 60 50 40 30 20 10 0 Month Maternity Net Promoter Response Rate (FFT) (commenced Oct 13) 80 Annual P.L.A.C.E. scores Number of complaints 140 120 100 80 60 40 20 0 Month 35% Response rate (blue bar) 70 A&E Friends and Family Test Results 80 Response rate (blue bar) Net promoter Score (Orange Line) 50% Net promoter Score (Orange Line) Inpatient Friends and Family Test Results 80 Response rate (blue bar) Net promoter Score (Orange Line) * Includes Private Patients 90% 85% 80% 75% 2014 Actual 2013 Actual Month Actual Threshold Quality Principles - Effectiveness 3.1 Stroke care Performance in 2013/14 Indicator Leading Frequency Stroke Care Stroke Care : % of patients scanned within 1 hr of arrival at hospital Stroke Care : % of potentially eligible patients thrombolysed within 45 Minutes - Monthly Monthly Threshold Feb-14 Qtr4 >50% >90% n/a n/a n/a n/a 69.60% 100.00% Q2 Q3 Q4 YTD 71.99% 89.26% 67.55% 89.68% 65.83% 100.00% 71.00% 88.89% 68.92% 92.24% Forecast Qtr 1 Qtr 2 15/16 15/16 Source Framework CQC CQC 100% % of patients % of patients Q1 Qtr 4 14/15 Stroke Care : % of potentially eligible patients thrombolysed within 45 Minutes Stroke Care : % of patients scanned within 1 hr of arrival at hospital 100% 80% 60% 80% 60% 40% 40% Month Actual Threshold Pg 9 Performance Current Year To Date Current Month Trust Board Report Month 11 Month Actual Threshold Quality Principles - Efficiency 4.1 Productivity Performance in 2013/14 Indicator Leading FrequencyThreshold Productivity Theatre Utilisation Rate Average Length of Stay - Elective Average Length of Stay - Non Elective Pre Op Length of Stay* Post Op Length of Stay* Day of Surgery Admission* Day Case Rate DNA - first appointment DNA - follow-up appointment Hospital Appointment Cancellations (hospital instigated) Monthly Monthly Monthly Monthly Monthly Monthly Monthly Monthly Monthly Monthly >81% <3.5 <4.5 tbc tbc tbc >80% <12.31% <11.33% tbc Performance Current Year To Date Feb-14 Qtr4 Current Month Q1 Q2 Q3 Q4 YTD 75.77% 2.84 4.15 0.70 3.95 87.98% 75.06% 14.27% 13.67% 2.12% 76.50% 2.93 4.25 0.68 4.22 88.05% 77.52% 14.56% 14.05% 2.12% 76.44% 3.89 4.92 0.90 5.40 88.23% 78.72% 13.12% 12.54% 1.14% 75.48% 2.62 4.35 0.83 4.30 87.98% 73.37% 15.87% 17.30% 1.31% 75.62% 3.24 4.42 0.70 4.50 89.00% 80.24% 16.80% 17.26% 1.11% 73.91% 3.58 4.74 0.90 5.07 89.07% 79.05% 14.76% 13.80% 1.03% 75.62% 3.78 4.89 0.85 5.50 88.67% 79.57% 13.55% 12.75% 1.08% 75.11% 3.23 4.56 0.82 4.78 88.68% 77.97% 15.87% 15.52% 1.14% Qtr 4 14/15 Forecast Qtr 1 Qtr 2 15/16 15/16 Source Framework CQC Internal Internal Define Define Define CQC Internal Internal Internal * London and Shelford Averages obtained from Dr Fosters - hence 3 months in arrears * Excludes 49 potentially incorrectly recorded admission which will be validated by the Divisions ** Excludes 33 potentially incorrectly recorded admission which will be validated by the Divisions 80% 78% 76% 74% 72% 70% 68% Actual Threshold Month Post Op Length of Stay Day of Surgery Admission 92% 1.2 5.0 90% 4.0 88% 3.0 86% 0.6 0.4 0.2 0.0 80% 0.0 60% 40% 20% 0% Actual Threshold DNA - Follow-Up Appointment DNA - First Appointment 80% 20% 15% 10% 5% 0% Month Trust Board Report Month 11 Hospital Appointment Cancellations (Hospital Instigated) 20% 15% 10% 5% 0% Actual Threshold Month Actual Shelford London Month DNA - Follow-Up Appointment 25% 100% Month Actual Shelford London Month DNA - First Appointment Day Case Rate 84% 82% 1.0 Actual Shelford London Month Pg 10 2.0 Actual Thresh… Hospital Appointment Cancellations 0.8 % 6.0 1.0 Actual Threshold Month 1.4 Post Op Length of Stay Pre Op Length of Stay 5.2 5.0 4.8 4.6 4.4 4.2 4.0 3.8 3.6 Actual Threshold Month Pre Op Length of Stay Day Case Rate Average Length of Stay - Non Elective 4.5 4.0 3.5 3.0 2.5 2.0 1.5 1.0 0.5 0.0 Average Length of stay - Elective Theatre Utilisatino Rate Average Length of Stay - Elective *Excluding SIC 1&2 data for July to February 2015 Average Length of stay - Non Elective Theatre Utilisation Rate 82% 2.5% 2.0% 1.5% 1.0% 0.5% 0.0% Month Actual Quality Principles - Timeliness 5.1 Elective Access, A&E & Other Access Measures Performance in 2013/14 Frequency Threshold Feb-14 Qtr4 - Monthly Monthly Monthly >90% >95% >92% 91.3% 95.2% 94.6% 90.8% 95.3% 94.6% 85.87% Month 11data not 88.43% yet available 83.18% 88.87% 94.66% 92.15% 83.88% 94.35% 87.14% 83.97% 91.59% 81.41% 85.87% 88.43% 83.18% 85.60% 93.02% 86.53% Monthly >95% 95.9% 95.9% 92.58% 95.86% 95.47% 91.17% 91.81% 93.74% Monthly Monthly <5% <0.8% 3.4% 1.4% 10.0% 1.3% 12.30% 0.82% 5.73% 0.69% 5.19% 1.15% 19.32% 1.10% 8.97% 0.91% Elective Access 18 weeks referral to treatment - admitted 18 weeks referral to treatment - non admitted 18 weeks referral to treatment - incomplete pathway A&E Access A&E maximum waiting times 4 hours Other Access Measures Percentage Cancelled Operations rebooked within 28 days Percentage Non Clinical Cancelled Operations 18 week referral to treatment - Non Admitted 18 week referral to treatment - Admitted 98% 96% 94% 92% 90% 88% 86% 84% 82% 80% 96% YTD 94% 92% 90% 88% 86% 84% 97% 95% 93% 91% 89% 87% Trust Board Report Month 11 TDA, CQC Define 94% 92% 90% 88% 86% 84% 80% Actual Mon, TDA, CQC 96% Actual Shelford Avg Threshold Month Percentage Cancelled Operations rebooked within 28 days 99% Mon, TDA, CQC Mon, TDA, CQC Mon, TDA, CQC 98% 82% Month Source Framework 18 week referral to treatment - Incomplete pathway 80% 25% Forecast Qtr 4 Qtr 1 Qtr 2 14/15 15/16 15/16 100% 82% Percentage Cancelled Operations rebooked within 28 days A&E maximum waiting times 4 hours Q4 Month 11 data not yet available 98% Actual Shelford Avg Threshold 85% Pg 11 Q3 100% A&E maximum waiting times 4 hours (Type 1 data only) Month Q2 18 week referral to treatment -Non Admitted 18 week referral to treatment - Admitted 100% Month Month 19.3% 11 data not yet available 1.1% Q1 18 week referral to treatment - Incomplete pathway Leading Actual Shelford Avg Threshold Percentage Non Clinical Cancelled Operations Percentage Non Clinical Cancelled Operations Indicator Performance Current Year To Date Current Month 2.0% Month 11 data not yet available 1.8% 20% 15% 10% 5% 0% 1.6% 1.4% 1.2% 1.0% 0.8% 0.6% 0.4% 0.2% 0.0% Month Actual Month Actual Threshold Quality Principles - Timeliness 5.2 Cancer Access Waiting Times Performance in 2013/14 Cancer Access Waiting Times 2 week wait from referral to date first seen all urgent referrals 2 week wait from referral to date first seen breast cancer 31 days standard from diagnosis to first treatment 31 days standard to subsequent Cancer Treatment - Drug 31 days standard to subsequent Cancer Treatment - Radiotherapy 31 days standard to subsequent Cancer Treatment - Surgery 62 day wait for first treatment from NHS screening services referral 62 day wait for first treatment from urgent GP referral - Monthly Monthly Monthly Monthly Monthly Monthly Monthly Monthly 2 week wait from referral to date first seen 2 week wait from referral to date first seen all urgent referrals 97% 96% 95% 94% 93% 92% 91% 90% 89% 88% Threshold Jan-14 Q3-13 >93% >93% >96% >98% >94% >94% >90% >85% 98.6% 98.0% 97.7% 100.0% 100.0% 96.0% 91.2% 65.6% 95.8% 94.7% 97.7% 100.0% 99.1% 95.3% 92.1% 85.8% 93.0% 94.0% 96.0% 100.0% 100.0% 94.6% 96.3% 77.1% London Avg 31 days standard to subsequent Cancer treatment - Radiotherapy 31 days standard to subsequent Cancer treatment - Drug 98.0% 97.0% 96.0% 95.0% 94.4% 94.0% 96.0% 100.0% 100.0% 94.6% 96.3% 94.6% 94.4% 92.4% 97.2% 99.9% 99.1% 95.8% 91.1% 84.5% 40% 20% 0% London Avg Shelford Avg Mon, TDA, CQC Mon, TDA, CQC Mon, TDA, CQC Mon, TDA, CQC Mon, TDA, CQC Mon, TDA, CQC Mon, TDA, CQC Mon, TDA, CQC 100% 99% 99% 98% 98% 97% 97% 96% 96% 95% 95% National Performance Month Threshold Actual 101% 100% 99% 98% 97% 96% 95% 94% 93% 92% 91% Threshold National Performance Actual 95% 90% 85% 80% 75% London Avg National Performance 100% 95% 90% 85% 80% 75% 70% 65% 60% Month Month Threshold National Performance London Avg LCA Avg Actual Shelford Avg Trust Board Report Month 11 Threshold LCA Avg Shelford Avg National Performance 99% 98% 97% 96% 95% 94% 93% 92% 91% 90% 89% 88% Month Shelford Avg 62 day wait for first treatment from urgent GP referral 62 day wait for first treatment from urgent GP referral 100% Threshold London Avg 31 days standard to subsequent Cancer treatment - Surgery Month Shelford Avg Source Framework 31 days standard from diagnosis to first treatment 60% 62 day wait for first treatment from NHS screening services referral 62 day wait for first treatment from NHS screening services referral 94.6% 94.8% 97.0% 100.0% 100.0% 95.7% 88.4% 94.9% 80% Month Pg 12 94.9% 93.1% 97.6% 100.0% 99.3% 95.3% 93.9% 93.7% 31 days standard to subsequent Cancer treatment - Radiotherapy 99.0% Actual Shelford Avg 93.7% 88.4% 97.4% 99.6% 97.6% 96.9% 91.0% 85.4% 100% Actual National Performance 100.0% London Avg YTD Forecast Qtr 3 Qtr 4 Qtr 1 14/15 14/15 15/16 Month Shelford Avg 101.0% Threshold Q4 2 week wait from referral to date first seen Breast Cancer 31 days standard to subsequent Cancer treatment - Drug Actual Q3 31 days standard to subsequent Cancer treatment - Surgery Threshold Q2 120% Month Actual Q1 31 days standard from diagnosis to first treatment Leading Frequency 2 week wait from referral to date first seen Breast Cancer Indicator Performance Current Year To Date Current Month London Avg National Performance Actual Threshold London Avg Shelford Avg National Performance Quality Principles - Equity 6.1 Dementia, Mixed Sex Accommodation and Safeguarding Training Levels Performance in 2013/14 Indicator Leading Frequency Performance Current Year To Date Forecast Qtr 4 Qtr 1 Qtr 2 14/15 15/16 15/16 Source Framework Threshold Feb-14 Qtr4 Current Month Q1 Q2 Q3 Q4 YTD Month 11 data not yet 93.36% available 91.10% 90.91% 90.19% 97.98% 96.50% 90.35% 92.91% 97.03% 90.53% 93.86% 95.37% 91.42% 93.27% 92.11% 90.48% 94.73% 95.90% Contractual Contractual Contractual CQUIN - Dementia CQUIN - Dementia - Find & Assess CQUIN - Dementia - Investigate CQUIN - Dementia - Refer - Monthly Monthly Monthly >90% >90% >90% 92% 99% 100% 88% 99% 98% Accomodation Mixed Sex Accommodation Mixed Sex Accommodation Rate per 1000 FCEs - Monthly Monthly 0 0 1 0.00% 1 0.00% 0 0.00% 0 0.00% 0 0.00% 8 0.03% 6 0 14 0.02% TDA TDA Safeguarding Training Levels* Safeguarding Training Levels Adults Safeguarding Training Levels Children Trust - Level 1 Safeguarding Training Levels Children Trust - Level 2 Safeguarding Training Levels Children Trust - Level 3 - Monthly Monthly Monthly Monthly >85% >80% >80% >80% n/a n/a n/a n/a n/a n/a n/a n/a 85.36% 80.28% 86.31% 72.2% 72.87% n/a n/a n/a 79.60% n/a n/a n/a 82.69% 73.0% 57.0% 61.0% 87.68% 75.14% 71.66% 67.10% 80.08% 74.4% 66.8% 65.1% Define Define Define Define Female Genital Mutilation Caseload Female Genital Mutilation Caseload - Monthly 0 n/a n/a 343 n/a 147 721 659 1527 Define Mental Health Act detentions Patients detained under the Mental Health Act - Monthly 0 n/a n/a 7 21 16 16 14 67 Define Dementia - Find & Assess Month 11 data available 40% 20% 0.4% 0.3% 2 0.2% 1 0.1% 0 0.0% Month Year 100% 80% 60% 40% 20% 0% Patients detained under the Mental Health Act Female Genital Mutilation Caseload Month Year 400 350 300 250 200 150 100 50 0 Month Year Pg 13 80% 60% 40% 20% Actuals Threshold Month Year Safeguarding Training Levels - Adults Female Genital Mutilation Caseload 100% 0% 0% Actuals Threshold Patients detained under the Mental Health Act 12 10 8 6 4 2 0 Actuals Month Year Trust Board Report Month 11 Actuals Threshold Actuals Safeguarding Training Levels - Children Safeguarding Training Levels Children 0.5% Mix Sex Accommodation breaches per 1000 FCEs Mix Sex Accommodation Breaches Mixed Sex Accommodation 3 60% Actuals Threshold Month Year 4 80% % Dementia - Refer % Dementia - Investigate 100% 98% 96% 94% 92% 90% 88% 86% 84% 82% 5 Dementia - Refer Dementia - Investigate 100% Safeguarding Training Levels Adults % Dementia - Find & Assess * Revised methodology used as at December 2014 100% * Revised methodology used as at December 2014 80% 60% 40% 20% 0% Month Year Level 1 Level 2 Level 3 Threshold People Domain Overview Voluntary Turnover Rate People Domain Lead: Jayne Mee Operating Vacancy Rate Rate of Staff Incidents per WTE Non-recruited Vacancy Rate Number of RIDDOR Staff Incidents Sickness Absence Rate 79.5% in month ; 76% YTD Average fill rate - care staff (%) - Night Consultant Peformance and Development Review (PDR) Rate Average fill rate - registered nurses/midwives (%) - Night Band 8c -9 Performance and Development Review (PDR) Rate Average fill rate - care staff (%) - Day LAS Average fill rate - registered nurses/midwives (%) - Day Band 7-8 Performance and Development Review (PDR) Rate New Nursing Requirements Band 2-6 Performance and Development Review (PDR) Rate Board Turnover Local Induction WTE Midwife average number of births over 12 month period Statutory Mandatory WTE Medics Per Bed Days Nurse : Bed Ratio Bank and Agency Spend (%) WTE Midwife : Births Corporate Welcome Attendance *Clarity as to how these indicators are measured and which domain they are included in is being proposed and will be refreshed in the next integrated performance scorecard. Current performance which meets or exceeds target Current performance which is not meeting target but is within 10% of target Current performance which is not meeting target within 10% Pg 14 Trust Board Report Month 11 People Principles - People 7.1 Turnover,Sickness and Training Compliance Performance in 2013/14 Indicator Leading Frequency Turnover & Vacancy Rate Voluntary Turnover Rate Operating Vacancy Rate Non-recruited Vacancy Rate Sickness Absence Rate Appraisal Rates Consultant Peformance and Development Review (PDR) Rate Band 8c -9 Performance and Development Review (PDR) Rate Band 7-8b Performance and Development Review (PDR) Rate Band 2-6 Performance and Development Review (PDR) Rate Training Compliance Local Induction Statutory Mandatory Bank and Agency Spend Bank Spend (%) Agency Spend (%) Corporate Welcome Corporate Welcome Attendance Monthly Threshold Feb-14 Performance Current Year To Date Qtr4 Current Month Q1 Q2 Q3 Q4 Forecast Rolling 12 Months Position Qtr 4 Qtr 1 Qtr 2 14/15 15/16 15/16 Source Framework Monthly Monthly Monthly Monthly <9.50% <9.00% <9.00% <3.4% 10.15% n/a n/a 3.73% 10.12% n/a n/a 3.72% 10.22% 13.05% 8.11% 3.41% 9.78% 12.50% 7.77% 3.34% 9.55% 11.83% 7.35% 3.30% 9.93% 12.71% 8.85% 3.67% 10.20% 13.24% 8.64% 3.58% Monthly Monthly Monthly Monthly >95.00% >95.00% >95.00% >95.00% 67.00% n/a n/a n/a 74.00% n/a n/a n/a 89.00% 97.00% 96.00% 92.00% 73.33% 96.08% n/a n/a 77.67% 93.96% 83.00% 11.00% 80.33% 94.67% 93.00% 80.00% 87.00% 96.50% 96.00% 91.00% Define Define Define Define Monthly Monthly >95.00% >95.00% 73.23% 68.29% 72.15% 67.99% 85.00% 79.00% 77.01% 69.20% 84.70% 71.08% 88.00% 73.33% 85.50% 39.50% Define Define Monthly Monthly tbc tbc n/a n/a n/a n/a 5.82% 6.51% 5.61% 8.10% 5.04% 7.01% 5.23% 6.35% 5.73% 6.19% Monthly >100.00% n/a n/a 84.00% 90.27% 95.00% 93.33% 85.00% 10.17% TDA CQC CQC CQC 3.50% Define Define 12.45% Define Indicators to be developed WTE Midwife : Births Nurse : Bed Ratio WTE Medics Per Bed Days WTE Midwife average number of births over 12 month period Board Turnover New Nursing Requirements Vacancy Rate 16% 16% 12% 12% 8% 8% 4% 4% 0% 0% Month 60% 40% 0% Month 80% 60% 40% 20% 0% Band 8c-9 Band 7-8 Band 2-6 Threshold Month Threshold Corporate Welcome Attemdamce Month 10 data not yet available 14% 12% 10% 8% 6% 4% 2% 0% Actual Threshold Trust Board Report Month 11 Month Actual Corporate Welcome Attendance Bank and Agency Spend Bank and Agency Spend (%) Statutory Mandatory Training Rate 100% Month Actual Threshold Actual Threshold Local Induction Rate 100% 90% 80% 70% 60% 50% 40% 30% 20% 10% 0% Statutory Mandatory Training Rate Month Month Localnductino Rate Non Medical PDR Rate Consultant PDR Rate 80% 20% Pg 15 Operating Vacancy Rate Non-recruited Vacancy Rate Threshold Performance and Review (PDR) Rate Consultant Performance and Review (PDR) Rate 100% 100% 90% 80% 70% 60% 50% 40% 30% 20% 10% 0% 3% 2% Actual Threshold Month Sickness Absence Rate 4% Sickness Absence Rate 20% Vacancy Rate Turnover Rate Voluntary Turnover Rate 20% Agency Spend Bank Spend Threshold 100% 90% 80% 70% 60% 50% 40% 30% 20% 10% 0% Month Actual Threshold Quality Principles - People 7.2 Appendix People KPI Report ~ Current Performance - February 2015 . General Ledger (GL) Establishment WTE Establishment & People Trust Overview Month 11 - February 2015 Vacancy Rate % Ward / Inpatient Staffing Levels Period in month ESR Established WTE 9,994 10,396 KPI Target Current Performance Performance Flag red - operating vacancy rate & 9.00% 13.05% operational vacancy rate & 8.11% nonrecruited to vacancy rate green - nonrecruited vacancy rate Current operating band 2~6 vacancy rate on our wards is 14.51% with an adjusted non-recruited vacancy rate of 8.37% taking into account 150 candidates waiting to join across the Divisions in month 6.40% 12.33% (6.51% agency & 5.82% bank) red B & A Spend as % of total paybill rolling 12-mths 7.00% 12.48% Variance GL & ESR Post WTE 402 ESR Inpost WTE 9,039 Worked Bank WTE 615 Worked Agency WTE 642 Total People WTE (inpost/b&a) 10,296 Variance Total People against ESR Establishment -99 Variance Total People against GL Establishment 302 Current Performance and Plans to Improve At the end of February, we directly employed (excl.hosted services) 9,039 WTE; 6 WTE less than reported in January. The occupational split for our directly employed staff is; 43% Nursing & Midwifery, 18% Medical, 17% AHP/S&T & Pharmacist and 22% A&C/Estates & nonclinical Senior Managers. The post establishments are currently being reviewed, as part of the Trust's financial planning for 15/16, and will ensure that only those posts required to support service delivery are live on ESR, recruited to and reported on. The overall effect is that the operating vacancy rate has decreased from 13.42% to 13.05% in-month and, with 514 successful candidates in the pipeline, we have a nonrecruited vacancy figure of 8.11%. Our pipeline candidates are split across the occupational groups as; 113 A&C/Est/Snr.Mgr, 287 Nursing & Midwifery, 28 Trust appointed Doctors & Consultants, 86 AHP/S&T/Pharmacists. The ERAF approval process continues to work to support recruitment that is appropriate and required for the delivery of safe high quality care for our patients. All established band 2-6 roles within clinical groups, as well as key Trust and Training Grade medical posts, are exempt from the ExCo review element of the ERAF process; supporting swift recruitment and minimising disruption to rota cover and delivery of care to our patients. Across our wards, at the end of February, there were 354 WTE vacancies within band 2 - 6 roles giving an operating vacancy rate of 14.51%. There are currently 150 WTE band 2 - 6 Nursing & Midwifery candidates waiting to join the ward establishments, bringing the nonrecruited to vacancy rate for this group to 8.37%. Monitoring of the band 2-6 vacancies within our Divisions continues to be supported by detailed monthly reporting at Divisional, ward and banding level as well as the use of a bespoke strategic people plans (SPP's) for each Division. Reducing our ward based vacancies to 5% is a key priority for the Divisions, Resourcing Team and Nurse Recruiters who are working in partnership to achieve this. At the end of February, a further 82 WTE band 2~6 nursing staff were required to reach the 5% vacancy rate target with a further 18 appointments each month to mitigate expected turnover within this cohort of staff. Bank and agency spend, as a % of our total paybill, increased from 11.50% to 12.33% in February ; 6.51% agency spend and 5.82% bank spend. During February, total requests for Nursing & Midwifery temporary staffing decreased from 832 WTE to 794 WTE in February (4.6% decrease), of which, 678 WTE were filled and worked (up from 665 WTE in January). Support for Cerner continues to reduce, down from 27 WTE to 22 WTE in February, with fixed-term recruitment continuing to the remaining established (2-year funded) Cerner support roles. In terms of overall spend, a total of £5.57m was spent during February on bank and agency by the Divisions and Corporate Services (£5.14m in January). When compared to the same month last year, February's bank & agency spend shows £576k more ; £270k more agency spend & £306k more bank spend. For the period April 14 - February 2015, the average usage for temporary staffing is 567 WTE per month for bank workers and 757 WTE per month for agency workers (for February 2015, 615 WTE bank & 642 WTE agency). red Turnover Rate % rolling 12-mths 9.50% 10.22% amber in month 3.40% 3.41% amber Sickness Absence Rate % rolling 12-mths 3.30% 3.47% amber 97% bands 8c~9 Performance & Development Review (PDR) % - bands 8c ~ 9 - bands 7 ~ 8b - bands 2 ~ 6 & 96% in month 95.00% band green bands 7~8b 7~8b & 92% bands Consultant Appraisal % green bands 8c~9 in month 95.00% amber bands 2~6 Voluntary turnover (rolling 12-month period) for the 12-month period ending at the end of February is at 10.22%; above the Trust's 9.50% target rate. During February, a total of 74 of our people voluntarily left the Trust which is lower than the 96 who left in January but 7 more than for the same month last year. Whilst we have seen our voluntary turnover increase over the past over the past few months, our voluntary turnover rate remains one of the lowest when compared to other London Acute Teaching Trusts and still remains significantly below the 11.61% recorded in June 2013. The Trust's stability index (measuring the retention of our people with more than 12 months service) has increased steadily since June 2013, rising from 78.93% to it's current position of 85.30%. Information from exit interviews and Engagement Survey's continue to be used within the Divisions to understand why our people choose to leave with appropriate action plans put into place to improve our people experience. Supporting this is the information received from our on-boarding survey. In addition, bespoke turnover analysis looking at length of service, banding spread and reasons for leaving are created, as requested, for identified hot-spot areas. Recorded sickness absence decreased by almost 9% from the levels recorded in January, down from 3.74% to 3.41%. This is also lower than the 3.74% recorded in February 2014. When you compare the average recorded sickness for the winter months of November - February this year to those from 13/14 you see an average decrease of 2% (3.63% compared to 3.71%). This months decrease is primarily due to a 15% reduction in the recorded sickness absence for coughs/cold and flu type illness and gastrointestinal type illness. However, an increase (14%) was seen within absence attributable to stress/anxiety/depression. Overall, this brings the rolling 12-month position to 3.47% against the 14/15 target of 3.30%. A total of 51,000 working hours were lost to illness during February which is the equivalent of 313 WTE, of which 78 WTE is related to long-term illness (25%). Across the organisation, sickness absence levels vary in-month; within Divisions from 2.91% in Surgery, Cancer & CV to 4.14% in Women's & Children's, within Corporate Services from 1.82% in Finance to 7.42% in Estates. Also by occupational group, ranging from 0.43% for our Consultants to 4.28% for Administrative & Clerical and 8.76% for Estates & Maintenance workers. Monitoring of safe staffing levels, to ensure that sickness absence has minimal impact, is done through daily reviews with the GM's and the Site team as well as monthly meetings with managers to ensure proactive management of sickness absence. New managers continue to attend the Understanding Workforce Policies training, as well as refresher training for existing managers, ensuring they are confident and supported in the pro-active management of sickness absence The combined PDR compliance rate for all of our non-medical people was 92.3% at the end of February. Within the specific banding groups, this is seen as; 92% for bands 2 - 6 (507 PDR's remaining to be completed), 96% within bands 7 - 8b and bands 8c - 9 at 97%. Proactive management of those PDR's still to be carried out continues and to support this, a weekly report is distributed to management teams detailing all of those who fall within this category. The Division's and Corporate Directorates also continue to receive a monthly report looking at the PDR compliance rates and grading spread for all three banding groups, showing comparison to Trust performance. The new PDR process was recently evaluated with 1,200 responses to an online survey: 90% managers said the new PDR process will help them improve the motivation of their team and 80% of reviewees stated that their PDR had been an improvement on the previous years. In March we will run focus groups and more in-depth evaluation to help determine how best to tailor our support for managers in 2015. The new cycle for PDR's commences in April and a communications campaign will be starting soon to remind managers of this. The Trust Consultant Appraisal rate has risen from 85% to 89% in February. Revalidation is based on annual appraisal over a 5 year cycle and deferral is necessary if appraisal outputs have not been completed. Across the Divisions, compliance for this people metric varies from 87% in the Division of Medicine (up from 79%) to 98% in the Division of Investigative Sciences & Clinical Support (up from 94%)with the Division of Women's & Children's at 91% (up from 84%) and Surgery, Cancer & Cardiovascular to 88% (up from 85%).The Medical Director’s Office is targeting specialties where appraisal rates are low through Divisional reporting and work with individuals and their clinical managers and appraisers. The new Revalidation and Appraisal policy will help to support this. There is a contractual responsibility to comply with annual appraisal and job planning and these metrics are being used to improve compliance in both areas. 89% amber 84% inCorporate Welcome October Joiners 100.00% month & 95% YTD Statutory Mandatory Training Compliance (non-medical) % in month 95.00% red - in-month compliance & amber - YTD compliance All new joiners are required to attend a Corporate Welcome session within the first 8 weeks of their employment, with the expectation that they attend as soon possible. The metric measures performance against this expectation with a 100% compliance target. The February compliance figure of 84% is reporting on those who joined us during December who, depending on when in December they joined, had until the end of February to attend a Corporate Welcome event. Full detail, of those joiners who have not yet attended a Corporate Welcome, is provided on the monthly MPI report to all Divisions and Corporate Services. The YTD compliance rate is at 95% and varies across the Divisions from 96% in Investigative Sciences and Medicine, to 95% in Surgery & Cancer and W&C at 91%. Within the Corporate Directorates, the compliance rates vary from 86% to 100%. The central Statutory & Mandatory Training Team do a monthly audit of all individuals who are non-compliant with a full diagnostic as to the contributing reasons for that non-attendance; following up either directly with the individual or recruiting manager requesting urgent attendance. Statutory and mandatory compliance rates for Month 11 are now produced by and available through WIRED2, the Trust’s core skills compliance reporting tool. The tool produces topic level compliance data for our core 10 training topics at division, departmental and individual level. Implementation of the tool has resulted in a significant improvement in our overall compliance rate, which in Month 1 was 69%. Now, the majority of topics show compliance of over 80%. The overall average, which is 79%, is adversely affected by two topics, fire safety for clinical and high risk areas and patient manual handling. These two topics will have bespoke turnaround plans. WIRED2 will continue to promote improved compliance as individual training plans are now transparent and training resources can be accessed directly via the tool itself. 79.00% amber Local Induction Compliance % in month 95.00% 85% red Local Induction compliance stands at 85% at the end of February; down marginally 86% in January. All of our new joiners are expected to have completed a local induction within their first 4 weeks of employment; the February figure represents all those who joined in the 12 months to the end of January 2015. To improve compliance for this key metric, the Divisions and Corporate Services continue to use a detailed (employee level) monthly report to focus efforts in areas where there is low compliance. In addition, a number of strategies are in place within the Divisions to improve compliance facilitated through weekly and monthly monitoring discussions with line managers responsible for areas with low compliance. These are accompanied by locally agreed improvement plans and departments are identified that have specific issues to enable focused support and help to improve performance against this metric. Within the Divisions, compliance ranges from 78% to 89% and across the Corporate Services from 63% to 100%. People Principles - People 7.3 Staffing: Nursing, midwifery and care staff Performance in 2013/14 Indicator Leading Frequency Staffing: Nursing, midwifery and care staff Average fill rate - registered nurses/midwives (%) - Day Average fill rate - care staff (%) - Day Average fill rate - registered nurses/midwives (%) - Night Average fill rate - care staff (%) - Night Monthly Monthly Monthly Monthly Performance Current Year To Date Monthly Threshold Feb-14 Qtr4 Current Month Q1 Q2 Q3 Q4 YTD tbc tbc tbc tbc n/a n/a n/a n/a n/a n/a n/a n/a 95.29% 91.29% 97.54% 95.81% 95.32% 93.82% 97.75% 97.16% 95.97% 92.82% 97.55% 96.74% 95.05% 91.61% 97.30% 96.06% 91.23% 91.23% 97.07% 95.57% 95.29% 92.34% 97.42% 96.39% Qtr 4 Qtr 1 Qtr 2 14/15 15/16 15/16 Source Framework Contractual Contractual Contractual Contractual Average fill rate - care staff - Day Average fill rate - registered nurses/midwives - Day 120% 120% 100% 100% 80% 80% 60% 60% % % Forecast 40% 40% 20% 20% 0% 0% Month Month Actual Average fill rate - registered nurses/midwives - Night Actual Average fill rate - care staff - Night 120% 100% 100% 80% 80% 60% 60% % % 120% 40% 40% 20% 20% 0% 0% Month Pg 17 Actual Trust Board Report Month 11 Month Actual People Principles - People 7.4 Health and Safety Performance in 2013/14 Indicator - Monthly Monthly Threshold Feb-14 Qtr4 tbc tbc 2 n/a 4 n/a 4 8.23 Number of RIDDOR Staff Incidents 5 4 3 2 1 0 Month Year Actuals Pg 18 Trust Board Report Month 11 Q1 Q2 Q3 Q4 YTD 2 7.90 2 8.73 9 8.75 6 8.70 19 8.42 Qtr 4 14/15 Forecast Qtr 1 Qtr 2 15/16 15/16 Source Framework Internal Internal Rate of Staff Incidents per WTE Rate of Staff Incidents per WTE Number of RIDDOR Staff Incidents Health and Safety Number of RIDDOR Staff Incidents Rate of Staff Incidents per WTE Leading Frequency Performance Current Year To Date Current Month 10 8 6 4 2 0 Month Year Actuals Finance Domain Overview Turnover Domain Lead: Alan Goldsman Finance - Continuity of Services Risk Rating Capital Servicing Capacity Pg 19 Trust Board Report Month 11 Liquidity Ratio Finance Principles - Finance 8.1 Financial & Continuity of Service Risk Rating Performance in 2013/14 Indicator Continuity of Service Risk Rating Liquidity Ratio Capital Servicing Capacity Leading Frequency Monthly Monthly Weighting Feb-14 Qtr4 >50% >50% n/a n/a 2 2 3 4 3 3 3 4 3 4 3 4 4 3 4 4 4 Overall Continuity of Service Risk Rating Pg 20 Performance Current Year To Date Current Month Trust Board Report Month 11 Q1 Q2 Q3 Q4 Qtr 4 14/15 Forecast Qtr 1 Qtr 2 15/16 15/16 Source Framework Finance Principles - Finance 8.2 Activity performance against plans commissioned by NWL CCG Performance in 2013/14 Indicator Leading Frequency Daycases Elective Inpatients NonElective Inpatients First Outpatient Follow-up Outpatient Adult Critical Care A&E Attendances Regular Day Attender Month Month Month Month Month Month Month Month Jan NWL 3,826 931 6,543 16,994 36,081 1,527 10,998 259 Threshold Outturn 3,887 950 5,578 14,819 24,763 1,606 11,942 226 -127 624 4,857 6,731 636 -2,174 -116 Q3 Q4 YTD 3,573 823 6,202 19,676 31,494 2,242 9,768 110 9,304 3,113 19,157 50,658 84,919 5,259 34,487 854 9,966 2,856 18,932 56,839 85,657 5,429 31,346 651 10,901 2,726 19,141 56,031 91,314 5,609 30,651 398 3,573 823 6,202 19,676 31,494 2,242 9,768 110 33,744 9,518 63,432 183,204 293,384 18,539 106,252 2,013 1,000 7,000 FCEs 3,000 2,000 1,000 Month 5,000 0 Month Adult Critical Care Activity - NWL CCG 14/15 Actual 13/14 Outturn 14/15 Plan Regular Day Attender - NWL CCG 12,000 10,000 FCEs 8,000 6,000 4,000 2,000 0 400 350 300 250 200 150 100 50 0 14/15 Actual 13/14 Outturn 14/15 Plan Please note : A small number of additional activity plans are in place for non-contracted activity, activity with devolved administrations, local authorites and overseas patients. These are included in the "Other" tab. A number of additional activitities (e.g. HASU bed days, Ward Attenders) are currently not shown. Trust Board Report Month 11 2,000 1,500 1,000 500 0 Month A&E Attendances - NWL CCG 14/15 Actual 13/14 Outturn 14/15 Plan 2,500 40,000 35,000 30,000 25,000 20,000 15,000 10,000 5,000 0 14/15 Actual 13/14 Outturn 14/15 Plan 14,000 Month 14/15 Actual 13/14 Outturn 14/15 Plan Critical Care Bed Days OP Attendances 10,000 Month 0 Follow-up Outpatient Activity - NWL CCG 15,000 Contractual Contractual Contractual Contractual Contractual Contractual Contractual Contractual 4,000 0 20,000 Source Framework 5,000 200 First Outpatient Activity - NWL CCG Forecast Qtr 1 Qtr 2 15/16 15/16 6,000 600 14/15 Actuals Qtr 4 14/15 NonElective Inpatient Activity - NWL CCG 8,000 400 25,000 OP Attendances -314 Q2 1,200 13/14 Outturn FCEs 11,490 2,769 18,316 53,760 98,110 4,667 35,547 670 Q1 800 Month Pg 21 Qtr3 Elective Inpatient Activity - NWL CCG 4,500 4,000 3,500 3,000 2,500 2,000 1,500 1,000 500 0 FCEs FCEs Daycase Activity - NWL CCG Performance Current Year To Date Current Month Month 14/15 Actual 13/14 Outturn 14/15 Plan Month *excl. WIP 14/15 Actual 13/14 Outturn Finance Principles - Finance 8.3 Activity performance against plans commissioned by Non NWL CCG Performance in 2013/14 Indicator Leading Frequency Daycase Elective Inpatients NonElective Inpatients First Outpatient Follow-up Outpatient Adult Critical Care Regular Day Attender Jan Non NWL CCG 809 266 1,092 2,367 6,350 390 54 Threshold Month Month Month Month Month Month Month 822 263 939 2,582 5,000 347 34 Q2 Q3 Q4 YTD 2,417 751 3,036 8,810 16,674 962 97 0 814 226 1,051 2,853 5,715 424 34 1,864 861 3,316 7,181 15,234 837 248 2,092 832 3,049 8,441 15,550 882 179 2,317 717 2,875 8,074 16,287 1,001 127 814 226 1,051 2,853 5,715 424 34 7,087 2,636 10,291 26,549 52,786 3,144 588 0 0 -8 -37 112 271 715 77 1,400 300 1,200 250 1,000 200 800 150 400 50 200 0 0 Month 13/14 Outturn 14/15 Actual 13/14 Outturn 14/15 Plan 3,000 6,000 500 1,500 1,000 5,000 4,000 3,000 2,000 500 1,000 0 0 14/15 Actual 13/14 Outturn 14/15 Plan Month Regular Day Attender - Non NWL CCG 100 80 FCEs 60 40 20 0 Month 14/15 Actual 13/14 Outturn 14/15 Plan Please note : A small number of additional activity plans are in place for non-contracted activity, activity with devolved administrations, local authorites and overseas patients. These are included in the "Other" tab. A number of additional activitities (e.g. HASU bed days, Ward Attenders) are currently not shown. Pg 22 Critical Care Bed Days 600 OP Attendances 7,000 2,000 Trust Board Report Month 11 14/15 Actual 13/14 Outturn 14/15 Plan Adult Critical Care Activity - Non NWL CCG 3,500 2,500 Source Framework Contractual Contractual Contractual Contractual Contractual Contractual Contractual Month Follow-up Outpatient Activity - Non NWL CCG First Outpatient Activity - Non NWL CCG Forecast Qtr 1 Qtr 2 15/16 15/16 600 100 14/15 Actual Qtr 4 14/15 NonElective Inpatient Activity - Non NWL CCG 350 FCEs 1,000 900 800 700 600 500 400 300 200 100 0 Month OP Attendances Q1 Qtr3 Elective Inpatient Activity - Non NWL CCG FCEs FCEs Daycase Activity - Non NWL CCG Performance Current Year To Date Current Month 400 300 200 100 0 Month 14/15 Actual 13/14 Outturn 14/15 Plan *excl. WIP Month 14/15 Actual 13/14 Outturn Finance Principles - Finance 8.4 Activity performance against plans commissioned by NHSE Performance in 2013/14 Indicator Leading Frequency Daycase Elective Inpatients NonElective Inpatients First Outpatient Follow-up Outpatient Adult Critical Care A&E Attendances Regular Day Attender Jan NHSE 1,413 548 898 5,216 11,029 1,307 2 1,106 Threshold Month Month Month Month Month Month Month Month 1,283 504 795 5,671 10,785 1,399 2 1,030 Daycase Activity - NHSE 700 1,400 600 1,200 -145 -90 17 -1,451 -1,442 133 -1 -80 Q2 Q3 Q4 YTD 1,138 414 812 4,220 9,343 1,532 1 950 2,974 1,494 2,319 12,790 27,431 3,756 7 2,452 3,373 1,410 2,211 10,979 25,737 5,638 6 2,455 3,452 1,354 2,435 11,138 26,512 4,044 7 2,622 1,138 414 812 4,220 9,343 1,532 1 950 10,937 4,672 7,777 39,127 89,023 14,970 21 8,479 400 300 400 200 200 100 0 0 14/15 Actual 13/14 Outturn 14/15 Plan Month Month 14/15 Actual 13/14 Outturn 14/15 Plan Adult Critical Care Activity - NHSE Critical Care Bed Days OP Attendances 8,000 6,000 4,000 2,000 2,000 1,500 1,000 500 0 0 14/15 Actual 13/14 Outturn 14/15 Plan Month 6 1,200 FCEs 1,400 5 1,000 4 800 3 600 2 400 1 200 0 0 Month 14/15 Actual 13/14 Outturn 14/15 Plan Regular Day Attender - NHSE A&E Attendances - NHSE 7 14/15 Actual 13/14 Outturn 14/15 Plan Please note : A small number of additional activity plans are in place for non-contracted activity, activity with devolved administrations, local authorites and overseas patients. These are included in the "Other" tab. A number of additional activitities (e.g. HASU bed days, Ward Attenders) are currently not shown. Trust Board Report Month 11 14/15 Actual 13/14 Outturn 14/15 Plan 2,500 10,000 Month Source Framework Contractual Contractual Contractual Contractual Contractual Contractual Contractual Contractual Month 12,000 9,000 8,000 7,000 6,000 5,000 4,000 3,000 2,000 1,000 0 Forecast Qtr 1 Qtr 2 15/16 15/16 1,000 900 800 700 600 500 400 300 200 100 0 Follow-up Outpatient Activity - NHSE First Outpatient Activity - NHSE Qtr 4 14/15 NonElective Inpatient Activity - NHSE FCEs FCEs FCEs 800 600 OP Attendances 3,732 1,508 2,303 18,502 31,084 3,795 9 3,201 Q1 500 1,000 FCEs Qtr3 Elective Inpatient Activity - NHSE 1,600 Pg 23 Performance Current Year To Date Current Month Month 14/15 Actual 13/14 Outturn 14/15 Plan *excl. WIP Month 14/15 Actual 13/14 Outturn Finance Principles - Finance 8.5 Activity performance against plans commissioned by Other Performance in 2013/14 Indicator Leading Frequency Daycases Elective Inpatients NonElective Inpatients First Outpatient Follow-up Outpatient Adult Critical Care Regular Day Attender Jan Other 18 31 19 3,602 1,818 15 0 Threshold Month Month Month Month Month Month Month 15 13 18 3,496 1,683 22 0 Daycase Activity - Other Q3 Q4 YTD 44 53 52 10,159 4,845 52 0 0 136 6 19 3,256 1,742 16 0 151 39 269 9,544 5,154 70 30 286 26 169 9,957 5,297 24 5 404 25 41 9,381 5,324 17 1 136 6 19 3,256 1,742 16 0 977 96 498 32,138 17,517 127 36 0 0 121 -7 1 -240 59 -6 160 140 30 140 25 120 60 15 40 20 5 20 0 0 0 14/15 Actual 13/14 Outturn 14/15 Plan Month Month Critical Care Bed Days OP Attendances 2,000 1,500 1,000 500 0 14/15 Actual Regular Day Attender - Other 16 14 12 10 8 6 4 2 0 Month 14/15 Actual 13/14 Outturn 14/15 Plan Please note : A small number of additional activity plans are in place for non-contracted activity, activity with devolved administrations, local authorites and overseas patients. These are shown here. A number of additional activitities (e.g. HASU bed days, Ward Attenders) are currently not shown. . Trust Board Report Month 11 Month 14/15 Actual 13/14 Outturn 14/15 Plan Adult Critical Care Activity - Other 2,500 13/14 Outturn Pg 24 14/15 Actual 13/14 Outturn 14/15 Plan Follow-up Outpatient Activity - Other First Outpatient Activity - Other Month Contractual Contractual Contractual Contractual Contractual Contractual Contractual 60 10 4,000 3,500 3,000 2,500 2,000 1,500 1,000 500 0 Source Framework 80 40 Month Forecast Qtr 1 Qtr 2 15/16 15/16 100 20 FCEs 80 Qtr 4 14/15 NonElective Inpatient Activity - Other 35 FCEs FCEs Q2 160 100 OP Attendances Q1 Qtr3 Elective Inpatient Activity - Other 120 FCEs Performance Current Year To Date Current Month 14/15 Actual 13/14 Outturn 80 70 60 50 40 30 20 10 0 *excl. WIP Month 14/15 Actual 13/14 Outturn Research and Education Domain Overview Turnover Research and Education Total number of participants enrolled in NIHR CRN Portfolio Commercial Studies Cumulative YTD) 3 Number of commercial NIHR CRN Portfolio studies to which the Trust is recruiting (Cumulative YTD) 3 Total number of participants enrolled in NIHR CRN Portfolio Studies (Cumulative YTD) 3 Total number of NIHR Clinical Research Network (CRN) Portfolio studies to which the Trust has recruited (Cumulative YTD) 3 Proportion of local CSP reviews completed within 15 calendar days Pg 25 Trust Board Report Month 11 Time elapsed between receipt of Valid Research Application and First Patient Recruitment for interventional studies (Mean) 1 Time elapsed between receipt of Valid Research Application and First Patient Recruitment for interventional studies (Median) 1 Percentage of interventional studies which recruited 1st patient within 70 days of Valid Research Application 1 Percentage of closed commerciallysponsored interventional studies that recruited to time and target 2 Research and Education Domain Overview Research & Development Indicator Leading Frequency Research & Development Time elapsed between receipt of Valid Research Application and First Patient Recruitment for interventional studies (Mean) 1 Time elapsed between receipt of Valid Research Application and First Patient Recruitment for interventional studies (Median) 1 Percentage of interventional studies which recruited 1st patient within 70 days of Valid Research Application 2 Percentage of closed commercially-sponsored interventional studies that recruited to time and target 1 Proportion of local CSP reviews completed within 15 calendar days 3 Total number of NIHR Clinical Research Network (CRN) Portfolio studies to which the Trust has recruited (Cumulative YTD) 4 Total number of participants enrolled in NIHR CRN Portfolio Studies (Cumulative YTD) 3 Number of commercial NIHR CRN Portfolio studies to which the Trust is recruiting (Cumulative YTD) 3 Total number of participants enrolled in NIHR CRN Portfolio Commercial Studies Cumulative YTD) 3 Quarterly Quarterly Quarterly Quarterly Quarterly Quarterly Quarterly Quarterly Quarterly Threshold Performance in 2013/2014 Q3 Q1-14 Q2-14 Q3-14 Q4-15 YTD Qtr 4 14/15 <=70 <=55 >=70% >=60% >=70% >284 >8165 >48 >557 98 76 30.0% 60.6% 74.2% 291 9211 51 554 95.7 76.0 57.1% 70.4% 47.2% 176 2933 24 128 75 49 63.5% 72.2% 59.2% 235 5929 40 308 64 48 79.0% 80.0% 56.5% 296 8887 53 395 0 0 0.0% N/A 0.0% 0 0 0 0 78 58 66.5% 74.2% 54.3% 236 5916 39 277 #N/A #N/A #N/A #N/A #N/A #N/A #N/A #N/A #N/A Performance Current Forecast Qtr 1 15/16 Qtr 2 15/16 Define Define Define Define Define Define Define Define Define [1] Data source: ICHNT quarterly returns to NIHR CCF (Q3 data as submitted on 30th Jan 2015; provisional and subject to NIHR verification) [2] Data source: Q2 14/15 Mean and median are verified and final figures from the NIHR CCF Q2 Report. Figure on percentage of studies that recruited in <70 days under KPI #2 is provisional and is being reviewed by NIHR. [3] Data source: NIHR Open Data Platform download for current YTD (13Jan2015) 60 40 20 0 Mean Proportion of local CSP reviews completed within 15 calendar days 90% 80% 70% 60% 50% 40% 30% 20% 10% 0% Month Year Number of commercial NIHR CRN Portfolio studies to which the Trust is recruiting (Cumulative YTD) Month Year 350 300 250 200 150 100 50 0 70 60 50 40 30 20 10 0 Month Year Threshold Actuals Threshold Total number of participants enrolled in NIHR CRN Portfolio Commercial Studies Cumulative YTD) 3 900 800 700 600 500 400 300 200 100 0 Actuals Month Year Month Year 90% 80% 70% 60% 50% 40% 30% 20% 10% 0% Actuals Threshold Total number of NIHR Clinical Research Network (CRN) Portfolio studies to which the Trust has recruited (Cumulative YTD) Actuals Threshold Number of commercial NIHR CRN Portfolio studies to which the Trust is recruiting (Cumulative YTD) Pg 26 90% 80% 70% 60% 50% 40% 30% 20% 10% 0% Median Total number of NIHR Clinical Research Network (CRN) Portfolio studies to which the Trust has recruited (Cumulative YTD) Proportion of local CSP reviews completed within 15 calendar days Month Year Percentage of closed commercially-sponsored interventional studies that recruited to time and target Percentage of closed commerciallysponsored interventional studies that recruited to time and target 80 Percentage of interventional studies which recruited 1st patient within 70 days of Valid Research Application Actuals Threshold Trust Board Report Month 11 Month Year Total number of participants enrolled in NIHR CRN Portfolio Studies (Cumulative YTD) 100 Percentage of interventional studies which recruited 1st patient within 70 days of Valid Research Application 120 Total number of participants enrolled in NIHR CRN Portfolio Commercial Studies Cumulative YTD) 3 Time elapsed between receipt of Valid Research Application and First Patient Recruitment for interventional studies [4] Data source: NIHR Open Data Platform www.odp.nihr.ac.uk/ Period analysed = Q1 (April to June); Q2 (April to September); Q3 (April to December) and Q4 (April to March) in each FY. Time elapsed between receipt of Valid Research Application and First Patient Recruitment for interventional studies Actual Threshold Total number of participants enrolled in NIHR CRN Portfolio Studies (Cumulative YTD) 14000 12000 10000 8000 6000 4000 2000 0 Actuals Month Year Source Framework Threshold Glossary Definitions Page number Domain Sub-domain Indicator title Summary Finance 3 Capital Servicing Capacity Summary Finance 3 Liquidity ratio Summary Access 3 18 weeks referral to treatment Description The Capital Servicing Capacity indicates the degree to which the organisation's generated income covers its financing obligations. A high rating indicates that the Trust has a low risk of defaulting. The Liquidity ratio is based on a calculation of the Trust's available capital against outstanding debt. A high rating indicates that the Trust has a low risk of defaulting. Patients have a legal right to commence NHS consultant-led treatment within a maximum of 18 weeks from referral, unless the patient chooses to wait longer or it is clinically appropriate to do so. The Trust's service-level waiting times can be compared to other Healthcare Providers across England. 2 week wait from referral to date first seen all Patients have a right to be seen by a specialist within a maximum of 2 weeks from GP referral where cancer is suspected. urgent referrals 2 week wait from referral to date first seen 3 Patients have a right to be seen by a specialist within a maximum of 2 weeks from GP referral where breast cancer is suspected. breast cancer 31 days standard from diagnosis to first 3 In cases where cancer has been confirmed, patients should wait no more than 31 days from the decision to treat to the start of their treatment. treatment Summary Access 3 Summary Access Summary Access Summary Access 3 31 days standard to subsequent cancer treatment In cases where cancer has been confirmed, patients should wait no more than 31 days from the decision to treat to their subsequent treatment. Summary Access 3 62 day wait for first treatment from NHS Screening Services referral / GP referral In cases where a patient has been referred for suspected cancer, and where cancer has subsequently been confirmed, patients have a right to commence NHS treatment within a maximum of 62 days from referral for suspected cancer. Summary Access 3 Summary Outcomes 3 Summary Governance 3 Summary Governance CQC CQC 4 MRSA (latest CQC report) This rating indicates the total number of incidences of MRSA within the Trust, as reported in the most recent CQC report. CQC CQC 4 Clostridium Difficile (latest CQC report) This rating indicates the total number of incidences of C-Diff within the Trust, as reported in the most recent CQC report. A&E maximum waiting times 4 hours Patients should be seen, treated, admitted, or discharged in under four hours of presenting at A&E. The national target is 95%. Clostridium Difficile (C-Diff) is a type of infectious diarrhoea that can be difficult to treat due to antibiotic resistance. This rating indicates the number of cases of C-Diff infections within the Trust during the reporting period. A high number may be indicative of infection control issues, such as hand hygiene. CQC Judgements – warning notice issued, civil In Foundation Trusts, Monitor can assign a red rating for governance concern based on CQC warning notices issued or Civil and/or criminal action initiated and / or criminal action initiated Third party reports from e.g. GMC, Ombudsman, medical Royal Colleges etc – In Foundation Trusts, Monitor can assign a red rating for governance concern based on ad hoc reports from GMC, the Ombudsman, commissioners, Healthwatch England, auditor reports, Health & Safety Executive, patient groups, complaints, whistleblowers, medical Royal 3 judgement based on severity and frequency Colleges etc. The judgement would be based on the severity and frequency of reports. of reports Clostridium Difficile (C-Diff) Post 72 hours Pg 27 Trust Board Report Month 11 Glossary Definitions Page number Domain Sub-domain Indicator title Quality Summary Safety Finance Quality Safety Quality Safety 6 Number of Dr Foster morality alerts Quality Safety 6 Number of deaths in low risk diagnostic groups Quality Safety 7 MRSA Quality Safety 7 Clostridium Difficile (C-Diff) Post 72 Hours Quality Safety 7 Never Events Quality Safety 7 Serious Untoward Incidents (SUI) Quality Safety 7 Harm Free Care (Safety Thermometer) Quality Safety 7 VTE Risk Assessments Quality Patient Centredness 8 Inpatients Net Promoter Score (FFT) Quality Patient Centredness 8 Inpatients Net Promoter Response Rate Quality Patient Centredness 8 A&E Net Promoter Score (FFT) Quality Patient Centredness 8 A&E Net Promoter Response Rate Quality Patient Centredness 8 Maternity Net Promoter Score (FFT) Quality Patient Centredness 8 Maternity Net Promoter Response Rate Quality Patient Centredness 8 Number of complaints received Quality Patient Centredness 8 Description The HSMR is an indicator of healthcare quality that measures the number of deaths in the Trust, during the patients' stay at the Trust, and which is adjusted for a variety of factors (i.e. age, poverty, treatments offered). 6 Hospital Standardised Mortality Rate (HSMR) The Capital Servicing Capacity indicates which the organisation's covers A itshigher financing obligations. A score of 100 indicates that the numberthe of degree deaths to within the Trust is similar togenerated what you income would expect. score means more deaths than expected, which may result from patient safety or clinical quality issues. 3 Capital Servicing Capacity The SHMI is an indicator of healthcare quality that measures whether the number of deaths in the Trust, or within 30 days of the patient's discharge, is higher or lower than you would expect. 6 Summary Hospital Mortality Indicator A score of 100 indicates that the number of deaths within the Trust is similar to what you would expect. A higher score means more deaths than expected, which may result from patient safety or clinical quality issues. Dr Foster Mortality alerts are sent to the Chief Executive of the Trust when the HSMR has, on at least one occasion in the preceding three months, reached double the expected rate for a particular diagnosis or procedure. This rating indicates the total number of Mortality alerts that have been sent to the Chief Executive of the Trust and may require investigation of the safety and quality of clinical care provided. This indicator aims to identify deaths that are likely to be attributable to health care errors by measuring deaths in patients admitted with, or for, a condition or procedure that has a low associated risk of death (i.e. headaches; tonsillectomy). This rating indicates the total number of deaths in low risk diagnostic groups during the reporting period. Methicillin-Resistant Staphyloccocus Aureus (MRSA) is a type of bacterial infection that is resistant to a number of widely used antibiotics. This rating indicates the total number of incidences of MRSA within the Trust during the reporting period. Clostridium Difficile (C-Diff) is a type of infectious diarrhoea that can be difficult to treat due to antibiotic resistance. This rating indicates the number of cases of C-Diff infections within the Trust during the reporting period. A high number may be indicative of infection control issues, such as hand hygiene. Never Events are serious, largely preventable patient safety incidents that should not occur if the available preventative measures have been implemented (i.e. wrong site surgery; wrong route administration of chemotherapy; retained instrument post-operation). The incidence of Never Events may indicate unsafe care. This rating indicates the number of Never Events that have occurred within the Trust during the reporting period. An SUI is a serious incident or event which led, or may have led, to the harm of patients or staff (i.e. Grade 3/4 pressure ulcer; data loss; HCAI outbreak; Never Events) This rating indicates the number of SUIs that have occurred within the Trust during the reporting period. Delivering Harm Free Care is a core component of the care that we provided to our patients. Harm Free Care is care that is provided in the absence of the four common harms: Pressure Ulcers; Falls; Catheter Associated Urinary Tract Infections (CAUTIs); and Venous Thromboembolism (VTE). This rating indicates the percentage of patients that received Harm Free Care at the Trust. A decreasing trend may indicate issues with the quality and safety or care provided to patients. A VTE (Venous Thromboembolism) is a blood clot that forms within a vein and is a serious, potentially fatal, medical condition. VTE Risk Assessments should be undertaken for every patient within 1 hour of admission. The rating indicates the percentage of patients that had a VTE risk assessment undertaken within 1 hour of admission. This Friends and Family Test (FFT) asks patients whether they would recommend the Trust's Inpatient services to their friends and family if they needed similar care or treatment. The Net Promoter Score (NPS) ranges from -100 to 100. A score that is higher than 0 is generally 'good', whilst a score above 50 is considered 'excellent'. The score is calculated by deducting the proportion of respondents who would not recommend the Trust from the proportion of respondents who would. It is important to ensure a high Net Promoter Response Rate (NPRR). A low response rate may mean that the FFT data is not robust, whereas a high response rate is more likely to provide valuable data which can be analysed for potential service improvement ideas. The NPRR is the proportion of people that responded to the FFT of the total that were eligible to do so. This Friends and Family Test (FFT) asks patients whether they would recommend the Trust's A&E services to their friends and family if they needed similar care or treatment. The Net Promoter Score (NPS) ranges from -100 to 100. A score that is higher than 0 is generally 'good', whilst a score above 50 is considered 'excellent'. The score is calculated by deducting the proportion of respondents who would not recommend the Trust from the proportion of respondents who would. It is important to ensure a high Net Promoter Response Rate (NPRR). A low response rate may mean that the FFT data is not robust, whereas a high response rate is more likely to provide valuable data which can be analysed for potential service improvement ideas. The NPRR is the proportion of people that responded to the FFT of the total that were eligible to do so. This Friends and Family Test (FFT) asks patients whether they would recommend the Trust's Maternity services to their friends and family if they needed similar care or treatment. Women will be asked for their views on their maternity services at three touch points: antenatal care; birth and care on the postnatal ward; and postnatal community care. The Net Promoter Score (NPS) ranges from -100 to 100. A score that is higher than 0 is generally 'good', whilst a score above 50 is considered 'excellent'. The score is calculated by deducting the proportion of respondents who would not recommend the Trust from the proportion of respondents who would. It is important to ensure a high Net Promoter Response Rate (NPRR). A low response rate may mean that the FFT data is not robust, whereas a high response rate is more likely to provide valuable data which can be analysed for potential service improvement ideas. The NPRR is the proportion of people that responded to the FFT of the total that were eligible to do so. When things do not go according to plan, a patient may decide to formally complain to the organisation. This will usually result in an investigation into the concerns raised and a formal response to the complainant. This rating indicates the total number of complaints received by the Trust within the reporting period. A high number of complaints, or an unexpected or prolonged rise in complaints, may warrant extra investigation into the matter. PLACE (Patient-led Assessments of the Care Environment) replaced the PEAT (Patient Environment Action Team) inspections in 2013. These are undertaken annual by teams, which include local people, to assess how the environment supports the patients' privacy and dignity, PLACE – Cleanliness; Facilities; Food; Privacy, food, cleanliness, and general building maintenance. Dignity, & Well being; This rating indicates how the Trust fared for each of the separate areas (i.e. cleanliness, food). The higher the percentage, the better the score. Pg 28 Trust Board Report Month 11 Glossary Definitions Page number Domain Sub-domain Quality Summary Patient Centredness Finance 8 3 Quality Patient Centredness 8 Quality Patient Centredness 8 (LQ35a) Did you get enough help from staff to eat your meals? Quality Patient Centredness 8 (CLQ14) Do you think hospital staff did everything they could to help control your pain? Quality Quality Quality Patient Centredness Patient Centredness Patient Centredness Quality Patient Centredness Quality Effectiveness Quality Effectiveness Indicator title (TC6) Involvement in care Capital Servicing Capacity (TC7) Worries and Fears Description "The most important goal of a modern health service is to achieve authentic patient participation. The lessons of the Francis inquiry into Stafford hospital are that the absence of patient participation is the root cause of poor care." - Tim Kelsey, Director, NHS-England. Engagement increasesCapacity the likelihood of successful whilst also improving our patients' The Capital Servicing indicates the degreetreatment, to which the organisation's generated incomeexperience. covers its financing obligations. This rating highlights the percentage of people that answered 'yes' to this question on the survey. The higher the score, the stronger the evidence that our staff have involved patients in the development of their treatment plans. Patients attending the Trust may require support in dealing with their worries and fears during their visit. Overcoming these obstacles is more likely to increase patient engagement with our services, whilst also improving their overall experience. This rating highlights the percentage of people that answered 'yes' to this question on the survey. The higher the score, the stronger the evidence that our staff provide sufficient support to patients to overcome their worries and fears. Some people may require extra help to ensure that they receive adequate nutrition whilst in hospital. It is important that we identify these patients and support them appropriately, as eating and drinking well while in hospital can help our patients get better sooner and reduce the risk of complications. This rating highlights the percentage of people that answered 'yes' to this question on the survey. The higher the score, the stronger the evidence that our staff assisted our patients to eat their meals. Good pain control can help to reduce risks and reduce the patient's length of stay in the hospital. If it is not well controlled, patients may, for example, not be able to breathe deeply or cough, increasing their risk of developing a chest infection; or they may not be able to walk or sit out in a chair, thereby increasing their risk of developing a deep vein thrombosis. This rating highlights the percentage of people that answered 'yes' to this question on the survey. The higher the score, the stronger the evidence that our staff are suitably skilled to ensure that our patients were as comfortable, and pain free, as possible during their stay. (CLQ29) Did you have confidence and trust in the doctors treating you? (CLQ10) Did you have confidence and trust in 8 the nurses treating you? (LQ36) Have you been treated with dignity 8 and respect by staff on this ward? It is important that patients have confidence in our doctors, and that they feel that they can trust them. This provides an element of security for the patient and allows them to engage with the service, i.e. by making informed choices about their care. This rating highlights the percentage of people that answered 'yes' to this question on the survey. The higher the score, the stronger the evidence that patients trust our doctors to treat them. It is important that patients have confidence in our nurses, and that they feel that they can trust them. This provides an element of security for the patient and allows them to engage with the service, i.e. by making informed choices about their care. This rating highlights the percentage of people that answered 'yes' to this question on the survey. The higher the score, the stronger the evidence that patients trust our nurses to treat them. It is important to ensure our patients are treated with dignity and respect, as evidence has shown a link between a failure to do so with a drop in both the patient experience and the quality of care that they experience. This rating highlights the percentage of people that answered 'yes' to this question on the survey. The higher the score, the stronger the evidence that the organisation treats our patients with dignity and respect in a consistent manner. The NHS has a key role to play in preventing all forms of harm, abuse and neglect, to our patients. Where abuse is suspected (whether physical, verbal, sexual, financial, or neglect), there is a duty to report this by raising a Safeguarding Alert. Safeguarding alerts generally regard 8 Safeguarding Adults : Referrals per month external organisations (i.e. nursing homes; NHS providers). This rating indicates the total number of safeguarding adults referrals were made in the previous month. A significant increase in the number of referrals may warrant further investigation and escalation to our commissioners, whilst a significant decrease may indicate underreporting of safeguarding concerns. Stroke is a preventable and treatable disease that affects approximately 110,000 people in England each year. A stroke occurrs when the blood supply to part of the brain is cut off, which can be caused by a blockage within one of the vessels within the brain or a bleed in the Stroke Care : % of patients scanned within 1 9 brain. Early intervention is linked with better patient outcomes, including reduced morbidity and dependency. hr of arrival at hospital This rating indicates the proportion of patients that had a brain scan within 1 hour of arrival at the hospital. A higher percentage means that we are ensuring that our patients are receiving the right diagnostic intervention at the right time. Stroke Care : % of potentially eligible patients Thrombolysis is the use of drugs to break up a blood clot. When given in a timely manner, this can significantly improve the outcome for patients, such as a decreased likelihood of complications. 9 thrombolysed within 45 Minutes This rating indicates the proportion of eligible patients that were treated with thrombolysing drugs within 45 minutes of arrival at the hospital. 8 Pg 29 Trust Board Report Month 11 Glossary Definitions Page number Domain Sub-domain Indicator title Description Quality Summary Efficiency Finance 10 3 Theatre Utilisation Rate Capital Servicing Capacity Quality Efficiency 10 Average Length of Stay - Elective Quality Efficiency 10 Average Length of Stay – Non Elective Quality Efficiency 10 Pre Op Length of Stay The number of days that a patient stays in an overnight bed prior to an operation Quality Efficiency 10 Post Op Length of Stay The number of days that a patient stays in an overnight bed following an operation Quality Efficiency 10 Day of Surgery Admission Quality Efficiency 11 Day Case Rate Quality Efficiency 11 DNA – first Appointment Quality Efficiency 11 DNA – follow-up appointment Quality Efficiency 11 Quality Efficiency Quality Efficiency Theatres are used to undertake surgical procedures. Well-organised theatres can treat more patients within the same timeframe, making them more efficient. Low utilisation rates may indicate problems with the environment, staff attendance, or poor organisation. This can thenCapital impactServicing on the timeliness of care provided to patients surgery. generated income covers its financing obligations. The Capacity indicates the degree to whichawaiting the organisation's This indicator aims to highlight the average number of days a patient spends in the hospital in relation to a specific elective surgery. An elective surgery is surgery that is scheduled in advance because it does not involve a medical emergency (i.e. a mastectomy or inguinal hernia surgery). Shorter lengths of stay indicates more efficient and effective care, whilst also meaning that the patient is able to return home earlier and recuperate in a familiar surrounding. This rating denotes the average number of days a patient spends in hospital in relation to an elective surgery. This indicator aims to highlight the average number of days a patient spends in the hospital in relation to a specific non-elective surgery. A non-elective surgery is surgery that occurs as a result of a medical emergency (i.e. an injury or illness that is acute and poses an immediate risk to a person's life or long term health). Shorter lengths of stay indicates more efficient and effective care, whilst also meaning that the patient is able to return home earlier and recuperate in a familiar surrounding. This rating denotes the average number of days a patient spends in hospital in relation to non-elective surgery. The percentage of patients that are admitted on the day of their surgery The percentage of patients who are admitted to hospital for a planned surgical procedure, returning home on the same day. A DNA (Did Not Attend) occurs where a patient fails to attend an arranged appointment without cancelling it beforehand. DNAs cost the NHS an average of £108 per appointment. When a patient DNAs their first appointment, they may be discharged back to their GP. This rating details the proportion of first appointments that were marked as 'DNA'. A DNA (Did Not Attend) occurs where a patient fails to attend an arranged appointment without cancelling it beforehand. DNAs cost the NHS an average of £108 per appointment. When a patient DNAs two follow-up appointments, they may be discharged back to their GP. This rating details the proportion of follow-up appointments that were marked as 'DNA' Appointments are sometimes cancelled by a service within the hospital. This should only occur in very limited circumstances - such as in an emergency or when a member of staff is ill. Hospital instigated cancellations also impact on the hospital's efficiency and potentially Hospital Appointment Cancellations (hospital delays treatment for our patients. instigated) This rating details the proportion of appointments that were cancelled by the hospital. A high percentage may indicate areas of concern which require further investigation. Appointments Not Checked In or DNA’d Within any organisation, it is important to monitor and investigation incidences of data quality issues. This indicator aims to highlight potential data quality issues regarding registering patients upon their arrival to the hospital. 11 (Appointment Date within the last 90 days) This rating indicates the total number of appointments showing as either 'Not Checked In' (i.e. arrived at the hospital) or 'DNA' (Did Not Attend) within the last 90 days. Appointments in a status of Checked In but Within any organisation, it is important to monitor and investigation incidences of data quality issues. This indicator aims to highlight potential data quality issues regarding registering patients upon their arrival to the hospital. 11 not Checked Out This rating indicates the total number of appointments showing as 'Checked In' (i.e. arrived at the hospital) within the last 90 days, but where they have not been 'Checked Out' (i.e. had their appointment) Pg 30 Trust Board Report Month 11 Glossary Definitions Page number Domain Sub-domain Indicator title Quality Summary Timeliness Finance 12 3 18 Capital weeks referral treatment ServicingtoCapacity Quality Timeliness 12 A&E maximum waiting times 4 hours Quality Timeliness Percentage Cancelled Operations rebooked 12 within 28 days Quality Timeliness 12 Quality Timeliness 13 Quality Timeliness 13 Quality Timeliness 13 Quality Equity 14 Quality Equity 14 Quality Equity 14 Quality Equity 14 Female Genital Mutilation Caseload Quality Equity 14 Patients detained under the Mental Health Act Description Patients have a legal right to commence NHS consultant-led treatment within a maximum of 18 weeks from referral, unless the patient chooses to wait longer or it is clinically appropriate to do so. The Capital Servicing Capacity indicates the degree to which the organisation's generated income covers its financing obligations. The Trust's service-level waiting times can be compared to other Healthcare Providers across England. Patients should be seen, treated, admitted, or discharged in under four hours of presenting at A&E. The national target is 95%. Where a patient's surgery appointment has been cancelled by the hospital, they have a right to be provided a new appointment date that occurs within 28 days of the original operation. This rating indicates the percentage of cancelled operations that were rebooked to occur within 28 days of the original operation. Surgical operations may be cancelled for both clinical and non-clinical reasons. The former relates to, for example, where a patient is too unwell to undergo surgery, thereas the latter might occur in instances whereby the theatre is required for an alternate emergency Percentage Non Clinical Cancelled Operations operation. Whilst some cancellations may be unavoidable, it is important to minimise these as it reduces the efficiency of Trust and may be distressing and inconvenient for patients. This rating provides a percentage of operations that were cancelled for non-clinical reasons. 2 week wait from referral to date first seen all Patients have a right to be seen by a specialist within a maximum of 2 weeks from GP referral where cancer is suspected. urgent referrals 2 week wait from referral to date first seen These ratings indicate the percentage of patients that were seen within the 2 week target. breast cancer 31 days standard from diagnosis to first treatment In cases where cancer has been confirmed, patients should wait no more than 31 days from the decision to treat (either as initial or subsequent treatment) to the start of their treatment. 31 days standard to subsequent cancer treatment This rating indicates the percentage of patients that were treated within 31 days of a cancer diagnosis, or within 31 days of deciding that subsequent treatment is required. 62 day wait for first treatment from NHS In cases where a patient has been referred for suspected cancer, and where cancer has subsequently been confirmed, patients have a right to commence NHS treatment within a maximum of 62 days from referral for suspected cancer. This rating indicates the percentage of patients that were treated within 62 days of referral for suspected cancer. Screening Services referral / GP referral Dementia is a common condition that affects about 800,000 people in the UK. The risk of developing dementia increases as you get older, and usually occurs in people over the age of 65. Most types of dementia cannot be cured, but its progression can be slowed down it detected early. Therefore, it is important to assess patients at risk of developing patients for signs of dementia, as well as undertaking investigations and referring patients to memory specialists if appropriate. CQUIN – Dementia: Find & Assess; This indicator is a combination of three ratings. The first indicator highlights the percentage of eligible patients that were risk assessed. The second highlights the percentage of appropriate patients that underwent further investigation, with the third being the percentage of Investigate; & Refer appropriate patients that were referred onto specialist services. Being in mixed-sex hospital accommodation can be difficult for some patients for a variety of personal and cultural reasons. Therefore, all providers of NHS-funded care are expected to eliminate mixed-sex accommodation (except where it is in the overall best interest of the patient or reflects their personal choice). Hospitals can face a fine of up to £250 for breaching same-sex accommodation guidance. Mixed Sex Accommodation This rating highlights the total number of times that the same-sex accommodation guidance was breached during the reporting period. Everyone has a responsibility for safeguarding vulnerable people, whether children or adults. Safeguarding is the protection of our patients from maltreatment, such as neglect; emotional, physical, sexual, discriminatory, institutional or financial abuse. Our responsibilities Safeguarding Training - Adults; Children include training our staff to ensure that they are competent to identify, and then act on, safeguarding concerns. (levels 1 - 3) This rating indicates the percentage of staff that have attended their Safeguarding training within the last 3 years. Pg 31 The total number of patients identified as having FGM before the Reporting Period Start Date, who are actively being treated on the Trust active caseload The number of patients detained under the Mental Health Act 1983 in month Trust Board Report Month 11 Glossary Definitions Page number Domain Sub-domain Indicator title People Summary People Finance 16 3 Voluntary Turnover Rate Capital Servicing Capacity People People 16 Operating Vacancy Rate People People 16 Non-recruited Vacancy Rate People People 16 Sickness Absence Rate People People 16 People People People People People People People People 16 Local Induction People People 16 Statutory Mandatory People People 16 Bank Spend (%) People People 16 Agency Spend (%) People People 16 Corporate Welcome Attendance People People 18 Average fill rate – nurses / care staff; day / night Consultant Performance and Development Review (PDR) Rate Band 8c-9 Performance and Development 16 Review (PDR) Rate Band 7 - 8a Performance and Development 16 Review (PDR) Rate Band 2-6 Performance and Development 16 Review (PDR) Rate Pg 32 Description The turnover rate highlights the rate at which an employer loses and gains employees. A certain amount of turnover is unavoidable, although too much may indicate areas of concern within the organisation. this the numbers of people who choose to leave the Trust voluntarily andincome is shown as a its percentage the average numbers of people employed. A certain level of turnover is expected and unavoidable and this metric is used to monitor this and to highlight The metric Capitalmeasures Servicing Capacity indicates the degree to which the organisation's generated covers financing of obligations. potential areas of concern, within the organisation, where turnover appears to be higher than expected. this metric measures the number of positions within the Trust which are vacant and is shown as a percentage of the total number of positions which are required to deliver the Trusts services. It is used to monitor levels of directly employed people, linking to service changes, future requirements and areas where recruitment may be difficult. this metric measures the number of positions within the Trust which are vacant and which have no appointed candidate waiting to join. It is used to understand levels of recruitment activity and the expected numbers of new joiners in the future. this metric measures the amount of working hours lost to sickness absence and is shown as a percentage of total contracted hours available. It is used to monitor levels of sickness absence, highlighting potential areas of concern when sickness is higher than expected and directing further analysis to understand trends or specific health at work issues. appraisal is an essential element of the revalidation process and this metric measures the number of Consultants, within the Trust who have had an appraisal during the past year; shown as a percentage of the total number of Consultants within the Trust. This metric is used to monitor compliance and to focus attention on areas where compliance is below expected levels. all Trust employees are required to have a PDR each year; reviewing performance over the past year, setting new objectives and creating a personal development plan. This metric allows us to understand and monitor the numbers of completed PDR’s and to focus attention on areas where compliance is below expected levels. all Trust employees are required to have a PDR each year; reviewing performance over the past year, setting new objectives and creating a personal development plan. This metric allows us to understand and monitor the numbers of completed PDR’s and to focus attention on areas where compliance is below expected levels. all Trust employees are required to have a PDR each year; reviewing performance over the past year, setting new objectives and creating a personal development plan. This metric allows us to understand and monitor the numbers of completed PDR’s and to focus attention on areas where compliance is below expected levels. when new people join us, it is essential they are fully briefed locally about policies procedures and protocols in the form of a local Induction. This metric measures how many people have completed their local induction and allows us to focus on areas where compliance is lower than expected Certain training courses are mandatory and are designed to ensure the safety and well-being of all our staff and patients. It also ensures that staff keep up to date with professional standards. The training includes, amongst others, Fire Training; Safeguarding Training; & Equality and Diversity Training. this metric shows us how many people have completed their statutory (i.e. fire) and other mandatory training. There are over 20 different topics of training which healthcare staff need to complete on a 3 yearly cycle. The metric shows us how many people are up to date with their training and highlights areas where training compliance is below expected levels. this metric shows the percentage of the paybill which is attributed to temporary bank and agency workers. It is used to understand levels of temporary staffing required to cover vacancies, sickness absence and increases in activity or capacity alongside the resources available and expected levels of use. this metric shows the percentage of the paybill which is attributed to temporary bank and agency workers. It is used to understand levels of temporary staffing required to cover vacancies, sickness absence and increases in activity or capacity alongside the resources available and expected levels of use. The Corporate Welcome Attendance is mandatory for all new staff and is an opportunity for staff to familiarise themselves with the Trust, meet new colleagues, and undertake face to face mandatory training courses. this metric shows us how many of our new joiners have attended our essential Corporate Welcome event. This is an important event enabling us to welcome our new joiners and to share with them core Trust messages around patient experience, quality and safety. This metric shows us how many people have competed corporate welcome within 8 weeks of joining. The Francis report explicitly stated that poor staffing levels at Mid Staffordshire led to poor quality care. Organisations are now required to publish details of staffing levels on each of their wards every month, including the percentage of shifts that met the safe staffing requirements. This rating indicates the percentage of shifts that met the agreed safe staffing requirements. Trust Board Report Month 11 Glossary Definitions Page number Domain Sub-domain Indicator title Description Finance Finance Summary Finance 20 Liquidity ratio 3 Capital Servicing Capacity The Liquidity ratio is based on a calculation of the Trust's available capital against outstanding debt. A high ratingServicing indicatesCapacity that theindicates Trust hasthe a low risk of The Capital degree to defaulting. which the organisation's generated income covers its financing obligations. Finance Finance 20 Capital Servicing Capacity Finance Finance 21 - 24 Daycase Finance Finance 21 - 24 Elective Inpatients Finance Finance 21 - 24 Non Elective Inpatients Finance Finance 21 - 24 First Outpatient Finance Finance 21 - 24 Follow-up Outpatient Finance Finance 21 - 24 Adult Critical Care Finance Finance 21 - 24 Research & Education Research & Education 26 Research & Education Research & Education 26 Research & Education Research & Education 26 Research & Education Research & Education Research & Education Research & Education Research & Education Research & Education Research & Education Research & Education Research & Education Research & Education The Capital Servicing Capacity indicates the degree to which the organisation's generated income covers its financing obligations. A high rating indicates that the Trust has a low risk of defaulting. Daycases are elective surgeries that do not usually require a patient to be admitted to hospital (i.e. have an overnight stay). Elective surgeries are scheduled (i.e. a mastectomy or inguinal hernia repair). This rating denotes the total number of daycase surgeries that were undertaken during the reporting period. Elective inpatients includes all patients that were admitted to hospital (i.e. had an overnight stay) for a scheduled surgical procedure (i.e. a mastectomy or inguinal hernia repair). This rating denotes the total number of elective inpatients during the reporting period. Non-elective inpatients includes all patients that were admitted to hospital (i.e. had an overnight stay) for emergency medical intervention (i.e. an injury or illness that is actue and poses an immediate risk to a person's life or long term health). This rating denotes the total number of non-elective inpatients during the reporting period. First outpatient appointment are primarily for the patient to discuss their concerns with an appropriate clinician and to coordinate their future care plan with the clinician (including which diagnostic tests to undertake, or which medical intervention is required). This rating denotes the total number of first outpatient appointments that took place during the reporting period. Follow up outpatient appointment are primarily for the patient to discuss any new concerns with a clinician, to discuss any investigations that may have been undertaken, and, if appropriate, to agree an appropriate treatment plan. This rating denotes the total number of follow up outpatient appointments that took place during the reporting period. Adult critical care encompasses patients that require high dependency or intensive care following, for example, surgical interventions or serious illnesses or traumatic injuries. In the UK, it costs around £1,328 per bed, per day, for an adult intensive care unit. This rating denotes the total number of adult patients that required critical care during the reporting period. There are over 21 million attendances at A&E (Accident & Emergency) departments in England each year. A&E departments assess and treat patients with serious injuries or illnesses (i.e. loss of consciousness; chest pain; severe bleeding that cannot be stopped). This rating denotes the total number of A&E attendances in the Trust during the reporting period. Research is a major priority at Imperial College Healthcare NHS Trust. Medical research is essential for developing new and improved medical treatments to improve the health of both adults and children. It is, therefore, important that research is undertaken in a timely Time elapsed between receipt of Valid manner after research applications have been approved. Research Application and First Patient There are two ratings associated with this indicator - the mean and median. The mean provides the average length of time elapsed between receipt of a valid research application and the first patient recruitment, whilst the median provides the 'middle number' in a list of Recruitment for interventional studies (mean) these times. The median indicator are used to ensure that anomalous results have not significantly affected the average (i.e. skewing it). Percentage of interventional studies which recruited 1st patient within 70 days of Valid This indicator is identical to the above, although the rating indicates the percentage of studies which recruited their first patient within 70 days of a Valid research application. Research Application Percentage of closed commercially-sponsored Imperial College Healthcare NHS Trust works closely with commercial enterprises, such as pharmaceutical companies, in the undertaking of medical research to develop and improve new treatments. It is, therefore, important that research is undertaken in a timely manner interventional studies that recruited to time after applications have been approved, in accordance with bespoke targets to the research item involved. This rating provides a percentage of commercially-sponsored interventional studies that recruited to time and to target. and to target Percentage of local R&D reviews for NIHR Local R&D review is a measure of the time taken by the Trust to give approval for clinical research studies to take place at any of our sites. This is a legal requirement, which aims to ensure that all studies taking place at ICHT are appropriately resourced and meet our own CRN Portfolio studies given within 30 days standards and policies. However, it is also important to ensure this process is completed in a reasonable timescale, to allow study sponsors to set up studies as quickly as possible and for patients to enter these studies. The NIHR Clinical Research Network Portfolio is a major Total number of NIHR Clinical Research The NIHR Clinical Research Network Portfolio is an important subset of all the clinical research studies undertaken at ICHT, these having been reviewed nationally for scientific quality and applicability to the NHS. It is our strategic aim, and that of the NIHR, to grow the number Network (CRN) portfolio studies to which the of studies being carried out at ICHT year on year, enabling more of our patients to take part in research. This indicator aims to demonstrate that growth. Total number of participants enrolled in NIHR The NIHR Clinical Research Network Portfolio is an important subset of all the clinical research studies undertaken at ICHT, these having been reviewed nationally for scientific quality and applicability to the NHS. It is our strategic aim, and that of the NIHR, to enable more of CRN Portfolio Studies (Cumulative YTD) our patients to participate in research. This indicator aims to demonstrate that growth. Number of commercial NIHR CRN Portfolio Commercially-sponsored / funded clinical research is an important part of our overall R&D strategy, and that of the NIHR. It is important for the UK to be competitive on the global stage in attracting commercial investment in clinical research. Growing the number of studies to which the Trust is recruiting commercial studies at ICHT is an important indicator of our ability to do this. Total number of participants enrolled in NIHR Commercially-sponsored / funded clinical research is an important part of our overall R&D strategy, and that of the NIHR. It is important for the UK to be competitive on the global stage in attracting commercial investment in clinical research. Enabling more of our patients to CRN Portfolio Studies take part in commercially-sponsored studies at ICHT is an important indicator of our ability to do this. A&E Attendances 26 26 26 26 26 Pg 33 Trust Board Report Month 11 Trust Board - Public: 25 March 2015 Agenda No: 2.4 Paper No: 7 Trust Board - Public Agenda Item 2.4 Title Finance Performance report Report for Noting Report Author Alan Goldsman, Interim Chief Financial Officer Responsible Executive Director Alan Goldsman, Interim Chief Financial Officer Executive Summary: This report provides a brief summary of the Trust’s financial results for the 11 months ended 28th February 2015. Recommendation to the Board: The Board is asked to note this paper. Trust strategic objectives supported by this paper: • To achieve excellent patient experience and outcomes, delivered efficiently and with compassion. • To educate and engage skilled and diverse people committed to continual learning and improvement. • As an Academic Health Science Centre, to generate world leading research that is translated rapidly into exceptional clinical care. • To pioneer integrated models of care with our partners to improve the health of the communities we serve. Page 1 of 6 Trust Board - Public: 25 March 2015 Agenda No: 2.4 Paper No: 7 FINANCE REPORT – 11 MONTHS ENDED 28 February 2015 1) Introduction This report provides a brief summary of the Trust’s financial results for the 11 months ended 28 February 2015. The Board is asked to note this paper. 2) Summary The Trust has arguably seen its best financial performance of the year in February; setting aside an unusual deficit plan profile for the month and the revised assumptions for Project Diamond funding. NHS and Private Care income is significantly above plan resulting in a favourable variance in February of a little under £1m. This result should be caveated by noting the continuing requirement to supplement the efficiency programme with non-recurrent reserves (£2.5m) and some concern over the inmonth pay position. The underlying run-rate assumptions for 2015 / 16 planning do not change. The drivers to achieving a break even position are focussed on delivering on CQUIN and Performance Bond income (where up to £10m is available) and the final component of balance sheet support. 2.1) Development reserve The chart below shows the funds generated for capital and development. £Ms Surplus for Development Reserve 50 45 40 35 30 25 20 15 10 5 0 34.7 29.0 31.8 21.1 12.7 1.2 3.6 6.2 Apr May Jun 25.4 26.6 16.4 Actual Plan 6.1 Jul Aug Sep Oct Nov Dec Jan Feb Mar After 11 months the Trust is reporting a surplus for development of £26.7m; compared to plan (£41.9m) this represents an adverse variance of £15.2m (of which £11.1m is the plan surplus based on Project Diamond). This surplus has improved by £1.3m in February and is expected to recover by a further £8m to year end; of which £5m will be from performance and £3m is the depreciation accrued for March. [Board is asked to note that the planned development surplus of £47.1m comprises Page 2 of 6 Trust Board - Public: 25 March 2015 Agenda No: 2.4 Paper No: 7 depreciation (funded in our prices - £34.7m), the retained surplus (£11.1m) and donations (£1.3m)]. The February results show that improvements in recruitment to substantive posts has not yet been offset by a reduction in bank use (£400k adverse in run-rate); although some winterpressures funding is available to offset that cost. This increase is not accounted for in the projected year end run rate and it will be important to ensure that investments in meeting winter pressures are taken out when funding is exhausted. For NHS and private care income the position continues to improve but the underlying benefit does not fully offset the CIP gap. 2.2) Retained surplus At the retained surplus level the Trust is reporting a deficit of £4.7m (after adjusting for the impairment of fixed assets and for donated assets), an adverse variance against the plan of £14.4m. This includes the reduction in planned income from Project Diamond of £12.1m YTD, and is supported by the realisation of £3.6m of one-off and non-recurrent income for estate related items, the assumption of full payment for winter resilience and additional waiting list monies of £8.8m. This position will improve to breakeven at year as noted above. 3) Cash The chart below shows the cash balance at the end of February (£65.1m) using the scale on the left hand axis and the liquidity days for the Trust, using the scale on the right. The balances over the last 12 months are shown for reference: 80,000 35 70,000 30 60,000 25 50,000 20 40,000 15 30,000 10 20,000 10,000 5 0 0 Cash (£000s) Jan- Feb- Mar Apr- May Jun- Jul- Aug- Sep- Oct- Nov Dec- Jan- Feb14 14 -14 14 -14 14 14 14 14 14 -14 14 15 15 54,7 69,3 50,4 51,9 60,4 45,6 56,5 46,8 34,1 47,8 45,2 41,3 42,5 65,1 Liquidity (Days) 23 29 26 26 26 23 26 27 26 27 29 29 26 Cash (£000s) Liquidity (Days) 26 The cash balance at the end of the month was £65.1m, £11.2m above the plan. This pattern is quite common at year end as Commissioners clear their positions and the Trust reaches settlement on the overall contract position (see Feb 14). The variance comprises an increase in income from commissioners of £4.1m and a reduction in payments of £3.4m (due to Page 3 of 6 Trust Board - Public: 25 March 2015 Agenda No: 2.4 Paper No: 7 slippage against the capital programme and delays in payments to suppliers since outsourcing the Accounts Payable function). The forecast year-end cash balance has been reduced by £13.2m to £43.4m due to the loss of Project diamond income. Cash is monitored on a daily basis, with surplus cash being invested in the National Loan Fund scheme. 4) Revenue The Appendix provides a summary of the position after 11 months. The annual plan is forward phased and unusually February shows a plan deficit in the month of £2.3m. The in-month deficit of £1.3m therefore represents a favourable variance of £1m. 4.1) Income Income exceeded plan by £3.6m in February; of which half is for research and development (£1.8m) with a corresponding offset in additional expenditure recorded as non-pay. High cost drugs, charged at cost to NHSE increased by £0.9m. Further work to produce an activity and income summary in a suitable format for board consideration is underway. NHS Clinical income improved by £3.1m (electives £1.6m and outpatient procedures £1.8m) and the private care position has improved by £0.7m. Other than for the items noted in section 5) below covering clinical transformation and CQUIN funding, additional income, even under a block contract with CCGs, has been earned for improvements in referral to treatment times (£5.4m), for winter pressures (£1.8m) and a number of other schemes (£2.3m). For NHS England (contracted on a tariff and cost recovery mechanism for drugs) there is under performance in the activity part of the contract (£9.1m) and over performance in drugs expenditure (£10.8m). The Trust has received formal confirmation from NHS England of £4.1m in-year payment of Project diamond funding instead of the planned £17.3m received in 13/14 and this is now reported separately. This loss of £13.2m of income will have a direct impact on reducing both the Trust’s revenue surplus and cash position. 4.2) Expenditure The run rate for pay costs increased by £0.4m in February, comprising an increase in substantive pay costs on the back of a significant programme of recruitment to vacancies, but no reduction in bank staffing costs (the agency run rate has improved by £200k). The non-pay expenditure variance (£2.7m) is explained by the two items matched by income and noted above. Elsewhere a review of balance sheet provisioning has improved the position by £2.5m. Further explanation of the underlying non-pay position in February is required; in the context of the CIP programme. 4.3) Cost Improvement Plan The Board received a diagnostic review of the underlying revenue position at its last meeting; including commentary on the veracity of the CIP plan. Delivery against the approved plan in month 11 continues the trend established over the year with adverse performance in-month of £1.7 million mitigated by non-recurrent resources. There has been some improvement in the Page 4 of 6 Trust Board - Public: 25 March 2015 Agenda No: 2.4 Paper No: 7 forecast CIP outturn, due to an improvement in private patient’s schemes. 5) Capital The Trust’s annual Capital Resource Limit (CRL) has been formally increased from £30m to £33m, with £2m relating to a previous application and a further £1m for a successful bid to a Nursing Technology Fund. This has increased the overall capital programme to £36m; including charity schemes. Year to date expenditure of £20m is behind plan by £6.7m; mainly due to slippage on the capital maintenance and ICT programmes (£5.3m) but is expected to catch up by year end. 6) Conclusion At the time of writing the Trust has only two weeks to go until the end of the year and expenditure is now largely locked in. The drivers to achieving a break even position are focussed on delivering on CQUIN and Performance Bond income (where up to £10m is available) and a detailed action plan is in place to secure this. Recommendation to the Board: The Board is asked to note this paper. Page 5 of 6 Trust Board - Public: 25 March 2015 Agenda No: 2.4 Paper No: 7 Appendix Statement of Comprehensive Income – 11 months to 28th February 2015 In Month Year To Date (Cumulative) Plan Actual Variance Plan Actual Variance £000s £000s £000s £000s £000s £000s Income Clinical (excl Private Patients) 57,404 60,507 3,103 673,422 691,002 17,580 Private Patients 3,234 3,968 734 35,590 38,870 3,280 Research & Development & Education 9,254 10,982 1,727 101,798 101,873 76 Other 6,025 5,188 (837) 59,663 57,621 (2,041) Project Diamond 1,442 342 (1,100) 15,858 3,758 (12,100) TOTAL INCOME 77,359 80,987 3,627 886,331 893,125 6,794 (40,575) (40,702) (128) (445,122) (442,883) 2,239 Pay - Bank (1,164) (2,718) (1,554) (12,750) (27,427) (14,677) Pay - Agency (1,558) (2,980) (1,422) (17,776) (35,673) (17,897) (18,606) (21,305) (2,699) (210,956) (220,787) (9,831) (3,455) (2,638) 817 (38,301) (33,791) 4,510 Other (10,376) (8,337) 2,039 (107,486) (94,315) 13,171 TOTAL EXPENDITURE (75,735) (78,681) (2,946) (832,391) (854,875) (22,485) 1,624 2,305 681 53,940 38,250 (15,690) Financing Costs (4,038) (3,715) 323 (199,372) (167,666) 31,706 SURPLUS / (DEFICIT) including donated asset treatment (2,414) (1,409) 1,004 (145,432) (129,416) 16,016 0 0 0 154,538 123,818 (30,720) 111 71 (40) 553 855 302 (2,303) (1,338) 965 9,659 (4,743) (14,402) Expenditure Pay - In post Drugs & Clinical Supplies General Supplies Earnings Before Interest, Tax, Depreciation & Amortisation Impairment of Assets Donated Asset treatment SURPLUS / (DEFICIT) Page 6 of 6 Meeting Details: Date Agenda No: 3.1 Paper No: 8 Trust Board Public Agenda Item 3.1 Title NHS Trust Development Authority Self-Certifications Report for Noting & Approval Report Author Alan Goldsman, Chief Financial Officer Responsible Executive Director Freedom of Information Status Alan Goldsman, Chief Financial Officer Report can be made public Executive Summary: As part of the on-going oversight by the NHS Trust Development Authority (TDA) the Trust is required to submit self-certified declarations on a monthly basis. The Board is asked to retrospectively approve the December 2014, January 2015 and February 2015 submissions and to approve the March 2015 submission. In addition requires the Monitor submission as part of the Foundation Trust preparation. This is presented here in one document to cover all four periods; since no changes have been made. Recommendation to the Board: The Board is asked to approve the Trust Development Agency self-certifications. Page 1 of 6 Meeting Details: Date Agenda No: 3.1 Paper No: 8 OVERSIGHT: Monthly self-certification requirements - Compliance Monitor. Monthly Data: December 2014 Submitted 31/01/2015 1. Condition G4 – Fit and proper persons as Governors and Directors (also applicable to those performing equivalent or similar functions). 2. Condition G5 - Having regard to monitor guidance. 3. Condition G7 – Registration with the Care Quality Commission. 4. Condition G8 – Patient eligibility and selection criteria. 5. Condition P1 – Recording of information. 6. Condition P2 – Provision of information. 7. Condition P3 – Assurance report on submissions to Monitor. 8. Condition P4 – Compliance with the National Tariff. 9. Condition P5 – Constructive engagement concerning local tariff modifications. 10. Condition C1 – The right of patients to make choices. 11. Condition C2 – Competition oversight. 12. Condition IC1 – Provision of integrated care. Further guidance can be found in Monitor's response to the statutory consultation on the new NHS provider licence: The new NHS Provider Licence COMPLIANCE WITH MONITOR LICENCE REQUIREMENTS FOR NHS TRUSTS: Condition Q1. Condition G4 Fit and proper persons as Governors and Directors. (Also applicable to those performing equivalent or similar functions). ICHT Response: Yes Explanation: All Governors and Directors pass the fit and proper persons test. Executive lead Jayne Mee, Director of People and Organisational Development. Q2. Condition G5 Having regard to monitor guidance. ICHT Response: Yes Explanation: Q3. Condition G7 Registration with the Care Quality Commission. ICHT Response: Yes Explanation: Q4. Condition G8 Patient eligibility and selection criteria. ICHT Response: Yes Explanation: This condition requires licensees to set and publish transparent patient eligibility and selection criteria and to apply these in a transparent manner. This includes criteria for determining patient eligibility for particular services, for accepting or rejecting referrals or determining the manner in which services are provided. The Trust fulfils this condition through a range of methods including; use of the ICHT access policy which sets out transparently how the Trust manages referrals and access to services, co-design with CCGs and NHSE of the eligibility criteria for access to specialist tertiary services and publication of these criteria to health care professionals and patients, use of specific processes to seek funding approval for those procedures where contractually prior commissioning approval is required, compliance with the standards set out within the NHS Constitution. Q5. Condition P1 Recording of information. ICHT Response: Yes Explanation: Q6. Condition P2 Provision of information. ICHT Response: Yes Explanation: Q7. Condition P3 Assurance report on submissions to Monitor. ICHT Response: Yes Explanation: Q8. Condition P4 Compliance with the National Tariff. ICHT Response: Yes Explanation: Q9. Condition P5 Constructive engagement concerning local tariff modifications. ICHT Response: Yes Explanation: Q10. Condition C1 The right of patients to make choices. Alan Goldsman, Chief Financial Officer Janice Sigsworth, Director of Nursing Steve McManus, Chief Operating Officer. Alan Goldsman, Chief Financial Officer Alan Goldsman, Chief Financial Officer Alan Goldsman, Chief Financial Officer Alan Goldsman, Chief Financial Officer Alan Goldsman, Chief Financial Officer Steve McManus, Chief Operating Officer. Page 2 of 6 Meeting Details: Date Agenda No: 3.1 ICHT Response: Yes Explanation: This condition protects patients’ rights to choose between providers by obliging providers to make information available and act in a fair way where patients have choice of provider. ICHT achieves this condition through a range of initiatives including; publishing waiting times through Choose & Book to support patients and their GP in making informed decisions in the GP surgery, working closely with CCGs and NHSE to draft and implement referral criteria/pathways for access to specialist services. Q11. Condition C2 Competition oversight. ICHT Response: Yes Explanation: Q12. Condition IC1 Provision of integrated care. ICHT Response: Yes Explanation: This condition states that the licensee shall not do anything that could reasonably be regarded as detrimental to enabling integrated care. ICHT works in partnership with commissioners to develop integrated care and whole systems approaches to developing patient pathways including; co-design and piloting of a virtual ward, development of joined community and secondary care outpatient services, improvements to electronic communications relating to patient records. Paper No: 8 Alan Goldsman, Chief Financial Officer Steve McManus, Chief Operating Officer. Page 3 of 6 Meeting Details: Date Agenda No: 3.1 Paper No: 8 NHS TRUST DEVELOPMENT AUTHORITY OVERSIGHT: Monthly self-certification requirements - Board Statements Monthly Data: December 2014, Submitted 31/01/2015 CLINICAL QUALITY FINANCE GOVERNANCE The NHS TDA’s role is to ensure, on behalf of the Secretary of State, that aspirant FTs are ready to proceed for assessment by Monitor. As such, the processes outlined here replace those previously undertaken by both SHAs and the Department of Health. In line with the recommendations of the Mid Staffordshire Public Inquiry, the achievement of FT status will only be possible for NHS Trusts that are delivering the key fundamentals of clinical quality, good patient experience, and national and local standards and targets, within the available financial envelope For CLINICAL QUALITY, that: Executive lead Q1. Chris Harrison, The Board is satisfied that, to the best of its knowledge and using its own processes and having had regard to the TDA’s Medical Director oversight model (supported by Care Quality Commission information, its own information on serious incidents, patterns of complaints, and including any further metrics it chooses to adopt), the trust has, and will keep in place, effective arrangements for the purpose of monitoring and continually improving the quality of healthcare provided to its patients. ICHT Response: Yes Explanation: Governance arrangements in place to assure quality of care with clear accountability and reporting. Q2. Janice Sigsworth, The Board is satisfied that plans in place are sufficient to ensure on-going compliance with the Care Quality Director of Nursing Commission’s registration requirements. ICHT Response: The Board is satisfied that the Trust meets the CQC registration requirements and is registered with no conditions. Following the CQC inspection in September 2014, the Trust received a number of compliance actions. An action plan has been approved by the Trust Board and CQC to address these regulatory breaches. Q3. The Board is satisfied that processes and procedures are in place to ensure all medical practitioners providing care on behalf of the trust have met the relevant registration and revalidation requirements. ICHT Response: Yes Explanation: Responsible officer in place with governance arrangements to provide assurance. For Finance, that: Q4. The Board is satisfied that the trust shall at all times remain a going concern, as defined by the most up to date accounting standards in force from time to time. ICHT Response: Yes Explanation: The Trust remains a going concern as defined by the most up to date accounting standards. The Board considers annually the Going Concern of the Trust as per IAS 1. The accounts for 2013/14 were prepared on a ‘Going Concern’ basis with a paper reviewed by the May Trust Board that supported this conclusion. For GOVERNANCE, that: Q5. The Board will ensure that the trust remains at all times compliant with the NTDA accountability framework and shows regard to the NHS Constitution at all times. ICHT Response: Yes Explanation: A detailed review of the NTDA Accountability Framework and the NHS Constitution was undertaken in February 2014 by Governance/FT Team. In respect of NTDA Accountability Framework, this document sets out how the TDA will work with the Trust on a day to day basis and how it will measure etc. The Trust continues to be an aspirant FT, and has regular involvement and meetings with TDA. The review looked at the themes and approval model and concluded the Trust was, at that time, on track. Notwithstanding the delay in FT timetable following the CQC inspection in September 2014, the work undertaken for the QGF and BGAF reviews provides evidence that the Trust remains compliant with the NTDA framework. The NHS Constitution has also been reviewed; the outcome provided evidence that appropriate processes or procedures were in place to enable the Trust to comply with the NHS Constitution. Q6. All current key risks to compliance with the NTDA's Accountability Framework have been identified (raised either internally or by external audit and assessment bodies) and addressed – or there are appropriate action plans in place to address the issues in a timely manner. ICHT Response: Yes The Trust has a Risk Management Strategy and a Corporate Risk Register (CRR). The CRR identifies the key risks to the organisation. Explanation: The Trust has a Risk Management Framework in place and risks identified as part of the FT process have been identified and documented with appropriate actions in place to deliver. Q7. The Board has considered all likely future risks to compliance with the NTDA Accountability Framework and has reviewed appropriate evidence regarding the level of severity, likelihood of a breach occurring and the plans for mitigation of Chris Harrison, Medical director Alan Goldsman, Chief Financial Officer Jan Aps Trust company Secretary Janice Sigsworth Director of Nursing Janice Sigsworth Director of Nursing Page 4 of 6 Meeting Details: Date Agenda No: 3.1 these risks to ensure continued compliance. ICHT Response: Yes Explanation: The Annual Governance Statement identifies significant issues for the coming year. The Trust has a Risk Management Framework in place and risks identified have been identified and documented with appropriate actions in place to deliver. In addition the risk management framework includes a rigorous review of scoring and review of controls and mitigation. Q8. The necessary planning, performance management and corporate and clinical risk management processes and mitigation plans are in place to deliver the annual operating plan, including that all audit committee recommendations accepted by the board are implemented satisfactorily. ICHT Response: Yes Explanation: There are risk management processes in place and the management of strategic risks is currently undergoing review. Recommendations from the Audit, Risk & Governance Committee are followed up on and the actions reported at each Audit, Risk & Governance Committee. Q9. An Annual Governance Statement is in place, and the trust is compliant with the risk management and assurance framework requirements that support the Statement pursuant to the most up to date guidance from HM Treasury (www.hm-treasury.gov.uk) ICHT Response: Yes Explanation: The AGS has gone through a rigorous process, is overseen by the Audit Risk & Governance Committee, and is tested and challenged by internal and external audit. Q10. The Board is satisfied that plans in place are sufficient to ensure on-going compliance with all existing targets as set out in the NTDA oversight model; and a commitment to comply with all known targets going forward. Paper No: 8 Alan Goldsman, Chief Financial Officer Jan Aps Trust company Secretary Steve McManus, Chief Operating Officer. Meticillin resistant Staphylococcus aureus bloodstream infections (MRSA BSI): • To date 4 cases of MRSA BSI have been allocated to the Trust (one case in April, two cases in May and one case in November); • The third case that was reallocated in May is currently being contested by the Trust and CCG; we are still waiting for the final outcome from Public Health England; • One case of MRSA BSI is currently being investigated. This December case is in a patient who had an emergency caesarean section and was subsequently transferred to ITU. This case has been provisionally been allocated to the Trust. Clostridium difficile infections: • The Department of Health’s annual ceiling for the Trust is 65 cases for 2014/15; at the end of December we had reported 60 cases attributed to the Trust; • The number of Trust attributable cases of C. difficile that arose due to a ‘potential lapse in care’ whilst at ICHT will be reported to the board from January 2015. The definition of a ‘potential lapse in care’ is currently being finalised and agreed with the CCG. A sample of Trust attributable C. difficile cases from quarter one has been subject to a collaborative review with the CCG and this methodology will be repeated for cases in Quarter two in January 2015. Referral to treatment (RTT) Data for December RTT performance has an agreed submission date of 26 January. The Trust has been working towards the delivery of the performance measures through additional activity and validation of data. A significant amount of work to improve data quality, by resolving technical issues with Cerner reporting, has taken place throughout December and the early part of January, as well as improving the workflow on Cerner so that it is more difficult to input correct data. Due to the above, there remains a risk in relation to the performance throughout the remainder of 2014/15. A team of validators are continuing to support the Trust with correction of data. Q11. The Trust has achieved a minimum of Level 2 performance against the requirements of the Information Governance Toolkit. ICHT Response: Yes Explanation: The Trust is compliant and re-submit the toolkit return on 31 March 2014. Q12. The Board will ensure that the trust will at all times operate effectively. This includes maintaining its register of interests, ensuring that there are no material conflicts of interest in the board of directors; and that all board positions are filled, or plans are in place to fill any vacancies. ICHT Response: Yes Explanation: Board members are reminded at each Trust Board of the need to ensure that the register of interests is current; it is formally reviewed at every other Trust Board. Responsibility for making declarations for all staff is advertised annually – the last in March 201 via the Source (which included information on the requirement and how to make a declaration). The Trust currently has one NED vacancy, and the Chief Financial Officer role is covered by an interim – recruitment is underway. The revised governance structure is working well, and further strengthening of the governance framework is being developed. Q13. The Board is satisfied that all executive and non-executive directors have the appropriate qualifications, experience and skills to discharge their functions effectively, including setting strategy, monitoring and managing performance and risks, Kevin Jarrold, Chief Information Officer. Jan Aps Trust company Secretary Jayne Mee, Director of People and Page 5 of 6 Meeting Details: Date Agenda No: 3.1 and ensuring management capacity and capability. ICHT Response: Yes Explanation: A Board Development programme has been designed for FY 15/16 for delivery bi-monthly. Q14. The Board is satisfied that: the management team has the capacity, capability and experience necessary to deliver the annual operating plan; and the management structure in place is adequate to deliver the annual operating plan. ICHT Response: Yes Explanation: A high calibre senior management team is in place with the capacity, capability and experience to deliver the annual operating plan. Development sessions will continue in 2015/16. Paper No: 8 Organisational Development. Jayne Mee, Director of People and Organisational Development. Page 6 of 6 Trust Board - Public: 25 March 2015 Agenda No: 3.2 Paper No: 9 Trust Board - Public Agenda Item 3.2 Title Eliminating mixed sex accommodation (EMSA) 2014/15 annual declaration Report for Monitoring Report Author Steve McManus, Chief Operating Officer Responsible Executive Director Steve McManus, Chief Operating Officer Executive Summary: The Trust is required to declare its position against the ‘elimination of mixed-sex accommodation, except where it is in the overall best interest of the patient, or reflects their personal choice’ on an annual basis, by the end of March. Compliance (or otherwise) against this standard is reported in the monthly Trust Board Integrated Performance Scorecard. Recommendation to the Board: The Board is asked to approve the public declaration of compliance for 2014/15. Trust strategic objectives supported by this paper: To achieve excellent patient experience and outcomes, delivered efficiently and with compassion. Trust Board - Public: 25 March 2015 Agenda No: 3.2 Paper No: 9 Eliminating mixed sex accommodation (EMSA) 2014/15 annual declaration Background In November 2010, the Chief Nursing Officer (CNO) and Deputy NHS Chief Executive wrote to all NHS Trusts. The letter (PL/CNO/2010/3) set out the expectations that all NHS organisations 'are expected to eliminate mixed sex accommodation, except where it is in the overall best interests of the patient, or their personal choice'. The CNO letter included detailed guidance on what was meant by 'overall best interests', including situations, for example, when a patient is admitted in a life threatening emergency. This was followed by another letter from the Chief Nursing Officer and Deputy NHS Chief Executive in February 2011 (Gateway ref 15552) setting out expectations regarding a declaration exercise. Trusts are required to declare an annual compliance with the statement above. Should they not be in a position to do so, they may declare non-compliance; however, significant financial penalties may apply under such a circumstance. Performance in 2014/15 2014/15 year to date there has been a total of 14 reportable breaches of single sex accommodation. At a rate of 0.03 per 1000 finished consultant episodes this is considered to be achieving compliance. Current situation Gender mixing within the Trust only occurs within critical care units and the emergency department. This is in line with the overall best interests criteria stated by the CNO. All adult in-patient wards are either single sex, or where they are mixed sex, areas within the ward are designated as male or female, with separate designated toilets and bathrooms. Where admissions and transfers may potentially cause a mixed sex breach, ward teams move patients to prevent this occurrence. Patient experience Year to date there have been no complaints specifically about breaches of single sex accommodation. Declaration of compliance 'Imperial College Healthcare NHS Trust confirms that mixed sex accommodation has been virtually eliminated within all its hospitals, except where it is in the overall best interest of the patient, or reflects their personal choice. We have the necessary facilities, resources and culture to ensure that patients who are admitted to our hospitals will only share the room where they sleep with members of the same sex, and same sex toilets and bathrooms will be close to their bed area. Sharing with members of the opposite sex will only happen by exception based on clinical need. (Example where patients need specialist equipment such as in critical care areas). If our care should fall short of the required standard, Imperial College Healthcare NHS Trust will report it. Imperial College Healthcare NHS Trust has assurance mechanisms in place to monitor compliance, the management structure to manage any breaches and the desire to ensure we are communicating to patients and the public that we are delivering our commitment to eliminating mixed sex accommodation.’ Trust Board - Public: 25 March 2015 Agenda No: 4.1 Paper No: 10 Trust Board - Public Agenda Item 4.1 Title Financial Plan 2015/16 Report for Decision Report Author Alan Goldsman Responsible Executive Director Alan Goldsman, Interim Chief Financial Officer Executive Summary: This paper summarises the current draft financial plan for 2015/16 which was reviewed by Finance & Investment Committee at the meeting 19 March 2015. The next draft plan is due to be submitted to the NTDA on 7 April and the final plan on 14 May. Recommendation to the Board: The Board is asked to: • Note the current position in relation to contract negotiation, including the revised timescales for submission of plans; • Note the mitigations in place to minimise financial risk. Trust strategic objectives supported by this paper: • To achieve excellent patient experience and outcomes, delivered efficiently and with compassion. Page 1 of 3 Trust Board - Public: 25 March 2015 Agenda No: 4.1 Paper No: 10 Annual Operating Plan and Budget – 2015/ 16 1) Introduction Delays in agreeing the NHS tariff and issuing the new contract mean that the timetables for agreeing finance and activity plans for the Trust across the sector have been extended. This paper provides a summary of the current position and the actions being taken to ensure that financial discipline is maintained and that potential new financial risk can be mitigated. 2) Summary The Trust is mitigating the financial risk associated with the current tariff, contract and commissioning delays; in particular by negotiating cash drawdown from its commissioners sufficient to remain financially solvent, and by maintaining budgetary discipline and expenditure control using the established means. There is clear legal precedent covering the period until a new contract is signed; ensuring that the Trust will continue to provide services and can expect to receive payment under an implied contract. 2.1) Revised timetable Board will be asked to approve the Annual Operating Plan and Budget at a meeting to coincide with its seminar on 13 May 2015; for onward submission to the NHS TDA on 14 May. A detailed update will be provided to the Board at its seminar on 29 April when it is expected that an offer from NHS England, a tariff and any mediation will be near conclusion. 2.2 Planning Assumptions The Board approved the financial planning assumptions at its meeting in January and the Finance and Investment Committee has subsequently functioned on the projected out-turn and progress on identifying implementable cost improvement programmes. The forecast out-turn assumptions are broadly in line with expectation and, at a required £52m, the required efficiency programme is considered to be at the top end of what is deliverable (around 6% to 7% of influenceable spend). Since the tariff position is still being negotiated, assumptions on income broadly reflect the Trusts expectation that service change, growth and any cuts proposed by NHS Commissioners must be fully funded and deliverable. 2.3) Tariff The Trust has joined other Trusts in the Shelford / Diamond group in rejecting the proposed and enhanced tariffs. Intensive negotiation is continuing with Monitor and with NHS England to ensure fair prices are set for the services the trust is expected to provide. 3) Contract The NHS Contract has now been issued. 3.1) Fines and penalties Penalties for breaching referral to treatment targets have been toughened up [to force providers] to bring down waiting lists, but sanctions for accident and emergency and elective treatment breaches have been reduced. Page 2 of 3 Trust Board - Public: 25 March 2015 Agenda No: 4.1 Paper No: 10 NHS England has made a concession for the new A/E penalties with providers fined £120 (down from £200) for every patient who takes the Trust below the target for 95% of patients to be treated, admitted or discharged within 4 hours. However, these fines will continue to be levied until a lower cap of 85% (rather than the current 92%) of performance is reached. There is also increased pressure on providers to reduce the size of their inpatient elective backlogs with the penalty for failing to meet the 92% incomplete standard increasing to £150 (from £100). Flexibility for Commissioners to waive fines has been removed. 3.2) Referrals The contract now contains a specific contractual requirement that providers must accept every referral, regardless of the identity of the responsible commissioner. Many Trusts have begun turning away out of area referrals because of increasing demand for their services and this requirement is already being challenged by some Trusts using patient safety criteria. 4) Surplus The Trust expects to earn, and spend, £970m in 2014 / 15; which makes the Trust one of the 5 largest in England. A little over £36m will be spent on capital schemes and the rest on providing healthcare, research and teaching. Breaking even in 2014 / 15 is just the start of the challenge and going forward the first task is to ensure this can be achieved every year. The Trusts income for 2014 / 15 has been supplemented by selling assets that are no longer required and by using up cash reserves (in total some £22m) to meet the increasing costs of providing services. This means that the challenge going into 2015 / 16 is to deliver an efficiency programme of £52m (about £1m per week); to regularise the current position and to meet both the inflation impact on service delivery and fulfil the government’s targets for meeting the increasing healthcare needs of our population. The Trust must also continue to invest in innovation, quality, its estate and its staff. The Trust has committed an additional £12m to meet this goal; but this must be funded by cutting out waste and by improving the value of the services provided. In scale, is similar to what most other successful Trusts are planning to do. 5) Conclusion The Trust has plans in place that will mitigate the financial risk associated with the current tariff, contract and commissioning delays during the contracting period that now extends into the start of the new financial year. Directors and Divisions are focussed on ensuring a safe and effective programme of efficiency initiatives is in place; and on ensuring the Trust can achieve contract volumes and prices sufficient to provide safe and financially sustainable services; within the targets specified in the contract. Page 3 of 3 Trust Board - Public: 25 March 2015 Agenda No: 4.2 Paper No: 11 Trust Board - Public Agenda Item 4.2 Title Annual Research review 2014 Report for Noting Report Author Prof Jonathan Weber (AHSC Director) & Dr Paul Craven (Head of Clinical Research Operations) Responsible Executive Director Prof Chris Harrison (Medical Director) Executive Summary: Professor Chris Harrison presented the research review report to the Board meeting in January. Professor Jonathan Weber will present and provide a more detailed update. Recommendation to the Board: The Board is asked to note the annual research review. Trust strategic objectives supported by this paper: • As an Academic Health Science Centre, to generate world leading research that is translated rapidly into exceptional clinical care. Page 1 of 1 Imperial College Healthcare NHS Trust Annual Research Review 2014 Professor Jonathan Weber AHSC Director / ICHNT Director of Research 2014: Highlights of a Pivotal Year • NIHR Imperial Biomedical Research Centre: o 3rd year of 5 year programme; re-application in mid-2016 o Mid-term review (October 2014); revised structure • Imperial Joint Translation Fund: o Value £1.3m o MRC, Wellcome, EPSRC, Imperial Innovations, BRC, RMH and C&W • NHS Genomic Medicine Centre for NW London: o Cancer and inherited rare disease whole genome sequencing o NHS transformation and research • NW London Clinical Research Network (CRN): o Hosted by ICHT; £13m p.a. • Research Excellence Framework (REF) results: o Imperial College Medicine UoAs – top for impact • Other key awards: o 4 x NIHR HPRUs; 1 x NIHR DEC; UK MED BIO Translational Research Infrastructure @ Imperial AHSC a complex space… School of Public Health NWL London CLAHRC Imperial College NIHR Diagnostic Evidence Cooperative Imperial Joint (DEC) ICTU NW NIHR Health Translation Fund London Protection NIHR Imperial BRC CRN Research Units Discovery science at (HPRUs) NIHR Translational Imperial College Research Partnerships Health Partners NIHR Imperial BRC: Mid-term Review Prof Dermot Kelleher (Chair) Dean of the Faculty of Medicine, Imperial College London Prof Jocelyn Cornwell Director, Point of Care Foundation Prof Ross Ethier Dept. of Biomedical Engineering, Georgia Institute of Technology Dr Wendy Ewart Formerly Deputy Chief Executive / Chief of Strategy, MRC Mrs Heather Lawrence Formerly CEO of C&WHFT; now Non-Exec Director @ Monitor Dr Steve Rees V-P, Screening Sciences & Sample Mgmt, AstraZeneca R&D Prof Jonathan Seckl Centre for Cardiovascular Science, University of Edinburgh Dr Tracey Batten Chief Executive, Imperial College Healthcare NHS Trust Prof Jonathan Weber Director, NIHR Imperial BRC; Director, Imperial AHSC Main Outcomes: • Ability to reach into FoNS and FoE distinguishes us from competitors • Wide support for ‘omics platforms with ‘big data science’ (ITMAT) • Focus on fewer Themes • Ensure we achieve ‘bang for buck’ – largest BRC • Innovative and successful training schemes • Communicate Imperial BRC’s unique attributes / characteristics / outcomes Delivering New Capabilities (Joint Translation Fund) Chemistry + Computing + Medicine = ‘Intelligent’ tools for cancer surgery (I-Knife) Microelectronics + Computing + Chemistry = Rapid medical diagnostics (DNAe) Engineering + Physics + Medical Imaging = Microbubble ultrasound diagnostics NIHR Imperial BRC: Recent Translational Highlights Epigenetic Therapy for Friedrich’s ataxia • Rare progressive degenerative disorder • Caused by deficiency of the frataxin protein • BRC-funded phase I study • Nicotinamide (vit B6) as a HDAC-inhibitor • Up-regulation of frataxin first epigenetic modulation in non-malignant disease NIHR Imperial BRC: Recent Translational Highlights I-Knife surgical technology: • REIMS - Rapid Evaporative Ionization mass spectroscopy • Theatre based mass spec allows real-time analysis • BRC funded phase I study in vivo in surgical environment • Breast and glioma trials to start in 2015 • Major collaboration with Waters (£10M, 5 yrs) NIHR Imperial BRC: Recent Translational Highlights Safer infertility treatment: • BRC-funded proof-ofconcept study • Hormone kisspeptin to induce ovulation during IVF treatment • 12 healthy babies born • http://www.bbc.co.uk/new s/uk-england-london22953488 Imperial Joint Translation Fund Contributors Early Outcomes • Value ~ £1.3m • Funds ~ 20 projects p.a. • Chair: Prof R Solari (GSK) • MAP4K4: a therapeutic target in cardiac muscle cell death (M Schneider) – Wellcome Trust Seeding Drug Discovert (£2.5m) • Clinical validation of an advanced bolus calculator (N Oliver, C Toumazou) – Commercial collaboration with Roche, Cellnovo, Dexcom 10 New NIHR Infrastructure Awards in 2014 £12m; 2014-19 £13m p.a.; 2014-19 £1m; 20142018 • Healthcare Associated Infections &Antimicrobial Resistance • Respiratory Infections • Development of Modelling Methodology • Environmental Hazards 11 Imperial College Health Partners: NHS Genomic Medicine Centre • Prime Minister’s 100K Genomes initiative • Common cancers & inherited rare diseases • ICHNT leading consortium with Royal Marsden, Royal Brompton and Chelsea & Westminster • One of 11 first wave GMCs • NHS transformation – embedding genomics in clinical practice • Provide tissue samples and clinical data • Biorepository for future research • Patient and public involvement / forum • Associated bid for MSc in Genomic Medicine 12 Clinical Trials Performance 13 Clinical Trials Performance: Initiation Times for Comparator Trusts 14 Clinical Trials Performance: Delivery of Commercial Studies 15 Involving Patients in Our Research Our approach through Imperial Patient Experience Research Centre - PERC • Build capacity – Guidance; policies (e.g. remuneration) – Training (researchers and patients) – PPI network in NWL (CLAHRC) • Report and learn – Set quality standards – Monitor / evaluate – Feedback, share practice • Collaborate – Within the BRC – Local partners – National organisations • Exemplar projects – Consent to contact – NHS Genomic Medicine Centre / NIHR Health Informatics Collaborative (NHIC) 16 Examples of Patient Involvement and its Impact 17 REF 2014 slide 18 ICHNT research priorities for 2015 NIHR Imperial BRC: • Embed new structure • Re-application in Q2, 2016 • Critical year for Trust investment – new appointments NHS Genomic Medicine Centre: • Realise NHS transformation of genomic medicine Closer research collaborations: • RBH, RMH, Oxford AHSC Build our industry links: • Waters, A-Z, GSK, J&J, Pfizer, NantHealth Trust Board - Public: 25 March 2015 Agenda No: 4.3 Paper No: 12 Trust Board - Public Agenda Item 4.3 Title Care Quality Commission - update report Report for Noting Report Author Priya Rathod, Associate Director – Chief of Staff (Nursing Directorate) Responsible Executive Director Professor Janice Sigsworth, Director of Nursing Executive Summary This report provides an update on work being undertaken in response to the CQC inspection of the Trust, as well as general updates in relation to CQC matters covering the following: • Delivery and monitoring of the CQC action plan Work is being undertaken through a trust-wide action plan, to ensure the delivery of actions which were outlined in the Trust’s inspection reports. An in-depth review of the action plan is underway to ensure delivery of actions and compliance with the CQC regulations. Actions that were due in March have been completed and the Executive Committee oversees progress each month, providing assurance to the Quality Committee at each of its meetings. • Compliance and Improvement Framework A Compliance and Improvement Framework will be implemented across the organisation designed to ensure achievement of a constant state of ‘compliance’ and ‘inspection readiness’. This framework will be an integral part of the Trust’s Quality Strategy and quality improvement methodology and will consist of the following components: - Delivery of the CQC action plan - Use of the CQC Intelligent Monitoring Report (as a routine element of the Trust scorecard) - Director led self-declarations of compliance against the regulations, underpinned by divisional/core service self-assessments (quarterly) - Eight core service reviews ( mock inspections) across the five CQC domains (three times a year) - A ward accreditation programme (in two phases) - Aim to have 100+ ICHT staff enrolled as CQC specialist experts undertaking CQC inspections. • Display of CQC ratings Following the publication of guidance by the CQC in March, it will be a legal requirement from 1st April for the Trust to display its CQC ratings at the main entrance of each hospital site, at its headquarters (The Bays building) and on its website. Work is currently being undertaken to ensure implementation. Page 1 of 4 Trust Board - Public: 25 March 2015 • Agenda No: 4.3 Paper No: 12 Updated rating for ‘Urgent and emergency services’ at St. Mary’s Hospital Further to the initial inspection and associated findings, the A&E Department at St. Mary’s was reinspected by the CQC in November 2014 and a revised report for urgent and emergency services at St. Mary’s was published on the 7 January 2015. The re-inspection looked at the ‘safe’ domain, which concluded that the rating be improved from ‘inadequate’ to ‘requires improvement’. This improved the overall rating of St Mary’s A&E service to ‘requires improvement’. Next steps • • Work will continue progress to ensure the implementation of the action plan and compliance framework. Progress will be reported to the Executive Committee on a monthly basis and to the Trust Board quarterly on delivery of the action plan. Recommendation to the Board: The Board is asked to note the report. Trust strategic objectives supported by this paper: • To achieve excellent patient experience and outcomes, delivered efficiently and with compassion. Page 2 of 4 Trust Board - Public: 25 March 2015 Agenda No: 4.3 Paper No: 12 Care Quality Commission (CQC) - Update report 1 Background At its meeting in January, the Trust Board received an update on the findings of the CQC inspection which took place across the St. Mary’s, Hammersmith, Charing Cross and Queen Charlottes and Chelsea hospital sites, in September 2014. 2 Purpose The following report provides an update on work being undertaken in response to the inspection as well as general updates in relation to CQC matters. 3 Delivery and monitoring of the CQC action plan Work is being undertaken through a trust-wide action plan, to ensure the delivery of actions which were outlined in the Trust’s inspection reports. An in-depth review of the action plan is underway to ensure delivery of actions and compliance with the CQC regulations. Actions that were due in March have been completed and the Executive Committee oversees progress each month, providing assurance to the Quality Committee at each of its meetings. 4 Compliance and Improvement Framework A compliance and Improvement Framework will be implemented across the organisation designed to ensure achievement of a constant state of ‘compliance’ and ‘inspection readiness’. This includes compliance with regulations and assurance that services are of a ‘good’ or ‘outstanding’ standard, as well as implementing all actions arising from the CQC inspection in September 2014. The approach will require a systematic and sustained change in how the Trust works and how it improves the quality of care it provides. This framework will be an integral part of the Trust’s Quality Strategy and quality improvement methodology and will consist of the following components: Delivery of the CQC action plan Use of the CQC Intelligent Monitoring Report (as a routine element of the Trust scorecard) Director led self-declarations of compliance against the regulations, underpinned by divisional/core service self-assessments (quarterly) Eight core service reviews ( mock inspections) across the five CQC domains (three times a year) A ward accreditation programme (in two phases) Aim to have 100+ staff enrolled as CQC specialist expert inspectors 4.1 Use CQC Intelligent Monitoring Report The CQC’s Intelligent Monitoring Report considers data and other quantitative measures from a wide range of sources, including staff surveys, patient surveys, mortality rates and performance measures. The CQC publishes Intelligent Monitoring reports twice per year which will be reported to the Executive Committee. Any areas of elevated risk that are identified will be reviewed to ensure appropriate action is taken place in order to bring performance back within ‘normal parameters’. 4.2 Director Review of Compliance against the Regulations Director leads have been identified for each CQC regulation and they will lead the assurance process that regulatory requirements are being met, and ensure that appropriate action is being Page 3 of 4 Trust Board - Public: 25 March 2015 Agenda No: 4.3 Paper No: 12 taken if non-compliance has been identified. The declarations will be underpinned by selfassessments from divisions/core services as well as evidence. 4.3 Core Service Reviews Core service reviews will be undertaken three times throughout 2015/16. The reviews will take place at each site, across each of the eight core services and across the five CQC domains using standardised formats / templates based on the CQC methodology – the key lines of enquiry (KLOEs). The first core service review will be set up and led in partnership with internal audit. Review teams will consist of ICHT staff as well as external stakeholders. 4.4 Ward Accreditation Programme (WAP) The WAP is designed to support ward, unit and department managers to understand how they deliver care, identify what works well and where further improvements are needed. The approach has been implemented with great success at other organisations and is supported by the Trust’s Divisional Directors of Nursing. Theoretically, ward accreditation provides ownership of quality standards at ward level. A pilot will take place in the summer of 2015 with full implementation of the programme from early 2016. 5 Display of CQC ratings Following the publication of guidance by the CQC in March, it will be a legal requirement from 1st April 2015 the all providers who have been awarded a CQC rating to display. To this end, the Trust will be required to display ratings at the main entrance of each hospital site, at its headquarters (The Bays building) and on its website. 6 Updated rating for ‘Urgent and emergency services’ at St. Mary’s Hospital Further to the initial inspection and associated findings, the A&E Department at St. Mary’s was reinspected by the CQC in November 2014 and a revised report for urgent and emergency services at St. Mary’s was published on the 7 January 2015. The re-inspection looked at the ‘safe’ domain, which concluded that the rating be improved from ‘inadequate’ to ‘requires improvement’. This improved the overall rating of St Mary’s A&E service to ‘requires improvement’. 7 Next steps • Work will continue progress to ensure the implementation of the action plan and compliance framework. • Progress will be reported to the Executive Committee on a monthly basis and to the Trust Board quarterly. Recommendation to the Board: The Board is asked to note the report. Page 4 of 4 Trust Board - Public: 25 March 2015 Agenda No: 4.4 Paper No: 13 Trust Board - Public Agenda Item 4.4 Title Engagement survey update & NHS annual staff survey Report for Noting Report Author Sue Grange, Associate Director of Talent Responsible Executive Director Jayne Mee, Director of People and OD Executive Summary: This paper provides an update on two surveys: (i) The latest results from the Trust local Engagement Survey which is carried out on a quarterly basis. The survey includes results from the 6th Survey conducted in January/February 2015. (ii) The national NHS Staff Survey 2014 Recommendation to the Board: The Board is asked to note the results of the survey and the action which is being taken as a result of the survey fedback Trust strategic objectives supported by this paper: • To achieve excellent patient experience and outcomes, delivered efficiently and with compassion. • To educate and engage skilled and diverse people committed to continual learning and improvement. Page 1 of 1 Imperial College Healthcare NHS Trust Engagement Survey January 2015 Board Summary Report March 2015 1 © Trust Engagement Survey 6 Methodology Engagement survey conducted 4 times a year (October, January, April and July) Each survey is sent to a random 25% sample of the Trust (therefore, throughout the year every employee will have a chance to complete); from Survey 3, generic/ open access also made available Survey 6 includes some revisions to the questionnaire 3 © Copyright 2014 The Survey Initiative and Imperial College Healthcare NHS Trust Survey 1-6 Engagement Survey Summary of overall results Survey Survey 6 (Jan 15) Shift from Oct 14 Response rate Total number of respondents Engagement score FFT Recommend for treatment 55% 1254 41% 76% 56% +4 -1 -2 +6 FFT Recommend for place to work Survey 5 (Oct 14) 49% 1209 37% 77% 58% Total combined Yr 13/14 30% 3276 39% 78% 59% Survey 4 (July 14) 45% 1415 38% 78% 60% Survey 3 (May 14) 31% 692 37% 78% 57% Survey 2 (Jan 14) 26% 564 39% NA NA Survey 1 (Oct 13) 27% 605 42% NA NA Please note Engagement Scores for survey 6 are based on the new question set and surveys 1 and 2 included the FFT questions. 4 © Copyright 2014 The Survey Initiative and Imperial College Healthcare NHS Trust Survey 1-6 Engagement Survey Summary of results over time Please note Engagement Scores for survey 6 are based on the new question set and surveys 1 and 2 included the FFT questions. 5 © Copyright 2014 The Survey Initiative and Imperial College Healthcare NHS Trust Survey 6 Engagement Positive ratings in line with Survey 1 (note impact of question changes) Analysis on responses to all the engagement question items* Survey 6 Survey 5 Total combine d Survey 4 Survey 3 Survey 2 Survey 1 Yr 13/14 Positive 10, 9 and 8 Neutral 7, 6 and 5 Negative 4, 3, 2 and 1 41.16% +4 37% 39% 38% 37% 39% 42% 40.39% -1 41% 38% 39% 40% 37% 36% 18.45% -4 22% 23% 23% 23% 24% 22% The table tracks the scores throughout the year, showing the percentage change in the score since Survey 5 and the Total combined Yr 13/14 score (for the last survey year). Please note Engagement Scores for survey 6 are based on the new question set and surveys 1 and 2 included the FFT questions. 6 © Copyright 2014 The Survey Initiative and Imperial College Healthcare NHS Trust Survey 6 How does engagement compare? Across sites Site Survey 6 % positive Charing Cross Hospital 40% - Hammersmith Hospital 40% - Queen Charlottes & Chelsea Hospital 37% - St Marys Hospital 45% - Western Eye Hospital 33% - . 7 © Copyright 2014 The Survey Initiative and Imperial College Healthcare NHS Trust Looking at the engagement items, with the revision of the survey, what are the priorities? Watch Do more of 13. The Trust Board and Executive Team provide clear direction for the organisation 26% 4. I have access to the learning and development I need to do my current job well 39% 8. My line manager (the person I report to on a regular basis) treats me with respect 57% 10. There is someone in management at work who encourages my own development 39% 9. My line manager (the person I report to on a regular basis) encourages me to make my own decisions as far as possible 50% 12. My organisation takes positive action on health and wellbeing 33% 6. At work my opinions seem to count 36% 14. Communications from my line manager keep me up to date with what is happening 41% 3. My line manager (the person I report to on a regular basis) praises me when I do a good job 41% 5. I have the authority I need to do my job 42% 7. Communication within my ward/ team is generally open and honest 46% 11. I would like to be working for my ward/ team in twelve months time 45% Engagement score 41% Survey 6 Action 8 © Copyright 2014 The Survey Initiative and Imperial College Healthcare NHS Trust Summary of Survey 6 results What is positive Where can we improve • Survey participation continues to increase as each survey is run, now 55% participation. • Engagement levels are responding too, increasing by 4% points since survey 5. • ALL engagement questions show slight improvements since survey 5. • 57% of people feel respected by their line managers an increase of 6% points since survey 5. • Pharmacists are the most engaged occupational group at 55% positive. • The friends and family questions are marginally down compared to survey 5. • Replacing the Senior Leadership question with The Trust Board and Executive Team provide clear direction for the organisation hasn’t altered it the focus on leadership being the lowest scoring question at just 26% positive. • Over the course of the 6 surveys out of the 10 questions that remain the same the positive sentiment is now lower across 5 of the questions asked. 9 © Copyright 2014 The Survey Initiative and Imperial College Healthcare NHS Trust NHS Staff Survey Results NHS Staff Survey 2014 Summary of Methodology Comparison of Response rates • Survey runs October - December 2014 • 10% Sample of the Trust received the survey (800 people) • Survey sent by Email • Response Rate: 41.2% (328 responses) Trust/Sector Response Rates Imperial 41.2% All Acute Trusts 42% All Acute (Specialist) 49% Ambulance 35% Mental health/Learning Disability 42% Relevance of NHS Staff Survey Data Question Use 1 Question 12d: “If a friend or relative needed treatment I would be happy with the standard of care provided by this organisation CQUIN 2 Overall Engagement Score CQC 11 © Copyright 2014 The Survey Initiative and Imperial College Healthcare NHS Trust NHS Staff Survey 2014: Key Results Score options Overall Engagement Score Highest (best) 20% Above(better than) average Score Ranking Average Trust 2014 3.76 Above (better than) average Below (worse than) average Trust 2013 3.78 Above (better than) average National Average Acute Trusts 2014 3.74 Lowest (worst) 20% How do we compare? Overall Engagement Score 4 3.5 3 2.5 Trust engagement score 2 National average for acute trusts 1.5 1 0.5 0 2014 2013 2012 Engagement Score is calculated from three Key Findings:KF 22 Staff ability to contribute towards improvements at work kF24: Staff Recommendation of the Trust as a place to work or receive treatment KF 25; Staff Motivation at work (Each Key Finding is made up of 2-3 individual questions) Shelford G & ST Thomas Newcastle Birmingham UCL Oxford Sheffield Kings Imperial Central Manchester Cambridge 3.96 3.9 3.87 3.87 3.82 3.81 3.79 3.76 3.76 3.7 AUKUH (London) Chelsea & Westminster G & ST UCL Royal Free St Georges Imperial Barts 3.82 3.96 3.87 3.78 3.77 3.76 3.61 12 © Copyright 2014 The Survey Initiative and Imperial College Healthcare NHS Trust NHS Staff Survey: Greatest Improvements since 2013 Question KF14: Fairness and effectiveness of incident reporting procedures Trust Score 2014 Trust Score 2013 3.61 3.48 KF 21: Percentage of staff reporting good communication between senior management and staff 37% 29% KF26: Percentage of staff having equality and diversity training in the last 12 months 73% 60% Open Hour, Divisional Forums, Web chats Walkabouts all developed in 2014-5 New E & D e-learning module developed in 2013 and rolled out widely across Trust 13 © Copyright 2014 The Survey Initiative and Imperial College Healthcare NHS Trust Summary of NHS Staff Survey 2014 Results What is positive? •Overall Engagement Score remains above average •CQUIN FFT question score is above average and improved since 2013 •Total number of questions in Top 20% has increased since 2013 and Total number in Bottom 20% has reduced since 2013 Where can we improve? •Sample size very small compared with our own Local Engagement Survey (328 compared with latest engagement survey response rate of 1254) •Opportunity for Improvement:•Staff reporting they experience discrimination •Equal Opportunities in Career progression/promotion •Harassment and Bullying •Notable improvements in •Errors and Incident reporting •Well structured appraisals •Good communication between senior managers and staff •Health and Safety Training •Staff experiencing harassment, bullying, abuse from staff Action Divisional/Directorate Action • All results have been shared and communicated to Divisions/Directorates • Divisions/Directorates are developing their local Action plans based on local results • Focus on ONE BIG THING to ensure that action is visible and tangible Corporate Action Survey Theme Action Local Positive Action on Health and Well being • Continue focus on Health and Well Being strategy and activities. Next Health and Well being week March 24-26 March 24 -26 Local Senior Leadership provide clear direction • To be discussed at ExCo 24 March 2015 National Health and Safety Training • Trust compliance rate currently 84% but we do have reported low compliance in High Risk Fire Training Targeted action plan on areas of low compliance for both Health and Safety and Fire Training New E-learning module introduced to enable compliance via e-learning as well as classroom By June 2015 Develop more detailed action plans using the Equality Delivery System Framework to address the specific issues raised in the National Survey October 2015 • • National Equal Opportunities in relation to Career progression No Staff who experience discrimination No Staff who experience harassment and bullying • Date/Timescale 15 © Copyright 2014 The Survey Initiative and Imperial College Healthcare NHS Trust Trust Board - Public: 25 March 2015 Agenda No: 5.1 Report to: Trust Board Report from: Quality Committee (11 February 2015) Paper No: 14a KEY ITEMS TO NOTE Quality report Professor Chris Harrison reported that the data included in the report was until the end of December 2014 and where available more up to date data had been provided. The report included the Safety and Effectiveness report and Infection Prevention and Control. Professor Harrison and Professor Alison Holmes highlighted: • The number of Serious Incident (SIs) reported in November was 17 and in December was 18; the year to date total number of SIs reported is 117 • Ebola - pathways at St Mary’s and Charing Cross were tested during December 2014 and January 2015. Training on the use of personal protective equipment was being delivered by the IP&C team on all hospital sites • There had been a significant rise in the number of flu cases • The TDA had visited Charing Cross Hospital in January 2015 and were impressed with A&E. They flagged the need to: increase training, introduce the Cerner electronic prescribing function for antibiotics: and ensure clearer involvement of primary care. CQC update Professor Janice Sigsworth reported there were no conditions attached to the Trust’s CQC registration at any site and the warning notice the Trust had received for cleanliness and infection control at St Mary’s A&E had been closed. It was expected that actions now being implemented in relation to the safety and responsiveness domains should have noticeable impact by September. Re-inspection of the eight core services on the three Trust sites was considered most likely to take place December 2015/January 2016, although it was noted that the CQC could inspect services at any time in response to complaints raised by patients or staff. A Compliance and Improvement Framework would be implemented (a selfassessment approach to assuring the Board of Trust compliance with CQC standards). This would focus on the five key areas of quality and Executive Directors would be asked to selfdeclare twice yearly against the standard’s requirements and provide evidence of compliance. Domestic services Ian Garlington reported on the detailed action plan that had been developed to ensure a sustained improvement in cleanliness, reporting and auditing to improve and retain standards of cleanliness in A&E at St Mary’s following the CQC inspection. An update would be provided to the Committee in September. WHO checklist Professor Jamil Mayet reported that compliance rates for the WHO checklist had improved Page 1 of 2 Trust Board - Public: 25 March 2015 Agenda No: 5.1 Paper No: 14a significantly and he outlined the changes to the WHO checklist management and audit process over the previous 18 months. ‘Secret shopper’ audits had been introduced and theatre teams were aware that audits may be undertaken at any time. A cross sectional audit of WHO checklist completion on all sites would be undertaken on one day in February. A communications programme relating to the five steps to safer surgery would start in March, aimed to reinforce the importance of the WHO checklist and to update teams of changes in the Trust’s expectations and processes including changes to the audit process. An update would be provided to the Committee in September. Health & Safety update Jayne Mee reported that a Trust Health and Safety action plan had been developed which was underpinned by the divisions also being required to develop action plans that would be agreed, updated and reviewed at divisional health and safety committees. A health & safety working group was being set up between the Trust and Imperial College in addition to formalised memoranda of understanding. Action requested by Trust Board The Trust Board is requested to: • Note the report Report from: Prof Sir Anthony Newman Taylor, Chairman, Quality Committee Report author: Tracy Walsh, Committee Clerk Next meeting: 13 May 2015 Page 2 of 2 Trust Board - Public: 25 March 2015 Agenda No: 5.1 Report to: Trust Board Report from: Quality Committee (4 March 2015) Paper No: 14b KEY ITEMS TO NOTE Quality report Professor Chris Harrison reported that the data included in the report was until the end of January 2015 and where available more up to date data had been provided. The report included the Safety and Effectiveness report, Infection Prevention and Control and the Hand Hygiene strategy produced for 2015. Professor Harrison and Professor Alison Holmes highlighted: • The number of Serious Incident (SIs) reported in January was 15 the year to date total number of SIs reported is 120. We continue to try to obtain benchmarking data; as soon as this information is available the Committee will share with the Board. • Hand Hygiene – a new audit tool had been introduced which included all five moments of hand hygiene, the hand hygiene facilities were being reviewed, monthly reviews and analysis of staff hand hygiene competency assessments would commence in March and patient engagement was being explored. CQC action plan progress report Professor Janice Sigsworth reported that the Trust’s action plan in response to the CQC’s inspection findings had been accepted by the CQC in January. Of the 78 ‘must do’ actions 15 had been completed on time, 61 were on track and 2 were delayed. Of the 32 ‘should do’ actions 7 had been completed on time and 25 were on track. The Nursing and Midwifery Council (NMC) had in February written to the Trust’s higher education providers (Kings College University and Bucks New University) seeking assurance with regard to what measures they were taking as a result of specific concerns that were highlighted in the Trust’s CQC inspection report. Both providers following the Trust’s response had written supportive letters to the NMC. End of life (EOL) care quarterly update report Professor Janice Sigsworth reported that the Trust had received its CQC inspection reports which included the findings and ratings for the ‘core service’ of end of life care. EOL care was rated as ‘Good’ across the Hammersmith, St. Mary’s and Charing Cross sites. Within each CQC domain (safe, caring, effective, responsive and well-led), EOL care was rated as ‘Good’ other than in the domain of ‘safe’, across the three sites. A periodic review of the complaints related to EOL care was due to be undertaken and would be reported in the next six-monthly update. Page 1 of 2 Trust Board - Public: 25 March 2015 Agenda No: 5.1 Paper No: 14b Action requested by Trust Board The Trust Board is requested to: • Note the report Report from: Prof Sir Anthony Newman Taylor, Chairman, Quality Committee Report author: Tracy Walsh, Committee Clerk Next meeting: 13 May 2015 Page 2 of 2 Trust Board - Public: 25 March 2015 Agenda No: 5.2 Report to: Trust Board Report from: Audit, Risk & Governance Committee (11 March 2015) Paper No: 15 KEY ITEMS TO NOTE Update on risk management Professor Janice Sigsworth reported that the Trust’s risk management policy had been updated to reflect the change in the approach to risk management and the associated governance arrangements. The policy had been approved by the Executive Committee in February and in light of the planned Datix implementation the policy would be reviewed again in six months’ time. Risk owners had reviewed and revised scores accordingly with three risks being escalated from divisional/director risk registers to the corporate risk register. The Committee reviewed in detail risks where the score had either increased or decreased. Gynaecology service had been the initial pilot area for implementing Datix for risk management and this had completed to schedule at the end of February. A full roll out to the divisions of women’s and children’s and medicine was expected by the end of April and the remaining divisions by the end of June. Pharmacy performance update Ann Mounsey, the Trust’s Chief Pharmacist reported that a review had taken place of the processes outside of direct pharmacy to see where improvements could be made. As a result of the review: • portering rounds have been added on the Hammersmith site including two delivery rounds which are solely for discharge prescriptions • all sites had 5-6 delivery rounds a day • E-prescribing was to be piloted over the next 6 weeks Cerner Patient administration system maternity module post project implementation review Kevin Jarrold reported that the system had gone live April 2014 and in the early stages there had initially been issues with the quality of data. Mr Jarrold confirmed that in the majority of areas the quality of the data in the trust was now at least as good as it had been prior to the Cerner implementation and in a number of areas it had improved and was now better. The Clinical documentation functionality had been successfully piloted in the outpatient and inpatient setting, lessons learnt from this pilot are being developed to rollout across the Trust by the end of March 2016. Electronic prescribing in theatres had gone live at Hammersmith Hospital week commencing 9 March with St Mary’s and Charing Cross Hospitals going live on subsequent weeks. Emergency department e-prescribing had gone live at all three sites on the 10 March. Page 1 of 2 Trust Board - Public: 25 March 2015 Agenda No: 5.2 Paper No: 15 Action requested by Trust Board The Trust Board is requested to: • Note the report Report from: Sir Gerald Acher, Chairman, Audit, Risk & Governance Committee Report author: Tracy Walsh, Committee Clerk Next meeting: 22 April 2015 Page 2 of 2 Trust Board - Public: 25 March 2015 Agenda No: 6.1 Paper No: 17 Trust Board - Public Agenda Item 6.1 Title Annual update on implementing the recommendations from the Francis Inquiry (2013). Report for Noting Report Author Priya Rathod, Associate Director – Chief of Staff (Nursing Directorate) Responsible Executive Director Janice Sigsworth, Director of Nursing Executive Summary: Following the publication of the Francis Inquiry (formally known as the ‘Mid Staffordshire NHS Foundation Trust Inquiry 2013), the Trust developed a comprehensive action plan incorporating the recommendations and has reported progress against this on an annual basis to the Trust Board. An annual update was last presented to the Trust Board in May 2014. The recommendations from the Francis Inquiry were subsequently included within an overall integrated quality governance work plan. As the Trust’s quality governance structures have strengthened over the past year, the Francis recommendations have been incorporated within other quality improvement work streams such as; Monitor’s quality governance assurance framework self-assessment, the recent CQC inspection, safety and effectiveness and the national safe nurse staffing agenda. The Trust therefore does not routinely report against the ‘Francis recommendations’ and has instead embedded the recommendations as part of the existing work streams and as part of business as usual. The Executive Committee and Quality Committee has oversight of the work being undertaken through agenda items (e.g. reports on quality, patient experience, workforce and CQC) reported at each of its meetings. The outstanding actions from the previous report shared with the Board and the subsequent updates are summarised below: Action Progress Feedback and learning Monthly complaints reports received by each division for them from complaints to disseminate and discuss learning at local quality meetings. Reviewing current structure and processes for complaints management to incorporate how learning can effectively take place. Nurses/Midwives to be Taken forward as part of wider safe nurse staffing work in supervisory capacity stream, including six monthly establishment review process. Establishments include supernumerary staff for each ward. Clinical audit - Mortality The clinical audit team is due to expand from April 2015 and and efficacy of will develop a robust audit plan aligned to the Trust’s quality treatment strategy. Page 1 of 2 Trust Board - Public: 25 March 2015 Agenda No: 6.1 Paper No: 17 Feedback from students The Imperial education group will look at student nursing and trainees feedback including the use of the audit tool to aid learning and improvement A trust-wide education committee takes place co-chaired by nursing and medical directorate leadership. The Trust is in the process of developing a new quality strategy and work plan by April 2015, which will integrate existing work streams and provide a vision and framework for quality improvement across the Trust. Any outstanding actions related to the Francis inquiry will be included within that work plan. Recommendation: The Board is asked • To note progress against the outstanding actions • To note the changes with how the Trust has approached the implementation of the Francis Inquiry recommendations over the past year and how these will be managed going forward. Trust strategic objectives supported by this paper: • To achieve excellent patient experience and outcomes, delivered efficiently and with compassion Page 2 of 2


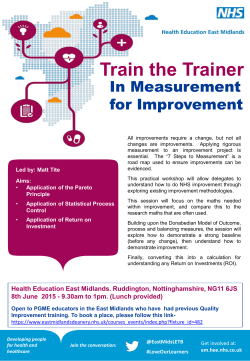


© Copyright 2026