
Ho Bee Land Annual Report 2014
1
Evolution.
H O BE E LAN D AN N UAL REP ORT 2014
Ho Bee Land
2
Contents
10 CHAIRMAN’S
STATEMENT
52 CORPORATE
INFORMATION
12 BOARD OF DIRECTORS
53 FINANCIAL
STATEMENTS
14 THE MANAGEMENT
TEAM
139 ADDITIONAL
INFORMATION
16 PROPERTY OVERVIEW
22 FIVE-YEAR FINANCIAL
SUMMARY
23 CORPORATE
STRUCTURE
141SHAREHOLDINGS
STATISTICS
143 NOTICE OF ANNUAL
GENERAL MEETING
24 CORPORATE
GOVERNANCE
REPORT
PROXY FORM
Annual Report 2014
1
Over the years, Ho Bee Land has grown
from strength to strength, becoming
what it is today at the forefront of the
industry. With strategic focus, shrewd
leadership and keen foresight, we
have strengthened our presence in
Australia, China and the UK, setting new
benchmarks and greater milestones. At
Ho Bee, we firmly believe in continual
growth, and this annual report shows
the path we have taken. Within these
pages, you will read our story, and our
journey of Evolution.
2
Ho Bee Land
Evolving
through the
Times
Ho Bee has always believed in investing
wisely. It is the reason we have acquired and
invested in properties around the world, and
why Ho Bee has evolved into what it is today.
Indeed, our approach has strengthened the
organisation through the years, preparing
our path for the future.
Annual Report 2014
3
4
Ho Bee Land
Growing
through Our
Focused
Strategies
Through Ho Bee’s strong leadership, our
strategies for growth have always been
focused on the right initiatives, developments
and investments. Our unwavering focus has
created Ho Bee’s success today, and its
journey for tomorrow. We constantly strive
to evolve, making our mark in the industry.
Annual Report 2014
5
6
Ho Bee Land
Strengthening
Our Global
Presence
Starting with a strong base in Singapore, Ho
Bee has evolved to see beyond our shores.
We have expanded into Australia, China
and the UK, ensuring greater growth for the
organisation as a whole, as well as greater
returns for our shareholders.
Annual Report 2014
7
8
Ho Bee Land
Building
upon Our
Rock-solid
Foundation
At Ho Bee, we believe long-term vision is vital
for an organisation to evolve. That is why we
have focused on achieving recurrent income
from our investments around the world.
Our strong recurrent income has provided
a rock-solid foundation for growth, ensuring
the lasting strength of our organisation.
Annual Report 2014
9
Ho Bee Land
10
Annual Report 2014
Chairman’s Statement
DEAR SHAREHOLDERS,
It is my pleasure to present to you, on behalf of the Board
of Directors, the Group’s performance for the financial year
ended 31st December 2014.
FINANCIAL REVIEW
Group turnover for FY2014 decreased 29% from
S$139.3 million to S$99.6 million. This was due to the
absence of revenue recognition for sales of development
properties.
However, in line with the Group’s strategy to build up its
recurrent income, rental from its portfolio of office buildings
in Singapore and London contributed to the bulk of the
income of S$99.6 million. This was an increase of 224% over
FY2013.
Profit before tax and minority interests amounted to S$321.9
million, 47% lower than the preceding year. The decline
was due mainly to the lower gain arising from fair value of
investment properties amounting to S$281.7 million (FY2013:
S$493.1 million) and the one-off gain of S$47.2 million on
sales of shares in Chongbang Holdings (International)
Limited, recorded in the immediate preceding year.
Despite the fall in turnover and profit, the Group has
achieved a satisfactory return on equity of 13%. Profit
attributable to shareholders amounted to S$315.0 million,
yielding an earnings per share of 47.2 cents.
“
Despite the fall in turnover and profit, the
Group has achieved a satisfactory return
on equity of 13%. Profit attributable to
shareholders amounted to S$315.0 million,
yielding an earnings per share of 47.2 cents.
Total shareholders’ funds as at financial year ended
31st December 2014 increased to S$2.6 billion, representing
a net asset value per share of S$3.90, an increase of 42 cents
over the preceding financial year.
“
11
PROPOSED DIVIDEND
The Board is recommending a first and final dividend
of 5 cents per share for the financial year ended 31st
December 2014. Subject to shareholders’ approval at the
Annual General Meeting of the Company to be held on 28
April 2015, the final dividend will be paid on 29 May 2015.
BUSINESS REVIEW
Property Development
Due to the weak market condition for high-end residential
properties as a result of the various measures imposed by
the Government, our joint-venture project in Sentosa Cove,
Cape Royale has not been launched for sale but was put
up for lease, together with the remaining unsold units in
Seascape and Turquoise, to provide rental income and
defray maintenance cost.
Construction work for two of our Australian residential
projects in Doncaster, Melbourne and Surfers Paradise, Gold
Coast have commenced, and is expected to be completed
by early 2016. Sales were satisfactory, with 65% of total
available units sold for the former and 15% for the latter.
Property Investment
The Group has acquired two additional commercial buildings
in London, 1 St Martin’s Le Grand and 60 St Martins Lane
in 2014 amounting to £214.9 million to further enhance its
recurring income. Both buildings are fully tenanted with
upward only rent review occurring from next year onwards.
Business Prospects
The property market in Singapore is expected to face
stronger headwinds in 2015. However, the Group is well
positioned to weather the challenging market environment
with the solid base of recurring income from our office
buildings in Singapore and London. The Metropolis, Rose
Court, 1 St Martin’s Le Grand and 60 St Martins Lane will be
the main contributors to the Group’s earnings in 2015.
To propel its future growth, the Group is continuing to
search for good investment and development opportunities
both locally and overseas.
ACKNOWLEDGEMENTS
I would like to thank our loyal shareholders, customers,
business associates and suppliers for their support
throughout the years.
I would also like to convey my deep appreciation to our
Board of Directors for their continued guidance and
support which have contributed greatly to the growth of
the Group.
To the management and staff of the Group, I wish to
extend my thanks and appreciation for their commitment,
dedication and invaluable contributions.
Chua Thian Poh
Chairman & CEO
12
Ho Bee Land
Annual Report 2014
Board of Directors
MR CHUA THIAN POH
MR ONG CHONG HUA
Chairman and CEO
Executive Director
Since
founding
the
Group
in
August
1987,
Mr Chua Thian Poh has helmed the Group as Chairman
and Chief Executive Officer. As the organisation’s key
decision maker, he sets the Group’s strategic direction and
determines its financial and investment decisions. Mr Chua
has led the Group through several pivotal chapters of its
history including the Company’s initial public offering in
1999 and its international expansion.
Mr Ong joined the Group in August 1995 as an Executive
Director. He works with the Chairman in charting the
Group’s investment, development and marketing
strategies for Singapore as well as overseas. In addition to
his strategic role, Mr Ong directs the project management
team that drives the construction of the Group’s various
development projects in Singapore. He also oversees the
property management of the Group’s investment portfolio
both locally and overseas.
Mr Chua serves on the boards of several other companies and
community organizations. He is the President of Singapore
Federation of Chinese Clan Associations, Board Chairman
of Business China, Honorary President of Singapore Chinese
Chamber of Commerce & Industry, Chairman of Ren Ci
Hospital, President of Singapore Hokkien Huay Kuan and
Chairman of Bishan East Citizens’ Consultative Committee.
Mr Chua is also the Chairman of Board of Trustee of Chinese
Development Assistance Council.
Mr Chua was conferred the Public Service Star (BBM) in 2004
and appointed Justice of the Peace in 2005. He was conferred
the 2006 Businessman of the Year. In November 2012, Mr
Chua was conferred The President’s Award for Philanthropy
(Individual). He was conferred the Distinguished Service
Order (Darjah Utama Bakti Cemerlang) in 2014.
MR DESMOND WOON CHOON LENG
Executive Director
Mr Woon joined the Group in 1987 as a Manager
responsible for the Group’s financial, investment and
marketing initiatives. He was appointed as an Executive
Director in August 1995. Mr Woon directs the Group’s
corporate finance, accounting, tax, legal, risk management,
corporate governance and investor relations, and oversees
these functions across the Group. He played a leading role
in the Company’s initial public offering in 1999.
Prior to joining the Group, Mr Woon’s career highlights
include holding the post of Finance and Administration
Manager at two of Indonesia’s leading electronics
companies.
Mr Ong has more than 30 years of experience in the real
estate sector. He began his career as a Town Planner with
the Urban Redevelopment Authority in 1980 before joining
Jones Lang Wootton (now known as Jones Lang LaSalle) in
1990 as Head of its Consultancy and Project Management
Department. Mr Ong holds a Masters degree in Town and
Regional Planning from the University of Sheffield, UK.
MR TAN KENG BOON
Lead Independent Director
Mr Tan was appointed to the Board in November 1999. An
active venture capitalist, Mr Tan is the Managing Director
of many venture and private equity funds managed by
Seavi Advent, a group of fund management companies.
Mr Tan has served as an independent director on the
boards of many listed companies over the last 25 years.
To concentrate on his own business, Mr Tan has stepped
down from all of them, except for his directorship in
Ho Bee Land Limited. Mr Tan’s career highlights include
serving as the Chairman of the Singapore Venture Capital
and Private Equity Association from 1993 to 2001. Mr Tan
graduated with a Bachelor of Engineering (Honours) in 1969
from the University of Singapore, where he also received a
postgraduate Diploma in Business Administration.
13
MR CH’NG JIT KOON
MR BOBBY CHIN YOKE CHOONG
Independent Director
Independent Director
Mr Ch’ng was appointed to the Board in November 1999.
He also sits on the boards of public listed companies of
Pan-United Corporation Ltd, Progen Holdings Limited
and Santak Holdings Limited. Mr Ch’ng was a Member of
the Singapore Parliament from 1968 to 1996 and held the
post of Senior Minister of State, Ministry of Community
Development, when he retired in January 1997. He currently
also serves in several community organisations.
Mr Bobby Chin was appointed to the Board in November
2006. He was the Managing Partner of KPMG Singapore
from 1992 until his retirement in September 2005. He
is an Associate Member of the Institute of Chartered
Accountants in England and Wales.
MR JEFFERY CHAN CHEOW TONG
Independent Director
Mr Chan was appointed to the Board in October 2002. He is
also an Independent Director of AXA Insurance Singapore
Pte Ltd and Goodhope Asia Holdings Ltd. Mr Chan is a
Fellow Member of the Institute of Chartered Accountants
in England and Wales as well as the Institute of Singapore
Chartered Accountants.
MR TAN ENG BOCK
Independent Director
Mr Tan has been a member of the Board since October 2002.
Mr Tan has been instrumental in the development of sports
in Singapore since 1970. He had, among other capacities,
served as the Deputy President of the Singapore Swimming
Association and Chairman of the River Valley Constituency
Sports Club. He was a Member of the Technical Water Polo
Committee of the World Swimming Body FINA as well as
Vice Chairman of the Asian Amateur Swimming Federation.
He also serves on the boards of several companies.
Mr Tan’s career saw him spent close to four decades in the
Singapore Police Force where he held various positions
including Director of Public Affairs and Director of Criminal
Investigation Department. He retired from the Singapore
Police Force as an Assistant Police Commissioner. For his
many contributions to the nation, Mr Tan was awarded The
Public Service Star (BBM) in 1986.
Mr Chin served as a board member of Urban Redevelopment
Authority from 1997 to 2006 and was its Chairman from
2001 to 2006. He also served as the Chairman of Singapore
Totalisator Board from 2006 to 2012.
Mr Chin is currently the Chairman of NTUC Fairprice Cooperative Ltd, Chairman of NTUC Fairprice Foundation
Ltd, and Deputy Chairman of NTUC Enterprise CoOperative Limited. He serves as a member of the Council
of Presidential Advisers. Mr Chin is also a board member of
Temasek Holdings (Private) Ltd, Frasers Centrepoint Asset
Management Ltd and Singapore Labour Foundation. He
sits on the boards of several listed companies including, Yeo
Hiap Seng Ltd, AV Jennings Limited, Sembcorp Industries
Ltd and Singapore Telecommunications Limited.
14
Ho Bee Land
Annual Report 2014
The Management Team
CHONG HOCK CHANG
NICHOLAS CHUA
Associate Director
Associate Director
Hock Chang joined the Group in 1995 as a Manager of marketing
and business development. He was appointed as Associate
Director in January 2011. In his role, Hock Chang steers the
marketing of the Group’s investment and development
properties, and develops new business ventures for the
Group. He also engages in the Group’s overseas development
projects. Hock Chang started his career as a Valuer at the
Inland Revenue Authority of Singapore. He then joined
Jones Lang Wootton (now known as Jones Lang Lasalle) as a
Consultant and undertook major research, feasibility studies
and formulated marketing strategies for clients. Hock Chang
holds a Bachelor of Science (Honours) in Estate Management
from the National University of Singapore, and is a member of
the Singapore Institute of Surveyors and Valuers. He currently
serves as a council member on the Management Committee
of the Real Estate Developers Association of Singapore.
Nicholas joined the Group in May 2002 as a Manager of
business development and marketing. He was appointed
as Associate Director in January 2011. As an Associate
Director, Nicholas is responsible for identifying and
evaluating business opportunities for the Group, and
marketing of the Group’s investment and development
properties. He also engages in the Group’s overseas
development projects. Before joining the Group, Nicholas
was with DBS Group Holdings Ltd. Nicholas graduated
with a Bachelor of Science in Finance and Marketing from
the University of Oregon.
15
CAROLINE EE-LEE
LUM HON CHEW
General Manager, HR and Corporate Affairs
General Manager, Special Projects
Caroline has been the General Manager of the Group’s
human resource and corporate affairs department since
2005. Her career began at the National Computer Systems
(now known as NCS), and she became the Assistant
Director of Administration and Special Projects at the
Singapore Chinese Chamber of Commerce and Industry
in 1993. At the chamber, Caroline successfully grew Cyber
Business Network Pte Ltd – a subsidiary of the chamber –
into an independent bilingual web publishing house that
created a distinctive online presence for businesses. For
her entrepreneurial achievements, Caroline was conferred
the Top 10 Woman Entrepreneur of The Year 2000 award
by the Singapore Association of Small and Medium
Enterprises. Caroline left the chamber as the Assistant
Executive Director. She was conferred The Public Service
Medal (PBM) in August 2012. Caroline holds a Bachelor of
Science (Information Systems and Computer Science) from
the National University of Singapore.
Hon Chew joined the Group in 2000 as a Project
Manager. He was appointed as General Manager
(Special Projects) in January 2015. Hon Chew is in
charge of property management for the Group’s local
investment portfolio, and project management for local
development assignments. Before joining the Group,
Hon Chew served in the Development Control Division
of the Urban Redevelopment Authority, and was also a
Project Development Manager with a private property
development firm. Hon Chew holds a Bachelor of Business
(Business Administration) from Royal Melbourne Institute
of Technology, a Diploma in Management Studies from
Singapore Institute of Management, and a Diploma in
Architectural Technology from Singapore Polytechnic.
16
Ho Bee Land
Annual Report 2014
Property Overview
THE METROPOLIS
Singapore
The Metropolis was officially opened by the Prime Minister of Singapore, Mr Lee Hsien Loong, on 3 November 2014.
Home to a number of eminent global corporations, the 1.1 million sq ft development already has 98% of its net lettable
area being leased. The Metropolis recently won the Singapore Property Award in the Office Category, which recognises
excellence in Singapore’s real estate projects. For the brilliance in its design, the development was also one of the winners
at the 2015 Singapore Good Design Mark.
Without a doubt, The Metropolis has become an distinct architectural marvel in the one-north precinct.
17
60 ST MARTIN’S LANE
London
The Group’s investment portfolio was further enhanced with its latest acquisition of 60 St Martin’s Lane in October 2014.
The freehold prime trophy office and retail building is located in the heart of Covent Garden, one of London’s most famous
retail, entertainment and business districts. The development was extensively redeveloped in 2011, retaining its striking
Portland Stone façade. The building has been designed according to the highest standards, boasting an impressive doublevolume reception area that complements the contemporary feel of the surroundings.
The six-storey development is currently fully leased.
18
Ho Bee Land
Annual Report 2014
Property Overview
PEARL
Melbourne
Featuring a dynamic product mix of apartment buildings and town houses, Pearl is located in the heart of Doncaster, beside
the Westfield Shopping Centre.
Pearl’s local area boasts exceptional amenities, and the city is within easy reach via the Eastern Freeway. Sales for the
project have commenced, and 65% of the 185-unit development has already been sold. In fact, Pearl’s town houses sold
out within the first week of its launch.
Pearl is slated for completion by the second quarter of 2016.
19
20
Ho Bee Land
Annual Report 2014
Property Overview
RHAPSODY
Gold Coast
Day by day, Rhapsody is growing into a more significant part of the Gold Coast skyline.
The 223-unit residential development is gradually taking shape, and will reach 41 storeys in height, with an unobstructed
view of the Pacific Ocean. Rhapsody is currently being marketed in Australia, and an international launch is scheduled for
the second half of 2015.
Set to become an architectural landmark at Surfers’ Paradise, Rhapsody is slated for completion in early 2016.
21
Ho Bee Land
22
Annual Report 2014
Five-Year Financial Summary
SHAREHOLDERS’ EQUITY
($ MILLION)
12
13
14
1,787
1,645
11
12
RETURN ON EQUITY
(%)
29
25
13
10
11
14
13
258
234
348
13
201
47
27
12
10
NET ASSETS VALUE PER SHARE
(CENTS)
87
28
45
11
14
12
13
14
10
11
13
10
11
14
EARNINGS PER SHARE
(CENTS)
10
1,476
11
315
13
390
12
187
11
203
10
101
149
333
342
473
2,331
592
600
PROFIT ATTRIBUTABLE TO
SHAREHOLDERS ($ MILLION)
2,601
TURNOVER
($ MILLION)
12
13
14
2010
Restated
2011*
2012*
2013*
2014*
Turnover
($’000)
600,396
341,522
472,585
149,081
101,048
Profit Before Taxation
($’000)
402,122
228,358
211,522
611,142
321,887
Profit Attributable to Shareholders
($’000)
333,049
202,514
187,065
591,775
314,991
Shareholders’ Equity
($’000)
1,476,306
1,645,244
1,786,690
2,330,775
2,601,117
Earnings Per Share
(cents)
45.25
27.98
26.69
87.42
47.16
Net Assets Value Per Share
(cents)
200.59
233.9
257.9
347.65
389.64
Dividends Per Share
(cents)
4
4
5
8
5
(%)
25.16
12.98
10.90
28.74
12.77
Return on Equity
*includes continuing and discontinued operations
23
Corporate Structure
HO BEE LAND
LIMITED
HB Properties International Pte Ltd
(100%)
HB Venture Capital Pte Ltd
(100%)
Ho Bee Developments Pte Ltd
(100%)
Ho Bee Realty Pte Ltd
(100%)
Pacific Rover Pte Ltd
(100%)
Ho Bee (Eastwood Park) Pte Ltd
(100%)
Grandiose Investments Pte. Ltd.
(100%)
Ho Bee (Pasir Ris) Pte Ltd
(100%)
HB Le Grand Pte. Ltd. (100%)
Ho Bee (One-North) Pte. Ltd.
(100%)
HB St Martins Pte. Ltd. (100%)
HB Australia Pty Ltd [AU]
(100%)
HB Ferny Pty Ltd [AU]
(100%)
HB Oracle Pty Ltd [AU]
(100%)
HB Doncaster Pty Ltd [AU]
(100%)
Ho Bee Cove Pte. Ltd.
(90%)
HB Investments (China) Pte. Ltd.
(80%)
HBS Investments Pte Ltd
(70%)
Calne Pte. Ltd.
(50%)
Seaview (Sentosa) Pte. Ltd.
(50%)
Yanlord Ho Bee Investments Pte. Ltd.
(50%)
Parliament View Developments
Limited [UK]
(100%)
Parliament View Management
Company Limited [UK]
(100%)
Yanlord Ho Bee Property
Development (Tangshan)
Co., Ltd. [PRC]
(100%)
Tangshan Yanlord Property
Management Co., Ltd. [PRC]
(100%)
Rivershore Pte. Ltd.*
(50%)
Shanghai Yanlord Hongqiao
Property Co., Ltd. [PRC]
(40%)
Pinnacle (Sentosa) Pte. Ltd.
(35%)
Zhuhai Yanlord Heyou Land Co., Ltd. [PRC]
(20%)
Notes
[AU]
[PRC]
[UK]
*
Incorporated in Australia
Incorporated in The People’s Republic of China
Incorporated in United Kingdom
In the process of liquidation
Ho Bee Land
24
Annual Report 2014
Corporate Governance Report
Ho Bee Land Limited is committed to adopting high standards of corporate governance and transparency in conducting
the Group’s businesses. The board of directors of the Company (the Board) ensures that an effective self-regulatory and
monitoring mechanism exists and is practised. This report outlines the main corporate governance practices that are in
place, with specific reference to the principles of the Code of Corporate Governance 2012 (the Code).
The Company also refers to the disclosure guide issued by the Singapore Exchange (SGX Disclosure Guide) in January 2015
and has incorporated answers to the questions set out in the SGX Disclosure Guide in this statement. Specific references
are made to the Code’s guidelines set out in the SGX Disclosure Guide.
SGX Disclosure Guide:
(a) Has the Company complied with all the principles and guidelines of the Code? If not, please state the specific deviations
and the alternative corporate governance practices adopted by the Company in lieu of the recommendations in the
Code.
(b) In what respect do these alternative corporate governance practices achieve the objectives of the principles and
conform to the guidelines in the Code?
The Company has adhered to most of the principles and guidelines of the Code. Where there are deviations from
the recommendations of the Code, we have provided the reason and explanation on the Company’s practices, where
appropriate.
BOARD MATTERS
The Board’s Conduct of Affairs (Principle 1)
Role of the Board and Board Responsibility
The principal role of the Board is to review and approve strategic plans, key operational and financial issues, evaluate
performance of the Company, and supervise executive management to achieve optimal shareholders’ value.
The Board undertakes the following duties and responsibilities in line with the Code:•
provide entrepreneurial leadership, set strategic objectives, and ensure that the necessary financial and human
resources are in place for the Company to meet its objectives;
•
establish a framework of prudent and effective controls which enables risks to be assessed and managed, including
safeguarding of shareholders’ interests and the Company’s assets;
•
review management performance;
•
identify the key stakeholder groups and recognise that their perceptions affect the Company’s reputation;
•
set the Company’s values and standards (including ethical standards) and ensure that obligations to shareholders and
other stakeholders are understood and met; and
•
consider sustainability issues such as environmental and social factors, as part of its strategic formulation.
25
Corporate Governance Report
Board processes
The Board has established various Board committees to assist in fulfilling its duties and responsibilities. These committees
are the Audit & Risk Committee (ARC), Nominating Committee (NC) and Remuneration Committee (RC) which are
governed by specific terms of reference.
The Board currently holds four scheduled meetings each year. Ad hoc meetings are also convened as and when necessary
to address any specific matters. The attendance of the directors at Board and Board committee meetings for the financial
year ended 31 December 2014 is as follows:Board meeting
ARC meeting
NC meeting
RC meeting
No. of
meetings
held while
a member
No. of
meetings
attended
No. of
meetings
held while
a member
No. of
meetings
attended
No. of
meetings
held while
a member
No. of
meetings
attended
No. of
meetings
held while
a member
No. of
meetings
attended
Chua Thian Poh
4
4
N.A.
N.A.
1
1
N.A.
N.A.
Desmond Woon Choon Leng
4
4
N.A.
N.A.
N.A.
N.A.
N.A.
N.A.
Ong Chong Hua
4
4
N.A.
N.A.
N.A.
N.A.
N.A.
N.A.
Tan Keng Boon
4
4
4
4
1
1
N.A.
N.A.
Ch’ng Jit Koon
4
4
4
4
1
1
N.A.
N.A.
Jeffery Chan Cheow Tong
4
4
4
4
N.A.
N.A.
2
2
Tan Eng Bock
4
4
N.A.
N.A.
N.A.
N.A.
2
2
Bobby Chin Yoke Choong
4
4
4
4
1
1
2
2
Name of director
Note:
N.A. means not applicable.
Ho Bee Land
26
Annual Report 2014
Corporate Governance Report
Matters requiring Board’s approval (Guideline 1.5)
SGX Disclosure Guide:
What are the types of material transactions which require approval from the Board?
The following is a list of key matters that require Board’s approval:•
annual budget;
•
quarterly and full year results announcements;
•
annual report and accounts;
•
declaration of dividends;
•
strategic plans; and
•
major acquisitions / disposals.
Training for directors (Guideline 1.6)
SGX Disclosure Guide:
(a)
Are new directors given formal training? If not, please explain why.
(b)
What are the types of information and training provided to (i) new directors and (ii) existing directors to keep them
up-to-date?
Directors are provided with the opportunity for training to ensure that they are conversant with their responsibilities and
familiar with the Group’s businesses, governance practices, relevant new legislations and changing commercial risks.
The directors can attend, at the Company’s expenses, relevant conferences and seminars including programmes conducted
by the Singapore Institute of Directors.
The Company arranges for directors’ training program each year based on the recommendations of the NC. In addition, the
Company arranges for professional briefings when necessary to update the directors on any new regulatory development
which has an impact on the Group.
27
Corporate Governance Report
Each year, the Company conducts an annual business review meeting for the directors. Presentations and briefings are
conducted at the annual business review meeting by the senior management on the Group’s operations, followed by
discussion sessions on matters relating to operations and strategies.
The directors are regularly briefed by the external auditors on new regulations and key changes to financial reporting
standards. In 2014, the external auditors from KPMG LLP briefed the directors on (i) the financial reporting surveillance
programme administered by the Accounting and Corporate Regulatory Authority; (ii) impending key changes to the
Singapore Companies Act; (iii) key changes to financial reporting standards; and (iv) proposed changes to auditors’ report.
Induction and orientation for new directors
There was no training for new directors in 2014 as there was no new appointment of directors. For any new director appointed
to the Board, they will be briefed and issued with a director pack comprising the following information:•
a letter of appointment which sets out the terms of appointment;
•
a general guide on the duties and liabilities of a director of a listed company under the Singapore Companies Act and
the Listing Manual of the Singapore Exchange;
•
a set of the Company’s corporate manual which contains all Company policies approved by the Board; and
•
an overview presentation by senior management on the Group’s business and operations.
Board composition and guidance (Principle 2)
Members of the Board
The Board comprises eight members, of whom five are independent non-executive directors. The Board comprises
individuals with diverse skills, qualifications and backgrounds which include accounting, audit, banking, investment,
government and business experience. All the directors have real estate experience, having been on the Board for a number
of years, and also from their experience gained from other boards or organisations. Details on the profile of the directors
are set out on pages 12 and 13 of the Annual Report.
Ho Bee Land
28
Annual Report 2014
Corporate Governance Report
Key information on the directors
The key information on the directors is set out in the following tables:CHUA THIAN POH Chairman and Chief Executive Officer
Age: 66
Date of first appointment as director: 8 August 1987
Date of last re-appointment as director: N.A.
Board
committee(s)
served on
Academic and
professional
qualification(s)
Current directorships in other listed companies and
other principal commitments
Past directorships in other
listed companies held over
preceding three years
Nominating
Committee
(Member)
N.A.
Other listed companies
Nil
Nil
(1)
Other principal commitments(1)
(1) Singapore Federation of Chinese Clan Associations
(President)
(2) Singapore Clan Foundation (Chairman)
(3) Singapore Chinese Cultural Centre Limited (Chairman)
(4) Singapore Hokkien Huay Kuan (President)
(5) Singapore Hokkien Huay Kuan Affiliated School
Management Committee (Chairman)
(6) The Hokkien Foundation Management Committee
(Chairman)
(7) Yunnan Realty Pte Ltd (Chairman)
(8) Singapore Hokkien Huay Kuan Cultural Academy
(Chairman)
(9) Singapore Chinese Chamber of Commerce & Industry
(Honorary President)
(10) Business China (Chairman)
(11) Ren Ci Hospital (Chairman)
(12) Bishan East Citizens’ Consultative Committee
(Chairman)
(13) Chinese Development Assistance Council Board of
Trustee (Chairman)
(14) National Integration Council (Member)
(15) National Steering Committee on Racial & Religious
Harmony (Member)
(16) Nalanda Library Fund Limited (Director)
Besides the principal commitments listed above, Mr Chua Thian Poh holds directorships in a number of related corporations,
associated companies and jointly controlled entities of the Company.
29
Corporate Governance Report
DESMOND WOON CHOON LENG
Executive Director
Age: 59 Date of first appointment as director: 11 August 1995 Date of last re-appointment as director: 27 April 2012
Date of next re-election as director: 28 April 2015 (1) Board
committee(s)
served on
N.A.
Academic and
professional
qualification(s)
N.A.
Current directorships in other listed companies and
other principal commitments
Other listed companies
Nil
Past directorships in other
listed companies held over
preceding three years
Nil
Other principal commitments(2)
Nil
Mr Desmond Woon Choon Leng is retiring under Article 104 of the Company’s Articles of Association at the 27th annual general
meeting and being eligible, he has offered himself for re-election. Saved as disclosed herein, there is no relationship (including
immediate family relationship) between Mr Woon and the other directors or the Company.
(1)
(2)
Mr Desmond Woon Choon Leng holds directorships in a number of related corporations, associated companies and jointly controlled
entities of the Company.
ONG CHONG HUA
Executive Director
Age: 60
Date of first appointment as director: 11 August 1995 Date of last re-appointment as director: 28 April 2014
Board
committee(s)
served on
Academic and
professional
qualification(s)
Current directorships in other listed companies and
other principal commitments
Past directorships in other
listed companies held over
preceding three years
N.A.
Masters Degree
in Town and
Regional
Planning
Other listed companies
Nil
Nil
(1)
Other principal commitments(1)
(1) Kingdom Investment Holdings Pte. Ltd. (Director)
(2) FNA Group International Pte. Ltd. (Director)
(3) Focus Network Agencies (Singapore) Pte. Ltd. (Director)
Besides the principal commitments listed above, Mr Ong Chong Hua holds directorships in a number of related corporations,
associated companies and jointly controlled entities of the Company.
Ho Bee Land
30
Annual Report 2014
Corporate Governance Report
TAN KENG BOON
Independent Non-Executive Director and Lead Independent Director
Age: 69
Date of first appointment as director: 12 November 1999
Date of last re-appointment as director: 30 April 2013
Board
committee(s)
served on
Academic and
professional
qualification(s)
Current directorships in other listed companies and other
principal commitments
Past directorships in other
listed companies held over
preceding three years
Nominating
Committee
(Chairman)
Honours Degree
in Engineering
Other listed companies
Nil
EnGro Corporation Limited
Diploma in
Business
Administration
Other principal commitments
(1) Seavi Advent Venture Management Pte Ltd
(Managing Director)
(2) Seavi Venture Management (Bermuda) Ltd
(Managing Director)
(3) Seavi Venture Services Pte Ltd (Managing Director)
(4) Seavi Advent Partners Limited (Director)
(5) SEAVI Advent Corporation Ltd (Director)
(6) SEAVI Advent Management Ltd (Director)
(7) SEAVI Advent Holdings Limited (Director)
(8) Seavi Advent Ocean Private Equity Limited (Director)
(9) Seavi Advent Equity Pte Ltd (Director)
(10) Seavi Management (S) Pte Ltd (Director)
(11) Seavi Advent Partners (III) Ltd (Director)
(12) Seavi Advent Management Pte Ltd (Director)
Audit & Risk
Committee
(Member)
31
Corporate Governance Report
BOBBY CHIN YOKE CHOONG Independent Non-Executive Director
Age: 63
Date of first appointment as director: 29 November 2006
Date of last re-appointment as director: 27 April 2012
Date of next re-election as director: 28 April 2015(1) Board
committee(s)
served on
Academic and
professional
qualification(s)
Current directorships in other listed companies and other
principal commitments
Past directorships in other
listed companies held over
preceding three years
Audit & Risk
Committee
(Chairman)
ACA (Institute
of Chartered
Accountants in
England & Wales)
Other listed companies
(1) AV Jennings Limited (Independent Director)
(2) Yeo Hiap Seng Ltd (Independent Director)
(3) Sembcorp Industries Ltd (Independent Director)
(4) Singapore Telecommunications Limited
(Independent Director)
(1) Neptune Orient Lines
Limited
(2) Oversea-Chinese
Banking Corporation
Limited
Nominating
Committee
(Member)
Remuneration
Committee
(Member)
(1)
Other principal commitments
(1) Frasers Centrepoint Asset Management Ltd
(Independent Director)
(2) Singapore Labour Foundation (Independent Director)
(3) Council of Presidential Advisers (Member)
(4) NTUC Enterprise Co-operative Limited (Deputy Chairman)
(5) NTUC Fairprice Co-operative Ltd (Chairman)
(6) NTUC Fairprice Foundation Ltd (Chairman)
(7) Temasek Holdings (Private) Ltd (Independent Director)
Mr Bobby Chin Yoke Choong is retiring under Article 104 of the Company’s Articles of Association at the 27th annual general meeting
and being eligible, he has offered himself for re-election. There is no relationship (including immediate family relationship) between
Mr Chin and the other directors, the Company or its 10% shareholders (as defined in the Code).
Ho Bee Land
32
Annual Report 2014
Corporate Governance Report
CH’NG JIT KOON
Independent Non-Executive Director
Age: 81
Date of first appointment as director: 12 November 1999
Date of last re-appointment as director: 28 April 2014
Date of next re-appointment as director: 28 April 2015(1)
Board
committee(s)
served on
Academic and
professional
qualification(s)
Current directorships in other listed companies and other
principal commitments
Past directorships in other
listed companies held over
preceding three years
Audit & Risk
Committee
(Member)
Degree in
Economics and
Political Science
Other listed companies
(1) Pan-United Corporation Ltd (Non-Executive Chairman)
(2) Progen Holdings Limited (Independent Director)
(3) Santak Holdings Limited (Independent Director)
Tung Lok Restaurants (2000)
Ltd
Nominating
Committee
(Member)
(1)
Other principal commitments
(1) Chinese Development Assistance Council Board of
Trustees (Member)
(2) Singapore Hokkien Huay Kuan Board of Governors
(Member)
Mr Ch’ng Jit Koon is retiring under Section 153 of the Companies Act, Chapter 50 at the 27th annual general meeting and he has
offered himself for re-appointment. There is no relationship (including immediate family relationship) between Mr Ch’ng and the
other directors, the Company or its 10% shareholders (as defined in the Code).
JEFFERY CHAN CHEOW TONG Independent Non-Executive Director
Age: 66
Date of first appointment as director: 15 October 2002 Date of last re-appointment as director: 28 April 2014
Board
committee(s)
served on
Academic and
professional
qualification(s)
Remuneration
Committee
(Chairman)
Fellow Chartered Other listed companies
Accountant of
Nil
Singapore
Other principal commitments
(1) AXA Insurance Singapore Pte Ltd (Independent Director)
FCA (Institute
(2) Goodhope Asia Holdings Ltd (Independent Director)
of Chartered
Accountants in
England & Wales)
Audit & Risk
Committee
(Member)
Current directorships in other listed companies and other
principal commitments
Past directorships in other
listed companies held over
preceding three years
Nil
33
Corporate Governance Report
TAN ENG BOCK Independent Non-Executive Director
Age: 78
Date of first appointment as director: 15 October 2002 Date of last re-appointment as director: 28 April 2014
Date of next re-appointment as director: 28 April 2015(1)
Board
committee(s)
served on
Remuneration
Committee
(Member)
(1)
Academic and
professional
qualification(s)
N.A.
Current directorships in other listed companies and other
principal commitments
Other listed companies
Ban Leong Technologies Ltd (Independent Director)
Past directorships in other
listed companies held over
preceding three years
Nil
Other principal commitments
Kyowa Security Guard & General Services Pte Ltd (Director)
Mr Tan Eng Bock is retiring under Section 153 of the Companies Act, Chapter 50 at the 27th annual general meeting and he has
offered himself for re-appointment. There is no relationship (including immediate family relationship) between Mr Tan and the other
directors, the Company or its 10% shareholders (as defined in the Code).
Notes:
(1) Information on directors’ shareholdings in the Company and its related corporations is set out in the Directors’ Report
on pages 54 to 57 of the Annual Report.
(2) N.A. means not applicable.
Proportion of Independent Directors (Guideline 2.1)
SGX Disclosure Guide:
Does the Company comply with the guideline on the proportion of independent directors on the Board? If not, please state
the reasons for the deviation and the remedial action taken by the Company.
There are five independent directors, constituting more than 50% of the Board and complies with the guideline of the
Code. The independent directors of the Company are:(1) Tan Keng Boon (Lead Independent Director)
(2) Ch’ng Jit Koon
(3) Jeffery Chan Cheow Tong
(4) Tan Eng Bock
(5) Bobby Chin Yoke Choong
Ho Bee Land
34
Annual Report 2014
Corporate Governance Report
Determining independence of independent directors (Guideline 2.3)
SGX Disclosure Guide:
(a)
Is there any director who is deemed to be independent by the Board, notwithstanding the existence of a relationship
as stated in the Code that would otherwise deem him not to be independent? If so, please identify the director and
specify the nature of such relationship.
(b)
What are the Board’s reasons for considering him independent? Please provide a detailed explanation.
The NC assesses the independence of the independent directors annually based on the guidelines set out in the Code.
Each independent director is required to make a declaration annually to confirm that there is no relationship as stated in
the Code that would otherwise deem him not to be independent. The NC has reviewed the declarations of independence
by the independent directors for the financial year ended 31 December 2014, and is satisfied that all independent directors
are suitable to be considered as independent for the purpose of Principle 2 of the Code.
Independent directors with more than 9-year tenure (Guideline 2.4)
SGX Disclosure Guide:
Has any independent director served on the Board for more than nine years from the date of his first appointment? If so,
please identify the director and set out the Board’s reasons for considering him independent.
The Company has implemented a Board Assessment Framework since 2012 which includes a robust process for reviewing
directors’ independence. Based on the directors’ performance assessment for 2014, the NC and the Board are satisfied that
the directors who have reached 9-year tenure, namely Mr Tan Keng Boon, Mr Ch’ng Jit Koon, Mr Jeffery Chan Cheow Tong
and Mr Tan Eng Bock, have continued to maintain independence in their oversight role and they have continued to add
value to the Company. The Board values continuity and stability and recommends that they continue to serve the Board.
Each independent director has recused himself in the determination of his own independence.
35
Corporate Governance Report
Determining Board’s composition (Guideline 2.6)
SGX Disclosure Guide:
(a)
What is the Board’s policy with regard to diversity in identifying director nominees?
(b)
Please state whether the current composition of the Board provides diversity on each of the following – skills,
experience, gender and knowledge of the Company, and elaborate with numerical data where appropriate.
(c)
What steps has the Board taken to achieve the balance and diversity necessary to maximise its effectiveness?
The Board’s composition is determined in accordance with the following principles:•
the Board should comprise a majority of non-executive directors, with independent directors making up at least half of
the Board as the Chairman and Chief Executive Officer (CEO) of the Company is the same person;
•
the Board should comprise directors with a broad range of expertise both nationally and internationally;
•
the Board should have enough directors to serve on various Board committees without the directors being overburdened to the extent that it becomes difficult for them to fully discharge their responsibilities; and
•
all directors (except the CEO) are subject to re-election once every three years at annual general meetings.
The composition of the Board is reviewed annually by the NC to ensure that there is a strong and independent element on
the Board and that its size is appropriate to the scope and nature of the Group’s operations.
The Board is of the view that there is sufficient diversity in skills, experience and knowledge of the Company in its current
Board composition to maximise effectiveness. The Board will take into consideration the skill sets and experience, including
gender diversity, for any future Board appointments.
Chairman and Chief Executive Officer (Principle 3)
There is no separation of roles between the Chairman and CEO in the Company due to the fact that Mr Chua Thian Poh who
indirectly owns the majority of the shares in the Company, has been personally involved in the day-to-day operations of the
Company since its incorporation. The Board is of the opinion that it has a strong and independent group of non-executive
directors and is well balanced. In addition, the Company has appointed Mr Tan Keng Boon, an independent non-executive
director, to be the lead independent director of the Company since 26 February 2007.
The Chairman is responsible for the effective working of the Board and his responsibilities include:•
leading the Board to ensure its effectiveness on all aspects of its role;
•
creating the conditions for overall Board and individual director effectiveness;
•
demonstrating ethical leadership;
•
setting clear expectations concerning the Company’s culture, values and behaviours;
Ho Bee Land
36
Annual Report 2014
Corporate Governance Report
•
setting the Board agenda in consultation with the executive directors, and ensuring that adequate time is available for
discussion of all agenda items, in particular strategic issues;
•
ensuring that all Board members are furnished with complete, high-quality and timely information;
•
ensuring effective communication with shareholders;
•
ensuring that proper procedures are set up to comply with the Code; and
•
promoting high standards of corporate governance.
Board membership (Principle 4)
Nominating Committee (Guideline 4.1)
The NC consists of three independent non-executive directors and one executive director. The chairman of the NC is the
Company’s lead independent director. The members of the NC are as follows:(1) Tan Keng Boon (Chairman)
(2) Ch’ng Jit Koon
(3) Chua Thian Poh
(4) Bobby Chin Yoke Choong
The key duties and responsibilities of the NC are as follows:•
make recommendations on all Board and Board committee appointments and re-appointments;
•
determine the performance criteria and evaluation process for assessing the performance of the Board, the Board
committees and individual directors;
•
review the size and composition of the Board to ensure the right mix to promote Board effectiveness;
•
determine directors’ independence;
•
review succession plans for directors and key management personnel;
•
set guideline on multiple board representations; and
•
review and recommend training and professional development programs for directors.
37
Corporate Governance Report
Guideline on multiple board representations (Guideline 4.4)
SGX Disclosure Guide:
(a)
What is the maximum number of listed company board representations that the Company has prescribed for its
directors? What are the reasons for this number?
(b)
If a maximum number has not been determined, what are the reasons?
(c)
What are the specific considerations in deciding on the capacity of directors?
The Board has adopted an internal guideline recommended by the NC to address the competing time commitments
that may be faced by a director holding multiple board appointments. The guideline provides that, as a general rule, the
maximum limit is one other listed company board representation for each executive director; three other listed company
board representations for each non-executive director with full time employment; and six other listed company board
representations for each non-executive director without full time employment. The guideline is reviewed by the NC annually.
In determining the maximum limit, the NC considers the average time requirement for directors to attend meetings, site
visits and briefings. The NC also considers the general limit set by other companies.
In its review of directors with multiple board representation, the NC considers whether (i) a director has given sufficient time
and attention to the affairs of the Company; and (ii) is able to and has been adequately carrying out his duties as a director
of the Company.
Process for selection, appointment of new directors, and re-appointment to the Board (Guideline 4.6)
SGX Disclosure Guide:
Please describe the board nomination process for the Company in the last financial year for (i) selecting and appointing new
directors and (ii) re-electing incumbent directors.
In the selection process for any new director, the NC will evaluate the balance of skills, knowledge and experience on
the Board, and determine the role and desirable competencies for any new appointment to enhance the existing Board
composition. Such evaluation may arise from the Board’s annual evaluation process. When necessary, the NC may seek the
help of external consultant to carry out the search process. The NC may meet with the potential candidate to assess his/
her suitability and availability. The selection process will take into account the candidate’s honesty, integrity, reputation,
competence, capability and financial soundness. The Board will also consider gender diversity in seeking any new
appointment to the Board. The NC will then make a recommendation to the Board for approval.
Ho Bee Land
38
Annual Report 2014
Corporate Governance Report
There was no new appointment of director in 2014 as there was no vacancy arising from director resignation and no
recommendation for additional director.
Eligibility of directors for re-election is reviewed by the NC based on the individual director’s performance.
Board performance (Principle 5)
Board evaluation (Guideline 5.1)
SGX Disclosure Guide:
(a)
What was the process upon which the Board reached the conclusion on its performance for the financial year?
(b)
Has the Board met its performance objectives?
The Ho Bee Board Assessment Framework was developed with the assistance of the Company’s consultant, KPMG Services
Pte Ltd. The framework was established and approved for use by the Board to ascertain the effectiveness of the Board
as a whole, its Board committees and the contribution by the Chairman and each director to the effectiveness of the
Board. The framework integrates the assessment of the Board, Board committees, Chairman and individual directors. This
framework is reviewed and refined annually, when required, to incorporate better practices to enable an effective and
relevant assessment process.
The Board review incorporates factors such as Board composition, access to information, Board processes, accountability,
monitoring of strategy, consideration of shareholders’ value, committee effectiveness, risk management, succession
planning and comparison with industry peers. The annual assessment is carried out using a board evaluation questionnaire
which is completed by each director. The results of the assessment is provided to the NC to assess and discuss the
performance of the Board as a whole, and recommend to the Board key areas for improvement and follow-up actions. For
the financial year under review, the Board was of the view that it had satisfactorily met its performance objectives.
The effectiveness of the Board committees is assessed annually, the results of which are assessed by the NC and the Board.
Areas for improvement are subsequently provided to the committees. The assessments are carried out using comprehensive
self-assessment checklists. The ARC checklist is adapted from the Guidebook for Audit Committees in Singapore (Second
Edition). The NC checklist is adapted from the Nominating Committee Guide 2012 published by KPMG Singapore. The RC
checklist provides a full check against the Code’s guidelines.
The Board Chairman is assessed annually by the independent directors during a meeting of independent directors, the
results of which are provided to the Board Chairman immediately after the meeting.
Individual directors are assessed annually using a director performance evaluation form which is completed by the
Board Chairman and the NC Chairman. The directors are assessed on how they continue to contribute effectively and
demonstrate their commitment to the role as a director. It also recognises how individual strengths complement each
other, utilising criteria such as leadership, communication skills, industry experience, risk management, time commitment
and professionalism.
39
Corporate Governance Report
Access to information (Principle 6)
Directors are provided with detailed financial statements and reports for each Board meeting which are required to be
circulated at least seven days in advance of each meeting. These include disclosure documents, management accounts,
budgets and information pertaining to matters to be brought before the Board. In addition, all relevant information on
material transactions and events are circulated to directors as and when they arise.
Additional information for independent directors (Guideline 6.1)
SGX Disclosure Guide:
What types of information does the Company provide to independent directors to enable them to understand its business,
the business and financial environment as well as the risks faced by the Company? How frequently is the information provided?
At each quarterly meeting, the independent directors are briefed by the executive directors and senior management on the
Group’s business, finance and risks. They are also briefed on key developments in the real estate industry both locally and
overseas.
Every Board member has independent and full access to the company secretary, auditors, senior management and other
employees to seek additional information. The directors can seek independent legal and professional advice, if necessary,
at the Company’s expense, to enable them to fulfill their duties and responsibilities.
REMUNERATION MATTERS
Procedures for developing remuneration policies (Principle 7)
Remuneration Committee (Guideline 7.1)
The RC comprises three independent non-executive directors. The members of the RC are as follows:(1) Jeffery Chan Cheow Tong (Chairman)
(2) Tan Eng Bock
(3) Bobby Chin Yoke Choong
The key duties and responsibilities of the RC are as follows:•
ensure that the level and structure of remuneration is aligned with the long term interest and risk policies of the Company;
•
review management’s proposal and recommend to the Board on the general remuneration framework and specific
remuneration packages for the directors and key management personnel;
•
review all benefits and long-term incentive schemes (including share schemes) and compensation packages for the
directors and key management personnel;
•
review service contracts for the directors and key management personnel; and
•
ensure that there is a fair compensation system for the directors and key management personnel.
Ho Bee Land
40
Annual Report 2014
Corporate Governance Report
Level and mix of remuneration (Principle 8)
The Company’s remuneration mix framework for executive directors and key management personnel is made up of a base/
fixed salary, variable or performance-related bonuses and benefits/allowances.
In 2013, Mercer (Singapore) Pte Ltd (Mercer), an independent remuneration consultant, was engaged to carry out
a benchmarking exercise on the remuneration for executive directors and key management personnel. Mercer has no
relationship with the Company. In 2014, the Company conducted a further benchmarking exercise on Chairman and CEO
compensation.
Executive directors do not receive director fee. The Board Chairman and CEO, Mr Chua Thian Poh is entitled to profit
sharing incentives under his service agreement with the Company.
There was no overly generous termination clause in the service contract of executive directors and key management
personnel.
The RC has reviewed the Code’s recommendation on the use of contractual provisions to reclaim incentive components of
remuneration of executive directors and key management personnel, and considered it irrelevant in the Company’s context.
Non-executive directors are paid directors’ fees, subject to the approval of shareholders at the annual general meeting.
The framework for determining non-executive directors’ fees in 2014 is as follows:Non-Executive Director
Audit & Risk Committee
Nominating Committee
Remuneration Committee
Note:
N.A. means not applicable.
Board Chairman
N.A.
Member
$40,000 per annum
Lead Independent Director
$10,000 per annum
Chairman
$20,000 per annum
Member
$10,000 per annum
Chairman
$10,000 per annum
Member
$5,000 per annum
Chairman
$10,000 per annum
Member
$5,000 per annum
41
Corporate Governance Report
Disclosure on remuneration (Principle 9)
The remuneration of directors and key management personnel for the year ended 31 December 2014 is set out in the tables
below:Remuneration of Directors and CEO (Guideline 9.2)
SGX Disclosure Guide:
Has the Company disclosed each director’s and the CEO’s remuneration as well as a breakdown (in percentage or dollar
terms) into base/fixed salary, variable or performance-related income/bonuses, benefits in kind, stock options granted,
share-based incentives and awards, and other long-term incentives? If not, what are the reasons for not disclosing so?
1) Summary remuneration table for directors and the CEO in bands of $250,000
Name of director
Directors’
Fees (1)
Base /
Fixed
Salary
Variable or
Bonuses
Benefits
or
Allowances
ShareBased
Total
-
13%
84%
3%
-
100%
Ong Chong Hua
Executive director
-
35%
61%
4%
-
100%
Desmond Woon Choon Leng
Executive director
-
37%
59%
4%
-
100%
Tan Keng Boon
Non-executive director
100%
-
-
-
-
100%
Ch’ng Jit Koon
Non-executive director
100%
-
-
-
-
100%
Jeffery Chan Cheow Tong
Non-executive director
100%
-
-
-
-
100%
Tan Eng Bock
Non-executive director
100%
-
-
-
-
100%
Bobby Chin Yoke Choong
Non-executive director
100%
-
-
-
-
100%
Above $5,250,000 and up to $5,500,000
Chua Thian Poh
Chairman & CEO
Above $750,000 and up to $1,000,000
$250,000 and below
(1)
Directors’ fees are subject to shareholders’ approval at the annual general meeting.
Ho Bee Land
42
Annual Report 2014
Corporate Governance Report
The remuneration of each individual director and the CEO is disclosed, on a named basis, in bands of $250,000 with a
breakdown in percentage terms of the remuneration earned through base/fixed salary, variable or performance-related
income/bonuses and benefits-in- kind/allowances. There was no stock option granted, share-based incentive/award, and
other long term incentives. The Board is of the view that such disclosure provides adequate information on the remuneration
of the directors and the CEO.
There are no termination, retirement and post-employment benefits granted to the directors and the CEO.
Remuneration of key management personnel (Guideline 9.3)
SGX Disclosure Guide:
(a)
Has the Company disclosed each key management personnel’s remuneration, in bands of S$250,000 or in more
detail, as well as a breakdown (in percentage or dollar terms) into base/fixed salary, variable or performance-related
income/bonuses, benefits in kind, stock options granted, share-based incentives and awards, and other long-term
incentives? If not, what are the reasons for not disclosing so?
(b)
Please disclose the aggregate remuneration paid to the top five key management personnel (who are not directors or
the CEO).
(2) Summary remuneration table for top five key management personnel (who are not directors or the CEO) in
bands of $250,000
Base/
Fixed Salary
Variable or
Bonuses
Benefits
or
Allowances
Share-Based
Total
Chong Hock Chang
47%
53%
-
-
100%
Caroline Ee-Lee
Name of key management personnel
Above $250,000 and up to $500,000
61%
39%
-
-
100%
(1)
47%
53%
-
-
100%
Soh Hwee Cheow (2)
60%
40%
-
-
100%
Lum Hon Chew
51%
49%
-
-
100%
Chua Wee-Chern
Below $250,000
Mr Chua Wee-Chern is son of the Chairman & CEO, Mr Chua Thian Poh.
Mr Soh Hwee Cheow resigned from 8 April 2014.
(1)
(2)
43
Corporate Governance Report
The remuneration of the top five key management personnel (who are not directors or the CEO) is disclosed, on a named
basis, in bands of $250,000 with a breakdown in percentage terms of the remuneration earned through base/fixed salary,
variable or performance-related income/bonuses and benefits-in-kind/allowances. There was no stock option granted,
share-based incentive/award, and other long term incentives. The Board is of the view that such disclosure provides
adequate information on the remuneration of the top five key management personnel (who are not directors or the CEO).
The aggregate total remuneration paid to the top five key management personnel (who are not directors or the CEO) for
the financial year ended 31 December 2014 is $1,352,583.
There are no termination, retirement and post-employment benefits granted to the top five key management personnel
(who are not directors or the CEO).
Remuneration of employees who are immediate family member of a director or CEO (Guideline 9.4)
SGX Disclosure Guide:
Is there any employee who is an immediate family member of a director or the CEO, and whose remuneration exceeds
S$50,000 during the year? If so, please identify the employee and specify the relationship with the relevant director or the
CEO.
Besides Mr Chua Wee-Chern, who is son of the Chairman and CEO, Mr Chua Thian Poh, and whose salary is disclosed in
the above remuneration table for the top five key management personnel (who are not directors or the CEO), the following
employees are immediate family members of a director or the CEO whose remuneration exceeds $50,000 in 2014:Name of employee
Remuneration Band
Ng Noi Hinoy (1)
$250,000 and below
Chua Kong Chian (2)
$250,000 and below
Chua Weijie (3)
$250,000 and below
(1)
(3)
Mdm Ng Noi Hinoy is the spouse of the Chairman & CEO, Mr Chua Thian Poh.
Mr Chua Kong Chian is brother of the Chairman & CEO, Mr Chua Thian Poh.
Mr Chua Weijie is son of the Chairman & CEO, Mr Chua Thian Poh.
(2)
Ho Bee Land
44
Annual Report 2014
Corporate Governance Report
Employee share schemes
The Company’s Share Option Scheme approved at the extraordinary general meeting held on 30 May 2001 (2001 Scheme)
had expired on 29 May 2011. There has been no new share option scheme or share scheme since the expiry of the 2001
Scheme.
Performance conditions for executive directors and key management personnel (Guideline 9.6)
SGX Disclosure Guide:
(a)
Please describe how the remuneration received by executive directors and key management personnel has been
determined by the performance criteria.
(b)
What were the performance conditions used to determine their entitlement under the short-term and long-term
incentive schemes?
(c)
Were all of these performance conditions met? If not, what were the reasons?
Performance measure for the executive directors and key management personnel is based on key performance indicators
set each year for the individuals towards achievement of the Company’s objectives. The annual salary review is carried
out in December each year. In setting remuneration packages, the Company takes into account the pay and employment
conditions within the industry and in comparable companies, as well as the profitability of the Group as a whole, and
individual performance.
The profit sharing incentive for the Board Chairman and CEO, Mr Chua Thian Poh for FY2014 was based on a percentage
of the Group’s audited consolidated profit before tax (excluding any surplus/loss on revaluation of the Group’s investment
properties), plus one-fifth of the surplus on revaluation of the Group’s investment properties for the year (Adjusted PBT).
The balance four-fifths of the surplus on revaluation of the Group’s investment properties shall be carried forward in equal
amount every year for the next four years to determine his entitlement for subsequent years. There was a decrease in the
profit sharing incentive for FY2014 compared to FY2013 due to the corresponding decrease in the Group’s Adjusted PBT.
There was an overall decrease in performance bonuses awarded to the other executive directors and key management
personnel for FY2014 due to the decrease in the Group’s profit level compared to FY2013.
45
Corporate Governance Report
ACCOUNTABILITY AND AUDIT
Accountability (Principle 10)
The Company has been making announcements of its quarterly results since financial year 2003. Every Board member
receives from management, detailed management accounts of the Group’s performance on a regular basis. It is the aim
of the Board, in presenting the quarterly and annual financial statements announcements, to provide shareholders with a
comprehensive and balanced assessment of the Group’s performance, financial position and prospects.
Risk Management and Internal Controls (Principle 11)
The Group has in place an Enterprise Risk Management (ERM) Framework, which governs the risk management process in
the Group. Through this framework, risk capabilities and competencies are continuously enhanced. The ERM Framework
also enables the identification, prioritisation, assessment, management and monitoring of key risks to the Group’s business.
The risk management process in place covers, inter alia, financial, operational, information technology and compliance risks
faced by the Group. The key risks of the Group are deliberated by the management and reported to the ARC twice a year.
The ARC reviews the adequacy and effectiveness of the ERM Framework against leading practices in risk management and
vis-à-vis the external and internal environment which the Group operates in.
The Group has established risk appetite statements with tolerance limits to monitor shifts in its significant risks and to
proactively manage them within acceptable levels. These risk appetite statements have been reviewed and approved by
the Board and are monitored on a quarterly basis.
Complementing the ERM Framework is a Group-wide system of internal controls, which includes documented policies and
procedures, proper segregation of duties, approval procedures and authorities, as well as checks-and-balances built into
the business processes.
To ensure that internal controls and risk management processes are adequate and effective, the ARC is assisted by various
independent professional service providers. External auditors provide assurance over the risk of material misstatements
in the Group’s financial statements. Internal auditors provide assurance that controls over the key risks of the Group are
adequate and effective.
The Board acknowledges that it is responsible for the overall internal control framework, but recognises that no cost
effective internal control system will preclude all errors and irregularities, as a system is designed to manage rather than
eliminate the risk of failure to achieve business objectives, and can provide only reasonable and not absolute assurance
against material misstatement or loss.
Ho Bee Land
46
Annual Report 2014
Corporate Governance Report
Board’s commentary on the adequacy and effectiveness of the Company’s internal controls and risk management
system (Guideline 11.3)
SGX Disclosure Guide:
(a)
In relation to the major risks faced by the Company, including financial, operational, compliance, information
technology and sustainability, please state the bases for the Board’s view on the adequacy and effectiveness of the
Company’s internal controls and risk management systems.
(b)
In respect of the past 12 months, has the Board received assurance from the CEO and the CFO as well as the internal
auditor that: (i) the financial records have been properly maintained and the financial statements give true and fair
view of the Company’s operations and finances; and (ii) the Company’s risk management and internal control systems
are effective? If not, how does the Board assure itself of points (i) and (ii) above?
Based on the internal controls established and maintained by the Group, work performed by independent external third
parties, and reviews performed by and assurance from the management, various Board committees and the Board, the
Board with the concurrence of the ARC is of the opinion that the Group’s system of risk management and internal controls,
addressing financial, operational, compliance and information technology risks, were adequate as at 31 December 2014.
The systems of internal controls and risk management established by the Group provide reasonable, but not absolute
assurance that the Group will not be adversely affected by any event that can be reasonably foreseen as it strives to achieve
its business objectives. However, the Board also notes that no system of internal controls and risk management can provide
absolute assurance in this regard, or absolute assurance against the occurrence of material errors, poor judgement in
decision making, human error, losses, fraud or other irregularities.
During the process of reviewing the financial statements of the Group for FY2014, the Board had received assurance from
the CEO and the Finance Director that (i) the Group’s financial records have been properly maintained and the financial
statements give a true and fair view of the Group’s operations and finances; and (ii) the effectiveness of the Group’s risk
management and internal control systems.
Audit & Risk Committee (Principle 12)
The Company’s Audit Committee was renamed as Audit & Risk Committee (ARC) on 7 November 2012.
The ARC is made up of four Board members, all of whom are independent non-executive directors. The members of the
ARC are as follows:1. Bobby Chin Yoke Choong (Chairman)
2. Tan Keng Boon
3. Jeffery Chan Cheow Tong
4. Ch’ng Jit Koon
47
Corporate Governance Report
The ARC meets regularly to perform the following functions:•
review the Company’s quarterly and annual financial statements, and any announcements relating to the Company’s
financial performance;
•
review related party transactions and interested person transactions to ensure compliance with the regulations set out
in the Listing Manual;
•
review the audit plan and audit report of the external auditors, their evaluation of the system of internal accounting
controls, and management’s responses to the recommendations;
•
review the scope and results of the external audits, their cost effectiveness, and the independence and objectivity of
the external auditors;
•
nominate external auditors for appointment or re-appointment, and review the remuneration and terms of engagement
of the external auditors;
•
review the internal audit programme including the scope and results of the internal audit procedures, and management
responses to the recommendations;
•
review the independence and resource capability of the internal auditors, and the adequacy and effectiveness of
internal audits;
•
approve the appointment or re-appointment, evaluation and remuneration of the internal auditors;
•
review the Company’s level of risk tolerance, its risk strategy and risk policies; and ensure that the Company sets a
process for the accurate and timely monitoring of large exposures and certain risk types of critical importance;
•
review the Company’s overall risk assessment process and risk assessment framework; and review the parameters used
in these measures and the methodology adopted;
•
review risk reports on the Company and review and monitor management’s responsiveness to the findings;
•
review the Company’s procedures for detecting fraud, including the whistle-blowing policy; and ensure that these
arrangements allow proportionate and independent investigation of such matters and appropriate follow up action;
and
•
review and report to the Board on the adequacy and effectiveness of the Company’s internal controls including
financial, operational, compliance and information technology controls, and risk management systems.
The ARC has full access to the internal and the external auditors and meets them at least once a year without the presence
of management. It has full authority and discretion to invite any director or senior officer to attend its meetings.
The Company has provided all ARC members with a copy each of the Guidebook for Audit Committees in Singapore
(Second Edition) issued jointly by the Monetary Authority of Singapore, the Accounting and Corporate Regulatory Authority
and the Singapore Exchange, and the Risk Governance Guidance for Listed Boards issued by the Corporate Governance
Council. In carrying out their responsibilities, the ARC members refer to these guidelines as appropriate. In addition, the
ARC members have access to professional resources to keep themselves abreast of changes to accounting standards and
issues which may have a direct impact on financial statements.
Ho Bee Land
48
Annual Report 2014
Corporate Governance Report
Fees paid to external auditors (Guideline 12.6)
SGX Disclosure Guide:
(a)
Please provide a breakdown of the fees paid in total to the external auditors for audit and non-audit services for the
financial year.
(b)
If the external auditors have supplied a substantial volume of non-audit services to the Company, please state the
bases for the Audit Committee’s view on the independence of the external auditors.
The total fees paid to the external auditors, KPMG LLP for the financial year ended 31 December 2014, are as disclosed in
the table below:External auditor fees for FY2014
Total Audit Fees
$’000
% of total audit fees
362
Total Non-Audit Fees
111
Total Fees Paid
473
23%
The ARC had reviewed the nature of non-audit services provided by the external auditors in FY2014. Based on the evaluation
of external auditors for FY2014, and taking into consideration the external auditors’ confirmation of independence, the
ARC was of the opinion that the level of non-audit services and non-audit fees would not affect the independence and
objectivity of the external auditors. The non-audit fees did not exceed the 50% limit prescribed under Regulation 12, Part
IV of the Companies Regulations.
Whistle-blowing policy
The Company has in place a whistle-blowing policy. The objectives of the whistle-blowing policy are to:•
communicate the Company’s expectations of employees of the Group in detecting fraudulent activities, malpractices
or improprieties;
•
guide employees on the course of action when addressing their concerns or suspicions of fraudulent activities,
malpractices or improprieties;
•
provide a process for investigations and management reporting; and
•
establish policies for protecting whistle-blowers against reprisal by any person internal or external to the Group.
The Company encourages its officers and employees of the Group to observe the highest standards of business and
personal ethics in the conduct of their duties and responsibilities.
In the pursuit of good corporate governance, the Company encourages its officers, employees, vendors/contractors,
consultants, suppliers and/or any other parties with whom the Group has a relationship to provide information that evidences
unsafe, unlawful, unethical, fraudulent or wasteful practices.
To ensure independent investigation and appropriate follow up action, all whistle-blowing reports are submitted either
to the General Manager (Human Resource & Corporate Affairs) or the Chairman of the ARC. All whistle-blower reports,
including anonymous complaints are brought up to the ARC for review and reported to the Board.
49
Corporate Governance Report
Internal audit (Principle 13)
Internal auditors (Guideline 13.1)
SGX Disclosure Guide:
Does the Company have an internal audit function? If not, please explain why.
The Company’s current internal auditors are Nexia TS Risk Advisory Pte. Ltd. The internal auditors report directly to the
Chairman of the ARC on audit matters and to the management on administrative matters. The ARC reviews the internal
audit reports and assesses the effectiveness of the internal auditors by examining the followings:•
the internal audit plan to ensure that the internal auditors have adequate resources to perform their audit;
•
the scope of the internal audit work to ensure that majority of the identified risks are audited by cycle;
•
the quality of the internal audit report to ensure the effectiveness of the internal auditors; and
•
the independence of the internal auditors.
The internal auditors have confirmed that all their team members are corporate members of the Institute of Internal Auditors
(IIA) and are equipped with and practising the recommended standards by the IIA.
SHAREHOLDER RIGHTS AND RESPONSIBILITIES
Shareholder rights (Principle 14)
The Company endeavours to treat all shareholders fairly and equitably, and recognise, protect and facilitate the exercise
of shareholders’ rights.
Communication with Shareholders (Principle 15)
Investor Relations (Guideline 15.4)
SGX Disclosure Guide:
(a)
Does the Company regularly communicate with shareholders and attend to their questions? How often does the
Company meet with institutional and retail investors?
(b)
Is this done by a dedicated investor relations team (or equivalent)? If not, who performs this role?
(c)
How does the Company keep shareholders informed of corporate developments, apart from SGXNET announcements
and the annual report?
The Company has formalised its investor relation policy which sets out the Company’s principles and procedures for
communicating with shareholders and the investment community. A copy of the investor relation policy can be found under
the “Investor Relations” section of the Company’s website at http://www.hobee.com.
Ho Bee Land
50
Annual Report 2014
Corporate Governance Report
In line with the Company’s obligations for continuing disclosures, the Board’s policy is for shareholders to be informed of
all major developments and transactions that impact the Group.
Information is disseminated to shareholders on a transparent and timely basis. All price sensitive information and financial
results announcements are publicly released via SGXNet. The Group’s results, annual reports and media releases can also
be found under the “Investor Relations” section of the Company’s website at http://www.hobee.com.
The Company notifies investors of the date of release of its financial results through an SGXNet announcement about three
weeks in advance. Results for the first three quarters are released via SGXNet announcement to shareholders not later than
45 days after the quarter end and full year results are announced within 60 days from the financial year end. Each quarterly
and full year financial result announcement is accompanied by a media release.
The Company’s investor relations function is led by the Finance Director who has the strategic management responsibility to
integrate finance, accounting, corporate communication and legal compliance to enable effective communication between
the Company and the investment community. The Finance Director meets regularly with analysts and fund managers to
facilitate shareholders’ and investors’ communication.
Dividends (Guideline 15.5)
SGX Disclosure Guide:
If the Company is not paying any dividends for the financial year, please explain why.
Although the Company has not formulated a dividend policy, it has been declaring dividends since 2001. In its evaluation and
recommendation of dividends, the Board takes into consideration the Group’s operating performance, financial condition,
cash position and planned capital needs, as well as general business conditions and risks. It is the Board’s objectives to
pay dividend on sustainable and regular basis, and to grow dividends over time, if possible, based on the Group’s financial
performance and conditions.
Conduct of Shareholder meetings (Principle 16)
Shareholders are encouraged to attend the annual general meeting as this is the principal forum for any dialogue they may
have with the directors and management of the Company. The Board welcomes views and questions from shareholders
and the respective chairmen of the ARC, NC and RC are available to answer any question or issue regarding the Company.
Any member of the Company who is unable to attend the general meetings can appoint up to two proxies to attend
and vote on his/her behalf. The Company allows shareholders who hold shares through their CPF approved nominees to
attend the general meetings as observers. The Company has not implemented absentia voting at general meetings due to
concern that this may complicate the voting process.
Notices for general meetings are announced via SGXNet and advertised in the newspapers within prescribed timeframe
prior to the meetings. The notices, together with relevant documents (such as annual report, letter to shareholders or
circular) are sent by post to all shareholders.
51
Corporate Governance Report
Shareholders are informed of the rules and voting procedures that govern these general meetings. With effect from 1 August
2015, the Company will conduct voting by poll at general meetings and announce poll results via SGXNet immediately after
the meetings in conformity with SGX listing rules.
The Company maintains minutes of general meetings including substantial and relevant comments or queries from
shareholders relating to the meeting agenda, and responses from Board members. These minutes are made available to
shareholders upon their request.
SECURITIES TRANSACTIONS
The Company has its own internal Code of Best Practices on Securities Transactions. Under the internal code, the Company
and its officers are not allowed to deal in the Company’s securities during the periods commencing two weeks before
the announcement of the Company’s results for each of the first three quarters of its financial year and one month before
the announcement of the Company’s annual results, as the case may be, and ending on the date of announcement of the
relevant results. The Company and its officers are also not allowed to deal in the Company’s securities while in possession
of undisclosed material information of the Group. Officers of the Company are also discouraged from dealing in the
Company’s securities on short-term consideration.
The Company issues quarterly reminders to its directors and officers on the restrictions in dealings in listed securities of
the Company as set out above, in compliance with Rule 1207(19) of the SGX Listing Manual. After the end of each financial
year, all directors and officers are required to complete a checklist to confirm their compliance with the internal code. The
Company has complied with the best practices set out in the SGX Listing Manual.
INTERESTED PERSON TRANSACTIONS
The Company has adopted a set of procedures for reporting and approving interested person transactions. Details of the
interested person transactions for the year ended 31 December 2014 are as follows:
Name of
interested person
Aggregate value of all interested person transactions
(excluding transactions less than $100,000 and
transactions conducted under a shareholders’
mandate pursuant to Rule 920 of the Listing Manual)
Aggregate value of all interested person
transactions conducted under a shareholders’
mandate pursuant to Rule 920 of the Listing Manual
(excluding transactions less than $100,000)
N.A.
N.A.
N.A.
Notes:
(1) N.A. means not applicable.
(2) All interested person transactions conducted during the financial year were less than $100,000 for each transaction. The interested
person transactions were carried out on normal commercial terms and were not prejudicial to the interests of the Company and its
minority shareholders.
PROFESSIONAL CONDUCT AND DISCIPLINE
The Company has in place various staff policies on conduct, confidentiality, conflict of interests, internet usage, safe-guard of
official information, intellectual property and software use. All employees of the Company are required to conduct and carry
themselves in a professional manner while at work, and undertake to observe and comply with the policies.
Ho Bee Land
52
Annual Report 2014
Corporate Information
REMUNERATION
COMMITTEE
COMPANY REGISTRATION NO.
Mr Jeffery Chan Cheow Tong
Chairman
198702381M
Mr Tan Eng Bock
REGISTERED OFFICE
Mr Ong Chong Hua
Executive Director
Mr Bobby Chin Yoke Choong
9 North Buona Vista Drive
Mr Tan Keng Boon
Lead Independent Director
MANAGEMENT TEAM
Singapore 138588
Mr Chong Hock Chang
Associate Director
Fax: (65) 6704 0800
BOARD OF DIRECTORS
Mr Chua Thian Poh
Chairman and CEO
Mr Desmond Woon Choon Leng
Executive Director
Mr Ch’ng Jit Koon
Independent Director
Mr Jeffery Chan Cheow Tong
Independent Director
Mr Nicholas Chua Wee Chern
Associate Director
Mr Tan Eng Bock
Independent Director
Mrs Caroline Ee-Lee
General Manager
(HR and Corporate Affairs)
Mr Bobby Chin Yoke Choong
Independent Director
Mr Lum Hon Chew
General Manager (Special Projects)
AUDIT & RISK
COMMITTEE
Mr Bobby Chin Yoke Choong
Chairman
Mr Tan Keng Boon
Mr Jeffery Chan Cheow Tong
Mr Ch’ng Jit Koon
NOMINATING
COMMITTEE
Mr Low Lai Sai
Senior Finance Manager
Ms Vivian Ng Lay Yen
Senior Marketing Manager
Mr Hong Leng Guan
Project Manager
COMPANY SECRETARY
Ms Tan Sock Kiang
#11-01 The Metropolis Tower 1
Tel: (65) 6704 0888
Website: www.hobee.com
SHARE REGISTRAR
M & C Services Private Limited
112 Robinson Road #05-01
Singapore 068902
EXTERNAL AUDITORS
KPMG LLP
Public Accountants and Chartered
Accountants Singapore
Partner-In-Charge:
Mr Ong Pang Thye (since 2012)
16 Raffles Quay #22-00
Hong Leong Building
Singapore 048581
INTERNAL AUDITORS
Nexia TS Risk Advisory Pte. Ltd.
Mr Tan Keng Boon
Chairman
100 Beach Road
Mr Ch’ng Jit Koon
Singapore 189702
Mr Chua Thian Poh
Mr Bobby Chin Yoke Choong
#30-00 Shaw Tower
53
Financial Statements
54 DIRECTORS’ REPORT
59 STATEMENT BY
DIRECTORS
60 INDEPENDENT
AUDITORS’ REPORT
62
STATEMENTS OF
FINANCIAL POSITION
63 CONSOLIDATED
INCOME STATEMENT
64 CONSOLIDATED
STATEMENT OF
COMPREHENSIVE
INCOME
65 CONSOLIDATED
STATEMENT OF
CHANGES IN EQUITY
67 CONSOLIDATED
STATEMENT
OF CASH FLOWS
69 NOTES TO THE
FINANCIAL
STATEMENTS
Ho Bee Land
54
Annual Report 2014
Directors’ Report
The directors are pleased to submit this annual report to the members of the Company together with the audited financial
statements for the financial year ended 31 December 2014.
Directors
The directors of the Company in office at the date of this report are as follows:
Chua Thian Poh
Desmond Woon Choon Leng
Ong Chong Hua
Tan Keng Boon
Ch’ng Jit Koon
Jeffery Chan Cheow Tong
Tan Eng Bock
Bobby Chin Yoke Choong
(Chairman)
Directors’ interests in shares or debentures
According to the register kept by the Company for the purposes of Section 164 of the Companies Act, Chapter 50, particulars
of interests of directors who held office at the end of the financial year in shares and debentures in the Company and in
related corporations (other than wholly-owned subsidiaries) are as follows:
Name of director and corporation
in which interests are held
Holdings in the name
of the director, spouse
or infant children
Other holdings in which
the director is deemed
to have an interest
At beginning
of the year
At end
of the year
At beginning
of the year
At end
of the year
–
–
483,400,000
485,685,000
19,070,000
19,070,000
–
–
HBS Investments Pte Ltd
- ordinary shares
–
–
700,000
700,000
Ho Bee Cove Pte. Ltd.
- ordinary shares
–
–
900,000
900,000
HB Investments (China) Pte. Ltd.
- ordinary shares
–
–
80,000
80,000
Chua Thian Poh
The Company
- ordinary shares
Immediate and ultimate holding company
Ho Bee Holdings (Pte) Ltd
- ordinary shares
Subsidiaries
55
Directors’ Report
Name of director and corporation
in which interests are held
Holdings in the name
of the director, spouse
or infant children
Other holdings in which
the director is deemed
to have an interest
At beginning
of the year
At end
of the year
At beginning
of the year
At end
of the year
Parliament View Developments Limited
- ordinary shares of £1 each
–
–
50,000
50,000
Parliament View Management Company Limited
- ordinary shares of £1 each
–
–
1
1
Absolutecar E-Services Pte Ltd
- ordinary shares
–
–
3,000,000
3,000,000
Absolutecar Services Pte Ltd
- ordinary shares
–
–
2
2
Airjet Investments Pte. Ltd.
- ordinary shares
–
–
500,000
500,000
Airjet Automotive Pte Ltd
- ordinary shares
–
–
200,000
200,000
HB Media Holdings Pte Ltd
- ordinary shares
–
–
13,894,164
13,894,164
Hin Lung Auto Pte. Ltd.
- ordinary shares
–
–
3,530,000
3,530,000
HLC Leasing Pte. Ltd.
- ordinary shares
–
–
10,000
10,000
Ho Bee Capital Pte Ltd
- ordinary shares
–
–
15,000,000
15,000,000
Hobee Print Pte Ltd
- ordinary shares
–
–
5,680,000
5,680,000
Kingdom Investment Holdings Pte. Ltd.
- ordinary shares
–
–
62,400,000
62,400,000
Zen Property Management Pte Ltd
- ordinary shares
–
–
1,000,000
1,000,000
Chua Thian Poh (cont’d)
Subsidiaries
Related corporations
56
Ho Bee Land
Annual Report 2014
Directors’ Report
Name of director and corporation
in which interests are held
Holdings in the name
of the director, spouse
or infant children
Other holdings in which
the director is deemed
to have an interest
At beginning
of the year
At end
of the year
At beginning
of the year
At end
of the year
2,100,000
2,100,000
–
–
1,800,000
1,800,000
–
–
1,625,000
1,625,000
–
–
500,000
500,000
–
–
420,000
420,000
–
–
370,000
370,000
–
–
131,000
131,000
–
–
975,000
975,000
–
–
Desmond Woon Choon Leng
The Company
- ordinary shares
Ong Chong Hua
The Company
- ordinary shares
Related corporation
Kingdom Investment Holdings Pte. Ltd.
- ordinary shares
Tan Keng Boon
The Company
- ordinary shares
Ch’ng Jit Koon
The Company
- ordinary shares
Jeffery Chan Cheow Tong
The Company
- ordinary shares
Bobby Chin Yoke Choong
The Company
- ordinary shares
Related corporation
Kingdom Investment Holdings Pte. Ltd.
- ordinary shares
57
Directors’ Report
By virtue of Section 7 of the Companies Act, Chapter 50, Mr Chua Thian Poh is deemed to have an interest in all the other
wholly-owned subsidiaries of Ho Bee Land Limited, at the beginning and at the end of the financial year.
Except as disclosed in this report, no other director who held office at the end of the financial year had interests in shares or
debentures of the Company or of related corporations either at the beginning or at the end of the financial year.
There was no change in any of the abovementioned interests in the Company or in related corporations between the end of
the financial year and 21 January 2015.
Arrangements to enable directors to acquire shares and debentures
Neither at the end of the financial year nor at any time during the financial year did there subsist any arrangement to which the
Company is a party, being arrangements whose objects are, or one of whose objects is, to enable the directors of the Company
to acquire benefits by means of the acquisition of shares in, or debentures of, the Company or any other body corporate.
Directors’ contractual benefits
During the financial year, the Company and its related corporations have in the normal course of business entered into
transactions with affiliated parties and parties in which Mr Chua Thian Poh is deemed to have an interest. Such transactions
comprised payments for rental expenses, printing expenses and other transactions carried out on normal commercial terms
and in the normal course of the business of the Company and its related corporations. However, the director has neither
received nor will he be entitled to receive any benefit arising out of these transactions other than those to which he may be
entitled as a customer, supplier or member of these corporations.
Except for salaries, bonuses and fees and those benefits that are disclosed in this report and in note 32 to the financial
statements, since the end of the last financial year, no director has received or become entitled to receive a benefit by reason
of a contract made by the Company or its related corporations with the director, or with a firm of which he is a member, or
with a company in which he has a substantial financial interest.
Share options
During the financial year, there were:
(i)
no options granted by the Company or its subsidiaries to any person to take up unissued shares in the Company or its
subsidiaries; and
(ii)
no shares issued by virtue of any exercise of option to take up unissued shares of the Company or its subsidiaries.
At the end of the financial year, there were no unissued shares of the Company or its subsidiaries under option.
58
Ho Bee Land
Annual Report 2014
Directors’ Report
Audit & Risk Committee
The members of the Audit & Risk Committee at the date of this report are as follows:
Bobby Chin Yoke Choong
Tan Keng Boon
Ch’ng Jit Koon
Jeffery Chan Cheow Tong
(Chairman, Independent Director)
(Lead Independent Director)
(Independent Director)
(Independent Director)
The Audit & Risk Committee performs the functions specified in Section 201B(5) of the Companies Act, Chapter 50, the
SGX-ST Listing Manual and the Singapore Code of Corporate Governance. These functions include a review of the financial
statements of the Company and of the Group for the financial year and the auditors’ report thereon.
The Audit & Risk Committee also assists the Board with risk governance and overseeing the Company’s risk management
framework and policies.
The Audit & Risk Committee has undertaken a review of the nature and extent of non-audit services provided by the firm acting
as the auditors. In the opinion of the Audit & Risk Committee, these services would not affect the independence of the auditors.
The Audit & Risk Committee is satisfied with the independence and objectivity of the auditors and has recommended to the Board
that the auditors, KPMG LLP, be nominated for re-appointment at the forthcoming Annual General Meeting of the Company.
In appointing the auditors of the Company and its subsidiaries, the Group has complied with Rule 712 and Rule 715 of the
SGX-ST Listing Manual.
Auditors
The auditors, KPMG LLP, have indicated their willingness to accept re-appointment.
On behalf of the Board of Directors
Chua Thian Poh
Chairman
Desmond Woon Choon Leng
Director
16 March 2015
59
Statement by Directors
In our opinion:
(a)
the financial statements set out on pages 62 to 138 are drawn up so as to give a true and fair view of the state of affairs
of the Group and of the Company as at 31 December 2014 and the results, changes in equity and cash flows of the
Group for the year ended on that date in accordance with the provisions of the Singapore Companies Act, Chapter 50
and Singapore Financial Reporting Standards; and
(b)
at the date of this statement, there are reasonable grounds to believe that the Company will be able to pay its debts
as and when they fall due.
The Board of Directors has, on the date of this statement, authorised these financial statements for issue.
On behalf of the Board of Directors
Chua Thian Poh
Chairman
Desmond Woon Choon Leng
Director
16 March 2015
60
Ho Bee Land
Annual Report 2014
Independent Auditors’ Report
Members of the Company
Ho Bee Land Limited
Report on the financial statements
We have audited the accompanying financial statements of Ho Bee Land Limited (the Company) and its subsidiaries (the
Group), which comprise the statements of financial position of the Group and the Company as at 31 December 2014, the
income statement and statement of comprehensive income, statement of changes in equity and statement of cash flows of
the Group for the year then ended, and a summary of significant accounting policies and other explanatory information, as
set out on pages 62 to 138.
Management’s responsibility for the financial statements
Management is responsible for the preparation of financial statements that give a true and fair view in accordance with the
provisions of the Singapore Companies Act, Chapter 50 (the Act) and Singapore Financial Reporting Standards, and for
devising and maintaining a system of internal accounting controls sufficient to provide a reasonable assurance that assets are
safeguarded against loss from unauthorised use or disposition; and transactions are properly authorised and that they are
recorded as necessary to permit the preparation of true and fair profit and loss accounts and balance sheets and to maintain
accountability of assets.
Auditors’ responsibility
Our responsibility is to express an opinion on these financial statements based on our audit. We conducted our audit in accordance
with Singapore Standards on Auditing. Those standards require that we comply with ethical requirements and plan and perform
the audit to obtain reasonable assurance about whether the financial statements are free from material misstatement.
An audit involves performing procedures to obtain audit evidence about the amounts and disclosures in the financial
statements. The procedures selected depend on the auditor’s judgement, including the assessment of the risks of material
misstatement of the financial statements, whether due to fraud or error. In making those risk assessments, the auditor
considers internal control relevant to the entity’s preparation of financial statements that give a true and fair view in order
to design audit procedures that are appropriate in the circumstances, but not for the purpose of expressing an opinion on
the effectiveness of the entity’s internal control. An audit also includes evaluating the appropriateness of accounting policies
used and the reasonableness of accounting estimates made by management, as well as evaluating the overall presentation
of the financial statements.
We believe that the audit evidence we have obtained is sufficient and appropriate to provide a basis for our audit opinion.
61
Independent Auditors’ Report
Opinion
In our opinion, the consolidated financial statements of the Group and the statement of financial position of the Company
are properly drawn up in accordance with the provisions of the Act and Singapore Financial Reporting Standards to give a
true and fair view of the state of affairs of the Group and of the Company as at 31 December 2014 and the results, changes
in equity and cash flows of the Group for the year ended on that date.
Report on other legal and regulatory requirements
In our opinion, the accounting and other records required by the Act to be kept by the Company and by those subsidiaries
incorporated in Singapore of which we are the auditors have been properly kept in accordance with the provisions of the Act.
KPMG LLP
Public Accountants and
Chartered Accountants
Singapore
16 March 2015
Ho Bee Land
62
Annual Report 2014
Statements of Financial Position
As at 31 December 2014
Note
Company
2013
$’000
2014
$’000
21,667
2,283,127
–
456,330
346,095
150
4,051
270,374
473
3,382,267
21,054
1,540,709
–
444,842
202,554
150
4,518
400,788
473
2,615,088
2,195
–
114,712
437,055
311,889
–
–
505,269
–
1,371,120
2,430
–
70,639
437,055
225,500
–
–
412,832
–
1,148,456
–
229,546
62,662
–
9,953
–
302,161
21
207,940
51,878
–
117,557
–
377,396
–
–
26,488
–
337
–
26,825
–
–
37,500
–
85,683
–
123,183
3,684,428
2,992,484
1,397,945
1,271,639
17
18
156,048
2,445,069
2,601,117
14,691
2,615,808
156,048
2,174,727
2,330,775
16,976
2,347,751
156,048
997,721
1,153,769
–
1,153,769
156,048
974,619
1,130,667
–
1,130,667
19
20
12
21
751,516
15,213
287
8,175
775,191
98,831
15,213
1,515
819
116,378
–
–
–
–
–
–
–
–
–
–
22
19
21
Total liabilities
81,990
163,644
13,250
34,545
293,429
1,068,620
110,353
370,703
3,876
43,423
528,355
644,733
90,447
153,729
–
–
244,176
244,176
45,955
94,903
–
114
140,972
140,972
Total equity and liabilities
3,684,428
2,992,484
1,397,945
1,271,639
Non-current assets
Property, plant and equipment
Investment properties
Subsidiaries
Associates
Jointly-controlled entities
Other assets
Financial assets
Other receivables
Deferred tax assets
4
5
6
7
8
9
10
11
12
Current assets
Inventories
Development properties
Trade and other receivables
Financial assets
Cash and cash equivalents
Assets held for sale
13
14
10
15
16
Total assets
Equity attributable to equity holders
of the Company
Share capital
Reserves
Non-controlling interests
Total equity
Non-current liabilities
Loans and borrowings
Other liabilities
Deferred tax liabilities
Deferred income
Current liabilities
Trade and other payables
Loans and borrowings
Deferred income
Current tax payable
2014
$’000
Group
2013
$’000
63
Consolidated Income Statement
Year ended 31 December 2014
Note
Revenue
23
Other income
24
Total income
Fair value gain on investment properties
5
Write back of accrual upon finalisation of construction cost for
development projects
Cost of sale of development properties including marketing expenses
Direct rental expenses
Loss on foreign exchange
Staff cost & directors’ remuneration
2014
$’000
99,601
2013
$’000
Restated
139,344
1,876
76,635
101,477
215,979
281,693
493,084
11,511
–
(4,105)
(84,907)
(20,471)
(8,298)
(1,967)
(369)
(5,896)
(7,464)
Other operating expenses
(16,217)
(11,719)
Profit from operating activities
346,025
596,306
(18,014)
(1,177)
-associates
(1,614)
(1,239)
- jointly-controlled entities
(4,323)
13,355
322,074
607,245
(7,371)
(4,263)
314,703
602,982
Net finance costs
26
Share of (losses)/profits, net of tax, of:
Profit before income tax
Income tax expense
27
Profit from continuing operations
Discontinued operation
(Loss)/Profit from discontinued operation (net of tax)
28
(187)
3,234
Profit for the year
29
314,516
606,216
Owners of the Company
314,991
591,775
Non-controlling interests
(475)
14,441
314,516
606,216
Profit attributable to:
Profit for the year
Earnings per share
Basic earnings per share (cents)
30
47.16
87.42
Diluted earnings per share (cents)
30
47.16
87.42
64
Ho Bee Land
Annual Report 2014
Consolidated Statement of Comprehensive Income
Year ended 31 December 2014
2014
Profit for the year
2013
$’000
$’000
314,516
606,216
Other comprehensive income
Items that are or may be reclassified subsequently to profit or loss:
Effective portion of changes in fair value of cash flow hedges
Foreign currency translation differences relating to foreign operations
Share of foreign currency translation differences of equity-accounted investee
Net loss on hedge of net investment in foreign operations
351
–
1,962
3,453
13,102
27,468
–
(1,700)
15,415
29,221
15,415
29,221
329,931
635,437
Owners of the Company
329,766
620,773
Non-controlling interests
165
14,664
329,931
635,437
Other comprehensive income for the year, net of income tax
Total comprehensive income for the year
Attributable to:
Total comprehensive income for the year
65
Consolidated Statement of Changes in Equity
Year ended 31 December 2014
Group
At 1 January 2013
Total comprehensive
income for the year
Profit for the year
Other comprehensive
income
Foreign currency translation
differences relating to
foreign operations
Share of foreign currency
translation differences of
equity-accounted investee
Net loss on hedge of net
investment in foreign
operations
Reversal of revaluation of
property, plant and
equipment
Total other comprehensive
income
Total comprehensive income
for the year
Reserve
Share for own
capital shares
$’000
$’000
Noncontrolling
Total
interests
$’000
$’000
(60,500)
2,230
–
94,676
–
–
–
–
–
–
591,775
591,775
14,441
606,216
–
–
–
–
–
3,230
–
3,230
223
3,453
–
–
–
–
–
27,468
–
27,468
–
27,468
–
–
–
–
–
(1,700)
–
(1,700)
–
(1,700)
–
–
–
–
(94,676)
–
94,676
–
–
–
–
–
–
–
(94,676)
28,998
94,676
28,998
223
29,221
–
–
–
–
(94,676)
28,998
686,451
620,773
14,664
635,437
–
–
–
–
–
–
(17,200)
(17,200)
–
–
–
–
(33,838)
(33,838)
–
(33,838)
–
–
–
–
–
–
–
–
–
–
–
(42,850)
–
–
–
(42,850)
–
–
–
–
(33,838)
(76,688)
(17,200)
(93,888)
2,230
–
–
156,048
(54,265)
(21,063) 1,566,214 1,786,690
Total
equity
$’000
205,133
Transactions with owners of
the Company, recognised
directly in equity
Contributions by and
distributions to owners
of the Company
Dividend paid to noncontrolling shareholders
–
–
Final tax exempt dividend
paid of 5 cents per share
in respect of 2012
–
–
Cancellation of treasury
shares
(49,085) 49,085
Purchase of treasury shares
– (42,850)
Total contributions by and
distributions to owners of
the Company
(49,085)
6,235
At 31 December 2013
Attributable to owners of the Company
Foreign
currency
Capital Hedging Revaluation translation Retained
reserve reserve
reserve
reserve earnings
$’000
$’000
$’000
$’000
$’000
7,935 2,218,827 2,330,775
19,512 1,806,202
16,976 2,347,751
Ho Bee Land
66
Annual Report 2014
Consolidated Statement of Changes in Equity (cont’d)
Year ended 31 December 2014
Attributable to owners of the Company
Foreign
Reserve
currency
Share for own Capital Hedging Revaluation translation Retained
capital shares reserve reserve
reserve
reserve earnings
Group
At 1 January 2014
Total comprehensive
income for the year
Profit for the year
Other comprehensive
income
Foreign currency translation
differences relating to
foreign operations
Share of foreign currency
translation differences of
equity-accounted investee
Effective portion of changes
in fair value of cash flow
hedges
Total other comprehensive
income
Total comprehensive income
for the year
Transactions with owners of
the Company, recognised
directly in equity
Contributions by and
distributions to owners
of the Company
Transfer capital reserve to
retained earnings
Dividend paid to noncontrolling shareholders
Final tax exempt dividend
paid of 8 cents per share in
respect of 2013
Purchase of treasury shares
Total contributions by and
distributions to owners of
the Company
At 31 December 2014
$’000
$’000
Noncontrolling
Total
interests
$’000
$’000
$’000
$’000
$’000
$’000
156,048
(54,265)
2,230
–
–
–
–
–
–
–
–
314,991
314,991
–
–
–
–
–
1,322
–
1,322
640
1,962
–
–
–
–
–
13,102
–
13,102
–
13,102
–
–
–
351
–
–
–
351
–
351
–
–
–
351
–
14,424
–
14,775
640
15,415
–
–
–
351
–
14,424
314,991
329,766
165
329,931
–
–
(187)
–
–
–
187
–
–
–
–
–
–
–
–
–
–
–
(2,450)
(2,450)
–
–
–
(6,019)
–
–
–
–
–
–
–
–
(53,405)
–
(53,405)
(6,019)
–
–
(53,405)
(6,019)
–
(6,019)
(187)
–
–
–
(53,218)
(59,424)
(2,450)
(61,874)
156,048
(60,284)
2,043
351
–
7,935 2,218,827 2,330,775
22,359 2,480,600 2,601,117
$’000
Total
equity
$’000
16,976 2,347,751
(475) 314,516
14,691 2,615,808
67
Consolidated Statement of Cash Flows
Year ended 31 December 2014
2014
2013
$’000
$’000
314,516
606,216
964
866
2
–
Unrealised exchange loss/ (gain)
3,038
(5,014)
Interest income
(1,423)
(4,674)
(43)
(38)
Cash flows from operating activities
Profit for the year
Adjustments for:
Depreciation of property, plant and equipment
Loss on disposal of property, plant and equipment
Dividend income
Distribution income from financial assets designated at fair value through profit or loss
Finance costs
Fair value gain of investment properties
Net changes in fair value of financial assets at fair value through profit or loss
(118)
(247)
14,591
5,274
(281,693)
(493,084)
272
(1,137)
Gain on disposal of freehold land and hotel building
–
(25,927)
Gain on sale of investee company
–
(47,194)
Gain on sale of quoted equity
–
(7)
-associates
1,614
1,239
- jointly-controlled entities
4,323
(13,355)
Income tax expense
7,371
4,925
63,414
27,843
(30,591)
69,036
21
23
Trade and other receivables
(9,511)
(25,025)
Trade and other payables
(8,622)
15,223
Cash generated from operations
14,711
87,100
Income taxes paid
(17,426)
(18,480)
(2,715)
68,620
Share of losses/(profits) of:
Changes in working capital:
Development properties
Inventories
Net cash (used in)/ generated from operating activities carried forward
68
Ho Bee Land
Annual Report 2014
Consolidated Statement of Cash Flows (cont’d)
Year ended 31 December 2014
Note
2014
2013
$’000
$’000
(2,715)
68,620
Net repayments from jointly-controlled entities
(4,083)
(13,785)
Purchase of property, plant and equipment
Net cash (used in)/ generated from operating activities brought forward
Cash flows from investing activities
(1,654)
(5,737)
Proceeds from disposal of freehold land and hotel building (net of transaction
costs)
–
161,836
Proceeds from sale of investee company
–
79,147
Proceeds from sale of quoted equity
–
114
Proceeds from sale of property, plant and equipment
–
271
Additional costs incurred on investment properties
–
(133,086)
Investment in associate
Interest received
Dividend received
Purchase of financial assets designated at fair value through profit or loss
Purchase of investment properties (net of transaction costs)
Advances to jointly controlled operations
Distributions from financial assets designated at fair value through profit or loss
Net cash used in investing activities
–
(5,321)
125
741
43
37,400
(45)
(97)
(468,908)
(138,707)
(12,091)
–
552
609
(486,061)
(16,615)
–
(5,384)
Cash flows from financing activities
Amount due to a non-controlling shareholder (non-trade)
Amount due to jointly-controlled entities (non-trade)
–
6,700
Proceeds from bank loans
773,613
198,638
Repayment of bank loans
(315,991)
(191,288)
(14,591)
(11,626)
(6,019)
(42,850)
(53,405)
(33,838)
Interest paid
Purchase of treasury shares
Dividends paid
Dividend paid to non-controlling shareholders
(2,450)
(17,200)
Net cash from/(used in) financing activities
381,157
(96,848)
Net decrease in cash and cash equivalents
(107,619)
(44,843)
Cash and cash equivalents at 1 January
117,557
162,508
15
(108)
9,953
117,557
Effect of exchange rate fluctuations on cash held
Cash and cash equivalents at 31 December
15
69
Notes to the Financial Statements
Year ended 31 December 2014
These notes form an integral part of the financial statements.
The financial statements were authorised for issue by the Board of Directors on 16 March 2015.
1
Domicile and activities
Ho Bee Land Limited (the Company) is incorporated in the Republic of Singapore. The address of the Company’s
registered office is 9 North Buona Vista Drive, #11-01 The Metropolis Tower 1, Singapore 138588.
The financial statements of the Company as at and for the year ended 31 December 2014 comprise the Company and
its subsidiaries (together referred to as the “Group” and individually as “Group entities”) and the Group’s interests in
associates and jointly-controlled entities.
The Group is primarily involved in property development, property investment and investment holding. The immediate and
ultimate holding company during the financial year is Ho Bee Holdings (Pte) Ltd, incorporated in the Republic of Singapore.
2
Basis of preparation
2.1 Statement of compliance
The financial statements have been prepared in accordance with the Singapore Financial Reporting Standards (FRS).
Change in presentation format of Consolidated Income Statement
The Group has reviewed the presentation format of its consolidated Income Statement, which was presented by function
in the audited financial statements for the year ended 31 December 2013. The Group took the decision to present its
consolidated Income Statement by nature for the year ended 31 December 2014 as this presentation provides more relevant
information to the users of the financial statements. The comparatives have been re-presented under this new format.
The following table summarises the impact to the Group’s consolidated Income Statement for the year ended 31
December 2013, as a result of the change in presentation format:
2013
As previously
stated
$
2013
As restated
$
Cost of sales of development properties
Direct rental expenses
Staff cost and directors’ remuneration
Loss on foreign exchange
Other operating expenses
Finance costs
84,907
8,298
93,205
7,464
369
11,719
208
19,760
Cost of sales
93,205
Other expenses
Administrative expenses
3,163
16,597
19,760
Ho Bee Land
70
Annual Report 2014
Notes to the Financial Statements
Year ended 31 December 2014
2
Basis of preparation (cont’d)
2.2 Basis of measurement
The financial statements have been prepared on the historical cost basis except as otherwise described below.
2.3 Functional and presentation currency
The financial statements are presented in Singapore dollars, which is the Company’s functional currency. All financial
information presented in Singapore dollars has been rounded to the nearest thousand, unless otherwise stated.
2.4 Use of estimates and judgements
The preparation of financial statements in conformity with FRS requires management to make judgements, estimates
and assumptions that affect the application of accounting policies and the reported amounts of assets, liabilities,
income and expenses. Actual results may differ from these estimates.
Estimates and underlying assumptions are reviewed on an ongoing basis. Revisions to accounting estimates are
recognised in the period in which the estimates are revised and in any future periods affected.
Information about critical judgements in applying accounting policies and assumptions and estimation uncertainties
that have the most significant effect on the amounts recognised in the financial statements or have a significant risk of
resulting in a material adjustment within the next financial year are included in the following notes:
•
•
Note 35 – valuation of financial instruments
Note 38 – accounting estimates and judgements
Measurement of fair values
A number of the Group’s accounting policies and disclosures require the measurement of fair values, for both financial
and non-financial assets and liabilities.
The Group has an established control framework with respect to the measurement of fair values. This framework
includes a finance team that reports directly to the Chief Financial Officer, and has overall responsibility for all significant
fair value measurements, including level 3 fair values.
The finance team regularly reviews significant unobservable inputs and valuation adjustments. Significant valuation
issues are reported to the Group Audit Committee.
When measuring the fair value of an asset or liability, the Group uses market observable data as far as possible. Fair
values are categorised into different levels in a fair value hierarchy based on the inputs used in the valuation techniques
as follows:
•
•
•
Level 1: quoted prices (unadjusted) in active markets for identical assets or liabilities;
Level 2: inputs other than quoted prices included within Level 1 that are observable for the asset or liability,
either directly (i.e., as prices) or indirectly (i.e., derived from prices);
Level 3: inputs for the asset or liability that are not based on observable market data (unobservable inputs).
71
Notes to the Financial Statements
Year ended 31 December 2014
2
Basis of preparation (cont’d)
2.4 Use of estimates and judgements (cont’d)
Measurement of fair values (cont’d)
If the inputs used to measure the fair value of an asset or liability might be categorised in different levels of the fair value
hierarchy, then the fair value measurement is categorised in its entirety in the same level of the fair value hierarchy as the
lowest level input that is significant to the entire measurement (with Level 3 being the lowest).
The Group recognises transfers between levels of the fair value hierarchy as of the end of the reporting period during
which the change has occurred.
Further information about the assumptions made in measuring fair values are included in the following notes:
•
•
Note 35 – valuation of financial instruments
Note 37 – determination of fair values
2.5 Changes in accounting policy
(i)
Subsidiaries
As a result of FRS 110 Consolidated Financial Statements, the Group has changed its accounting policy for determining
whether it has control over and consequently whether it consolidates its investees. FRS 110 introduces a new control
model that focuses on whether the Group has power over an investee, exposure or rights to variable returns from its
involvement with the investee and ability to use its power to affect those returns.
In accordance with the transitional provisions of FRS 110, the Group reassessed the control conclusion for its investees
at 1 January 2014. The adoption of FRS110 has no impact on the recognised assets, liabilities and comprehensive
income of the Group.
(ii)
Joint Arrangements
From 1 January 2014, as a result of FRS 111 Joint Arrangements, the Group has changed its accounting policy for its interests
in joint arrangements. Under FRS 111, the Group has classified its interests in joint arrangements as either joint operations
(if the Group has rights to the assets, and obligations for the liabilities, relating to an arrangement) or joint ventures (if
the Group has rights only to the net assets of an arrangement). When making this assessment, the Group considered the
structure of the arrangements, the legal form of any separate vehicles, the contractual terms of the arrangements and other
facts and circumstances. Previously, the structure of the arrangement was the sole focus of classification.
The Group has re-evaluated its involvement in its joint arrangement. The adoption of FRS 111 has no impact on the
recognised assets, liabilities and comprehensive income of the Group.
Ho Bee Land
72
Annual Report 2014
Notes to the Financial Statements
Year ended 31 December 2014
3
Significant accounting policies
The accounting policies set out below have been applied consistently to all periods presented in these financial
statements, and have been applied consistently by Group entities, except as explained in note 2.5, which addresses
change in accounting policy.
3.1 Basis of consolidation
Business combinations
Business combinations are accounted for using the acquisition method as at the acquisition date, which is the date
on which control is transferred to the Group. Control is the power to govern the financial and operating policies of
an entity so as to obtain benefits from its activities. In assessing control, the Group takes into consideration potential
voting rights that are currently exercisable.
The consideration transferred does not include amounts related to the settlement of pre-existing relationships. Such
amounts are generally recognised in profit or loss.
Any contingent consideration payable is recognised at fair value at the acquisition date. If the contingent consideration
is classified as equity, it is not remeasured and settlement is accounted for within equity. Otherwise, subsequent
changes to the fair value of the contingent consideration are recognised in profit or loss.
When share-based payment awards (replacement awards) are required to be exchanged for awards held by the
acquiree’s employees (acquiree’s awards) and relate to past services, then all or a portion of the amount of the
acquirer’s replacement awards is included in measuring the consideration transferred in the business combination.
This determination is based on the market-based value of the replacement awards compared with the market-based
value of the acquiree’s awards and the extent to which the replacement awards relate to past and/or future service.
For non-controlling interests that are present ownership interests and entitle their holders to a proportionate share of
the acquiree’s net assets in the event of liquidation, the Group elects on a transaction-by-transaction basis whether
to measure them at fair value, or at the non-controlling interests’ proportionate share of the recognised amounts
of the acquiree’s identifiable net assets, at the acquisition date. All other non-controlling interests are measured at
acquisition-date fair value or, when applicable, on the basis specified in another standard.
Costs related to the acquisition, other than those associated with the issue of debt or equity securities, that the Group
incurs in connection with a business combination are expensed as incurred.
Subsidiaries
Subsidiaries are entities controlled by the Group. The Group controls an entity when it is exposed to, or has rights to,
variable returns from its involvement with the entity and has the ability to affect those returns through its power over
the entity. The financial statements of subsidiaries are included in the consolidated financial statements from the date
that control commences until the date that control ceases.
The accounting policies of subsidiaries have been changed when necessary to align them with the policies adopted by
the Group. Losses applicable to the non-controlling interest (NCI) in a subsidiary are allocated to the NCI even if doing
so causes the NCI to have a deficit balance.
73
Notes to the Financial Statements
Year ended 31 December 2014
3
Significant accounting policies (cont’d)
3.1 Basis of consolidation (cont’d)
Loss of control
Upon the loss of control, the Group derecognises the assets and liabilities of the subsidiary, any non-controlling
interests and the other components of equity related to the subsidiary. Any surplus or deficit arising on the loss of
control is recognised in profit or loss. If the Group retains any interest in the previous subsidiary, then such interest is
measured at fair value at the date that control is lost. Subsequently, it is accounted for as an equity-accounted investee
or as an available-for-sale financial asset depending on the level of influence retained.
Investments in associates and joint ventures (equity-accounted investees)
Associates are those entities in which the Group has significant influence, but not control or joint control, over the financial
and operating policies of these entities. Significant influence is presumed to exist when the Group holds 20% or more of the
voting power of another entity. A joint venture is an arrangement in which the Group has joint control, whereby the Group
has rights to the net assets of the arrangement, rather than rights to its assets and obligations for its liabilities.
Investments in associates and joint ventures are accounted for using the equity method. They are recognised initially at
cost, which includes transaction costs. Subsequent to initial recognition, the consolidated financial statements include
the Group’s share of the profit or loss and OCI of equity-accounted investees, after adjustments to align the accounting
policies with those of the Group, from the date that significant influence or joint control commences until the date that
significant influence or joint control ceases.
When the Group’s share of losses exceeds its interest in an equity-accounted investee, the carrying amount of the
investment, together with any long-term interests that form part thereof, is reduced to zero, and the recognition of
further losses is discontinued except to the extent that the Group has an obligation to fund the investee’s operations
or has made payments on behalf of the investee.
Joint operations
A joint operation is an arrangement in which the Group has joint control whereby the Group has rights to the assets,
and obligations for the liabilities, relating to an arrangement. The Group accounts for each of its assets, liabilities and
transactions, including its share of those held or incurred jointly, in relation to the joint operation.
Transactions eliminated on consolidation
Intra-group balances and transactions, and any unrealised income or expenses arising from intra-group transactions,
are eliminated in preparing the consolidated financial statements. Unrealised gains arising from transactions with
associates and jointly-controlled entities are eliminated against the investment to the extent of the Group’s interest in
the investee. Unrealised losses are eliminated in the same way as unrealised gains, but only to the extent that there is
no evidence of impairment.
Accounting for subsidiaries, associates, jointly-controlled entities by the Company
Investments in subsidiaries, associates and joint ventures are stated in the Company’s statement of financial position at
cost less accumulated impairment losses.
Ho Bee Land
74
Annual Report 2014
Notes to the Financial Statements
Year ended 31 December 2014
3
Significant accounting policies (cont’d)
3.2 Foreign currency
Foreign currency transactions
Transactions in foreign currencies are translated to the respective functional currencies of Group entities at the exchange
rate at the date of the transaction. Monetary assets and liabilities denominated in foreign currencies at the end of the
reporting date are translated to the functional currency at the exchange rate at that date. The foreign currency gain or
loss on monetary items is the difference between amortised cost in the functional currency at the beginning of the year,
adjusted for effective interest and payments during the year, and the amortised cost in foreign currency translated at
the exchange rate at the end of the year.
Non-monetary assets and liabilities denominated in foreign currencies that are measured at fair value are translated to the
functional currency at the exchange rate at the date that the fair value was determined. Non-monetary items in a foreign
currency that are measured in terms of historical cost are translated using the exchange rate at the date of the transaction.
Foreign currency differences arising on retranslation are recognised in profit or loss, except for the following differences
which are recognised in other comprehensive income arising on the retranslation of:
•
•
•
available-for-sale equity instruments (except on impairment in which case foreign currency differences that have
been recognised in other comprehensive income are reclassified to profit or loss);
a financial liability designated as a hedge of the net investment in a foreign operation to the extent that the
hedge is effective; or
qualifying cash flow hedges to the extent the hedge is effective.
Foreign operations
The assets and liabilities of foreign operations, excluding goodwill and fair value adjustments arising on acquisition,
are translated to Singapore dollars at exchange rates at the end of the reporting period. The income and expenses of
foreign operations are translated to Singapore dollars at exchange rates at the dates of the transactions. Goodwill and
fair value adjustments arising on the acquisition of a foreign operation on or after 1 January 2005 are treated as assets
and liabilities of the foreign operation and are translated at the exchange rates at the end of the reporting period. For
acquisitions prior to 1 January 2005, the exchange rates at the date of acquisition were used.
Foreign currency differences are recognised in other comprehensive income, and presented in the foreign currency
translation reserve (translation reserve) in equity. However, if the foreign operation is a non-wholly-owned subsidiary,
then the relevant proportionate share of the translation difference is allocated to the non-controlling interests. When a
foreign operation is disposed of such that control, significant influence or joint control is lost, the cumulative amount in the
translation reserve related to that foreign operation is reclassified to profit or loss as part of the gain or loss on disposal.
When the Group disposes of only part of its interest in a subsidiary that includes a foreign operation while retaining control,
the relevant proportion of the cumulative amount is reattributed to non-controlling interests. When the Group disposes
of only part of its investment in an associate or jointly-controlled entity that includes a foreign operation while retaining
significant influence or joint control, the relevant proportion of the cumulative amount is reclassified to profit or loss.
When the settlement of a monetary item receivable from or payable to a foreign operation is neither planned nor
likely in the foreseeable future, foreign exchange gains and losses arising from such a monetary item are considered
to form part of a net investment in a foreign operation. These are recognised in other comprehensive income, and are
presented in the translation reserve in equity.
75
Notes to the Financial Statements
Year ended 31 December 2014
3
Significant accounting policies (cont’d)
3.2 Foreign currency (cont’d)
Hedge of a net investment in foreign operation
The Group applies hedge accounting to foreign currency differences arising between the functional currency of the
foreign operation and the Company’s functional currency (Singapore dollars), regardless of whether the net investment
is held directly or through an intermediate parent.
Foreign currency differences arising on the retranslation of a financial liability designated as a hedge of a net investment
in a foreign operation are recognised in other comprehensive income to the extent that the hedge is effective, and
are presented within equity in the foreign currency translation reserve. To the extent that the hedge is ineffective, such
differences are recognised in profit or loss. When the hedged net investment is disposed of, the relevant amount in the
foreign currency translation reserve is transferred to profit or loss as part of the gain or loss on disposal.
3.3 Financial instruments
Non-derivative financial assets
The Group initially recognises loans and receivables and deposits on the date that they are originated. All other
financial assets (including assets designated at fair value through profit or loss) are recognised initially on the trade
date, which is the date that the Group becomes a party to the contractual provisions of the instrument.
The Group derecognises a financial asset when the contractual rights to the cash flows from the asset expire, or it
transfers the rights to receive the contractual cash flows on the financial asset in a transaction in which substantially all
the risks and rewards of ownership of the financial asset are transferred. Any interest in transferred financial assets that
is created or retained by the Group is recognised as a separate asset or liability.
Financial assets and liabilities are offset and the net amount presented in the statement of financial position when, and
only when, the Group has an unconditional and legally enforeceable right to offset the amounts and intends either to
settle on a net basis or to realise the asset and settle the liability simultaneously
The Group classifies non-derivative financial assets into the following categories: financial assets at fair value through
profit or loss, loans and receivables and available-for-sale financial assets.
Financial assets at fair value through profit or loss
An instrument is classified at fair value through profit or loss if it is acquired principally for the purpose of selling in the
short term or is designated as such upon initial recognition. Financial instruments are designated as fair value through
profit or loss if the Group manages such investments and makes purchase and sale decisions based on their fair value
in accordance with the Group’s documented risk management and investment strategies. Upon initial recognition,
attributable transaction costs are recognised in profit or loss when incurred. Financial instruments at fair value through
profit or loss are measured at fair value, and changes therein are recognised in profit or loss.
Ho Bee Land
76
Annual Report 2014
Notes to the Financial Statements
Year ended 31 December 2014
3
Significant accounting policies (cont’d)
3.3 Financial instruments (cont’d)
Available-for-sale financial assets
The Group’s investments in certain equity securities and debt securities are classified as available-for-sale financial
assets. Subsequent to initial recognition, they are measured at fair value and changes therein, other than for impairment
losses, and foreign exchange gains and losses on available-for-sale monetary items (see note 3.2), are recognised in
other comprehensive income and presented within equity in the fair value reserve. When an investment is derecognised,
the cumulative gain or loss in other comprehensive income is transferred to profit or loss.
Equity instruments that do not have a quoted market price in an active market and in respect of which the range of
fair value estimates is significant, are measured at cost less accumulated impairment losses if the probabilities of the
various estimates cannot be reasonably assessed.
Loans and receivables
Loans and receivables are financial assets with fixed or determinable payments that are not quoted in an active market.
Such assets are recognised initially at fair value plus any directly attributable transaction costs. Subsequent to initial
recognition, loans and receivables are measured at amortised cost using the effective interest method, less any
impairment losses.
Loans and receivables comprise cash and cash equivalents, and trade and other receivables.
Non-derivative financial liabilities
The Group initially recognises financial liabilities (including liabilities designated at fair value through profit or loss) initially
on the trade date, which is the date that the Group becomes a party to the contractual provisions of the instrument.
The Group derecognises a financial liability when its contractual obligations are discharged, cancelled or when they expire.
Non-derivative financial liabilities are recognised initially at fair value plus any directly attributable transaction costs. Subsequent
to initial recognition, these financial liabilities are measured at amortised cost using the effective interest method.
Other financial liabilities comprise loans and borrowings, trade and other payables and other liabilities.
Financial assets and liabilities are offset and the net amount presented in the statement of financial position when, and
only when, the Group has an unconditional and legally enforeceable right to offset the amounts and intends either to
settle on a net basis or to realise the asset and settle the liability simultaneously.
Impairment of financial assets
A financial asset is impaired if objective evidence indicates that a loss event has occurred after the initial recognition
of the asset, and that the loss event has a negative effect on the estimated future cash flows of that asset that can be
estimated reliably.
77
Notes to the Financial Statements
Year ended 31 December 2014
3
Significant accounting policies (cont’d)
3.3 Financial instruments (cont’d)
Impairment of financial assets (cont’d)
Objective evidence that financial assets (including equity securities) are impaired can include default or delinquency
by a debtor, restructuring of an amount due to the Group on terms that the Group would not consider otherwise,
indications that a debtor or issuer will enter bankruptcy, adverse changes in the payment status of borrowers or issuers
in the Group, economic conditions that correlate with defaults or the disappearance of an active market for a security.
In addition, for an investment in an equity security, a significant or prolonged decline in its fair value below its cost is
objective evidence of impairment.
An impairment loss in respect of a financial asset measured at amortised cost is calculated as the difference between
its carrying amount and the present value of the estimated future cash flows discounted at the asset’s original effective
interest rate. An impairment loss in respect of an available-for-sale financial asset is calculated by reference to its
current fair value.
Individually significant financial assets are tested for impairment on an individual basis. The remaining financial assets
are assessed collectively in groups that share similar credit risk characteristics.
All impairment losses are recognised in the profit or loss. Any cumulative loss in respect of an available-for-sale financial
asset recognised previously in equity is transferred to profit or loss.
Impairment losses in respect of financial assets measured at amortised cost are reversed if the subsequent increase in
fair value can be related objectively to an event occurring after the impairment loss was recognised.
Impairment losses once recognised in profit or loss in respect of available-for-sale equity securities are not reversed
through profit or loss. Any subsequent increase in fair value of such assets is recognised directly in equity.
Intra-group financial guarantees
Financial guarantees are financial instruments issued by the Group that require the issuer to make specified payments
to reimburse the holder for the loss it incurs because a specified debtor fails to meet payment when due in accordance
with the original or modified terms of a debt instrument.
Financial guarantee contracts are accounted for as insurance contracts. A provision is recognised based on the
Company’s estimate of the ultimate cost of settling all claims incurred but unpaid at the balance sheet date. The
provision is assessed by reviewing individual claims and tested for adequacy by comparing the amount recognised and
the amount that would be required to settle the guarantee contract.
Share capital
Ordinary shares are classified as equity.
Costs directly attributable to the issue of ordinary shares are recognised as a deduction from equity, net of any tax effects.
Ho Bee Land
78
Annual Report 2014
Notes to the Financial Statements
Year ended 31 December 2014
3
Significant accounting policies (cont’d)
3.3 Financial instruments (cont’d)
Share capital (cont’d)
Where share capital recognised as equity is repurchased (treasury shares), the amount of the consideration paid,
including directly attributable costs, net of any tax effects, is recognised as a deduction from equity. Repurchased
shares are classified as treasury shares and are presented in the reserve for own share account. Where such shares
are subsequently reissued, sold or cancelled, the consideration received is recognised as a change in equity and the
resulting surplus or deficit on the transaction is presented in non-distributable capital reserve.
Derivative financial instruments, including hedge accounting
The Group holds derivative financial instruments to hedge its foreign currency and interest rate risk exposures. Embedded
derivatives are separated from the host contract and accounted for separately if the economic characteristics and risks
of the host contract and the embedded derivative are not closely related, a separate instrument with the same terms
as the embedded derivative would meet the definition of a derivative, and the combined instrument is not measured
at fair value through profit or loss.
On initial designation of the derivative as the hedging instrument, the Group formally documents the relationship
between the hedging instrument and the hedged item, including the risk management objectives and strategy in
undertaking the hedge transaction and the hedged risk, together with the methods that will be used to assess the
effectiveness of the hedging relationship. The Group makes an assessment, both at the inception of the hedge
relationship as well as on an ongoing basis, of whether the hedging instruments are expected to be ‘highly effective’
in offsetting the changes in the fair value or cash flows of the respective hedged items attributable to the hedged
risk, and whether the actual results of each hedge are within a range of 80 - 125%. For a cash flow hedge of a forecast
transaction, the transaction should be highly probable to occur and should present an exposure to variations in cash
flows that could ultimately affect reported profit or loss.
Derivatives are recognised initially at fair value; any attributable transaction costs are recognised in profit or loss as
incurred. Subsequent to initial recognition, derivatives are measured at fair value, and changes therein are accounted
for as described below.
Cash flow hedges
When a derivative is designated as the hedging instrument in a hedge of the variability in cash flows attributable to a
particular risk associated with a recognised asset or liability or a highly probable forecast transaction that could affect
profit or loss, the effective portion of changes in the fair value of the derivative is recognised in OCI and presented
in the hedging reserve in equity. Any ineffective portion of changes in the fair value of the derivative is recognised
immediately in profit or loss.
When the hedged item is a non-financial asset, the amount accumulated in equity is retained in OCI and reclassified
to profit or loss in the same period or periods during which the non-financial item affects profit or loss. In other cases
as well, the amount accumulated in equity is reclassified to profit or loss in the same period that the hedged item
affects profit or loss. If the hedging instrument no longer meets the criteria for hedge accounting, expires or is sold,
terminated or exercised, or the designation is revoked, then hedge accounting is discontinued prospectively. If the
forecast transaction is no longer expected to occur, then the balance in equity is reclassified to profit or loss.
79
Notes to the Financial Statements
Year ended 31 December 2014
3
Significant accounting policies (cont’d)
3.4 Property, plant and equipment
Property, plant and equipment are stated at cost less accumulated depreciation and impairment losses except for
hotel land and buildings, which are stated at their revalued amounts. The revalued amount is the fair value at the
date of revaluation less any subsequent accumulated depreciation and subsequent accumulated impairment losses.
Revaluations are carried out by independent professional valuers regularly such that the carrying amount of these
assets does not differ materially from that which would be determined using fair values at the balance sheet date.
Any increase in the revaluation amount is credited to the revaluation reserve unless it offsets a previous decrease in
value of the same asset that was recognised in profit or loss. A decrease in value is recognised in profit or loss where it
exceeds the increase previously recognised in the revaluation reserve. Upon disposal, any related revaluation reserve
is transferred from the revaluation reserve to accumulated profits and is not taken into account in arriving at the gain or
loss on disposal.
Cost includes expenditure that is directly attributable to the acquisition of the asset. The cost of self-constructed assets
includes the cost of materials and direct labour, and any other costs directly attributable to bringing the asset to a
working condition for its intended use, and the cost of dismantling and removing the items and restoring the site on
which they are located and capitalised borrowing costs. When parts of an item of property, plant and equipment have
different useful lives, they are accounted for as separate items (major components) of property, plant and equipment.
The gain or loss on disposal of an item of property, plant and equipment is determined by comparing the proceeds
from disposal with the carrying amount of property, plant and equipment, and is recognised net within other income/
other expense in profit or loss.
The cost of replacing part of an item of property, plant and equipment is recognised in the carrying amount of the item
if it is probable that the future economic benefits embodied within the part will flow to the Group and its cost can be
measured reliably. The costs of the day-to-day servicing of property, plant and equipment are recognised in profit or
loss as incurred.
Paintings and sculptures, and property under construction are not depreciated. Depreciation on other property, plant
and equipment is recognised in profit or loss on a straight-line basis over the estimated useful lives of each part of an
item of property, plant and equipment.
Depreciation is recognised from the date that the property, plant and equipment are installed and are ready for use,
or in respect of internally constructed assets, from the date that the asset is completed and ready for use.
The estimated useful lives for the current and comparative years are as follows:
Freehold property
Leasehold improvements
Furniture, fittings and office equipment
Motor vehicles
Depreciation methods, useful lives and residual values are reviewed, and adjusted as appropriate, at each reporting date.
Property, plant and equipment which are fully depreciated, are retained in the financial statements until they are no
longer in use.
50 years
5 to 10 years
5 years
5 years
Ho Bee Land
80
Annual Report 2014
Notes to the Financial Statements
Year ended 31 December 2014
3
Significant accounting policies (cont’d)
3.5 Goodwill
Goodwill and negative goodwill arise on the acquisition of subsidiaries, associates and jointly-controlled entities.
Goodwill represents the excess of:
•
the fair value of the consideration transferred; plus
•
the recognised amount of any non-controlling interests in the acquiree; plus
•
if the business combination is achieved in stages, the fair value of the existing equity interest in the acquiree,
over the net recognised amount (generally fair value) of the identifiable assets acquired and liabilities assumed.
Goodwill is measured at cost less accumulated impairment losses. In respect of equity-accounted investees, the
carrying amount of goodwill is included in the carrying amount of the investment, and an impairment loss on such
an investment is not allocated to any asset, including goodwill, that forms part of the carrying amount of the equityaccounted investee.
3.6 Investment properties
Investment property is property held either to earn rental income or for capital appreciation or for both, but not for sale
in the ordinary course of business, use in the production or supply of goods or services or for administrative purposes.
Investment property is measured at cost on initial recognition and subsequently at fair value with any change therein
recognised in profit or loss. At each year end, the Group’s investment property portfolio is valued by an external,
independent valuation company, having appropriate recognised professional qualifications. Rental income from
investment properties is accounted for in the manner described in note 3.14.
Cost includes expenditure that is directly attributable to the acquisition of the investment property. The cost of selfconstructed investment property includes the cost of materials and direct labour, any other costs directly attributable
to bringing the investment property to a working condition for their intended use and capitalised borrowing costs.
Any gain or loss on disposal of an investment property (calculated as the difference between the net proceeds from
disposal and the carrying amount of the item) is recognised in profit or loss. When an investment property that was
previously classified as property, plant and equipment is sold, any related amount included in the revaluation reserve
is transferred to retained earnings.
When the use of a property changes such that it is reclassified as property, plant and equipment, or development
properties, its fair value at the date of reclassification becomes its cost for subsequent accounting.
Property that is being constructed for future use as investment property is accounted for at fair value.
Where a property is expected to be sold within the foreseeable future, it is reclassified to current assets in the statement
of financial position. The property is measured at fair value with any change recognised in profit or loss.
81
Notes to the Financial Statements
Year ended 31 December 2014
3
Significant accounting policies (cont’d)
3.7 Leases
When the entities within the Group are lessors of an operating lease
Assets subject to operating leases are included in investment properties and are stated at fair value and not depreciated.
Rental income (net of any incentives given to lessees) is recognised on a straight-line basis over the lease term.
When the entities within the Group are lessees of an operating lease
Where the Group has the use of assets under operating leases, payments made under the leases are recognised in
profit or loss on a straight-line basis over the term of the lease. Lease incentives received are recognised in profit or loss
as an integral part of the total lease.
3.8 Impairment – non-financial assets
The carrying amounts of the Group’s non-financial assets, other than investment properties, inventories and deferred
tax assets, are reviewed at each reporting date to determine whether there is any indication of impairment. If any such
indication exists, the assets’ recoverable amounts are estimated. For goodwill, the recoverable amount is estimated at
each reporting date, and as and when indicators of impairment are identified.
An impairment loss is recognised if the carrying amount of an asset or its cash-generating unit exceeds its estimated
recoverable amount. A cash-generating unit is the smallest identifiable asset group that generates cash flows that
largely are independent from other assets and groups. Impairment losses are recognised in profit or loss unless it
reverses a previous revaluation, credited to equity, in which case it is charged to equity. Impairment losses recognised
in respect of cash-generating units are allocated first to reduce the carrying amount of any goodwill allocated to the
units and then to reduce the carrying amount of the other assets in the unit (group of units) on a pro rata basis.
The recoverable amount of an asset or cash-generating unit is the greater of its value in use and its fair value less costs
to sell. In assessing value in use, the estimated future cash flows are discounted to their present value using a pre-tax
discount rate that reflects current market assessments of the time value of money and the risks specific to the asset or
cash-generating unit.
An impairment loss in respect of goodwill is not reversed. In respect of other assets, impairment losses recognised in
prior periods are assessed at each reporting date for any indications that the loss has decreased or no longer exists. An
impairment loss is reversed if there has been a change in the estimates used to determine the recoverable amount. An
impairment loss is reversed only to the extent that the asset’s carrying amount does not exceed the carrying amount
that would have been determined, net of depreciation or amortisation, if no impairment loss had been recognised.
Ho Bee Land
82
Annual Report 2014
Notes to the Financial Statements
Year ended 31 December 2014
3
Significant accounting policies (cont’d)
3.9 Development properties
Development properties are those properties which are held with the intention of development and sale in the ordinary
course of business. They are stated at the lower of cost plus, where appropriate, a portion of attributable profit, and
estimated net realisable value, net of progress billings. Net realisable value is the estimated selling price less costs to
be incurred in selling the properties.
The cost of properties under development comprise specifically identified costs, including acquisition costs,
development expenditure, borrowing costs and other related expenditure. Borrowing costs payable on loans funding
a development property are also capitalised, on a specific identification basis, as part of the cost of the development
property until the completion of development.
Development properties which have been awarded Temporary Occupation Permit (TOP) and are not sold are transferred
to properties held for sale.
Properties held for sale are those properties which are acquired as completed properties and are stated at the lower of
cost and net realisable value. Net realisable value is the estimated selling price less costs to be incurred in selling the
properties. The cost of properties held for sale comprises the cost of purchase of properties and associated costs.
3.10 Inventories
Inventories are stated at the lower of cost and net realisable value on the first-in, first-out basis.
3.11 Assets held for sale
Non-current assets, or disposal groups comprising assets and liabilities, that are expected to be recovered primarily
through sale rather than through continuing use, are classified as held for sale. Immediately before classification as held
for sale, the assets, or components of a disposal group, are remeasured in accordance with the Group’s accounting
policies. Thereafter, the assets, or disposal group, are generally measured at the lower of their carrying amount and fair
value less costs to sell. Any impairment loss on a disposal group is first allocated to goodwill, and then to remaining
assets and liabilities on pro rata basis, except that no loss is allocated to inventories, financial assets, deferred tax assets,
employee benefit assets, investment property and biological assets, which continue to be measured in accordance
with the Group’s accounting policies. Impairment losses on initial classification as held for sale and subsequent gains
or losses on remeasurement are recognised in profit or loss. Gains are not recognised in excess of any cumulative
impairment loss.
Intangible assets and property, plant and equipment once classified as held for sale or distribution are not amortised or
depreciated. In addition, equity accounting of associates and jointly controlled entities ceases once classified as held
for sale or distribution.
83
Notes to the Financial Statements
Year ended 31 December 2014
3
Significant accounting policies (cont’d)
3.12 Employee benefits
Defined contribution plans
A defined contribution plan is a post-employment benefit plan under which an entity pays fixed contributions into a
separate entity and will have no legal or constructive obligation to pay further amounts. Obligations for contributions
to defined contribution pension plans are recognised as an employee benefit expense in profit or loss in the periods
during which services are rendered by employees.
Short-term employee benefits
Short-term employee benefit obligations are measured on an undiscounted basis and are expensed as the related
service is provided.
A liability is recognised for the amount expected to be paid under short-term cash bonus or profit-sharing plans if
the Group has a present legal or constructive obligation to pay this amount as a result of past service provided by the
employee, and the obligation can be estimated reliably.
3.13 Interest-free related party loans – non-quasi equity
Loans to subsidiaries and associate
Interest-free loans to subsidiaries and associate are stated at fair value at inception. The difference between the fair
value and the loan amount at inception is recognised as additional investments in subsidiaries and associate in the
financial statements. Subsequently, these loans are measured at amortised cost using the effective interest method.
The unwinding of the difference is recognised as interest income in profit or loss over the expected repayment period.
Intra-group balances between the Company and its subsidiaries are eliminated in full in the Group’s consolidated
financial statements.
3.14 Revenue recognition
Sale of development properties in Singapore
Where property is under development and agreement has been reached to sell such property when construction is
complete, the Group considers whether the contract comprise a contract to construct a property or a contract for the
sale of a completed property.
Where a contract is judged to be for the construction of a property, revenue is recognised using percentage of
completion method as construction progresses. Under the percentage of completion method, the percentage of
completion is measured by reference to the work performed, based on the stage of completion certified by an architect
or a quantity surveyor. Profits are recognised only in respect of finalised sale agreements to the extent that such profits
relate to the progress of the construction work.
Ho Bee Land
84
Annual Report 2014
Notes to the Financial Statements
Year ended 31 December 2014
3
Significant accounting policies (cont’d)
3.14 Revenue recognition (cont’d)
Sale of development properties in Singapore (cont’d)
Where a contract is judged to be for the sale of a completed property, revenue is recognised when the significant risks
and rewards of ownership of the real estate have been transferred to the buyer.
Sale of development properties overseas
For overseas property development projects, where no progress payments are received from purchasers during construction,
there is a risk that purchasers may not complete their obligations under the sale contracts. Accordingly, income from such sales
is recognised in the period in which the purchaser takes possession of the property and when full payment is received.
Rental income
Rental income receivable under operating leases is recognised in profit or loss on a straight-line basis over the term
of the lease. Lease incentives granted are recognised as an integral part of the total rental income to be received.
Contingent rentals are recognised as income in the accounting period in which they are earned.
Dividend income
Dividend income is recognised on the date that the shareholder’s right to receive payment is established, which in the
case of quoted securities is the ex-dividend date.
Interest income
Interest income from bank deposits is recognised as it accrues, using the effective interest method.
Distribution income
Distribution received from investment in private equity fund which constitute a return of capital is treated as a return of
investment and is set off against the carrying value of the investment. Any other distributions are taken to profit or loss.
Management fee income
Fees from the provision of management services are recognised when the services have been rendered.
3.15 Finance income and finance costs
Finance income comprise interest income on funds invested. Interest income is recognised as it accrues in profit or loss,
using the effective interest method.
Finance cost comprise borrowing costs which are recognised in profit or loss using the effective interest method, except
to the extent that they are capitalised as being directly attributable to the acquisition, construction or production of an
asset which necessarily takes a substantial period of time to be prepared for its intended use or sale.
Capitalisation of interest for a development of property is discontinued upon the receipt of TOP issued by the relevant authority.
85
Notes to the Financial Statements
Year ended 31 December 2014
3
Significant accounting policies (cont’d)
3.16 Income tax
Income tax expense comprises current and deferred tax. Income tax expense is recognised in profit or loss except to
the extent that it relates to items recognised directly in equity, in which case it is recognised in equity.
Current tax is the expected tax payable or receivable on the taxable income or loss for the year, using tax rates enacted
or substantively enacted at the reporting date, and any adjustment to tax payable in respect of previous years.
Deferred tax is recognised in respect of temporary differences between the carrying amounts of assets and liabilities
for financial reporting purposes and the amounts used for taxation purposes. Deferred tax is not recognised for the
following temporary differences: temporary differences on the initial recognition of assets or liabilities in a transaction
that is not a business combination and that affects neither accounting nor taxable profit or loss, temporary differences
relating to investments in subsidiaries and jointly-controlled entities to the extent that it is probable that they will not
reverse in the foreseeable future, and taxable temporary differences arising on initial recognition of goodwill.
The measurement of deferred taxes reflects the tax consequences that would follow the manner in which the Group
expects, at the end of the reporting period, to recover or settle the carrying amount of its assets and liabilities. Deferred
tax is measured at the tax rates that are expected to be applied to temporary differences when they reverse, based on
the laws that have been enacted or substantively enacted by the reporting date.
Deferred tax assets and liabilities are offset if there is a legally enforceable right to offset current tax liabilities and
assets, and they relate to income taxes levied by the same tax authority on the same taxable entity, or on different tax
entities, but they intend to settle current tax liabilities and assets on a net basis or their tax assets and liabilities will be
realised simultaneously.
A deferred tax asset is recognised for unused tax losses, tax credits and deductible temporary differences, to the extent
that it is probable that future taxable profits will be available against which they can be utilised. Deferred tax assets are
reviewed at each reporting date and are reduced to the extent that it is no longer probable that the related tax benefit
will be realised.
In determining the amount of current and deferred tax, the Group takes into account the impact of uncertain tax positions
and whether additional taxes and interest may be due. The Group believes that its accruals for tax liabilities are adequate
for all open tax years based on its assessment of many factors, including interpretations of tax law and prior experience.
This assessment relies on estimates and assumptions and may involve a series of judgements about future events. New
information may become available that causes the Group to change its judgement regarding the adequacy of existing tax
liabilities; such changes to tax liabilities will impact tax expense in the period that such a determination is made.
3.17 Discontinued operations
A discontinued operation is a component of the Group’s business that represents a separate major line of business or
geographical area of operations that has been disposed of or is held for sale, or is a subsidiary acquired exclusively
with a view to resale. Classification as a discontinued operation occurs upon disposal or when the operation meets
the criteria to be classified as held for sale, if earlier. When an operation is classified as a discontinued operation,
the comparative income statement is re-presented as if the operation had been discontinued from the start of the
comparative year.
Ho Bee Land
86
Annual Report 2014
Notes to the Financial Statements
Year ended 31 December 2014
3
Significant accounting policies (cont’d)
3.18 Earnings per share
The Group presents basic and diluted earnings per share (EPS) data for its ordinary shares. Basic EPS is calculated by
dividing the profit or loss attributable to ordinary shareholders of the Company by the weighted average number of
ordinary shares outstanding during the period, adjusted for own shares held. Diluted EPS is determined by adjusting the
profit or loss attributable to ordinary shareholders and the weighted average number of ordinary shares outstanding,
adjusted for own shares held, for the effects of all dilutive potential ordinary shares.
3.19 Segment reporting
An operating segment is a component of the Group that engages in business activities from which it may earn
revenues and incur expenses, including revenues and expenses that relate to transactions with any of the Group’s other
components. All operating segments’ operating results are reviewed regularly by the Group’s CEO to make decisions
about resources to be allocated to the segment and assess its performance.
3.20New standards and interpretations not adopted
A number of new standards, amendments to standards and interpretations are effective for annual periods beginning
after 1 January 2014, and have not been applied in preparing these financial statements. None of these are expected
to have a significant effect on the financial statements of the Group and the Company.
87
Notes to the Financial Statements
Year ended 31 December 2014
4
Property, plant and equipment
Paintings
and
Freehold
Leasehold
property improvements sculptures
Group
Furniture,
fittings
and office
equipment
Motor
vehicles
$’000
$’000
2,003
19,486
$’000
$’000
$’000
$’000
2,248
625
13,046
1,564
Total
Cost/Valuation
At 1 January 2013
Additions
–
–
2,975
2,762
–
5,737
Disposals
–
–
–
(410)
–
(410)
(270)
–
–
–
–
(270)
1,978
625
16,021
3,916
2,003
24,543
Effect of movement in exchange
rate
At 31 December 2013
Additions
–
–
1,088
496
70
1,654
Disposals
–
–
–
(44)
(5)
(49)
(78)
–
–
(1)
(3)
(82)
1,900
625
17,109
4,367
2,065
26,066
Effect of movement in exchange
rate
At 31 December 2014
Ho Bee Land
88
Annual Report 2014
Notes to the Financial Statements
Year ended 31 December 2014
4
Property, plant and equipment (cont’d)
Paintings
and
Freehold
Leasehold
property improvements sculptures
Furniture,
fittings
and office
equipment
Motor
vehicles
$’000
$’000
$’000
$’000
$’000
At 1 January 2013
44
625
–
1,274
887
2,830
Depreciation charge for the year
42
–
–
595
229
866
–
–
–
(200)
–
(200)
Group
$’000
Total
Accumulated depreciation and
impairment losses
Disposals
Effect of movement in exchange
rate
(7)
–
–
–
–
(7)
At 31 December 2013
79
625
–
1,669
1,116
3,489
Depreciation charge for the year
40
–
–
670
254
964
–
–
–
(44)
(3)
(47)
Disposals
Effect of movement in exchange
rate
At 31 December 2014
(5)
–
–
–
(2)
(7)
114
625
–
2,295
1,365
4,399
2,204
–
13,046
290
1,116
16,656
Carrying amount
At 1 January 2013
At 31 December 2013
1,899
–
16,021
2,247
887
21,054
At 31 December 2014
1,786
–
17,109
2,072
700
21,667
89
Notes to the Financial Statements
Year ended 31 December 2014
4
Property, plant and equipment (cont’d)
Company
Furniture,
fittings
and office
equipment
Motor
vehicles
Paintings
$’000
$’000
259
523
–
782
$’000
$’000
Total
Cost
At 1 January 2013
Additions
2,745
–
3
2,748
Disposals
(5)
–
–
(5)
2,999
523
3
3,525
At 31 December 2013
Additions
453
−
−
453
Disposals
−
(5)
−
(5)
3,452
518
3
3,973
At 1 January 2013
216
244
–
460
Depreciation charge for the year
564
76
–
640
(5)
–
–
(5)
At 31 December 2013
775
320
–
1,095
Depreciation charge for the year
654
32
−
686
−
(3)
−
(3)
1,429
349
−
1,778
43
279
–
322
At 31 December 2013
2,224
203
3
2,430
At 31 December 2014
2,023
169
3
2,195
At 31 December 2014
Accumulated depreciation and impairment losses
Disposals
Disposals
At 31 December 2014
Carrying amount
At 1 January 2013
Ho Bee Land
90
Annual Report 2014
Notes to the Financial Statements
Year ended 31 December 2014
5
Investment properties
Note
2014
Group
2013
$’000
$’000
At 1 January
274,245
125,300
Additions
Freehold properties
468,908
138,707
Changes in fair value
11,693
1,300
Movement in exchange rate
(8,183)
8,938
746,663
274,245
At 31 December
Leasehold properties
At 1 January
1,266,464
31,600
–
743,080
270,000
491,784
1,536,464
1,266,464
At 1 January
–
604,282
Additions
–
138,798
Transfer to leasehold properties
–
(743,080)
Transfer from leasehold property under development
Changes in fair value
At 31 December
Leasehold property under development
At 31 December
Total investment properties
Interest capitalised during the year
26
–
–
2,283,127
1,540,709
–
5,712
Investment properties comprise a number of commercial properties that are leased to third party customers. Each of
the leases contains an initial non-cancellable period of 1 to 15 years. Subsequent renewals are negotiated with the
lessee. During the year, contingent rent of $161,905 (2013: $122,125) was charged and recognised as income.
Certain investment properties with carrying value amounting to $2,175,896,000 (2013: $1,537,245,569) have been
pledged to secure banking facilities granted to the Group (see note 19).
Investment properties are stated at fair value based on valuations carried out by independent external valuers, namely
Colliers International Consultancy & Valuation (Singapore) Pte Ltd (“Colliers”) and DTZ Debenham Tie Leung Limited
(“DTZ”). Both the valuers have appropriate recognised professional qualifications and recent experience in the location
and category of property being valued.
The fair values are based on market values, being the estimated amount for which a property could be exchanged
on the date of the valuation between a willing buyer and a willing seller in an arm’s length transaction after proper
marketing, wherein the parties had each acted knowledgeably, prudently and without compulsion.
91
Notes to the Financial Statements
Year ended 31 December 2014
5
Investment properties (cont’d)
In 2014, the Group recognised a fair value gain of $281,693,000 (2013: $493,084,000) on its investment properties, out
of which, $270,000,000 (2013: $489,583,000) relate to the revaluation of The Metropolis. The Metropolis was reclassified
from leasehold properties under development to leasehold properties following its completion in 2013. See note 37 –
Determination of fair values for disclosure on the valuation techniques used by Colliers and DTZ.
6
Subsidiaries
Company
2014
Equity investments, at cost
$’000
$’000
113,507
69,366
2,205
2,273
Discount implicit in interest-free loans to subsidiaries
Impairment loss
(1,000)
(1,000)
114,712
70,639
Details of the significant subsidiaries are as follows:
Name of subsidiary
Principal place
of business
Effective equity
held by the Group
2014
2013
%
%
Ho Bee Developments Pte Ltd
Singapore
100
100
Ho Bee Realty Pte Ltd
Singapore
100
100
Ho Bee (One North) Pte. Ltd.
Singapore
100
100
Pacific Rover Pte Ltd
Singapore
100
100
Ho Bee Cove Pte Ltd
Singapore
90
90
HB Investments (China) Pte. Ltd.
Singapore
80
80
Grandiose Investments Pte Ltd
Singapore
100
100
HB Le Grand Pte Ltd
Singapore
1001
–
HB St Martins Pte Ltd
Singapore
1002
–
1
2
2013
HB Le Grand Pte Ltd was incorporated on 11 February 2014.
HB St Martins Pte Ltd was incorporated on 3 October 2014.
KPMG LLP are the auditors of all significant Singapore-incorporated subsidiaries.
Ho Bee Land
92
Annual Report 2014
Notes to the Financial Statements
Year ended 31 December 2014
6
Subsidiaries (cont’d)
The Group has no non-controlling interest where the results of the non-controlling interest is material and significant
to the Group.
7
Associates
The Group has two associates (2013: two) that are material to the Group. All are equity accounted. The following are
for the material associates:
Shanghai Yanlord Hongqiao
Property Co., Ltd
(Shanghai Yanlord Hongqiao)
Nature of relationship with the Group
Strategic property developer
providing access to residential
development projects in China
Strategic property developer
providing access to residential
development projects in China
Principal place of business/Country of
incorporation
China
China
Ownership interest/Voting rights held
40% (2013: 40%)
20% (2013: 20%)
1
2
1
Zhuhai Yanlord Heyou Land Co.,
Ltd
(Zhuhai Yanlord Heyou) 2
Audited by 上海中惠会计师事务所, a CPA firm, China
Audited by 珠海德鸿会计师事务所有限公司, a CPA firm, China
The following summarises the financial information of each of the Group’s material associates based on their
respective financial statements prepared in accordance with FRS, modified for fair value adjustments on acquisition
and differences in the Group’s accounting policies.
93
Notes to the Financial Statements
Year ended 31 December 2014
7
Associates (cont’d)
Shanghai
Yanlord
Hongqiao
$’000
Zhuhai
Yanlord
Heyou
$’000
–
(3,696)
(3,696)
(3,696)
–
(680)
(680)
(680)
261
1,157,584
(274,689)
(72,743)
810,413
810,413
535
733,348
(54,762)
(18,301)
660,820
660,820
318,652
126,190
444,842
(1,478)
(136)
(1,614)
6,992
324,166
6,110
132,164
13,102
456,330
2013
Revenue
Loss from continuing operations
Total comprehensive income
Attributable to investee’s shareholders
–
(1,738)
(1,738)
(1,738)
–
(2,720)
(2,720)
(2,720)
Non-current assets
Current assets
Non-current liabilities
Current liabilities
Net assets
Attributable to investee’s shareholders
263
946,814
(118,997)
(31,450)
796,630
796,630
205
631,413
–
(668)
630,950
630,950
Group’s interest in net assets of investee at beginning of the year
Group’s share of:
- Loss from continuing operations
Other comprehensive income:
- Foreign currency translation differences
Group’s contribution during the year
Carrying amount of interest in investee at end of the year
298,526
114,765
413,291
(695)
(544)
(1,239)
20,821
–
318,652
6,647
5,322
126,190
27,468
5,322
444,842
2014
Revenue
Loss from continuing operations
Total comprehensive income
Attributable to investee’s shareholders
Non-current assets
Current assets
Non-current liabilities
Current liabilities
Net assets
Attributable to investee’s shareholders
Group’s interest in net assets of investee at beginning of the year
Group’s share of:
- Loss from continuing operations
Other comprehensive income:
- Foreign currency translation differences
Carrying amount of interest in investee at end of the year
Total
$’000
Ho Bee Land
94
Annual Report 2014
Notes to the Financial Statements
Year ended 31 December 2014
8
Jointly-controlled entities
The Group has two (2013: two) jointly-controlled entities that are material and three (2013: three) joint-controlled
entities that are individually immaterial to the Group.
These jointly-controlled controlled entities are structured as separate vehicles and the Group has a residual interest
in their net assets. Accordingly, the Group has classified its interest in these entities as joint ventures, which are
equity-accounted for.
The following are the material joint ventures:
Seaview (Sentosa) Pte Ltd
(Seaview)1
Nature of relationship with the Group
Strategic partner providing high end Strategic partner providing high end
residential properties in Sentosa
residential properties in Sentosa
Principal place of business/Country of
incorporation
Singapore
Singapore
Ownership interest/Voting rights held
50% (2013: 50%)
35% (2013: 35%)
1
Pinnacle (Sentosa) Pte Ltd
(Pinnacle)1
Audited by KPMG LLP, Singapore
The following summarises the financial information of each of the Group’s material joint ventures based on their
respective financial statements prepared in accordance with FRS, modified for fair value adjustments on acquisition
and differences in the Group’s accounting policies.
95
Notes to the Financial Statements
Year ended 31 December 2014
8
Jointly-controlled entities (cont’d)
2014
Seaview
Pinnacle
11,043
6,033
3,864
(9,900)
$’000
Revenue
Profit / (Loss) from continuing operations*
Other comprehensive income
$’000
–
–
Total comprehensive income
3,864
(9,900)
Attributable to investee’s shareholders
3,864
(9,900)
–
1,549
Current assets
Non-current assets
472,537
1,465,172
Non-current liabilities
(370,410)
(559,350)
Immaterial
joint
ventures
Total
$’000
$’000
Current liabilities
(4,634)
(20,545)
Net assets
97,493
886,826
Attributable to investee’s shareholders
97,493
886,826
Group’s interest in net assets of investee at beginning of
the year
46,753
158,237
(2,436)
202,554
Group’s share of total comprehensive income:
1,932
(3,465)
(2,790)
(4,323)
Intra group eliminations
(1,115)
(99)
–
(1,214)
–
–
(372)
(372)
Foreign currency translation differences
Conversion of loan to investment
Carrying amount of interest in investee at end of the year
–
149,450
–
149,450
47,5701
304,1231
(5,598)
346,095
1
Includes elimination of prior year’s shareholder loan interest capitalised as part of development properties of
$1,177,000 for Seaview and $6,266,000 for Pinnacle.
*
Includes elimination of intercompany loan interests for the year.
Ho Bee Land
96
Annual Report 2014
Notes to the Financial Statements
Year ended 31 December 2014
8
Jointly-controlled entities (cont’d)
2013
Seaview
Pinnacle
14,947
74
$’000
Revenue
$’000
Profit / (Loss) from continuing operations*
5,118
(5,288)
Total comprehensive income
5,118
(5,288)
Attributable to investee’s shareholders
5,118
(5,288)
–
–
Current assets
471,957
1,465,570
Non-current liabilities
Non-current assets
Immaterial
joint
ventures
Total
$’000
$’000
(372,551)
(559,350)
Current liabilities
(3,547)
(436,212)
Net assets
95,859
470,008
Attributable to investee’s shareholders
95,859
470,008
Group’s interest in net assets of investee at beginning of
the year
45,337
(62,410)
22,317
5,244
Group’s share of total comprehensive income:
2,559
(1,851)
12,647
13,355
Intra group eliminations
(1,143)
(1,502)
–
(2,645)
Dividends received during the year
–
–
(37,400)
(37,400)
Conversion of loan to investment
–
224,000
–
224,000
46,753
158,237
(2,436)
202,554
Carrying amount of interest in investee at end of the year
1
1
1
Includes elimination of prior year’s shareholder loan interest capitalised as part of development properties of
$1,177,000 for Seaview and $6,266,000 for Pinnacle.
* Includes elimination of intercompany loan interests for the year.
97
Notes to the Financial Statements
Year ended 31 December 2014
9
Other assets
2014
At cost
Club membership
10
Group
2013
$’000
$’000
150
150
Financial assets
2014
Non-current assets
Group
2013
2014
Company
2013
$’000
$’000
$’000
$’000
4,051
4,518
–
–
Investments designated at fair value
through profit or loss
Investments in private equity funds
Investments designated at fair value through profit or loss are those that the Group intends to hold for the medium term
and represent investments in companies that are strategic and are involved in emerging technologies.
Ho Bee Land
98
Annual Report 2014
Notes to the Financial Statements
Year ended 31 December 2014
11
Other receivables
2014
Group
2013
2014
2013
$’000
$’000
- interest bearing
–
–
585
1,296
- non-interest bearing
–
–
319,479
137,099
–
–
320,064
138,395
185,205
331,070
185,205
331,070
85,169
69,718
–
–
Non-current assets
$’000
Company
$’000
Amounts due from subsidiaries (non-trade)
Amounts due from jointly-controlled entities
(non-trade)
-interest-bearing
- non-interest bearing
Impairment losses
–
–
–
(56,633)
270,374
400,788
185,205
274,437
270,374
400,788
505,269
412,832
The above amounts are unsecured and are not expected to be repaid within the next 12 months.
Group
The settlement for the non-interest bearing amounts due from jointly-controlled entities of $85,169,000 (2013:
$69,718,000) is neither planned nor likely to occur in the foreseeable future. As this amount is, in substance, a part of
the Group’s net investment in the jointly-controlled entities, it is stated at cost less accumulated impairment losses.
Interest bearing amounts due from jointly-controlled entities of $185,205,000 (2013: $331,070,000) have no fixed terms
of repayment and are charged at rates of 1.20% to 1.45% per annum.
Company
The settlement for the non-interest bearing amounts due from subsidiaries of $319,479,000 (2013: $137,099,000) is
neither planned nor likely to occur in the foreseeable future. As this amount is, in substance, a part of the Company’s
net investment in the subsidiary, it is stated at cost less accumulated impairment losses.
Interest bearing amounts due from subsidiaries of $585,000 (2013: $1,296,000) have no fixed terms of repayment and
are charged at a rate of 2.40% per annum.
In 2014, amounts due from a jointly-controlled entity (non-trade) of $149,450,000 was converted to preference shares
and included as part of the Company’s investment in jointly-controlled entities. At the same time, the impairment loss
of $56,633,000 was applied to the carrying amount. During the year, an impairment of $6,428,000 was made against the
Company’s investment in its jointly-controlled entities.
99
Notes to the Financial Statements
Year ended 31 December 2014
12
Deferred tax
Movements in deferred tax assets and liabilities of the Group (prior to offsetting of balances) during the year are as follows:
Group
At 1
January
2013
Recognised
in income
statement
(note 27)
At 31
December
2013
12,379
(12,249)
53
–
104
–
$’000
$’000
Others
At 31
December
2014
130
–
130
53
–
53
104
–
104
$’000
$’000
$’000
Deferred tax liabilities
Development properties
Property, plant and equipment
Income not remitted into Singapore
Accrued rent receivables
–
1,228
1,228
(1,228)
–
12,536
(11,021)
1,515
(1,228)
287
Tax loss carried forward
(109)
109
–
–
–
Deferred income
(473)
–
(473)
–
(473)
Total
(582)
109
(473)
–
(473)
Total
Deferred tax assets
In 2013, the Group recorded a deferred tax liability of $1,228,000 arising from accrued rent receivables. In 2014, the
Group had opted to elect for a concessionary tax treatment under FRS 17 – Leases which will align the tax treatment
on rental income under an operating lease to the requirements of FRS 17 (i.e. rental income will be subject to tax in the
same period in which income is recognised in the profit and loss statement). As a result, the Group has transferred its
deferred tax liabilities of $1,228,000 as at 31 December 2013 to current tax liabilities as at 31 December 2014.
Ho Bee Land
100
Annual Report 2014
Notes to the Financial Statements
Year ended 31 December 2014
13
Development properties
Note
Properties held for sale
2014
Group
2013
$’000
$’000
149,714
149,753
79,832
58,187
Properties under development:
- Costs incurred and attributable profits
- Progress billings
Total development properties
Interest capitalised during the year
26
–
–
79,832
58,187
229,546
207,940
28
–
During the year, the finance costs was capitalised at rates ranging from 4.53% to 4.59% (2013: 1.18% to 1.32%) per
annum for development properties.
Certain development properties with carrying value amounting to $63,942,789 (2013: $nil) were pledged to secure
banking facilities granted to the Group (see note 19).
101
Notes to the Financial Statements
Year ended 31 December 2014
14
Trade and other receivables
2014
Group
2013
2014
Company
2013
$’000
$’000
$’000
$’000
499
12,904
–
–
24,945
7,825
(34)
(16)
–
–
Net receivables
25,410
20,713
–
–
Other deposits
561
810
29
49
–
–
6,256
18,329
17
16
–
–
Trade receivables
Accrued rent receivables
Impairment losses
Amounts due from:
- subsidiaries (non-trade)
- non-interest bearing
- jointly-controlled entities (non-trade)
- non-interest bearing
- associate (non-trade)
19,665
18,760
19,665
18,760
Goods and services tax recoverable
133
4,247
–
106
Derivative financial asset
351
–
–
–
Other receivables
Prepayments
Deposits paid to acquire residential properties
8,161
442
505
228
54,298
44,988
26,455
37,472
348
2,794
33
28
8,016
4,096
–
–
62,662
51,878
26,488
37,500
Amounts due from subsidiaries, jointly-controlled entities and joint venture partner are unsecured and repayable within
the next twelve months.
Included within other receivables are amounts held by lawyers in trust of $7,093,000 (2013: $nil) in relation to deposits
received from sale of properties.
15
Cash and cash equivalents
2014
Group
2013
2014
Company
2013
$’000
$’000
$’000
$’000
Cash at banks and in hand
4,618
19,901
337
347
Fixed deposits
5,335
97,656
–
85,336
9,953
117,557
337
85,683
Ho Bee Land
102
Annual Report 2014
Notes to the Financial Statements
Year ended 31 December 2014
15
Cash and cash equivalents (cont’d)
Included in cash and cash equivalents of the Group are amounts held under the Housing Developers (Project Account)
(Amendment) Rules 1997, totalling $nil (2013: $8,544,000), the use of which is subject to restrictions imposed by the
aforementioned rules.
The weighted average effective interest rates relating to fixed deposits at the balance sheet date for the Group is 0.50%
(2013: 0.73%) per annum. Interest rates reprice at intervals of one, three or six months.
16
Assets held for sale
In 2013, the sale of the freehold land and hotel building was completed and a net gain of $25,927,000 was recognised in
the profit for the year.
17
Share capital
Group and Company
2014
2013
Number
of shares
Number
of shares
703,338
703,338
(’000)
(’000)
Fully paid ordinary shares, with no par value:
At 1 January and 31 December
As at 31 December 2014, included in the total number of ordinary shares was 35,777,000 (2013: 32,895,000) shares
purchased by the Company (the “Treasury Shares”) by way of market acquisition at an average price of $1.68 (2013:
$1.65) per share. The Treasury Shares were deducted from total equity (see note 18).
The holders of ordinary shares (excluding treasury shares) are entitled to receive dividends as declared from time to
time and are entitled to one vote per share at meetings of the Company. All shares (excluding treasury shares) rank
equally with regard to the Company’s residual assets.
Capital management
The Board’s policy is to maintain an adequate capital base so as to maintain investor, creditor and market confidence
and to sustain future development of the business.
The Board of Directors monitors the return on capital, which the Group defines as net operating income divided
by total shareholders’ equity, excluding non-controlling interests. The Board of Directors also monitors the level of
dividends to ordinary shareholders. The Group funds its operations and growth through a mix of equity and debts. This
includes the maintenance of adequate lines of credit and assessing the need to raise additional equity where required.
103
Notes to the Financial Statements
Year ended 31 December 2014
17
Share capital (cont’d)
Capital management (cont’d)
From time to time, the Group may undertake share purchases or acquisitions under its approved Share Purchase
Mandate if and when circumstances permit, as part of the Group’s management mechanism to facilitate the return of
surplus cash over and above its ordinary capital requirements, in an expedient and cost-efficient manner. The purchases
or acquisitions of its shares seek to increase shareholder’ values and provide greater flexibility over the Group’s share
capital structure.
There were no changes in the Group’s approach to capital management during the year.
The Company and its subsidiaries are not subject to externally imposed capital requirements.
The gearing ratio is calculated as net debt divided by total equity (excluding non-controlling interests). Net debt is
calculated as borrowings less cash and cash equivalents.
2014
Net debt
Total equity (excluding non-controlling
interests)
Gearing ratio
Group
2013
2014
Company
2013
$’000
$’000
$’000
$’000
905,207
351,977
153,392
9,220
2,601,117
2,330,775
1,153,769
1,130,667
0.35
0.15
0.13
0.01
The Group and the Company are in compliance with all borrowing covenants for the financial years ended 31 December
2013 and 31 December 2014.
18
Capital and reserves
2014
Reserve for own shares
Capital reserve
Hedging reserve
Foreign currency translation reserve
Revaluation reserve
Retained earnings
Group
2013
2014
Company
2013
$’000
$’000
$’000
$’000
(60,284)
(54,265)
(60,284)
(54,265)
2,043
2,230
−
187
351
−
−
−
22,359
7,935
−
–
−
–
−
–
2,480,600
2,218,827
1,058,005
1,028,697
2,445,069
2,174,727
997,721
974,619
Ho Bee Land
104
Annual Report 2014
Notes to the Financial Statements
Year ended 31 December 2014
18
Capital and reserves (cont’d)
Reserve for own shares
Reserve for own shares comprises the cost of the Company’s shares held by the Group.
Capital reserve
The capital reserve which arose prior to 1 January 2001, comprises negative goodwill arising on acquisition of interests
in subsidiaries and discount arising on the acquisition of a loan extended by a former shareholder to a subsidiary.
Foreign currency translation reserve
The currency translation reserve comprises all foreign exchange differences arising from the translation of the financial
statements of foreign operations whose functional currencies are different from the functional currency of the Company.
Revaluation reserve
As at 31 December 2012, the revaluation reserve comprised of the surpluses arising from the revaluation of freehold
land and hotel building. In 2013, the Group completed the sale of its freehold land and hotel building. The revaluation
reserve amounting to $94,676,000 was transferred to retained earnings.
Retained earnings
Included in retained earnings is a net accumulated profit of $12,703,000 (2013: profit of $18,640,000) representing share
of post acquisition results of associates and jointly-controlled entities.
19
Loans and borrowings
2014
Non-current liabilities
Secured bank loans
Group
2013
2014
Company
2013
$’000
$’000
$’000
$’000
751,516
98,831
–
–
163,644
370,703
153,729
94,903
915,160
469,534
153,729
94,903
Current liabilities
Secured bank loans
105
Notes to the Financial Statements
Year ended 31 December 2014
19
Loans and borrowings (cont’d)
The bank loans are secured on the following assets:
Note
2014
Group
2013
$’000
$’000
Investment properties
5
2,175,896
1,537,246
Development properties
13
63,943
–
2,239,839
1,537,246
Carrying amounts
In addition, the Group’s bank loans are secured by legal assignment of sales and rental proceeds.
Terms and debt repayment schedule
Terms and conditions of outstanding loans and borrowings are as follows:
Effective
interest
rate
Group
%
Expected
year of
maturity
Face
value
$’000
2014
Carrying
amount
Face
value
$’000
$’000
2013
Carrying
amount
$’000
Secured bank loans
- floating rate
1.49 – 3.93
2015 – 2019
915,160
915,160
469,534
469,534
1.57 – 3.93
2015
153,729
153,729
94,903
94,903
Company
Secured bank loans
- floating rate
Ho Bee Land
106
Annual Report 2014
Notes to the Financial Statements
Year ended 31 December 2014
19
Loans and borrowings (cont’d)
Intra-group financial guarantees
Intra-group financial guarantees comprise guarantees given by the Company to banks in respect of banking facilities
amounting to $957,203,000 (2013: $570,404,000) extended to its subsidiaries, associates and jointly-controlled entities.
The periods in which the financial guarantees expire are as follows:
2014
20
2013
2014
Company
2013
$’000
$’000
$’000
$’000
–
195,773
9,915
471,573
195,773
–
947,288
98,831
195,773
195,773
957,203
570,404
Less than 1 year
Between 1 and 5 years
Group
Other liabilities
2014
Amount due to a non-controlling shareholder (non-trade)
Group
2013
$’000
$’000
15,213
15,213
Amount due to a non-controlling shareholder (non-trade) is unsecured and interest-free, and does not have fixed terms
of repayment. As the amount represents, in substance, the non-controlling shareholder’s net investment in the Group,
it is stated at cost.
21
Deferred income
2014
Gain on sale and leaseback arrangement
Rental advances from tenants
Non-current
Current
Group
2013
$’000
$’000
819
1,801
20,606
2,894
21,425
4,695
8,175
819
13,250
3,876
21,425
4,695
107
Notes to the Financial Statements
Year ended 31 December 2014
21
Deferred income (cont’d)
Gain on sale and leaseback arrangement
In 2010, the Group entered into a sale and leaseback arrangement, in which a deferred gain is recognised on the excess
of sale proceeds over the fair value of the disposed leasehold property. Deferred gain is released to profit or loss on a
straight-line basis over the leaseback period of 5 years.
22
Trade and other payables
2014
Group
2013
2014
Company
2013
$’000
$’000
$’000
$’000
Trade payables
–
53
–
–
Rental deposits
15,683
14,842
–
–
Accrued operating expenses and development
expenditure
53,807
75,700
7,111
10,180
–
–
79,623
29,075
Amount due to jointly-controlled entity (nontrade)
3,690
6,700
3,690
6,700
Other payables
7,055
684
23
–
Goods and services tax payable
1,755
594
–
–
–
11,780
–
–
81,990
110,353
90,447
45,955
Amounts due to subsidiaries (non-trade)
Retention sums payable
Amounts due to subsidiaries are unsecured, interest-free and repayable on demand.
Amount due to jointly-controlled entity is unsecured, interest-free and repayable within the next twelve months.
23
Revenue
Revenue represents property development income, and rental income and service charges, after eliminating intercompany transactions. Property development income consists of sales proceeds from properties held for resale, and
in respect of property development projects, an appropriate portion of the contracted sales value on which profit has
been recognised under the percentage of completion method.
Ho Bee Land
108
Annual Report 2014
Notes to the Financial Statements
Year ended 31 December 2014
23
Revenue (cont’d)
The amount of each significant category of revenue is as follows:
2014
Gross proceeds from properties sold
Rental income and service charges
Group
2013
$’000
$’000
–
108,646
99,601
30,698
99,601
139,344
Included in rental income and service charges is lease income generated from investment properties of $94,990,000
(2013: $25,727,000).
24
Other income
2014
$’000
Group
2013
$’000
Gross dividend income from:
- quoted equity investments
–
1
43
38
Gain on disposal of freehold land and hotel building
–
25,927
Gain on sale of quoted equity
–
7
Gain on sale of investee company
–
47,194
Distribution income from financial assets designated at fair value through
profit or loss
118
247
Forfeiture income
167
–
Management fee income
420
1,569
Fair value (loss)/gain on financial assets at fair value through profit or loss
(272)
1,137
1,400
515
1,876
76,635
- unquoted equity investments
Others
109
Notes to the Financial Statements
Year ended 31 December 2014
25
Directors’ remuneration
Number of directors in remuneration bands:
2014
Number of
Directors
$500,000 and above
3 3
$250,000 to $499,999
– –
Below $250,000
5*5*
Total
8 8
*
26
2013
Number of
Directors
Includes 5 (2013: 5) independent directors.
Finance income and finance costs
Note
2014
Group
2013
$’000
$’000
Interest income on loans and receivables
1,423
4,674
Finance income
1,423
4,674
Interest expense on financial liabilities measured at amortised cost
(19,465)
(11,563)
Interest expense capitalised in properties under development
13
28
–
Interest expense capitalised in investment property under construction
5
–
5,712
Finance costs
(19,437)
(5,851)
Net finance costs recognised in profit or loss
(18,014)
(1,177)
Ho Bee Land
110
Annual Report 2014
Notes to the Financial Statements
Year ended 31 December 2014
27
Income tax expense
2014
Current tax expense
Current year
Overprovision of tax in prior years
Group
2013
$’000
$’000
7,737
20,330
(366)
(4,493)
7,371
15,837
–
(10,912)
Income tax expense
7,371
4,925
Income tax expense from continuing operations
7,371
4,263
Deferred tax expense
Movements in temporary differences
Income tax expense from discontinued operations
Total income tax expense
–
662
7,371
4,925
Reconciliation of effective tax rate
2014
Profit for the year
Total income tax expense
Profit excluding income tax
Tax calculated using Singapore tax rate of 17% (2013: 17%)
Expenses not deductible for tax purposes
Tax exempt revenue
Income not subject to tax
Effect of different tax rates in other countries
Tax incentives
Overprovision of tax in prior years
Group
2013
$’000
$’000
314,516
606,216
7,371
4,925
321,887
611,141
54,721
103,894
2,877
4,227
(156)
(157)
(48,796)
(98,457)
721
297
(1,630)
(386)
(366)
(4,493)
7,371
4,925
111
Notes to the Financial Statements
Year ended 31 December 2014
28
Discontinued operations
In October 2012, the Group entered into option to purchase agreement with a third party customer to sell its freehold
land and hotel building. Following the reclassification of the freehold land and hotel building to assets held for sale,
the Group’s hotel operations were discontinued.
In May 2013, the Group completed the sale of its freehold land and hotel building. A net gain of $25,927,000 was
recognised in the income statement for the financial year ended 31 December 2013. Following the sale in May 2013,
the Group then signed an agreement with the purchaser to continue with the hotel operation as part of the transitional
arrangement. The arrangement expired on 27 March 2014.
The income statement has been presented to show the discontinued operations separately from continuing operations.
2014
Group
2013
$’000
$’000
Revenue
1,447
9,737
Expenses
(1,634)
(5,841)
(187)
3,896
–
(662)
(187)
3,234
Basic earnings per share (cents)
(0.03)
0.48
Diluted earnings per share (cents)
(0.03)
0.48
Results of discontinued operation
Results from operating activities
Tax
Profit for the year
The loss from discontinued operation of $187,000 (2013: profit of $3,234,000) is attributable entirely to the owners of
the Company.
Of the profit from continuing operations of $314,703,000 (2013: $602,982,000), an amount of $315,178,000 is attributable
to the owners of the Company (2013: $588,541,000).
Cash flows from discontinued operations
2014
$’000
Group
2013
$’000
Net cash from operating activities
(747)
3,432
Net cash flows for the year
(747)
3,432
Ho Bee Land
112
Annual Report 2014
Notes to the Financial Statements
Year ended 31 December 2014
29
Profit for the year
The following items have been included in arriving at profit for the year:
Note
Direct operating expenses from investment properties
Audit fees payable/paid to auditors of the Company
Non-audit fees paid to auditors of the Company
Group
2013
$’000
$’000
19,105
6,995
362
343
111
138
Depreciation of property, plant and equipment
4
964
866
Amortisation of deferred gain on sale of leasehold property under a
sale and leaseback arrangement
21
(982)
(961)
6,171
8,878
Contributions to defined contribution plans included in staff costs
253
398
Allowance for impairment loss reversed on trade receivables
(18)
(12)
(2)
–
Staff costs
Loss on disposal of property, plant and equipment
30
2014
Earnings per share
2014
Group
2013
$’000
$’000
314,991
591,775
Basic earnings per share is based on:
Net profit attributable to ordinary shareholders
The Company does not have any dilutive potential ordinary shares in existence for the current and previous financial years.
2014
Less : Cancelled shares
2013
Number
of shares
Number
of shares
703,338
737,338
–
(34,000)
’000
Ordinary shares in issue at beginning of the year
Group
’000
Effect of own shares held
(35,457)
(26,388)
Weighted average number of ordinary shares in issue during the year
667,881
676,950
113
Notes to the Financial Statements
Year ended 31 December 2014
31
Dividends
After the balance sheet date, the Directors proposed the following dividends, which have not been provided for.
Group and Company
2014
2013
$’000
Proposed final tax-exempt dividend of 5 cents (2013: 8 cents) per share
$’000
33,378
53,635
32
Significant related party transactions
Key management personnel
Key management personnel of the Group are those persons having the authority and responsibility for planning, directing
and controlling activities of the Group. The Directors of the Group are considered as key management personnel.
Key management personnel compensation comprised:
2014
Directors’ fees
Group
2013
$’000
$’000
317
317
7,028
8,622
7,345
8,939
Directors’ remuneration:
- short-term employee benefits
Ho Bee Land
114
Annual Report 2014
Notes to the Financial Statements
Year ended 31 December 2014
32
Significant related party transactions (cont’d)
Other related party transactions
Other than as disclosed elsewhere in the financial statements, the transactions with related parties entered into on
terms agreed between the parties are as follows:
2014
Group
2013
$’000
$’000
43
25
-insurance
57
58
-printing
45
32
-others
54
41
6,000
1,500
Related corporations
Rental income
Other operating expenses:
Other related parties
Donations made
(i)
(i)
The donation of $6,000,000 (2013: $1,500,000) was made to Ho Bee Foundation, the philanthropic arm of the
Group. By virtue of Mr Chua Thian Poh’s shareholdings in Ho Bee Holdings (Pte) Ltd, the immediate and ultimate
holding company, he is deemed to have control over the financial and operating policies of the Company.
Mr Chua is also a director and a key management personnel of Ho Bee Foundation.
33
Commitments
As at 31 December 2014, commitments for expenditure which have not been provided for in the financial statements
were as follows:
2014
Group
2013
$’000
$’000
106,104
320
335
366
Authorised and contracted for:
- development expenditure
- subscription for additional interest in private equity funds
115
Notes to the Financial Statements
Year ended 31 December 2014
33
Commitments (cont’d)
The Group leases out its investment properties, property, plant and equipment and certain properties held for sale.
Non-cancellable operating lease rentals are receivable as follows:
2014
34
Group
2013
$’000
$’000
Within 1 year
101,897
40,766
After 1 year but within 5 years
283,716
93,413
After 5 years
179,501
1,577
565,114
135,756
Financial risk management
Overview
The Group has a system of controls in place to create an acceptable balance between the cost of risks occurring and
the cost of managing the risks. Management continually monitors the Group’s risk management process to ensure
that an appropriate balance between risk and control is achieved. Risk management policies and systems are reviewed
regularly to reflect changes in market conditions and the Group’s activities.
Credit risk
Credit risk is the risk of financial loss to the Group if a customer or counterparty to a financial instrument fails to meet
its contractual obligations, and arises principally from the Group’s receivables from customers and financial assets. The
Group has procedures in place to manage credit risk and exposure to such risk is monitored on an ongoing basis.
The Group establishes an allowance for impairment that represents its estimate of incurred losses in respect of trade
and other receivables. This allowance is a specific loss component that relates to individually significant exposures. The
allowance account in respect of trade and other receivables is used to record impairment losses unless the Group is
satisfied that no recovery of the amount owing is possible. At that point, the financial asset is considered irrecoverable and
the amount charged to the allowance account is written off against the carrying amount of the impaired financial asset.
Cash and fixed deposits are placed with banks and financial institutions which are regulated. Investments and
transactions involving derivative financial instruments are restricted with counterparties who meet the appropriate
credit criteria and/or are of high credit standing. As such, management does not expect any counterparty to fail to
meet its obligations.
Ho Bee Land
116
Annual Report 2014
Notes to the Financial Statements
Year ended 31 December 2014
34
Financial risk management (cont’d)
Credit risk (cont’d)
Financial guarantee
The principal risk to which the Company is exposed to is credit risk in connection with guarantee contracts it has issued.
The credit risk represents the loss that would be recognised upon a default by the parties to which the guarantees were
given on behalf of. To mitigate these risks, management continually monitors the risks and has established processes
including performing credit evaluations of the parties it is providing the guarantee on behalf of. Guarantees are only
given to its subsidiaries, associate and jointly-controlled entities.
There are no terms and conditions attached to the guarantee contracts that would have a material effect on the
amount, timing and uncertainty of the Company’s future cash flows.
The intra-group financial guarantees with subsidiaries are eliminated in preparing the consolidated financial statements.
Estimates of the Company’s obligations arising from financial guarantee contracts may be affected by future events,
which cannot be predicted with any certainty. The assumptions may well vary from actual experience so that the actual
liability may vary considerably from the best estimates.
Liquidity risk
The Group actively manages its debt maturity profile, operating cash flows and the availability of funding to ensure
that all refinancing, repayment and funding needs are met. As part of its overall liquidity management, the Group
maintains sufficient level of cash or cash convertible investments to meet its working capital requirements. In addition,
the Group strives to maintain available banking facilities of a reasonable level compared to its overall debt position.
When necessary, the Group will raise committed funding from either the capital markets and/or financial institutions
and prudently balance its portfolio with some short term funding so as to achieve overall cost effectiveness.
Market risk
Market risk is the risk that changes in market prices, such as interest rates, foreign exchange rates and equity prices, will
affect the Group’s income or the value of its holdings of financial instruments. The objective of market risk management
is to manage and control market risk exposures within acceptable parameters, while optimising the return on risk.
Interest rate risk
The Group manages its interest rate exposure by actively reviewing its debt portfolio and switching to cheaper sources of
funding in a low interest rate environment to achieve a certain level of protection against interest rate hikes. Where appropriate,
the Group uses interest rate derivatives to hedge its interest rate exposure for specific underlying debt obligations.
Interest rate derivatives are used to manage interest rate risk, to the extent that the perceived cost is considered to
outweigh the benefit from the flexibility of variable rate borrowings, and the Group actively monitors the need and
timing for such derivatives.
Where used, interest rate derivatives are classified as cash flow hedges and stated at fair value within the Group’s
statement of financial position.
117
Notes to the Financial Statements
Year ended 31 December 2014
34
Financial risk management (cont’d)
Interest rate risk (cont’d)
Cash flow hedges
A subsidiary of the Group has entered into an interest rate swap in 2014 to fix the interest relating to the payment of
quarterly interest charges arising on the drawdown of term loan facility totaling $141,970,040, and designated this as
cash flow hedge. The risk being hedged was the variability of cash flows arising from movements in interest rates. The
hedge will be in place until the term loan matures in February 2019.
The cash flows will occur on a quarterly basis until the loan balance mature in February 2019 and this hedge which is
designated as a cash flow hedge, is considered to be highly effective. The carrying value of the hedging instrument
was restated to its fair value at each reporting date, with the effective portion of changes in fair value since inception
being taken to the hedging reserve. The gain recognized in the other comprehensive income in 2014 in respect of the
change in fair value of this hedging instrument was $351,000. There was no ineffectiveness recognized in the income
statement that arose from this cash flow hedge.
Foreign currency risk
The Group incurs foreign currency risk on transactions that are denominated in currencies other than the Singapore
dollar. The Group tries to maintain a natural hedge whenever possible, by borrowing in the currency of the country in
which the property or investment is located or by borrowing in currencies that match the future revenue streams to be
generated from its investments. The currencies giving rise to this risk are primarily the United States dollar (USD), British
pound (GBP) and Australian dollar (AUD). Exposure to foreign currency risk is monitored on an ongoing basis by the
Group to ensure that the net exposure is kept at an acceptable level.
The Group is also exposed to currency translation risk on its net investments in foreign operations. Such exposures are
reviewed and monitored on a regular basis.
In 2013, the Group’s non-current amount owing from a jointly-controlled entity, amounting to $69,718,000, which
was denominated in USD was hedged by a USD-denominated bank loan, which mitigated the currency translation
risk arising from the jointly-controlled entity. The loan was designated as a net investment hedge. As the hedging
instrument has expired in 2014, hedge accounting was discontinued during the year.
35
Financial instruments
Credit risk
Exposure to credit risk
The maximum exposure to credit risk is represented by the carrying amount of each financial asset in the statement of
financial position.
The Group’s credit risk is primarily attributable to trade and other receivables and financial assets. The Group’s
historical experience in the collection of accounts receivable falls within the recorded allowances. Due to these factors,
management believes that no additional credit risk is inherent in the Group’s trade receivables.
Ho Bee Land
118
Annual Report 2014
Notes to the Financial Statements
Year ended 31 December 2014
35
Financial instruments (cont’d)
Credit risk (cont’d)
Exposure to credit risk (cont’d)
At the balance sheet date, the Group has receivables due from jointly-controlled entities amounting to $270,391,000
(2013: $400,804,000) representing 81% (2013: 89%) of total gross trade and other receivables. Except for these
receivables, there was no concentration of credit risk.
Impairment losses
The ageing of trade receivables at the reporting date was:
Gross
Impairment
losses
Gross
Impairment
losses
Group
$’000
$’000
$’000
$’000
Not past due
24,945
−
7,825
−
419
−
12,716
−
16
−
75
−
64
34
113
16
25,444
34
20,729
16
Past due 0 – 30 days
Past due 31 – 120 days
More than 120 days past due
2014
2014
2013
2013
The movements in impairment loss in respect of trade receivables during the year are as follows:
2014
Group
2013
$’000
$’000
At 1 January
16
28
Impairment loss made/ (reversed)
18
(12)
At 31 December
34
16
Based on historical default rates and the Group’s assessment of the recoverability of amounts due from specific
customers, the Group believes that no impairment allowance is necessary in respect of trade receivables not past due
or past due not more than 120 days.
Receivables that were past due but not impaired relate to a wide range of customers for whom there has not been a
significant change in the credit quality. Based on past experience, management believes that no impairment allowance
is necessary and the balances are still considered fully recoverable.
119
Notes to the Financial Statements
Year ended 31 December 2014
35
Financial instruments (cont’d)
Liquidity risk
The following are the expected contractual undiscounted cash inflows/(outflows) of financial liabilities, including interest
payments and excluding the impact of netting agreements:
Carrying
amount
Group
2014
Non-derivative financial liabilities
Secured bank loans*
Amount due to jointly-controlled entity
Trade and other payables
2013
Non-derivative financial liabilities
Secured bank loans
Retention sums payable
Amount due to jointly-controlled entities
Trade and other payables
Company
2014
Non-derivative financial liabilities
Secured bank loans
Amounts due to subsidiaries
Amount due to jointly-controlled entity
Trade and other payables
2013
Non-derivative financial liabilities
Secured bank loans
Amounts due to subsidiaries
Amount due to jointly-controlled entities
Trade and other payables
Cash flows
Within
2 to 5 years
$’000
$’000
Contractual
cash flows
$’000
Within
1 year
$’000
More than
5 years
$’000
915,160
3,690
78,300
997,150
(983,989)
(3,690)
(78,300)
(1,065,979)
(180,588)
(3,690)
(78,300)
(262,578)
(803,401)
–
–
(803,401)
–
–
–
–
469,534
11,780
6,700
91,873
579,887
(487,438)
(11,780)
(6,700)
(91,873)
(597,791)
(380,950)
(11,780)
(6,700)
(91,873)
(491,303)
(106,488)
–
–
–
(106,488)
–
–
–
–
–
153,729
79,623
3,690
7,134
244,176
(153,978)
(79,623)
(3,690)
(7,134)
(244,425)
(153,978)
(79,623)
(3,690)
(7,134)
(244,425)
–
–
–
–
–
–
–
–
–
–
94,903
29,075
6,700
10,180
140,858
(95,118)
(29,075)
(6,700)
(10,180)
(141,073)
(95,118)
(29,075)
(6,700)
(10,180)
(141,073)
–
–
–
–
–
–
–
–
–
–
*
The contractual cashflow is net of the impact of interest rate swap.
For secured bank loans with no interest rate swap arrangements, the contractual cashflows includes the estimated
interest payments based on interest rates transacted in the 4th quarter of 2014.
Ho Bee Land
120
Annual Report 2014
Notes to the Financial Statements
Year ended 31 December 2014
35
Financial instruments (cont’d)
Currency risk
Exposure to currency risk
The Group’s significant exposures to foreign currencies other than the Company’s functional currency are as follows:
USD
Group
Financial assets
Trade and other receivables
Cash and cash equivalents
Loans and borrowings
2014
GBP
AUD
USD
2013
GBP
AUD
$’000
$’000
$’000
$’000
$’000
$’000
4,051
–
–
4,518
–
–
92,761
190,911
83,793
18,760
–
50,232
331
4,183
189
294
2,549
731
–
(441,150)
(54,009)
–
(146,776)
(46,958)
97,143
(246,056)
29,973
23,572
(144,227)
4,005
Company
19,665
182,654
75,973
18,760
–
50,232
Cash and cash equivalents
Trade and other receivables
–
–
–
1
–
–
Loans and borrowings
–
(108,609)
(45,119)
–
(47,945)
(46,958)
19,665
74,045
30,854
18,761
(47,945)
3,274
121
Notes to the Financial Statements
Year ended 31 December 2014
35
Financial instruments (cont’d)
Currency risk (cont’d)
Sensitivity analysis
The foreign currencies which the Group is significantly exposed to are USD, GBP and AUD. A strengthening of the
Singapore dollar against these foreign currencies at the reporting date would increase/(decrease) profit before income
tax by amounts shown below. This analysis assumes that all other variables, in particular, interest rates, remain constant.
Group
Profit before
income tax
31 December 2014
$’000
USD (10% strengthening of Singapore dollar)
(9,714)
GBP (10% strengthening of Singapore dollar)
24,606
AUD (10% strengthening of Singapore dollar)
(2,997)
31 December 2013
USD (10% strengthening of Singapore dollar)
(2,357)
GBP (10% strengthening of Singapore dollar)
14,423
AUD (10% strengthening of Singapore dollar)
(401)
Company
Profit before
income tax
31 December 2014
$’000
USD (10% strengthening of Singapore dollar)
(1,967)
GBP (10% strengthening of Singapore dollar)
(7,405)
AUD (10% strengthening of Singapore dollar)
(3,085)
31 December 2013
USD (10% strengthening of Singapore dollar)
(1,876)
GBP (10% strengthening of Singapore dollar)
4,795
AUD (10% strengthening of Singapore dollar)
(328)
A weakening of the Singapore dollar against the above currencies would have had the equal but opposite effect to the
amounts shown above, on the basis that all other variables remain constant.
Ho Bee Land
122
Annual Report 2014
Notes to the Financial Statements
Year ended 31 December 2014
35
Financial instruments (cont’d)
Interest rate risk
Profile
At the reporting date, the interest rate profile of the interest-bearing financial instruments was:
Group
Company
Carrying Amount
2014
Fixed rate instruments
Financial assets
2013
Carrying Amount
2014
2013
$’000
$’000
$’000
$’000
5,335
97,656
–
85,336
(141,970)
–
–
–
(136,635)
97,656
–
85,336
Financial assets
185,205
331,070
185,205
331,070
Financial liabilities
(915,160)
(469,534)
(153,729)
(94,903)
Effect of interest rate swap
141,970
–
–
–
(587,985)
(138,464)
31,476
236,167
Effect of interest rate swap
Variable rate instruments
Sensitivity analysis
Fixed rate instruments
The Group does not account for any fixed rate financial assets and liabilities at fair value through profit or loss, and the
Group does not designate derivatives (interest rate swaps) as hedging instruments under a fair value hedge accounting
model. Therefore a change in interest rates at the reporting date would not affect profit or loss.
123
Notes to the Financial Statements
Year ended 31 December 2014
35
Financial instruments (cont’d)
Interest rate risk (cont’d)
Variable rate instruments
For the interest rate swap and the other variable rate financial assets and liabilities, a change of 100 bp in interest rate at
the reporting date would increase/(decrease) amounts charged or credited to the income statement as shown below.
This analysis assumes that all other variables, in particular, foreign currency rates, remain constant.
Profit before income tax
Group
100 bp
increase
100 bp
decrease
(58,798)
58,798
(1,055)
1,055
3,148
(3,148)
2,362
(2,362)
$’000
$’000
31 December 2014
Variable rate instruments
31 December 2013
Variable rate instruments
Company
31 December 2014
Variable rate instruments
31 December 2013
Variable rate instruments
Estimation of fair values for financial assets and liabilities
A number of the Group’s accounting policies and disclosures require the determination of fair value for financial assets
and liabilities. Fair values have been determined for measurement and/or disclosure purposes based on the following
methods. When applicable, further information about the assumptions made in determining fair values is disclosed in
the notes specific to that asset or liability.
Valuation processes applied by the Group
The Group has an established control framework with respect to the measurement of fair values. This framework
includes a finance team that reports directly to the Chief Financial Officer, and has overall responsibility for all significant
fair value measurements, including level 3 fair values.
The following summarises the significant methods and assumptions used in estimating the fair values of financial
instruments of the Group and the Company.
Ho Bee Land
124
Annual Report 2014
Notes to the Financial Statements
Year ended 31 December 2014
35
Financial instruments (cont’d)
Estimation of fair values for financial assets and liabilities (cont’d)
Financial assets designated at fair value through profit or loss
The fair value of the Group’s and the Company’s financial assets designated at fair value through profit or loss, and
available-for-sale financial assets is determined by reference to their quoted bid price at the balance sheet date. If
a quoted market price is not available, the fair value of the financial assets is estimated using valuation techniques.
Valuation techniques include recent arm’s length prices, comparisons to similar instruments for which market observable
prices exist, valuation models or discounted cash flow techniques.
The fair value of the Group’s unquoted investments in private equity funds are determined based on quotations from
the fund managers.
It is not practicable to reliably estimate the fair value of unquoted available-for-sale financial assets due to the lack
of quoted market prices in an active market, significant range of reasonable fair value estimates, and the inability to
reasonably assess the probabilities of the various estimates.
Amounts due from/to subsidiaries, associate, jointly-controlled entities and non-controlling shareholders
The carrying values of amounts due from/to subsidiaries, associate, jointly-controlled entities and non-controlling
shareholders that reprice within six months of the balance sheet date approximate their fair values. Fair value is
calculated based on discounted expected future principal and interest cash flows. For non-interest bearing amounts,
the prevailing market interest rates of similar loans are used to discount the loans to subsidiaries and associate to arrive
at their fair values.
Interest-bearing bank loans (secured)
The carrying values of interest-bearing bank loans that reprice within six months of the balance sheet date approximate
their fair values. Fair value is calculated based on discounted expected future principal and interest cash flows.
Other financial assets and liabilities
The carrying amounts of financial assets and liabilities with a maturity of less than one year (including trade and other
receivables, cash and cash equivalents, and trade and other payables) approximate their fair values because of the
short period to maturity. All other financial assets and liabilities are discounted to determine their fair values.
125
Notes to the Financial Statements
Year ended 31 December 2014
35
Financial instruments (cont’d)
Interest rates used in determining fair values
The interest rates used to discount estimated cash flows, where applicable, are as follows:
2014
2013
Financial liabilities
1.3 – 4.6
1.6 – 4.3
Receivables
1.2 – 1.5
1.2 – 1.5
Payables
1.3 – 4.6
1.6 – 4.3
%
%
Fair values versus carrying amounts
The carrying amounts of the Group’s and the Company’s financial instruments carried at cost or amortised cost are not
materially different from their fair values as at 31 December 2014 and 2013.
Fair value hierarchy
The table below analyses financial instruments carried at fair value by valuation method. The different levels have been
defined as follows:
•
Level 1: quoted prices (unadjusted) in active markets for identical assets or liabilities;
•
Level 2: inputs other than quoted prices included within Level 1 that are observable for the asset or liability, either
directly (i.e., as prices) or indirectly (i.e., derived from prices);
•
Level 3: inputs for the asset or liability that are not based on observable market data (unobservable inputs).
Financial assets carried at fair value
Level 1
Level 2
Level 3
$’000
$’000
–
–
4,051
4,051
$’000
$’000
Total
Group
31 December 2014
Financial assets designated at fair value
through profit or loss
Interest rate swaps used for hedging
–
351
–
351
–
351
4,051
4,402
–
–
4,518
4,518
31 December 2013
Financial assets designated at fair value
through profit or loss
Ho Bee Land
126
Annual Report 2014
Notes to the Financial Statements
Year ended 31 December 2014
35
Financial instruments (cont’d)
Fair value hierarchy (cont’d)
Level 2 fair values
In 2014, the Group entered into an interest rate swap to hedge its interest rate exposure on its variable rate borrowings.
The interest rate swap is carried at fair value at each reporting date, based on broker quotes. Similar contracts are
traded in an active market and the quotes reflect the actual transactions in similar instruments. There are no significant
unobservable inputs in measuring the fair value.
Contract/
Notional
Amount
2014
Cash flow hedges – Interest rate swap
$’000
141,970
Group
Fair value
of Assets
(note 14)
$’000
351
127
Notes to the Financial Statements
Year ended 31 December 2014
35
Financial instruments (cont’d)
Fair value hierarchy (cont’d)
Level 3 fair values
The following table shows a reconciliation from the beginning balances to the ending balances for fair value
measurements in Level 3 of the fair value hierarchy:
Financial assets
at fair value
through
profit or loss
Group
1 January 2014
4,518
Fair value changes
(272)
Distribution income
118
Dividend income
Exchange gain recognised in profit or loss
Purchases
Settlements
31 December 2014
Total gain for the year included in profit or loss for assets held as at 31 December 2014
43
193
45
(594)
4,051
82
1 January 2013
3,438
Fair value changes
1,137
Distribution income
247
Exchange gain recognised in profit or loss
185
Dividend income
Purchases
Settlements
$’000
23
97
(609)
31 December 2013
4,518
Total gain for the year included in profit or loss for assets held as at 31 December 2013
1,592
Ho Bee Land
128
Annual Report 2014
Notes to the Financial Statements
Year ended 31 December 2014
35
Financial instruments (cont’d)
Fair value hierarchy (cont’d)
Level 3 fair values (cont’d)
Gain/(loss) included in profit or loss for the year (above) is presented in other income/other expenses as follows:
2014
2013
$’000
$’000
Fair value (loss)/gain
(272)
1,137
Distribution income
118
247
Other income
Dividend income
43
23
(111)
1,407
193
185
82
1,592
Other expense
Exchange gain recognised
Total gain included in profit or loss for the year
The fair value of financial assets designated at fair value through profit or loss has been measured at fair value as
determined by the investment manager or fund manager. Because of the inherent uncertainty of valuations of financial
assets, the estimated values may differ significantly from the values that would have been used had a ready market
for the securities existed, and the differences could be material. As such, these investments are valued at cost until
occurrence of a valuation event as defined below:
(a)
Buy-out/later stage investments for which subsequent rounds of financing are not anticipated: once the investment
has been held in the portfolio for one year, an analysis of the fair market value of the investment will be performed.
The analysis will typically be based on a discounted multiple of earnings, revenues, earnings before interest and taxes
(EBIT) or EBIT adjusted for certain non-cash changes (EBITDA) (depending on what is appropriate for that particular
company/industry). Valuations may also be based on pending sale or initial public offering prices.
(b) Private equity investments are initially valued based upon transaction price, with subsequent adjustments to
values which reflect the consideration of available market data, including primarily observations of the trading
multiples of public companies considered comparable to the privately held companies being valued. Valuations
are also adjusted to give consideration to the financial condition and operating results specific to the issuer. Any
investment in a privately-held company, suffering an impairment in its value is written down to anywhere from
75% to 100% of the carrying value of the investment depending on the severity of the situation.
(c)
Public stocks, not restricted to sale or transfer, are valued at the bid price on their principal exchange as of the
valuation date. If any listed security was not traded on such date, then the mean of the high bid and low ask prices
as of the close of such date is used. Public stocks restricted as to sale or transfer are discounted by analyzing the
nature and length of the restriction and the relative volatility of the market prices of such security.
Accordingly, the use of different factors or estimation methodologies may not be indicative of the amounts the private
equity funds could realise in a current market. However, these differences on the estimated fair values will not lead to
a significant effect on the Group’s financial statements.
129
Notes to the Financial Statements
Year ended 31 December 2014
35
Financial instruments (cont’d)
Financial instruments by category
Group
Loans and
receivables
Financial
assets at
fair value
through
profit or
loss
239,152
$’000
$’000
Financial
Availablefor-sale Fair value – liabilities at
amortised
hedging
financial
cost
assets instruments
Total
$’000
$’000
$’000
$’000
–
–
351
–
239,503
–
4,051
–
–
–
4,051
9,953
–
–
–
–
9,953
31 December 2014
Trade and other receivables*
Financial assets at fair value
through profit or loss
Cash and cash equivalents
Loans and borrowings
–
–
–
–
(915,160)
(915,160)
Trade and other payables
–
–
–
–
(81,990)
(81,990)
249,105
4,051
–
351
(997,150)
(743,643)
376,058
–
–
–
–
376,058
31 December 2013
Trade and other receivables*
Financial assets at fair value
through profit or loss
Cash and cash equivalents
Loans and borrowings
Trade and other payables
–
4,518
–
–
–
4,518
117,557
–
–
–
–
117,557
–
–
–
–
(469,534)
(469,534)
–
–
–
–
(110,353)
(110,353)
493,615
4,518
–
–
(579,887)
(81,754)
Ho Bee Land
130
Annual Report 2014
Notes to the Financial Statements
Year ended 31 December 2014
35
Financial instruments (cont’d)
Financial instruments by category (cont’d)
Financial assets
Financial
at fair value
liabilities at
through
Loans and
profit or loss amortised cost
receivables
Company
Total
$’000
$’000
$’000
$’000
212,245
–
–
212,245
337
–
–
337
–
–
(90,447)
(90,447)
31 December 2014
Trade and other receivables*
Cash and cash equivalents
Trade and other payables
Loans and borrowings
–
–
(153,729)
(153,729)
212,582
–
(244,176)
(31,594)
313,205
–
–
313,205
85,683
–
–
85,683
31 December 2013
Trade and other receivables*
Cash and cash equivalents
Trade and other payables
–
–
(45,955)
(45,955)
Loans and borrowings
–
–
(94,903)
(94,903)
398,888
–
(140,858)
258,030
*
Excludes prepayments, deposits paid to acquire residential properties and amounts whereby, in substance, are
part of the Group’s and the Company’s net investment in subsidiaries and jointly-controlled entities.
36
Operating segments
The Group has two reportable segments, as described below, which are the Group’s strategic business units. The strategic
business units offer different products and services, and are managed separately because they require different marketing
strategies. For each of the strategic business units, the Group’s CEO reviews internal management reports on at least a
monthly basis. The following summary describes the operations in each of the Group’s reportable segments:
•
Property investment
: The investment in properties.
•
Property development : The development and trading in properties.
Other segments include investing in quoted and unquoted securities and private equity funds and the discontinued
operations of the hotel. These segments do not meet any of the quantitative thresholds for determining reportable
segments in 2014 or 2013.
131
Notes to the Financial Statements
Year ended 31 December 2014
36
Operating segments (cont’d)
Information regarding the results of each reportable segment is included below. Performance is measured based on
segment gross profit, as included in the internal management reports that are reviewed by the Group’s CEO. Segment
gross profit is used to measure performance as management believe that such information is the most relevant in
evaluating the results of certain segments relative to other entities that operate within these industries.
(a)
Operating segments
2014
Turnover
Operating results
Sale of
development
properties
Rental
income
Others
$’000
$’000
–
99,601
–
99,601
7,406
79,130
–
86,536
$’000
$’000
Total
Other operating income
283,569
Other operating expenses
(24,080)
Profit from operations
346,025
Net finance costs
(18,014)
Share of loss of associates
(1,614)
Share of loss of jointly-controlled entities
(4,323)
Income tax expense
(7,371)
Profit from continuing operations, net of tax
314,703
Profit from discontinued operations, net of tax
(187)
Profit for the year
314,516
Other material non-cash items:
–
281,693
–
281,693
Reportable segment assets
- Fair value changes on investment properties
229,546
2,308,295
4,051
2,541,892
Investments in associates and jointly-controlled
entities
887,594
–
–
887,594
69,222
861,150
–
930,372
Reportable segment liabilities
Ho Bee Land
132
Annual Report 2014
Notes to the Financial Statements
Year ended 31 December 2014
36
Operating segments (cont’d)
(a)
Operating segments (cont’d)
2013
Turnover
Operating results
Sale of
development
properties
Rental
income
Others
$’000
$’000
108,646
30,698
–
139,344
23,739
22,400
–
46,139
$’000
$’000
Total
Other operating income
569,720
Other operating expenses
(19,553)
Profit from operations
596,306
Net finance costs
(1,177)
Share of loss of associates
(1,239)
Share of profits of jointly-controlled entities
13,355
Income tax expense
(4,263)
Profit from continuing operations, net of tax
602,982
Profit from discontinued operations, net of tax
3,234
Profit for the year
606,216
Other material non-cash items:
- Fair value changes on investment properties
–
493,084
–
493,084
Reportable segment assets
216,588
1,562,232
4,518
1,783,338
Investments in associates and jointly-controlled
entities
717,114
–
–
717,114
62,171
422,579
–
484,750
Reportable segment liabilities
133
Notes to the Financial Statements
Year ended 31 December 2014
36
Operating segments (cont’d)
(a)
Operating segments (cont’d)
Reconciliations of reportable segment assets and liabilities and other material items
2014
Assets
Total assets for reportable segments
Other assets
Investments in equity accounted investees
Total assets for discontinued operations
Other unallocated amounts
2013
$’000
$’000
2,537,841
1,778,820
4,051
4,518
887,594
717,114
–
1,148
254,942
490,884
3,684,428
2,992,484
930,372
484,750
–
–
Other unallocated amounts
138,248
159,983
Consolidated total liabilities
1,068,620
644,733
Reportable
segment totals
Unallocated
amounts
Consolidated
totals
Capital expenditure
–
17,813
17,813
Depreciation of property, plant and equipment
–
964
964
Capital expenditure
–
5,737
5,737
Depreciation of property, plant and equipment
–
866
866
Consolidated total assets
Liabilities
Total liabilities for reportable segments
Other liabilities
Other material items
$’000
$’000
$’000
2014
2013
Ho Bee Land
134
Annual Report 2014
Notes to the Financial Statements
Year ended 31 December 2014
36
Operating segments (cont’d)
(b) Geographical segments
The Group operates principally in Singapore.
In presenting information on the basis of geographical segments, segment revenue is based on the geographical
location of business. Segment assets are based on the geographical location of the assets.
$’000
China
$’000
United
Kingdom
Australia
Consolidated
total
74,262
50
25,232
57
99,601
2,055,460
430,001
620,113
1,795
3,107,369
132,456
21
6,779
88
139,344
1,618,471
441,293
147,646
1,899
2,209,309
Singapore
2014
Revenue
Non-current assets*
$’000
$’000
$’000
2013
Revenue
Non-current assets*
*
Excludes financial assets, other receivables and deferred tax assets.
The Group has a large and diversified customer base which consists of individuals and corporations. There was
no single customer that contributed 10% or more to the Group’s revenue.
37
Determination of fair values
A number of the Group’s accounting policies and disclosures require the determination of fair value, for both financial
and non-financial assets and liabilities. Fair values have been determined for measurement and/or disclosure purposes
based on the following methods. When applicable, further information about the assumptions made in determining
fair values is disclosed in the notes specific to that asset or liability.
Financial assets and liabilities
The valuation techniques and the inputs used in the fair value measurements of the financial assets and financial
liabilities for measurement and/or disclosure purposes are set out in note 35.
135
Notes to the Financial Statements
Year ended 31 December 2014
37
Determination of fair values (cont’d)
Investment properties
Investment properties are stated at fair value. External, independent valuation companies, having appropriate
recognised professional qualifications and recent experience in the location and category of property being valued,
value the Group’s investment property portfolio at each year end.
The fair values are based on market values, being the estimated amount for which a property could be exchanged
on the date of the valuation between a willing buyer and a willing seller in an arm’s length transaction after proper
marketing, wherein the parties had each acted knowledgeably. Such valuation is based on price per square metre for
the buildings derived from observable market data from an active and transparent market.
In the absence of a price per square metre for similar buildings with comparable lease terms in an active market,
the valuations are prepared by considering the estimated rental value of the property (i.e. the income approach). A
market yield is applied to the estimated rental value to arrive at the gross property valuation. When actual rents differ
materially from the estimated rental value, adjustments are made to reflect actual rents.
Valuations reflect, when appropriate, the type of tenants actually in occupation or responsible for meeting lease
commitments or likely to be in occupation after letting vacant accommodation, the allocation of maintenance and
insurance responsibilities between the Group and the lessee, and the remaining economic life of the property. When
rent reviews or lease renewals are pending with anticipated reversionary increases, it is assumed that all notices, and
when appropriate counter-notices, have been served validly and within the appropriate time.
Fair value hierarchy
Fair value and fair value hierarchy information on financial instruments are disclosed in note 35.
The table below analyses recurring non-financial assets carried at fair value. The different levels are defined as follows:
•
Level 1: quoted prices (unadjusted) in active markets for identical assets or liabilities;
•
Level 2: inputs other than quoted prices included within Level 1 that are observable for the asset or liability, either
directly (i.e., as prices) or indirectly (i.e., derived from prices);
•
Level 3: inputs for the asset or liability that are not based on observable market data (unobservable inputs).
Ho Bee Land
136
Annual Report 2014
Notes to the Financial Statements
Year ended 31 December 2014
37
Determination of fair values (cont’d)
Fair value hierarchy (cont’d)
Non-financial assets carried at fair value
Level 1
Level 2
Level 3
$’000
$’000
−
−
2,283,127
2,283,127
−
−
1,540,709
1,540,709
$’000
$’000
Total
Group
31 December 2014
Investment properties
31 December 2013
Investment properties
Level 3 fair values
The following table shows a reconciliation from the beginning balances to the ending balances for Level 3 fair
value measurements.
Investment
Properties
Group
1 January 2014
Additions
$’000
1,540,709
468,908
Gains and losses for the year
Changes in fair value
Movement in exchange rate
At 31 December 2014
281,693
(8,183)
2,283,127
137
Notes to the Financial Statements
Year ended 31 December 2014
37
Determination of fair values (cont’d)
Valuation techqniue and significant unobservable inputs
The following table shows the Group’s valuation techniques used in measuring the fair values of the investment
properties, as well as the significant unobservable inputs used:
Significant
unobservable
inputs
Inter-relationship between
key unobservable inputs and
fair value measurement
Country
Valuation technique
Singapore
Investment method which involves • Occupancy rates
the estimated annual net rental
(96% 2013: 91%)
income of the building at current • C a p i t a l i s a t i o n
rate after deducting all necessary
rates (4.25% - 5%,
outgoings and expenses capitalized
2013:4.5% - 5.5%)
at an appropriate rate of return to
arrive at the market value
The estimated fair value would
increase (decrease) if:
• The occupancy rates was
higher (lower);
• The capitalisation rate was
lower (higher).
United Kingdom
Direct comparison method involves Not applicable
the analysis of comparable sales of
similar properties and adjusting the
sale prices to that reflective of the
investment properties.
Not applicable
38
Accounting estimates and judgements
The Group makes estimates and assumptions that affect the reported amounts of assets and liabilities within the next
financial year. Estimates and judgements are continually evaluated and are based on historical experience and other
factors, including expectations of future events that are believed to be reasonable under the circumstances.
The Group believes the following critical accounting policies involved the most significant judgements and estimates
used in the preparation of the financial statements.
Impairment loss on trade receivables
The Group evaluates whether there is any objective evidence that trade receivables are impaired, and determines the
amount of impairment loss as a result of the inability of the debtors to make required payments. The Group bases
the estimates on the ageing of the trade receivables balance, credit-worthiness of the debtors and historical write-off
experience. If the financial conditions of the debtors were to deteriorate, actual write-offs would be higher than the
amount estimated.
Ho Bee Land
138
Annual Report 2014
Notes to the Financial Statements
Year ended 31 December 2014
38
Accounting estimates and judgements (cont’d)
Assessment of stage of completion and estimated total construction costs of development properties and
allowance for foreseeable loss on development properties
The Group recognises profits on development projects using the percentage of completion method for development
properties sold under normal payment scheme. The progress of construction is determined based on the certification
by an architect or a quantity surveyor of the stage of completion of the development project
The estimation of total project costs is based on historical experience and contractual arrangements with contractors/
suppliers. The estimated total costs for each project is reviewed on a regular basis by the Group to determine whether
any allowance for foreseeable loss is required to be set up. Actual costs could differ from the estimates.
Impairment loss on completed unsold development properties
Where necessary, allowance for impairment loss would be set up for estimated losses which may result from deterioration
in the estimated market values for unsold development properties. The Group estimates the level of allowance based
on the prevailing selling prices of the development properties or similar development properties within the vicinity at
the reporting date. In the absence of current prices in an active market, valuations are obtained from an external and
independent property valuer.
Valuation of investment properties
The fair values of investment properties are estimated based on valuations carried out by external and independent
property valuers, having appropriate recognised professional qualifications and recent experience in the location and
category of property being valued. The valuations reflect when appropriate, comparable sales of similar properties or
estimated market values based on projection of income and expense streams over period of leases, using market rates
of return.
Income taxes
Significant judgement is required in determining the capital allowances, taxability of certain income and deductibility
of certain expenses during the estimation of the provision for income taxes and deferred tax liabilities.
The Group exercises significant judgement to determine that the deferred tax assets are recognised to the extent that
it is probable that future taxable profits will be available against which temporary differences can be utilised.
139
Additional Information
As at 31 December 2014
a) Development Properties
Location
Land
Tenure
Description
Gross
Stage of
Site area Floor Area
(Sq m)
completion
(Sq m)
Expected
Date of
Completion
Group’s
effective
interest
Australia
1
Surfers Paradise, 223 apartments
Gold Coast
Freehold
25%
2,382
17,627 January 2016
100%
2
Broadbeach,
Gold Coast
Mixed use site
Freehold
-
11,342
73,723
-
100%
3
Ferny Avenue,
Gold Coast
Residential site
Freehold
-
1,055
6,858
-
100%
4
Doncaster,
Melbourne
185 apartments
Freehold
10%
5,475
18,766
April 2016
100%
b) Developed Properties
Location
Description
Land
Tenure
Type of
Development
Net
Lettable/
Saleable
Area
(Sq m)
Group’s
effective
interest
Singapore
1
Turquoise
Cove Drive, Sentosa Cove
48 apartments
Leasehold - 99 yrs
Residential
11,438
90%
2
Seascape
Cove way, Sentosa Cove
103 apartments
Leasehold - 99 yrs
Residential
26,209
50%
3
Cape Royale
Cove way, Sentosa Cove
302 apartments
Leasehold - 99 yrs
Residential
64,934
35%
Ho Bee Land
140
Annual Report 2014
Additional Information
As at 31 December 2014
c) Investment Properties
Location
Description
Land Tenure
Lettable
Area
(sq m)
Group's
effective
interest
Singapore
1
623A Bukit Timah Rd
SPC petrol station
Leasehold - 999 yrs
1,857
100%
2
Eastwood Centre
20 Eastwood Road
2 retail units
Leasehold - 99 yrs
972
100%
3
HB Centre I
12 Tannery Road
A block of 10-storey high-tech
industrial building
Freehold
7,662
100%
4
HB Centre 2
31 Tannery Lane
A block of 8-storey light industry Freehold
building
3,216
100%
5
Forte
29 New Industrial Road
A block of 8-storey high-tech
industrial building
9,128
100%
6
The Metropolis
Two office towers of 21 and 23
9 & 11 North Buona Vista Drive storeys with retail component
100,396
100%
Freehold
Leasehold - 99 yrs
London
1
Rose Court
2 Southwark Bridge Road
London SE 1
A block of 11-storey office
building
Freehold
14,623
100%
2
1 St Martin's Le Grand
London EC1A 4NP
A block of 11-storey office
building
Freehold
25,715
100%
3
60 St Martin's Lane
London WC2 4JS
A block of 6-storey office building Freehold
3,377
100%
d) Properties held for Sale
Location
Saleable
Area
(sq m)
Group's
effective
interest
Description
Land Tenure
1 apartment
Leasehold - 70 yrs
190
100%
2 apartments
Freehold
271
70%
Shanghai
1
Changyuan
888 Yu Yuan Road, Shanghai
London
1
Parliament View
1 Albert Embankment
London SE 1
141
Shareholdings Statistics
As at 17 March 2015
SHARE CAPITAL
Class of shares
Voting rights
- Ordinary shares with equal voting rights @
- On a show of hands: 1 vote for each member
- On a poll: 1 vote for each ordinary share
SHAREHOLDING HELD IN HANDS OF PUBLIC
Based on information available to the Company as at 17 March 2015, 24.19% of the issued ordinary shares of the Company
is held by the public and therefore, Rule 723 of the Listing Manual is complied with.
ANALYSIS OF SHAREHOLDINGS
Range of Shareholdings
No. of Shareholders
1 - 99
%
No. of Shares
12
0.16
100 - 1,000
2,624
35.80
2,614,706
0.37
1,001 - 10,000
3,733
50.94
17,143,497
2.44
934
12.74
50,229,705
7.14
26
0.36
633,349,807
90.05
7,329
100.00
703,338,000
100.00
10,001 - 1,000,000
1,000,001 and above
285
%
0.00
TOP 20 SHAREHOLDERS
No.
Name of Shareholder
1
Ho Bee Holdings (Pte) Ltd
2
Citibank Nominees Singapore Pte Ltd
3
DBS Nominees Pte Ltd
No. of Shares
%**
485,659,800
72.80
25,575,435
3.83
9,645,599
1.45
4
HSBC (Singapore) Nominees Pte Ltd
7,182,238
1.08
5
Estate Of Chua Pin Chong, Deceased
6,610,000
0.99
6
Raffles Nominees (Pte) Ltd
6,338,307
0.95
7
Lee Pineapple Company Pte Ltd
5,500,000
0.82
8
DBSN Services Pte Ltd
4,452,493
0.67
9
Chua Thiam Chok
4,265,000
0.64
10
Phillip Securities Pte Ltd
4,236,600
0.64
11
DB Nominees (S) Pte Ltd
4,214,050
0.63
12
BNP Paribas Nominees Singapore Pte Ltd
4,047,750
0.61
13
Nanyang Gum Benjamin Manufacturing (Pte) Ltd
3,988,000
0.60
14
Maybank Kim Eng Securities Pte Ltd
3,621,235
0.54
15
Yap Boh Sim
3,300,000
0.49
16
Bank of Singapore Nominees Pte Ltd
2,428,000
0.36
17
United Overseas Bank Nominees Pte Ltd
2,362,200
0.35
18
Woon Choon Leng Desmond
2,100,000
0.31
Ho Bee Land
142
Annual Report 2014
Shareholdings Statistics
As at 17 March 2015
TOP 20 SHAREHOLDERS (CONT’D)
No.
Name of Shareholder
No. of Shares
%**
19
Chua Wee-Chern
2,052,000
0.31
20
Hexacon Construction Pte Ltd
1,865,000
0.28
589,443,707
88.35
@
Ordinary shares purchased and held as treasury shares by the Company will have no voting rights. As at 17 March
2015, the Company has 36,186,100 shares held as treasury shares and this represents approximately 5.42% against
the total number of issued shares excluding treasury shares as at that date.
** The percentage is calculated based on the number of issued ordinary shares of the Company as at 17 March 2015,
excluding 36,186,100 shares held as treasury shares as at that date.
SUBSTANTIAL SHAREHOLDERS
Direct Interest
Substantial Shareholders
No. of Shares
%(1)
Ho Bee Holdings (Pte) Ltd
485,659,800
-
Mr Chua Thian Poh
Deemed Interest
No. of Shares
%(1)
72.80
1,414,000
(2)
0.21
-
487,073,800
73.01
(3)
Notes
(1)
Ho Bee Holdings (Pte) Ltd has a deemed interest in the 1,414,000 shares held by Kingdom Investment Holdings Pte. Ltd.
(2)
(3)
The percentage is calculated based on the number of issued shares of the Company as at 17 March 2015, excluding
36,186,100 shares held as treasury shares as at that date.
Mr Chua Thian Poh has a deemed interest in the 485,659,800 shares held by Ho Bee Holdings (Pte) Ltd and 1,414,000
shares held by Kingdom Investment Holdings Pte. Ltd.
143
Notice of Annual General Meeting
HO BEE LAND LIMITED
(Incorporated in the Republic of Singapore)
(Company Registration No. 198702381M)
NOTICE IS HEREBY GIVEN that the 27th annual general meeting of Ho Bee Land Limited (the “Company”) will be held at
NTU@one-north, Auditorium 302, 11 Slim Barracks Rise Level 3, Singapore 138664 on Tuesday, 28 April 2015 at 10.30 a.m.
to transact the following business:Ordinary Business
1.
To receive and adopt the audited financial statements for the financial year ended 31 December 2014 and the reports
of the directors and the auditors thereon. (Resolution 1)
2.
To declare a first and final one-tier tax exempt dividend of 5 cents per share for the financial year ended
31 December 2014. (Resolution 2)
3.
To approve directors’ fees of S$300,000 for the financial year ended 31 December 2014. (2013: S$300,000) (Resolution 3)
4.
To re-appoint Mr Ch’ng Jit Koon pursuant to Section 153(6) of the Companies Act, Chapter 50 as a director
to hold such office from the date of this annual general meeting until the next annual general meeting of
the Company. (Resolution 4)
5.
To re-appoint Mr Tan Eng Bock pursuant to Section 153(6) of the Companies Act, Chapter 50 as a director to hold such office
from the date of this annual general meeting until the next annual general meeting of the Company. (Resolution 5)
6.
To re-elect Mr Desmond Woon Choon Leng, a director who will retire by rotation pursuant to Article 104 of the
Company’s Articles of Association and who, being eligible, will offer himself for re-election. (Resolution 6)
7.
To re-elect Mr Bobby Chin Yoke Choong, a director who will retire by rotation pursuant to Article 104 of the Company’s
Articles of Association and who, being eligible, will offer himself for re-election. (Resolution 7)
8.
To re-appoint KPMG LLP as auditors of the Company and to authorise the directors to fix their remuneration. (Resolution 8)
Special Business
To consider and, if thought fit, to pass with or without any modifications, the following ordinary resolutions:9.
That authority be and is hereby given to the directors of the Company to:(a)
(i)
issue shares in the capital of the Company (“shares”) whether by way of rights, bonus or otherwise; and/or
(ii) make or grant offers, agreements or options (collectively, “instruments”) that might or would require
shares to be issued, including but not limited to the creation and issue of (as well as adjustments to)
warrants, debentures or other instruments convertible into shares,
at any time and upon such terms and conditions and for such purposes and to such persons as the directors
may in their absolute discretion deem fit; and
Ho Bee Land
144
Annual Report 2014
Notice of Annual General Meeting
(b) (notwithstanding the authority conferred by this resolution may have ceased to be in force) issue shares in
pursuance of any instrument made or granted by the directors while this resolution was in force,
provided that:(1)
the aggregate number of the shares to be issued pursuant to this resolution (including shares to be issued
in pursuance of instruments made or granted pursuant to this resolution), does not exceed 50% of the total
number of issued shares (excluding treasury shares) in the capital of the Company (as calculated in accordance
with sub-paragraph (2) below), of which the aggregate number of shares to be issued other than on a pro
rata basis to shareholders of the Company (including shares to be issued in pursuance of instruments made
or granted pursuant to this resolution) does not exceed 20% of the total number of issued shares (excluding
treasury shares) in the capital of the Company (as calculated in accordance with sub-paragraph (2) below);
(2)
(subject to such manner of calculation as may be prescribed by the Singapore Exchange Securities Trading
Limited (“SGX-ST”)) for the purpose of determining the aggregate number of shares that may be issued under
sub-paragraph (1) above, the percentage of issued shares shall be based on the total number of issued shares
(excluding treasury shares) in the capital of the Company at the time this resolution is passed, after adjusting for:(i)
new shares arising from the conversion or exercise of any convertible securities or share options or vesting
of share awards which are outstanding or subsisting at the time this resolution is passed; and
(ii)
any subsequent bonus issue, consolidation or subdivision of shares;
(3)
in exercising the authority conferred by this resolution, the Company shall comply with the provisions of the
Listing Manual of the SGX-ST for the time being in force (unless such compliance has been waived by the SGXST) and the Articles of Association for the time being of the Company; and
(4)
(unless revoked or varied by the Company in general meeting) the authority conferred by this resolution shall continue
in force until the conclusion of the next annual general meeting of the Company or the date by which the next annual
general meeting of the Company is required by law to be held, whichever is the earlier.
(Resolution 9)
10.That:(a)
for the purposes of Sections 76C and 76E of the Companies Act, Chapter 50 (the “Companies Act”), the
exercise by the directors of the Company of all the powers of the Company to purchase or otherwise acquire
issued ordinary shares in the capital of the Company (“shares”) not exceeding in aggregate the Prescribed
Limit (as hereinafter defined), at such price(s) as may be determined by the directors of the Company from time
to time up to the Maximum Price (as hereinafter defined), whether by way of:(i)
on-market purchase(s) (each a “Market Purchase”) transacted through the trading system of the
Singapore Exchange Securities Trading Limited (“SGX-ST”); and/or
145
Notice of Annual General Meeting
(ii)
off-market purchase(s) (each an “Off-Market Purchase”) effected otherwise than on the SGX-ST in accordance
with any equal access scheme(s) as may be determined or formulated by the directors of the Company as they
consider fit, which scheme(s) shall satisfy all the conditions prescribed by the Companies Act,
and otherwise in accordance with all other laws and regulations, including but not limited to, the provisions of
the Companies Act and listing rules of the SGX-ST as may for the time being be applicable, be and is hereby
authorised and approved generally and unconditionally (the “Share Buyback Mandate”);
(b)
unless varied or revoked by the Company in general meeting, the authority conferred on the directors of the
Company pursuant to the Share Buyback Mandate may be exercised by the directors at any time and from time to
time during the period commencing from the date of passing of this resolution and expiring on the earlier of:(i)
the date on which the next annual general meeting of the Company is held or required by law to be held;
(ii)
the date on which the purchases or acquisitions of shares by the Company pursuant to the Share Buyback
Mandate are carried out to the full extent mandated; or
(iii) the date on which the authority conferred by the Share Buyback Mandate is varied or revoked by
shareholders in a general meeting;
(c) in this resolution:“Average Closing Price” means the average of the closing market prices of a share over the last five market
days on which the transactions of the shares are recorded on the SGX-ST, preceding the day of the Market
Purchase, and deemed to be adjusted for any corporate action that occurs after the relevant five-day period;
“day of the making of the offer” means the day on which the Company announces its intention to make an
offer for the purchase of shares from shareholders of the Company stating the purchase price (which shall not
be more than the Maximum Price calculated on the basis herein stated) for each share and the relevant terms
of the equal access scheme for effecting the Off-Market Purchase;
“Highest Last Dealt Price” means the highest price transacted for a share recorded on the Market Day on
which there were trades in the shares immediately preceding the day of the making of the offer pursuant to the
Off-Market Purchase;
“Maximum Price” in relation to a share to be purchased or acquired, means the purchase price (excluding
brokerage, stamp duties, applicable goods and services tax and other related expenses) not exceeding:(i)
in the case of a Market Purchase, 105% of the Average Closing Price; and
(ii)
in the case of an Off-Market Purchase, 120% of the Highest Last Dealt Price; and
“Prescribed Limit” means the number of shares representing 5% of the total number of issued shares of the
Company as at the date of passing of this resolution (excluding any shares which are held as treasury shares as
at that date); and
Ho Bee Land
146
Annual Report 2014
Notice of Annual General Meeting
(d) the directors of the Company and/or any of them be and are hereby authorised to complete and do all such
acts and things (including executing such documents as may be required) as they and/or he may consider
expedient or necessary to give effect to the transactions contemplated and/or authorised by this resolution.
(Resolution 10)
11.
To transact any other business as may properly be transacted at an annual general meeting.
By Order of the Board
Tan Sock Kiang
Company Secretary
Ho Bee Land Limited
9 April 2015
Explanatory Notes and Statement Pursuant to Article 64 of the Company’s Articles of Association
Ordinary Resolution 3: This resolution is to seek approval for the payment of a total sum of S$300,000 as directors’ fees
for the financial year ended 31 December 2014 to be paid to the non-executive directors.
Ordinary Resolution 4: Mr Ch’ng Jit Koon will, upon re-appointment, remain a member of the Audit & Risk Committee
and a member of the Nominating Committee. He is considered an independent director. Key information on Mr Ch’ng is
set out on page 32 of the Annual Report.
Ordinary Resolution 5: Mr Tan Eng Bock will, upon re-appointment, remain a member of the Remuneration Committee.
He is considered an independent director. Key information on Mr Tan is set out on page 33 of the Annual Report.
Ordinary Resolution 6: Mr Desmond Woon Choon Leng is an executive director. Key information on Mr Woon is set out
on page 29 of the Annual Report.
Ordinary Resolution 7: Mr Bobby Chin Yoke Choong will, upon re-election, remain as the chairman of the Audit & Risk
Committee, a member of the Nominating Committee, and a member of the Remuneration Committee. He is considered
an independent director. Key information on Mr Chin is set out on page 31 of the Annual Report.
Ordinary Resolution 9: This resolution is to empower the directors from the date of this resolution being passed until the
date of the next annual general meeting of the Company, or the date by which the next annual general meeting is required
by law to be held or when varied or revoked by the Company in general meeting, whichever is the earlier, to issue shares or
to make or grant instruments convertible into shares, and to issue shares in pursuance of such instruments. The maximum
number of shares and instruments which the directors may issue shall not exceed the quantum set out in this resolution.
Ordinary Resolution 10: This resolution is to renew the Share Buyback Mandate, which was originally approved by
shareholders on 29 April 2008 and was last renewed at the annual general meeting of the Company held on 28 April 2014.
Please refer to the Appendix to this Notice of Annual General Meeting for details.
147
Notice of Annual General Meeting
Books Closure Date and Payment Date for Dividend
Subject to the approval of the shareholders for the proposed first and final one-tier tax exempt dividend being obtained
at the 27th annual general meeting, the register of members and the transfer book of the Company will be closed on 15 May 2015
for the purpose of determining shareholders’ entitlements to the proposed first and final dividend for the financial year
ended 31 December 2014.
Duly completed transfers received by the Company’s Share Registrar, M & C Services Private Limited at 112 Robinson Road
#05-01, Singapore 068902 up to 5.00 p.m. on 14 May 2015 will be registered before entitlements to the proposed first and
final dividend are determined.
Shareholders whose securities accounts with The Central Depository (Pte) Limited are credited with shares at 5.00 p.m. on
14 May 2015 will be entitled to the proposed first and final dividend.
The proposed first and final dividend, if approved by shareholders at the 27th annual general meeting will be paid on 29 May 2015.
Notes
A member entitled to attend and vote at the annual general meeting may appoint not more than two proxies to attend
and vote on his behalf. Where a member appoints more than one proxy, he shall specify the proportion of his shareholding
to be represented by each proxy. A proxy need not be a member of the Company. The instrument appointing a proxy or
proxies must be deposited at the office of the Company’s Share Registrar, M & C Services Private Limited at 112 Robinson
Road #05-01, Singapore 068902 not less than 48 hours before the time appointed for the meeting.
Personal Data Privacy
By submitting an instrument appointing a proxy(ies) and/or representative(s) to attend, speak and vote at the annual general
meeting and/or any adjournment thereof, a member of the Company (i) consents to the collection, use and disclosure
of the member’s personal data by the Company (or its agents or service providers) for the purpose of the processing
and administration by the Company (or its agents or service providers) of proxies and representatives appointed for the
annual general meeting (including any adjournment thereof) and the preparation and compilation of the attendance lists,
minutes and other documents relating to the annual general meeting (including any adjournment thereof), and in order
for the Company (or its agents or service providers) to comply with any applicable laws, listing rules, regulations and/or
guidelines (collectively, the “Purposes”), (ii) warrants that where the member discloses the personal data of the member’s
proxy(ies) and/or representative(s) to the Company (or its agents or service providers), the member has obtained the prior
consent of such proxy(ies) and/or representative(s) for the collection, use and disclosure by the Company (or its agents
or service providers) of the personal data of such proxy(ies) and/or representative(s) for the Purposes, and (iii) agrees that
the member will indemnify the Company in respect of any penalties, liabilities, claims, demands, losses and damages as a
result of the member’s breach of warranty.
This page has been intentionally left blank.
This page has been intentionally left blank.
This page has been intentionally left blank.
IMPORTANT
1. For investors who have used their CPF monies to buy Ho Bee Land Limited’s
shares, this annual report is forwarded to them at the request of their CPF
approved nominees and is sent solely FOR INFORMATION ONLY.
2. This proxy form is not valid for use by CPF investors and shall be ineffective
for all intents and purposes if used or purported to be used by them.
3. CPF investors who wish to vote should contact their CPF approved nominees.
HO BEE LAND LIMITED
(Incorporated in the Republic of Singapore)
Company Registration No. 198702381M
Personal Data Privacy
By submitting an instrument appointing a proxy(ies) and/or representative(s),
the member accepts and agrees to the personal data privacy terms set out in
the notice of annual general meeting dated 9 April 2015.
Annual General Meeting
Proxy Form
I/We
, NRIC/Passport no.
of
being a member/members of Ho Bee Land Limited (the “Company”) hereby appoint:
Name
Address
NRIC/ Passport
Number
Proportion of Shareholdings
No. of Shares
%
and/or (delete as appropriate)
as my/our proxy/proxies to attend and vote for me/us on my/our behalf and, if necessary, to demand a poll at the
27th annual general meeting of the Company to be held at NTU@one-north, Auditorium 302, 11 Slim Barracks Rise,
Level 3, Singapore 138664 on Tuesday, 28 April 2015 at 10.30 a.m. and at any adjournment thereof.
(Please indicate with an “X” in the spaces provided whether you wish your vote(s) to be cast for or against the resolutions
as set out in the notice of annual general meeting. In the absence of specific directions, the proxy/proxies will vote or
abstain as he/they may think fit, as he/they will on any other matter arising at the annual general meeting.)
No. Resolutions
Ordinary Business
1
To receive and adopt the audited financial statements for the financial year ended 31 December 2014
and the reports of the directors and the auditors thereon.
2
To declare a first and final one-tier tax exempt dividend of 5 cents per share for the financial
year ended 31 December 2014.
3
To approve directors’ fees of S$300,000 for the financial year ended 31 December 2014.
(2013: S$300,000)
4
To re-appoint Mr Ch’ng Jit Koon as director.
5
To re-appoint Mr Tan Eng Bock as director.
6
To re-elect Mr Desmond Woon Choon Leng as director.
7
To re-elect Mr Bobby Chin Yoke Choong as director.
8
To re-appoint KPMG LLP as auditors and to authorise the directors to fix their remuneration.
Special Business
9
To approve the authority to issue shares and make or grant instruments convertible into shares.
10 To approve the renewal of the Share Buyback Mandate.
Dated this
day of
For
2015
Total Number of Shares Held
Signature(s) of Member(s) or Common Seal
IMPORTANT
PLEASE READ NOTES OVERLEAF
Against
Notes
1
Please insert the total number of shares held by you. If you have shares entered against your name in the Depository
Register (as defined in Section 130A of the Companies Act, Chapter 50), you should insert that number. If you have
shares registered in your name in the Register of Members of the Company, you should insert that number. If you
have shares entered against your name in the Depository Register and shares registered in your name in the Register
of Members, you should insert the aggregate number. If no number is inserted, this form of proxy will be deemed to
relate to all the shares held by you.
2
A member entitled to attend and vote at a meeting of the Company is entitled to appoint not more than two proxies
to attend and vote on his behalf. A proxy need not be a member of the Company.
3
The instrument appointing a proxy or proxies must be deposited at the office of the Company’s Share Registrar,
M & C Services Private Limited at 112 Robinson Road #05-01, Singapore 068902 not less than 48 hours before the
time appointed for the meeting.
4
Where a member appoints more than one proxy, he shall specify the proportion of his shareholding to be represented
by each proxy. If no such proportion or number is specified the first named proxy may be treated as representing
100% of the shareholding and any second named proxy as an alternate to the first named.
5
The instrument appointing a proxy or proxies must be under the hand of the appointor or of his attorney duly
authorised in writing. Where the instrument appointing a proxy or proxies is executed by a corporation, it must be
executed under its common seal or under the hand of its attorney duly authorised.
6
Where an instrument appointing a proxy or proxies is signed on behalf of the appointor by an attorney, the power of
attorney (or other authority) or a duly certified copy thereof must (failing previous registration with the Company) be
lodged with the instrument of proxy, failing which the instrument may be treated as invalid.
7
A corporation which is a member may authorise by resolution of its directors or other governing body such person as it
thinks fit to act as its representative at the meeting, in accordance with Section 179 of the Companies Act, Chapter 50.
8
The Company shall be entitled to reject an instrument of proxy which is incomplete, improperly completed, illegible
or where the true intentions of the appointor are not ascertainable from the instructions of the appointor specified
on the instrument of proxy. In addition, in the case of shares entered in the Depository Register, the Company may
reject an instrument of proxy if the member, being the appointor, is not shown to have shares entered against his
name in the Depository Register as at 48 hours before the time appointed for holding the meeting, as certified by
The Central Depository (Pte) Limited to the Company.
153
154
HO BEE LAND LIMITED
(Company Registration No. 198702381M)
9 North Buona Vista Drive #11-01
The Metropolis Tower 1
Singapore 138588
Tel: +65 6704 0888
Fax: +65 6704 0800
www.hobee.com
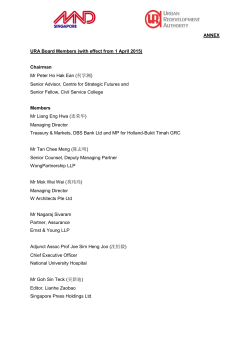
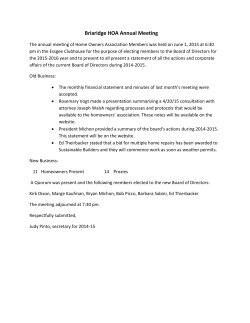


© Copyright 2026