
View the presentation slides - Institute for Governance and Policy
Presentation to public seminar:
Institute for Governance and Policy Studies,
Victoria University, Wellington
12.30PM, Tuesday 14 April 2015
Auckland Council
Fact and Fiction
Doug McKay, Former Chief Executive
Roger Blakeley, Chief Planning Officer
Local boards
Fiction: “Local boards have no voice or budget…”
Facts:
• Local boards have real power – negotiate local service standards,
manage local facilitates and parks, local events, local board plans,
local leadership, identify and propose local bylaws, input into CCO
and economic development plans, etc
• Local boards have a real budget – they have autonomous decisionmaking authority over one in every four dollars of council’s core
budget spent in their local area
• Local boards have a real voice – they meet collectively each month
to influence council’s region-wide decisions, they meet regularly with
the council’s CCOs and senior management, they develop local
boards plans, etc
• LG Act changed to build on lessons from Auckland’s Local Board
model
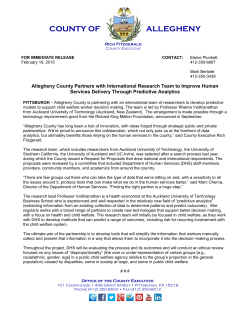
Rates
Fiction: “Higher rates than the previous councils…”
Facts:
• The average rate increase for the
eight years prior to amalgamation
was 5.7 percent
• Auckland Council inherited a rates
increase of more than 9 percent
and a proposed average annual
rates increase of 6 percent
• Rates increases reduced every
year to a low of 2.5 percent in
2014/15, among the lowest in the
country
• For the 2015 LTP period it is proposed to be 3.5 percent a year, well
below comparable figures for the pre-amalgamation councils
Efficiency Savings
Fiction: “Council is wasteful…”
Facts:
• In its first full year council achieved
$81 million worth of efficiency savings
• The following year a further $50 million
of savings were identified
• For the 2012-22 LTP period council
identified $1.7 billion of savings
• This has increased to $2.64 billion for
the next LTP 2015-25, or an average
of $264 million per year
• Every $14 million saved equals a one
percent rates reduction.
Staff Numbers
Fiction: “Council employs more staff than the former councils…”
Facts:
• FTEs have decreased from 9,430
pre-amalgamation to 8,825 for the
whole Group as at last annual
report
•
Changes in past four years driven
by population growth, new
projects, economic upturn and
insourcing
•
Last year staff core council numbers grew by 0.8% (Group
including CCOs grew by 3.8%) compared to local GDP growth of
2.8% and a regional population increase of 2.3%
Staff Costs
Fiction: “Staff costs have ballooned…”
Facts:
• Former councils’ staff
costs were $649m
(2009/10) compared to
$671m in 2014/15
• But when converted into
today’s dollars, Auckland
Council’s staff costs are
7.8 percent lower than the
former councils
•
Today’s
dollars
Since amalgamation, staff costs as a percentage of operating
expenses have remained at 22 percent. This is equal to, or
below, other comparable local authorities
Staff Salaries
Fiction: “Staff are paid too much…”
Facts:
• 12 percent of council staff earn
over $100,000 and 14 percent
within the wider Council Group
• Wage costs structures compare
favourably to other large
organisations - 22 percent for
Fonterra, 26 percent Air NZ, 28
percent for Fletcher and 37
percent for Spark (Telecom)
•
Scale and complexity are critical factors. Council’s three largest
CCOs combined are as big as Tauranga, Hamilton and Wellington
City Councils combined
Debt
Fiction: “Debt is bad and you are borrowing too much…”
Facts:
• Council has to invest to support
growth – large population increases
equivalent to the size of Hamilton
between 2010 and 2016
• Does not borrow to fund operating
costs
•
•
Value of council’s assets is growing faster than debt. Over next 10
years, average annual debt increases by $466 million per year, but
assets grow an average $1.7 billion per year
Auckland’s debt management is exemplary. Auckland’s AA credit
rating is a level below Government’s (AA+), and stronger than all
New Zealand banks
Council Controlled Organisations
Fiction: “They add no value…”
Facts:
• Originally established by government and council
happy with essential role CCOs perform:
• Auckland Transport delivers record PT increases
– PT patronage 77m passenger trips for the 12
months to Feb 2015, including a 20% increase in
rail patronage
• ATEED has developed Auckland as a global
visitor, sporting and event centre - Auckland is
now ranked the third best sporting city in the world
•
•
Waterfront Auckland has transformed Auckland’s central waterfront, which
has been embraced by the public and visitors and international awards.
In 2013, Watercare spent over $116 million to upgrade Franklin’s water
supply. The problems discovered in Franklin were typical of those for some
smaller councils where investment did not occur prior to amalgamation
Council Controlled Organisations
Watercare’s Water Tariffs
Estimated annual water bill for a residential
household using 600 litres per day
Previous councils
2010/11:
2014/15:
Previous council
Watercare tariff
water tariff per
per 1000 litres
1000 litres
Change to
volumetric
water price
since
amalgamation
Under 2010
tariffs
Change in
average
household’s
Under 2014 tariff
annual water
bill since
amalgamation
Rodney District
(Rural and Towns)
$3.50
$1.37
-61%
$1,010
$301
-70%
Rodney District
(Hibiscus Coast)
$1.96
$1.37
-30%
$510
$301
-41%
North Shore City
$1.52
$1.37
-10%
$333
$301
-10%
Waitakere City
$1.74
$1.37
-21%
$380
$301
-21%
Auckland City
$1.62
$1.37
-15%
$396
$301
-24%
Manukau City
$1.31
$1.37
5%
$286
$301
5%
Franklin City
$2.00
$1.37
-31%
$438
$301
-31%
City Regional Planning and Implementation
Fiction: “Creating a single unitary authority was unnecessary”
• Auckland Plan creates one single strategic spatial plan
for region – unachievable under old system
• Series of sub plans – Economic Development, Visitor
Strategy, Waste Management, etc
• Harmonising of bylaws (158 down to 30) and user
charges – gives certainty and simplicity
• Proposed Auckland Unitary Plan combined the previous
14 regional and district plans into one unitary plan
• 2015-25 Long-term Plan has allowed long term strategic
priority-setting for the Auckland city-region
Community engagement
Fiction: “Council is distant and doesn't listen…”
Facts:
• 15,000 Aucklanders helped write the Auckland Plan
• Unitary Plan largest statutory planning process in NZ’s history:
• broke records for engagement even before the traditional
consultation began
• 100,000 individuals visited website
• 21,000 items of feedback
• used social media: Facebook, Twitter, YouTube
• “International best practice in community engagement” Ann McAfee,
former Planning Director Vancouver
• SOLGM supreme award, NZPI best practice commendation
•
Draft 2015-25 Long-term Plan
• 27,000 submissions
• 172% increase on previous LTP three years ago
• major poll on alternative transport packages
Housing
Fiction: “Auckland Council is not alleviating the pressure…”
Facts:
• Building and resource consents volumes
have increased 38 and 22 percent, and
processed within 98 and 96 percent of
statutory timeframes
• Government and council working hand-inhand on affordable housing:
• dedicated Project Housing Office to give a
fast “one stop shop”
• 80 Special Housing Areas approved with potential yield of 40,000
dwellings or sites
• exceeded Housing Accord Target of 11,000 consented dwellings or sites
within Year 1 of Accord, and on track for target of 39,000 consented
dwellings or sites over three years of Accord
Working with Central Government
Fiction: “Council has a dysfunctional relationship with government…”
Facts:
• Under the previous councils, government had to speak to eight
council leaders with eight different points of view. Getting things
done was hard and mostly impossible
• Government can now pick up the phone and speak to one council
• Cabinet Ministers and councillors meet formally each year. Mayor
and PM have constant engagement. CE has regular engagement
with all relevant Ministers. The government has an Auckland Policy
Office and SSC has appointed a Deputy Commissioner for Auckland
• Government and council have successfully implemented joint
programmes – one network between NZTA and AT, the Southern
Initiative, the Auckland Housing Accord/Special Housing Areas, the
Maunga Authority, agreement to construct the City Rail Link, etc
Democracy
Fiction: “Auckland Council is awash with too many politicians…”
Facts:
• The number of elected members is set out in legislation. There are
92 fewer elected members than the former councils
Former Councils
Auckland Council
Councils
1 Regional
3 District
4 City
1 Council
Local
30 Community Boards
21 Local Boards
Mayor
7 Mayors and 1 Chair
1 Mayor
Councillors
109 Councillors
20 Councillors
Local
145 Community Board members
148 Local Board members
Total Elected
Members
261
169
How have we done?
Royal Commission Recommendation (Several Examples)
Achieved
“Auckland needs an overarching vision for the region”
Auckland Plan and Mayor’s Vision
“Auckland Council prepares a regional spatial plan”
Auckland Plan
“Auckland needs robust, considered and consistent planning to support the
region’s ongoing growth and development”
Auckland Plan, Proposed Unitary
Plan and harmonised bylaws
“The Auckland Council needs to deliver services in the most efficient and
cost-effective way”
Consistent ongoing savings and
Transformation Programme
“Auckland needs governance structures for economic development capable
of working effectively with central government”
ATEED
“There should be a City Centre and Waterfront Development Agency”
Waterfront Auckland and
Development Auckland from 9/15
“All Auckland Council’s major commercial trading and infrastructure activities
should be undertaken through CCOs”
ACIL, RFA, WSL, ACPL, WA and AT
“Auckland Council should consider creating an Urban Development Agency”
Development Auckland from 9/15
“A new Regional Transport Authority ("RTA") for Auckland should be
established as a council-controlled organisation”
AT
Any questions?


© Copyright 2026