
FSAU April 2007 Nutrition Update: Gedo Region Analysis
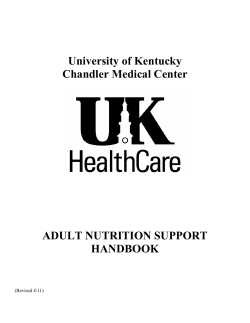
FSAU Monthly Nutrition Update April 2007
FSAU
Food Security Analysis Unit - Somalia
NUTRITION
UPDATE
G E N E R A L OV E RV I E W
FSAU
April 2007
(GAM) with 17.7% (15.3-20.4) GAM and 3.5% (2.5-5) Severe
Acute Malnutrition (SAM) in the Riverine population, 16.7%
(14.4-19.3) GAM and 3.1% (2.1-4.5) SAM in the Agropastoral
population and 19.9% (17.4-22.7) GAM and 2.6% (1.7-3.9)
SAM in the Pastoral population. Although a direct comparison
cannot be made to the most recent assessment conducted in
March 2006, where 23.8% (21.1-26.7) GAM was reported, as
the sample included the entire Gedo Region therefore mixing
all the livelihoods, some recovery has been noted. Crude
mortality rates were slightly above the alert threshold in all
three assessments.
o The impact of the recent conflict in Mogadishu continues,
with large numbers of internally displaced populations (IDP)
remaining throughout South and Central Zones. Current figures
estimate that a total of 393,4301 people have fled Mogadishu
since February 1st with an estimate of 8,200 returnees to
date to Mogadishu, predominantly from the Shabelle Regions.
Following concerns as to the nutrition status of the recently
arrived IDP population in Baidoa Town, a rapid assessment was
conducted in five camps2 hosting these populations, by FSAU
and partners from May 12th to 14th. The assessment involved
an exhaustive study using Mid Upper Arm Circumference, o WHO3 continue to report cases of Acute Watery Diarrhoea
(MUAC) of 1106 children aged 1-5yrs from 611 households. The
(AWD), with the latest figures from the period of January 1st
results indicated a very worrying situation with 18.6% of these
to May 11th estimating a total of 30,227 cases from Central
children classified as acutely malnourished (MUAC <12.5cm)
and Southern Zones including 973 related deaths. In the
including 4.3% classified as severely malnourished (MUAC
reported epidemiological week (week 19) the reported cases
<11cm). The results have been shared with partners on the
decreased by 24% in comparison with the previous week.
ground who are mobilising efforts to respond, however the lack
In addition the overall Case Fatality Rate (CFR) continues to
of facilities for the management of severe acute malnutrition
decrease from 4.3% in epidemiological week 14 to 1.26% in
in Baidoa is of great concern. These camps host both recent
the current reporting week (19).
IDPs (from February 1st ) and longer term IDPs (up to 10 months
ago), therefore both groups were included in the assessment, o Four nutrition assessments were conducted by FSAU
and partners in May in Southern Somalia. Two of these
however on desegregating the nutrition data by group, both
assessments were conducted in Lower and Middle Shabelle
were equally affected.
Regions; one to estimate the nutrition situation of the Riverine
o Three nutrition assessments were conducted in Gedo Region
population and one to estimate the nutrition situation of the
in April ’07 by FSAU and partners. The assessments were
Agropastoral population. The other two nutrition assessments
done at livelihood levels, representing the Riverine population,
were conducted in Burhakaba district, focusing on the Pastoral
Agropastoral population and Pastoral population. The results
population and the Agropastoral population. Results of all
indicated continuing critical rates of Global Acute Malnutrition
four assessments will be presented in next months Nutrition
Update.
SPECIAL FOCUS ON GEDO
3WHO Somalia, Acute Watery Diarrhoea Update, May 11th 2007
Map 1: Livelihood Zones Gedo Region
41°0'0"E
43°0'0"E
45°0'0"E
47°0'0"E
49°0'0"E
"
ZEYLAC
!
.BOSSASO
LASQORAY
"
ERIGABO
LUGHAYE "
Awdal
!
.
BERBERA
"
Sanag
BAKI
10°0'0"N
"
ALULA
KANDALA
Gulf of Aden
"
DJIBOUTI
"
Bari
BORAMA
Woq. Galbeed
!
.
" SHEIKH
ISKUSHUBAN
10°0'0"N
1 UNHCR figures, May 17th
2 Hanano, 11 January, Onod, ADC and BB1.
"
EL AFWEIN "
GEBILEY
"
!
.
!
.
HARGEYSA
BURAO
BANDAR BEYLA
" GARDO
"
"
OWDWEINE
HUDUN
TALEH
"
8°0'0"N
"
Sool
AINABA
"
!
.LAS ANOD
BUHODLE
!
.
GAROWE
"
EYL
Nugal
"
8°0'0"N
Togdheer
Context
" BURTINLE
JARIBAN
"
GOLDOGOB
"
ETHIOPIA
GALKAYO
!
.
6°0'0"N
"
" ADADO
!
. DUSAMAREB
6°0'0"N
Mudug
ABUDWAQ
Indian Ocean
HOBYO
"
Galgadud
BELET
"
!
. WEYNE
EL BARDE
"
"
!
.
HARADHERE
EL BUR
"
"
Hiran
HUDUR
4°0'0"N
4°0'0"N
Bakol
Rab
Dhuure
DOLO
TIEGLO
"
BELET XAWA
"
BULO BURTI "
WAJID
LUUQ
"
"
EL DER
"
ADAN YABAL
"
GARBAHAREY
JALALAQSI
"
!
.
BAIDOA
!
.
"
QANSAH
DERE "
BUR HAKABA
JOWHAR
"
Bay
Mahaday
Weyn
M. Shabelle
!
.
WANLA
WEYN
"
"
" BALAD
2°0'0"N
"
AFGOYE
"
"
/
National Capital
!
.
Regional Capital
MOGADISHU
"
/
L. ShabelleBanadir
QORYOLEY
"
KENYA
KURTUNWAAREY
" SAKOW
"
!
.MARKA
"
"
"
BRAVA
Regional Boundary
"
District Boundary
JILIB
"
"
Major Road
L. Juba
"
JAMAME
River
KISMAAYO
!
.
"
BADHADHE
District Capital
International Boundary
SABLALE
BU'AALE
!
.
Hagar
AFMADOW
40 20
0
±
40
Coastline
80
120
Datum:
WGS84
Data Source: Admin. layers: UNDP, 1998
160
Kilometers
41°0'0"E
LEGEND
ADALE
"
DINSOR
BARDERA
M. Juba
2°0'0"N
"
43°0'0"E
0°0'0"
Gedo
EL WAQ
0°0'0"
Gedo Region is located in the South West of Somalia (see Inset on
Map 1.) and borders Ethiopia to the North, Kenya to the West and
has an estimated population of 328,3784. Gedo Region comprises
of six districts (Luuq, Dolo, Belet Hawa, Garbaharey, El Wak, and
Bardera) with six main district capital urban centres. The main
rural livelihoods zones in Gedo Region are; 1) Bay Bakool Agro
Pastoral, 2) Dawa Pastoral, 3) Juba Pump Irrigation Riverine, 4)
Southern Agro Pastoral and 5) Southern Inland Pastoral (See Map
1). Following the collapse of the Somali Central Government in
1991, South and Central Somalia has been faced with a series of
disasters, both natural (floods and droughts) and man-made (poor
governance, sporadic armed conflict and widespread human
rights abuses). This series of shocks has particularly affected
Gedo Region and, with limited opportunity for the population to
recover between shocks, has lead to a chronic emergency situation
for parts of the population. This is illustrated in the series of
FSAU Integrated Phase Classification Maps from 2004 (see Map
Updated: May, 2007
45°0'0"E
47°0'0"E
49°0'0"E
4 Rural population estimates by region, UNDP. August 2005
The Nutrition Surveillance Project is managed by FAO, funded by USAID/OFDA
and receives support
from the EC
1
12°0'0
9°0'0"N
6°0'0"N
3°0'0"N
KENYA
0°0'0"
Kismayo
L. JUBA
Afmadow
41°0'0"E
Badhadhe
Dinsor
Jamaame
Jilib
Bu'aale
/
"
Afgoye
L. SHABELLE
44°0'0"E
Brava
Sablale
Jowhar
Cadale
Aden Yabal
Ceel Dheere
Ceel Bur
GALGADUD
MOGADISHU
BANADIR
Balcad
Harardheere
Hobyo
MUDUG
Jariiban
Eyl
Qardho
Moderate risk
2. For category explanations see http://www.fsausomali.org
47°0'0"E
50°0'0"E
NOTES:
1. Estimated populations do not include IDP or Urban estimates
Areas with IDP Concentrations
Sustained Phase 2 or 3 for > 3 yrs
High risk
Early Warning of worsening conditions:
6 Generally Food Secure
5 Chronic Food Insecurity
4 Alert
Calula
Bandar Beyla
3 Acute Food and Livelihood Crisis
2 Humanitarian Emergency
1 Famine
Phase classes
M. SHABELLE
Jalalaqsi
Bulo Barde
Wanle Weyne
Qoryoley
Kurtun Warrey Marka
Bur Hakaba
BAY
Baydhaba
Wajid
Qansax Dheere
M. JUBA
Sakow
Baardheere
Ceel Waq
GEDO
Luuq
HIIRAN
Beled Weyne
Cadaado
Galkacyo
NUGAL
Garowe
Talex
Burtinle
Laas Caanood
Dhusa Mareeb
Cabudwaaq
Xudun
SOOL
BARI
Iskushuban
Qandala
Bossaaso
Las Qoray/Badhan
SANAG
Ceerigaabo
Goldogob
Buuhoodle
Caynabo
Ceel Afweyne
ETHIOPIA
TOGDHEER
Burco
Sheikh
Berbera
Owdweyne
Tayeglow
BAKOOL
Ceel Barde
Hargeysa
Rab-Dhuure Xudur
Garbaharey
Beled Hawa
Dolo
Baki
Lughaye
Gulf of Aden
Gebiley W. GALBEED
Borama
AWDAL
Zeylac
DJIBOUTI
POST DEYR 2005/6 (JANUARY ‘06)
POST GU 2004 (JULY ‘04)
Dolo
9°0'0"N
GEDO
Kismayo
L. JUBA
Afmadow
Kismayo
L. JUBA
41°0'0"E
Baki
Lughaye
Ceel Barde
Hargeysa
BANADIR
MOGADISHU
Dinsor
Jamaame
Jilib
Bu'aale
NOTES:
1. Estimated populations do not include IDP or Urban estimates
Afgoye
/
"
44°0'0"E
Cadaado
Cadale
Aden Yabal
BANADIR
MOGADISHU
Indian Ocean
Eyl
Calula
Bandar Beyla
indicates severity
colour of diagonal lines
Updated: December, 2006
Datum:
WGS84
Data Source: FSAU, 2006
admin. layers:
UNDP, 1998
50°0'0"E
NOTES:
1. Estimated populations do not include IDP or Urban estimates, and are
rounded to the nearest 10,000
2. For category explanations see http://www.fsausomali.org
Sustained Phase 3 or 4 for > 3 yrs
Areas with IDP Concentrations
High Risk
Moderate Risk
Watch
Early Warning Levels for worsening Phase
5 Famine/Humanitarian Catastrophe
4 Humanitarian Emergency
3 Acute Food and Livelihood Crisis
2 Chronically Food Insecure
1 Generally Food Secure
Phase Classification
Legend
Harardheere
Hobyo
MUDUG
Jariiban
NUGAL
Garowe
Talex
Burtinle
Galkacyo
47°0'0"E
Ceel Dheere
Ceel Bur
GALGADUD
M. SHABELLE
Balcad
Wanle Weyne
Jowhar
Jalalaqsi
Bulo Barde
HIIRAN
Xudun
SOOL
Qardho
BARI
Iskushuban
Qandala
Bossaaso
Las Qoray/Badhan
SANAG
Laas Caanood
Dhusa Mareeb
Cabudwaaq
Moderate risk
Areas with IDP Concentrations
Sustained Phase 2 or 3 for > 3 yrs
High risk
Early Warning of worsening conditions:
6 Generally Food Secure
5 Chronic Food Insecurity
4 Alert
3 Acute Food and Livelihood Crisis
Ceerigaabo
Goldogob
Buuhoodle
Caynabo
Ceel Afweyne
ETHIOPIA
Beled Weyne
L. SHABELLE
Brava
Sablale
Burco
TOGDHEER
Qoryoley
Kurtun Warrey Marka
Bur Hakaba
BAY
Baydhaba
Berbera
Eyl
Calula
Bandar Beyla
2 Humanitarian Emergency
1 Famine
Phase classes
Harardheere
Hobyo
MUDUG
Jariiban
NUGAL
Garowe
Qardho
BARI
Iskushuban
Qandala
Bossaaso
2. For category explanations see http://www.fsausomali.org
47°0'0"E
50°0'0"E
M. SHABELLE
Balcad
Sheikh
Owdweyne
Tayeglow
BAKOOL
Wajid
Qansax Dheere
M. JUBA
Sakow
Afmadow
Badhadhe
Luuq
Aden Yabal
Ceel Dheere
Ceel Bur
GALGADUD
Cadale
Gulf of Aden
Gebiley W. GALBEED
Borama
AWDAL
Zeylac
Rab-Dhuure Xudur
Garbaharey
Baardheere
Ceel Waq
GEDO
Beled Hawa
Dolo
L. SHABELLE
44°0'0"E
Brava
Sablale
/
"
Afgoye
Qoryoley
Kurtun Warrey Marka
Bur Hakaba
Jowhar
Jalalaqsi
Bulo Barde
Wanle Weyne
Tayeglow
HIIRAN
Beled Weyne
Cadaado
Galkacyo
Burtinle
Laas Caanood
Dhusa Mareeb
Cabudwaaq
Xudun
SOOL
Talex
Las Qoray/
Badhan
SANAG
Ceerigaabo
Goldogob
Buuhoodle
Caynabo
ETHIOPIA
TOGDHEER
Owdweyne Burco
Ceel Afweyne
POST GU 2006 (JULY ‘06)
Jamaame
Jilib
Bu'aale
DJIBOUTI
41°0'0"E
Badhadhe
Dinsor
BAY
Baydhaba
Wajid
Qansax Dheere
M. JUBA
Sakow
Baardheere
Ceel Waq
Luuq
Garbaharey
Beled Hawa
BAKOOL
Ceel Barde
Hargeysa
Sheikh
Berbera
Gulf of Aden
W. GALBEED
Baki
Lughaye
Gebiley
Borama
AWDAL
Zeylac
Rab-Dhuure Xudur
DJIBOUTI
Oc
ea
n
ia n
In
d
6°0'0"N
3°0'0"N
0°0'0"
POST DEYR 2004/5 (JANUARY ‘05)
KENYA
Dolo
Luuq
GEDO
Dinsor
Dinsor
Hobyo
MUDUG
NUGAL
Eyl
Moderate risk
.
!
Kismayo
.
!
KISMAAYO
Jamaame
Jilib
BU'AALEBu'aale
Afgoye
/
"
L. SHABELLE
44°0'0"E
Brava
Sablale
Jalalaqsi
Bulo Barde
MOGADISHU
BANADIR
Balcad
Burtinle
Cadaado
Cabudwaaq
Ceel Dheere
Ceel Bur
47°0'0"E
Hobyo
MUDUG
Jariiban
Qardho
Bandar Beyla
Calula
Indian Ocean
Eyl
Iskushuban
BARI
indicates severity
Updated: January, 2007
Datum:
WGS84
Data Source: FSAU, 2006
Admin. layers: UNDP, 1998
50°0'0"E
NOTES:
1. Estimated populations do not include IDP or Urban estimates, and are
rounded to the nearest 10,000
2. For category explanations see http://www.fsausomali.org
Sustained Phase 3, 4 or 5 for > 3 yrs
Areas with IDP Concentrations
High Risk
Moderate Risk colour of diagonal lines
Early Warning Levels for worsening Phase
Watch
5 Famine/Humanitarian Catastrophe
4 Humanitarian Emergency
3 Acute Food and Livelihood Crisis
2 Chronically Food Insecure
1 Generally Food Secure
Phase Classification
Harardheere
GALGADUD
Dhusa Mareeb
.
!
NUGAL
!Garowe
.
GAROWE
Laas Caanood
.LAS ANOD
!
GALKAYO Galkacyo
DUSAMAREB
Aden Yabal
HIIRAN
. Weyne
!
Beled
.
!
Xudun
SOOL
Talex
Las Qoray/Badhan
SANAG
ERIGABO
!
.
Ceerigaabo
Goldogob
Buuhoodle
Caynabo
Ceel Afweyne
Qandala
BOSSASO
Bossaaso
.
!
51°0'0"E
NOTES:
1. Estimated populations do not include IDP or Urban estimates
2. For category explanations see http://www.fsausomali.org
Areas with IDP Concentrations
Sustained Phase 2 or 3 for > 3 yrs
High risk
Early Warning of worsening conditions:
6 Generally Food Secure
5 Chronic Food Insecurity
4 Alert
3 Acute Food and Livelihood Crisis
2 Humanitarian Emergency
1 Famine
Phase classes
Indian Ocean
Harardheere
48°0'0"E
Cadale
M. SHABELLE
Jowhar
.JOWHAR
Wanle Weyne !
Qoryoley
.
!
Kurtun Warrey Marka
Bur Hakaba
BAY
Baydhaba
.BAIDOA
!
Wajid
HUDUR
BAKOOL
Ceel Barde
TOGDHEER
Owdweyne
BURAO
!
.
Burco
Sheikh
Berbera
Gulf of Aden
ETHIOPIA
!
.
Hargeysa
HARGEYSA
GALBEED
Baki
!
.
Gebiley W.
BORAMA
Qansax Dheere
M. JUBA
Sakow
L. JUBA
Luuq
.
!
Garbaharey
Afmadow
41°0'0"E
45°0'0"E
L. SHABELLE
Lughaye
AWDAL
Zeylac
Borama
GARBAHAREY
Dolo
Baardheere
Badhadhe
Brava
Sablale
Rab-Dhuure Xudur
.
!
DJIBOUTI
GEDO
Ceel Waq
Jamaame
Jilib
Bu'aale
BANADIR
MOGADISHU
Balcad
/
"
Afgoye
Qoryoley
Kurtun WarreyMarka
Bur Hakaba
BAY
Aden Yabal
Ceel Dheere
Ceel Bur
GALGADUD
Cadale
Jowhar M. SHABELLE
Wanle Weyne
Jalalaqsi
Tayeglow Bulo Barde
HIIRAN
Beled Weyne
Cadaado
Dhusa Mareeb
!
!
! !!
!
!
!
!
!
Qardho
!
!
Bandar Beyla
!
!
!
!
!
Iskushuban
BARI
!
!!
!
!
!
!
!
!
!
!
!
!
!
!
Jariiban !
!!!
!!
!
!
Garowe
Talex
Burtinle
Laas Caanood
SOOL
Xudun
SANAG
Calula
51 0 0 E
Qandala
Bossaaso
CeerigaaboLas Qoray/Badhan
Goldogob
Galkacyo
Buuhoodle
Caynabo
Cabudwaaq
TOGDHEER
Owdweyne Burco
Ceel Afweyne
48 0 0 E
POST DEYR 2006/7 (JANUARY ‘07)
Beled Hawa
42°0'0"E
Badhadhe
Kismayo
L. JUBA
Afmadow
M. JUBA
Ceel Barde
BAKOOL
Baydhaba
Qansax Dheere
Sakow
Baardheere
Ceel Waq
Hargeysa
ETHIOPIA
Wajid
Berbera
Gulf of Aden
GALBEED Sheikh
Baki
Lughaye
GebileyW.
Borama
AWDAL
Zeylac
45 0 0 E
POST GU 2005 (JULY ‘05)
Rab-Dhuure Xudur
DJIBOUTI
Beled Hawa
Garbaharey
42 0 0 E
TIME-SERIES OF THE INTEGRATED PHASE CLASSIFICATIONS (IPC) MAPS FOR SOMALIA 2004 – 2007
In
d
ia n
Oc
ea
n
12°0'0
9°0'0"N
6°0'0"N
3°0'0"N
0°0'0"
KENYA
9°0'0"N
6°0'0"N
3°0'0"N
KENYA
0°0'0"
12°0
9°0'0"N
6°0'0"N
3°0'0"N
0°0'0"
12°0'0
9°0'0"N
KENYA
12°0'0
9°0'0"N
6°0'0"N
3°0'0"N
0°0'0"
6°0'0"N
3°0'0"N
0°0'0"
12°0'0
9°0'0"N
6°0'0"N
3°0'0"N
0°0'0"
Tayeglow
12°0'0
9°0'0"N
6°0'0"N
3°0'0"N
2
0°0'0"
FSAU
FSAU Monthly Nutrition Update April 2007
FSAU Monthly Nutrition Update April 2007
FSAU
For Somalia the use of weight for height expressed in Z scores
to estimate prevalence of acute malnutrition, were introduced in
1995 by Action Contre La Faim (ACF) and Chart 2 illustrates
the trends of acute malnutrition from 1995 to current time using
Z scores and the standard 30x30 two-stage cluster sampling
methodology. What is very clear here is the persistently high
levels of GAM reported from the assessments conducted from
1995 to current time irrespective of the location or the season.
Series Pg 2.) which indicates the persistence of a Humanitarian
Emergency for the affected population in Gedo Region from
2004 into 2007. This is further illustrated by the purple outline
which highlights a sustained IPC Phase 3 or 4 (Acute Food and
Livelihood Crisis/Humanitarian Emergency) for >3 years.
Although the numbers of affected population in Humanitarian
Emergency have reduced over the last year, following the end
of the severe drought of 2005, due to other underlying chronic
vulnerabilities of the affected population, this has prevented any
significant recovery in the nutrition situation.
Chart 2: Trends in Acute Malnutrition 1995 to 2007, Gedo Region
Expressed in Z Scores (<-2 Z Scores WHZ)
40%
Due to the persisting Humanitarian Emergency for the affected
population in Gedo Region, this update aims to provide a summary
of the trends in the humanitarian situation from the early 1990’s
to current time to explore some of the potential contributing
factors.
35%
30%
25%
20%
15%
10%
5%
Flash Floods, Bardera, May ’05
35%
30%
25%
20%
15%
10%
El Wak
G/Harey
B/Hawa
Bardera
GarbaHarey
Bardera
B/Hawa
El Wak,
Bardera,
G/harey
Luuq,
G/Harey
B/Hawa
Luuq,
G/Harey
Gedo
region
Luuq
5%
0%
Jan-88 Apr-88
Jul-88
Jan-93
Oct-94
Nov-95
Jul-96
Gedo
Pastoral
Gedo
Riverine
Gedo
Agropastoral
Bardera
Town
Luuq
Gedo Region
B/Hawa
Again, although a direct comparison between assessments is
not possible due to the varying location and timings of the
assessments, these trends illustrate the persistence of a critical
nutrition situation with results of >15% GAM, the emergency
threshold, (as is illustrated graphically in chart 2) being reported
throughout. However it is also important to highlight that it is
not possible to directly compare the assessment results reporting
prevalence of global acute malnutrition in % of the reference
median (WHM) and Z Scores (WHZ) as different estimates on
the same population will be recorded. Therefore Charts 1 and
Chart 2 cannot be compared.
40%
May-87 Nov-87
B/Hawa
B/Hawa
Nov- Dec- Dec- Apr- Apr- May- Sep- Oct- Apr- May- Sep- Dec- Oct- Oct- Mar- Apr- Apr- Apr- Apr95
99
99
00
00
00
00
02
00
00
00
01
02
04
06
06
07
07
07
Chart 1: Trends in Acute Malnutrition 1980 to 1996, Gedo Region
Expressed in % of the Reference Median (<80%WHM)
1980
Burdhubo
B/Hawa
Luuq IDPs
B/Hawa
Burdhubo
Luuq IDPs
Luuq Town
Bardera
Town
Bardera
District
The nutrition situation has been recorded in Gedo Region from
as far back as 1980, when the Centre for Disease Control (CDC)
Atlanta, conducted a nutrition survey in Luuq district with the
then existing Ministry of Heath. From 1980 to 1988 nutrition
assessments conducted in Gedo Region indicated varying levels
of Global Acute Malnutrition (GAM) below 15% (WHM< 80%
or oedema) indicating a worrying nutrition situation. The standard
30x30 two-stage cluster sampling method is referred to in all these
assessments. However following the collapse of the government
in the early nineties and the subsequent conflict, the nutrition
situation indicated a severe deterioration recording extremely high
levels of GAM in January 1993 (Bardera) at 38% and July 1996
(Belet Hawa) at 37% (See Chart 1). One very important point
to note is that pre 1992 all nutrition surveys conducted estimated
prevalence of acute malnutrition based on % of the reference
Median. The concept of Z Scores, which estimated prevalence
of acute malnutrition based on standard deviations from the
norm, were introduced by WHO globally in 1992. Therefore the
application of the >15% Global Acute Malnutrition threshold
to classify an emergency nutrition situation is only relevant for
nutrition surveys conducted using the Z score reference. It is
also of note that while the timing and location of the nutrition
assessments presented are not directly comparable, however,
these trends from 1980 to 1996 are very useful in highlighting a
more stable nutrition situation in the 1980’s with extremely high
levels recorded in some parts of the region following the collapse
of the Government.
Luuq Town
0%
Historical Nutrition Situation
Dry Pasture, Garbaharey, Dec ’05
3
FSAU Monthly Nutrition Update April 2007
FSAU
The below table summarises the timeline of recorded events based on the existing data available to FSAU from 1991 which may
have contributed to the persistent critical nutrition situation.
Table 1: Historical Timeline of Events in Gedo from 1991 to Current
Year
Events and Potential Risk Factors for Acute Malnutrition
Nutrition Status Outcome
1991
•
Nutrition data not available this year
for Gedo
•
•
Collapse of the Somalia Central Government and with it governance
problems and sporadic armed conflict in Gedo Region. This led to
widespread human rights abuses, interruption to normal livelihood practices
and reduced access to food and health care services.
Beginning of drought conditions reported in parts of South and Central
Somalia following very poor rainfall leading to livestock deaths (lack of milk
and milk products for consumption) and crop failure.
Massive displacement of people within Somalia and across the border into
refugee camps in Kenya in search of assistance
(Source: Inter Agency Assessment Gedo Region, February-April 2000; GHC, Gedo
Regional Health Program – GRH, Progress Report for Jul04-Dec05)
1992
early
1993
•
•
•
•
•
Ongoing insecurity across region threatens access for humanitarian actors
‘Operation Restore Hope’ commences in December 1992 in Somalia
Drought and Famine conditions continue in the South. Total collapse of
livelihoods following high numbers of internally displaced populations and
continuing failed rainfall contributing to further livestock deaths (lack of milk
and milk products for consumption) and crop failure.
Trocaire (INGO) commences emergency health care, SFP/TFP, food aid,
EPI, rehabilitation of health facilities, water and sanitation and agricultural
activities in Gedo in September
FSAU Baseline Profile: A bad year
•
Famine
conditions
and
starvation reported in parts of
Southern Somalia illustrated by
Jan ’93 Bardera Nutrition
Assessment (CDC, UNICEF,
CPH) which reported a GAM of
38% (WHM<80% or oedema)
(Sources: Inter Agency Assessment Gedo Region, February-April 2000;
GHC, Gedo Regional Health Program – GRH, Progress Report for Jul04-Dec05)
FSAU Food Economy Zones Profiles, 2001-2002)
Mid –
End
1993
•
•
•
UNOSOM takes over from ‘Operation Restore Hope’ in May, enabling
humanitarian food assistance to commence in Southern Somalia, including
Gedo region.
Improved rainfall leading to increased production in both agriculture and
livestock sectors
FSAU Livelihood Profile: A normal-good year
Nutrition data not available this year
for Gedo
(Sources: Inter Agency Assessment Gedo Region, February-April 2000;
GHC, Gedo Regional Health Program – GRH, Progress Report for Jul04-Dec05;
FSAU Food Economy Zones Profiles, 2001-2002)
1994
•
•
•
•
•
UNOSOM continue presence in Somalia
The Somali Aid Coordination Body established to coordinate humanitarian
response in Somalia
WFP commences Food for Work projects in Gedo Region
Medium rains, pasture available and livestock conditions good, prices normal
FSAU Baseline Profile: A normal year
•
October 1994 Garbaharey
Nutrition Assessment (UNICEF):
GAM of 6.0% (WHM<80% or
oedema):
•
AICF Nov 1995 Bardera Town,
Rural Areas, IDPs Nutrition
Assessment: GAM of 17%
(WHM<80% or oedema)
•
Trocaire, AMREF, Memisa July
1996 Belet Hawa Nutrition
Assessment: GAM of 37%
(WHM<80% or oedema)
(Sources: Inter Agency Assessment Gedo Region, February-April 2000;
GHC, Gedo Regional Health Program – GRH, Progress Report for Jul04-Dec05;
FSAU Food Economy Zones Profiles, 2001-2002)
1995
•
•
•
1996
•
•
•
•
UNOSOM withdraws from Somalia due to heightened insecurity.
Gu & Deyr rainfall failure causing crop failure and poor livestock condition
FSAU Baseline Profile: A bad year
(Source: FSAU Food Economy Zones Profiles, 2001-2002)
Southern Somalia is classified as a humanitarian emergency zone by the UN
Appeal for 1996/97
Insecurity in Bay Bakool leads to in-migration of IDPs to Luuq
Improved rainfall in Gu and Deyr leading to good crop and livestock
production
A cholera outbreak in Mandera affects Belet Hawa District
(Sources: Inter Agency Assessment Gedo Region, February-April 2000;
GHC, Gedo Regional Health Program – GRH, Progress Report for Jul04-Dec05)
4
FSAU Monthly Nutrition Update April 2007
1997
•
•
•
•
•
FSAU
El-Nino rains in Gedo Region, increasing water and pasture availability and
resulting in good livestock production except for camels which were lost in
high numbers due to a camel disease
The persistently heavy rains cause serious floods, deaths and extensive
damage to infrastructure and property. Hundreds of thousands of people are
displaced and important crop and livestock losses reported. Flood recession
commences towards the end of the year.
Communicable disease outbreaks mainly, malaria and acute watery
diarrhoea, causing high mortality
Belet Hawa Hospital opened by Trocaire in December
FSAU Baseline Profile: A bad year
Nutrition data not available this year
for Gedo
(Sources: Inter Agency Assessment Gedo Region, February-April 2000;
GHC, Gedo Regional Health Program – GRH, Progress Report for Jul04-Dec05;
FSAU Food Economy Zones Profiles, 2001-2002)
1998
•
•
•
•
Rift valley fever outbreak in Gedo following El-Nino floods
The Saudi Arabia government, the main importer of Somalia’s livestock
imposes a ban due to RVF. This leads to reduced income access options for
Somalia including Gedo Region
Pasture and water availability normal
High levels of pregnancy (and anaemia) related maternal deaths reported in
8 health posts
Nutrition data not available this year
for Gedo
(Sources: Inter Agency Assessment Gedo Region, February-April 2000; Trocaire
Rehabilitation &Development Program, End of Assignment report 1994-2001, Kathleen
Fahy)
1999
•
•
•
•
•
•
Poor rainfall leading to low livestock prices and high cereal prices. This leads
to unusual out-migration of livestock to riverine areas for water and pasture
Household food availability is below normal.
CARE commences targeted general food distribution in four districts of Gedo
Region: Luuq, El Wak, Belet Hawa and Dolo
There is reported influx of IDPs from Bakool in Luuq town. CARE food
distributions in the North have improved food availability, however in the
South, food is generally very scarce as no distribution has been undertaken
A cholera outbreak reported in Bardera with 1169 cases and Case Fatality
Rate of 3%; low measles vaccination coverage of 8.2%
FSAU Baseline Profile: A bad year
•
UNICEF Dec 1999 Bardera
Town Nutrition Assessment:
GAM of 23% (WHZ< -2 or
oedema)
•
ACF rapid assessment of 243
households in Luuq IDP Camp
in December 1999 indicates
57.2% of population at risk of
mortality in addition to a
mortality rate of 10.6/10,000/day
•
ACF April 2000 Luuq Town
Nutrition Assessment: GAM of
8.8% (WHZ< -2z or oedema)
ACF Luuq IDPs Apr 2000
Nutrition Assessment: GAM of
14.9% (WHZ < -2 or oedema)
UNICEF May 2000 Belet Hawa
Nutrition Assessment: GAM of
21.5% (WHZ < -2 or oedema)
UNICEF September 2000
Burdhubo Nutrition Assessment:
GAM of15% (WHZ < -2 or
oedema)
(Sources: Inter Agency Assessment Gedo Region, February-April 2000; GHC, Gedo
Regional Health Program – GRH, Progress Report for Jul04-Dec0; FSAU Food
Economy Zones Profiles, 2001-2002)
2000
•
•
•
•
•
•
Security conditions better than usual
Good livestock condition at favourable market prices. However, there is a
sustained livestock ban imposed by the gulf countries in 1998 on Somali
livestock due to Rift Valley Fever (RVF)
Humanitarian food assistance provided by CARE in Luuq, El Wak, Belet
Hawa and Dolo
A joint Assessment conducted in Gedo by a UN Mission (led by
FSAU/UNCU) estimates 74-97,000 people to be food insecure in parts of
Gedo with the situation likely to deteriorate. These are mostly from the poor
wealth groups who have limited access to food.
ACF opens a feeding centre in Luuq District in February, insecurity in Gedo
having contributed to a one year delayed start.
FSAU Baseline Profile: A bad year
•
•
•
(Sources: Inter Agency Assessment Gedo Region, February-April 2000;
GHC, Gedo Regional Health Program – GRH, Progress Report for Jul04-Dec05)
FSAU Food Economy Zones Profiles, 2001-2002)
2001
•
•
•
•
•
The GU’01 rains commence on time in southern Gedo and are average. In
northern Gedo, they commence late and are poor.
Devaluation of the Somali shilling in April 2001 leads to increased prices both
for essential and imported foods, across all livelihood zones
Conflict in the northern part of Gedo Region leads to out migration to
Mandera (Kenya), Bardera and El Wak
Formation of the Gedo Health Consortium (of three agencies Trocaire-Lead
agency, AMREF, CORDAID) in April 2001; supporting 3 hospitals, 5 outpatient departments, 3 TB treatment centres and 36 health posts in 5 districts
(Burdhubo, Garbaharey, Belet Hawa, Dolo and Luuq).
FSAU Baseline Profile: A very bad year
(Sources: Inter Agency Assessment Gedo Region, February-April 2000;
GHC, Gedo Regional Health Program – GRH, Progress Report for Jul04-Dec05)
FSAU Food Economy Zones Profiles, 2001-2002)
5
•
FSAU/UNICEF/CARE/GHC
Belet Hawa District Dec ’01
Nutrition Assessment; GAM of
37.1% (WHZ < -2 or oedema)
FSAU Monthly Nutrition Update April 2007
FSAU
2002
•
Poor Gu and Deyr rains lead to significant crop failure and out-migration of
livestock in search of water and pasture. There is significant loss of assets
especially in the poor wealth groups
•
Fighting breaks out in Luuq in October leaving about 100 dead or injured;
increased tension in Gedo, blocked routes in parts of northern Gedo, limiting
access to food and health care services
•
Food availability improves in southern Gedo as WFP conducts general food
distribution
•
FSAU/GHC/CARE/WHO Belet
Hawa District Oct ’02 Nutrition
Assessment: GAM of 21.7%
(WHZ < -2 or oedema)
(Source: FSAU Monthly Reports, Oct’02, Jan & Feb’03)
•
GHC January-December 2002 health report
A diarrhoea outbreak reported in Garbaharey Paediatric Hospital. GHC
commences therapeutic and supplementary feeding programs in January in
Belet Hawa and Garbaharey districts
(Source: GHC, Therapeutic Feeding Program Annual Report 2002)
2003
•
•
•
•
2004
•
•
The overall food security situation is below normal following poor Gu rains.
The situation however improves with Deyr ’03/04 rains
Subsequently, poor households from all livelihood zones in Northern Gedo
have limited assets and income options and therefore face difficulties in
accessing food.
Therapeutic and supplementary feeding programs by GHC on-going in Belet
Hawa and Garbaharey districts
A measles outbreak in South and Central hits Gedo Region’s Belet Hawa,
Garbaharey, Burdhubo in April May
No Nutrition Assessment conducted
this year in Gedo
•
FSAU Rapid assessment in
Burdhubo Town indicates 13.5%
with MUAC<12.5 cm (N=67
children aged 12-59 months) in
October
•
FSAU/UNICEF/SRCS Luuq Oct
2004 Nutrition Assessment
GAM of 25.4% WHZ < -2 or
oedema
(Sources: FSAU Monthly reports August-December 2003;
GHC, Gedo Regional Health Program Progress Report for Jul04-Dec05)
The FSAU Post Gu ’04 Analysis:
52,100 people in Gedo faced with a Humanitarian Emergency and 58,200
faced with a Livelihood Crisis due to drought and on-going civil insecurity
and serious crop failure in Northern Gedo (Belet Hawa, Dolo and Luuq)
Therapeutic and supplementary feeding programs by GHC on-going in Belet
Hawa and Garbaharey districts
(Sources: The FSAU Post Gu ’04 Analysis, Technical Series Report IV.2 Sept. 2004;
GHC, Gedo Regional Health Program Progress Report for Jul04-Dec05)
(Sources:
The FSAU Post Deyr ‘’04/05 Analysis, Technical Series Reports IV.3 Feb 2005
The FSAU Post Gu’05 Analysis, Technical Series Reports IV.7 Sept. 2005)
•
Therapeutic and supplementary feeding programs by GHC on-going in Belet
Hawa and Garbaharey districts
(Source: GHC 2005, Monthly reports on Therapeutic and supplementary feeding
programs)
6
No Nutrition Assessment conducted
in 2005 in Gedo
Luuq
Luuq
Dolow
Garbaharey
Belet Haw a
Sentinel sites
Sentinel sites
Rasqodey
Buraa
Gawido
Rasqodey
Gawido
Belet Haw a
Dolow
Beled Amin
Surgadud
Beled Amin
Surgadud
Gedweyne
Gedweyne
Taganey
Proportion of m alnourished children in Gedo sites, Oct0
Proportion of m alnourished children in Gedo sites, Oct05
35
30
25
20
15
10
5
0
Taganey
35
30
25
20
15
10
5
0
FSAU’s first round of sentinel
sites conducted in 8 sites in
Gedo indicate levels of acute
malnutrition of >15% WHZ
Garbolow
•
% malnourished
•
FSAU Post Deyr ’04/05 Analysis:
•
Northern Gedo remains of significant concern due to the continuing
and chronic state of Humanitarian Emergency, with an estimated
53,000 people in a state of Humanitarian Emergency and a further
59,000 facing a Livelihood Crisis with no improvement since the
previous FSAU assessment in Sept ’04.
•
Civil insecurity, the main underlying cause of the areas vulnerability
continues to disrupt economic activities and undermine people’s
livelihoods food security and well being
FSAU Post Gu ’05 Analysis:
•
An estimated 53,000 people in Northern Gedo (Belet Hawa, Dolo and
Luuq) are in a state of sustained Humanitarian Emergency, with a
further 59,000 in a state of Acute Livelihood Crisis.
•
The causes are multiple shocks such as recurrent conflict, below
normal rains, failed ’05 crop and expensive fuel prices have also
limited the accessibility for humanitarian assistance to the affected
areas. Recurrent conflict has led to closure of the Kenya border,
thereby negatively impacting cross border trade and economic
activities.
•
Flash flooding in parts of Gedo destroy standing crops and irrigation
infrastructure and loss of food stocks
Garbolow
•
% malnourished
2005
Garb
FSAU Monthly Nutrition Update April 2007
2006
FSAU
•
FSAU Post Deyr’05/06 Analysis:
180,000 people in Gedo face a Humanitarian Emergency and 80,000 face
an Acute Food and Livelihood Crisis as a result of prolonged drought that
has led to crop failure and loss of livestock. Northern Gedo (Belet Hawa,
Dolo and Luuq) in a ‘Sustained Humanitarian phase for preceding 3 years
•
The critical food security and livelihood situation is associated with the
multiple shocks over a number of years including increased and recurrent
conflict, population displacement and migration fluxes, successive years of
below normal rainfall, drought condition and restricted movement and market
options. These have undermined the overall resilience and livelihoods of the
population and led to a state of chronic ‘structural vulnerability’. Conflict has
negatively affected cross border trade and livestock and population
movements further increasing the vulnerability of the Gedo pastoralists.
•
FSAU Post Gu’06 Analysis:
160,000 in Gedo are faced with a Humanitarian Emergency and 69,000 an
Acute Food and Livelihood Crisis
•
The overall performance of the Gu rains throughout the season was
below normal, with poor distribution both in time and area of coverage.
In Northern Gedo, this resulted in poor pasture conditions and water
availability, thus stimulating an out-migration to southern Gedo where the
Gu rains were better, as well as into Bay region and into Zone V of
Ethiopia.
•
Gedo recorded the greatest livestock losses in southern Somalia during
the drought. Between April’05 - May’06, it is estimated that livestock
holdings were reduced by 40-60% for cattle, 30-50% for sheep and
goats and 5-10% for camels.
•
Milk production extremely low due to low levels of kidding and milk
production. High cereal prices and low cattle prices have eroded the
purchasing power of pastoralists
FSAU/UNICEF Nutrition
Assessments:
•
March 2006 Gedo Region
Nutrition Assessment: GAM of
23.8% (WHZ < -2 or oedema)
•
April 2006 Bardera Town
Nutrition Assessment GAM of
19.0% (WHZ < -2 or oedema)
(Sources:
The FSAU Post Deyr ’05/06 Analysis, Technical Series Reports IV.8 Feb 2006
The FSAU Post Gu ’06 Analysis, Technical Series Reports V.9 Sept. 2006
•
Therapeutic and supplementary feeding programs by GHC on-going in Belet
Hawa and Garbaharey districts
(Source: GHC 2006: Monthly reports on Therapeutic and supplementary feeding
programs)
JanMay
2007
•
FSAU Post Deyr ’06/07 Analysis:
A total of 108,000 people in Humanitarian Emergency and 88,000 in Acute
food and Livelihood Crisis.
•
The food security and livelihoods situation in the pastoral and agropastoral population improved compared to the Gu’06 situation. The
nutrition situation also shows improvements from Very critical to critical
levels. However, the humanitarian situation in Gedo region’s Riverine
population remains critical and deteriorating due to the compounding
impacts of the previous drought and severe flooding in Deyr ’06.
•
Gedo is identified with an Early Warning Level of Moderate Risk of
deterioration in the humanitarian situation depending on: confirmation
and vector spread of RVF and the duration of the disruption of cattle
markets and trade due to the Kenya-Somalia border and Garissa market
closure has reduced income access options for pastorals.
(Source: The FSAU Post Deyr 06/07 Analysis, Technical Series ReportsV.12 March
2007)
•
Acute watery diarrhoea outbreaks, three out of four samples analyzed by
AMREF test positive for cholera in May 2007
(Source: WHO May 11th 2007 bulletin on Acute Watery Diarrhoea)
•
Therapeutic and supplementary feeding programs by GHC on-going in Belet
Hawa and Garbaharey districts
(Source: GHC 2007, Monthly reports on Therapeutic and supplementary feeding
programs)
7
FSAU/UNICEF/GHC/COSV Nutrition
Assessments in April 2007
•
Gedo Riverine: GAM of 17.7%
(CI: 17.4-22.7) (WHZ < -2 or
oedema
•
Gedo Pastorals: GAM of 19.9%
(CI: 17.4-22.7) WHZ < -2 or
oedema)
•
Gedo Agro-Pastorals: GAM of
16.7% (CI:14.4-19.3) WHZ < -2
or oedema
FSAU Monthly Nutrition Update April 2007
FSAU
CURRENT SITUATION IN GEDO
Food Security Situation
There are three main livelihood zones in Gedo Region: Riverine,
Agropastoral and Pastoral. As is illustrated in the timeline the
population have faced several shocks in the recent times which
has had a very negative impact on their food and livelihood
security. In the FSAU ’05/06 Post Deyr Analysis an estimated
180,000 population across the main livelihood zones of Gedo
Region were reported to be facing a Humanitarian Emergency
with an estimated 81,000 facing a Livelihood Crisis. ( See Map
Series Pg 2.)
Health Situation
Acute Watery Diarrhoea (AWD) (Ref: Acute Watery Diarrhoea
Update, WHO, May 11th)
Gedo Region reported its first confirmed case of AWD in
epidemiological week 10 in 2007 and to date has reported a total of
1793 cases with 45 related deaths. The current Case Fatality Rate
is estimated at 1.55%, lower than the average for the duration of
the outbreak in Gedo of 2.51%. The most recent epidemiological
week, (week 19) reported 129 cases down from the 230 cases
reported a week earlier, as is illustrated in Chart 3 and this has
indicated a downward trend in the reported numbers of cases.
The improved security situation throughout the region has also
facilitated response agencies on the ground to meet the needs.
Chart 3: Number of AWD Cases from Gedo Region
Cattle Grazing in Bardera, Gedo, April ‘07
The critical food security situation at the time was associated with
very high livestock deaths as a result of prolonged drought from
2005, with Gedo Region being most affected. The peak of the
drought was in the dry season between the Deyr ‘05/06 and the Gu
‘06. The Gu ‘06 marked the end of the severe drought where FSAU
analysis estimated that 160,000 were facing a Humanitarian
Emergency with 69,000 in an Acute Food and Livelihood
Crises. However an improvement in the food security situation
has been noted in recent times with gradual recovery of livestock
holdings following the improved Gu ’06 and Deyr ’06/07 rainfall
(FSAU Post Deyr ’06/07) predominantly benefiting the Pastoral
and Agropastoral populations.
Further information on AWD can be obtained from
Dr. Hamman El Sakka: [email protected]
Health Services Overview: From 1992 up to April 2001, health
services in Gedo Region were mainly provided by Trocaire (Belet
Hawa and Dolo), AMREF (Luuq) and CORDAID (Garbaharey and
Burdhubo), who worked directly or through local partnership to
provide health and social development services. These agencies have
since consolidated into the Gedo Health Consortium (GHC) with
a comprehensive management and administrative structure, with
programmes covering five (out of the six5) districts. GHC supports
three hospitals, five outpatient departments, three Tuberculosis
(TB) treatment centres and approximately 36 health posts in the
five districts. The emergency programme, a department in GHC,
supports the management of severely malnourished children < 5
years through therapeutic feeding centres (TFC) with TFCs at
Luuq Hospital, Garbaharey and Belet Hawa. In 2006, with support
from Concern Worldwide, the programme expanded to include
community based management of severely malnourished children.
Further information on GHC interventions can be obtained from
GHC’s Director, Rosemary Heenan at [email protected]
Nevertheless, parts of the population in Gedo Region even
now remain in Humanitarian Emergency, which still affects
an estimated 108,000 people down from the 160,000 affected
in the Gu ’06 and with a further 88,000 facing an Acute Food
and Livelihood Crisis. Of greatest concern are 29,000 people
in the Riverine areas in a state of Humanitarian Emergency,
nearly 9% of the total regional population. Of this, 27,000 people
representing 100% of the poor and middle wealth groups are in
Humanitarian Emergency with a risk of further deterioration.
(FSAU Post Deyr ’06/07)
The Gu ’07 rains commenced in late April in Gedo Region though
light showers had been reported in March. However from early
May only light and scattered showers were reported. In general,
with the exception of a few localised areas, availability of water
and pasture is increasing. Livestock holdings are also reported to
be increasing with high rates of sheep lambing and goat kidding
in February and March.
COSV has been managing three maternal and child health centres
in Elwak District since 2001 and provides ante natal and post
natal care, child growth monitoring and EPI services. COSV also
implements a supplementary feeding program for the under fives,
with funds from ECHO and UNICEF. Further information on
COSV can be obtained from: [email protected].
Following the conflict in Mogadishu in February ’07 there have
been reports of up to 393,4306 people displaced out of Mogadishu
throughout the country. Of these an estimated 5,022 are in Gedo,
the majority (3,052) of whom moved to Bardera. A further impact
6 UNHCR figures, May 18, 2007
5 Garbaharey, Bulahawa, Luuq, Bardera, Dolo and El Wak
8
FSAU Monthly Nutrition Update April 2007
FSAU
of the conflict has been the recorded increases in markets prices of
key commodities from analysis conducted by FSAU in different
parts of the country. In Gedo, according to this analysis, the most
significant increase seen in the markets were in maize prices
which recorded a 67% increase from Mid March to End April
and rice, wheat and sugar, which recorded a 22-57% increase in
the same time period. Prices for sorghum during this time period
reported a 34% decrease.
FSAU and partners8 conducted three nutrition assessments in
Gedo Region in April 2007:- Gedo Pastoral, Gedo Agropastoral
and Gedo Riverine livelihood zones (See map 1). Using a 30
by 30 cluster sampling methodology, a sample of 899; 928 and
908 children aged 6- 59 months were assessed from Pastoral,
Agropastoral and Riverine livelihoods respectively. The summary
findings of the three assessments are presented in the table
overleaf.
FSAU, with partners, will be conducting a seasonal assessment
following the Gu rains in June-July ’07 to provide an review of
the humanitarian situation which will be represented in an updated
Integrated Phase Classification (IPC) Map in August ’07.
Results indicate continuing critical nutrition levels (GAM of 1519.9) in all the three assessments, the highest point prevalence
reported in the Pastoral livelihood with GAM of 19.9% (17.4
– 22.7) while the Agropastoral livelihood recorded the lowest
malnutrition rate with a GAM of 16.7% (14.4 -19.3) and the
Riverine livelihood assessment recorded a GAM of 17.7% (CI:
15.3-20.4). However, as the confidence interval ranges overlap
between all three studies, there is no statistically significant
difference in the rates of acute malnutrition between the three
livelihood zones. Even though the results are not statistically
different, integrated analysis indicates some improvement from
the previous assessment9 when GAM of 23.8% (CI: 21.1-26.7%)
was reported.
Food Security / Livelihood Programming in Gedo CARE’s Experience in Gedo Region
CARE USA are one of the many actors in Gedo Region
implementing food security and livelihood support interventions.
CARE commenced its operations in Gedo Region in 1999
supporting Luuq, Dolo, Belet Hawa and El Wak Districts.
The main intervention at the time focused on a general food
distribution to a targeted numbers of the population. CARE has
recently embarked on a holistic approach to programming of
food security and livelihoods interventions to address immediate,
intermediate and underlying causes. CARE, with support from
USAID, therefore, continues to conduct targeted general food
distributions, and in collaboration with other stakeholders such as
GHC, has commenced water interventions and livelihood security
and support programmes.
A possible explanation could be the improved dietary diversity
which was reportedly high with between 72 and 92% of the
households consuming four or more food groups in the previous
24 hours, an improvement from the assessment conducted in
2006. In addition improved milk consumption (>89%) and recent
supplies of cereals, pulses and oil in addition to own sorghum
production could have contributed to improved dietary diversity
and by extension to improved nutrition status. Even though the
majority of the assessed households reportedly sourced their food
through purchasing (>64%), a significant proportion also reported
to obtain their staple cereals through food aid (29-35%) and own
production (17-57%).
However, CARE’s experiences in Gedo have brought their own
challenges and regular natural disasters e.g. drought, floods and
animal disease outbreaks tends to overwhelm staff and also affect
program impact. One clear example is where CARE rehabilitated
wells in the region during 2006 some of which were partly
destroyed by floods immediately after. In addition poor access
due to the on-going conflict continues to limit service delivery,
although CARE works very closely with community based NGOs
and local authorities to continue dialogue and support operations
on the ground. Further challenges exist due to the need for cross
border logistical support from Kenya, which has recently been
affected by the border closure.
The crude mortality rates for the three assessments were above
the alert threshold (1/10,000/day10) indicating a concerning
situation again similar to the mortality situation from the previous
assessment in March 2006. For the under five year mortality rate
only the results for the Agropastoral population indicated alert
levels with the other two at acceptable levels. The consistently
high morbidity rates, especially diarrhoea (>16%) are possible
aggravating factors to the nutrition situation. A rapid diagnostic
test for malaria11 conducted concurrently in the region reported
a positive prevalence of 19.7% for Plasmodium Falciparum
among the sampled population. This analysis was conducted in
the 3 livelihood zones assessed. Further analysis continues to
show strong significant association between malnutrition and
morbidity rates (p<0.05).
Nevertheless, amidst this complex emergency, CARE not only
makes its contribution to save lives in crucial moments such as
when the livelihoods have collapsed; but has also commenced
a journey to assist in the recovery of lost livelihoods. Further
information on CARE’s activities in Gedo can be obtained from
[email protected]
In summary, therefore, it should be emphasised that in spite of
this evidence of a slight recovery in the nutrition situation, the
results continue to highlight that the rates of acute malnutrition
in Gedo Region have been and still remain at unacceptable
levels for over 12 years. Intervention efforts, therefore, need to
be strengthened and broadened to address both immediate life
saving needs, in addition to developing longer term strategies to
enhance the provision of basic services, sustainable strategies for
livelihood support and social protection mechanisms.
Nutrition Situation - Findings of the April 2007 Gedo
Livelihood Nutrition Assessments
As described earlier in the timeline, the nutrition situation in Gedo
is emerging from a background of livelihood stress resulting from
the severe drought of 2005, and though is indicating gradual
recovery the nutrition situation remains critical. The most recent
nutrition sentinel site surveillance data7 also indicated that the
nutrition situation in these areas remains critical with a more
worrying situation in the Riverine population than the Pastoral/
Agropastoral population.
8 UNICEF, GHC, SRCS and COSV
9 FSAU Nutrition Update March 2006
10 Moren et al, 1995
11 Tests using Parachecks conducted in collaboration with UNICEF
7 FSAU Nutrition Update March 2007
9
FSAU Monthly Nutrition Update April 2007
FSAU
Table 2. SUMMARY OF THE GEDO ASSESSMENT FINDINGS
Indicator
Total number of households surveyed
Mean household size
Total number of children assessed
Global Acute Malnutrition (WHZ<-2 or oedema)
Severe Acute Malnutrition (WHZ<-3 or oedema)
Oedema
Global Acute Malnutrition (WHM<80% or oedema)
Severe Acute Malnutrition (WHM<70% or oedema)
Proportion of malnourished pregnant women (MUAC≤23.0).
Proportion of severely malnourished pregnant women (MUAC≤20.7)
Proportion of children reported to have diarrhoea in 2 weeks prior to
assessment
Proportion of children reported to have ARI within two weeks prior to
assessment
Children reported to have a febrile illness in 2 weeks prior to assessment
Suspected measles within one month prior to assessment
Children (9-59 months) immunised against measles
Children who have ever received polio vaccine
Children who received vitamin A supplementation in last 6 months
Proportion of children 6-24 months who are breastfeeding
Children (6-24 months) introduced to other foods before 6 months
Proportion of households who consumed ≤3 food groups
Proportion of households who consumed ≥4 food groups
370
91.8
(88.6-94.2)
1.48 (0.22-3.18)
1.05 (0.51-1.60)
Under five Death Rate (U5DR) as deaths/10,000/ day
Crude Death Rate (CDR) as deaths/10,000/ day
Tr a i n i n g a n d c o u r s e s a n n o u n c e m e n t s
•
The Sphere Project is glad to announce the 15th Global
Sphere Training of Trainers Course: Application Deadline:
Sunday, May 13th, 2007, 12:00 GMT 12:00; Venue: City
Seasons Hotel, Abu Dhabi; Language: Arabic
Applications should be sent to [email protected]
•
Public Health in Complex Emergency (PHCE) Course,
Makerere University Institute of Public Health (IPH) in
Kampala on December 3-15. Information and application
forms are also available at: www.phcetraining.org
FSAU
Pastoral
% (CI)
N
403
100
6.5
SD=2.2
899
100
19.9
179
(17.4-22.7)
2.6
23
(1.7-3.9)
0
0
13.9
125
(11.7-16.4)
0.8
7
(0.3-1.7)
19.7
25
(N=127)
5.5
7
202
22.5
(19.8-25.4)
253
28.1
(25.2-31.2)
167
18.6
(16.1-21.3)
33
3.8
(2.7-5.4)
748
86.1
(83.6-88.3)
841
93.5
(91.7-95.0)
689
76.6
(73.3-79.3)
136
50.6
(44.4-56.7)
242
90.0
(85.7-93.3)
33
8.2
(5.8-11.4)
Agro pastoral
N
% (CI)
464
100
5.7
SD=2.1
928
100
16.7
155
(14.4-19.3)
3.1
29
(2.1-4.5)
0
0
10.1
94
(8.3-12.3)
1.3
12
(0.7-2.3)
36.6
30
(N=82)
13.4
11
173
18.6
(16.2-21.3)
152
16.4
(14.1-19.0)
101
10.9
(9.0-13.1)
13
1.5
(0.8-2.6)
259
29.7
(26.7-32.9)
741
79.8
(77.1-82.4)
295
31.8
(28.8-34.9)
175
58.9
(53.1-64.6)
233
78.5
(73.3-83.0)
58
12.5
(9.7-15.9)
406
Riverine
N
% (CI)
438
100
6.3
SD=2.3
908
100
17.7
161
(15.3-20.4)
3.5
32
(2.5-5.0)
0
0
11.3
103
(9.4-13.6)
0.6
5
(0.2-1.4)
10.2
11
(N=108)
6.5
7
151
16.6
(14.3-19.2)
134
14.8
(12.5-17.3)
84
9.3
(7.5-11.4)
35
4.1
(2.9-5.7)
613
71.4
(68.2-74.3)
860
94.7
(93.0-96.0)
644
70.9
(67.8-73.8)
140
47.9
(42.1-53.8)
236
80.8
(75.8-85.2)
124
28.3
(24.2-32.8)
87.5
(84.1-90.3)
2.65 (1.11-4.18)
1.53 (0.75-2.30)
314
71.7
(67.2-75.8)
1.63 (0.68-2.57)
1.09 (0.50-1.67)
Other related publications and Releases
o
FSAU/FEWSNET Market Data Update, May 2007.
o
FSAU/FEWSNET Climate Data Update, May 2007
o
FSAU Food Security and Nutrition Brief, April 2007
Physical address: Kalson Towers, Parklands, Nairobi. Postal address: PO Box 1230, Village Market, Nairobi, Kenya
Telephone: +254-20-3741299, 3745734, 3748297. Fax: 3740598 General email: [email protected]
Comments and information related to nutrition: [email protected], Website: http://www.fsausomali.org
10


© Copyright 2026