
Intercomparison of RSS and JAXA AMSR2 brightness temperature
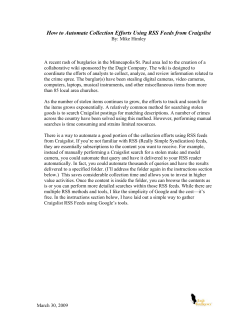
Intercomparison of RSS and JAXA AMSR2
Brightness Temperature Calibrations
Kyle Hilburn and Chelle Gentemann
Remote Sensing Systems
Workshop on Optimal Estimation of Ocean, Ice, and Atmosphere Parameters
17 March 2015
Next slide please
1
Introduction
• At the AMSR2 meeting in Tokyo, I
presented validation results for
Remote Sensing Systems (RSS)
retrievals of sea surface
temperature (SST) from AMSR2
• The results showed AMSR2 intercalibration accuracy of better than
0.1 K (compared to other RSS
satellite data records)
• For example, the figure shows a
time series of AMSRE (2002-2011)
and AMSR2 (2012-2014) (both in
red) and WindSat (blue) SST for the
Gulf of Mexico
• Note the excellent agreement in
annual cycle, inter-annual
variability, and overall mean
Next slide please
2
Overview
• RSS and JAXA have produced two independent calibrations of AMSR2
• Several Kelvin differences exist between RSS and JAXA calibrations
• My presentation at the AMSR2 meeting showed similar large differences
between the RSS and JAXA nonlinearity corrections
• RSS: calibration to rain-free ocean radiative transfer model (RTM)
• This approach has also been applied to AMSR-E, GMI, SSMI, SSMIS, TMI, WindSat
• AMSR2 is the only satellite for which we’ve seen such large nonlinearities
• JAXA: nonlinearity determined from pre-launch measurements
• Key finding: Difference in nonlinearity corrections largely explains
differences between RSS and JAXA AMSR2 TB
Next slide please
3
Background: AMSR2 Nonlinearity
• Red: JAXA correction developed
from pre-launch measurements
(Kasahara, 2013 X-Cal presentation)
• JAXA model is characterized by
maximum deflection at midpoint
parameter
• Black: RSS correction developed
post-launch from RTM using
WindSat
• RSS model is 5th order polynomial
• 6 and 7 GHz: RSS and JAXA agree
on positive deflections, but
disagree on magnitude
• 10, 18, 23, 36 GHz: JAXA has
positive deflections, while RSS has
negative deflections
• 89 GHz: RSS and JAXA agree that
nonlinearity is weak
Next slide please
4
Background: Sources of Nonlinearity
• AMSR sensors are unique in their
nonlinearity
• AMSR: 1.0%
• AMSR2 Data Users Handbook, 2013
• AMSR-E Data Users Handbook, 2006
• AMSR-E nonlinearity only evident at 6 GHz
• WindSat: 0.1 %
• Gaiser et al., 2004
• GMI: 0.25%
• Draper et al., 2013
• SSM/I: 0.5%
• Yan et al., 2008
• The means that nonlinearity is single
largest term in AMSR2 calibration
• Nonlinearity in detector diode
• The typical assumption in MW
radiometer calibration is that output
voltage is proportional to the square of
the input voltage (square law), thus
directly proportional to input power
• This is only valid over range of input
powers and diode temperatures
• Expected to cause positive deflections
• Nonlinearity in amplifiers
• Low noise amplifier
• Intermediate frequency amplifier
• Warmer temperatures can cause gain
compression
• Expected to cause negative deflections
Next slide please
5
Data
• AMSR2 has six feedhorns
•
•
•
•
•
•
6 and 7 GHz shared
10 GHz
18 and 23 GHz shared
36 GHz
89 GHz A
89 GHz B
• Shared horns have band-rejection filters and highpass filters to separate the frequencies
• Signal sent through low noise amplifier, then
bandwidth filter
• Additional amplification, demodulation, and
integration
• Temperature monitoring for auto gain control
• Two-point calibration
• High temperature source: 293 +/- 0.6 K
• Design much improved on AMSR-E
• No evidence of direct solar intrusion for AMSR2
• Low temperature source: cold space mirror
• Time period of comparison is all of 2014
• Spatial domain of intercomparison is all
surface types including ocean, land, and ice
• Note: RSS calibration largely based on ocean
data, but this intercomparison is all surfaces
• JAXA Version 1.1
• RSS Version 7.2
• Version 7 = Meissner and Wentz [2012] RTM
• Used L1B files: not resampled
• JAXA files: separates ascending, descending
orbit segments, named by date and time
• RSS files: one whole orbit, named by RSS
orbit number
• One RSS file matches two JAXA files
• JAXA TAI time and RSS UTC time different by
8 leap seconds (1993-2014)
Next slide please
6
Methodology
• Calibration to ocean RTM over rain-free scenes
• RSS RTM requires input: SST, wind speed and
direction, water vapor, and cloud water
• WindSat Version 7 specifies wind speed, water
vapor, and cloud water
• Important: retrieval algorithm is inverse of RTM to
within 0.1 K, this establishes absolute calibration
• NCEP for wind direction
• Reynolds OI for SST
• RTM gives TB, inverse of APC to get TA
• Spillover, cross-polarization, hot load offset, and
nonlinearity iteratively adjusted to minimize TA
differences over full mission
• Amazon comparisons to further constrain warm
end; strong nonlinearity complicates the
separation of nonlinearity and spillover effects
• RSS AMSR2 processing begins with JAXA L1A
• Reverse AGC to get counts, the fundamental
starting point
• To obtain cold reference, filter counts for RFI and
moon intrusion, and Earth spillover for low
frequencies
• To obtain hot reference, simple average of
thermistors, apply -1.3 K hot load offset to all
channels
• Reference temperatures convert counts to TA
• Along scan biases removed, generally 0.3 K or less,
except near scan edge for low frequencies
• APC converts TA to TB
• RSS and JAXA use somewhat different APC
coefficients, but nonlinearity correction is the
major source of differences between the two
calibrations
Next slide please
7
Results: 6 and 7 GHz
• 6 GHz: TB diff (blue) of 1-2 K matches NL
correction diff (red) to within better
than 0.1 K
• Quadratic fit to TB diff has R2 > 0.96,
indicating mostly linear/quadratic shape
• RSS and JAXA agree on positive
deflections
Blue: JAXA-RSS TB
Cyan: +/- 1 SD JAXA-RSS TB
Red: JAXA-RSS nonlin. correction
Grey: Number of observations
• 7 GHz: TB diff (blue) of 2-3 K mostly
explained by NL diff (red) to within 0.51K
• Quadratic fit to TB diff has R2 > 0.96,
indicating mostly linear/quadratic shape
• Note the small increase with
temperature in the difference between
the TB and NL diffs
Next slide please
8
Results: 10 and 23 GHz
• 10 GHz: TB diff (blue) of 3 K
• NL diff (red) explains shape of TB
diff, with residual diff of 1-1.5 K
• Quadratic fit to TB diff has R2 > 0.99,
indicating linear/quadratic shape
• 23 GHz: TB difference (blue) of 3-4 K
• NL diff (red) explains shape of TB
diff, with residual diff of 1-1.5 K
• Quadratic fit to TB diff has R2 > 0.99,
indicating linear/quadratic shape
Blue: JAXA-RSS TB
Cyan: +/- 1 SD JAXA-RSS TB
Red: JAXA-RSS nonlin. correction
Grey: Number of observations
Next slide please
9
Results: 18 and 36 GHz
• 18 GHz: TB diff (blue) of 2-4 K mostly
explained by NL diff (red) to within 0.5-1 K
• Note the large polarization difference, the
V-pol diff about 2 K larger than H-pol diff
• Quadratic fit to TB diff has R2 > 0.99 for Vpol and R2 = 0.65 for H-pol.
• Shape of 18H has substantial contribution
from higher order terms
• 36 GHz: TB diff (blue) of 2-3K is mostly
explained by NL diff (red) to within 0.6 K
• Quadratic fit to TB diff has R2 > 0.98,
indicating linear/quadratic shape
Next slide please
Blue: JAXA-RSS TB
Cyan: +/- 1 SD JAXA-RSS TB
Red: JAXA-RSS nonlin. correction
Grey: Number of observations
10
Results: 89 GHz
• 89A: TB diff (blue) of 0.4-0.7 K is explained
at cold end by NL diff (red) with residual
diffs of 0.3 K
• Quadratic fit to TB diff has R2 = 0.83 for Vpol and 0.96 at H-pol indicates
contribution of higher order terms for Vpol
• RSS and JAXA agree on small nonlinearity
Blue: JAXA-RSS TB
Cyan: +/- 1 SD JAXA-RSS TB
Red: JAXA-RSS nonlin. correction
Grey: Number of observations
• 89B: TB diff (blue) of 0.5-1 K is explained
at cold end by NL diff (red) with residual
diffs of 0.5 K
• Quadratic fit to TB diff has R2 = 0.99 for Vpol and 0.88 for H-pol indicates
contribution from higher order terms for
H-pol
• RSS and JAXA agree on small nonlinearity
Next slide please
11
Summary of Results
• Table provides:
• JAXA minus RSS mean
TB difference
• Standard deviation (SD)
• Coefficients for
quadratic polynomial
regression of JAXA-RSS
difference as a function
of JAXA TB
• Correlation coefficient
for the regression
• TB range of regression
• Double difference (DD)
residual JAXA-RSS TB
difference minus JAXARSS nonlinearity
correction
Next slide please
Chan
Mean
SD
C2
C1
C0
R2
Range
DD
06V
1.08
0.63
-3.893E-05
8.122E-03
1.170E+00
0.968
156, 310
-0.02
06H
1.64
0.54
-5.349E-05
1.298E-02
1.194E+00
0.992
74, 290
-0.06
07V
1.89
0.43
-6.722E-05
2.492E-02
-2.825E-01
0.969
158, 314
0.80
07H
3.16
0.75
-2.194E-04
7.361E-02
-1.722E+00
0.994
76, 292
0.59
10V
3.28
0.94
-2.032E-04
7.253E-02
-2.599E+00
0.999
166, 312
1.41
10H
2.88
0.62
-1.545E-04
5.056E-02
-4.337E-01
0.999
80, 292
1.24
18V
4.00
1.17
-4.293E-04
1.717E-01
-1.240E+01
0.996
172, 312
0.72
18H
1.70
0.56
7.558E-05
-3.272E-02
4.790E+00
0.649
96, 296
0.38
23V
3.50
0.72
-3.353E-04
1.422E-01
-1.106E+01
0.990
170, 310
1.43
23H
3.78
0.87
-1.557E-04
5.029E-02
3.257E-01
0.997
112, 298
1.13
36V
1.71
0.48
-1.265E-04
4.981E-02
-2.917E+00
0.986
166, 312
0.62
36H
2.84
0.68
-1.672E-04
5.914E-02
-1.976E+00
0.995
128, 298
0.29
89AV
0.36
0.49
2.749E-05
-1.269E-02
1.799E+00
0.830
164, 308
0.31
89AH
0.73
0.55
2.744E-05
-2.063E-02
4.025E+00
0.968
148, 300
0.21
89BV
0.85
0.45
-2.202E-06
-3.402E-03
1.872E+00
0.994
166, 308
0.57
89BH
0.58
0.51
5.228E-05
-2.793E-02
4.208E+00
0.885
148, 300
0.40
12
• Although not evident in results shown so far, there is
isolated problem in 10V
• Figure shows 10V TA measured minus RTM AMSR2
closure versus orbit number and intra-orbit position
• “Closure” means RTM input is from AMSR2 retrievals
• Detects features that are inconsistent with RTM
•
•
•
•
White circle: warm anomaly in mission plot 1.4 K
Starts at orbit 8500, December 22, 2013
Southern Hemisphere summer near Antarctica
Anomaly in cold counts and in LNA temperature counts,
reducing cold counts makes problem worse
• Problem happens when 10V LNA counts are at maximum
value
• Believe the problem is a temperature related
nonlinearity
• Red areas around North Pole in winter are due to larger
errors in modeling cold SST and high wind
Next slide please
Intra-Orbit Position
10V LNA Problem
Orbit Number
13
Comparison with Kachi
Kachi, Imaoka, Maeda, Okuyama, Naoki, Hori, Kasahara, and Ito, 2014: Calibration and validation results of the
Advanced Microwave Scanning Radiometer 2 (AMSR2), EUMETSAT, 22-26 September, Geneva, Switzerland
• Black: JAXA – RSS AMSR2 TB
• Red: Kachi et al. provide linear
fit for AMSR2 - TMI
• 10V: good match over all TB,
except at hot end
• 10H: good match in center
• 18V: matches at cold end,
slope right, but offset colder
• 18H: matches at cold end
• 23V: matches at warm end
• 36V: offset warmer
• 36H: matches at warm end
• 89: slope matches, offset
warmer
Next slide please
14
Comparison with JAXA
JAXA, 2014: Results of intercalibration between AMSR2 and TMI/AMSR-E (AMSR2 Version 1.1), March 12, 2014,
Available online: http://www.wmo.int/pages/prog/sat/meetings/documents/GSICS-EP-15_Doc_05_JAXA-AMSR2XcalResults.pdf, accessed 13 February 2015
• Black: JAXA – RSS AMSR2 TB
• JAXA provides linear fit
• Red solid: AMSR2 - TMI
• Red dash: AMSR2 - AMSR-E
• TMI has larger slope than
AMSR-E at low frequencies
(6-36 GHz)
• AMSR-E has larger slope at
89 GHz than TMI
• 6V, 6H: slope similar, but
offset cooler
• 10, 18, 23, 36: slopes similar,
offset cooler, matches best at
cold end
• 89: TMI slopes match best
Next slide please
15
Comparison with Alsweiss
Alsweiss, Jelenak, Chang, Park, and Meyers, 2015: Inter-calibration results of the Advanced Microwave Scanning
Radiometer-2 over ocean. IEEE J. Selected Topics Appl. Earth Obs. Rem. Sens., in press.
• Black: JAXA – RSS AMSR2 TB
• Alsweiss et al. provide
quadratic polynomial for
AMSR2 – TMI diffs
• Red solid: ascending
• Red dash: descending
• Temperature of best match
goes from cold end at 10
GHz to warm end at 89 GHz
with increasing frequency,
following the mode of TB
histogram
• Slopes do not match our
results
Next slide please
16
Comparison with Singh
Singh, Piyush, Varma, and Rajput, 2014: Radiative transfer based cross-calibration of passive microwave
measurements obtained by satellites. Intl. Geosci. Rem. Sens. Symposium, 13-18 July, Québec, Canada.
• Black: JAXA – RSS AMSR2 TB
• Singh et al. provide quadratic
polynomial for TMI TB vs
AMSR2 TB
• Red: AMSR2 - TMI
• Completely different results;
flipping the sign makes
better agreement for
agreement for 10H, 18V, and
18H; and worse agreement
for 10V, 23V, and 36V
Next slide please
17
Summary and Discussion
• JAXA-RSS mean differences are as large as 4 K
• JAXA is warmer than RSS for all channels
• Standard deviations across all TB are as large as 1 K
• At a given temperature, standard deviations as large as 0.5 K
• Nonlinearity explains most of differences, except at 10 and 23 GHz that have
double difference residuals greater than 1 K
• JAXA nonlinearity is generally larger than RSS
• Quadratic fit is very good match to shape of TB differences, except for 18H,
which has higher order nonlinearity contributions in RSS correction
• JAXA and RSS agree on positive deflections for 6 and 7 GHz
• JAXA and RSS agree on small nonlinearity at 89 GHz
• Disagree on sign of deflection: 10, 18, 23, and 36 GHz
• JAXA deflection is positive for all channels
• RSS deflection is negative for these channels
Next slide please
18
Conclusions
• The several Kelvin differences between JAXA and RSS TB from AMSR2
are mostly due to differences in nonlinearity characterizations
• However, both calibrations find nonlinearity of several Kelvin
• Climate monitoring requires 0.1-0.2 K accuracy
• Achieving this accuracy is complicated by large nonlinearity
• Differences between JAXA and RSS raise possibility of temperature
dependent nonlinearity in radiometer components
• Linearity design requirements of 0.1% would greatly solve the
problem
Thank you!
19


© Copyright 2026