
Addressing the Agriculture Efficiency Cycle
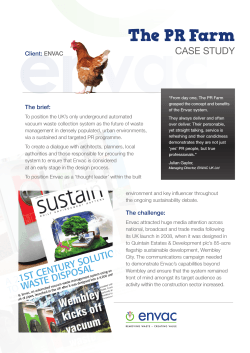
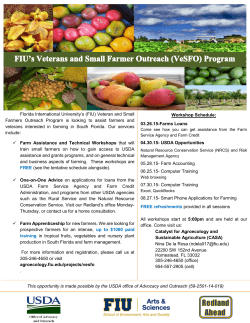
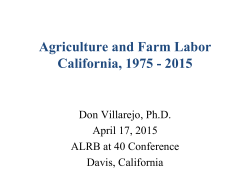
May 2015
INSIGHTS
Addressing the Agriculture Efficiency Cycle:
It’s Time to Drive Down Production Cost Per Unit
AgriThought
AgriBank provides financial
solutions to meet the needs
of production agriculture in
America’s heartland. We feature
our research and analysis in
AgriBank Insights as part of our
AgriThought initiative to help
inform the financial decisions
among those we serve.
Contents
2
5
6
10
Net farm
income
Farm balance
sheets
Ag efficiency/cost
structure
For more
information
Through hard work and favorable economic conditions in recent years,
crop farmers across America’s heartland have generally enjoyed a
period of significant financial progress. However, in 2013, prices for
key commodities such as corn and soybeans, as well as other key
indicators, began to moderate. Net farm income is projected to fall
over the next decade. Farm balance sheets, while strong today, are
at risk of weakening. Is this the start of a “down cycle” in the crop
production sector that could lead to a 1980s-type farm crisis? Not
necessarily. Producers who see today’s environment as an “agriculture
efficiency cycle”—and find ways to drive down cost per unit of
production—can position themselves for continued success.
Highlights
NET FARM INCOME FALLING. After the record $129 billion in 2013, the U.S.
Department of Agriculture (USDA) projects aggregate nominal net farm income
to decline in 2014 and 2015, reaching a five-year low of $73.6 billion in 2015.
Most of the expected decline can be attributed to lower crop and livestock
prices and receipts.
FARM BALANCE SHEETS STRONG BUT MODERATING. The U.S. farm sector
debt-to-asset ratio, a measure of overall farm financial health, reached an alltime low of 10.6 percent in 2014 and is projected to increase only slightly to
10.9 percent for 2015—still well below the values that prevailed in the 1980s
and 1990s. This compares to the high of over 22 percent during the height of
the 1980s farm crisis.
AGRICULTURE EFFICIENCY CYCLES REQUIRES COST CUTS. While strong balance
sheets provide a window of opportunity for producers to adjust to changing
market conditions, the expected decline in net farm income means producers
must bring income and expenses in line. A solution in periods like this is to drive
a higher level of efficiency into operations, which can reduce the cost per unit of
production.
© 2015 AgriBank. All rights reserved.
1
Net Farm Income
Net farm income projected to decline over next
decade
Following the 1980s farm crisis, American agriculture experienced several
decades of rising net farm income. Average aggregate nominal net farm income
reached a record $129 billion in 2013. However, the inevitable downturn in the
market cycle has returned, especially in the crops sector, as falling prices and
rising expenses are starting to take their toll on income statements.
2014-2015: Lower crop and livestock receipts,
higher cash expenses
After the record $129 billion in 2013, the USDA projects aggregate nominal net
farm income to decline 16.3 percent in 2014 and 31.8 percent in 2015, reaching
a five-year low of $73.6 billion in 2015. Most of the decline in 2014 can be
attributed to sharply lower crop receipts (down $20.3 billion) and much higher
cash expenses (up $17.6 billion). In 2015, the culprit is much lower cash receipts
for both livestock (down $10.1 billion) and crops (down $15.6 billion), while cash
expenses increase only modestly (up $1.6 billion).
After increasing $15.7 billion in 2014, due mainly to much higher feeder
livestock and labor expenses, total farm production expenditures are projected
to increase only $2.2 billion in 2015. Feeder livestock purchases
are expected to still be a major contributor (up $3.5 billion)
along with labor expenses (up $1.4 billion), but these are
counterbalanced by sharp declines in petroleum, fuel, and
oil (down $4.6 billion) and fertilizer (down $1.1 billion). Feed
purchases also are expected to decline by $1.6 billion due to
lower crop prices.
Producer capital expenditures are projected to significantly
decline in 2015 after declining slightly in 2014. Total capital
expenditures, including operator dwellings, are expected to
decline by $3.1 billion in 2015 compared to a $123 million
decline in 2014. This would represent a 7.4 percent one-year
decline from 2014 to 2015. A majority of the decline is projected
to be absorbed by vehicles and machinery purchases, which are
forecast to drop by $1.8 billion (-6.0 percent) in 2015. Buildings
and land improvement expenditures, including operator
dwellings, are projected to decline by $1.3 billion (-11.4 percent)
in 2015.
2
USDA Aggregate U.S. Farm Income Statement, 2011-2015 Calendar Years
CALENDAR YEAR
(billion $)
Cash income statement
ABSOLUTE CHANGE
(billion $)
PERCENT CHANGE
(percent)
2011
2012
2013
2014F
2015F
2013/2014F
2014F/2015F
2013/2015F
2015F/2015F
$368.7
$404.8
$401.3
$407.4
$381.6
$6.1
$(25.8)
1.5
(6.3)
Crops 1/
$204.7
$236.1
$218.5
$198.2
$182.6
$(20.3)
$(15.6)
(9.3)
(7.9)
Livestock
$163.9
$168.7
$182.8
$209.2
$199.0
$26.4
$(10.1)
14.4
(4.9)
b. Direct Government payments 2/
$10.4
$10.6
$11.0
$10.8
$12.4
$(0.2)
$1.6
(2.2)
15.0
c. Farm-related income 3/
$26.1
$28.5
$31.5
$27.3
$27.3
$(4.2)
$0.0
(13.4)
0.0
d. Gross cash income (a+b+c)
$405.2
$443.9
$443.9
$445.5
$421.3
$1.6
$(24.1)
0.4
(5.4)
e. Cash expenses 4/, 5/
$277.7
$306.8
$312.7
$330.3
$332.0
$17.6
$1.6
5.6
0.5
f. Net cash income (d-e)
$127.5
$137.1
$131.1
$115.1
$89.4
$(16.0)
$(25.8)
(12.2)
(22.4)
a. Cash receipts
Farm income statement
g. Gross cash income (a+b+c)
$405.2
$443.9
$443.9
$445.5
$421.3
$1.6
$(24.1)
0.4
(5.4)
h. Nonmoney income 6/
$22.8
$20.2
$23.4
$24.0
$23.8
$0.6
$(0.2)
2.6
(1.0)
i. Value of inventory adjustment
$(1.7)
$(19.1)
$13.7
$6.4
$(1.2)
$(7.3)
$(7.5)
NA
NA
j. Total gross income (g+h+i)
$426.3
$445.0
$481.0
$475.9
$444.0
$(5.1)
$(31.9)
(1.1)
(6.7)
k. Total expenses
$312.5
$342.4
$352.0
$367.9
$370.4
$15.9
$2.5
4.5
0.7
l. Net farm income (j-k)
$113.8
$102.5
$129.0
$108.0
$73.6
$(21.0)
$(34.4)
(16.3)
(31.8)
1/ Includes CCC loans.
2/ Note: Government payments reflect payments made directly to all recipients in the farm sector, including landlords. The
nonoperator landlords’ share is offset by its inclusion in rental expenses paid to these landlords and thus is not reflected in net
farm income or net cash income.
3/ Income from custom work, machine hire, recreational activities, forest product sales and other farm sources.
4/ Excludes depreciation and prerequisites to hired labor.
5/ Excludes farm households.
6/ Value of home consumption of farm products plus the imputed rental value of operator and hired labor dwellings.
Source: USDA Economic Research Service (ERS) February 2015 Farm Sector Income and Finances Forecast Release, http://www.
ers.usda.gov/topics/farm-economy/farm-sector-income-finances.aspx
After falling by $247 million in 2014, direct government
payments to producers are projected to increase by $1.6
billion to a total of $12.4 billion in 2015. Some of these
will be delayed 2014 payments under the new Farm Bill.
While fixed payments will go from $4.5 billion to zero
in 2015, it is projected that approximately $6.2 billion
in payments under the Price Loss Coverage (PLC) and
Agricultural Risk Coverage (ARC) programs will be made
in 2015. An additional $178.4 million in loan deficiency
payments and marketing loan gains also are projected for
2015. No payments are projected under the new Dairy
Margin Protection Program, as most forecasts do not
expect the margin to drop below the $8.00/cwt maximum
coverage threshold.
3
USDA long-run farm income projections: Back to the 1980s?
The accompanying chart shows real (2009 dollars) U.S. net farm income from 1930 to 2013 and
the 10-year USDA forecast. The forecast shows real net farm income falling rather sharply in 2015
(more significant in magnitude than 2006 and 2009) before leveling off at a slightly lower level. In
real terms, the forecast shows net farm income continuing to lose ground to inflation over time,
averaging $61.3 billion from 2014 to 2024.
The USDA forecasts reflect the February 2015 financial update release for 2014 and 2015, while the
remaining years (2016 through 2024) come from the USDA Agricultural Baseline Projections that
were released in early January. This likely explains part of the rather abrupt increase from 2015 to
2016. It is likely that, if revised, the 2016 through 2024 forecasts would be shifted downward to
reflect the downgrade in the 2015 revision.
BILLIONS OF 2009 $
How does the projected average real net farm income, which averages approximately $61 billion over
the next decade, compare to previous time periods? As the chart indicates, the Great Depression/
Dust Bowl decade of the
Real U.S. Net Farm Income from Farming, 1930 to 2013 (actual)
1930s had the lowest
with USDA Forecast from 2014 to 2024
average real net farm
$140
income at approximately
1973, $130.16
2013,
$112.85
$48 billion. The Farm Crisis
$120
$106.30
decade of the 1980s was
$98.70
$100
slightly higher at around
$80.54
$51 billion, recovering to
$76.07
$80
$64.97
$64.88 $69.65
around $65 billion in the
$61.30
$60
$51.34
1990s. The average forecast
$48.39
2024, $52.98
of the next decade would
$40
land somewhere between
1983, $26.58
$20
the decade averages for the
1980s and 1990s in terms
$1930
1940
1950
1960
1970
1980
1990
2000
2010
2020
of average real net farm
DECADE AVERAGE REAL NFI
income measured in 2009
REAL NET FARM INCOME (IN 2009 $)
FORECASTED
dollars.
Source: USDA National Agricultural Research Service and USDA Office of the Chief
Economist
Beware of forecasts
One word of caution regarding long-run baselines and forecasts in general: It is almost certain that
reality will be far different than what is forecast. The baseline forecast merely represents what is
expected to happen if everything follows the prevailing trends and the forecast assumptions over
the projected time period. These baseline forecasts do not account for any shocks to the system
such as weather events, economic trends, technological change, political events, and so forth. They
also do not account for changes in producer behavior and practices to operate more efficiently and
potentially improve net margins by reducing costs and/or increasing revenues. This may include
major changes to the mix of crops they produce.
4
Farm Balance Sheets
Farm balance sheets strongest in a generation
The greatest reason the coming decade is different from the 1980s-1990s may
be the overall financial health of the U.S. farm economy—which entered 2015
in perhaps its strongest financial condition in over 50 years. While slowing, real
($2009) farm asset values and equity reached all-time highs in 2014. The U.S.
farm sector debt-to-asset ratio, a measure of overall farm financial health (lower
is better), reached an all-time low level of 10.6 percent in 2014 and is projected
to increase only slightly to 10.9 percent for 2015—still well below the values that
prevailed in the 1980s and 1990s.
U.S. Farm Sector Balance Sheet (Billion Real 2009 $)
and Debt-to-Asset Ratio
ANNUALIZED
GROWTH 2002-2013
ASSETS
5.7%
DEBT
2.6%
EQUITY
6.1%
$3,000
$2,500
25%
2014F; $2,765.1
1985; 22.2
2015F; $2,737.9
2014F; $2,471.7
20%
2015F; $2,439.5
1980; $2,249.2
BILLION 2009 $
15%
2002; $1,485.1
$1,500
2015F; 10.9
1980; $1,884.0
2002; $1,265.2
1960; $995.4
2014F; 10.6
10%
$1,000
DEBT-TO-ASSET RATIO %
$2,000
1960; $867.2
5%
$500
1980; $365.2
2002; $219.9
1960; $128.1
2015F; $298.3
2014F; $293.4
0%
1960
1961
1962
1963
1964
1965
1966
1967
1968
1969
1970
1971
1972
1973
1974
1975
1976
1977
1978
1979
1980
1981
1982
1983
1984
1985
1986
1987
1988
1989
1990
1991
1992
1993
1994
1995
1996
1997
1998
1999
2000
2001
2002
2003
2004
2005
2006
2007
2008
2009
2010
2011
2012
2013F
2014F
2015F
$-
ASSETS (LEFT AXIS)
DEBT (LEFT AXIS)
NET EQUITY (LEFT AXIS)
DEBT ASSET RATIO (RIGHT AXIS)
Source: USDA Economic Research Service (ERS), 1960-2015F (forecasted)
By comparison, during the 1980s farm crisis, the debt-to-asset ratio reached a
50-year high of 22.2 percent in 1985. From the mid-1980s through 2014, the
ratio showed steady improvement with the exception of a few brief periods
when a slight reversal in the long-term downward trend occurred in response to
a downturn in the general economy.
5
Current overall debt levels, measured in real dollars (2009), are significantly
lower than in the early 1980s, and overall assets are higher. In addition, and very
positive for agriculture, interest rates today are dramatically lower than in the
1980s.
Of course, note that individual producer financial conditions can vary widely,
and some pockets of financial distress could arise if these long-run forecasts are
realized. Also, the large majority of aggregate farm asset value is held in real
estate (about 81.7 percent in 2014), so major declines in farmland value can
have a substantial impact on the aggregate balance sheet for U.S. agriculture.
Ag Efficiency/Cost Structure
The answer to lower net farm income? Agriculture
efficiency
The current market conditions and resulting long-run forecasts suggest we are in
the beginning of a down cycle in economic returns primarily for crop production,
the largest segment of agriculture across the 15-state AgriBank District. Lower
receipts and higher expenses have led to a decline in current and projected net
farm income. While strong balance sheets give individual producers a window
of opportunity to adjust to changing market conditions, the ultimate solution
in times of tighter margins must involve bringing income and expenses in line.
Historically, the successful implementation of this solution must start with
implementing a higher level of operational efficiency that drives down the
cost per unit of production. If current price forecasts are correct, enhancing
gross receipts will be very difficult, but pricing opportunities will still present
themselves. Adept marketing and risk management by producers will still have a
substantive payoff in this economic environment.
Note our use of cost per unit (or bushel) of production as distinguished from
total cost of production. Some avenues exist whereby total cost of production
may increase but unit production increases enough so that cost per unit
of production decreases. An example of this would be implementing new
machinery technologies or seed genetics.
6
Corn: Reducing the cost per bushel of production
Producers can begin by focusing on achieving efficiencies in the largest cost
categories for the commodities they produce. In these categories, even a small
increase in efficiency can result in a significant reduction in the cost per bushel
of production.
Consider corn, the largest crop in terms of total production in the AgriBank
District. The accompanying pie chart shows the USDA 2015 forecast for corn cost
of production. The top four cost categories, by share of total costs per acre, are
land, fertilizer, capital recovery (i.e., depreciation on buildings, machinery and
equipment) and seed.
The greatest opportunity for corn producers is to become more efficient in their
cost of land, fertilizer, buildings, machinery and equipment, and seed. If you’re a
corn producer, you need to answer some tough questions. Are you in a position
to negotiate more favorable terms to rent cropland? What is the trade-off on
your fields between fertilizer/chemical usage and the choice of seed (genetically
modified or not)? Would it be more cost-effective to delay purchases of new
equipment when compared to the anticipated maintenance costs for new
equipment? Could use of precision farming and Enterprise Resource Planning
(ERP) improve your productivity and realize enough cost savings to justify the
investment? The answers to these and related questions likely will be different
for each producer, depending on their unique circumstances.
The USDA forecasts for net farm income don’t account for any “shocks” to the
system such as weather events. Nor do they account for changes in producer
behavior. Producers should not accept the forecasts as inevitable. They can help
shape the future—and potentially do better than the forecasts—if they can
reduce their cost structure on a per unit basis.
USDA 2015 Corn Cost
of Production Forecast
Top 4 Cost Categories with Cost
Per Acre and % Share of Total
Costs
Source: USDA Economic Research
Service (ERS) November 2014 Cost of
Production Forecasts
ALL OTHER
COSTS,
$164.68,
24%
LAND,
$174.22,
25%
SEED,
$101.23,
15%
CAPITAL
RECOVERY,
$101.39,
15%
FERTILIZER,
$142.36,
21%
7
The cost of borrowing: Farmers in a stronger position today
than in the 1980s
Another potentially significant cost for ag producers is the cost of borrowing. The
cost of borrowing money for equipment, home mortgages, farm real estate and
operations is substantially lower today than in the 1980s.
In 2012, approximately 4 percent of U.S. farmers held 68 percent of total U.S.
farm debt. This contrasts with the time period just prior to the farm crisis years
(around 1979) when approximately 30 percent of U.S. farmers held approximately
the same share (70 percent) of U.S. farm debt. While a smaller share of the total
farm population, the 4 percent of U.S. farmers holding most of the debt in 2012
produced a larger share of aggregate net farm income (approximately 48 percent)
when compared to the 30 percent of farmers in 1979 (approximately 42 percent).
In 2012, approximately 75 percent of U.S. farming operations were debt-free
compared to just 32 percent in 1979. Note, however, that the USDA counts small
hobby farms as farming operations and these are a more significant portion of
the U.S. farm population total when compared to 1979.
In contrast to the double-digit rates of the 1980s, interest rates remain near
historically low levels today. Also, there is greater availability of fixed long-term
rates on agricultural loans today, which allows borrowers to lock in current low
rates. Total aggregate farm interest expense, which exceeded aggregate net
farm income in 1983 by $6.3 billion (150 percent of NFI), was just 14 percent of
aggregate net farm income in 2012.
As producers look for ways to drive down input costs such as land, fertilizer, machinery and
seed, they can also look for ways to lower their cost of financing.
1980s
In 1979, 70% of the farm debt was held
by approximately 30% of the farming
operations. This 30% of the farming
operations produced approximately 42% of
the net farm income.*
In 1979, the percentage of farming
operations with no debt was approximately
32%*
Historically high interest rates. Prime rate in
1981 was 21%, and Fed Funds rate in 1981
was as high as 19%.
Most loans had variable interest rates
In 1983, total farm interest expense was
approximately 150% of net farm income*
TODAY
In 2012, 68% of the farm debt was held by
approximately 4% of the farming operations.
This 4% of the farming operations produced
approximately 48% of net farm income.*
In 2012, the percentage of farming
operations with no debt was approximately
75%*
Historically low interest rates. Prime rate is
3.25%, and Fed Funds rate is 0.25%.
More use of fixed interest rates, with many
borrowers having already locked in recordlow rates
In 2012, total farm interest expense was
approximately 14% of net farm income*
Source: USDA Ag Census (1979 data) and Agricultural Resource Management Survey (2012 data),
financial data, and AgriBank internal calculations.
8
Insurance, risk management tools designed to protect farm
income
With the prospect of falling net farm income over the next decade, in addition to restructuring
production costs, producers should consider protecting their income with insurance and risk
management tools. New programs and products that have been introduced since the 1980s will
help reduce the odds of a repeat of the 1980s farm crisis. The following are two such resources:
CROP/REVENUE INSURANCE. The aggregate farm income statement presented by the USDA
does not include crop/revenue insurance premiums, subsidies, and indemnities. In the past
two Farm Bills, a greater emphasis of producer support has shifted to the crop insurance title
programs and away from the traditional commodity title programs. In the 1980s and 1990s, the
crop insurance program had much lower participation rates, revenue insurance only became
available as a pilot program in 1994, and almost all government support came through the
commodity title programs. By excluding crop/revenue insurance, the USDA aggregate income
statement may understate the level of government support to producers when compared to
previous decades.
MARKET RISK MANAGEMENT TOOLS. Producers today have a greater array of market risk
management tools available and are much more adept at using these tools when compared
to the 1980s and 1990s. Commodity options were reintroduced on a pilot basis for corn and
soybeans in 1984 and eventually became available on all commodity futures by the end of
the 1990s. Over-the-counter (OTC) contracts, including commodity swap products such as
AgriHedge (available from Farm Credit Associations affiliated with AgriBank), were rarely
available in agricultural commodities until the early 2000s and then were mostly tailored to the
needs of commercial users. Only in the past five years have OTC products with more producerfriendly features become more widely available.
Taking the bull by the horns
Producers are not able to control market forces, such as commodity prices, that affect their financial
well-being. But they can control how they respond to those forces as they plan how to protect their
income statements and balance sheets. If you’re a producer, the following are steps you can take to
adapt to today’s agriculture efficiency cycle:
Understand all of the primary factors that determine your cost per unit of production
Research and thoroughly evaluate those practices, techniques and technologies that have the
potential to reduce the major cost of production categories. Adopt those that can have a major
impact on your cost per unit of production.
Take advantage of historically low interest rates by locking in fixed rates when appropriate
Use crop/revenue insurance and sound, prudent marketing strategies to protect and enhance
the gross revenue side of the farm income statement
Don’t let today’s market cycle keep you down. The forecasted decline in net farm income is not a
given if producers take control of their income statements and their future through the prudent
deployment of cost-reduction and risk management strategies.
9
Associations in the AgriBank District
FCS of
North Dakota
For more
information
FCS of
Mandan
USDA AGRICULTURAL BASELINE. This
site contains projections of farm
receipts, expenses and income
in Table 36. This information is
presented in the form of a simplified
income statement and includes
projections of both net cash income
and net farm income. http://
www.usda.gov/oce/commodity/
projections/index.htm
AgStar
Financial
Services
United
FCS
United
FCS
USDA ECONOMIC RESEARCH
SERVICE (ERS) FARM INCOME AND
WEALTH STATISTICS. Much of the
data comes from the annual
Agricultural Resource Management
Survey (ARMS), which is jointly
administered by the USDA-ERS
and National Agricultural Statistics
Service (NASS) and surveys
approximately 30,000 farms each
year across 48 states. http://www.
ers.usda.gov/data-products/farmincome-and-wealth-statistics.aspx
AgCountry FCS
Badgerland
Financial
Farm Credit Services
of America
GreenStone
FCS
1st FCS
AgriBank Offices
FCS Financial
Farm Credit
Illinois
Farm Credit
Mid-America
Territory served by AgHeritage FCS and Delta
Territory not served by AgriBank District Associations
Territory served by Progressive FCS and Farm Credit Midsouth
FCS of
Western
Arkansas
Progressive FCS
Farm Credit Midsouth
AgHeritage FCS
Delta
About AgriBank
AgriBank is one of the largest banks within the national Farm Credit System,
with more than $90 billion in total assets. Under the Farm Credit System’s
cooperative structure, AgriBank is primarily owned by 17 affiliated Farm Credit
Associations. The AgriBank District covers America’s Midwest, a 15-state area
stretching from Wyoming to Ohio and Minnesota to Arkansas. About half of
the nation’s cropland is located within the AgriBank District, providing the Bank
and its Association owners with expertise in production agriculture. For more
information, visit www.AgriBank.com.
Contacts
FARM CREDIT. Whether farmers,
ranchers or other borrowers are
looking to manage day-to-day
operations, expand operations, take
advantage of new opportunities
or prepare for changing economic
cycles, Farm Credit can help them
access needed financing and other
financial solutions. Find a local Farm
Credit Association at
www.AgriBank.com.
MEDIA INQUIRIES
OTHER INQUIRIES
Kirstin Brost Grantham
Corporate Communications
[email protected]
(651) 282-8635
John Share
Senior Writer
[email protected]
(651) 282-8634
ADDRESS
AgriBank
30 E. 7th Street, Suite 1600
St. Paul, MN 55101
10


© Copyright 2026