
Anisotropy models for spatial data - Informatique de MIA
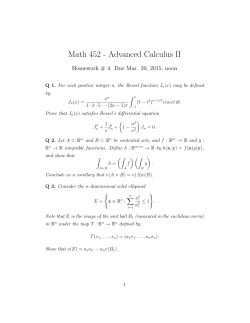
Anisotropy models for spatial data
D. Allarda , R. Senoussia and E. Porcub
a
Biostatistique et Processus Spatiaux (BioSP), INRA, Site Agroparc, 84914 Avignon, France
b
Departamento de Matematica, Universidad Santa Maria, Valparaso, Chile
Running title: Anisotropy models for spatial data
Corresponding author: D. Allard. Email: [email protected]
Summary
This work addresses the question of building useful and valid models of anisotropic variograms
for spatial data that go beyond classical anisotropy models, such as the geometric and zonal
ones. Using the concept of principal irregular term, variograms are considered, in a quite
general setting, having regularity and scale parameters that can potentially vary with the
direction. It is shown that if the regularity parameter is a continuous function of the direction,
it must necessarily be constant. Instead, the scale parameter can vary in a continuous or
discontinuous fashion with the direction. A directional mixture representation for anisotropies
is derived, in order to build a very large class of models that allow to go beyond classical
anisotropies. A turning band algorithm for the simulation of Gaussian anisotropic processes,
obtained from the mixture representation, is then presented and illustrated.
Keywords Anisotropy, Covariance, Isotropy, Spatial Statistics, Turning Band Method, Variogram.
1
Introduction
In spatial statistics the assumption of isotropy is very common despite being very restrictive
for describing the rich variety of interactions that can characterize spatial processes. This
1
is probably due to a combination of at least two reasons. Isotropic models are obviously
mathematically easier to build than anisotropic ones and, being more parsimonious, the
estimation of their parameters is more feasible, in particular when the sample size is small.
When anisotropy is modeled, anisotropic models are in the vast majority of cases restricted to
the classical geometric and zonal anisotropy models, which in essence amounts to transform
the coordinates by means of a transformation matrix (Chil`es and Delfiner, 2012, pp. 98–100).
The literature on anisotropy models evading from these two classical models is very sparse,
at the exception of the approaches based on componentwise anisotropy (Ma, 2007; Porcu et
al., 2006).
The present work has been prompted by the following question, not uncommon in geostatistics. Suppose that, when exploring a given spatial dataset, the empirical variograms
computed in different directions show not only varying ranges and/or sills, but also significantly different behaviors at the origin, e.g. close to a quadratic behavior in one direction and
close to a linear behavior in the perpendicular direction. It is well known that the presence
of a linear trend in one direction induces a quadratic behavior of the empirical variogram
along that direction. The scientist modeling such data is thus faced to the following problem:
should these variations of regularity be modeled by adding a linear trend, or can they be
modeled within the random field model using a variogram model whose regularity parameter
changes with the direction as proposed in Eriksson and Siska (2000) and Dowd and Ig´
uzquiza
(2012)? Providing a definitive answer to this question requires to first address a collection of
theoretical issues: Is such a model admissible? Can we find necessary and sufficient validity
conditions for anisotropy models? Can we find a full characterization of admissible anisotropy
models, having zonal and geometrical models as special cases? Can we easily simulate from
those?
The purpose of this paper is to provide a full characterization of admissible anisotropy
models and, based on this, to propose a large class of anisotropy models that includes all
2
known models of anisotropy. Section 2 sets the notations and makes general reminders on
variograms that will be useful for the presentation of our findings. In particular, spectral
representation and characterization of the regularity at the origin by means of the principal
irregular term are recalled. In Section 3 the usual anisotropy models are reviewed. Section 4
is the theoretical core of our work. From a result on fractal dimensions of surface roughness
in Davies and Hall (1999), it is shown that when the regularity of a variogram in Rd varies
continuously with the direction, it must be equal to a given constant in all directions. As a
consequence, on the plane, the regularity of a variogram must be the same in all directions,
at the exception of one single direction where it can be larger than the common value.
Then, a full characterization of admissible anisotropies is obtained, based on a result in
Matheron (1975). This result is revisited, and its equivalence with directional mixtures of
zonal anisotropies is shown. Through parametric or non-parametric constructions, it allows to
evade from the classical anisotropy models and it provides the basis for simulating anisotropic
random fields using a modified turning band algorithm. New Anisotropy models are presented
on the plane, along with realizations from these models.
2
2.1
Covariance Functions and Variograms
Stationarity and spectral representations
We start by recalling second order properties of Gaussian fields which are necessary for the
rest of this paper. This part is largely expository and the reader is referred to Chil`es and
Delfiner (2012), Gneiting et al. (2001), and the more recent paper by Porcu and Schilling
(2011) for a thorough overview. We will consider Gaussian fields {Z(s)}, s ∈ Rd , that are
either weak or intrinsic stationary. The former assumes that the first order moment is finite
and constant, and that the covariance cov{Z(s), Z(s0 )} depends exclusively on the lag vector
s − s0 , thus defining the covariance function C : Rd → R,
C(h) = cov{Z(s), Z(s + h)},
3
s, h ∈ Rd .
The assumption of intrinsic stationarity is more relaxed. A Gaussian field is called intrinsically
stationary if first and second moments of differences Z(s + h) − Z(s) are finite and stationary,
thus defining the variogram γ : Rd → R+ ,
γ(h) = 0.5var{Z(s + h) − Z(s)} = 0.5E[{Z(s + h) − Z(s)}2 ],
s, h, ∈ Rd .
For the remainder of the paper, it will be useful to decompose the vector h = (h1 , . . . , hd ) ∈ Rd
into its modulus r = khk and its direction θ ∈ Sd−1 , thus writing h = (r, θ) ∈ R+ × Sd−1 . We
shall make equivalent use of r or khk for the Euclidean norm of h as will be apparent from
the context. For two directions θ and η belonging to Sd−1 , we shall make a slight abuse of
notation and write cos(η − θ) = cos(η, θ) =< η, θ >, since kηk = kθk = 1.
Parameters of covariance functions relate in general to variance, scale and regularity at
the origin. Unbounded variograms are associated to intrinsic random functions for which
the variance of Z(·) is infinite. For bounded variograms, it is well known that the sill of
the variogram, σ 2 , must be identical in all direction. Without loss of generality, we will set
σ 2 = 1 from now on, except if explicitly stated otherwise. Discontinuities at the origin of the
variogram do not depend on direction. Thus, throughout we are only considering variograms
being continuous at the origin. The scale parameter, denoted b, is associated to the lag vector
h or its modulus khk. In our notations, b is homogeneous to khk, so that covariance functions
and variograms will be functions of the ratio h/b.
A necessary and sufficient condition for a candidate mapping C : Rd → R to be a covariance function is that of positive definiteness: for any finite dimensional collection of points
P P
{si }ni=1 and any real coefficients {ai }ni=1 , we have ni=1 nj=1 ai C(si −sj )aj ≥ 0. The function
C is characterized through Bochner’s theorem as being the Fourier transform of a positive
and bounded measure.
A necessary and sufficient condition for γ : Rd → R to be a variogram is that of conditional
P P
negative definiteness, that is, the inequality above reads: − ni=1 nj=1 ai γ(si −sj )aj ≥ 0, the
P
coefficients {ai }ni=1 being additionally restricted to be a contrast, i.e. ni=1 ai = 0. The class
4
of variograms being broader than that of covariance functions, more attention will be given
through the manuscript to variograms rather than covariances. The set of variograms is a
convex cone, closed under pointwise convergence and linear combinations with non-negative
coefficients. As a result, mixtures of variograms γ(·; ξ) with respect to finite mixtures µ(dξ)
are variograms. We will make use of the analogue of Bochner’s representation theorem for
variograms (Schoenberg, 1938b) and Chil`es and Delfiner (2012, p. 69).
Theorem 1 (Schoenberg, 1938) Let γ : Rd → R be a continuous function satisfying
γ(0) = 0. The following three properties are equivalent:
i) γ(·) is a variogram on Rd ;
ii) exp{−ξγ(·)} is a covariance function for all ξ > 0;
iii) γ(·) is of the form
Z
γ(h) =
Rd
1 − cos(2π < ω, h >)
χ(dω)
4π 2 kωk2
(1)
where χ is a positive symmetric measure with no atom at the origin and satisfying
Z
Rd
χ(dω)
< ∞.
1 + 4π 2 kωk2
(2)
The spectral measure of the variogram is ν(dω) = χ(dω)/4π 2 kωk2 . The condition in Eq.
R
R
(2) equivalent to kωk≥ε ν(dω) < ∞ and kωk<ε kωk2 ν(dω) < ∞, for all ε > 0. As a direct
application of Theorem 1, the function γ(h) = ckhkβ is a valid variogram for 0 < β < 2 and
c > 0 in Rd , for any d ∈ N. It is referred to as the “power variogram”. Its associated measure
R
χ(dω) is proportional to kωk2−β−d dω. If ν(Rd ) < ∞, γ(·) is of the form σ 2 {1 − Rd cos(2π <
ω, h >)ν(dω)}. In this case the variogram is bounded and there exists a covariance function
C : Rd → R, with spectral measure ν as above, such that γ(h) = C(0) − C(h).
5
2.2
Mixture representation of isotropic covariance functions and variograms
Covariance functions and variograms are called isotropic or radially symmetric when there
exists mappings ϕ : [0, ∞) → R and and ψ : [0, ∞) → R+ such that
C(h) = ϕ(khk),
γ(h) = ψ(khk),
h ∈ Rd .
Following Daley and Porcu (2013), we denote Φd the class of continuous mappings ϕ :
[0, ∞) → R with ϕ(0) = 1 and such that there exists a weakly stationary Gaussian
field on Rd whose covariance function is ϕ(khk). The classes Φd are nested, so that
T
Φ1 ⊃ Φ2 ⊃ . . . ⊃ Φ∞ = k≥1 Φk , the inclusion relation being strict, where Φ∞ is the
class of functions which are isotropic and positive definite on any d-dimensional Euclidean
space. We also introduce the class Ψd of continuous mappings ψ : [0, ∞) → R+ such that
there exists a weakly or an intrinsically stationary Gaussian field whose variogram is ψ(khk).
The class Ψd is also strictly nested. If Z(·) is weakly stationary with covariance function
ϕ ∈ Φd , the function ψ such that ψ(·) = ϕ(0) − ϕ(·) belongs necessarily to Ψd . There are
however functions of Ψd without counterpart in Φd . Table 1 provides examples of unbounded
members of Ψ∞ .
A mapping γ from Rd to R is said to be the radial or isotropic version of a member of the
class Ψd when γ(h) = ψ(khk). Anisotropic covariance functions will be derived by applying
to ψ ∈ Ψd a scaling factor b(θ) function of the direction θ = h/khk, i.e. γ(h) = ψ{khk/b(θ)}.
Table 1: Some unbounded elements of the class Ψ∞ .
Variogram
Name
Parameters
ψ(r) = (r/b)β
ψ(r) = [(r/b)β + 1]α − 1
ψ(r) = log[(r/b)β + c] − log c
Power
Gen. Power
Log-Power
0 < β ≤ 2, b > 0
0 < β ≤ 2, 0 < α < 1, b > 0
0 < β ≤ 2, b > 0, c > 1.
6
2.3
Regularity and Principal Irregular Term within the class Ψd .
Regularity properties are presented under the assumption of isotropy. Characterization of
the regularity of anisotropic variograms is fully addressed in Sect. 4. The behavior of the
variogram near the origin is one of its most important characteristics. It relates to the
regularity of the associated random field and infill asymptotic properties, see e.g. Stein
(1999). Mean squared continuity of the random field is equivalent to the variogram being
continuous at the origin. A variogram that is 2m times differentiable at the origin corresponds
to a random field that is m times mean squared differentiable.
The regularity properties of isotropic variograms on Rd is given by the behavior of ψ ∈ Ψd
as r → 0+ . All functions in Table 1 behave as a(r/b)β + o(rβ ) when r → 0+ , with 0 < β ≤ 2
and a > 0, so that the correspondent radial version γ will behave as a(khk/b)β + o(rβ ), as
khk → 0. Similar observations can be made for members of the class Φd . In this class,
regularity properties are characterized by the behavior of 1 − ϕ(r) as r → 0+ which, with a
slight abuse of language, will be referred to as the regularity at the origin or the behavior
at the origin of the covariance function. For instance, the powered exponential covariance
C(r) = exp{−(r/b)β } and the Cauchy covariance C(r) = {1 + (r/b)β }−α/β , with 0 < β ≤ 2,
α > 0 and b > 0 also behave as 1 − c(r/b)β + o(rβ ) when r → 0+ . The behavior at the origin
of the Mat´ern covariance function
CMat (r) =
r κ
r
1
K
,
κ
2κ−1 Γ(κ) b
b
r ∈ [0, ∞),
where b, κ > 0, depends on the parameter κ. It is proportional to (r/b)2κ if 0 < κ < 1; it is
proportional to (r/b)2 log(r/b) if k = 1 and proportional (r/b)2 whenever κ ≥ 1.
Following Stein (1999), the regularity of an isotropic variogram is described using the
concept of principal irregular term which relates to the property of ψ(r) when ψ ∈ Ψd and
r tends to zero from above. Loosely speaking, the principal irregular term is the term rβ
with lowest degree of the series expansion of ψ(r) that is not an even power (Matheron, 1970;
7
Chil`es and Delfiner, 2012, p. 61). Stein (1999, p.29) defines the principal irregular term of
ψ(r) as the function g such that g(r)r−2n → 0 and |g(r)|r−2n−2 → ∞ for some n ≥ 0 as
P
r → 0+ and γ(r) = nj=0 cj r2j + g(r) + o(|g(r)|) as r → 0+ . On the examples seen so far
and for virtually all models used in practice, principal irregular terms are either of the form
g(r) = αrβ , for 0 < β < 2 positive and not an even integer, or g(r) = αr2k log r, for some
positive integer k. Obviously, for power variograms, it is the power variogram itself.
3
Overview of anisotropy models
Anisotropy is usually modeled through geometric, zonal or separable models of anisotropy
(Chil`es and Delfiner, 2012, pp. 98-100). These elementary models of anisotropy can be
composed to provide more complex anisotropies, as in Journel and Froidevaux (1982).These
models are briefly recalled, before being extended in a common framework in Sect. 4. They
are illustrated on the plane in Fig. 1.
Geometric anisotropy
A variogram in Rd displays a geometric anisotropy if it is of the form γ(h) = ψ(kAhk),
for ψ ∈ Ψd , where A is a transformation matrix, i.e. the product between a diagonal matrix
of scaling factors, say D, and a rotation matrix. In this model, the function γ inherits the
properties of the associated ψ ∈ Ψd in terms of regularity, in all directions. It can be shown
that the contour lines of this variogram are represented by ellipsoids. If ψ(r) = r, the inverse
of the slope of γ(h) as a function of the direction θ is represented by an ellipsoid. Figure 1
(left panel) provides an illustration of a geometrical anisotropy in R2 . It shows, in a polar
representation, the graph of the scale parameter b(θ) of the exponential variogram
h 1/2 i
−2
2
2
γ(h) = 1 − exp{−r/b(θ)} = 1 − exp −r b−2
cos
(θ
−
θ
)
+
b
sin
(θ
−
θ
)
,
0
0
1
2
−2
2
2
−1/2 . As expected, the shape of the graph is
with b(θ) = {b−2
1 cos (θ − θ0 ) + b2 sin (θ − θ0 )}
an ellipse.
8
Zonal Anisotropy
Zonal anisotropy is a degenerate case of geometrical anisotropy, obtained when some
of the diagonal elements of D are equal to 0. Suppose that the d0 non null components
of D are the d0 first coordinates of Rd . Then, the variogram is strictly equal to 0 in any
0
direction perpendicular to Rd . Equivalently, the associated random field is constant within
0
any subspace of Rd that is perpendicular to Rd . Of particular importance for the rest of this
work will be the case d0 = 1, i.e. when the variogram depends only on one component. Fix
θ0 ∈ Sd−1 . The corresponding zonal anisotropy variogram in a direction θ is then
γ(h) = ψ{r| cos(θ − θ0 )|},
(3)
where ψ ∈ Ψd . If ψ has sill σ 2 and range b, the variogram γ in a given direction θ has sill σ 2
and range b/| cos(θ − θ0 )|, except in any direction perpendicular to θ0 where the variogram is
identically zero. Figure 1 (central panel) is an example of zonal anisotropy in the plane. It
shows b(θ) as a function of θ for the exponential variogram
γ(h) = 1 − exp{−r/b(θ)} = 1 − exp{−r| cos(θ − θ0 )|/b1 },
where b(θ) = b1 /| cos(θ − θ0 )|. The graph is made of two parallel lines, which can be viewed
as the degenerate case of an ellipse when the major axis tends to infinity.
In practice, a real phenomenon is rarely modeled through a pure zonal model. In general,
P
there are several components γj (h) with γ(h) = Jj=1 γj (h), some of which being zonal. There
is a large variety of possible situations, which will not be detailed here. Interested readers
are for example referred to Chil`es and Delfiner (2012, p. 100) for illustrative examples. With
zonal anisotropy, one can model variograms whose regularity varies with directions, as shown
in the following example. In R2 , let γ(h) = γ1 (h) + γ2 (h), where γ1 (h) has a zonal anisotropy
with γ1 (h) = (r| cos θ|)β1 and γ2 (h) is isotropic with γ2 (h) = rβ2 . Let further assume that
β1 < β2 . Then, along all directions θ ∈
/ {π/2, −π/2} the principal irregular term is equal to
rβ1 . For θ ∈ {π/2, −π/2}, it is equal to rβ2 , which is more regular than rβ1 . We emphasize
9
that in this example the principal irregular term of the variogram varies with θ, but only
discontinuously along two directions.
Separability: componentwise anisotropy
This case corresponds, possibly after appropriate rotation, to the tensorial product
C(h) =
p
Y
i=1
where hi ∈ Rdi and
Pp
i=1 di
Ci (hi ) =
p
Y
ϕi (khi k) ,
ϕi ∈ Φdi ,
i=1
= d. These models are also called separable. The function C is
the tensor product of the radial versions of members of the classes Φdi , i = 1, . . . , p. It is for
Q
example the covariance function of the random field Z(s) = pi=1 Zi (si ), where Zi (si ) is any
random field with covariance Ci on Rdi , independent on all other random fields Zj (·), j 6= i.
Separable models can also lead to discontinuities of the regularity parameter with respect
to the direction on a finite set of directions, as illustrated in the following example. Let
us consider, in R2 , the product of the two stable covariance functions exp{−|h1 |β1 } and
exp{−|h2 |β2 }, with β1 < β2 . Then, the corresponding variogram is
γ(h) = 1 − exp{−|h1 |β1 } exp{−|h2 |β2 }
= 1 − exp{−rβ1 [| cos θ|β1 + rβ2 −β1 | sin θ|β2 ]},
which shows that the principal irregular term is rβ1 in all directions θ ∈
/ {π/2, −π/2}, whereas
it is rβ2 in the directions {π/2, −π/2}. The right panel in Fig. 1 represents the anisotropy
of the following separable model of covariance
−1
γ(h) = 1 − exp{−r/b(θ)} = 1 − exp{−rb−1
1 | cos(θ − θ0 )| − rb2 | sin(θ − θ0 )|},
−1
−1
with b(θ) = {b−1
1 | cos(θ − θ0 )| + b2 | sin(θ − θ0 )|} . Notice that the same behavior of the
principal irregular term was also obtained with a very different model of variogram in the
previous paragraph.
The shapes of the graph of b(θ) obtained in Fig. 1 differ greatly with the type of anisotropy
model. The possible shapes of the graph of b(θ) that can be obtained for these three classical
10
−2
0
2
4
4
−4
−2
0
2
4
−4
−2
0
2
4
2
0
−2
−4
−4
−4
−2
0
2
4
−4
−2
0
2
4
Figure 1: Examples of geometric (left), zonal (center) and separable anisotropy (right). Each
panel shows in a polar representation the graph of the scale parameter b(θ) as a function of
the angle θ, for b1 = 1, b2 = 4 and θ0 = π/6 for an exponential variogram (i.e. β = 1).
models of anisotropy in the plane are summarized in Table 2. Geometric anisotropies yield
always elliptical shapes, whereas graphs associated to zonal anisotropies are always the union
of two parallel lines. For separable anisotropies the shape of the graph varies with the
exponent of the principal irregular term, β, from 4-cusp hypocyclo¨ıds when 0 < β < 1 to
ellipses when β = 2.
Table 2: Possible shapes of the graph of b(θ) for three classical models of anisotropy. The
parameter β is the exponent of the principal irregular term.
Model
Geometric
Zonal
Separable
4
0<β<1
β=1
1<β<2
— Ellipse —
— Parallel lines —
4-cusp hypocyclo¨ıd Rhombus
Convex
β=2
Ellipse
A general characterization of anisotropy
A complete characterization of anisotropic variograms is now provided. First is addressed the
characterization of the regularity at the origin. It will be shown that regularity parameters
that vary continuously with the direction must be constant. A complete characterization of
11
the scale parameter is then provided.
4.1
Isotropy of the regularity at the origin
Eriksson and Siska (2000) and Dowd and Ig´
uzquiza (2012) proposed the following anisotropic
power variogram model in R2
γAP (h) = a(θ)rβ(θ) ,
h = (r, θ) ∈ R+ × [0, 2π),
in which the scale parameter a(θ) and the power coefficient β(θ) are continuous functions of
θ, with the usual restriction a(θ) > 0 and 0 < β(θ) ≤ 2. The mapping β(·) relates to the
regularity at the origin of the variogram, i.e. to the smoothness of the random field (Stein,
1999), whilst the function a(·) is a scaling factor. It was further proposed that β(θ) varies in
a way similar to the geometric anisotropy, i.e. according to an ellipse.
The model γAP (h) is unfortunately not valid, except in a very particular case. In Davies
and Hall (1999) it was shown that if a random field has a well defined fractal index in
each direction, then the fractal dimensions of its line transect processes are the same in
all directions, except possibly one, whose dimension may be less than in all others. For
power variograms, the fractal dimension in direction θ, D(θ), is related to β(θ) through
D(θ) = d + 1 − 12 β(θ). As a direct application, a necessary condition for the above model
to be valid is thus that β(·) = β in all directions, except one where it can be larger than β,
which leads to the following proposition, adapted from Davies and Hall (1999).
Proposition 1 The function γAP : R+ × Sd−1 → R+ with h = (r, θ), d ≥ 2 and such that
γAP (h) = a(θ)rβ(θ) , where a(θ) > 0 and where β(θ) is a continuous function on Sd−1 with
0 < β(θ) ≤ 2, is a valid variogram on Rd if and only if β(θ) is constant on Sd−1 .
The proof, shortly sketched here, will be used for the next Theorem. For the sake of completeness, it is provided in Appendix. The “if” part is straightforward, since the power
variogram γ(h) = a(θ)rβ is valid on Rd , d ≥ 1, provided that a(θ) is a valid model of
12
anisotropy. The “only if” part is proven by building a simple counter-example in R2 . It
is shown that the conditional definite negativeness condition is not verified for the contrast
Z(0, 0) − Z(−r cos θ, r sin θ)/2 − Z(r cos θ, r sin θ)/2 as r → 0, unless β(θ) is constant. The
proof is then completed by noticing that a function not c.d.n. in R2 is necessarily not c.d.n.
in Rd , for d > 2.
The next step is to make this statement more general, thus leading to our main theoretical
result. It is expected that Proposition 1 holds for a much larger class of variograms than
power variograms, as formally stated below. We first recall that a function f : R+ → R+ is
said to be regularly varying at 0 if limr→0 f (αr)/f (r) < ∞ for all α > 0. Polynomials, power
functions and logarithms are regularly varying functions at 0.
Theorem 2 Let Z(·) be an intrinsic random field on Rd with a continuous variogram γ(·)
in the class Ψd with a behavior at the origin of the form
g(h) = a(θ)rβ(θ) f (r)
(4)
where 0 < β(·) ≤ 2, the function a(·) is a positive, finite, continuous function on Sd−1 and
the function f (·) is regularly varying. Then, if β(·) is a continuous function on Sd−1 , it is
constant.
The proof of Theorem 2 is given in Appendix. Particular cases for condition (4) are f (r) = 1
and f (r) = log r, which lead to principal irregular terms of the form gθ (r) = rβ(θ) , respectively
gθ (r) = r2 log r when β = 2. Proposition 1 is thus a special case of Theorem 2. Conditions of
Theorem 2 are quite general, since they include all known expressions of principal irregular
terms. They are verified by virtually all variograms used in practice: Mat´ern class, Cauchy
variograms, power variograms, logarithm variogram, etc.
Theorem 2 thus states very generally that the regularity of a variogram, and hence that of
the associated random field cannot vary continuously with the direction. When the regularity
parameter varies, it is only possible along some directions: in 2D, there is at most one direction
13
corresponding to a zonal anisotropy model along which the regularity is smoother than in
any other direction. In 3D, there is either a single direction, or a single plane on which the
regularity is smoother.
4.2
Anisotropy of the scale parameter as directional mixtures of zonal
anisotropies
Let us first go back to variograms behaving near the origin according to
γ(h) = a(θ)rβ + o(rβ ),
h = (r, θ) ∈ R+ × Sd−1 ,
(5)
with 0 < β ≤ 2. In order to define a valid model of variogram in Rd , the function a(θ)
has to verify some conditions. Necessary and sufficient conditions for a(θ) were presented in
Matheron (1975, p. 96). It is rephrased below, using our notations.
Theorem 3 (Matheron, 1975) Suppose γ is a variogram on Rd such that, for any direction θ ∈ Sd−1 , Eq. (5) holds with a : Sd−1 → R+ being a continuous mapping, and 0 < β < 2.
Then, as khk → 0, the variogram admits a representation (5) with
Z
| cos(θ − η)|β ν(dη)
a(θ) =
(6)
Sd−1
where ν is a uniquely determined finite, non negative, symmetric, measure on Sd−1 . Conversely, if the representation (6) exists, the function γ(h) is a variogram.
Readers are referred to Matheron (1975, p. 96) for the original proof. From Theorem 3, we
are now able to provide a full characterization of the anisotropic variograms when 0 < β < 2.
Theorem 4 Suppose γ is a function such that, for any direction θ, Eq. (5) holds. Then, γ
is a valid variogram in Rd if and only if it is a finite, non negative, directional mixture of
zonal anisotropy versions of a radial variogram ψ ∈ Ψd ,
Z
ψ(r| cos(θ − η)|)ν(dη),
γ(h) =
Sd−1
where ν is a finite, non negative, mixture on Sd−1 .
14
(7)
Moreover, the scale parameter is
Z
b(θ) =
−1/β
| cos(θ − η)| ν(dη)
,
β
(8)
Sd−1
for some non negative, symmetric, measure ν defined on Sd−1 .
Proof: The “if” part is straightforward. It follows from the fact that the class Ψd is a
convex cone closed under pointwise convergence. The “only if part” is a consequence of
Matheron’s theorem, as shown now. Consider the function γ(h) = ψ{khk/b(θ)}, where b(θ)
is a continuous function of θ ∈ Sd−1 and where ψ(r) ∼ arβ as r → 0, with a > 0. Then,
Theorem 3 states that the function γ(h) = ψ{khk/b(θ)} is a valid anisotropic variogram if
and only if the scale parameter b(θ) varies with the direction according to Eq. (8), thus
leading to variograms verifying Eq. (6) as r → 0.
On the other hand, this representation actually corresponds to a directional mixture of
zonal anisotropies, as defined in Eq. (3). Let Y (z), z ∈ R, be an isotropic intrinsic random
function with radial variogram ψ ∈ Ψd and let η ∈ Sd−1 be a direction in Rd . Let us define
Zη (s) as the zonal anisotropic random field
Zη (s) = Y {ksk cos(η − ksk−1 s)},
s ∈ Rd .
The variogram of Zη (s) is thus
γη (h) = ψ{r| cos(θ − η)|},
h ∈ Rd .
Let us now consider that η is a random direction with probability measure ν˜(·) =
ν(·)/ν([0, 2π[) on Sd−1 and let us define the mixture random field:
Z(s) = Zη (s),
η ∼ ν˜.
Then, the variogram of Z(·) is
γ(h) = 0.5E[{Z(s) − Z(s + h)}2 ] = Eν˜ [0.5E[{Zη (s) − Zη (s + h)}2 | η]]
Z
= Eν˜ [γη (h)] =
ψ(r| cos(θ − η)|)˜
ν (dη).
Sd−1
15
Since ψ(r) ∼ arβ as r → 0, we thus have
γ(h) = rβ
Z
| cos(θ − η)|β a˜
ν (dη),
Sd−1
as khk → 0, which is equivalent to Eq. (6) with ν = a˜
ν . As a conclusion, Theorem 3 is
equivalent to a directional mixture representation.
Remark: Positive, finite directional mixtures of zonal anisotropies of variograms ψ ∈ Ψd
also define valid anisotropic variograms for a larger class of variograms than those verifying
the conditions of Theorem 3. It is in particular the case for those variograms whose principal
irregular term are proportional to r2 log r or proportional to r2 as r → 0.
4.3
Simulations of anisotropic fields
The above representation provides the basis for simulating anisotropic random fields, using an
anisotropic version of the turning band simulation algorithm (Lantu´ejoul, 2002, p. 192). The
general idea is to reduce the simulation of Z to the simulations of N independent processes
with variogram ψ. The expectation with respect to the measure ν˜ in Eq. (7) is replaced by
the arithmetic mean taken on the N independent realizations of Zηi (·), where (ηi )i=1,...,N are
independent directions drawn according to the probability distribution ν˜. The pseudo-code
for generating an anisotropic model is the following:
Algorithm Simulate Anistropic Random Field
1. Set N
2. Compute ν0 = ν([0, 2π[)
3. For i = 1, ..., N
(a) Draw a random direction ηi ∼ ν˜ = ν/ν0
(b) On the real line simulate a Gaussian process Yi (·) with variogram ψ ∈ Ψd .
16
4. For all sites sj = (rj , θj ), j = 1, . . . , n on which the simulation is to be performed,
compute
N
1 X
1/β
Z(sj ) = √
Yi (rj ν0 cos(θj − ηi )).
N i=1
5. Return (Z(s1 ), . . . , Z(sn )).
Variograms ψ and γ are related by Eq. (7). Thanks to Theorem 3 the behavior at the
origin of γ is the same as that of ψ, but the mixture representation changes the behavior of
ψ away from the origin. Let us denote γiso an isotropic version of γ. Then, Eq. (7) can be
re-written (Lantu´ejoul, 2002)
(d − 1)vd−1
γiso (r) = 2
dvd
1
Z
0
ψ(tr)
dt,
(1 − t2 )(d−3)/2
(9)
where vd is the d-volume of the unit ball in Rd .
When d = 2, Eq. (9) becomes γiso (r) = π −1
Rπ
0
ψ(r sin u)du after the change of variable
t = sin u, thus leading to
Z
π/2
ψ(r) = 1 + r
0
γiso
(r sin u)du,
(10)
0
0 denotes the derivative of γ . These formulas are still in integral form and not
where γiso
iso
easily handled. Gneiting (1998) derives ψ explicitly for the most commonly used covariances.
When d = 3, Eq. (9) reduces to
Z
γiso (r) =
1
ψ(tr)dt,
or
0
ψ(r) = γiso (r) + rγiso
(r).
(11)
0
Remarks
1. It is important to re-emphasize that contrarily to the usual turning band algorithm, the
directions of the lines are not uniform but must be drawn according to the directional
measure ν.
2. As apparent from Eqs. (10) and (11), the regularity at the origin is the same for ψ and
γ. The mixture representation does not alter the regularity at the origin.
17
3. A similar idea has been recently proposed in Bierm, Moisan and Richard (2014) to
simulate anisotropic fractional Brownian fields in two dimensions for a restricted class
of anisotropy. Bierm, Moisan and Richard (2014) proposes a dynamic programming
algorithm for optimizing the directions of the turning bands. Our implementation is
thus slightly less efficient but much more general since the above algorithm is valid for
any variogram, any dimension and all anisotropies.
5
Illustration: a class of anisotropy models on the plane
5.1
Classical models of anisotropy revisited
In this section, it is illustrated how to use Theorem 4 in order to build anisotropic models. We
shall stick to the case d = 2 for ease of exposition, but extension to higher dimensional spaces
is straightforward, although cumbersome in terms of notation and difficult to represent. In
R2 , Eq. (6) simplifies to
b(θ)−β =
Z
2π
| cos(θ − η)|β ν(dη).
(12)
0
Since ν is symmetric on [0, 2π[, the function b(·) is π-periodic, i.e. b(θ + π) = b(θ). Moreover,
if the measure ν is symmetric around a principal direction θ0 , so will be the function b(·).
Specific cases of Eq. (12) correspond to the well known models of anisotropy reviewed in
Sect. 3.
Isotropy
Obviously, if ν is rotationally invariant, i.e. if it is constant on [0, 2π), the function b(θ)
is also rotationally invariant and thus constant. The associated covariance is thus isotropic.
Zonal anisotropy
When the measure ν in Eq. (6) is the sum of two Dirac measures in opposite directions,
i.e.
ν(dη) = 0.5(b−β δθ0 + b−β δ−θ0 )(dη),
18
direct inspection shows that b(θ) = b/| cos(θ − θ0 )| which corresponds to the zonal anisotropy
model γ(h) = ψ{r| cos(θ − θ0 )|/b}, with ψ ∈ Ψ2 .
Anisotropy corresponding to separable covariances
This case is obtained by setting the measure ν as the sum of two Dirac measures in
perpendicular directions, i.e.
−β
−β
−β
ν(dη) = 0.5(b−β
1 δθ0 + b1 δπ+θ0 )(dη) + 0.5(b2 δθ0 +π/2 + b2 δθ0 +3π/2 )(dη).
Direct inspection shows that
n
o−1
,
b(θ) = | cos(θ − θ0 )/b1 |β + | sin(θ − θ0 )/b2 |β
(13)
which corresponds to separable covariance functions, i.e. covariance functions that are the
product of two covariances defined on the real line, along the directions θ0 and θ0 + π/2, i.e.
γ(h) = 1 − {1 − ψ(|h1 |/b1 )}{1 − ψ(|h2 |/b2 )}, where h1 = r cos(θ − θ0 ) and h2 = r sin(θ − θ0 ),
and ψ ∈ Ψ2 . The first row of Fig. 2 shows in a polar representation the scale parameter b(θ)
as a function of θ for different values of β. Let g(r) = rβ be the principal irregular term of
ψ. Then, direct inspection shows that the principal irregular term of γ in the direction θ is
i
ih
h
gθ (r) = 1 − 1 − rβ {| cos(θ − θ0 )|/b1 }β 1 − rβ {| sin(θ − θ0 )|/b2 }β
= rβ {cos(θ − θ0 )|/b1 }β + rβ {| sin(θ − θ0 )|/b2 }β
which shows clearly that the principal irregular term arising from separable covariances is
similar to that arising from the sum of zonal anisotropies in perpendicular directions.
Geometric anisotropy
The geometric anisotropy corresponds to
1/2 γ(h) = ψ (kAhk) = ψ r {cos(θ − θ0 )/b1 }2 + {sin(θ − θ0 )/b2 }2
,
where ψ ∈ Ψ2 . Then, Eq. (12) becomes
−β
b(θ)
2
2 β/2
= {[cos(θ − θ0 )/b1 ] + [sin(θ − θ0 )/b2 ] }
Z
=
0
19
2π
| cos(θ − η)|β ν(dη).
(14)
This equation is a special instance of a Fredholm integral equation of the first kind. It is
easily solved when β = 2. In this case, a simple solution is the sum of Dirac measures in the
directions θ0 and θ0 + π/2
−2
−2
−2
ν(dη) = 0.5[b−2
1 δθ0 + b1 δπ+θ0 ](dη) + 0.5[b2 δθ0 +π/2 + b2 δθ0 +3π/2 ](dη),
which is nothing but the anisotropy corresponding to separable covariance functions seen
above with β = 2. Finding exact solutions in the general case 0 < β < 2 is a task which
would lead us beyond the scope of this paper, this section being meant to be illustrative.
Excellent approximate solutions will be shown in the next section.
5.2
A new class of anisotropy models
General construction
The directional mixture representation in Eq. (12) opens new avenues for building a large
variety of valid anisotropic models. Anisotropy models are defined by the directional measure
ν, which we propose to model as a sum of kernels, wrapped on the circle. Let us consider an
even kernel function k(·) of unit mass, and let us denote kh,x0 (x) = h−1 k{(x − x0 )/h}, with
h > 0 and x ∈ R. Since ν must be π-periodic, anisotropy models will thus be defined as the
weighted sum of 2J kernels characterized by directions θj and windows hj ,
ν(dη) =
J
X
o
n
−β
(η)
+
c
k
(η)
dη.
0.5 c−β
k
hj ,θj +π
hj ,θj
j
j
(15)
j=1
Each kernel is weighted by factor c−β
j , so that the values cj can be interpreted as scale factors
in the direction θj . Specific examples with Gaussian, squared cosine and bi-squared kernels
will be shown later. This class includes zonal anisotropies as well as anisotropies arising from
separable models by letting khj ,θj → δθj when hj → 0.
Two perpendicular directions
To illustrate this class of models, we first consider anisotropy models obtained when
considering two similar kernels in perpendicular directions θ0 and θ0 + π/2, with identical
20
window parameter h,
−β
ν(dη) = 0.5c−β
1 {kh,θ0 (η) + kh,θ0 +π (η)}dη + 0.5c2 {kh,θ0 +π/2 (η) + kh,θ0 +3π/2 (η)}dη.
(16)
Figures 2 and 3 show a polar representation of the scale parameter b(θ). These plots
demonstrate clearly that it is possible to obtain, for a fixed value of β, a much larger variety
of graphs than those summarized in Table 2. When β ≥ 1, Eq. (12) implies that the graph
of b(θ) as a function θ describes the boundary of a symmetric, closed, and convex set (see
panels in the middle and right columns), tending to an ellipse as β → 2. On the contrary, the
graph is non convex when β < 1, with an increasing convexity as h increases. When c1 = c2 ,
and kh,θ0 = kh,θ0 +π/2 the periodicity of b(θ) is equal to π/2, as in Fig. 2. When one of these
two conditions is not verified, the periodicity of b(θ) is equal to π. Figure 3 illustrates some
anisotropy models when c2 6= c1 and kh,θ0 = kh,θ0 +π/2 . As h → ∞, we get that ν(dη) → ν∞
for all η, i.e. then we tend to an isotropic model.
Figure 4 shows two realizations of Gaussian random fields with an anisotropy models
corresponding to Eq. (16), for both an exponential covariance function and a power variogram
with β = 1.2. Simulations were performed using the R package RandomFields (Schlather et
al., 2015) according the algorithm Simulate Anistropic Random Field presented in Sect.
4.3. These realizations show clearly anisotropic patterns that are very different to those
obtained with geometric or separable anisotropies (not shown here). In contrast to patterns
arising from separable covariances, there is some amount of variability around the two main
anisotropy directions.
Geometric anisotropy
We show here that excellent approximate solutions to geometric anisotropies can be obtained using the following sum of kernels in perpendicular directions
"
b−β − b−β
b−β + b−β
2
2
+ 1
ν(dη) = 1
2
2b
k(2h)
#2/β
"
b−β − b−β
b−β + bβ2
2
kh,θ0 (η)dη+ 1
− 1
2
2b
k(2h)
#2/β
kh,θ0 +π/2 (η)dη,
(17)
21
where b
k(ω) is the Fourier transform of the kernel function k(η). The coefficients multiplying
the kernel functions correspond to the exact geometric anisotropy model with scale factors
equal to b1 and b2 along directions θ0 and θ0 + π/2 when β = 2. Table 3 provides the correspondence between the Gaussian, squared cosine and bi-squared kernels and their respective
Fourier transform value b
k(ω).
Figure 5 represents on a polar graph the scale factor b(θ) resulting from this approximation. The corresponding geometrically anisotropic models are also represented. It can
be observed that the match is excellent, well within statistical fluctuations usually observed
on data. As expected the approximation is better for larger values of β in agreement with
the fact that geometric anisotropy is exactly recovered when β → 2. There are only slight
differences from one kernel to the other. On all tested situations we found that the choice of
the kernel is secondary as compared to the choice the bandwidth.
Table 3: Some usual kernels and their corresponding Fourier transform.For each kernel, k(x),
R
ˆ
its Fourier transform is k(ω).
All kernels have been standardized such that R k(x)dx = 1.
The function sinc(x).
Name
Gaussian
Squared cosine
Bi-squared
Kernel, k(x)
ˆ
Fourier transform, k(ω)
π −1/2 exp(−x2 )
cos2 (xπ/2)1(−1,1)
15/16(1 − x2 )2 1(−1,1)
exp(−ω 2 /4)
{sinc(π − ω) + 2sinc(ω) + sinc(π + ω)}/2
−15{(ω 2 − 3) sin ω + 3ω cos ω}/ω 5
Three directions
This class of anisotropies is not limited to the sum of two kernels located at θ0 and θ0 +π/2.
In sharp contrast with usual models, anisotropies with more than two principal directions can
easily be defined. Figure 6 shows some anisotropic models obtained when considering three
components in Eq. (15). Figure 7 shows two realizations of Gaussian random fields with a
spherical covariance model and with a linear variogram. The anisotropy model is the result
of the sum of three kernels along (θ1 , θ2 , θ3 ) = (0, π/6, π/3). The three main directions are
22
clearly visible, in particular in the stationary case. The simulated pattern is very different to
any pattern obtained with usual anisotropy models.
6
Conclusion and Discussion
In this paper we have explored the strategies allowing to go beyond classical anisotropies. We
first proved that if the regularity parameter of a variogram does not vary discontinuously with
the direction, it must necessarily be constant. We then provided a necessary and sufficient
characterization of the anisotropy of the scale parameter as directional mixtures of zonal
anisotropy variograms, for which a straightforward simulation algorithm is derived. Far
beyond the classic zonal or geometric models of anisotropy, this representation offers a great
variety of anisotropy models. As a practical way to model quite generally a great variety of
anisotropies, a semi-parametric class of of the directional mixture, defined as the weighted
sum of kernel functions located at J main directions (θj )j=1,...,J , has been proposed.
The findings reported in this work open new avenues for the modeling of anisotropic
random fields. This paper must be seen as a first, theoretical, step in that directions. Further work is required in various directions in order build a practical geostatistical modeling
strategy. The mixture representation offers two approaches to estimate a valid anisotropy
model as given in Theorem 4. Ongoing research is undertaken to estimate the parameters
of the semi parametric model proposed in Eq. (15) using the weighted composite likelihood
proposed in Bevilacqua et al. (2012). Other semi-parametric models and/or competing estimation procedures could be proposed. In particular, the promising Bayesian approach in
Kazianka (2013) could be generalized to our representation. Alternatively, the mixture measure can be estimated non parametrically by estimating the scale parameter b(θ) in various
directions and inverting Eq. (8). We believe that this work could initiate further theoretical
work. We highlight two possible research directions. Firstly, relationships with space-time
covariance modeling should be systematically explored, e.g. in the light of the recent devel-
23
opments in Stein (2013), where generalized covariance with different smoothness parameters
in space and time were proposed within the framework of Intrinsic Random Functions of
order k. Secondly, extensions to processes defined over the sphere, for which the Euclidean
distance is no longer a suitable metric, would of great interest for model global processes on
the planet Earth.
Appendix
Proof of Proposition 1
The “only if” part is proven by building a simple counter-example in R2 . Let (r, θ) be the
polar coordinates of h. Since β(θ) is a continuous function of θ on a compact set, there
exists β1 such that 0 < β1 = minθ {β(θ)} ≤ β(θ). Without loss of generality, we will set the
X-axis in a (non necessarily unique) direction for which β(θ) is minimum, i.e. we have now
β(0) = β1 . Recall that β(θ) = β(θ + π) because the variogram is an even function. Let us
consider the points s0 = (0, 0), s1 = (−x, y) and s2 = (x, y), with x, y > 0. The contrast
Z(0, 0) − Z(−x, y)/2 − Z(x, y)/2 =
2
X
wi Z(si )
i=0
corresponds to the error made when predicting the value at s0 with the average of the values
located at s1 and s2 . Let us examine the sign of the quadratic form
Q = −
2 X
2
X
wi wj γ(si − sj )
i=0 j=0
= γAP {(−x, y)} + γAP {(x, y)} − 0.5γAP {(2x, 0)}
= a(π − θ)rβ(π−θ) + a(θ)rβ(θ) − 0.5a(0)(2x)β1 ,
where θ denotes the angle of the vector s2 − s0 with the X-axis and r2 = x2 + y 2 . The
quadratic form Q would correspond to the variance of the linear combination if γAP (h) was
a valid variogram. Let us denote βm = min{β(π − θ), β(θ)} ≥ β1 . Using x = r cos θ and
dividing by rβm the above expression becomes
Q
= a(π − θ)rβ(π−θ)−βm + a(θ)rβ(θ)−βm − 0.5a(0)(2r cos θ)β1 −βm .
r βm
24
(18)
As r → 0, the first two terms in (18) are bounded by a(π − θ) + a(θ) and the last term is
proportional to −rβ1 −βm with β1 ≤ βm . We thus see that Q becomes negative as r → 0
unless βm = β1 . We thus obtain the following result for all 0 < θ < π/2:
Q ≥ 0 as x → 0 ⇔ min{β(π − θ), β(θ)} = β1 .
θ
(19)
Using topological arguments, one can then show that β(θ) = β1 , for all θ. The proof is
completed by noticing that if a function is not c.d.n. in R2 , it is not c.d.n. in Rd , for d ≥ 2.
Proof of Theorem 2
For the same construction as in Proposition 1, the quadratic form Q now reads
Q = a(π − θ)rβ(π−θ) f (r) + a(θ)rβ(θ) f (r) − 0.5a(θ)(2x)β1 f (2x),
and thus
Q
β(π−θ)−βm
β(θ)−βm
β1 −βm f (2r cos θ) β1 −βm
r
. (20)
=
a(π
−θ)r
+a(θ)r
−0.5a(0)(2
cos
θ)
β
f (r)
f (r)r m
As r → 0, the first two terms in (20) are bounded and, since f is a slowly varying function
at r = 0, the last term tends to −∞. Hence, Q becomes negative as r → 0 unless βm = β1 .
The end of the proof is now exactly similar to that of Proposition 1.
References
Bevilacqua, M., Gaetan, C., Mateu, J., & Porcu, E. (2012) Estimating space and space-time
covariance functions for large data sets : a weighted composite likelihood approach. J. Am.
Statist. Assoc. 107, 268–280.
Bierm´e, H., Moisan, L. and Richard F. (2014) A turning-band method for the simulation of anisotropic fractional Brownian fields, J. of Comput. Graph. Statist., DOI:
10.1080/10618600.2014.946603.
25
Chil`es, J.P.& Delfiner, P. (2012). Geostatistics: Modeling Spatial Uncertainty. Second Edition.
New-York: John Wiley & Sons.
Daley, D.J. & Porcu, E. (2013). Dimension walks through Schoenberg spectral measures. P.
Am. Math. Soc.. In press.
Davies, S. & Hall P. (1999) Fractal analysis of surface roughness by using spatial data. J. R.
Statistic. Soc. B, 61, pp. 3–37.
Dowd, A. & Ig´
uzquiza, E. (2012) Geostatistical analysis of rainfall in the West African Sahel,
in IX Conference on Geostatistics for Environmental Applications, geoENV2012, Ed. J.
G´omez-Hern´
andez, Editorial Universitat Polit`ecnica de Val`encia, pp. 95–108.
Eriksson, M. and Siska, P. (2000) Understanding Anisotropy Computations. Math. Geol., 32,
683–700.
Gneiting, T. (1998) Closed Form Solutions of the Two-Dimensional Turning Bands Equation.
Math. Geol., 30, 379–390.
Gneiting, T., Sasvari, Z. & Schlather, M. (2001) Analogies and correspondences between
variograms and covariance functions. Adv. Appl. Probab., 33, 617–630.
Journel A. & Froidevaux, R. (1982) Anisotropic Hole-Effect Modeling. Math. Geol., 14, 217–
239.
Kazianka, H. (2013) Objective Bayesian Analysis of Geometrically Anisotropic Spatial Data.
J. Agr. Biol. Envir. Statist., 18, 514–537
Ma, C. (2007) Why is isotropy so prevalent in spatial statistics? Trans. Amer. Math. Soc.,
135, 865–871.
Lantu´ejoul, C. (2002) Geostatistical Simulation. Models and Algorithms. Berlin: Springer.
26
Matheron, G. (1970) La th´eorie des variables r´egionalis´ees et ses applications. Cahiers du
Centre de Morphologie Math´ematique de Fontainebleau, Fasc. 5, Ecole des Mines de Paris.
Translation (1971): The Theory of Regionalized Variables and Its Applications.
Matheron (1975) Random Sets and Integral Geometry. New York: John Wiley & Sons.
Porcu, E. & Schilling R. (2011) From Schoenberg to Pick-Nevanlinna: Toward a complete
picture of the variogram class. Bernoulli, 17(1), 441–455.
Porcu, E., Gregori, P., & Mateu, J. (2006), Nonseparable Stationary Anisotropic Space-Time
Covariance Functions Stoch. Envir. Res. Risk Assess., 21, 113–122.
Schlather,
M.
et
al.
(2015)
Package
’RandomFields’.
Accessible
from
http://cran.r-project.org/web/packages/RandomFields/.
Stein, M. (1999) Interpolation of Spatial Data: some theory for kriging. New-York: Springer.
Stein, M. (2013) On a class of space-time intrinsic random functions Bernoulli, 19, 387–408.
Schoenberg, I.J. (1938), Metric Spaces and Completely Monotone Functions. Ann. Math.,
39, 811–841.
Schoenberg, I.J. (1938) Metric spaces and positive definite functions. T. Am. Math. Soc.,
44(3), 522–536.
27
Dirac;β=1.5
−5
0
5
1
0
y
−2
−1
0
1
2
−2
−1
0
1
2
x
x
Gauss kernel; h=π/24;β=0.5
Gauss kernel; h=π/24;β=1
Gauss kernel; h=π/24;β=1.5
−2
−1
0
1
2
2
1
y
0
−2
−2
−2
−1
−1
y
0
0
1
1
2
2
x
−1
−2
−1
0
1
2
−2
−1
0
1
2
x
x
Gauss kernel; h=π/6;β=0.5
Gauss kernel; h=π/6;β=1
Gauss kernel; h=π/6;β=1.5
−2
−1
0
x
1
2
y
−1
0
y
−0.5
−2
−2
−1.5
−1
y
0
0.5
1
1
1.5
2
x
2
y
−2
−1
y
0
−1
−2
−5
y
0
1
5
2
Dirac;β=1
2
Dirac;β=0.5
−1.5
−0.5
0.5
x
1.5
−2
−1
0
1
2
x
Figure 2: Anisotropy models corresponding to the sum of two kernels, as in Eq. (16). Top
row: sum of two Dirac measures (corresponding to separable models of covariance). Middle
row: Sum of two Gaussian kernels with h = π/24. Bottom row: Same with h = π/6. From
left to right: β = 0.5, 1, 1.5. For all models, θ0 = 0, c1 = c2 = 2.
28
Dirac;β=1.5
−2
0
2
4
2
y
0
−4
−1.0
−0.5
0.0
0.5
1.0
−1.0
−0.5
0.0
0.5
1.0
Gauss kernel; h=π/24;β=0.5
Gauss kernel; h=π/24;β=1
Gauss kernel; h=π/24;β=1.5
−1.0
−0.5
0.0
0.5
1.0
2
y
−4
−2
0
2
−4
−4
−2
y
0
0
2
4
x
4
x
4
x
−2
−1.0
−0.5
0.0
0.5
1.0
−1.0
−0.5
0.0
0.5
1.0
Gauss kernel; h=π/6;β=0.5
Gauss kernel; h=π/6;β=1
Gauss kernel; h=π/6;β=1.5
−1.0
−0.5
0.0
x
0.5
1.0
2
y
−4
−2
0
2
−2
−4
−4
−2
y
0
2
4
x
4
x
4
x
0
y
−2
y
−4
y
0
−4
−15
−2
−5
y
0
5
2
10
4
Dirac;β=1
4
Dirac;β=0.5
−1.0
−0.5
0.0
x
0.5
1.0
−1.0
−0.5
0.0
0.5
1.0
x
Figure 3: Anisotropy models corresponding to the sum of two kernels. Same as Figure 2, but
here c1 = 1 and c2 = 4.
29
10
5
4
y
0
2
y
0
−5
−2
−10
−4
−10
−5
0
5
10
−4
−2
0
x
2
4
x
Figure 4: Realizations of Gaussian random fields with an anisotropy model with two squared
cosine kernels as in Eq. (16), with c1 = 1, c2 = 2, h = π/8 and θ0 = π/6. Left: exponential
covariance function. Right: power variogram with power β = 1.2.
0.0 0.5 1.0
4
2
y
−4
−2
0
2
−4
−2
y
0
2
0
−4
−2
−1.0
0.0 0.5 1.0
−1.0
0.0 0.5 1.0
Gaussian kernel;β=1.5
Sq. cosine kernel;β=1.5
Bi−sq. kernel;β=1.5
−1.0
0.0 0.5 1.0
x
2
y
−4
−2
0
2
−2
−4
−4
−2
y
0
2
4
x
4
x
4
x
0
y
−1.0
y
Bi−sq. kernel;β=1
4
Sq. cosine kernel;β=1
4
Gaussian kernel;β=1
−1.0
0.0 0.5 1.0
x
−1.0
0.0 0.5 1.0
x
Figure 5: Black line: scale parameter b(θ) as a function of the angle, for models of anisotropies
as defined in Eq. (17), with b1 = 1 and b2 = 4 and. From left to right: Gaussian kernel with
h = π/12; squared cosine kernel with h = π/6; bi-squared kernel with h = π/6. Red solid
line: geometric anisotropy with same range for θ ∈ {0, π/2}. Top row: β = 1; bottom row:
β = 1.5.
30
β= 1; Dirac
β= 1.5; Dirac
2
y
−2 −1
0
y
0
−1
−3
−4
−2
y
0
1
1
2
2
4
3
β= 0.5; Dirac
−2
−1
0
1
2
−1.5
−0.5
0.5
1.5
−1.0
0.0 0.5 1.0
x
x
β= 0.5; Sq. cos, h=π/24
β= 1; Sq. cos, h=π/24
β= 1.5; Sq. cos, h=π/24
y
−2 −1
0
1
2
−3
−2
y
0
1
2
1
−1 0
y
2
3
x
−1
0
1
−1.0
1.0
−1.0
0.0 0.5 1.0
x
β= 0.5; Sq. cos, h=π/6
β= 1; Sq. cos, h=π/6
β= 1.5; Sq. cos, h=π/6
1
y
−1
−1
−0.5
0.5
x
1.5
−2
−2
−2
−1.5
0
y
0
0
1
1
2
2
2
x
−1
y
0.0
x
−1.5
−0.5
0.5
x
1.5
−1.5
−0.5
0.5
1.5
x
Figure 6: Anisotropy models corresponding to the sum of three kernels, as in Eq. (13). Top
row: sum of Dirac measures. Middle row: Sum of squared cosine kernels with h = π/24.
Bottom row: Same with h = π/6. From left to right: β = 0.5, 1, 1.5. For all models,
b1 = 1; b2 = 4; b3 = 2.
31
4
y
−4
−2
0
2
4
2
y
0
−2
−4
−10
−5
0
5
10
−10
x
−5
0
5
10
x
Figure 7: Realizations of Gaussian random fields with an anisotropy models with three
squared cosine kernels, with (θ1 , θ2 , θ3 ) = (0, π/6, π/3), (c1 , c2 , c3 ) = (1, 2, 3) and h = π/6.
Left: spherical covariance function. Right: power variogram with β = 1.
32


© Copyright 2026