
Here - Williams Partners LP
2015 Analyst Day
May 13, 2015
Forward-looking Statements
>  The reports, filings, and other public announcements of The Williams Companies, Inc. (Williams) and Williams Partners L.P. (WPZ)
may contain or incorporate by reference statements that do not directly or exclusively relate to historical facts. Such statements are
"forward-looking statements" within the meaning of Section 27A of the Securities Act of 1933, as amended, and Section 21E of the
Securities Exchange Act of 1934, as amended. We make these forward-looking statements in reliance on the safe harbor
protections provided under the Private Securities Litigation Reform Act of 1995. You typically can identify forward-looking
statements by various forms of words such as “anticipates,” “believes,” “seeks,” “could,” “may,” “should,” “continues,” “estimates,”
“expects,” “forecasts,” “intends,” “might,” “goals,” “objectives,” “targets,” “planned,” “potential,” “projects,” “scheduled,” “will,”
“assumes,” “guidance,” “outlook,” “in service date” or other similar expressions. These forward-looking statements are based on
management's beliefs and assumptions and on information currently available to management and include, among others,
statements regarding:
–  Expected levels of cash distributions by WPZ with respect to general partner interests, incentive distribution rights, and limited
partner interests
–  The levels of dividends to Williams stockholders
–  Future credit ratings of Williams and WPZ
–  Amounts and nature of future capital expenditures
–  Expansion and growth of our business and operations
–  Financial condition and liquidity
–  Business strategy
–  Cash flow from operations or results of operations
–  Seasonality of certain business components
–  Natural gas, natural gas liquids, and olefins prices, supply, and demand; and
–  Demand for our services
>  Forward-looking statements are based on numerous assumptions, uncertainties and risks that could cause future events or results
to be materially different from those stated or implied in this presentation. Many of the factors that will determine these results are
beyond our ability to control or predict. Specific factors that could cause actual results to differ from results contemplated by the
forward-looking statements include, among others, the following:
–
–
–
–
ii
Whether WPZ will produce sufficient cash flows to provide the level of cash distributions we expect
Whether Williams is able to pay current and expected levels of dividends
Availability of supplies, market demand, and volatility of prices
Inflation, interest rates, and fluctuation in foreign exchange rates and general economic conditions (including future disruptions and
volatility in the global credit markets and the impact of these events on customers and suppliers)
Analyst Day 2015 | May 13, 2015
© 2015 The Williams Companies, Inc. All rights reserved.
Forward-looking Statements (cont’d)
–  The strength and financial resources of our competitors and the effects of competition
–  Whether we are able to successfully identify, evaluate and execute investment opportunities
–  Our ability to acquire new businesses and assets and successfully integrate those operations and assets into our existing businesses as
well as successfully expand our facilities
–  Development of alternative energy sources
–  The impact of operational and developmental hazards and unforeseen interruptions
–  Costs of, changes in, or the results of laws, government regulations (including safety and environmental regulations), environmental
liabilities, litigation, and rate proceedings
–  Williams’ costs and funding obligations for defined benefit pension plans and other postretirement benefit plans
–  WPZ’s allocated costs for defined benefit pension plans and other postretirement benefit plans sponsored by its affiliates
–  Changes in maintenance and construction costs
–  Changes in the current geopolitical situation
–  Our exposure to the credit risk of our customers and counterparties
–  Risks related to financing, including restrictions stemming from debt agreements, future changes in credit ratings as determined by
nationally-recognized credit rating agencies and the availability and cost of capital
–  The amount of cash distributions from and capital requirements of our investments and joint ventures in which we participate
–  Risks associated with weather and natural phenomena, including climate conditions
–  Acts of terrorism, including cybersecurity threats and related disruptions and
–  Additional risks described in our filings with the Securities and Exchange Commission (SEC)
>  Given the uncertainties and risk factors that could cause our actual results to differ materially from those contained in any forward-
looking statement, we caution investors not to unduly rely on our forward-looking statements. We disclaim any obligations to and
do not intend to update the above list or announce publicly the result of any revisions to any of the forward-looking statements to
reflect future events or developments
>  In addition to causing our actual results to differ, the factors listed above may cause our intentions to change from those statements
of intention set forth in this presentation. Such changes in our intentions may also cause our results to differ. We may change our
intentions, at any time and without notice, based upon changes in such factors, our assumptions, or otherwise
>  Investors are urged to closely consider the disclosures and risk factors in Williams’ and WPZ’s annual reports on Form 10-K filed
with the SEC on Feb. 25, 2015, and each of our quarterly reports on Form 10-Q available from our offices or from our websites at
www.williams.com and www.investor.williams.com
iii
Analyst Day 2015 | May 13, 2015
© 2015 The Williams Companies, Inc. All rights reserved.
Agenda
Continental Breakfast
Welcome and Introductions
John Porter
CEO Perspective
Alan Armstrong
Access Midstream
Bob Purgason
Break
Northeast Gathering & Processing
Jim Scheel & John Seldenrust
NGL & Petchem Services
John Dearborn
Break – Box Lunches
iv
West
Walter Bennett
Atlantic-Gulf
Rory Miller
Financial Outlook
Don Chappel
Closing Remarks
Alan Armstrong
Analyst Day 2015 | May 13, 2015
© 2015 The Williams Companies, Inc. All rights reserved.
Alan Armstrong
President & Chief Executive Officer
May 13, 2015
CEO Perspective
Today’s Focus
DEMAND IS HERE
AND GROWING
A - 2 Analyst Day 2015 | May 13, 2015
SHARP FOCUS ON
EXECUTION AND
TREMENDOUS GROWTH
SOLID STRATEGY
DELIVERING
LONG-TERM VALUE
© 2015 The Williams Companies, Inc. All rights reserved.
CEO Perspective
Demand is Here and Growing
A - 3 Analyst Day 2015 | May 13, 2015
© 2015 The Williams Companies, Inc. All rights reserved.
CEO Perspective
Natural Gas Demand Pull Across
All Regions and Sectors
CUMULATIVE DEMAND GROWTH BY
CENSUS REGION SINCE 2015, IN BCF/D
40
MARKET SECTOR DEMAND
PULL THROUGH 2025, IN BCF/D
>  Industrial
5.7
30
>  Power
9.1
25
>  Residential/Commercial
1.1
>  Other
3.2
>  Transport
2.0
35
20
15
10
5
>  LNG exports
0
>  Net Mexican Exports
-5
2016 2017 2018 2019 2020 2021 2022 2023 2024 2025
West South Central
East North Central
Pacific
Mountain
New England
South Atlantic
Mid Atlantic
West North Central
East South Central
Canada
Source: Wood Mackenzie
A - 4 Analyst Day 2015 | May 13, 2015
© 2015 The Williams Companies, Inc. All rights reserved.
12.6
2.2
CEO Perspective
Supply Continues to Grow, Led by Northeast;
Poised to Meet Demand Growth
CUMULATIVE NATURAL GAS PRODUCTION GROWTH BY REGION SINCE 2015 IN BCF/D
40
35
30
25
20
15
10
5
0
-5
2016
2017
2018
2019
2020
2021
2022
2023
2024
2025
Gulf Coast
Northeast
Rockies
Mid-Continent
Permian
Fort Worth
San Juan
Gulf of Mexico
West Coast
WCSB
Eastern Canada
Arctic
Source: Wood Mackenzie
A - 5 Analyst Day 2015 | May 13, 2015
© 2015 The Williams Companies, Inc. All rights reserved.
CEO Perspective
Natural Gas Production Continues to Rise Despite
Depressed Prices
US NATURAL GAS PRODUCTION VS. NATURAL GAS + NGL UPLIFT PRICE
75
$7
70
$6
$5
60
55
$4
50
45
320 Rigs
1-4-13
40
Jan-2013
May-2013
$3
273 Rigs
1-3-14
Sep-2013
US Dry Natural Gas Production (Bcf/d)
Gas Price + NGL Uplift ($/MMBtu)
Jan-2014
169 Rigs
5-01-15
May-2014
Sep-2014
Jan-2015
Henry Hub Natural Gas Spot Price ($/MMBtu)
Source: EIA, Baker Hughes, Williams Research
Note: March and April 2015 US dry natural gas production data based on Williams’ estimates
A - 6 Analyst Day 2015 | May 13, 2015
© 2015 The Williams Companies, Inc. All rights reserved.
$2
$/MMBtu
Bcf/d
65
CEO Perspective
U.S. Natural Gas Remains Most
Cost-effective Feedstock
$/MMBtu
$45
$40
$35
$30
$25
$20
$15
$10
$5
$0
1Q
2Q
3Q
4Q
2010
1Q
2Q
3Q
4Q
1Q
2011
Gas
Ethane
2Q
3Q
4Q
2012
Propane
1Q
2Q
3Q
4Q
2013
Crude
Ethylene
1Q
2Q
3Q
4Q
2014
Propylene
Note: Historical CMAI Gulf Coast spot prices converted to a $/MMBtu basis.
A - 7 Analyst Day 2015 | May 13, 2015
© 2015 The Williams Companies, Inc. All rights reserved.
CEO Perspective
Natural Gas: Significant Advantages Across
All Sectors
If inefficient coal plants in the US were to retire,
7.3 Bcf/d of natural gas would be required
By 2020, NA fertilizer projects could increase
production by 24.7 million metric tons per year requiring
an incremental 1.2 Bcf/d of natural gas demand
NA methanol production is poised to increase by
13 million metric tons per year requiring 1.4 Bcf/d
of natural gas
If half of the Northeast US fuel oil use was
displaced by natural gas, it would equate to roughly
800 MMcf/d of incremental natural gas
A - 8 Analyst Day 2015 | May 13, 2015
© 2015 The Williams Companies, Inc. All rights reserved.
1Q
2015
CEO Perspective
Sharp Focus on Execution and
Tremendous Growth
A - 9 Analyst Day 2015 | May 13, 2015
© 2015 The Williams Companies, Inc. All rights reserved.
CEO Perspective
Leaders Focused on Safe, Reliable Operations;
Delivering Value
>  Performing above industry standards
>  Safety metrics embedded in annual incentive plans
# INCIDENTS / 1,000 MILES
RELEASE VOL (MCF GAS / MI)
0.8
6.5
6.4
5.8
4.9
0.5
0.4
0.4
2011
0.2
2012
2013
2014
0.0
WILLIAMS
INDUSTRY
WILLIAMS
0.3 0.4
INDUSTRY
0.4 0.4
4.4
4.2
2015*
2011
0.8
0.3
2012
0.0
2013
0.0
2014
* Through 3/31/15, annualized
PHMSA reports a total mileage of interstate natural gas pipelines of approximately 320,267 (PHMSA website - accessed 5/4/2015)
The numbers above are based on incidents reported to PHMSA under 49 CFR 191; An incident is an event where an unintentional
release of natural gas results in: A death or personal injury resulting in hospitalization; Estimated property damage of $50,000 or more;
Gas loss of 3 MMCF or more.
A - 10 Analyst Day 2015 | May 13, 2015
© 2015 The Williams Companies, Inc. All rights reserved.
2015*
CEO Perspective
Significant, Growth-oriented Assets Positioned
Across Natural Gas Value Chain
Approximately 30% U.S. Gas Volumes Touch Our Systems
Transmission Pipelines and Storage
Market Hub
End User
Natural
Gas
Ethylene
Propylene
Wellhead
(onshore and offshore)
Gathering
Gas Processing
Plants
17 Bcf/d
7 Bcf/d
inlet
Mixed
Natural Gas
Liquids
418
Mbbl/d
Multiple
Products
Fractionation Facilities
233 Mbbl/d
Storage
22 MMbbl
Transmission Pipelines
Olefins Plant
416
Mbbl/d
(lbs/year)
475 Mbbl/d
crude oil
1,950 MM
ethylene
807 MM
propylene
Market Hub
395MM lbs
ethylene
storage
25 storage
customers
9 exchange
partners
Figures represent 100% capacity for operated assets, including those in which Williams and/or WPZ have a share of ownership;
NGL and derivatives storage includes capacity owned and under long-term lease; olefins-plant volumes are inclusive of Geismar, LA.,
facility at full operation and expansion. All data as of December 31, 2014.
A - 11 Analyst Day 2015 | May 13, 2015
© 2015 The Williams Companies, Inc. All rights reserved.
CEO Perspective
Williams Positioned to Benefit from Demand
Increases Along Major Interstate Corridors
Natural Gas Demand Growth in Bcf/d (2015–2025)
4.4
0.8
2.0
0.2
2.7
0.5
LEGEND
2.5
22.2
Transco
corridor
Williams’ pipeline
corridors
Other regions
0.7
Source: Wood Mackenzie
A - 12 Analyst Day 2015 | May 13, 2015
© 2015 The Williams Companies, Inc. All rights reserved.
End User
CEO Perspective
Already Capturing 36% of Future Demand,
2015–2025
BCF/D
Capacity3
Williams Project
(in execution or negotiating)
8.3
Growth Available
22.2
Williams current share
36%
Constitution
(0.7 Bc/d)
NE Connector
(0.1 Bcf/d) /
Rockaway Lateral1
New York Bay
(0.1 Bcf/d)
Leidy Southeast
(0.5 Bcf/d)
Garden State
(0.5 Bc/d)
Atlantic Sunrise
(1.7 Bcf/d)
CPV
Woodbridge1
Virginia Southside I&II
(0.5 Bcf/d)
Hillabee Phase 1&2
(1.0 Bcf/d)
Rock Springs
(0.2 Bcf/d)
Dalton Lateral
(0.5 Bc/d)
Gulf Connector
(1.2 Bcf/d)2
Mobile Bay South
III (0.2 Bcf/d)
Gulf Trace
(1.2 Bcf/d)
1
2
3
South Louisiana
Market (0.2 Bcf/d)
These projects are Firm Delivery Lateral Service and do not add mainline capacity.
In negotiations with potential shippers.
Does not include firm delivery lateral service projects
A - 13 Analyst Day 2015 | May 13, 2015
© 2015 The Williams Companies, Inc. All rights reserved.
CEO Perspective
Transition to Demand-driven Growth
Demonstrated in Guidance and Beyond
WMB/WPZ Pursuing Over $30 Billion of Growth Projects
Supply Driven
2015
to
2017
>  Gulfstar One
>  Kodiak
>  Northeast
>  CNRL Offgas*
>  Gunflint
>  Access G&P
Supply & Demand Driven
>  Atlantic Sunrise
>  Constitution Pipeline
Completed
Projects
Future
Projects
G&P
2018+ >  Additional
2014
to
2015
!  = Completed
Demand Driven
>  Rockaway Lateral
>  Leidy SE
>  Virginia Southside
>  Rock Springs
>  Dalton Lateral
>  Hillabee (Phase 1)
>  Mobile Bay South III
>  CPV Woodbridge
>  Gulf Trace
>  Garden State
>  Jackrabbit Propylene
>  Promesa*
>  Sabal Trail
>  Texas-to-Mexico
>  Parachute Plant
>  Continue Expansion in Dry Gas
>  Numerous demand-
Gulfstars
>  Mexican
offshore
production
facilities
>  Syncrude
offgas
>  Access G&P
Expansion
>  Various offshore
tiebacks
>  Marcellus/
Utica supply to
Transco
Southeast
markets
NE PA to Meet Producers’ Growth
>  New Producers Opportunities for
Utica and southern Marcellus
>  LMM Cantaral and Shamrock
System Expansion
>  Additional Takeaway Projects
>  Gathering and Processing
Opportunities in NW PA & NE OH
driven Transco
projects
>  Gulf market area
expansions serving
LNG and industrial
customers
>  Pacific Connector
! Gulfstar One
! Keathley
Canyon
Connector
! NE: Frac II
! NE: Ethane
line and
de-ethanizer
! NE: Oak Grove
TXP I
! Bucking Horse
Plant
In Progress; Potential / under negotiation
A - 14 Analyst Day 2015 | May 13, 2015
(ownership option)
export pipeline
>  Geismar 2*
>  PDH 1 & 2*
>  Washington
Expansion
>  NGL & Petchem
services – other*
! Geismar Expansion** ! Texas Belle*
! Bayou Ethane*
* WMB projects expected to be dropped down to WPZ
** Currently in ramp-up
© 2015 The Williams Companies, Inc. All rights reserved.
CEO Perspective
Solid Strategy Delivering Long-term Value
A - 15 Analyst Day 2015 | May 13, 2015
© 2015 The Williams Companies, Inc. All rights reserved.
CEO Perspective
WPZ Fee Revenues Projected to Increase Over
$2.7 Billion as NGL Margins Decline 81%
2011 to 2015 (Dollars in Millions)
$6,000
$5,000
C
(20%
)
AGR e 107%
s
crea
es In
u
n
e
Rev
Fee
$4,000
$3,000
$0
NGL
Margins
$1,000
Fee Revenues
$2,000
2011
2012
2013
2014
2015
FORECAST
Note: Data does not include proportionate share of fee revenues or commodity margins from joint ventures
A - 16 Analyst Day 2015 | May 13, 2015
© 2015 The Williams Companies, Inc. All rights reserved.
CEO Perspective
Planning Williams 2015 Dividend of $2.38 with Annual
Dividend Growth of Approximately 12.5% through 2017
CASH DIVIDENDS PER SHARE GROWTH
2010–2017 CAGR OF 30%
ILLUSTRATIVE EXCESS CASH FLOW
AVAILABLE & COVERAGE RATIO 1
(Millions)
$3,000
$3.50
$3.01
$3.00
1.10x
$2.68
1.06x
$2.38
$2.50
$2,000
$1.96
$2.00
1.05x
1.20x
Expected
Dividends Paid
$1.44
$1.50
Expected Cash
Flow Available
After Dividends
$1.20
$1,000
$1.00
$0.78
$0.49
$0.50
$0
$0.00
2014
2010 2011 2012 2013 2014 2015 2016 2017
Actual
1
2015
2016
2017
Guidance
Detailed illustrative dividend and coverage calculations are included in the presentation.
A - 17 Analyst Day 2015 | May 13, 2015
© 2015 The Williams Companies, Inc. All rights reserved.
CEO Perspective
Positioned to Connect Best Supplies to Best Markets;
Capture Emerging Demand-side Opportunities
WEST
>  Reliable operations across vast footprint
>  Significant volumes driving high-quality revenue
>  Well-positioned to feed growing demand pull
NE GATHERING &
PROCESSING
>  Extensive footprint to serve
NE producers
>  Positioned to capture the value
of significant investment
ACCESS
>  High quality, scalable asset
>  Creating hubs to open the
Marcellus/Utica to even
more markets
base in high growth
unconventional plays
>  Low risk business model with
100% fixed-fee revenues with
MVC, rate determination,
cost of service and fee
tier contracts
ATLANTIC GULF
>  Growing demand driving
rapid expansion
NGL PETCHEM
>  Building fee-based cash flow to drive high
quality revenue
>  Taking commodity exposure only when
sustainably advantaged
A - 18 Analyst Day 2015 | May 13, 2015
>  Solid track record of execution
>  Unique capabilities in Gulf in
a capital-constrained
environment
© 2015 The Williams Companies, Inc. All rights reserved.
CEO Perspective
Right Leaders in the Right Place to
Execute Strategy
Bob
Purgason
Access
Jim Scheel
NE
Gathering &
Processing
John
Dearborn
NGL &
Petchem
Services
Walter
Bennett
West
Don
Chappel
Chief
Financial
Officer
Sarah Miller
Interim
General
Counsel
John
Seldenrust
Access
Eastern
Operations
A - 19 Analyst Day 2015 | May 13, 2015
Rory Miller
Atlantic-Gulf
© 2015 The Williams Companies, Inc. All rights reserved.
Access Operating Area
Bob Purgason
Senior Vice President
WPZ – Access
Overview
B - 2 Analyst Day 2015 | May 13, 2015
© 2015 The Williams Companies, Inc. All rights reserved.
WPZ – Access
Growing High-return, Low-risk, Fee-based Business
EXPANDING ASSET BASE
High quality, scalable asset
base in high growth
unconventional plays
B - 3 Analyst Day 2015 | May 13, 2015
LOW RISK
BUSINESS MODEL
100% fixed-fee revenues with
MVC, rate redetermination,
cost of service and
fee tier contracts
OPERATIONAL
EXCELLENCE
Leading safety, reliability
and environmental
stewardship culture
© 2015 The Williams Companies, Inc. All rights reserved.
WPZ – Access
High Quality, Scalable Asset Base in High Growth
Unconventional Plays
Key Operating Data1
Dedicated Area:
~8.3MM acres
Miles of Pipe:
6,829
Volume:
6.195 Bcf/d
Horsepower:
698,743
1 Data
as of quarter ended March 31, 2015. Volume represents the gross throughput for operated assets and net throughput allocated to
the Partnership’s interest for non-operated assets.
B - 4 Analyst Day 2015 | May 13, 2015
© 2015 The Williams Companies, Inc. All rights reserved.
WPZ – Access
Leading Contract Structure – 100% Fixed Fee
Barnett
Mid-Continent
Haynesville
Permian
Niobrara
Eagle Ford
Marcellus
Utica
Cost of Service
Cost of Service
Cost of Service
(gathering)/
Fixed Fee
(processing)
Contract
Structure
MVC and Fee
Redetermination
Annual Fee
Cost of Service/
Redetermination/
Fee
Annual Fee
Redetermination
Fixed Fee with
Redetermination
MVC & Fee Tiers
Term
20 Year Acreage
Dedication
20 Year Acreage
Dedication
10-20 Year
Acreage
Dedication
20 Year Acreage
Dedication
20 Year Acreage
Dedication
20 Year Acreage
Dedication
15 Year Acreage
Dedication
15-20 Year
Acreage
Dedication
Dedicated
Acreage1
900,000
1,550,000
550,000
400,000
300,000
1,400,000
1,500,000
1,600,000
Gas Gathered
(MMcf/d)2
812
397
971
109
78
388
2,634
778
Invested
Capital ($B)
2.0
0.7
1.4
0.4
0.2
1.4
1.7
1.2
Ownership3
100%
100%
100%
Perm Op – 100%
DBJV – 50%
RWTX – 33%
50%
100%
~45%
Cardinal – 66%
UGS – 100%
UEOM – 49%
Cost of Service
WPZ has agreed to purchase up to 21%
additional interest in UEOM from EVEP
1
Dedicated Acreage in all regions represents the gross acres dedicated to WPZ and it’s partners.
Gas Gathered represents the gross throughput for operated assets and net throughput allocated to the Partnership’s interest for
non-operated assets.
3 WPZ is Operator of its Marcellus and Cardinal Joint Ventures.
2
B - 5 Analyst Day 2015 | May 13, 2015
© 2015 The Williams Companies, Inc. All rights reserved.
WPZ – Access
Cost of Service IllustrationNear-Term Volume Reduction
>  15–20 year fee calculated based on mid-teens return on invested capital
>  Long-term EBITDA growth part of contractual model
>  Fee recalculated annually for actual experience and revised forecast
COST OF SERVICE STRUCTURE
Near-term Volume Reduction
Align Capital Spend
with Volume
Re-calculate Fee Based
on Mid-teens Return
Volume
Levelized Fee ($/Mcf)
CAPEX
Cost of Service Structure Provides Long-term, Built-in EBITDA Growth
B - 6 Analyst Day 2015 | May 13, 2015
© 2015 The Williams Companies, Inc. All rights reserved.
WPZ – Access
Cost of Service IllustrationImproved Well Production
>  15–20 year fee calculated based on mid-teens return on invested capital
>  Long-term EBITDA growth part of contractual model
>  Fee recalculated annually for actual experience and revised forecast
COST OF SERVICE STRUCTURE
Improved Well Production
Align Capital Spend
with Volume
Re-calculate Fee Based
on Mid-teens Return
Volume
Levelized Fee ($/Mcf)
CAPEX
Cost of Service Structure Provides Long-term, Built-in EBITDA Growth
B - 7 Analyst Day 2015 | May 13, 2015
© 2015 The Williams Companies, Inc. All rights reserved.
WPZ – Access
Access Integration
B – 8 Analyst Day 2015 | May 13, 2015
© 2015 The Williams Companies, Inc. All rights reserved.
WPZ – Access
The Overall Integration Program is Being
Executed in Three Phases
Phase 2
Phase 1
2014
(implemented 1/1/15)
>  Transitioned ACMP
employees to WMB on
January 1, 2015
>  Launched integration
of ACMP and WMB
shared corporate
functions (HR, IM/IT,
F&A, Communication
& Outreach, Legal)
2015
Phase 3
H2 2015 onward
>  Focus on integrating OE, E&C, EH&S, Supply Chain,
>  Focus on integration
and CSD functional areas across 18 key initiatives
of Operating Areas
–  Gas Purchasing
–  Drafting Standards
–  Security
–  Operational Risk
Assessment
–  Gathering Compression
Integration (GCI)
–  PLC/Unifier Integration
–  Gathering Lines
–  Construction Safety
–  SME Operational Support
–  EH&S and Regulatory
–  Maximo
–  Leverage Williams Scale
–  Commodity Services/
Volume Management
–  Supply Chain Integration
–  Maintenance
>  Continued
implementation of
integrated operating
models across
functional areas
–  Commercial Contract
Oversight
–  Mechanical Integrity
–  Pipeline Risk & Integrity
B - 9 Analyst Day 2015 | May 13, 2015
© 2015 The Williams Companies, Inc. All rights reserved.
WPZ – Access
One Williams – One Maximo: Highlights
>  Identified cost savings of ~$2.4MM and reduction of 9 months of work to
achieve One Williams, compared to alternatives (e.g. running parallel systems)
>  Single Site, Single Org will allow Access OA the opportunity to implement
different configuration and design with deep dive deliverables
>  Leverage Williams’ implementation learnings and experience
>  Implementations will be in a mature system
>  Bring M&R processes, data and systems together to prevent continuous
divergence and promote One Williams continuous improvement
>  Avoid 2017 change that would be required to normalize two systems
>  Use superior Williams Knowledge Management Portal
>  Opportunity to leverage mobility to Williams OA work groups and simplify
Maximo 7.5 upgrade
B - 10 Analyst Day 2015 | May 13, 2015
© 2015 The Williams Companies, Inc. All rights reserved.
WPZ – Access
Modular Compression Facilities
AUGUSTA FACILITY
SLUG CATCHER
B - 11 Analyst Day 2015 | May 13, 2015
DEHY TRAIN SKID
© 2015 The Williams Companies, Inc. All rights reserved.
WPZ – Access
Gathering Compression Integration
Increased Speed to Market, Competitive & Predictable Cost, Reliable
& Common Operations, Easy to Redeploy
Legacy
Access
Standard
Gathering
Facility
Approach
B - 12 Analyst Day 2015 | May 13, 2015
Gathering
Compression
Integration
(GCI)
GEN-15
© 2015 The Williams Companies, Inc. All rights reserved.
WPZ – Access
Williams Compression –
Enhancing Our Capabilities
HIGHLIGHTS:
HORSEPOWER
>  Current Service: Access Legacy Utica &
300,000
Marcellus gathering
200,000
>  Owned HP:
188,800
>  Serviced HP:
72,550
100,000
0
>  Asset portfolio fits WPZ business model
Q1-14
>  Future expansion to other WPZ systems
–  200,000 HP (Est) by 2017
>  Enhances organizational capabilities
>  Accommodates greater efficiencies
>  Provides attractive expense savings through
in-sourcing a key cost element
B - 13 Analyst Day 2015 | May 13, 2015
Q2-14
Q3-14
Owned HP
Q4-14
Serviced HP
INFRASTRUCTURE
Region
Utica
Owned HP
52,830
Serviced HP
72,430
Region
Marcellus
Owned HP
135,970
Serviced HP
120
© 2015 The Williams Companies, Inc. All rights reserved.
WPZ – Access
Franchise Snapshots
B - 14 Analyst Day 2015 | May 13, 2015
Q1-15
© 2015 The Williams Companies, Inc. All rights reserved.
WPZ – Access
2016 Central Operating Area
For 2015 Included in Access Operating Area
MISSISSIPPI
LIME
GRANITE WASH/
COLONY WASH
WOLFBERRY
BARNETT
HAYNESVILLE
DELAWARE
(PERMIAN)
EAGLE
FORD
B - 15 Analyst Day 2015 | May 13, 2015
© 2015 The Williams Companies, Inc. All rights reserved.
WPZ – Access
Barnett – Long-term Value Basin
HIGHLIGHTS:
DAILY VOLUME (MMcf/d)
>  Product:
Dry Gas
>  Services:
Gathering, Compression,
& Treating
1,400
1,200
1,000
800
600
>  Volume:
812 MMcf/d
>  Major Producers:
Chesapeake Energy
Total Gas & Power
400
200
0
Q1-13 Q2-13 Q3-13 Q4-13 Q1-14 Q2-14 Q3-14 Q4-14 Q1-15
Barnett
>  Long-term acreage dedication
>  Large inventory of remaining drilling locations
>  Potential upside from increased gas demand
>  Contractual protections
$2.0B Invested Capital
B - 16 Analyst Day 2015 | May 13, 2015
MVC
CONTRACT & INFRASTRUCTURE
Gas Gathering Systems
25
Pipelines
859 Miles
Compression
114,790 HP
System Capacity
950 MMcf/d
Dedication
900,000 Acres
Contract Structure
MVC & Fee Redetermination
Contract Term
20 Years (2029)
Ownership
100% WPZ
© 2015 The Williams Companies, Inc. All rights reserved.
WPZ – Access
Mid-Continent – Vast Gathering Infrastructure
HIGHLIGHTS:
>  Product:
DAILY VOLUME (MMcf/d)
Associated Gas (Oil) &
Lean Gas
>  Services:
Gathering, Compression,
& Treating
>  Volume:
397 MMcf/d
>  Regions:
Miss-Lime, Granite Wash,
Colony Wash
>  Long-term acreage dedication
>  Contractual protection through fee
redetermination
>  Growth potential from additional producers
$0.7B Invested Capital
531
479
504
486
470
456
443
426
397
Q1-13 Q2-13 Q3-13 Q4-13 Q1-14 Q2-14 Q3-14 Q4-14 Q1-15
CONTRACT & INFRASTRUCTURE
Gas Gathering Systems
106
Pipelines
2,247 Miles
Compression
100,533 HP
System Capacity
945 MMcf/d
Dedication
1,550,000 Acres
Contract Structure
Annual Fee Redetermination
Contract Term
20 Years (2029)
Ownership
100% WPZ
B - 17 Analyst Day 2015 | May 13, 2015
© 2015 The Williams Companies, Inc. All rights reserved.
WPZ – Access
Haynesville – Prolific Dry Gas Basin
HIGHLIGHTS:
DAILY VOLUME (MMcf/d)
>  Product:
Dry Gas
>  Services:
Gathering, Compression,
& Treating
>  Volume:
971 MMcf/d
>  Long-term acreage dedication
1,200
900
600
300
0
Q1-13 Q2-13 Q3-13 Q4-13 Q1-14 Q2-14 Q3-14 Q4-14 Q1-15
>  Contractual protection through MVC &
fee structure
>  Significant growth potential from LNG exports
Springridge
Mansfield
CONTRACT & INFRASTRUCTURE
Gas Gathering Systems
Pipelines
Compression
System Capacity
Dedication
Contract Structure
Contract Term
$1.4B Invested Capital
Ownership
B - 18 Analyst Day 2015 | May 13, 2015
Mansfield MVC
7
591 Miles
17,713 HP
1,650 MMcf/d
550,000 Acres
Fixed Fee with MVC, Fee
Redetermination, and Fee Tiers
Springridge - 10 Years (2020)
Mansfield - 20 Years (2032)
100% WPZ
© 2015 The Williams Companies, Inc. All rights reserved.
Total
WPZ – Access
Permian – Liquids-rich Gathering & Processing
HIGHLIGHTS:
>  Product:
NET DAILY VOLUME (MMcf/d)
Associated Gas (Oil), Wet
Gas, & Dry Gas
>  Services:
Gathering, Compression,
Treating, & Processing
>  Volume:
109 MMcf/d (Net)
109
89
80
77
110
111
109
94
79
>  Long-term dedication
>  Significant upside from multiple profitable zones
>  Development of processing solutions
PERMIAN NON-OPERATED
Gas Gathering Systems
Pipelines
Contract Structure
Contract Term
Ownership
1
242 Miles
Cost of Service
Ranch Westex - 10 years (2021)
DBJV - 18 years (2025)
Ranch Westex - 33%
DBJV - 50%
$0.4B Invested Capital
Q1-13 Q2-13 Q3-13 Q4-13 Q1-14 Q2-14 Q3-14 Q4-14 Q1-15
PERMIAN OPERATED
Gas Gathering Systems
Pipelines
Compression
System Capacity
Dedication
Contract Structure
Contract Term
Ownership
B - 19 Analyst Day 2015 | May 13, 2015
14
346 Miles
18,375 HP
85 MMcf/d
400,000 Acres
Annual Fee Redetermination, Cost
of Service
20 Years (2029)
100% WPZ
© 2015 The Williams Companies, Inc. All rights reserved.
WPZ – Access
Eagle Ford – Key Liquids-rich Basin
HIGHLIGHTS:
>  Product:
DAILY VOLUME (MMcf/d)
Associated Gas (Oil)
& Wet Gas
348
295
>  Services:
Gathering, Compression,
& Treating
>  Volume:
388 MMcf/d
258
271
267
376
388
292
228
>  State-of-the-art sour gas treating facility
>  Large footprint with significant capacity
>  Strong upside potential from numerous
producers and profitable zones
$1.4B Invested Capital
B - 20 Analyst Day 2015 | May 13, 2015
Q1-13 Q2-13 Q3-13 Q4-13 Q1-14 Q2-14 Q3-14 Q4-14 Q1-15
CONTRACT & INFRASTRUCTURE
Gas Gathering Systems
12
Pipelines
971 Miles
Compression
101,892 HP
System Capacity
687 MMcf/d
Dedication
1,400,000 Acres
Contract Structure
Cost of Service
Contract Term
20 Years (2032)
Ownership
100% WPZ
© 2015 The Williams Companies, Inc. All rights reserved.
WPZ- Access
Eagle Ford – The Fox Creek Gathering and
Treating Expansion
Highlights:
"  Expands gathering & treating footprint in Eagle Ford
"  Gathering – Minimum Volume Commitment
"  Treating – Cost of Service with mid-teens return
"  Purchase of existing assets
"  Approximately 140 existing miles of 6”, 8” &
12” pipelines
"  100 MMcfd Sour Gas Compression Facility
"  Expansion of system to accommodate future
volumes
"  Construction of a Sour Gas Treating Facility
B - 21 Analyst Day 2015 | May 13, 2015
© 2015 The Williams Companies, Inc. All rights reserved.
WPZ – Access
Growth Outlook
B - 22 Analyst Day 2015 | May 13, 2015
© 2015 The Williams Companies, Inc. All rights reserved.
WPZ – Access
Strong Fundamentals and Competitive
Advantages Drive Robust, Visible Growth
Access Midstream Growth Investment Opportunities
2015–2020
WPZ / WMB Pursuing Over
$30 Billion of Project Opportunities
!! In guidance1
Growth Opportunities Include:
!! Under negotiation
>  Business Development
!! Potential
NGL &
Petchem
(WPZ)
NGL &
Petchem
(WMB)
West
(WPZ)
Growth
–  New producer opportunities
Northeast
G&P
(WPZ)
Access
Northeast
(WPZ)
–  Expanding processing
–  Bolt-on acquisitions
>  Contractual Growth
Access
Midstream
(WPZ)
–  Escalating minimum
volume commitments
Atlantic-Gulf
(WPZ)
–  Long-term cost of service
fee structures
1
Guidance presented here is at the midpoint of ranges.
B - 23 Analyst Day 2015 | May 13, 2015
© 2015 The Williams Companies, Inc. All rights reserved.
WPZ – Access
Access Midstream Summary
>  Expanding asset base
>  Low risk business model
>  Operational excellence
>  Growing high-return, low-
risk, fee-based business
B - 24 Analyst Day 2015 | May 13, 2015
© 2015 The Williams Companies, Inc. All rights reserved.
Northeast G&P
Jim Scheel
Senior Vice President
John Seldenrust
Senior Vice President
WPZ – Northeast G&P
Overview
C - 2 Analyst Day 2015 | May 13, 2015
© 2015 The Williams Companies, Inc. All rights reserved.
WPZ – Northeast G&P
Large-Scale Position Connects Best Basins
to Best Markets
LARGE-SCALE
INFRASTRUCTURE
IN PLACE
Extensive footprint serving
Marcellus, Utica producers
C - 3 Analyst Day 2015 | May 13, 2015
POSITIONED TO
CAPTURE VALUE OF
SIGNIFICANT INVESTMENT
Marcellus/Utica long-term
growth outlook is strong
FOCUSED ON DELIVERING
OPTIMAL VALUE
Creating gas/NGL hubs to
provide producers with
access to best markets
© 2015 The Williams Companies, Inc. All rights reserved.
WPZ – Northeast G&P
Legacy Williams Footprint: Large-scale
Infrastructure Established in Marcellus, Utica
NW PA and NE Ohio/TRM
Susquehanna Supply Hub
>  530,000 dedicated acres
>  ~3 Bcf/d takeaway capacity
Blue Racer Midstream 1, 2
Laurel Mountain
Midstream 1, 2
>  1.5 Bcf/d gathering capacity
>  1.0 Bcf/d processing capacity
>  ~700 MMcf/d gathering
>  ~125 Mbpd fractionation
capacity
Ohio Valley Midstream
>  0.7 Bcf/d processing capacity
>  ~80 Mbpd fractionation/
de-ethanization
1
2
Represents 2015 estimated capacity at year end
LMM, Blue Racer Midstream are partially owned systems; amount shown reflect 100%
C - 4 Analyst Day 2015 | May 13, 2015
© 2015 The Williams Companies, Inc. All rights reserved.
WPZ – Northeast G&P
Access Integration Enhances Large-Scale Position
Bradford MN1
>  3.0 Bcf/d gathering exit
capacity
Utica Midstream 1, 2
>  1.0 Bcf/d gathering exit
capacity
>  0.8 Bcf/d processing capacity
>  ~135 Mbpd fractionation
capacity
Marcellus South 1
>  0.7 Bcf/d gathering capacity
1
2
Represents 2015 estimated capacity at year end
Utica Midstream is partially owned; amount shown reflects 100%
C - 5 Analyst Day 2015 | May 13, 2015
© 2015 The Williams Companies, Inc. All rights reserved.
WPZ – Northeast G&P
Combined Position to Serve Marcellus,
Utica Wet/Dry Gas
Susquehanna
Supply Hub
NW PA and NE Ohio/TRM
Bradford Supply Hub
Blue Racer
Midstream1
Utica Supply Hub1
Ohio River Supply Hub
>  Ohio Valley Midstream
>  Laurel Mountain
Midstream1
>  Marcellus South
1 LMM,
Blue Racer and Utica Supply Hub are partially owned systems. Blue Racer and a portion of Utica Supply Hub is not
operated by Williams.
C - 6 Analyst Day 2015 | May 13, 2015
© 2015 The Williams Companies, Inc. All rights reserved.
WPZ – Northeast G&P
Franchise Snapshots
C - 7 Analyst Day 2015 | May 13, 2015
© 2015 The Williams Companies, Inc. All rights reserved.
WPZ – Northeast G&P
NE PA Footprint: Heart of Low-Cost Marcellus
Market Remains Constrained by Takeaway Capacity
Constitution
m
Millenniu
Bradford Supply Hub
Susquehanna
Supply Hub
essee
Tenn
Atlantic Sunrise
Wyoming
c
Trans
C - 8 Analyst Day 2015 | May 13, 2015
o
© 2015 The Williams Companies, Inc. All rights reserved.
WPZ – Northeast G&P
Susquehanna Supply Hub
Large-scale Gathering System in Northeast PA
SIGNIFICANT SUPPLY HUB WITH ACCESS
TO EAST COAST MARKETS
Constitution
>  Access to 3 Bcf/d* of takeaway capacity
into 3 major interstate pipelines
m
nniu
Mille
–  Transco, Tennessee, Millennium
>  Future expansions will deliver into
Constitution and Atlantic Sunrise
EXPANDING GAS GATHERING SYSTEM TO
MEET PRODUCERS’ DRILLING PLANS
essee
Tenn
Wyoming
>  Key customers
c
Trans
o
–  Cabot
–  Southwestern Energy
–  Carrizo-Reliance
Atlantic Sunrise
>  Large-scale build out
* Excludes Constitution, estimated in-service date is 2016
C - 9 Analyst Day 2015 | May 13, 2015
© 2015 The Williams Companies, Inc. All rights reserved.
WPZ – Northeast G&P
Bradford Supply Hub
Largest Gathering Footprint in the Dry Marcellus
ANOTHER SIGNIFICANT SUPPLY HUB
Constitution
>  2.6 Bcf/d System capacity
(3.0 Bcf/d by 2015 year end)
>  39% WPZ owned and operated
m
nniu
Mille
>  600,000 acres dedicated
EXPANDING GAS GATHERING SYSTEM TO
MEET PRODUCERS’ DRILLING PLANS
e
Tenn
ssee
Wyoming
>  Key customers
co
Trans
–  Andarko
–  Epsilon
–  Chesapeake
–  Mitsui
–  Chief
–  Statoil
Atlantic Sunrise
>  Large-scale build out
C - 10 Analyst Day 2015 | May 13, 2015
© 2015 The Williams Companies, Inc. All rights reserved.
WPZ – Northeast G&P
Susquehanna and Bradford Supply Hub
Canada
tion
stitu
Con
+
ssee
Tenne
Northeast
Markets
TRANSCO +
Bradford SSH
Atlantic
SCO
Sunrise
TRAN
+
Southeast
Markets
Gulf
Coast
Existing
Proposed
Local
Markets
+ Expansion Proposed or In Progress
C - 11 Analyst Day 2015 | May 13, 2015
© 2015 The Williams Companies, Inc. All rights reserved.
WPZ – Northeast G&P
Utica Supply Hub
Vertically Integrated in Rapidly Expanding Basin
LEADING ASSETS POSITIONED TO SERVE
PRODUCERS IN THE WET & DRY UTICA
>  Integrated from wellhead to fractionation
>  1,650,000 acres dedicated
Cardinal Gathering System:
>  Gathering and Compression 0.9 Bcf/d
>  66% WPZ owned
>  WPZ operated
Utica Dry Gathering System:
Utica Dry Existing
Development Area
>  Dry System
>  Ownership: 100% WPZ
>  Development Underway
C - 12 Analyst Day 2015 | May 13, 2015
© 2015 The Williams Companies, Inc. All rights reserved.
WPZ – Northeast G&P
Utica Supply Hub
Vertically Integrated in Rapidly Expanding Basin
LEADING ASSETS POSITIONED TO SERVE
PRODUCERS IN THE WET & DRY UTICA
Kensington Plant
>  Integrated from wellhead to fractionation
Utica East Ohio System:
>  Processing Capacity:
–  Kensington Cryogenic Plant: 600 MMcf/d
–  Leesville Cryogenic Plant: 200 MMcf/d
Leesville Plant
Harrison Hub
>  Fractionation Capacity:
–  Harrison Fractionator: 135 MBpd
>  Ownership: 49% WPZ owned
–  13% – 21% Acquisition Pending
C - 13 Analyst Day 2015 | May 13, 2015
© 2015 The Williams Companies, Inc. All rights reserved.
WPZ – Northeast G&P
Ohio River Supply Hub: Well Positioned to Serve Wet,
Dry Gas in Growing Marcellus and Utica Basins
A Powerful Combination of Assets to Serve Southern Marcellus, Eastern Utica
C - 14 Analyst Day 2015 | May 13, 2015
© 2015 The Williams Companies, Inc. All rights reserved.
WPZ – Northeast G&P
Laurel Mountain Midstream
Covers Broad Footprint in Western PA
CONTINUED SYSTEM EXPANSION
THROUGH JV WITH CHEVRON
>  JV with Chevron
–  69% WPZ owned starting Oct 1st, 2014
–  WPZ operated
>  Optimization of capital plan for dry
gas area
–  System capacity of ~700 MMcf/d by 2015
year end
EXTENSIVE DEDICATIONS PROVIDE
EXPOSURE TO DRY GAS AREAS
>  Approximately 275,000 acres dedicated
C - 15 Analyst Day 2015 | May 13, 2015
© 2015 The Williams Companies, Inc. All rights reserved.
WPZ – Northeast G&P
Marcellus South
Expanding in Liquids-Rich Growth Basin
LARGE ACREAGE DEDICATION ON THE
WET GAS MARCELLUS BASIN
>  65% WPZ owned and operated
>  900,000 acres dedicated
>  Gathering and Compression
HIGH LEVEL OF RIG ACTIVITY AROUND
OUR ASSETS FROM CURRENT AND
POTENTIAL CUSTOMERS
>  600 MMcf/d Gathering capacity
(680 MMcf/d by 2015 year end)
>  Southwestern Energy entry
C - 16 Analyst Day 2015 | May 13, 2015
© 2015 The Williams Companies, Inc. All rights reserved.
WPZ – Northeast G&P
Ohio Valley Midstream
Large-scale Presence in Liquids-rich Marcellus
EXTENSIVE ACREAGE, GATHERING AND
PROCESSING UNDER CONTRACT
>  Long-term contracts:
–  236,000 acres dedicated
–  7 producers
–  Processing of gathered gas
WELL POSITIONED ASSETS WITH
SIGNIFICANT EXPANSION OPPORTUNITIES
Moundsville Oak Grove
Ft. Beeler
>  Processing Capacity
–  Fort Beeler Cryogenic Plant currently 520 MMcf/d
–  Oak Grove Cryogenic Plant currently 200 MMcf/d
>  Fractionation/Deethanization Capacity
–  Moundsville fractionation 42.5 MBPD
–  Oak Grove Deethanizer 40 MBPD of ethane
–  Condensate Stabilizer 14.5 MBPD
Proposed Liberty Pipeline
>  Ethane outlet to Sunoco
C - 17 Analyst Day 2015 | May 13, 2015
© 2015 The Williams Companies, Inc. All rights reserved.
WPZ – Northeast G&P
Caiman Energy II/Blue Racer Midstream
JV Interest Enhances Presence in Utica Shale
FOCUSES ON COUNTIES IN EAST OH AND
NORTHWEST PA COVERING THE UTICA SHALE
>  Blue Racer Midstream is developing a
substantial gathering and processing system
–  Nearly 600 miles of large-diameter
gathering pipelines
–  Nearly 130 miles of NGL and condensate
transportation pipelines
–  Natrium complex in Marshall County, WV,
processing and fractionation assets
–  Berne processing complex in Monroe County, OH
>  Williams Partners owns a 58% equity
investment in Caiman Energy II. Caiman
Energy II owns 50% of Blue Racer Midstream
Berne
Natrium
>  Williams Partners invested approximately
$420 million through 2014 for its proportional
interest in Blue Racer Midstream
C - 18 Analyst Day 2015 | May 13, 2015
© 2015 The Williams Companies, Inc. All rights reserved.
WPZ – Northeast G&P
Utica/Ohio River Supply Hubs:
Connecting Best Supplies to Best Markets
C - 19 Analyst Day 2015 | May 13, 2015
© 2015 The Williams Companies, Inc. All rights reserved.
WPZ – Northeast G&P
Expanding Ethane Market Connectivity
Canada
Markets
Petchem
Market
Mariner W
Harrison Frac
Houston, PA
Mari
ner E
Local
Petchem
Export
East
Coast
UEO
OVM
BRM
ATEX
Natrium
Frac
Oak Grove
De-Ethanizer
Local
Power
Plants
Local
Petchem
Gulf
Coast
Petchem
Existing
Under Evaluation
C - 20 Analyst Day 2015 | May 13, 2015
© 2015 The Williams Companies, Inc. All rights reserved.
WPZ – Northeast G&P
Utica and Ohio River Ethane Market Hub
PROJECTS UNDERWAY, BUT
OPPORTUNITIES REMAIN
Canada
>  Total Market Access Goal
Mariner
West
>  Existing Connectivity:
230,000 bpd
Exports/
East Coast
Utopia*
>  Potential Connectivity:
460,000 bpd
Mariner
East
Utica
&
Ohio River
>  Supporting New Demand
ATEX
Development
Gulf
Coast
Local Petchem
Gathering Pipeline*
Local
Power
Plants*
Local Petchem*
* Under Evaluation
C - 21 Analyst Day 2015 | May 13, 2015
© 2015 The Williams Companies, Inc. All rights reserved.
WPZ – Northeast G&P
Expanding Propane, Butane, Natural Gasoline
Market Connectivity
Canada
Markets
Local
Heating
Markets
Harrison
Frac
Chicago
Utopia W
C5+ to Diluent Mkt
Mariner C3/C4
C3/C
BRM Natrium Frac
Conway
Gulf
Coast
Existing
Under Evaluation
C - 22 Analyst Day 2015 | May 13, 2015
4
OVM Moundsville
Frac
UMTP
Y-grade / C3/C4
ne
Cor
C5+
Refineries
OH, MI, IL
UEO
ne
rsto
Export
East
Coast
Truck
Barge
Rail
© 2015 The Williams Companies, Inc. All rights reserved.
WPZ – Northeast G&P
Utica and Ohio River Propane, Butane and Natural
Gasoline Market Hub
CONTINUED OPPORTUNITIES
TO BUILD FOR ADDITIONAL
INFRASTRUCTURE
Canada
Local
Heating
Markets
>  Total Market Access Goal
Utopia*
Cornerstone*
110,000 bpd
East Coast/
Exports
Utopia West*
Refineries
>  Existing Pipe Connectivity:
TEPPCO
Chicago
Utica
&
Ohio River
>  Planned Pipe Connectivity:
Mariner
East
565,000 bpd
>  Several Projects Entering
UMTP*
Gulf
Coast
“Open Season”
Truck
Rail
Barge*
>  Truck, Rail, and Barge
Balancing Capacity
Conway
* Under Evaluation
C - 23 Analyst Day 2015 | May 13, 2015
© 2015 The Williams Companies, Inc. All rights reserved.
WPZ – Northeast G&P
Utica, Ohio River Expanding Market Hub for Gas
Canada
NE Mkts
Ontario
Canada
Michigan
Local
Distribution
Tennessee
Chicago
Midwest
Hub
Utica &
Ohio River
Spectra
Nexus +
TETCO
TETCO
Transco
Northeast
Dominion
North
Carolina
Appalachian
Connector
MidContinent
Transco
Northeast
TCO
Pool
Gulf
Coast
Transco
Southeast
Existing Pipeline / Connections + Expansion Proposed or In Progress
Proposed Pipeline
C - 24 Analyst Day 2015 | May 13, 2015
© 2015 The Williams Companies, Inc. All rights reserved.
WPZ – Northeast G&P
Additional Growth Opportunities for Dedicated
Acreage in NW PA and NE Ohio
EXTENSIVE DEDICATION PROVIDES
OPPORTUNITIES TO EXPAND
>  Rex and Shell G&P Agreement
–  244,500 dedicated acres
–  Fee-based
>  Chevron G&P Agreement
–  285,000 dedicated acres
–  Fee-based
Rex, Shell and Chevron
Acreage Dedications
C - 25 Analyst Day 2015 | May 13, 2015
© 2015 The Williams Companies, Inc. All rights reserved.
WPZ – Northeast G&P
Growth Outlook
C - 26 Analyst Day 2015 | May 13, 2015
© 2015 The Williams Companies, Inc. All rights reserved.
WPZ – Northeast G&P
Strong Fundamentals and Competitive
Advantages Drive Robust, Visible Growth
Northeast G&P Growth Investment Opportunities
2015–2020
WPZ / WMB Pursuing Over
$30 Billion of Project Opportunities
!! In guidance1
Growth Opportunities Include:
!! Under negotiation
>  Continue Expansion in NE PA
!! Potential
West
(WPZ)
NGL &
Petchem
(WMB)
NGL &
Petchem
(WPZ)
to Meet Producers’ Growth
Northeast
G&P
(WPZ)
>  Opportunities for Continued
Growth in Ohio River and
Utica Supply Hubs
Access
Northeast
(WPZ)
>  Expanding Market Hubs
Access
Midstream
(WPZ)
>  Gathering and Processing
Atlantic-Gulf
(WPZ)
Opportunities in NW PA and
NE OH
C - 27 Analyst Day 2015 | May 13, 2015
© 2015 The Williams Companies, Inc. All rights reserved.
WPZ – Northeast G&P
Delivering Large Scale Infrastructure for
Fastest-Growing Supply Area in the U.S.
GATHERING VOLUME GROWTH THROUGH 1Q2015
AVERAGE GATHERED VOLUMES (BCF/D)
7.00
2012–2014 CAGR:
6.00
>  Legacy WPZ +45%
5.00
>  Legacy Access +52%
>  Combined +49%
4.00
3.00
2.00
1.00
1Q'12
2Q'12
3Q'12
4Q'12
1Q'13
2Q'13
Dry Gas
3Q'13
4Q'13
1Q'14
2Q'14
3Q'14
4Q'14
Wet Gas
Partially owned system volumes are shown at 100%.
Note: Excludes volumes for Blue Racer investment.
C - 28 Analyst Day 2015 | May 13, 2015
© 2015 The Williams Companies, Inc. All rights reserved.
1Q'15
WPZ – Northeast G&P
Leading Gathering Position in Preeminent
Gas Basin in North America
TOTAL MARCELLUS/UTICA AVERAGE GATHERED VOLUMES (Bcf/d) - 1Q 20151
Marcellus
38%
Non WPZ
Marcellus & Utica
Gathered Volumes2
Utica
Northeast Gathering Systems and WPZ Ownership
Susquehanna Supply Hub (100%)
Bradford Supply Hub (39%)
1
Source for total Utica and Marcellus volume: Energy Information
Administration, average daily production for 1Q 2015.
2
Ohio River Supply Hub
#  Ohio Valley Midstream (100%)
#  Laurel Mountain Midstream (69%)
#  Marcellus South (65%)
Utica Supply Hub
#  Utica Dry Gas (100%)
#  Cardinal (66%)
Blue Racer Midstream (29%)
Partially owned gathering system volumes are shown at 100%.
C - 29 Analyst Day 2015 | May 13, 2015
© 2015 The Williams Companies, Inc. All rights reserved.
WPZ – Northeast G&P
Northeast G&P Summary
>  Large-scale
infrastructure in place
>  Positioned to
capture value
>  Focused on delivering
optimal value
>  Large-scale position
connects best basins to
best markets
C - 30 Analyst Day 2015 | May 13, 2015
© 2015 The Williams Companies, Inc. All rights reserved.
NGL & Petchem Services
John Dearborn
Senior Vice President
NGL & Petchem Services
Overview
D - 2 Analyst Day 2015 | May 13, 2015
© 2015 The Williams Companies, Inc. All rights reserved.
NGL & Petchem Services
Connecting Low Cost NGL Supplies to Growing
Global Markets for Fuels and Petrochemicals
Strong Linkage to Williams Strategy
EXECUTION
With a Process Safety
Mindset, operate our existing
assets reliably, minimizing
cost and maximizing
their value
FEE-BASED GROWTH
Grow free cash flow
employing a fee for service
business model to the
valuable solutions and
services provided
to the market
D - 3 Analyst Day 2015 | May 13, 2015
SUSTAINABLE
COMPETITIVE ADVANTAGE
Take commodity exposure
only when sustainably
advantaged and
compensated for the risk
© 2015 The Williams Companies, Inc. All rights reserved.
NGL & Petchem Services
Uniquely Positioned to Benefit from a Broad
Spectrum of Opportunities
Serving Demand Growth Enabled by Abundant Natural Gas
Competitively
Advantaged Margins
Fee for Service
Pipelines
Storage
Fractionation
Geismar
Canadian Offgas
Processing
Canadian PDH
(Proposed)
Geismar II
(Proposed)
D - 4 Analyst Day 2015 | May 13, 2015
© 2015 The Williams Companies, Inc. All rights reserved.
NGL & Petchem Services
NGL & Petchem Execution Highlights
Progressing Against Plan
>  Geismar operating at base capacity
–  Full expanded capacity expected in June
>  Advancing our unique position in Alberta
–  Maximizing value from current assets
–  Horizon Offgas project in Alberta scheduled for start-up in Q4
–  PDH-1 advancing to sanction
–  In discussions with Syncrude for a third offgas extraction plant in Alberta
>  Pipeline projects progressing
–  Texas Belle in-service and pursuing additional business opportunities
–  Bayou Ethane in-service providing physical connectivity to Mt. Belvieu
–  Promesa Pipeline commercial negotiations nearing completion, pipeline in
construction
>  Acquired the Hutchinson rail terminal from NGL Energy Partners
>  Advancing Geismar II with discipline
D - 5 Analyst Day 2015 | May 13, 2015
© 2015 The Williams Companies, Inc. All rights reserved.
NGL & Petchem Services
Market Dynamics
D - 6 Analyst Day 2015 | May 13, 2015
© 2015 The Williams Companies, Inc. All rights reserved.
NGL & Petchem Services
Naphtha – Dominant Global Ethylene Feedstock
North America Enjoys Sustainable Natural Gas-based Advantage
ETHYLENE PRODUCTION BY FEEDSTOCK
(BILLIONS OF POUNDS)
>  Naphtha expected to
set global market
price for ethylene
500
>  North American
400
feedslate
predominantly
ethane based
300
200
>  Low likelihood of
oversupply in the
global ethylene
market
100
0
World N.A.
World N.A.
World N.A.
World N.A.
World N.A.
2016
2018
2020
2022
2024
Ethane
Propane
Butane
Naphtha
Gas Oil
Others
Source: IHS, World Ethylene Analysis 2015
D - 7 Analyst Day 2015 | May 13, 2015
© 2015 The Williams Companies, Inc. All rights reserved.
NGL & Petchem Services
Ethane Sustains North American Investment
Cost Advantage Remains Through a Wide Range of Commodity Prices
GLOBAL ETHYLENE PRODUCTION COST SUPPLY CURVE
$100/bbl
40
$58/bbl
30
0
2,500
5,000
7,500
Asia Naphtha
W. Europe
Naphtha
W. Europe LPG
Asia LPG
NA Ethane
China Coal
Middle East
Ethane
0
Rest of World
19 cpg
10
NA Naphtha
20
Middle East
LPG / Naphtha
50 cpg
NA
LPG
Ethylene Production Cost
(cents/pound)
50
10,000 12,500 15,000 17,500 20,000 22,500 25,000
Monthly Global Ethylene Production (millions of pounds)
Source: Wood Mackenzie, Williams Research
Feb 2015: Brent Crude Oil = $58/bbl; US Ethane = 18.5 cpg; US Natural Gas = $2.65/MMbtu
What-if Scenario: Brent Crude Oil = $100/bbl; US Ethane = 50.0 cpg; US Natural Gas = $4.50/MMbtu
D - 8 Analyst Day 2015 | May 13, 2015
© 2015 The Williams Companies, Inc. All rights reserved.
NGL & Petchem Services
Ethane Supplies Are Plentiful in North America
Ethane Remains Competitive Feedstock After Paying for Infrastructure
ETHANE SUPPLY POTENTIAL SUPPORTS ~500 MBPD OF ADDITIONAL U.S.
CRACKER DEMAND (MBPD)
Additional cost required to
deliver to market
3,000
Demand Sources
2,500
Exports to
Canada
n
Rejectio
2,000
Other Demand
1,500
Waterborne
Exports
Chemical
Demand for
Ethane
1,000
500
0
2014
2016
2018
2020
2022
2024
Total Supply
Source: Wood Mackenize, Williams Research
D - 9 Analyst Day 2015 | May 13, 2015
© 2015 The Williams Companies, Inc. All rights reserved.
NGL & Petchem Services
Franchise Snapshots
D - 10 Analyst Day 2015 | May 13, 2015
© 2015 The Williams Companies, Inc. All rights reserved.
NGL & Petchem Services
Driving Growth in Guidance and Beyond
NGL & Petchem Services Contributes to Williams Growth Potential
2015–2020
WPZ / WMB PURSUING OVER $30 BILLION OF
PROJECT OPPORTUNITIES
!! In guidance1
!! Under negotiation
!! Potential
NGL &
Petchem
(WPZ)
NGL &
Petchem
(WMB)
Northeast
G&P
(WPZ)
West
(WPZ)
Access
Northeast
(WPZ)
Access
Midstream
(WPZ)
Atlantic-Gulf
(WPZ)
1
GROWTH OPPORTUNITIES INCLUDE:
>  In Guidance:
–  Geismar Expansion & Modernization
–  Bayou Ethane
–  Texas Belle
–  Promesa
–  Hutch Rail
>  Additional Growth Opportunities:
–  Geismar II
–  Syncrude Offgas Processing
–  PDH I
–  PDH II
–  Jackrabbit Propylene System
Guidance presented here is at the midpoint of ranges.
D - 11 Analyst Day 2015 | May 13, 2015
© 2015 The Williams Companies, Inc. All rights reserved.
Geismar Plot Plan
Rebuilt and Expanded
D - 12 Analyst Day 2015 | May 13, 2015
© 2015 The Williams Companies, Inc. All rights reserved.
Geismar Plant Currently Operating at Base Rate
Expansion Awaiting Repair to EBR System Transformer
Gas Treating
Propane
To
Fuel
To
Fuel
To
Hydrogen
Purification
Ethylene
and Ethane
New Caustic Tower
Hydrogen
Dryers
2 New
Charge Gas
Compressor
Bed
Height
Extended
Feed
Separators
Demethanizer
New Trays
New
Quench
Tower
New
Demethanizer
Cracking
Furnaces
Precut
Demethanizer
Ethane
Parallel Amine Towers
New
C2
Dryer
Methane
To
Hydrogen
Customer
Battery
Limits
New EBR
System
New
Booster
Compressor
Ethylene
Propane
Conversion
Ddebutanizer
Certain new
equipment
added
Propylene
Fractionator
Depropanizer
Ethylene Fractionator
New Trays
2 New
Acetylene Converters
replacing existing 3
Propylene
Recycle to
DeEthanizer
Legend
Systems currently
operating
System not yet
operating
Butadiene
DAC
D - 13 Analyst Day 2015 | May 13, 2015
© 2015 The Williams Companies, Inc. All rights reserved.
NGL & Petchem Services
Geismar Expansion and Modernization
Restore Confidence in Geismar’s Reliability
>  Expectations and focus:
–  Production expected to average
base rate in April to May period
with nearly 100 million pounds
of ethylene produced in April
–  Full expanded production
expected in June
–  Focus on optimizing reliability
and profitability with new
equipment configuration
–  Deliver promised value to
our shareholders
>  Expansion increases annual ethylene production capacity 50% to 1.95 billion lbs
–  Williams’ share is 1.7 billion lbs
D - 14 Analyst Day 2015 | May 13, 2015
© 2015 The Williams Companies, Inc. All rights reserved.
NGL & Petchem Services
Pipeline Projects Meeting Market Demands
Texas Belle and Bayou Ethane Now Operational
WMB TEXAS BELLE PIPELINE
>  Commissioned and in-service
>  Transportation solution for new C4+
NGL demand
–  On-purpose butylene production from
plentiful iso-butane supply
–  Motor fuel blending and export
WPZ BAYOU ETHANE PIPELINE
>  Phase 1 in service in Dec. 2014
>  Phase 2 in service this month
>  Phase 3 later this year
>  Supplies Geismar plant
along with customers in Mississippi
River Corridor, Golden Triangle and
Lake Charles areas
D - 15 Analyst Day 2015 | May 13, 2015
© 2015 The Williams Companies, Inc. All rights reserved.
NGL & Petchem Services
Promesa Open Access Ethylene Pipeline
Pipeline in Construction
>  Linking new growing supplies with
Net Ethylene Capacity
Golden Triangle Area
new growing demand of ethylene
>  Connecting the Ship Channel,
Mont Belvieu, Golden Triangle
and the Mississippi River markets
>  Strengthens the Williams
ethylene hub
>  System of repurposed, leased
and some new-build pipelines
Net Ethylene Capacity
Mont Belvieu/Ship Channel
2014
2019
2024
0-
MM lbs/yr
2,000
1,600
1,200
800
MM lbs/yr
400
(2,000)
0
2014
2019
2024
(4,000)
(6,000)
–  Integrity work progressing on
repurposed pipeline
Net Ethylene Capacity
Lake Charles Area
Net Ethylene Capacity
Mississippi River Area
2,000
2014
2019
2024
0-
1,200
MM lbs/yr
MM lbs/yr
1,600
800
400
0
2014
2019
2024
(2,000)
(4,000)
(6,000)
Note: Ethylene supply and consumption data per IHS
D - 16 Analyst Day 2015 | May 13, 2015
© 2015 The Williams Companies, Inc. All rights reserved.
NGL & Petchem Services
Advancing Unique Positions in Alberta
Expanding Liquids Extraction and Fractionation
>  Suncor-sourced liquids production of
6.9 million barrels included full-year
of ethane extraction
–  Fee for service floor pricing provides
protection in a low price ethane
environment
Alberta
>  Horizon project nearing completion
–  Scheduled for start-up in fourth
quarter of 2015
–  Scope includes
•  Liquids extraction plant (WMB)
•  Boreal pipeline lateral (WMB)
•  Redwater expansion (WPZ)
–  Contributes meaningfully to 2016+
>  In discussions with Syncrude for
third offgas processing opportunity
D - 17 Analyst Day 2015 | May 13, 2015
© 2015 The Williams Companies, Inc. All rights reserved.
NGL & Petchem Services
Fee-based Alberta Propylene Production (PDH-1)
Land-locked Propane Converted to Globally Competitive Polypropylene
>  Propylene capacity of 525 KTA
–  450 KTA fee for service firm offtake
–  75 KTA marketed as propylene
>  With propylene derivative
partner this system makes
some of the most competitive
polypropylene in North America
>  Significant FEED completed to reduce capital risk
>  Target full sanction in early 2016
D - 18 Analyst Day 2015 | May 13, 2015
© 2015 The Williams Companies, Inc. All rights reserved.
NGL & Petchem Services
Maximizing the Mid-continent
Bakke
n
(3 rd Pa NGL Pipelin
e
rty Pip
eline)
Demand Increasing for NGL Services
>  Cochin Reversal, Powder River
Growth and Bakken Growth
contributing to increasing demand in
Mid-continent for NGL services
–  Customers pursuing seasonal fuels
blending opportunities
>  Overland Pass Pipeline
–  Significant growth expected in 2015
volumes primarily driven by Bakken
and Powder River volume
>  Conway rail and storage
–  Strong storage season exceeded
expectations
–  New Hutch rail capacity allows
flexibility for Williams to capture rail
unloading and associated storage
>  Conway frac
–  Williams share fully utilized due to
Overland Pass Pipeline connection
D - 19 Analyst Day 2015 | May 13, 2015
© 2015 The Williams Companies, Inc. All rights reserved.
NGL & Petchem Services
Expanded Rail Capacity – Fee for Service Growth
Williams Now Largest Rail Service Provider in Mid-continent
>  Increased rail car capacity by 70%
>  Provides an additional 22 aboveground
storage tanks
>  Served by BNSF railroad
>  Fully integrated with existing Conway rail and
storage facilities – 25 miles from Conway assets
D - 20 Analyst Day 2015 | May 13, 2015
© 2015 The Williams Companies, Inc. All rights reserved.
NGL & Petchem Services
Connecting Supplies with Global Markets
Fee for Service New Build Ethylene Cracker at Geismar
COMPETITIVE ADVANTAGES
>  Builds into Mississippi River
ethylene short position of
4.5–5 billion pounds
>  Creates new Gulf Coast
ethylene and ethane demand
>  Provides supply reliability
to market
D - 21 Analyst Day 2015 | May 13, 2015
STATUS OF PROJECT
>  Nearing selection of JV partner
>  Advancing negotiations on ethane
to supply Mississippi River
>  Honing execution strategy to
minimize capital risk
>  Target 2016 sanction
© 2015 The Williams Companies, Inc. All rights reserved.
NGL & Petchem Services
NGL & Petchem Strategic Imperatives
>  Enhance operational discipline
and safety performance
>  Bring expanded Geismar plant
into sustainably safe operations
>  Maximize value of Horizon
Offgas start-up
>  Deliver Gulf Coast pipeline and
storage solutions
>  Deliver PDH program value
D - 22 Analyst Day 2015 | May 13, 2015
© 2015 The Williams Companies, Inc. All rights reserved.
West
Walter Bennett
Senior Vice President
WPZ – West
Low Risk, High Return, Strong Outlook
RELIABLE OPERATIONS
ACROSS VAST FOOTPRINT
Large-scale operations in
positions in proven
hydrocarbon reserves
E - 2 Analyst Day 2015 | May 13, 2015
SIGNIFICANT
VOLUMES DRIVING
HIGH-QUALITY REVENUE
Steady, primarily fee-based
business underpinned by
strong customer base
WELL-POSITIONED
TO FEED GROWING
DEMAND PULL
Linking abundant, diverse
supplies to established and
emerging markets
© 2015 The Williams Companies, Inc. All rights reserved.
WPZ – West
Reliable Operations Spanning from
New Mexico to Pacific Northwest
Key Operating Data – West
Miles of Gathering Pipe:
7,927
Miles of Transmission Pipe:
3,900
Gathering Capacity:
4.4 Bcf/d
Processing Capacity:
5.2 Bcf/d
Total Horsepower:
E - 3 Analyst Day 2015 | May 13, 2015
1.32 million
© 2015 The Williams Companies, Inc. All rights reserved.
WPZ – West
Video Profile: Bucking Horse Plant
E - 4 Analyst Day 2015 | May 13, 2015
© 2015 The Williams Companies, Inc. All rights reserved.
WPZ – West
Durable, Fee-based Revenue 87% of Gross
Margin and Expected to Continue Growing
$1.2 BILLION GROSS MARGIN - 2015
NGL Margins
11%
Commodity-based Fee 2%
48% G&P Fee
NWP Fee
39%
E - 5 Analyst Day 2015 | May 13, 2015
© 2015 The Williams Companies, Inc. All rights reserved.
WPZ – West
West G&P: Scale, Stability, Potential Growth
>  Prolific reserves
throughout region
Northwest
Pipeline
>  Large-scale positions
Wyoming
>  3,776 miles of pipeline
>  1.2 Bcf/d of gathering capacity
provide competitive
advantages
>  2.3 Bcf/d of processing capacity
Piceance Basin
>  328 miles of pipeline
>  Strong cash flows and
efficiencies
>  1.4 Bcf/d of gathering capacity
>  1.8 Bcf/d of processing capacity
>  Ability to “throttle up” to
meet customer needs
Four Corners
>  3,739 miles of pipeline
>  1.8 Bcf/d of
gathering capacity
>  1.5 Bcf/d of processing/
treating capacity
E - 6 Analyst Day 2015 | May 13, 2015
>  Expanding midstream
services to upstream
customers
© 2015 The Williams Companies, Inc. All rights reserved.
WPZ – West
West G&P Delivers Significant Volumes, Revenue
GATHERING VOLUME BY QUARTER (BCF/D)1
3.0
2.5
2.0
1.5
1.0
0.5
0.0
Q1'13
1 Reflects
Q2'13
Q3'13
Q4'13
Q1'14
Q2'14
Q3'14
Q4'14
Q1'15
volumes gathered on Williams-operated systems.
E - 7 Analyst Day 2015 | May 13, 2015
© 2015 The Williams Companies, Inc. All rights reserved.
WPZ – West
Rockies Producer Margins Still Strong Thanks to
Low-cost Available Infrastructure
Source: Williams Research
$4.00
T&F Fees
NGL
$3.00
$2.00
Margin
Gas Processing
Gas Gathering
Gas
NGL Uplift
$1.00
Opal Gas
$0.00
ROCKIES PRODUCER'S GAS + NGL VALUE & FEES – 2015 ($/Mcf)
E - 8 Analyst Day 2015 | May 13, 2015
© 2015 The Williams Companies, Inc. All rights reserved.
WPZ – West
Northwest Pipeline: Delivering Value for
Customers in Pacific Northwest
Spokane
Seattle
>  Optionality for customers between
Canada and Rockies prices
–  Plentiful, diverse supply sources in British
Columbia, Alberta, Rockies,
San Juan
Portland
Northwest
Pipeline
Boise
3.9 MMdth/d long-term capacity
- 3,900 miles of pipeline
- 41 compressor stations
14 MMdth storage capacity
- 2 storage facilities
- 731 Mdth/d withdrawal capacity
1 In
>  Strong competitive position
–  Sole provider in most major markets
–  Established infrastructure difficult and
expensive to replicate
–  99.9% reliability on firm transportation
>  High-quality revenue for Williams
–  High credit-quality customers
–  Average remaining contract life > 9 years
>  Strong customer relationships
–  Ranked #2 in Mastio survey of
pipeline customers1
–  Most customers rated Northwest Pipeline
“better” or “much better” than other pipelines
the mega/major pipeline category.
E - 9 Analyst Day 2015 | May 13, 2015
© 2015 The Williams Companies, Inc. All rights reserved.
WPZ – West
Outlook
E - 10 Analyst Day 2015 | May 13, 2015
© 2015 The Williams Companies, Inc. All rights reserved.
WPZ – West
Strong Fundamentals and Competitive
Advantages Drive Growth Opportunities
West Growth Investment Opportunities
2015–2020
WPZ / WMB Pursuing Over
$30 Billion of Project Opportunities
!! In guidance1
!! Under negotiation
Growth Opportunities Include:
!! Potential
>  Methanol Plant Expansions
West
(WPZ)
Northeast
G&P
(WPZ)
NGL &
Petchem
(WMB)
NGL &
Petchem
(WPZ)
>  Pacific Connector
>  Industrial & Power Plant
Access
Northeast
(WPZ)
Access
Midstream
(WPZ)
Expansions
>  Gathering and Processing
Opportunities
Atlantic-Gulf
(WPZ)
1
Guidance presented here is at the midpoint of ranges.
E - 11 Analyst Day 2015 | May 13, 2015
© 2015 The Williams Companies, Inc. All rights reserved.
WPZ – West
Pacific Northwest Demand Growth Heating Up
Port of Tacoma
Methanol Export
Up to 320 MDth/d
Target ISD: 2019
>  Announced New Market
Seattle
Kalama
Methanol Export
Up to 320 MDth/d
Target ISD: 2018
Washington Expansion
Up to 750 MDth/d
Target ISD: 2020
TransAlta Coal Plant
Up to 200 MDth/d
Target ISD: 2020/2025
Oregon
LNG
Opportunities
–
–
–
–
LNG Export
Methanol Export
Fertilizer Plants
Coal Conversion
Portland
>  Potential Projects
–  Washington Expansion
–  Pacific Connector
Port Westward
Methanol Export
Up to 320 MDth/d
Target ISD: 2020
Jordan
Cove
Pacific Connector
Gas Pipeline
1 Bcf/d
Target ISD: 2020
Magnida Fertilizer
Up to 75 MDth/d
Target ISD: 2018
Boise
E - 12 Analyst Day 2015 | May 13, 2015
Blue = Proposed Expansion Projects
(not included in guidance)
Green = Potential new end-use markets
announced by 3rd parties (may lead to
additional expansion opportunities on
Northwest)
© 2015 The Williams Companies, Inc. All rights reserved.
WPZ – West
Pacific Connector to Serve Global Markets
>  To serve proposed Jordan Cove
LNG export terminal
>  232-mile, 36-inch pipeline;
initial capacity = 1 Bcf/d
>  50/50 Ownership:
Williams & Veresen
>  Access to Rockies and Canadian
supplies from existing pipelines
>  Terminal has advantaged
port and shipping costs to
Asian markets
E - 13 Analyst Day 2015 | May 13, 2015
© 2015 The Williams Companies, Inc. All rights reserved.
WPZ – West
West Wrap-up
>  Reliable operations, vast
footprint
>  Significant, high-quality
revenue
>  Demand growth
building
E - 14 Analyst Day 2015 | May 13, 2015
© 2015 The Williams Companies, Inc. All rights reserved.
Atlantic - Gulf
Rory Miller
Senior Vice President
WPZ – Atlantic - Gulf
Overview
F - 2 Analyst Day 2015 | May 13, 2015
© 2015 The Williams Companies, Inc. All rights reserved.
WPZ – Atlantic - Gulf
High-growth, Low-risk, Fee-based Businesses
RAPID PACE
OF EXPANSION
Growing demand continues to
drive tremendous opportunity
F - 3 Analyst Day 2015 | May 13, 2015
TRACK RECORD
OF EXECUTION
2015 to date: Rockaway,
Northeast Connector,
Mobile Bay South III,
CPV Woodbridge
UNIQUE CAPABILITIES
IN GULF
Business model appeals to
producers in capital
constrained environment
© 2015 The Williams Companies, Inc. All rights reserved.
WPZ – Atlantic - Gulf
Abundant Supply + Strong Demand = Rapid Growth
CONNECTING
THE BEST
SUPPLIES
Marcellus-Utica,
Gulf Coast
TO THE BEST
MARKETS
New York City,
Washington D.C.,
Philadelphia, Florida,
Atlanta, LNG export
F - 4 Analyst Day 2015 | May 13, 2015
© 2015 The Williams Companies, Inc. All rights reserved.
WPZ – Atlantic - Gulf
Franchise Snapshots
F - 5 Analyst Day 2015 | May 13, 2015
© 2015 The Williams Companies, Inc. All rights reserved.
WPZ – Atlantic - Gulf
Eastern Interstates: Nation’s Largest,
Fastest-growing Interstate Pipeline Systems
NE Connector/
Rockaway Lateral
CAPITAL INVESTED PLACED
INTO SERVICE ($B)
Constitution
$5.1
Leidy
Southeast
New York Bay
Expansion
Garden State
Expansion
Atlantic
Sunrise
$3.3
2017
Virginia
Southside I & II
$0.4
2016
Hillabee
Phase 1
$1.4
2015
South Louisiana
Market
Rock Springs
Expansion
Dalton Lateral
Gulf Trace
F - 6 Analyst Day 2015 | May 13, 2015
CPV
Woodbridge
Mobile Bay
South III
© 2015 The Williams Companies, Inc. All rights reserved.
WPZ – Atlantic - Gulf
Gulf West: Strong Competitive Position for
Mexico, Deepwater Business
>  Well positioned for
Alaminos Canyon, Pemex,
and export to Mexico
>  Eagle Ford rich gas
gathering and processing
opportunities
>  Continued development
at Perdido has resulted in
record production rates of
175MMcfd and 90Mbpd
>  Opportunity to build
1.5 Bcfd gas pipeline
to supply several CFE
pipelines in Mexico
F - 7 Analyst Day 2015 | May 13, 2015
© 2015 The Williams Companies, Inc. All rights reserved.
WPZ – Atlantic - Gulf
Gulf East: Tiebacks Drive New Opportunities
CONTRACTED:
>  Tubular Bells – Gulfstar One (GS1)
– ramping up production from
3 wells and bringing on fourth well
now
>  Kodiak – tieback to Devils Tower –
expected online 4Q 2015
>  Gunflint – tieback to GS1 expected
first half 2016
POTENTIAL:
>  Appomattox development
(Norphlet Play) – gas gathering,
transportation, & processing –
projected in service 2019
>  Taggart – tieback to Devils Tower –
projected in service early 2017
F - 8 Analyst Day 2015 | May 13, 2015
© 2015 The Williams Companies, Inc. All rights reserved.
WPZ – Atlantic - Gulf
Discovery: Keathley Canyon Connector™ Ramps Up
>  400 MMcf/d capacity
>  Lucius First Gas: Feb. 7, 2015
>  Hadrian South First Gas:
March 28, 2015
>  Combined Lucius/Hadrian South
ramp-up ongoing
>  Heidelberg First Gas: Mid-2016
>  Buckskin/Moccasin: Likely tied back
to Lucius
>  High-potential neighborhoods with
development drilling planned in 2015
>  Total Discovery system currently at
max capacity of 650MMcf/d
F - 9 Analyst Day 2015 | May 13, 2015
© 2015 The Williams Companies, Inc. All rights reserved.
WPZ – Atlantic - Gulf
Video Profile: Keathley Canyon Connector
F - 10 Analyst Day 2015 | May 13, 2015
© 2015 The Williams Companies, Inc. All rights reserved.
WPZ – Atlantic - Gulf
Growth Outlook
F - 11 Analyst Day 2015 | May 13, 2015
© 2015 The Williams Companies, Inc. All rights reserved.
WPZ – Atlantic - Gulf
Eastern Interstates: Unprecedented Growth
with Fully Contracted Projects
CAPITAL INVESTMENT PLACED INTO SERVICE
($MM)
MMdt/Day
17.7
$4,000
13.4
Peak Day
Transco
Record Jan. 7
$3,500
$3,000
$2,500
16
14
10.8
$2,000
18
12
$1,500
10
$1,000
7.7
8
$500
$0
6
2003
2005
Transco
2007
Gulfstream*
2009
Constitution*
2011
2013
2015
2017
Capacity*
* Represents Williams ownership percentage. The estimated project in-service dates assume timely receipt of all regulatory approvals.
Constitution expected in service second half of 2016.
F - 12 Analyst Day 2015 | May 13, 2015
© 2015 The Williams Companies, Inc. All rights reserved.
WPZ – Atlantic - Gulf
Eastern Interstates: Growth Volumes Well
Balanced Among High-quality Customers
LDC
LNG
12%
>  Distribution of total
25%
Producer
volume growth (6.9
Bcf/d) in guidance
29%
>  Contract life ranges
from 15 to 30 years
34%
Power Plant
F - 13 Analyst Day 2015 | May 13, 2015
© 2015 The Williams Companies, Inc. All rights reserved.
WPZ – Atlantic - Gulf
WPZ – Atlantic - Gulf
Customer Demand Drives New York Bay Project
>  Expansion from Station
195 in York County,
Pa., to two existing
delivery points in
New York
>  Follow-on to Rockaway
Narrows
Rockaway
Delivery Point
210
205
200
195
River Road
F - 14 Analyst Day 2015 | May 13, 2015
207
>  Open season
concluded March 26
>  115 MDth/d fully
committed
>  Customer:
National Grid
>  Target in-service:
Late 2017
© 2015 The Williams Companies, Inc. All rights reserved.
WPZ – Atlantic - Gulf
Atlantic Sunrise: Unlocking Marcellus Access
>  Bolsters connection to growing
Marcellus supplies
195
>  1.7 MMDth/d fully committed
>  15-year binding
Atlantic Sunrise
•  1.7 MMDth/d
•  2017
firm-transportation
agreements
>  Expecting WPZ net
165
investment of $1.9 billion
>  Producers, LDCs investing in
greenfield portion of project
>  Target in-service:
second half of 2017
85
F - 15 Analyst Day 2015 | May 13, 2015
© 2015 The Williams Companies, Inc. All rights reserved.
WPZ – Atlantic - Gulf
Proposed Appalachian Connector Leverages
Northeast G&P’s Ohio Valley Midstream Position
>  Incremental firm
195
Proposed
Appalachian
Connector Project
165
transportation capacity
from receipt points in
western Marcellus, Utica
to mid-Atlantic, Southeast
and Gulf Coast markets as
far south as Station 65
in Louisiana
>  In discussions with
potential shippers
>  Facilities and scope to be
Market
Pull: LNG,
Mexico
85
Market
Pull: Power
Gen
determined based on final
level of shipper
commitment
65
F - 16 Analyst Day 2015 | May 13, 2015
© 2015 The Williams Companies, Inc. All rights reserved.
WPZ – Atlantic - Gulf
Northern Market: Continuing Strong Growth
Constitution
•  650 MDth/d
•  2016
Leidy Southeast
•  525 MDth/d
•  2015
Leidy Hub
CPV Woodbridge
•  264 MDth/d
•  April 1,
2015
New
York City
Atlantic Sunrise
•  1,700 MDth/d
•  2017
210
Rockaway Lateral
•  647 MDth/d
•  2015
Garden State
•  180 MDth/d
•  2017
195
VA
F - 17 Analyst Day 2015 | May 13, 2015
NE Connector
•  100 MDth/d
•  2014/2015
Rock Springs Lateral
•  192 MDth/d
•  2016
© 2015 The Williams Companies, Inc. All rights reserved.
WPZ – Atlantic - Gulf
Power Gen Fuels Southern Market Expansions
Virginia Southside
•  270 MDth/d
•  2015
Virginia Southside II
•  250 MDth/d
•  2017
165
160
Dalton Expansion
•  448 MDth/d
•  2017
Hillabee Expansion
•  818 MDth/d
•  2018
85
Mobile Bay South III
•  225 MDth/d
•  April 1, 2015
F - 18 Analyst Day 2015 | May 13, 2015
© 2015 The Williams Companies, Inc. All rights reserved.
WPZ – Atlantic - Gulf
Video Profile: Virginia Southside
F - 19 Analyst Day 2015 | May 13, 2015
© 2015 The Williams Companies, Inc. All rights reserved.
WPZ – Atlantic - Gulf
Gulf Market Area Expansions Serving LNG and
Industrial Customers
65
Gulf Connector
•  1,200 MDth/d
•  2019
50
45
30
Gulf Trace
•  1,200 MDth/d
•  2017
F - 20 Analyst Day 2015 | May 13, 2015
South Louisiana Market
•  190 MDth/d
•  2018
© 2015 The Williams Companies, Inc. All rights reserved.
WPZ – Atlantic - Gulf
Summary
F - 21 Analyst Day 2015 | May 13, 2015
© 2015 The Williams Companies, Inc. All rights reserved.
WPZ – Atlantic - Gulf
Unprecedented Growth Expected Through 2020
Atlantic - Gulf Growth Investment Opportunities
2015–2020
WPZ / WMB PURSUING OVER $30 BILLION OF
PROJECT OPPORTUNITIES
!! In guidance1
!! Under negotiation
>  Numerous demand-driven
Transco projects
!! Potential
NGL &
Petchem
(WPZ)
NGL &
Petchem
(WMB)
GROWTH OPPORTUNITIES INCLUDE:
Northeast
G&P
(WPZ)
West
(WPZ)
Access
Northeast
(WPZ)
Access
Midstream
(WPZ)
>  Infrastructure to connect Marcellus/
Utica supply to Transco’s Southeast
markets
>  Gulf market area expansions
serving LNG and industrial
customers
>  Additional Gulfstars
>  Various offshore tiebacks
Atlantic-Gulf
(WPZ)
>  Mexican offshore production
facilities
>  Texas-to-Mexico export pipeline
1
Guidance presented here is at the midpoint of ranges.
F - 22 Analyst Day 2015 | May 13, 2015
© 2015 The Williams Companies, Inc. All rights reserved.
WPZ – Atlantic - Gulf
Atlantic - Gulf Wrap-up
>  Connecting the best
supplies to the best
markets
>  Stable, repeatable
cash flows
>  Proven track record
of execution
>  And the hits keep
on coming!
F - 23 Analyst Day 2015 | May 13, 2015
© 2015 The Williams Companies, Inc. All rights reserved.
WPZ and WMB: Financial Outlook
Don Chappel
Chief Financial Officer
Financial Outlook – WPZ
Williams Partners L.P. (WPZ)
Financial Outlook
G - 2 Analyst Day 2015 | May 13, 2015
© 2015 The Williams Companies, Inc. All rights reserved.
Financial Outlook – WPZ
WPZ Is a Premier Energy-Infrastructure Investment
>  ACMP/WPZ merger created leading natural gas MLP with strong cash
distribution growth and investment-grade credit ratings
1
>  DCF expected to grow ~18% (CAGR) from 2015 to 2017
>  Approximately 88% of WPZ gross margin coming from fee-based
revenues
>  Investment grade credit rating with ~$3 billion of available liquidity
>  $9.3 billion of total growth capex in 2015-2017 guidance; 99% is
focused on fee-based projects
>  WPZ and WMB have over $30 billion of committed and potential
growth capital through 2020
1
>  Improving cash coverage ratio over period, targeting 1.07x by 2016
>  Expect WPZ per unit distributions of $3.40 in 2015 with 7% to 11%
annual growth rate through 2017 with growing coverage
Notes: All Distributable Cash Flow (DCF) references are “Attributable to Partnership Operations”. 1 Distributable Cash Flow (DCF)
and Cash Distribution Coverage Ratio are non-GAAP measures. A reconciliation to the most relevant GAAP measure is included in
this presentation.
G - 3 Analyst Day 2015 | May 13, 2015
© 2015 The Williams Companies, Inc. All rights reserved.
Financial Outlook – WPZ
Expect Strong Growth Through 2017 and Beyond
(Low / High guidance, dollars in millions)
ADJUSTED EBITDA 1
$6,500
$6,000
DISTRIBUTABLE CASH FLOW (DCF) 1
2-Yr CAGR
16%
$6,180
$5,000
$4,500
2-Yr CAGR
18%
$5,510
$5,500
$5,000
$5,750
$4,630
$3,475
$3,000
$2,845
$4,300
2015
$2,500
2016
2015
2017
2015
1.15x
$5,000
1.10x
1.06x
$4,230
$3,630
2017
DISTRIBUTION COVERAGE RATIO1
CAPEX & INVESTMENTS2
$4,000
$3,960
$3,175
$5,120
$4,500
$4,000
$3,875
$4,000
$3,500
$4,410
$3,580
1.05x
1.03x
$3,680
1.08x
1.05x
0.95x
$3,000
$3,080
$2,980
2016
2017
0.95x
0.85x
$2,000
2015
2015
2016
2017
Notes: Expect 2015 Adjusted EBITDA , DCF and Cash Distribution Coverage Ratio to be near low end of guidance range. All Distributable
Cash Flow (DCF) references are “Attributable to Partnership Operations”. 1 Adjusted EBITDA, Distributable Cash Flow and Cash
Distribution Coverage Ratio are non-GAAP measures. A reconciliation to the most relevant GAAP measure is included in this presentation.
2 Includes purchases of property, plant & equipment; investments; and businesses.
G - 4 Analyst Day 2015 | May 13, 2015
© 2015 The Williams Companies, Inc. All rights reserved.
Financial Outlook – WPZ
WPZ expecting ~ 88% fee-based gross margins
for 2015-2017
0
2015 FORECAST: $6.9 BILLION (includes proportional JV margins)
4%
7%
29%
Regulated Gas Pipeline Fee
Based Revenue (29%)
(Demand Payments)
Access Midstream Fee Based
Revenue (29%)
(Primarily Cost of Service and MVC)
31%
Other Fee Based Revenue (31%)
Olefins Commodity Margins (7%)
NGL Commodity Margins (4%)
29%
Note: Gross margin dollars and fee-based percentage calculated at midpoint of guidance range.
G - 5 Analyst Day 2015 | May 13, 2015
© 2015 The Williams Companies, Inc. All rights reserved.
Financial Outlook – WPZ
WPZ allocating 99% of $9.3 billion in growth
capital guidance to fee-based projects
2015-2017 GROWTH CAPITAL FORECAST
1%
Regulated Gas Pipeline Fee
Based Projects (52%)
26%
(Demand Payments)
Access Fee Based Projects (21%)
(Primarily Cost of Service and MVC)
52%
Other Fee Based Projects (26%)
Commodity Margin Projects (1%)
21%
Note: Growth capital dollars and fee-based percentage calculated at midpoint of guidance range.
G - 6 Analyst Day 2015 | May 13, 2015
© 2015 The Williams Companies, Inc. All rights reserved.
Financial Outlook – WPZ
WPZ Has Significant Liquidity and Investment Grade Rating
>
>
>
>
>
>
~$3.0 billion total available liquidity (as of 5/1/15)
No outstanding revolver loans (as of 5/1/15)
$521 million of commercial paper outstanding (as of 5/1/15)
No significant debt maturities until 2020
Debt is all fixed rate
Investment grade credit metrics and rating
WPZ CONSOLIDATED DEBT (DOLLARS IN MILLIONS)
$5,000
$4,000
$4,500
$4,468
$2,000
$2,100
$1,000
$375
$0
2015 *
2016
$785
2017
$1,250
$1,500
2021
2022
$2,000
$1,750
2023
2024
$500
2018
2019
2020
2025-2045
2025
* $750 million of debt maturing in 1Q 2015 was previously refinanced.
G - 7 Analyst Day 2015 | May 13, 2015
© 2015 The Williams Companies, Inc. All rights reserved.
Financial Outlook – WPZ
Expect Continued Strong Cash
Distribution Growth
(Midpoint of guidance, distributions per L.P. unit)
2015–2017 9% CAGR
>  History of strong distribution growth
>  Current guidance reflects annual
distribution growth of 7% to 11%
through 2017 with growing coverage
$4.50
$4.04
$4.00
>  Cash distributions growing less than
underlying DCF growth as we rebuild
coverage to target
>  Cash flows are anchored by
rapidly growing fee-based
business, which is projected
to be ~88% of WPZ’s 2015-2017
gross margin
$3.71
$3.50
$3.40
$3.00
$2.50
2015
2016
2017
Guidance
Notes: Presented on an accrual basis.
G - 8 Analyst Day 2015 | May 13, 2015
© 2015 The Williams Companies, Inc. All rights reserved.
Financial Outlook – WPZ
WPZ Adjusted EBITDA1 Expected to Grow by $1.2 Billion
or 38% This Year Driven by Increases in Fee Revenues
$5,500
Dollars in millions
+$400
($321)
$5,000
($175)
+$125
Increase
in Gas
Pipelines
Fee
Revenues
($80)
Decrease
in NGL
Margins
$4,465
Increase
in
Operating
Expenses
& Other
+$700
$4,000
Increase
in Other
Fee
Revenues
(Unregulated
excluding
ACMP)
Inclusion
of Full
Year +
$570
$3,500
llion
mi
,224
%
or 38
+$1
Growth
+$130
$3,241
$3,000
Increase
in
Olefins
Volumes
+$575
$4,500
Geismar
Insurance
Timing3
Increase
in ACMP
EBITDA
2014
Adjusted
EBITDA 1,2
2015
Adjusted
EBITDA 1
Notes: Expect 2015 Adjusted EBITDA to be near low end of guidance range. Includes proportionate share from joint venture
investments. 1 A more detailed schedule reconciling this non-GAAP measure is provided in this presentation. 2 Includes ACMP
from July 1 to December 31. 3 2014 Adjusted EBITDA included $321 million of actual and expected business interruption insurance
proceeds.
G - 9 Analyst Day 2015 | May 13, 2015
© 2015 The Williams Companies, Inc. All rights reserved.
Financial Outlook – WPZ
WPZ Adjusted EBITDA1 Grows $1.5 Billion or 34% Over
Two Years Driven by Increases in Fee Revenues
$6,500
Dollars in millions
+$50
+$200
$6,000
+$250
Increase
in Gas
Pipelines
Fee
Revenues
+$275
+$175
$5,500
($125)
$5,315
+$125
Increase
Increase in
in
Commodity Operating
Margins
Expenses
& Other
+$250
$5,000
$4,500
Increase
in Gas
Pipelines
Fee
Revenues
+$425
Increase
in ACMP
Fee
Revenues
$4,465
Increase
in ACMP
Fee
Revenues
Increase
in Other
Fee
Revenues
(Unregulated
excluding
ACMP)
illion
($125)
$5,965
Increase
in
Operating
Expenses
& Other
%
or 12
0m
+$65
Increase
in Other
Fee
Revenues
(Unregulated
excluding
ACMP)
$4,000
illion
%
or 19
0m
+$85
$3,500
$3,000
Increase in
Commodity
Margins
2015
Adjusted
EBITDA 1
2016
Adjusted
EBITDA 1
2017
Adjusted
EBITDA 1
Notes: Expect 2015 Adjusted EBITDA to be near low end of guidance range. Includes proportionate share from joint venture
investments. 1 A more detailed schedule reconciling this non-GAAP measure is provided in this presentation.
G - 10 Analyst Day 2015 | May 13, 2015
© 2015 The Williams Companies, Inc. All rights reserved.
Financial Outlook – WMB
Williams (WMB) Financial Outlook
G - 11 Analyst Day 2015 | May 13, 2015
© 2015 The Williams Companies, Inc. All rights reserved.
Financial Outlook – WMB
Williams well positioned for continued strong growth
>  ACMP/WPZ merger created leading natural gas MLP with cash
distribution growth and investment-grade credit ratings
>  Strong, growing cash flows from WPZ distributions expected to increase
~31% from 2015 to 2017 (14% CAGR)
>  Fee-based revenues comprise ~87% of WMB gross margins
>  Over $9.7 billion of total growth capex in 2015-2017 guidance; 99% of
projects focused on fee-based projects
>  Investment grade credit rating with ~$1.2 billion of available liquidity
>  Over $30 billion of committed and potential growth capital through 2020
>  Expect WMB dividend of $2.38 per share in 2015 with 10% to 15%
annual growth rate in 2016 and 2017 with growing coverage
G - 12 Analyst Day 2015 | May 13, 2015
© 2015 The Williams Companies, Inc. All rights reserved.
Financial Outlook – WMB
Expect Strong Growth Through 2017 and Beyond
(Midpoint of guidance, dollars in millions, except per share amounts)
ADJUSTED EBITDA1
$7,000
DISTRIBUTIONS FROM WPZ
2-Yr CAGR
16%
$4,000
$6,050
$6,000
3-Yr CAGR
12%
$3,000
$5,375
$2,000
$5,000
$4,510
$2,805
$2,455
$1,000
$4,000
$0
2015
2016
2017
DIVIDENDS PER SHARE2
$3.50
$2,140
$2,000
2014
2016
2017
DIVIDEND COVERAGE RATIO2
CAGR 2014-2018 15.5%
CAGR 2015-2018 12.5%
1.30x
Boosted Dividend 36% in 2014
and Moved to a Pure-Play GP
Holding Company Structure
$3.01
$2.68
1.20x
$2.38
$2.50
2015
1.19x
$1.96
1.10x
$1.50
1.00x
2014
2015
2016
2017
2014
1.10x
1.06x
1.05x
2015
2016
2017
Notes: Expect 2015 Adjusted EBITDA to be near low end of guidance range. 1 A more detailed schedule reconciling this nonGAAP measure is provided in this presentation. 2 Detailed illustrative dividend and coverage calculations are included in this
presentation.
G - 13 Analyst Day 2015 | May 13, 2015
© 2015 The Williams Companies, Inc. All rights reserved.
Financial Outlook – WMB
Strategic, Large-Scale, Primarily
Fee-Based Cash Flows Driving Growth
PROJECT DESCRIPTION AND EST. CAPEX
$ IN MILLIONS
>  Target IRRs
>  Fee-based 13%-25%
>  Commodity-exposed
25%+
EXPECTED REMAINING TIME TO
IN-SERVICE DATE1)
Atlantic Sunrise (Transco share) – $1,900
Leidy SE – $600
Partial Service
Keathley Canyon Connector 60% Ownership – $460
Constitution Pipeline 41% Ownership – $360
Rockaway Lateral – $350
WPZ
Atlantic/Gulf
Virginia South Side – $300
Partial Service
Gulf Trace – $300
Hillabee Expansion (Phase 1) – $310
Dalton Lateral – $275
Virginia South Side, Ph. 2 – $210
Garden State - $150
Phase 2
Gunflint – $150
2)
Geismar Expansion – $810
WPZ NGL/Petchem
CNRL Upgrader – $250
WMB
NGL/Petchem
CNRL Upgrader – $450
Pipeline Acq. & Related Petchem Svs. Proj. – $450
Q1
Q2
Q3
2015
Q4
Q1
Q2
Q3
2016
Q4
Q1
Q2
1)  Actual in-service date often dependent on customer readiness, regulatory approvals, and other factors outside our control. Estimated
project capital expenditures include amounts invested prior to 2015.
2)  Geismar expansion currently in ramp-up, expect full expansion production rate in June 2015
G - 14 Analyst Day 2015 | May 13, 2015
Q3
2017
© 2015 The Williams Companies, Inc. All rights reserved.
Q4
Financial Outlook – WMB
Strong Fundamentals and Competitive
Advantages Drive Robust, Visible Growth
Growth Investment Spending by Operating Area
2015–2017
2015–2020
~$10 BILLION
~$18 BILLION
!! 2015-17 in guidance1
!! In guidance
$30 BILLION+
!! In guidance1
1
!! Under negotiation
!! Potential
!! Under negotiation
Access Midstream
(WPZ)
West (WPZ)
Northeast
G&P (WPZ)
NGL &
Petchem
(WMB)
NGL &
Petchem
(WPZ)
1
Atlantic-Gulf
(WPZ)
Guidance presented here is at the midpoint of ranges.
G - 15 Analyst Day 2015 | May 13, 2015
© 2015 The Williams Companies, Inc. All rights reserved.
Transition to Demand-driven Growth
Demonstrated in Guidance and Beyond
WMB/WPZ Pursuing Over $30 Billion of Growth Projects
Supply Driven
2015
to
2017
>  Gulfstar One
>  Kodiak
>  Northeast
>  CNRL Offgas*
>  Gunflint
>  Access G&P
Supply & Demand Driven
>  Atlantic Sunrise
>  Constitution Pipeline
Completed
Projects
Future
Projects
G&P
2018+ >  Additional
2014
to
2015
!  = Completed
Demand Driven
>  Rockaway Lateral
>  Leidy SE
>  Virginia Southside
>  Rock Springs
>  Dalton Lateral
>  Hillabee (Phase 1)
>  Mobile Bay South III
>  CPV Woodbridge
>  Gulf Trace
>  Garden State
>  Jackrabbit Propylene
>  Promesa*
>  Sabal Trail
>  Texas-to-Mexico
>  Parachute Plant
>  Continue Expansion in Dry Gas
>  Numerous demand-
Gulfstars
>  Mexican
offshore
production
facilities
>  Syncrude
offgas
>  Access G&P
Expansion
>  Various offshore
tiebacks
>  Marcellus/
Utica supply to
Transco
Southeast
markets
NE PA to Meet Producers’ Growth
>  New Producers Opportunities for
southern Marcellus and Utica
>  LMM Cantaral and Shamrock
System Expansion
>  Additional Takeaway Projects
>  Gathering and Processing
Opportunities in NW PA & NE OH
driven Transco
projects
>  Gulf market area
expansions serving
LNG and industrial
customers
>  Pacific Connector
! Gulfstar One
! Keathley
Canyon
Connector
! NE: Frac II
! NE: Ethane
line and
de-ethanizer
! NE: Oak Grove
TXP I
! Bucking Horse
Plant
In Progress; Potential / under negotiation
G - 16 Analyst Day 2015 | May 13, 2015
(ownership option)
export pipeline
>  Geismar 2*
>  PDH 1 & 2*
>  Washington
Expansion
>  NGL & Petchem
services – other*
! Geismar Expansion** ! Texas Belle*
! Bayou Ethane*
* WMB projects expected to be dropped down to WPZ
** Currently in ramp-up
© 2015 The Williams Companies, Inc. All rights reserved.
Financial Outlook – WMB
WPZ’s Expected Growth Drives 31% Increase in
Cash Distributions to WMB
(Midpoint of guidance1, dollars in millions)
>  WPZ business expected to grow 34% (16% CAGR) – GP / IDRs expected to
grow 47% (21% CAGR)
WPZ ADJUSTED EBITDA2
WPZ DISTRIBUTIONS TO WILLIAMS3
(ACCRUED BASIS)
7,000
3,000
16%
CAGR
6,000
3
ncr
4% I
ease
14%
CAGR
5,965
31%
Incr
eas
e
2,805
2,455
5,315
GP/IDRs
21% CAGR
2,140
5,000
4,465
2,000
4,000
3,000
LP
9% CAGR
1,000
2,000
1,000
0
0
2015
2016
2015
2017
2016
2017
1 2015
Notes:
adjusted EBITDA and distributable cash flow expected to be near the low end of the guidance range. 2 A more detailed schedule
reconciling this non-GAAP measure is provided in this presentation. 3 Distributions reflect per-unit increases of 9% annually in 2016-2017 (midpoint of
guidance). Williams owns an approximate 58 percent limited partner interest, a 2 percent general partner interest and the incentive distribution rights
(IDRs).
G - 17 Analyst Day 2015 | May 13, 2015
© 2015 The Williams Companies, Inc. All rights reserved.
Financial Outlook – WMB
Planning Williams 2015 Dividend of $2.38 with Annual
Dividend Growth of Approximately 12.5% through 2017
CASH DIVIDENDS PER SHARE GROWTH
2010–2017 CAGR OF 30%
ILLUSTRATIVE EXCESS CASH FLOW
AVAILABLE & COVERAGE RATIO 1
(millions)
$3.50
$3,000
$3.01
$3.00
1.10x
$2.68
1.06x
$2.38
$2.50
1.05x
$2,000
$1.96
$2.00
1.20x
Expected
Dividends Paid
$1.44
$1.50
$1.20
$1.00
Expected Cash
Flow Available
After Dividends
$1,000
$0.78
$0.49
$0.50
$0.00
2010 2011 2012 2013 2014 2015 2016 2017
Actual
$0
2014
2015
2016
2017
Guidance
Note: 1 Detailed illustrative dividend and coverage calculations are included in the presentation.
G - 18 Analyst Day 2015 | May 13, 2015
© 2015 The Williams Companies, Inc. All rights reserved.
Financial Outlook – WMB
Expect 10 - 15% Annual Dividend Growth with
Expanding Coverage
DIVIDEND ILLUSTRATION AND COVERAGE CALCULATION
(Midpoint of guidance, dollars in millions except per share amounts)
2015
Distributions from Williams Partners
Williams NGL & Petchem Services Adjusted Cash Flow (see below)
Corporate Interest
$2,455
(260)
$2,805
25
(260)
1,880
-2.9%
2,195
0.0%
2,570
0.2%
55
(60)
(60)
(5)
(40)
$1,875
$2,135
$2,525
$2.50
$2.83
$3.32
(1,785)
1
WMB Cash Taxes (excludes cash taxes paid by MLP)
Corporate Capex and Other
WMB Cash Flow Available for Dividends
- per share
WMB Expected Dividends Paid
(2,020)
(2,290)
$90
$115
$235
1.05x
1.06x
1.10x
Excess Cash Flow Available After Dividends
Coverage Ratio
2017
$2,140
(5)
(255)
Subtotal
WMB Cash Tax Rate
2016
2
Dividend Per Share
$2.38
Annual Growth Rate
Williams'NGL'&'Petchem'Services'Adjusted'Cash'Flow:
Adjusted'EBITDA'(see'reconciliation'provided'in'this'presentation)
Maintenance'Capital
Adjusted'Cash'Flow
$2.68
$3.01
22%
12.5%
12.5%
(5)
(5)
5
(5)
-
30
(5)
25
Notes: 1 Near-term tax rates are lower than longer-term rates due to accelerated depreciation and deductions related to our
investment in ACMP. A 2014 tax Net Operating Loss, due to bonus depreciation, will yield a carryback refund from 2012 and a
carryforward reducing taxes through 2017. The average tax rate for 2018–2019 is expected to be approximately 4%, which
represents a blended rate on WPZ distributions, WMB NGL Petchem earnings, and corporate interest expense as well other tax
items impacting the WMB corporate entity. 2 WMB Cash Flow Available for Dividends / WMB Expected Dividends Paid.
G - 19 Analyst Day 2015 | May 13, 2015
© 2015 The Williams Companies, Inc. All rights reserved.
Financial Outlook – WMB
WMB Maintains Investment Grade Rating and Has
Significant Liquidity
>  ~$1.2 billion total available liquidity (as of 5/1/15)
>  $350 million of revolver borrowing (as of 5/1/15)
>  No significant WMB corporate debt maturities until after 2020
>  All debt is fixed rate
>  Investment grade credit metrics and rating
WMB CONSOLIDATED DEBT MATURITIES (DOLLARS IN MILLIONS)
$7,000
$6,000
$5,000
$4,000
$4,468
WPZ
$1,688
WMB
$3,000
$2,000
$2,000
$2,100
$1,250
$375
$785
$500
$32
$21
$371
2016
2017
2018
2019
2020
2021
$1,000
$0
2015 *
* $750 million of debt maturing in 1Q 2015 was previously refinanced.
G - 20 Analyst Day 2015 | May 13, 2015
$1,500
2022
$1,750
$850
$1,250
2023
2024
2025-2045
2025
© 2015 The Williams Companies, Inc. All rights reserved.
Financial Outlook – WMB
WMB and WPZ Are Premier
Energy-Infrastructure Investments
Our Long-Term Strategy
remains sound, backlog of
projects to serve the
demand side of growing
natural gas markets
continues to build
Large-Scale Positions
and Strong Competitive
Advantages
Deep, Diverse,
Long-Range Growth
Opportunities Provide
Visibility Through End
of Decade to Growing
Fee-Based Cash Flows
STRONG CASH DIVIDEND/DISTRIBUTION GROWTH GUIDANCE
>  WMB cash dividend – projected 12.5% annual growth in 2016 and 2017 with
growing coverage
>  WPZ per-unit cash distribution – expected $3.40 in 2015 with 9% annual growth
rate in 2016 and 2017 with growing coverage
>  $9.7 billion of total 2015-2017 in-guidance growth capex; 99% is focused on
fee-based projects
>  Large inventory of future growth projects with over $30 billion of committed and
potential growth capital through 2020
>  Strong financially – both WMB and WPZ have investment grade ratings
G - 21 Analyst Day 2015 | May 13, 2015
© 2015 The Williams Companies, Inc. All rights reserved.
Appendix
Recently Proposed IRS Regulations on MLP
Qualified Income
Update
>  On May 5, 2015, the Treasury Department issued
proposed regulations providing guidance on the
meaning of “qualified income” from activities related to
natural resources under Code section 7704(d)(1)(E)
>  The proposed regulations provide that activities related
to olefins derived from natural gas do not generate
qualified income
Williams view on proposed regulations …
>  Among other issues, the proposed regulations create a
distinction between petroleum and natural gas that
does not exist in the statute or legislative history
>  On July 2, 2012, Williams Partners received a Private
Letter Ruling (PLR) from the IRS that income from its
olefins assets is qualified
>  Williams believes its PLR is a correct interpretation of
the statute and legislative history
G - 23 Analyst Day 2015 | May 13, 2015
We are early in the process …
>  These proposed regulations are not final and are
subject to public comment
>  Williams is working with other industry participants to
develop comments for submission to IRS and Treasury
>  The process to finalize these regulations could take
anywhere from a matter of months to a matter of years
Potential implications for Williams and
Williams Partners …
>  The proposed regulations provide a 10 year transition
period, beginning when the regulations become final,
that would apply to current olefins operations
>  If, under final regulations, olefins income is no longer
considered qualified income, such income from current
operations would likely remain significantly less than
the 10% threshold due to growth in our qualified
income during the 10-year transition period. If nonqualified income was expected to approach or exceed
the 10% threshold, including new projects, we would
expect to use a “blocker” corporation and other tax
planning options to minimize the impact on its tax
obligations.
© 2015 The Williams Companies, Inc. All rights reserved.
Financial Outlook – WMB
Sensitivities to price changes
(millions)
WPZ
2015
Williams NGL &
Petchem Services 1
WMB
WPZ
2016
Williams NGL &
Petchem Services 1
WMB
NG
($5.9)
+ $.10/Mmbtu
+ $.01/gallon
+ $.01/pound
+ $.10/Mmbtu
+ $.01/gallon
+ $.01/pound
+ $.10/Mmbtu
+ $.01/gallon
+ $.01/pound
Ethane
Propane
C4+
($4.2)
$3.7
$2.9
Ethylene
Propylene 2
$14.4
$1.9
$0.0
$0.1
$14.4
$2.0
Ethylene
Propylene 2
$16.0
$2.0
$0.0
$0.8
$16.0
$2.8
($0.2)
$0.1
$0.1
$0.0
($6.1)
($4.1)
NG
($5.2)
+ $.10/Mmbtu
+ $.01/gallon
+ $.01/pound
+ $.10/Mmbtu
+ $.01/gallon
+ $.01/pound
+ $.10/Mmbtu
+ $.01/gallon
+ $.01/pound
$3.8
$2.9
Ethane
Propane
C4+
($5.0)
$3.5
$2.7
($1.4)
$0.7
$0.6
$0.1
($6.6)
($4.3)
$4.1
$2.8
Includes)equity)volumes)associated)with)Opal,)Echo,)Piceance,)Four)Corners,)Mobile)Bay,)Markham,)Discovery,)RGP)SpliDer,)Geismar,)Conway,)and)
Canada.))Fixed)margin)and)commodity)exposed)fee)contracts)are)also)taken)into)account.)
)
))
))
1))Includes)equity)volumes)associated)with)Canada)that)are)not)in)WPZ)
))
2))Excludes)volumes)associated)with)RGP)SpliDer)
))
))
G - 24 Analyst Day 2015 | May 13, 2015
))
))
© 2015 The Williams Companies, Inc. All rights reserved.
Financial Outlook – WMB
2015-2017 WMB and WPZ Guidance
2015
Low
Guidance Metric
Adjusted+EBITDA+(millions)+
))))Williams)Partners)
Expected
))))Williams)NGL)&)Petchem)Services)
Benefits
))))Other)
Total+Adjusted+EBITDA+(1)+
++
Capital+&+Investment+Expenditures+(millions)+
))))Williams)Partners)Growth)
))))Williams)Partners)Maintenance)
))))Williams)NGL)&)Petchem)Growth)
))))Williams)NGL)&)Petchem)Services)Maintenance)
))))Other))
Total+Capital+&+Investment+Expenditures+
))
Williams+
))))Cash)Available)for)Dividends)(1))
))))Cash)Dividends)
))))Dividends)per)Share)
))))Dividend)Coverage)Ra\o)(1))
))
Williams+Partners+
))))Distributable)Cash)Flow)(1))
))))Cash)Distribu\ons)
))))Cash)Distribu\ons)per)LP)Unit)
))))Cash)Distribu\on)Coverage)Ra\o)(1)))
))))Pro)Forma)Cash)Distribu\on)Coverage)Ra\o)(2))
Mid
))
$4,300))
(5))
50))
$4,345))
)
)
$3,250))
430))
220))
0))
60))
$3,960))
))
))
))
))
)
))
$2,845))
$3,010))
$3.40)
0.95x)
)
))
$4,465))
(5))
50))
$4,510))
$3,525))
430))
260))
0))
60))
$4,275))
1,875))
1,785))
$2.38)
1.05x)
))
$3,010))
$3,005))
$3.40)
1.00x)
1.05x)
2016
High
Low
$4,630))
(5))
50))
$4,675))
)
)
$3,800))
430))
300))
0))
60))
$4,590))
$5,120))
(5))
55))
$5,170))
))
$5,315))
5))
55))
$5,375))
$2,650))
430))
155))
5))
60))
$3,300))
$2,925))
430))
185))
5))
60))
$3,605))
)
)
)
)
)
$3,175))
$2,995))
$3.40)
1.06x)
)
Mid
))
2,135))))
2,020))))
$2.68) ))
1.06x)
))
$3,475))
$3,380))
$3.64)
1.03x)
$3,675))
$3,440))
$3.71)
1.07x)
NA)
2017
High
Low
$5,510))
15))
55))
$5,580))
)
)
$3,200))
430))
215))
5))
60))
$3,910))
$5,750))
20))
55))
$5,825))
))
$5,965))
30))
55))
$6,050))
$2,550))
430))
0))
5))
40))
$3,025))
$2,850))
430))
0))
5))
40))
$3,325))
High
$6,180))
40))
55))
$6,275))
)
)
$3,150))
430))
0))
5))
40))
$3,625))
))
2,525))))
2,290))))
$3.01) ))
1.10x)
))
)
$3,875))
$3,515))
$3.78)
1.10x)
)
Mid
$3,960))
$3,770))
$3.89)
1.05x)
$4,185))
$3,925))
$4.04)
1.07x)
NA)
)
$4,410))
$4,090))
$4.19)
1.08x)
)
(1)  Adjusted EBITDA, cash available for dividends, dividend coverage ratio, distributable cash flow and cash distribution coverage ratio are non-GAAP measures.
Reconciliations to the most relevant measures included in GAAP are provided in this presentation.
(2)  We estimate the 2015 cash distribution coverage ratio would have been approximately 1.05x, assuming Geismar, Keathley Canyon Connector and Gulfstar were in
service at expected capacity for full-year 2015.
G - 25 Analyst Day 2015 | May 13, 2015
© 2015 The Williams Companies, Inc. All rights reserved.
Financial Outlook – WMB
Guidance reflects sharply lower commodity price
assumptions
2015
2016
2017
Expected
Benefits
Commodity Price Assumptions
Low
Mid
High
Low
Mid
High
Low
Mid
High
$45.00
$55.00
$65.00
$53.75
$65.00
$76.25
$57.50
$70.00
$82.50
NG – Henry Hub $/MMBtu
$2.50
$3.00
$3.50
$2.75
$3.25
$3.75
$3.25
$3.75
$4.25
Composite NGL barrel
36.0
45.0
52.0
41.0
49.0
56.0
46.0
55.0
62.0
29.7
35.0
41.1
32.3
37.6
44.3
34.6
39.5
46.6
36.0
15.0
43.0
19.0
50.0
21.0
39.5
17.0
46.5
21.0
54.0
23.0
43.0
20.0
50.0
25.0
58.0
27.0
Propane - cents/gallon
50.0
60.0
70.0
55.0
65.0
75.0
60.0
70.0
80.0
Propylene spot - cents/pound
40.5
47.5
54.5
41.5
48.5
55.5
43.0
50.0
57.0
Crude – WTI $/barrel
for reference only(1)
Expected
Benefits
(2)
– cents/gallon
Crack Spread - cents/pound(3)
Ethylene spot - cents/pound
Ethane - cents/gallon
(1)  No crude oil sales, price provided for reference only
(2)  Component weighting of composite NGL barrel assuming ethane recovery (ethane 55%, propane 23%, iso-butane 7%, normal butane 5%, C5+ 10%)
(3)  Crack spread is based on delivered U.S. Gulf Coast ethylene and Mont Belvieu ethane.
G - 26 Analyst Day 2015 | May 13, 2015
© 2015 The Williams Companies, Inc. All rights reserved.
Financial Outlook – WMB
Tax Rates
2015 First Quarter
Year-to-Date
Dollars in millions
Provision (benefit) at statutory rate
$15
35%
-4
-9%
1
2%
14
33%
4
9%
$30
70%
Increases (decreases) in taxes resulting from:
Impact of nontaxable noncontrolling interests
State income taxes (net of federal benefit)
Tax related to prior year foreign taxable income adjustment
Other-net
Provision (benefit) for income taxes
Rates Below Are Based On Income From
Continuing Operations Before Income
Taxes
Full Year Effective Tax Rate Guidance
G - 27 Analyst Day 2015 | May 13, 2015
2015
2016
27–29%
27-29%
See Williams Dividend
Illustration and
Coverage Calculation
slide, for WMB effective
cash tax rates
© 2015 The Williams Companies, Inc. All rights reserved.
WMB Non-GAAP Reconciliations
WMB Non-GAAP Reconciliations
WMB Non-GAAP Disclaimer
>
This presentation includes certain financial measures – adjusted EBITDA, adjusted income from continuing operations (“earnings”),
adjusted earnings per share, cash available for dividends, dividend coverage ratio, distributable cash flow and cash distribution
coverage ratio – that are non-GAAP financial measures as defined under the rules of the Securities and Exchange Commission
>
Our segment performance measure, modified EBITDA is defined as net income (loss) before income tax expense, net interest expense,
equity earnings from equity-method investments, other net investing income, depreciation and amortization expense, and accretion
expense associated with asset retirement obligations for nonregulated operations. We also add our proportional ownership share (based
on ownership interest) of modified EBITDA of equity investments.
>
Adjusted EBITDA further excludes items of income or loss that we characterize as unrepresentative of our ongoing operations and may
include assumed business interruption insurance related to the Geismar plant. Management believes this measure provides investors
meaningful insight into results from ongoing operations
>
For Williams, cash available for dividends is defined as cash received from its ownership in MLPs, cash received (used) by its NGL &
Petchem Services segment (other than cash for capital expenditures) less interest, taxes and maintenance capital expenditures
associated with Williams and not the underlying MLPs. We also calculate the ratio of cash available for dividends to the total cash
dividends paid (dividend coverage ratio). This measure reflects Williams’ cash available for dividends relative to its actual cash dividends
paid.
>
For Williams Partners L.P., we define distributable cash flow as adjusted EBITDA less maintenance capital expenditures, cash portion of
interest expense, income attributable to noncontrolling interests and cash income taxes plus WPZ restricted stock unit non-cash
compensation and certain other adjustments that management believes affects the comparability of results. Adjustments for
maintenance capital expenditures and cash potion of interest expense include out proportionate share of these items of our equitymethod investments.
>
For Williams Partners L.P., we also calculate the ratio of distributable cash flow to the total cash distributed (cash distribution coverage
ratio). This measure reflects the amount of distributable cash flow relative to our cash distribution. We have also provided this ratio
calculated using the most directly comparable GAAP measure, net income.
>
This presentation is accompanied by a reconciliation of these non-GAAP financial measures to their nearest GAAP financial measures.
Management uses these financial measures because they are accepted financial indicators used by investors to compare company
performance. In addition, management believes that these measures provide investors an enhanced perspective of the operating
performance of the Company’s assets and the cash that the business is generating.
>
Neither adjusted EBITDA, adjusted income from continuing operations, cash available for dividends, nor distributable cash flow are
intended to represent cash flows for the period, nor are they presented as an alternative to net income or cash flow from operations.
They should not be considered in isolation or as substitutes for a measure of performance prepared in accordance with United States
generally accepted accounting principles.
H - 2 Analyst Day 2015 | May 13, 2015
© 2015 The Williams Companies, Inc. All rights reserved.
WMB Non-GAAP Reconciliations
WMB Non-GAAP reconciliation schedule
2014*
(Dollars in millions, except per-share amounts)
1st Qtr
2nd Qtr
2015
3rd Qtr
4th Qtr
Year
1st Qtr
Inc ome' (los s )' from' c ontinuing ' operations ' attributable' to' T he' W illiams ' C ompanies ,' Inc .'
available' to' c ommon' s toc kholders
$%%%%%%%%%140
$%%%%%%%%%%%%%99
$%%%%%%%1,678
$%%%%%%%%%%193
$%%%%%%2,110
$%%%%%%%%%%%%%%%70
Inc ome' (los s )' from' c ontinuing ' operations ' 4' diluted' earning s ' per' c ommon' s hare
$%%%%%%%%%%.20
$%%%%%%%%%%%%.14
$%%%%%%%%%2.22
$%%%%%%%%%%.26
$%%%%%%%2.91
$%%%%%%%%%%%%%%.09
$%%%%%%%%%%%%%11 $%%%%%%%%%%%30
Adjus tments :
W illiams 'P artners
Merger%and%transition%related%expenses
$%%%%%%%%%%%—
$%%%%%%%%%%%%%—
$%%%%%%%%%%41
$%%%%%%%%%%%%%%%32
AcquisitionFrelated%expenses
—
2
13
1
16
—
Impairment%of%certain%materials%and%equipment
—
17
—
35
52
3
S hare%of%impairment%at%equityFmethod%investment
—
—
—
—
—
8
C ontingency%loss%(gain),%%net%of%legal%costs
—
—
—
(143)
(143)
—
Net%gain%related%to%partial%acreage%dedication%release
—
—
(12)
—
(12)
—
6
—
—
—
6
—
G eismar%Incident%adjustment%for%insurance%and%timing
54
96
—
(71)
79
—
Loss%related%to%G eismar%Incident
—
—
5
5
10
1
Loss%related%to%Opal%incident
—
6
—
2
8
1
Loss%on%sale%of%equipment
—
—
—
7
—
Estimated%minimum%volume%commitments%[1]
—
—
47
(114)
(67)
55
Total'W illiams 'P artners 'adjus tments
60
121
64
(248)
(3)
100
25
—
70
—
95
—
Loss%related%to%compressor%station%fire
7
W illiams 'NG L'&'P etchem'S ervices
Bluegrass%Pipeline%project%development%costs
25
1
—
Bluegrass%Pipeline%and%Moss%Lake%writeFoff%of%previously%capitalized%project%development%costs
70
—
—
Total'W illiams 'NG L'&'P etchem'S ervices 'adjus tments
95
1
—
WMB%impact%of%AC MP%transactionFrelated%compensation%expenses
—
—
19
—
19
—
TransitionFrelated%costs
—
—
3
7
10
6
Total'O ther'adjus tments
—
—
22
7
29
6
155
122
86
121
106
(1)
—
(1)
O ther
Adjustments%included%in%Modified%EBITDA
(242)
*Recast)due)to)the)merger)between)Williams)Partners)L.P.)and)Access)Midstream)Partners,)L.P.)and)the)change)to)Modified)EBITDA)as)our)measure)of)segment)performance)in)first)quarter)2015.
H - 3 Analyst Day 2015 | May 13, 2015
© 2015 The Williams Companies, Inc. All rights reserved.
WMB Non-GAAP Reconciliations
WMB Non-GAAP reconciliation schedule cont’d
2014*
(Dollars in millions, except per-share amounts)
1st Qtr
2nd Qtr
2015
3rd Qtr
4th Qtr
Year
1st Qtr
Adjustments0below0Modified0EBITDA
Acquis ition*related0financing0expens es 0*0Williams 0P artners
—
9
G ain0on0remeas urement0of0equity*method0inves tment0in0AC MP 0*0O ther
—
—
—
(2,522)
—
(22)
9
2
(2,544)
—
G ain0as s ociated0with0AC MP 0equity0is s uance0*0O ther
—
(4)
4
—
—
Interes t0income0on0receivable0from0s ale0of0Venezuela0as s ets 0*0O ther
(13)
(14)
(14)
—
(41)
—
Allocation0of0adjus tments 0to0noncontrolling0interes ts
(25)
(36)
3
38
(20)
(33)
16
(2,596)
(31)
(38)
(45)
(2,529)
T otal, adjus tments
117
77
(2,443)
Less0tax0effect0for0above0items
(47)
(32)
Adjustments0for0taxSrelated0items0[2]
(20)
14
925
(3)
(226)
41
—
(2,475)
75
887
2
(28)
(7)
5
Adjus ted, inc ome, from, c ontinuing , operations , available, to, c ommon, s toc kholders , [1]
$000000000190
$00000000000158
$0000000000157
$00000000515
$0000000000000122
Adjus ted, diluted, earning s , per, c ommon, s hare, [1]
$0000000000.28
$000000000000.23
$00000000000.21 $00000000000.01 $000000000.71
$00000000000000.16
W eig hted(averag e, s hares , (, diluted, (thous ands )
688,904
700,696
752,064
$00000000000010
751,898
723,641
752,028
0(1) The0third0and0fourth0quarter0of020140have0been0recast0to0include0adjustments0to0normalize0the0quarterly0impact0of0approximately0$1670million0of0annual0minimum0volume0commitments0
related0to0ACMP0that0were0recorded0during0the0fourth0quarter.0The0recast0impacts0adjusted0diluted0earnings0per0common0share0by0an0increase0of0$.060in0the0third0quarter020140and0a0
decrease0of0$.150in0the0fourth0quarter02014,0for0a0total0year0decrease0of0$.09.0
0(2) The0first0quarter0of020140includes0an0unfavorable0adjustment0related0to0completing0the0dropdown0of0certain0Canadian0operations0to0Williams0Partners.0The0second0quarter0of020140
includes0a0favorable0adjustment0to0reflect0taxes0on0undistributed0earnings0of0certain0foreign0operations0that0are0no0longer0considered0permanently0reinvested.
Note: The0sum0of0earnings0per0share0for0the0quarters0may0not0equal0the0total0earnings0per0share0for0the0year0due0to0changes0in0the0weightedSaverage0number0of0common0
shares0outstanding.
*Recast(due(to(the(merger(between(Williams(Partners(L.P.(and(Access(Midstream(Partners,(L.P.(and(the(change(to(Modified(EBITDA(as(our(measure(of(segment(performance(in(first(
quarter(2015.
H - 4 Analyst Day 2015 | May 13, 2015
© 2015 The Williams Companies, Inc. All rights reserved.
WMB Non-GAAP Reconciliations
Reconciliation of Non-GAAP Modified EBITDA to
Non-GAAP Adjusted EBITDA
2014*
1st Qtr
(Dollars in millions)
Net income (loss)
$
2nd Qtr
196 $
2015
3rd Qtr
127 $
4th Qtr
1,708 $
Year
308 $
1st Qtr
2,339
$
13
(Income) loss from discontinued operations
—
(4)
—
—
(4)
—
Provision (benefit) for income taxes
51
84
998
116
1,249
30
140
163
210
234
747
251
Equity (earnings) losses
48
(37)
(66)
(89)
(144)
(51)
(Gain) on remeasurement of equity-method investments
—
—
(2,522)
(22)
(2,544)
Other investing (income) loss
(14)
(18)
(11)
—
(43)
—
28
113
132
165
438
136
214
214
369
379
1,176
427
3
666 $
6
648 $
4
5
822 $ 1,096 $
708 $
596 $
843 $
1,097 $
(8)
(4)
(3)
Interest expense
Proportional Modified EBITDA of equity-method investments
Depreciation and amortization expenses
Accretion for asset retirement obligations associated with nonregulated operations
Modified EBITDA
$
$
Williams Partners
Williams NGL & Petchem Services
(100)
Other
Total Modified EBITDA
$
58
666 $
60
648 $
$
60 $
121 $
—
18
3,232
$
6
812
3,244
$
817
103
3,232
$
—
812
(248) $
(3)
$
100
(1)
95
(115)
(17)
2
822 $ 1,096 $
(5)
Adjustments included in Modified EBITDA:
Williams Partners
95
Williams NGL & Petchem Services
Other
Total Adjustments included in Modified EBITDA
64 $
1
—
—
$
—
155
$
—
122 $
22
86 $
7
(242) $
29
121
$
6
106
$
768 $
717 $
907 $
849 $
3,241
$
917
(5)
(7)
(4)
(4)
$
58
821 $
60
770 $
5
908 $
9
854 $
$
6
918
Adjusted EBITDA:
Williams Partners
Williams NGL & Petchem Services
Other
Total Adjusted EBITDA
(20)
(5)
132
3,353
*Recast(due(to(the(merger(between(Williams(Partners(L.P.(and(Access(Midstream(Partners,(L.P.(and(the(change(to(Modified(EBITDA(as(our(measure(of(segment(performance(in(
first(quarter(2015.
H - 5 Analyst Day 2015 | May 13, 2015
© 2015 The Williams Companies, Inc. All rights reserved.
WMB Non-GAAP Reconciliations
Net Income to Adjusted EBITDA Reconciliation
2&&&0&&&1&&&5
Net income from continuing operations
Add: Net interest expense
Add: Provision for income taxes
Add: Depreciation & amortization (DD&A)
Less: Equity earnings from investments
Add: Proportionate share of EBITDA from investments
1
Adjustments
Adjusted EBITDA
Low
WPZ
Base
High
$1,555
855
15
1,705
(380)
$1,720
855
15
1,705
(385)
$1,885
855
15
1,705
(390)
665
670
(115)
$4,300
(115)
$4,465
Low
WPZ
Base
Net income from continuing operations
Add: Net interest expense
Add: Provision for income taxes
Add: Depreciation & amortization (DD&A)
Less: Equity earnings from investments
$2,025
965
25
1,800
(495)
Add: Proportionate share of EBITDA from investments
Adjustments
Adjusted EBITDA
675
(115)
$4,630
WMB&NGL&PETCHEM
Low
Base
High
$0
(15)
10
($5)
$0
(15)
10
-
$0
(15)
10
-
CORPORATE&/&OTHER
Low
Base
High
Low
($630)
255
365
35
-
$925
1,095
380
1,750
(380)
-
($5)
($5)
($670)
255
405
35
-
($710)
255
445
35
-
-
-
-
25
$50
25
$50
25
$50
665
(90)
$4,345
TOTAL&WMB
Base
$1,050
1,095
420
1,750
(385)
670
(90)
$4,510
High
$1,175
1,095
460
1,750
(390)
675
(90)
$4,675
2&&&0&&&1&&&6
High
WMB&NGL&PETCHEM
Low
Base
High
CORPORATE&/&OTHER
Low
Base
High
Low
$2,225
960
25
1,800
(505)
$2,425
955
25
1,800
(515)
($20)
(10)
25
-
($5)
(5)
25
-
($730)
260
480
45
-
($778)
260
528
45
-
($825)
260
575
45
-
$1,275
1,225
495
1,870
(495)
$1,435
1,220
545
1,870
(505)
$1,595
1,215
595
1,870
(515)
800
$5,120
810
$5,315
820
$5,510
($5)
$15
$55
$55
$55
800
$5,170
810
$5,375
820
$5,580
Low
WPZ
Base
High
CORPORATE&/&OTHER
Low
Base
High
Low
TOTAL&WMB
Base
Net income from continuing operations
Add: Net interest expense
Add: Provision for income taxes
Add: Depreciation & amortization (DD&A)
Less: Equity earnings from investments
$2,465
1,075
25
1,875
(645)
$2,690
1,065
25
1,875
(660)
$2,915
1,055
25
1,875
(675)
($5)
25
-
$5
25
-
$15
25
-
($810)
260
560
45
-
($870)
260
620
45
-
($930)
260
680
45
-
$1,650
1,335
585
1,945
(645)
$1,825
1,325
645
1,945
(660)
$2,000
1,315
705
1,945
(675)
Add: Proportionate share of EBITDA from investments
Adjustments
Adjusted EBITDA
955
$5,750
970
$5,965
985
$6,180
$20
$30
$40
$55
$55
$55
955
$5,825
970
$6,050
985
$6,275
($12.5)
(7.5)
25
$5
TOTAL&WMB
Base
High
2&&&0&&&1&&&7
WMB&NGL&PETCHEM
Low
Base
High
Notes: 1 A detailed schedule of 2015 adjustments is provided in this presentation.
H - 6 Analyst Day 2015 | May 13, 2015
© 2015 The Williams Companies, Inc. All rights reserved.
High
WMB Non-GAAP Reconciliations
WMB and WPZ 2015 Schedule of Expected EBITDA
Adjustments
(Dollars in millions)
Williams'Partners'(WPZ)
Geismar'incident'adjustment'for'insurance'and'timing
ACMP'retention'expenses
Total&Williams&Partners&adjustments
'
Williams'Corporate'/'Other'Adjustments:
ACMP'acquisition'related'expenses
'
!Total!WMB!Adjustments
H - 7 Analyst Day 2015 | May 13, 2015
'''''''(150)
'''''''''''35
'''''''(115)
'
'''''''''''25
'
!!!!!!!!!(90)
© 2015 The Williams Companies, Inc. All rights reserved.
WPZ Non-GAAP Reconciliations
WPZ Non-GAAP Reconciliations
WPZ Non-GAAP Disclaimer
>
This presentation includes certain financial measures – adjusted EBITDA, distributable cash flow, and cash distribution coverage ratio –
that are non-GAAP financial measures as defined under the rules of the Securities and Exchange Commission
>
Our segment performance measure, modified EBITDA, is defined as net income (loss) before income tax expense, net interest expense,
equity earnings from equity-method investments, other net investing income, depreciation and amortization expense, and accretion
expense associated with asset retirement obligations for nonregulated operations. We also add our proportional ownership share (based
on ownership interest) of modified EBITDA of equity investments.
>
Adjusted EBITDA further excludes items of income or loss that we characterize as unrepresentative of our ongoing operations and may
include assumed business interruption insurance related to the Geismar plant. Management believes this measure provides investors
meaningful insight into results from ongoing operations.
>
We define distributable cash flow as adjusted EBITDA less maintenance capital expenditures, cash portion of interest expense, income
attributable to noncontrolling interests and cash income taxes plus WPZ restricted stock unit non-cash compensation and certain other
adjustments that management believes affects the comparability of results. Adjustments for maintenance capital expenditures and cash
portion of interest expense include our proportionate share of these items of our equity-method investments.
>
We also calculate the ratio of distributable cash flow to the total cash distributed (cash distribution coverage ratio). This measure reflects
the amount of distributable cash flow relative to our cash distribution. We have also provided this ratio calculated using the most directly
comparable GAAP measure, net income.
>
This presentation is accompanied by a reconciliation of these non-GAAP financial measures to their nearest GAAP financial measures.
Management uses these financial measures because they are accepted financial indicators used by investors to compare company
performance. In addition, management believes that these measures provide investors an enhanced perspective of the operating
performance of the Partnership's assets and the cash that the business is generating.
>
Neither adjusted EBITDA, nor distributable cash flow are intended to represent cash flows for the period, nor are they presented as an
alternative to net income or cash flow from operations. They should not be considered in isolation or as substitutes for a measure of
performance prepared in accordance with United States generally accepted accounting principles
H - 9 Analyst Day 2015 | May 13, 2015
© 2015 The Williams Companies, Inc. All rights reserved.
WPZ Non-GAAP Reconciliations
Reconciliation of Non-GAAP distributable cash
flow to GAAP net income
2014*
(Dollars in millions, except coverage ratios)
2015
1st Qtr
2nd Qtr 3rd Qtr
4th Qtr
Year
1st Qtr
$%%%%%%352
%%%%%%%%%%%%8
$%%%%%%%223
%%%%%%%%%%%%%5
$%%%%%%247
%%%%%%%%%%10
$%%%%%%462
%%%%%%%%%%%%6
$%%%1,284
%%%%%%%%%%29
$%%%%%%%112
%%%%%%%%%%%%3
%%%%%%%%106
%%%%%%%%%126
%%%%%%%%154
%%%%%%%%176
%%%%%%%%562
%%%%%%%%192
W illiams ' P artners ' L .P .
Reconciliation*of*G AAP *"Net*Income"*to*Non3G AAP *"Modifed*EBITDA",*"Adjus ted*EBITDA",*and*"Dis tributable*cas h*flow”
Net%income
Provision%(benefit)%for%income%taxes
Interest%expense
Equity%(earnings)%losses
Other%investing%(income)%loss
%%%%%%%%(23) %%%%%%%%%(32) %%%%%%%%(85) %%%%%%%%(88) %%%%%%(228)
—
(1)
—
(1)
(2)
%%%%%%%%%(51)
(1)
Proportional%Modified%EBITDA%of%equityXmethod%investments
%%%%%%%%%%54
%%%%%%%%%%%62
%%%%%%%%150
%%%%%%%%165
%%%%%%%%431
%%%%%%%%136
Depreciation%and%amortization%expenses
%%%%%%%%208
%%%%%%%%%207
%%%%%%%%364
%%%%%%%%372
%%%%%%%1,151
%%%%%%%%419
Accretion%for%asset%retirement%obligations%associated%with%nonregulated%operations
%%%%%%%%%%%%3
%%%%%%%%%%%%%6
%%%%%%%%%%%%3
%%%%%%%%%%%%5
%%%%%%%%%%17
%%%%%%%%%%%%7
%%%%%%%%708
%%%%%%%%%596
%%%%%%%%843
%%%%%1,097
%%%%%3,244
%%%%%%%%817
Modified%EBITDA
Adjustments
Estimated%minimum%volume%commitments
—
—
47
(114)
AcquisitionXrelated%expenses
—
2
13
1
(67)
55
16
Merger%and%transition%related%expenses
—
—
11
S hare%of%impairment%at%equityXmethod%investment
—
—
—
—
30
41
32
—
—
G eismar%Incident%adjustment%for%insurance%and%timing
54
96
—
8
(71)
79
—
Loss%related%to%G eismar%Incident
—
—
5
Impairment%of%certain%materials%and%equipment
—
17
—
35
52
3
C ontingency%loss%(gain),%%net%of%legal%costs
—
—
—
(143)
(143)
—
Net%gain%related%to%partial%acreage%dedication%release
—
5
10
1
—
(12)
—
(12)
—
6
—
—
—
6
—
Loss%related%to%Opal%incident
—
6
—
2
8
Loss%on%sale%of%equipment
—
60
—
121
—
64
$%%%%%%768
$%%%%%%%717
$%%%%%%907
Loss%related%to%compressor%station%fire
Total%EBITDA%adjustments
Adjusted%EBITDA
7
(248)
$%%%%%%849
1
7
(3)
—
100
$%%%3,241
$%%%%%%917
*Re c a st%due %to%the %me rg e r%be twe e n%Willia ms%P a rtne rs%L.P .%a nd%Ac c e ss%Midstre a m%P a rtne rs,%L.P .%a nd%the %c ha ng e %to%Modifie d%EBITDA%a s%our%me a sure %of%se g me nt%pe rforma nc e %in%first%qua rte r%2015.
(1)
Note s:% %Inc lude s%proportiona te %sha re %of%ma inte na nc e %c a pita l%e xpe nditure s%of%e quity%inve stme nts.
(2)
% %Inc lude s%proportiona te %sha re %of%inte re st%e xpe nse %of%e quity%inve stme nts.
H - 10 Analyst Day 2015 | May 13, 2015
© 2015 The Williams Companies, Inc. All rights reserved.
WPZ Non-GAAP Reconciliations
Reconciliation of Non-GAAP distributable cash
flow to GAAP net income cont’d
2014*
1st Qtr
(Dollars in millions, except coverage ratios)
2015
2nd Qtr 3rd Qtr 4th Qtr
Year
Maintenance,capital,expenditures, (1)
Interest,expense,(cash,portion),(2)
Cash,taxes
Income,attributable,to,noncontrolling,interests
WPZ,restricted,stock,unit,nonYcash,compensation
Plymouth,incident,adjustment
1st Qtr
(54)
(204)
(1)
(23)
7
4
Distributable,cash,flow,attributable,to,Partnership,Operations
646
Total,cash,distributed
$,,,,,,725
C overag e( ratios :
Distributable,cash,flow,attributable,to,partnership,operations,divided,by,Total,cash,distributed
,,,,,,,0.89
Net,income,divided,by,Total,cash,distributed
,,,,,,,0.15
*Re c a st,due ,to,the ,me rg e r,be twe e n,Willia ms,P a rtne rs,L.P .,a nd,Ac c e ss,Midstre a m,P a rtne rs,,L.P .,a nd,the ,c ha ng e ,to,Modifie d,EBITDA,a s,our,me a sure ,of,se g me nt,pe rforma nc e ,in,first,qua rte r,2015.
(1)
Note s:, ,Inc lude s,proportiona te ,sha re ,of,ma inte na nc e ,c a pita l,e xpe nditure s,of,e quity,inve stme nts.
(2)
, ,Inc lude s,proportiona te ,sha re ,of,inte re st,e xpe nse ,of,e quity,inve stme nts.
H - 11 Analyst Day 2015 | May 13, 2015
© 2015 The Williams Companies, Inc. All rights reserved.
WPZ Non-GAAP Reconciliations
Reconciliation of Non-GAAP Modified EBITDA to
Non-GAAP Adjusted EBITDA
2014*
(Dollars in millions)
Modified&E BITDA:
Access1Midstream
Northeast1G&P
Atlantic(Gulf
West
NGL1&1Petchem1S ervices
Other
Total&Modified&E BITDA
1st Qtr
$
$
Adjustments:
Total&Access&Midstream&adjustments
Total&Northeast&G &P&adjustments
Total&Atlantic<G ulf&adjustments
Total&West&adjustments
Total&NG L&&&Petchem&S ervices&adjustments
Total&Other&adjustments
Total&Adjustments
Adjusted&E BITDA:
Access1Midstream
Northeast1G&P
Atlantic(Gulf
West
NGL1&1Petchem1S ervices
Other
Total&Adjusted&E BITDA
2nd Qtr
— $
48
266
212
182
—
708 $
—
6
—
—
54
—
$
$
$
60
3rd Qtr
(2) $
59
270
199
72
(2)
596 $
2
17
—
6
96
—
$
— $
54
266
212
236
—
768 $
121
2015
4th Qtr
254 $
80
271
224
17
(3)
843 $
68
(12)
—
—
5
3
$
— $
76
270
205
168
(2)
717 $
64
390 $
208
258
188
53
—
1,097 $
(65)
(130)
10
2
(66)
1
Year
1st Qtr
642
395
1,065
823
324
(5)
3,244
$
$
228
90
335
161
6
(3)
817
5
(119)
10
8
89
4
86
10
—
1
1
2
$
(248) $
(3)
$
100
322 $
68
271
224
22
—
907 $
325 $
78
268
190
(13)
1
849 $
647
276
1,075
831
413
(1)
3,241
$
314
100
335
162
7
(1)
917
$
*Recast(due(to(the(merger(between(Williams(Partners(L.P.(and(Access(Midstream(Partners,(L.P.(and(for(the(change(to(Modified(EBITDA(as(our(measure(of(segment(performance(in(
first(quarter(2015.
H - 12 Analyst Day 2015 | May 13, 2015
© 2015 The Williams Companies, Inc. All rights reserved.
WPZ Non-GAAP Reconciliations
Adjustments to Modified EBITDA by Segment
2014*
(Dollars in millions)
1st Qtr
Adjustments:
Access Midstream
Acquisition-related expenses
Merger and transition costs
Loss on sale of equipment
Impairment of certain materials and equipment
Estimated minimum volume commitments
Total Access Midstream adjustments
Northeast G&P
Share of impairment at equity-method investment
Contingency (gain) loss, net of legal costs
Loss related to compressor station fire
Net gain related to partial acreage dedication release
Impairment of certain materials and equipment
Total Northeast G&P adjustments
Atlantic-Gulf
Impairment of certain equipment
Total Atlantic-Gulf adjustments
West
Loss related to Opal incident
Total West adjustments
NGL & Petchem Services
Loss related to Geismar Incident
Geismar Incident adjustment for insurance and timing
Total NGL & Petchem Services adjustments
Other
WPZ conflicts committee costs associated with merger
Total Other adjustments
$
2nd Qtr
2015
3rd Qtr
4th Qtr
Year
1st Qtr
— $
—
—
—
—
—
2 $
—
—
—
—
2
13 $
8
—
—
47
68
1 $
29
7
12
(114)
(65)
16
37
7
12
(67)
5
$
—
30
—
1
55
86
—
—
6
—
—
6
—
—
—
—
17
17
—
—
—
(12)
—
(12)
—
(143)
—
—
13
(130)
—
(143)
6
(12)
30
(119)
8
—
—
—
2
10
—
—
—
—
—
—
10
10
10
10
—
—
—
—
6
6
—
—
2
2
8
8
1
1
—
54
54
—
96
96
5
—
5
5
(71)
(66)
10
79
89
1
—
1
—
—
—
—
3
3
1
1
4
4
2
2
Total Adjustments
$
60 $ 121 $
64 $ (248) $
(3) $ 100
*Recast(due(to(the(merger(between(Williams(Partners(L.P.(and(Access(Midstream(Partners,(L.P.(and(for(the(change(to(Modified(EBITDA(as(our(measure(of(segment(performance(in(
first(quarter(2015.
H- 13 Analyst Day 2015 | May 13, 2015
© 2015 The Williams Companies, Inc. All rights reserved.
WPZ Non-GAAP Reconciliations
Net Income to Adjusted EBITDA Reconciliation
('$$in$millions)
Net income from continuing operations
Add: Net interest expense
Add: Provision for income taxes
Add: Depreciation & amortization (DD&A)
Less: Equity earnings from investments
Add: Proportionate share of EBITDA from investments
Adjustments
1
2
Adjusted EBITDA
1)#Proportionate#Share#of#EBITDA#from#investments:
Net income from continuing operations
Add: Net interest expense
Add: Depreciation & amortization (DD&A)
Other
Adjusted EBITDA from Equity Investments
Low
2---0---1---5
Base
High
Low
2---0---1---6
Base
High
Low
2---0---1---7
Base
High
$1,555
$1,720
$1,885
$2,025
$2,225
$2,425
$2,465
$2,690
$2,915
855
855
855
965
960
955
1,075
1,065
1,055
15
15
15
25
25
25
25
25
25
1,705
1,705
1,705
1,800
1,800
1,800
1,875
1,875
1,875
(380)
(385)
(390)
(495)
(505)
(515)
(645)
(660)
(675)
665
670
675
800
810
820
955
970
985
(115)
(115)
(115)
-
-
-
-
-
-
$4,300
$4,465
$4,630
$5,120
$5,315
$5,510
$5,750
$5,965
$6,180
Low
2--0--1--5
Base
High
Low
2--0--1--6
Base
High
Low
2--0--1--7
Base
High
$380
$385
$390
$495
$505
$515
$645
$660
53
53
53
58
58
58
61
61
61
206
206
206
226
226
226
236
236
236
26
26
26
21
21
21
13
13
13
$665
$670
$675
$800
$810
$820
$955
$970
$985
2)#Adjustments:
Low
Geismar#incident#adjustment#for#insurance#and#timing
($150)
ACMP#acquisitionErelated#expenses
Total$Adjustments
H - 14 Analyst Day 2015 | May 13, 2015
$675
##########35
($115)
2--0--1--5
Base
High
Low
2--0--1--6
Base
High
Low
2--0--1--7
Base
High
($150)
#########35
($115)
($150)
#########35
($115)
############E
############E
############E
############E
############E
############E
############E
############E
############E
############E
############E
############E
############E
############E
############E
############E
############E
############E
© 2015 The Williams Companies, Inc. All rights reserved.
WPZ Non-GAAP Reconciliations
Distributable Cash Flow (DCF)
Dollars'in'millions,'except'per'L.P.'unit
1
Adjusted(EBITDA(
Less:(Maintenance(Capex(2
Low
2""""0""""1""""5
Base
High
Low
2""""0""""1""""6
Base
High
Low
2""""0""""1""""7
Base
High
$4,300
$4,465
$4,630
$5,120
$5,315
$5,510
$5,750
$5,965
$6,180
(430)
(430)
(430)
(440)
(440)
(440)
(440)
(440)
(440)
Less:(Interest(Expense((cash(portion)(
Less:(Cash(Taxes
Less:(Noncontrolling(Interests
Distributable(Cash(Flow(Attributable(to(Partnership(Operations
(885)
(5)
(135)
$2,845
(885)
(5)
(135)
$3,010
(885)
(5)
(135)
$3,175
(1,000)
(10)
(195)
$3,475
(995)
(10)
(195)
$3,675
(990)
(10)
(195)
$3,875
(1,110)
(10)
(230)
$3,960
(1,100)
(10)
(230)
$4,185
(1,090)
(10)
(230)
$4,410
Cash(Distributions((accrued)
((HHH((per(L.P.(Unit
$3,010
$3.40
$3,005
$3.40
$2,995
$3.40
$3,380
$3.64
7%
$3,440
$3.71
9%
$3,515
$3.78
11%
$3,770
$3.89
7%
$3,925
$4.04
9%
$4,090
$4.19
11%
1.03x
1.07x
1.10x
1.05x
1.07x
1.08x
3
!!"""!!Annual!growth!rate
Cash(Distribution(Coverage(Ratio
0.95x
1.00x
1.06x
Note: 1 A more detailed schedule reconciling this non-GAAP measure is provided in this presentation. 2 Includes proportionate share of
maintenance capex of equity investments 3 Includes proportionate share of interest expense of equity investments
H - 15 Analyst Day 2015 | May 13, 2015
© 2015 The Williams Companies, Inc. All rights reserved.


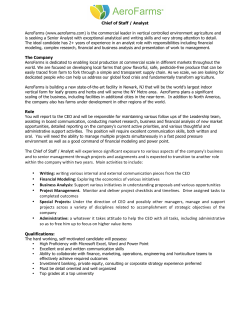


© Copyright 2026