
Rice water use and efficiency 2011â14
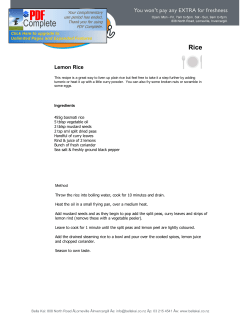
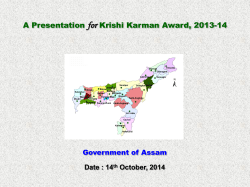
RICE WATER USE &
EFFICIENCY AT FINLEY
John Lacy
John Lacy Consulting, Finley
QUICK TAKE
›› Rice water use efficiency (WUE) increased from 0.7 t/ML
in 2011 and 2012, to 0.8 t/ML in 2013 and 2014.
›› Increasing yields, helped by good seasons in 2013–14,
higher adoption of Sherpa, drill sowing and stable water
use have led to an increase in rice WUE.
›› The top 10 yielding rice crops averaged 0.95 t/ML WUE
each year.
›› Irrigation water use increased in 2013 and 2014, to 13.5
and 12.7 ML/ha respectively, compared with 10.1 ML/
ha in 2011 and 11.4 ML/ha in 2012, as a result of lower
rainfall.
›› High summer rainfall after the drought led to high rainfall
water use of 4.3 ML/ha in 2011 and 2.4 ML/ha in 2012,
compared with the low rainfall water use in the drier
summers of 0.8 ML/ha in 2013 and 0.9 ML/ha in 2014.
Four years of farmer data, collected by the Ricecheck system,
shows that rice water use efficiency can be increased at the
planning stage of the rice crop with paddock and variety
selection, as well as by drill sowing the crop.
The Finley Discussion Groups use Ricecheck records to
benchmark and improve rice water use and water use efficiency.
Farmers can compare their rice crop water use with other rice
crops, to assist making decisions to choose paddocks, rotations,
varieties and sowing methods to lower water use. Lifting water
use efficiency keeps rice crop water use competitive with the
water use efficiency of other enterprises, such as winter crop and
lamb systems.
Rice yields, irrigation & total water use
Average rice yields (t/ha), irrigation water use (ML/ha) and total
water use (irrigation + rainfall) (ML/ha) for the four harvest years,
2011–14, are shown in Figure 1.
Most of the 116–119 crops in the Ricecheck system for the last
three years were the varieties Sherpa and Reiziq, and there were
14 Opus crops in 2014.
The data shows that yields improved each season.
Irrigation water use has risen in the last two years, 13.5 and
12.7 ML/ha respectively, compared with 10.1 ML/ha in 2011 and
11.4 ML/ha in 2012, as a result of lower rainfall.
The high summer rainfall after the drought, resulted in rainfall
water use of 4.3 ML/ha in 2011 and 2.4 ML/ha in 2012, compared
with rainfall water use in drier summers of 0.8 ML/ha in 2013 and
0.9 ML/ha in 2014.
The total water use was relatively similar over the four years, from
a minimum of 13.6 ML/ha in 2014 to a maximum of 14.4 ML/ha
in 2011.
The combination of increased yields helped by good seasons in
2013–14, higher adoption of the high-yielding variety Sherpa and
stable water use led to an increase in WUE from 0.7 t/ML in 2011
and 2012 to 0.8 t/ML in 2013 and 2014.
The top 10 yielding crops, which were mainly Sherpa from
2012 onward, had WUE of 0.9, 1.0, 0.9 and 1 t/ML in the years
2011through to14, respectively.
A factor helping irrigation water use in 2013 and 2014 was that
51% and 52% of the crops, respectively, were sown following a
previous rice crop, compared with 33% in 2012, which means
the surplus subsoil moisture after the first rice crop helped reduce
water use for the second crop.
Lowest & highest water use
Although farmers aim to have average or below-average water
use, the range in each year is surprisingly high, as Figure 2 shows.
The figure is based on the average of the five lowest and five
highest irrigation water use rice crops in each year.
In 2011, the lowest irrigation water use was only 7.7 ML/ha,
offset by rainfall water use of 4.6 ML/ha and total water use of
12.3 ML/ha. However, in the same season, the highest irrigation
34
IREC Farmers’ Newsletter – Large Area No. 191: Spring 2014
rice water use
water use was 12.9 ML/ha and rainfall of 3.6 ML/ha totalling water
use of 16.5 ML/ha.
In 2012, the lowest irrigation water use was 9.3 ML/ha with
3.1 ML/ha rainfall totalling water use of 12.4 ML/ha and in the
same season the highest irrigation water use was 14.5 ML/ha and
rainfall of 2.2 ML/ha and total water use of 16.7 ML/ha.
In the drier 2013 summer, the lowest irrigation water use was
10.5 ML/ha with only 0.8 ML/ha rainfall totalling 11.3 ML/ha. In
the same season, the highest irrigation water use was 16 ML/ha
and rainfall of 0.8 ML/ha, and total water use of 16.8 ML/ha.
Similarly in 2014, the lowest irrigation water use was 10.2 ML/ha
with only 0.9 ML/ha rainfall totalling 11.1 ML/ha. In the same
season the highest irrigation water use was 15.6 ML/ha with
rainfall of 1.0 ML/ha and total water use of 16.6 ML/ha.
Other factors
These results show that farmers can lower rice water use and
improve water use efficiency by choosing one, a combination or
all of the following options:
MM
lower water use paddocks
MM
management for higher yields
MM
selection of the variety Sherpa
MM
drill sowing
MM
sowing into rice stubble.
Lowering water use helps rice compete for water with winter
crops and lambs water use.
Acknowledgements
These results were derived from the Finley Discussion Group farmer
records, so thanks to all the discussion group farmers for participating in
the groups and completing the records, which most farmers find, is an
arduous task.
Further information
John Lacy
T: 0427311821
E: [email protected]
15
16
13
12
water use ML/ha
Yield t/ha or water use ML/ha
Variety had an influence on water use, with water use of Sherpa
0.5 ML/ha less than that of Reiziq in 2012 and 2013, and 0.2 ML/ha
less in 2014. Water use of 24 drill sown crops in 2013 and 2014
was, respectively, 1.9 and 1.0 ML/ha less than pre-germinated
aerial sown crops, which averaged 1.5 ML/ha over the two years.
Conclusion
11
9
7
2011
Yield
2012
Irrig water use
2013
2014
Water use
Figure 1. Average yield (t/ha), irrigation and total water use of rice crops
participating in Ricecheck in the Finley district
IREC Farmers’ Newsletter – Large Area No. 191: Spring 2014
8
4
0
2011
2012
2013
Lowest irrigation
Lowest rainfall
Highest irrigation
Highest rainfall
2014
Figure 2. Lowest and highest irrigation and rainfall water use
35


© Copyright 2026