
A plan for raising performance of irrigated grains 2007
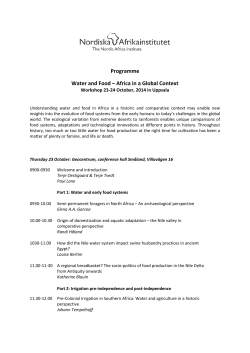
20 07
GRDC
F O R I R R I G AT I O N C R O P P E R S
A plan for raising performance
of irrigated grains
Paper prepared by
Dennis E Toohey
Dennis E Toohey and Associates
Albury, NSW
Ph: 02 6041 4955
E-mail: [email protected]
IREC
C/- CSIRO Land and Water, Griffith
Private mail bag 3 Griffith NSW 2680
Tel: 02 69601550 Fax: 02 69601562 Email: [email protected]
A plan for raising performance of irrigated grains
Dennis E Toohey
At a glance
A study of the potential for irrigated grains in the Southern Murray-Darling Basin (SMDB) found:
• Current water use efficiency of irrigated wheat is low. Present average wheat yields of 3 t/ha achieve an
Irrigation Water Use Efficiency (WUE) of 10 kg/mm/ha, i.e. yield (kg) divided by irrigation water (mm).
• Irrigated wheat has an impressive potential for improvement to 22 kg/mm/ha when yields are 10.4 t/ha
- a figure being achieved in variety trials and by some farmers.
• There is a sense of urgency to lift productivity and profitability of irrigated grains as a response to cut
backs in water entitlements and to achieve higher order efficiencies from the use of irrigation water.
• A quantum shift is required to achieve high returns at world’s best practice across all of the studied
grains. It can be achieved.
• Rationale for the 35 recommendations is of investment in research, extension and education being
critical to a closing of the gap between current and potential crop yields. Or expressed as:
• Profitable irrigation farming = Farmers as enthusiastic investors in best practice = A closing of the gap
between present and potential yields.
• The four goals of a major irrigated grains investment program for the SMDB are: plant breeding, grain
quality, industry relationships and resource sustainability.
Irrigated grain cropping in the Southern Murray-Darling Basin
The focus of the scoping study commissioned by the Irrigated Cropping Forum was to establish the potential
for irrigated grain production in the SMDB.
A full listing of crops appears in Table 4: Irrigation enterprises, SMDB. Two markets for grain of growing
importance, intensive livestock and biofuels were separately investigated and reported upon.
Assessing yield potential
The present yields of grains were those used by the NSW Department of Primary Industries in their Farm
Budget publications.
The potential for achieving higher yields was reviewed at up to four levels.
Yield level 1: Base. Median trial yields selected from trials conducted on ‘irrigated’ farms1.
Yield level 2: Measured potential. Six grains that had had their yields calculated under a non-stressed
and optimum growing environment.
Yield level 3: Achievable yield. A derived figure obtained by applying to the measured potential a 1%
simple interest rise per annum from year of its measurement, e.g. wheat 1993/1994 to 2006.
Yield level 4: Possible yield. Again a derived figure by applying a further 10 years of 1% per annum
growth onto achievable yield.
An illustration of the assessment methodology is presented in Figure 1: Milling Wheat, potential yields.
Winter cereals
Wheat is the largest crop both in terms of area and production with markets for milling, stock feeds and
potentially for ethanol production.
Throughout the 2000s irrigating winter cereals has been a more widespread practice with the emphasis
more upon ensuring a harvestable crop than for achieving maximum yield.
2007 GRAINS RESEARCH UPDATE for irrigation croppers
Page No 1
Dennis E Toohey
Tonnes/Hectare
A plan for raising performance of irrigated grains
Fig 1. Milling wheat, potential yields
Notes. Regional average is assumed yield across the SMDB. Trial average is the median
yield of 14 trials. Measured potential is Lamble and Hutchins assessment of the 1993/1994
Northern Region’s wheat crops.
The potential is substantial for an expansion of irrigation of winter cereals arising from markets for AH milling
wheat and durum; improvements in irrigation layouts and farmer skill and know-how.
Regional expression of potential
Farmer confidence is a way of expressing potential as measured via larger areas and tonnes of grain.
Present yields and areas, referred to a Base Model, and were established within each valley with an
example for wheat in Table1: Wheat, irrigated present production
Table 1: Wheat, irrigated present production
Note 1. Model allocation of Lachlan 50% allocation of maximum licensed; Murrumbidgee 80%; Murray
90% and Northern Victoria 75%. Note 2. 3.0 ML/ha of irrigation.
Three scenarios were established to represent what might occur when there were improvements in Water
Use Efficiency (WUE) and of yields. The three scenarios were: a modest improvement (10% WUE); possible
improvement (20% WUE); and real stretch (40% WUE).
At the modest improvement scenario summarised in Table 2: Wheat, irrigated potential scenarios these
are the leading regional impacts relative to Base model:
• Irrigation WUE improves by up to 1.61 kg/mm/ha (10%).
• Sown area expands by 42 216 ha. To gain an impression of this increase the present Murray Valley is
assessed as growing 58 153 ha a year.
• Milling Wheat’s share of the regional irrigation base resource of 4.910 GL rises by 4% to 23.6% (Base of
966 742 ML to 1 160 090 ML in scenario 1).
2007 GRAINS RESEARCH UPDATE for irrigation croppers
Page No 2
A plan for raising performance of irrigated grains
Dennis E Toohey
Table 2: Wheat, irrigated potential scenarios
Scenario
Area (ha)
Yield (t/ha)
Production (t)
WUE Irrigation
(kg/mm/ha)
10% WUE + 20% area
expansion
253 295
8.14
2 061 820
17.77
20% WUE + 40% area
expansion
295 511
8.88
2 624 134
19.39
40% WUE + 100% area
expansion
422 158
10.36
4 373 557
22.62
Base potential model of
SMDB
211 079
7.40 1
1 561 985
16.16
Note 1. Median trial yield of 14 trials conducted on irrigation farms in the Murrumbidgee Valley from 2002 to 2005.
Modelling was undertaken in Excel ® for 21 irrigated enterprises: 13 grains and 9 others (pastures, lucerne,
rice, cotton and horticulture).
An illustration of the modelling frame is in Figure 2: Layout of template for modelled grains. Grain yield
and irrigation water requirements are the major assumptions.
The Southern Murray-Darling Basin
The Southern Murray-Darling Basin includes the potential irrigated ‘grain growing’ areas of the Lachlan Valley
in central NSW the Murrumbidgee and NSW Murray Valleys. Victorian component of the SMDB includes
the Shepparton Irrigation Region (Shepparton, Central Goulburn and Rochester Irrigation Areas plus the
Murray Valley District [draws water direct from the River Murray]) and the Loddon Region (Torrumbarry and
Pyramid-Boort).
The water licences route was selected for establishing a base as to irrigation water in the SMDB.
A SMDB resource of 4.910 GL, referred to as ‘base’, as per Table 3: Irrigation water resources, SMDB.
Table 3: Irrigation water resources, SMDB
Water resources - surface and groundwater
Valley
Maximum allocation 1
(ML)
Long-term average 2
(ML)
Dry year 3 (ML)
Lachlan
554 503
277 252
55 450
Murrumbidgee
2 215 618
1 772 495
886 247
Murray (NSW)
1 524 408
1 371 967
457 322
Northern Victoria
2 305 920
1 488 314
977 240
Total 4
6 600 449
4 910 028
2 376 259
Note 1. Volume equating to a valley’s maximum allocation: 75% for Lachlan and 100% Murrumbidgee, Murray and
Northern Victoria, by the end of the season. Note 2. Volume available with announced allocation of Lachlan, 50%,
Murrumbidgee, 80% and Murray 90%. For Northern Victoria, Water Right plus 35% sales in Murray and zero sales
in the Goulburn Valley. Note 3. Volume arising from an announced allocation for the Lachlan of 10%, Murrumbidgee
40% and NSW Murray 30%. For Northern Victoria, 70% of Water Right, no Sales. Note 4. Groundwater volume
available for extraction mirrors that of the respective valley for long-term average and dry year.
2007 GRAINS RESEARCH UPDATE for irrigation croppers
Page No 3
Dennis E Toohey
A plan for raising performance of irrigated grains
The ‘dry’ year represents the 93 to 100 per cent probability, i.e. for the Lachlan River a 10% allocation can
be expected in 93 years out of 100; Murrumbidgee, a 100% probability of a 40% allocation; NSW Murray,
a 30% allocation can be expected in 97 years out of 100; and in Northern Victoria achieving a 70% Water
Right allocation in 99 years of 100.
Strategic goals
Four strategic goals are proposed for advancing irrigated grains in the SMDB.
1. Plant breeding. Increased productivity to achieve value along the various irrigated grain supply
chains.
2. Grain quality. Grain features that match the requirements of users.
3. Industry relationships. Collaboration to achieve partnerships and alliances.
4. Resource sustainability. Programs that achieve continuous improvement and innovation in water
efficiency and in maintaining productive soils suited for higher yielding crops.
The achievement of the goals for irrigated grains is seen through actions (Scoping Study recommendations)
within three interconnected objectives:
1. Customer value. The application/use of water to grains to achieve higher-end user demand/expectation/
value.
2. Biological potential. To put in place bridges whereby present production equals the best trial yields and
progressively, as superior genetic material becomes available, move to higher yields.
3. Water Resource Use. To use the water resources in a manner that recognises their scarcity and capacity
to generate regional economic value.
Further reading
The report ‘Irrigated Grain Crops – a scoping study of southern Murray-Darling Basin’ authored by Dennis
E Toohey and Stephen J Chaffey, Albury NSW, is available on the Internet at www.irec.org.au.
References
Lamble, C. and Hutchins, N. (1995). Best management practices and benchmarking study, Phase 1. Inland
Agricultural Pty Ltd, Nathalia and Hutchins Agronomic Services, Darlington Point. Murray-Darling Basin
Commission. Canberra.
Table 4: Irrigation enterprises, SMDB
Modelled grains
SMDB water budget: other ‘crop’ enterprises
Wheat - milling
Pastures - winter
Wheat - biscuit
Pastures - summer
Wheat - durum
Pastures - Victoria
Winter crops other - Barley and Triticale
Lucerne
Winter pulse - Faba beans and Chick peas
Horticulture
Winter oilseeds – Canola and Safflower
Rice
Summer oilseeds – Soybeans (culinary) and
Sunflower
Cotton
Summer pulse - Azuki beans and Mung beans
Vegetables
Summer cereals - Maize
2007 GRAINS RESEARCH UPDATE for irrigation croppers
Page No 4
Winter pulse - Faba beans and Chick peas
Winter oilseeds – Canola and Safflower
Summer oilseeds – Soybeans (culinary) and Sunflower
Summer pulse - Azuki beans and Mung beans
A plan for raising performance of irrigated grains
Summer cereals - Maize
Horticulture
Rice
Cotton
Vegetables
Note 1
1
Wheat - milling
Note 5
Note 6
Note 7
1
2
3
4
5
6
7
8
9
10
CWR Rainfall
CWR Irrigation
Total CWR
Crop WUE change scenarios
Yield
Total WUE
Irrigation WUE
Change in Production
Change in Area
Price
11 Achievable & Possible Yields (t/ha)
Note 3
Note 2
Future Potential
Unit
Note 4
Dennis E Toohey
ML/ha
ML/ha
ML/ha
%
t/ha
kg/mm/ha
kg/mm/ha
t/ha
%
$/tonne
Year
t/ha
Present
Base
3.90
3.90
3.00
4.58
6.90
8.48
0%
3.00
7.40
4.35
8.73
10.00
16.16
0.00
0%
$150.00
on farm
Regional
Average Trial Average
3.0
7.4
Scenario 1 Scenario 2
Scenario 3
3.90
3.90
3.90
4.58
4.58
4.58
8.48
8.48
8.48
10%
20%
40%
8.14
8.88
10.36
9.60
10.47
12.22
17.77
19.39
22.62
0.74
1.48
2.96
20%
40%
100%
Measured
Potential
9.4
Achievable
Yield Possible Yield
10.6
11.8
Note 1. Present situation as sourced
from
Department
of Primary
Industries,
informed opinion and
Figure
2: Layout
of template
for modelled
grains
consultant’s
knowledge
and
experiences.
Note 1. Present situation as sourced from Department of Primary Industries, informed opinion and
Note 2. Crop
yields from
highestand
yielding
variety trials and Crop Water Requirements based upon
consultant’s
knowledge
experiences.
Griffith NSW.
Note 2. Crop yields from highest yielding variety trials and Crop Water Requirements based upon
Note 3. Future potential based upon three scenarios.
Griffith NSW.
Note 4. Crop Water Use Efficiency is yield (kg) divided by total Crop Water Requirements (mm).
Note 3. Future potential based upon three scenarios.
Note 5. Irrigation Water Use Efficiency is yield (kg) divided by irrigation water (mm).
Note 4. Crop Water Use Efficiency is yield (kg) divided by total Crop Water Requirements (mm).
Note 6. Farm gate price for grain.
Note 5. Irrigation
Water Use
Efficiency
is yield
(kg) divided
irrigationMeasured
water (mm).
Note 7. Achievable
and possible
yields:
Regional
average,
Trial by
average,
potential,
FarmPossible
gate price
for grain.
AchievableNote
yield6.and
yield.
Note 7. Achievable and possible yields: Regional average, Trial average, Measured potential,
Achievable yield and Possible yield
Dennis Toohey
Ph: 02 6041 4955
E-mail: [email protected]
2007 GRAINS RESEARCH UPDATE for irrigation croppers
Page No 5


© Copyright 2026