
Prologis, Inc. Supplemental Report
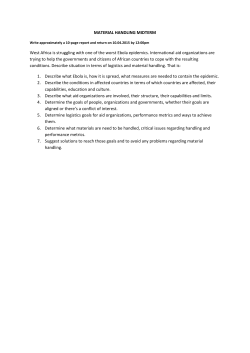
Strategic Capital
Summary and Financial Highlights
Supplemental 1Q 2015
Co-Investm ent Ventures (A)
Am ericas:
Prologis U.S. Logistics Venture
Prologis North American Industrial Fund
Prologis Targeted U.S. Logistics Fund
FIBRA Prologis
Brazil Fund and joint ventures (B)
Europe:
Prologis Targeted Europe Logistics Fund
Prologis European Properties Fund II
Europe Logistics Venture 1
Prologis European Logistics Partners
Asia:
Nippon Prologis REIT
Prologis China Logistics Venture
Type
Accounting
Established Method
Region
Ow nership
Structure
Next Prom ote
Opportunity
Core
Core
Core
Core
Development
2014
2006
2004
2014
2010
Consolidated
Consolidated
Unconsolidated
Unconsolidated
Unconsolidated
US
US
US
Mexico
Brazil
55.0%
66.1%
24.4%
45.9%
various
Open end
Open end
Open end
Public, Mexican Exchange
Closed end
Q4 2016 (C)
Q1 2018 (C)
Q2 2017 (C)
Q2 2015 (D)
Q4 2017 (E)
Core
Core
Core
Core
2007
2007
2011
2013
Unconsolidated
Unconsolidated
Unconsolidated
Unconsolidated
Europe
Europe
Europe
Europe
43.0%
31.2%
15.0%
50.0%
Open end
Open end
Open end
Open end
Q3 2016 (C)
Q3 2016 (C)
Q4 2015 (C)
Q4 2015 (C)
Core
2013
Core/Development 2011
Unconsolidated
Unconsolidated
Japan
China
15.1%
15.0%
Public, Tokyo Exchange
Closed end
n/a
Q1 2018
Unconsolidated Co-Investm ent Ventures (F):
(in tho usands)
Prologis Targeted U.S. Logistics Fund
FIBRA Prologis (G)
Brazil Fund and joint ventures
Am ericas
Prologis Targeted Europe Logistics Fund
Prologis European Properties Fund II
Europe Logistics Venture I
Prologis European Logistics Partners
Europe
Nippon Prologis REIT (G)
Prologis China Logistics Venture
Asia
Total
(A)
(B)
15
(C)
(D)
(E)
(F)
(G)
First Qtr
NOI
GBV of Operating
Bldgs
Debt
First Qtr
NOI
50,659
31,362
5,574
87,595
$ 62,464
36,135
10,850
109,449
$
4,627,800
1,762,956
362,364
6,753,120
$ 1,578,357
676,372
2,254,729
$ 15,216
16,575
1,520
33,311
16,281
70,746
5,257
57,959
150,243
24,156
82,754
7,122
66,264
180,296
1,674,273
5,072,015
359,589
3,696,326
10,802,203
420,258
1,852,143
99,204
2,371,605
20,913
5,482
26,395
50,394
5,820
56,214
3,381,148
315,952
3,697,100
264,233
$ 345,959
21,252,423
Sq Ft
$
Prologis Share
Annualized
Pro form a
Debt
$
Net
Tangible
Prologis
Investm ent
60,864
66,300
6,080
133,244
$ 384,818
310,252
695,070
$ 14,495
71,245
15,549
101,289
$
10,397
25,786
1,068
33,132
70,383
41,588
103,144
4,272
132,528
281,532
180,879
577,128
49,602
807,609
32,498
44,832
601
21,528
99,459
426,969
409,560
49,217
1,645,107
2,530,853
1,353,323
317,521
1,670,844
7,609
873
8,482
30,436
3,492
33,928
204,352
47,628
251,980
20,065
7,044
27,109
294,404
54,747
349,151
$ 6,297,178
$ 112,176
$ 448,704
$ 1,754,659
$ 227,857
$
704,844
592,306
204,496
1,501,646
4,381,650
The information presented excludes the co-investment venture Prologis DFS Fund I due to the investment size of the venture.
We have a 50% ownership interest in Prologis Brazil Logistics Partners Fund I (“Brazil Fund”), a consolidated co-investment venture. The Brazil Fund in turn has an ownership interest in various joint ventures that are accounted for on the
equity method. We also have other Brazil joint ventures that we account for using the equity method. Prologis’ share in these Brazil entities is reflected at our effective economic ownership.
Promote opportunity is every three years.
Promote opportunity is every year.
We have an opportunity to earn a promote, at the end of the term of the fund, based on the performance of the Brazil Fund only. We do not have a promote opportunity in any of the other Brazil joint ventures.
Values represent Prologis’ adjusted basis and may not be comparable to values reflected in the ventures’ stand alone financial statements calculated on a different basis.
Throughout this document, we use the most recent public information for these co-investment ventures.
Copyright © 2015 Prologis


© Copyright 2026