
PageRank for Product Image Search Yushi Jing Shumeet Baluja
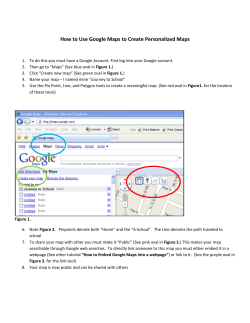
WWW 2008 / Refereed Track: Rich Media
April 21-25, 2008. Beijing, China
PageRank for Product Image Search
Shumeet Baluja2
[email protected]
Yushi Jing1,2
[email protected]
1
College Of Computing, Georgia Institute of Technology, Atlanta GA
2
Google, Inc. 1600 Amphitheater Parkway, Mountain View, CA
ABSTRACT
In this paper, we cast the image-ranking problem into the
task of identifying “authority” nodes on an inferred visual
similarity graph and propose an algorithm to analyze the
visual link structure that can be created among a group
of images. Through an iterative procedure based on the
PageRank computation, a numerical weight is assigned to
each image; this measures its relative importance to the
other images being considered. The incorporation of visual
signals in this process differs from the majority of largescale commercial-search engines in use today. Commercial
search-engines often solely rely on the text clues of the pages
in which images are embedded to rank images, and often entirely ignore the content of the images themselves as a ranking signal. To quantify the performance of our approach in
a real-world system, we conducted a series of experiments
based on the task of retrieving images for 2000 of the most
popular products queries. Our experimental results show
significant improvement, in terms of user satisfaction and
relevancy, in comparison to the most recent Google Image
Search results.
(a) Eiffel Tower
Categories and Subject Descriptors
H.3.3 [Information systems]: Information Search and Retrieval; I.4.9 [Computing Methodologies]: Image Processing and Computer Vision
General Terms
Algorithms
Keywords
PageRank, Graph Algorithms, Visual Similarity
1.
INTRODUCTION
Although image search has become a popular feature in
many search engines, including Yahoo, MSN, Google, etc.,
the majority of image searches use little, if any, image information to rank the images. Instead, commonly only the
text on the pages in which the image is embedded (text in
the body of the page, anchor-text, image name, etc) is used.
There are three reasons for this: first, text-based search of
web pages is a well studied problem that has achieved a
(b) McDonalds.ps
Figure 1: The query for “Eiffel Tower” returns good
results on Google. However, the query for “McDonalds” returns mixed results.
Copyright is held by the International World Wide Web Conference Committee (IW3C2). Distribution of these papers is limited to classroom use,
and personal use by others.
WWW 2008, April 21–25, 2008, Beijing, China.
ACM 978-1-60558-085-2/08/04.
307
WWW 2008 / Refereed Track: Rich Media
April 21-25, 2008. Beijing, China
great amount of real-world success. Second, a fundamental
task of image analysis is yet largely an unsolved problem:
human recognizable objects are usually not automatically
detectable in images. Although certain tasks, such as finding faces [17] [15] and highly textured objects like CD covers [12], have been successfully addressed, the problem of
general object detection and recognition remains open. Few
objects other than those mentioned above can be reliably detected in the majority of images. Third, even for the tasks
that are successfully addressed, the processing required can
be quite expensive in comparison to analyzing the text of a
web-page. Not only do the signal-processing algorithms add
an additional level of complexity, but the rapidly increasing
average size of images makes the simple task of transferring
and analyzing large volumes of data difficult and computationally expensive.
The problem of answering a query without image processing is that it can often yield results that are inconsistent
in terms of quality. For example, the query “Eiffel Tower”
submitted to image search on Google.com (with strict adult
content filtering turned on), returns good results as shown
in Figure 1(a). However, the query for “McDonalds” returns
mixed results as shown in Figure 1(b); the typical expected
yellow “M” logo is not seen as the main component of an
image until results 6 and 13.
The image in Figure 1(b) provides a compelling example
of where our approach will significantly improve the image
ranking. Our approach relies on analyzing the distribution
of visual similarities among the images. The premise is simple: an author of a web page is likely to select images that,
from his or her own perspective, are relevant to the topic.
Rather than assuming that every user who has a web-page
relevant to the query will link to an image that every other
user finds relevant, our approach relies on the combined preferences of many web content creators. For example, in Figure 1(b), many of the images contain the familiar “M”. In a
few of the images, the logo is the main focus of the image,
whereas in others it occupies only a small portion. Nonetheless, its repetition in a large fraction of the images is an
important signal that can be used to infer a common “visual theme” throughout the set. Finding the multiple visual
themes and their relative strengths in a large set of images
is the basis of the image ranking system proposed in this
study.
There are two main challenges in taking the concept of
inferring common visual themes to creating a scalable and
effective algorithm. The first challenge is the image processing required. Note that every query may have an entirely
separate set of visual features that are common among the
returned set. The goal is to find what is common among the
images, even though what is common is not a priori known,
and the common features may occur anywhere in the image
and in any orientation. For example, they may be crooked
(Figure 1(b), image 5), rotated out of plane (Figure 1(b), images 4,9, 16), not be a main component of the image (Figure
1(b), images 1, 8, 20), and even be a non-standard color (Figure 1(b), images 7 and 10). What will make this tractable is
that unlike approaches that require analyzing the similarity
of images by first recognizing human recognizable objects in
the images (i.e. “both these images contain trees and cars”),
we do not rely on first detecting objects. Instead, we look
for low level features of the images that are invariant to the
types of degradations (scale, orientation, etc) that we ex-
Figure 2: Many queries like “nemo” contain multiple
visual themes.
pect to encounter. To address this task, we turn to the use
of local features [10] [2]. Mikolajczyk et al. [11] presented
a comparative study of various descriptors. Although a full
description of local features is beyond the scope of this paper, we provide a brief review in the next section.
The second challenge is that even after we find the common features in the images, we need a mechanism to utilize
this information for the purposes of ranking. As will be
shown, simply counting the number of common visual features will yield poor results. To address this task, we infer a
graph between the images, where images are linked to each
other based on their similarity. Once a graph is created, we
demonstrate how iterative procedures similar to those used
in PageRank can be employed to effectively create a ranking
of images. This will be described in Section 2.
1.1 Background and Related Work
There are many methods of incorporating visual signals
into search engine rankings. One popular method is to construct an object category model trained from the the top
search results, and re-rank images based on their fit to the
model [13] [5]. These method obtained promising results,
but the assumption of homogeneous object category and
limited scale of experiment fall short of offering a conclusive answer on the practicality and performance of such system in commercial search engines. For example, there are
significant number of web queries with multiple visual concepts, for example “nemo” (shown in Figure 2). This makes
it more difficult to learn a robust model given limited and
potentially very diverse set of search results. Further, there
is a fundamental mismatch between the goal of object category learning and image ranking. Object category learners are designed to model the relationship between features
and images, whereas images search engines are designed to
model the relationships (order) among images. Although a
well trained object category filter can be used improve the
relevancy of image search results, it offers limited capability
to directly control how and why one visual theme, or image,
is ranked higher than others.
In this work, we propose an intuitive graph-model based
method for content-based image ranking. Instead of modelling the relationship between objects and image features,
we model the expected user behavior given the visual similarities of the images to be ranked. By treating images as
web documents and their similarities as probabilistic visual
hyperlinks, we estimate the likelihood of images visited by a
user traversing through these visual-hyperlinks. Those with
more estimated “visits” will be ranked higher than others.
This framework allows us to leverage the well understood
PageRank [3] and Centrality Analysis [4] approach for Webpage ranking.
Unlike the web, where related documented are connected
by manually defined hyperlinks, we compute visual-hyperlinks
explicitly as a function of the visual similarities among images. Since the graph structure will uniquely determine the
ranking of the images, our approach offers a layer of abstrac-
308
WWW 2008 / Refereed Track: Rich Media
April 21-25, 2008. Beijing, China
tion from the set of features used to compute the similarity
of the image. Similarity can be customized for the types
and distributions of images expected; for example, for people queries, facial similarity can be used, color features for
landscapes, or local features for architecture, product images, etc.
Several other studies have explored the use of a similarity based graph [8] [19] for semi-supervised learning. Given
an adjacency matrix and a few labelled vertices, unlabeled
nodes can be described as a function of the labelled nodes
based on the graph manifolds. In this work, our goal is not
classification; instead, we model the centrality of the graph
as a tool for ranking images. This is an extension of [7], in
which image similarities are used to find a single most representative, or “canonical” image from image search results.
Here, we use well understood methods for graph analysis
based on PageRank, and provide a large-scale study of both
the performance and computational costs of such system.
the likelihood of arriving in each of the vertices by traversing
through the graph (with a random starting point), where the
decision to take a particular path is defined by the weighted
edges.
The premise of using these visual-hyperlinks for the basis
of random walks is that if a user is viewing an image, other
related (similar) images may also be of interest. In particular, if image u has a visual-hyperlink to image v, then there
is some probability that the user will jump from u to v. Intuitively, images related to the query will have many other
images pointing to them, and will therefore be visited often
(as long as they are not an isolated and in a small clique).
The images which are visited often are deemed important.
Further, if we find that an image, v, is important and it links
to an image w, it is casting its vote for w’s importance and
because v is itself important, the vote should count more
than a “non-important” vote.
Like page rank, the image rank (IR) is iteratively defined
as the following:
1.2 Contribution of this work
This paper makes three contributions:
IR = S ∗ × IR
1. We introduce a novel, simple, algorithm to rank images
based on their visual similarities.
S is the column normalized, symmetrical adjacency matrix S where Su,v measures the visual similarity between
image u and v. Since we assume similarities are commutative, the similarity matrix S is undirected. Repeatedly
multiplying IR by S ∗ yields the dominant eigenvector of the
matrix S ∗ . Although IR has a fixed point solution, in practice it can be estimated more efficiently through iterative
approaches.
The image rank converges only when matrix S ∗ is aperiodic and irreducible. The former is generally true for the
web, and the later usually requires a strongly connected
graph, a property guaranteed in practice by introducing a
damping factor d into Equation 1. Given n images, IR is
defined as:
2. We introduce a system to re-rank current Google image
search results. In particular, we demonstrate that for
a large collection of queries, reliable similarity scores
among images can be derived from a comparison of
their local descriptors.
3. The scale of our experiment is the largest among the
published works for content-based-image ranking of
which we are aware. Basing our evaluation on the
most commonly searched for object categories, we significantly improve image search results for queries that
are of the most interest to a large set of people.
The remainder of the paper is organized as follows. Section 2 introduces the algorithm and describes the construction of the image-feature based visual similarity graph. Section 3 studies the performance on queries with homogeneous
and heterogeneous visual categories. Section 4 presents the
experiments conducted and an analysis of the findings. Section 5 concludes the paper.
2.
(1)
∗
1
where p = [ ]n×1 . (2)
n
This is analogous to adding a complete set of weighted
outgoing edges for all the vertices. Intuitively, this creates
a small probability for a random walk to go to some other
images in the graph, although it may not have been initially
linked to the current image. d > 0.8 is often chosen for
practice; empirically, we have found the setting of d to have
relatively minor impact on the global ordering of the images.
IR = dS ∗ × IR + (1 − d)p,
APPROACH & ALGORITHM
Given a graph with vertices and a set of weighted edges, we
would like to measure the importance of each of the vertices.
The cardinality of the vertices, or the sum of geodesic distance to the surrounding nodes are all variations of centrality
measurement. Eigenvector Centrality provides a principled
method to combine the “importance” of a vertex with those
of its neighbors in ranking. For example, other factors being
equal, a vertex closer to an “important” vertex should rank
higher than others. As an example of a successful application of Eigenvector Centrality, PageRank [3] pre-computes
a rank vector to estimate the importance for all of the webpages on the Web by analyzing the hyperlinks connecting
web documents.
Eigenvector Centrality is defined as the principle Eigenvector of a square stochastic adjacency matrix, constructed
from the weights of the edges in the graph. It has an intuitive
Random Walk explanation: the ranking scores correspond to
2.1 Features generation and representation
A reliable measure of image similarity is crucial to good
performance since this determines the underlying graph structure. Global features like color histograms and shape analysis, when used alone, are often too restrictive for the breadth
of image types that need to be handled. For example, as
shown in Figure 3, the search results for “Prius” often contains images taken from different perspectives, with different
cameras, focal lengths, compositions and etc.
Compared with global features, local descriptors contain
a richer set of image information and are relatively stable
under different transformations and, to some degree, lighting variations. Examples of local features include Harris
corners [6], Scale Invariant Feature Transform (SIFT) [10],
Shape Context [2] and Spin Images [9] to name a few. Mikolajczyk et al. [11] presented a comparative study of various
309
WWW 2008 / Refereed Track: Rich Media
April 21-25, 2008. Beijing, China
Figure 3: Similarity measurement must handle potential rotation, scale and perspective transformations.
(a) A v.s. B
(b) A v.s. C
(c) A v.s. D
(d) B v.s. C
(e) B v.s. D
(f) C v.s. D
Figure 4: Since all the variations (B, C, D) are
based on the original painting (A), A contains more
matched local features than others.
descriptors, [18] [1] presented work on improving the their
performance and computational efficiency. In this work, we
use the SIFT features, with a Difference of Gaussian (DoG)
interest point detector and orientation histogram feature
representation as image features. Nonetheless, any of the
local features could have been substituted.
We used a standard implementation of SIFT; for completeness, we give the specifics here. A DoG interest point
detector builds a pyramid of scaled images by iteratively applying Gaussian filters to the original image. Adjacent Gaussian images are subtracted to create Difference of Gaussian
images, from which the characteristic scale associated with
each of the interest points can be estimated by finding the
local extrema over the scale space. Given the DoG image
pyramid, interest points located at the local extrema of 2D
image space and scale space are selected. A gradient map is
computed for the region around the interest point and then
divided into a collection of subregions, in which an orientation histogram can be computed. The final descriptor is
a 128 dimensional vector by concatenating 4x4 orientation
histogram with 8 bins.
Given two images u and v, and their corresponding den
2
1
scriptor vector, Du = (d1u , d2u , ...dm
u ) and Dv = (dv , dv , ...dv ),
we define the similarity between two images simply as the
number interest points shared between two images divided
by their average number of interest points.
the experiment section, we follow this procedure on 2000 of
the most popular queries for Google Product Search.
3. A FULL RETRIEVAL SYSTEM
The goal of image-search engines is to retrieve image results that are relevant to the query and diverse enough to
cover variations of visual or semantic concepts. Traditional
search engines find relevant images largely by matching the
text query with image metadata (i.e. anchor text, surrounding text). Since text information is often limited and can be
inaccurate, many top ranked images may be irrelevant to the
query. Further, without analyzing the content of the images,
there is no reliable way to actively promote the diversity of
the results. In this section, we will explain how the proposed
approach can improve the relevancy and diversity of image
search results.
3.1 Queries with homogeneous visual concepts
For queries that have homogeneous visual concepts (all
images look somewhat alike) the proposed approach improves the relevance of the search results. This is achieved
by identifying the vertices that are located at the “center” of
weighted similarity graph. “Mona-lisa” is a good example of
search query with a single homogeneous visual concept. Although there are many comical variations (i.e. “Bikini-lisa”,
“Monica-Lisa”), they are all based on the original painting.
As shown in Figure 4, the original painting contains more
matched local features than others, thus has the highest likelihood of visit by an user following these probabilistic visualhyperlinks. Figure 5 is generated from the top 1000 search
results of “Mona-Lisa.” The graph is very densely connected,
but not surprisingly, the center of the images all correspond
to the original version of the painting.
2.2 Query Dependent Ranking
It is computationally infeasible to generate the similarity
graph S for the billions of images that are indexed by commercial search engines. One method to reduce the computational cost is to precluster web images based using metadata
such as text, anchor text, similarity or connectivity of the
web pages on which they were found, etc. For example,
images associated with “Paris”, “Eiffel Tower”, “Arc de Triomphe” are more likely to share similar visual features than
random images. To make the similarity computations more
tractable, a different rank can be computed for each group
of such images.
A practical method to obtain the initial set of candidates
mentioned in the previous paragraph is to rely on the existing commercial search engine for the initial grouping of
semantically similar images. For example, similar to [5],
given the query “Eiffel Tower” we can extract the top-N results returned, create the graph of visual similarity on the
N images, and compute the image rank only on this subset.
In this instantiation, the approach is query dependent. In
3.2 Queries with heterogeneous visual concepts
In the previous section we showed an example of improved
performance with homogeneous visual concepts. In this section, we demonstrate it with queries that contain multiple visual concepts. Examples of such queries that are often given
in information retrieval literature include “Jaguar” (car and
animal) and “Apple” (computer and fruit). However, when
considering images, many more queries also have multiple
canonical answers; for example, the query “Nemo”, shown
earlier, has multiple good answers. In practice, we found
that the approach is able to identify a relevant and diverse
310
WWW 2008 / Refereed Track: Rich Media
April 21-25, 2008. Beijing, China
Figure 5: Similarity graph generated from the top 1000 search results of “Mona-Lisa.” The largest two images
contain the highest rank.
Figure 6: Top ten images selected from the 1000 search results of “Monet Paintings.” By analyzing the link
structure in the graph, note that highly relevant yet diverse set of images are found. Images include those
by Monet and of Monet (by Renoir)
311
WWW 2008 / Refereed Track: Rich Media
April 21-25, 2008. Beijing, China
Figure 7: Alternative method of selecting images with the most “neighbors” tend to generate relevant but
homogeneous set of images.
set of images as top ranking results; there is no apriori bias
towards a fixed number of concepts or clusters.
A question that arises is whether simple heuristics could
have been employed for analyzing the graph, rather than
using a the Eigenvector approach used here. For example,
a simple alternative is to select the high degree nodes in
the graph, as this implicitly captures the notion of wellconnected images. However, this fails to identify the different distinctive visual concepts as shown in Figure 7. Since
there are more close matches of “Monet Painting in His Garden at Argenteuil” by Renoir, they reinforce each other to
form a strongly connected clique, and these are the only
images returned.
4.
suggested. In these cases, we assumed that the graph was
too sparse to contain enough information. After this pruning, we concentrated on the approximately 1000 remaining
queries.
It is challenging to quantify the quality of (or difference
of performance) of sets of image search results for several
reasons. First, and foremost, user preference to an image
is heavily influenced by a user’s personal tastes and biases.
Second, asking the user to compare the quality of a set of
images is a difficult, and often a time consuming task. For
example, an evaluator may have trouble choosing between
group A, containing five relevant but mediocre images, and
group B, that is mixed with both great and bad results. Finally, assessing the differences in ranking (when many of the
images between two rankings being compared are the same)
is error-prone and imprecise, at best. Perhaps the most principled way to approach this task is to build a global ranking
based on pairwise comparisons. However, this process requires significant amount of user input, and is not feasible
for large numbers of queries.
To accurately study the performance, subject to practical
constraints, we devised two evaluation strategies. Together,
they offer a comprehensive comparison of two ranking algorithms, especially with respect to how the rankings will be
used in practice.
EXPERIMENTAL RESULTS
To ensure that our algorithm works in practice, we conducted experiments with images collected directly from the
web. In order to ensure that the results would make a significant impact in practice, we concentrated on the 2000
most popular product queries 1 on Google (product search).
These queries are popular in actual usage, and users have
a strong expectations of the type of results each should return. Typical queries included “ipod”, “xbox”, “Picasso”,
“Fabreze”, etc.
For each query, we extracted the top 1000 search results
from Google Image Search on July 23rd, 2007, with the strict
safe search filter. The similarity matrix is constructed by
counting the number of matched local features for each pair
of images after geometric validation normalized by the number of descriptors generated from each pairs of images.
We expect that Google’s results will already be quite good,
especially since the queries chosen are the most popular
product queries for which many relevant web pages and images exist. Therefore, we would suggest a refinement to the
ranking of the results when we are confident there is enough
information to work correctly. A simple threshold was employed: if, in the set of 1000 images returned, fewer than 5%
of the images had at least 1 connection, no modification was
4.1 Minimizing Irrelevant Images
This study is designed to study a conservative version of
“relevancy” of our ranking results. For this experiment, we
mixed the top 10 selected images using our approach with
the top 10 image from Google, removed the duplicates, and
presented them to the user. We asked the user: “Which
of the image(s) are the least relevant to the query?” For
this experiment, more than 150 volunteer participants were
chosen, and were asked this question on a set of randomly
chosen 50 queries selected from the top-query set. There was
no requirement on the number of images that they marked.
There are several interesting points to note about this
study. First, it does not ask the user to simply mark relevant images; the reason for this is that we wanted to avoid
a heavy bias to a user’s own personal expectation (i.e. when
1
The most often queried keywords during a one month period.
312
WWW 2008 / Refereed Track: Rich Media
April 21-25, 2008. Beijing, China
Table 1: “Irrelevant” images per product query
Image Rank Google
Among top 10 results
0.47
2.82
Among top 5 results
0.30
1.31
Among top 3 results
0.20
0.81
querying “Apple” did they want the fruit or the computer?).
Second, we did not ask the users to compare two sets; since,
as mentioned earlier, this is an arduous task. Instead, the
user was asked to examine each image individually. Third,
the user was given no indication of ranking; thereby alleviating the burden of analyzing image ordering.
It is also worth noting that minimizing the number of irrelevant images is important in real-world usage scenarios
beyond “traditional” image search. In many uses, we need
to select a very small set (1-3) of images to show from potentially millions of images. Unlike ranking, the goal is not to
reorder the full set of images, but to select only the “best”
ones to show. Two concrete usage cases for this are: 1.
Google product search: only a single image is shown for each
product returned in response to a product query; shown in
Figure 8(a). 2. Mixed-Result-Type Search: to indicate that
image results are available when a user performs a web (webpage) query, a small set of representative images may also
be shown to entice the user to try the image search as shown
in Figure 8(b). In both of these examples, it is paramount
that the user is not shown irrelevant, off-topic, images. Both
of these scenarios benefit from procedures that perform well
on this experimental setup.
We measured the results at three settings: the number
of irrelevant images in the top-10, top-5, and top-3 images
returned by each of the algorithms. Table 1 contains the
comparison results. Among the top 10 images, we produced
an average of 0.47 irrelevant results, this is compared with
2.82 by Google; this represents an 83% drop in irrelevant
images. When looking at the top-3 images, the number of
irrelevant images dropped to 0.2, while Google dropped to
0.81.
In terms of overall performance on queries, the proposed
approach contains less irrelevant images than Google for 762
queries. In only 70 queries did Google’s standard image
search produce better results. In the remaining 202 queries,
both approaches tied (in the majority of these, there were no
irrelevant images). Figure 9 shows examples of top ranking
results for a collection of queries. Aside from the generally
intuitive results shown in Figure 9, an interesting result is
shown for the query “Picasso Paintings”; not only are all the
images by Picasso, one of his most famous, “Guernica”, was
selected first.
To present a complete analysis, we describe two cases that
did not perform as expected. Our approach sometimes fails
to retrieve relevant images as shown in Figure 10. The first
three images are the logos of the company which manufactured the product being searched for. Although the logo is
somewhat related to the query, the evaluators did not regard
them as relevant to the specific product for which they were
searching. The inflated logo score occurs for two reasons.
First, many product images contains the company logos; either within the product itself or in addition to the product.
In fact, extra care is often given to make sure that the logos
are clearly visible, prominent, and uniform in appearance.
(a) Google product search
(b) Mixed-Result-Type Search
Figure 8: In many uses, we need to select a very
small set (1-3) of images to show from potentially
millions of images. Unlike ranking, the goal is not
to reorder the full set of images, but to select only
the “best” ones to show.
313
WWW 2008 / Refereed Track: Rich Media
April 21-25, 2008. Beijing, China
Second, logos often contain distinctive patterns that provides a rich set of local descriptors that are particularly well
suited to SIFT-like feature extraction.
A second, but less common, failure case is when screenshots of web pages are saved as images. Many of these
images include browser panels or Microsoft Window’s control panels that are consistent across many images. It is
suspected that these mismatches can easily be filtered by
employing other sources of quality scores or measuring distinctiveness of the features not only within queries but also
across queries; in a manner similar to using TF-IDF [14]
weighting in textual relevancy.
(a) Fabreze
(b) Microsoft Zune
4.2 Click Study
Results from the previous experiment show that we can
effectively decrease the number of irrelevant images in the
search results. However, user satisfaction is not purely a
function of relevance; for example, numerous other factors
such as diversity of the selected images must also be considered. Assuming the users usually click on the images they
are interested in, an effective way to measure search quality
is to analyze the total number of “clicks” each image receives.
We collected clicks for the top 40 images (first two pages)
presented by the Google search results on 130 common product queries. For the top-1000 images for each of the 130
queries, we rerank them according to the approach described.
To determine if the ranking would improve performance, we
examine the number of clicks each method received from
only the top-20 images (these are the images that would
be displayed in the first page of results of Google’s image
search). The hope is that by reordering the top-40 results,
the best images will move to the top and would be displayed
on the first page of results. If we are successful, then the
number of clicks for the top-20 results under reordering will
exceed the number of clicks for the top-20 under the default
ordering.
It is important to note that this evaluation contains an
extremely severe bias that favors the default ordering. The
ground-truth of clicks an image receives is a function not
only of the relevance to a query and quality of the image,
but of the position in which it is displayed. For example,
it is often the case that a mediocre image from the top of
the first page will receive more clicks than a high quality
image from the second page (default ranking 21-40). If we
are able to outperform the existing Google Image search in
this experiment, we can expect a much greater improvement
in deployment.
When examined over the set of 130 product queries, the
images selected by our approach to be in the top-20 would
have received approximately 17.5% more clicks than those
in the default ranking. This improvement was achieved despite the positional bias that strongly favored the default
rankings.
(c) Ipod Mini
(d) Picasso Paintings
(e) Xbox Games
Figure 9: An example of top product images selected.
(a) dell
puter
com- (b)
nintendo (c) 8800 Ultra
wii system
(d) keychain
(e) ps 2 network (f) dell
adapter
puter
5. CONCLUSIONS
com-
The algorithms presented in this paper describe a simple
mechanism to incorporate the advancements made in using
link and network analysis for web-document search into image search. Although no links explicitly exist in the image
search graph, we demonstrated an effective method to infer a graph in which the images could be embedded. The
result was an approach that was able to outperform the default Google ranking on the vast majority of queries tried.
Figure 10: The particular local descriptors used provided a bias to the types of patterns found. These
images, selected by our approach, received the most
“irrelevant” votes from the users for the queries
shown.
314
WWW 2008 / Refereed Track: Rich Media
April 21-25, 2008. Beijing, China
[3] S. Brin and L. Page. The anatomy of a large-scale
hypertextual Web search engine. Computer Networks
and ISDN Systems, 30(1–7):107–117, 1998.
[4] R. Diestel. Graph Theory. Springer, New York, NY,
2005.
[5] R. Fergus, P. Perona, and A. Zisserman. A visual
category filter for google images. In Proc. 8th
European Conference on Computer Vision (ECCV),
pages 242–256, 2004.
[6] C. Harris and M. Stephens. A combined corner and
edge detector. In Proc. 4th Alvey Vision Conference,
pages 147–151, 1988.
[7] Y. Jing, S. Baluja, and H. Rowley. Canonical image
selection from the web. In Proc. 6th International
Conference on Image and Video Retrieval (CIVR),
2007.
[8] R. I. Kondor and J. Lafferty. Diffusion kernels on
graphs and other discrete structures. In Proc. 19th
International Conference on Machine Learning
(ICML), 2002.
[9] S. Lazebnik, C. Schmid, and J. Ponce. A sparse
texture representation using affine-invariant regions.
In Proc. Conference on Computer Vision and Pattern
Recognition (CVPR), pages 319–324, 2003.
[10] D. G. Lowe. Distinctive Image Features from
Scale-Invariant Keypoints. International Journal of
Computer Vision, 60(2):91–110, 2004.
[11] K. Mikolajczyk and C. Schmid. A performance
evaluation of local descriptors. IEEE Transaction on
Pattern Analysis and Machine Intelligence,
27(10):1615–1630, 2005.
[12] D. Nist´er and H. Stew´enius. Scalable recognition with
a vocabulary tree. In Proc. Conference on Computer
Vision and Pattern Recognition (CVPR), volume 2,
pages 2161–2168, 2006.
[13] G. Park, Y. Baek, and H. Lee. Majority based ranking
approach in web image retrieval. Lecture notes in
computer science, pages 111–120, 2003.
[14] G. Salton and M. J. McGill. Introduction to Modern
Information Retrieval. McGraw-Hill Book Co., New
York, NY, 1983.
[15] H. Schneiderman. Learning a restricted Bayesian
network for object detection. In Proc. Conference on
Computer Vision and Pattern Recognition (CVPR),
pages 639–646, 2004.
[16] S. Uchihashi and T. Kanade. Content-free image
retrieval by combinations of keywords and user
feedbacks. In Proc. 5th International Conference on
Image and Video Retrieval (CIVR), pages 650–659,
2005.
[17] P. Viola and M. Jones. Robust real-time object
detection. International Journal of Computer Vision,
57:137–154, May 2004.
[18] S. Winder and M. Brown. Learning local image
descriptors. In Prof. Conference on Computer Vision
and Pattern Recognition (CVPR), pages 1–8, 2007.
[19] X. Zhu and Z. Ghahramani. Learning from labeled
and unlabeled data with label propagation, 2002.
Importantly, the ability to reduce the number of irrelevant
images shown is extremely important not only for the task
of image ranking for image retrieval applications, but also
for applications in which only a tiny set of images must be
selected from a very large set of candidates.
Interestingly, by replacing user-created hyperlinks with
automatically inferred “visual-hyperlinks”, the proposed approach seems to deviate from a crucial source of information
that makes PageRank successful: the large number of manually created links on a diverse set of pages. However, a significant amount of the human-coded information is recaptured
through two mechanisms. First, by making the approach
query dependent (by selecting the initial set of images from
search engine answers), human knowledge, in terms of linking relevant images to webpages, is directly introduced into
the system, since it the links on the pages are used by Google
for their current ranking. Second, we implicitly rely on the
intelligence of crowds: the image similarity graph is generated based on the common features between images. Those
images that capture the common themes from many of the
other images are those that will have higher rank.
The categories of queries addressed, products, lends itself
well to the type of local feature detectors that we employed
to generate the underlying graph. One of the strengths of
the approach described in this paper is the ability to customize the similarity function based on the expected distribution of queries. Unlike classifier based methods [5] [13]
that construct a single mapping from image features to ranking, we rely only on the inferred similarities, not the features
themselves. Similarity measurements can be constructed
through numerous techniques; and their construction is independent of the image relevance assessment. For example,
images related to people and celebrities may rely on face
recognition/similarity, images related products may use local descriptors, other images such as landscapes, may more
heavily rely on color information, etc. Additionally, within
this framework, context-free signals, like user-generated covisitation [16], can be used in combination with image features to approximate the visual similarity of images.
Inferring visual similarity graphs and finding PageRanklike scores opens a number of opportunities for future research. Two that we are currently exploring are (1) determining the performance of the system under adversarial conditions. For example, it may be possible to bias the search
results simply by putting many duplicate images into our
index. We need to explore the performance of our algorithm
under such conditions. 2) the role of duplicate and nearduplicate images must be carefully studied, both in terms
of the potential for biasing our approach, and also in terms
of transition probabilities. It may be unlikely that a user
who has visited one image will want to visit another that
is a close or an exact duplicate. We hope to model this
explicitly in the transition probabilities.
6.
REFERENCES
[1] H. Bay, T. Tuytelaars, and L. V. Gool. Surf: Speeded
up robust features. In Proc. 9th European Conference
on Computer Vision (ECCV), pages 404–417, 2006.
[2] S. Belongie, J. Malik, and J. Puzicha. Shape matching
and object recognition using shape contexts. IEEE
Transactions on Pattern Analysis and Machine
Intelligence (PAMI), 24(24):509–522, 2002.
315


© Copyright 2026