
Article PDF - Journal of Pathology and Translational Medcine
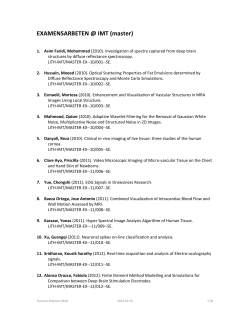
Journal of Pathology and Translational Medicine 2015; 49: 218-229
http://dx.doi.org/10.4132/jptm.2015.04.15
▒ REVIEW ▒
Pathology-MRI Correlation of Hepatocarcinogenesis: Recent Update
Jimi Huh1 · Kyung Won Kim1,2
Jihun Kim2,3 · Eunsil Yu2,3
Department of Radiology, 2Asan Liver Center,
Department of Pathology, Asan Medical Center,
University of Ulsan College of Medicine,
Seoul, Korea
1
3
Understanding the important alterations during hepatocarcinogenesis as well as the characteristic magnetic resonance imaging (MRI) and histopathological features will be helpful for managing
patients with chronic liver disease and hepatocellular carcinoma. Recent advances in MRI techniques, such as fat/iron quantification, diffusion-weighted images, and gadoxetic acid-enhanced
MRI, have greatly enhanced our understanding of hepatocarcinogenesis.
Received: April 7, 2015
Accepted: April 14, 2015
Corresponding Author
Kyung Won Kim, M.D., Ph.D.
Department of Radiology, Asan Medical Center,
University of Ulsan College of Medicine,
88 Olympic-ro 43-gil, Songpa-gu, Seoul 138-736,
Korea
Tel: +82-2-3010-4377
Fax: +82-2-3010-8724
E-mail: [email protected]
Key Words: Hepatocarcinogenesis; Magnetic resonance image; Carcinoma, hepatocellular; Pathology
Hepatocellular carcinoma (HCC) is the sixth most common
cancer worldwide and the third most common cause of death
from cancer.1 Asia is an endemic area of HCC. It is estimated
that approximately 75%–80% of the HCC cases worldwide develop in Asia.2 The primary etiological factor in Asia is the hepatitis B virus; however, the proportion of hepatitis C virus–related
HCC has been increasing.3 In chronic hepatitis B or C, multistep hepatocarcinogenesis, in which dysplastic nodules progress
to early HCC and eventually advanced HCC, is widely accepted
as the main mechanism of HCC development.4
Knowledge of the mechanism of hepatocarcinogenesis is important, as it may contribute to improved detection of HCC at
an early stage and more successful therapeutic outcomes. In fact,
the 5-year survival rate for patients with HCC has improved
over the past several decades, and the early detection of HCC is
one of the most important contributing factors.5 In particular,
the nationwide surveillance for HCC among high-risk individuals has allowed small HCCs less than 2 cm in diameter to be
easily detected.4 Furthermore, the rapid development of noninvasive imaging technology, including the rapidly developing,
high-quality magnetic resonance (MR) techniques using new,
cell-specific contrast agents, may allow further improvement of
the detection and characterization of small nodules in cirrhotic
livers.6 As a result, we are currently able to diagnose more earlystage HCCs. Pathologists and radiologists should be aware of
the variable imaging features of these early-stage HCCs, as they
frequently show different characteristics than advanced HCC.
In this study, we review the important changes in magnetic resonance imaging (MRI) and histopathologic features during multistep hepatocarcinogenesis as well as the recent developments
in MRI technology for detecting and characterizing hepatocellular nodules.
MULTISTEP HEPATOCARCINOGENESIS:
HISTOLOGIC CHANGE
Multistep hepatocarcinogenesis is characterized by progressive
dedifferentiation of phenotypically abnormal nodular lesions in
the liver and the emergence of successively more advanced precancerous, early cancerous, and overtly cancerous lesions (Fig.
1).7,8 Chronic inflammation causes repeated injury to liver cells
and regeneration of injured tissue, both of which promote accumulation of genetic and epigenetic alterations.9-12 These alterations begin from the early preneoplastic phase and progress par-
© 2015 The Korean Society of Pathologists/The Korean Society for Cytopathology
218
This is an Open Access article distributed under the terms of the Creative Commons Attribution Non-Commercial License (http://creativecommons.org/licenses/
by-nc/3.0) which permits unrestricted non-commercial use, distribution, and reproduction in any medium, provided the original work is properly cited.
pISSN 2383-7837
eISSN 2383-7845
Pathology and MRI for Hepatocarcinogenesis • 219
RN
LG-DN
HG-DN
Early HCC
Progressed HCC
Neoangiogenesis (unpaired artery)
Portal tracts in the nodule
Cellular differentiation
Cell density of the nodule
Intranodular fatty change
Intranodular iron accumulation
OATP1B1/B3 expression
Fig. 1. Schematic view of multistep hepatocarcinogenesis. Unpaired arterial supply replaces portal supply progressively from regenerative
nodules to progressed hepatocellular carcinoma (yellow, nodules with portal supply; red, nodules with unpaired arterial supply). Degrees of
various pathologic components are depicted as gradient bars. DN, dysplastic nodule; HCC, hepatocellular carcinoma; HG, high grade; LG,
low grade; RN, regenerative nodule.
allel to the evolution of hepatic fibrosis or cirrhosis.13,14
This linear, repetitive, and successive process of the expansion
and development of less differentiated, aberrant clonal populations of hepatocytes causes their evolution over time.15 These dedifferentiated clonal populations eventually completely replace
those of the more differentiated environment. Repetitive clonal
growth and expansion ultimately generates nodules of the malignant phenotype. The dedifferentiated evolution process occurs
in serial order as a biologic continuum in vivo; however, these
processes are divided into discrete steps for clinical use.16
In 1995, after the stepwise development of HCC from regenerating nodules of liver cirrhosis was proposed, the International
Working Party (IWP) of the World Congress of Gastroenterology defined regenerative nodules (RNs), low-grade dysplastic
nodules (DNs), high-grade DNs, and HCC as steps from regeneration to cancer.17,18 In addition, the IWP defined small HCCs
as tumors less than 2 cm in diameter. However, there had been
debate regarding the definition of small HCC, as these tumors
can be divided into early HCCs, i.e., an early stage of hepatocarcinogenesis, and progressed HCCs, i.e., advanced HCC less
than 2 cm in diameter. In addition, the accurate pathological
definition of early HCCs differentiated from DNs was not established until recently. Finally, in 2009 the International Consensus Group for Hepatocellular Neoplasia (ICGHN) reached a
consensus regarding the pathological criteria of early HCCs, as
discussed below.19 These international efforts have contributed
greatly to the standardization of the nomenclature regarding
http://dx.doi.org/10.4132/jptm.2015.04.15
nodules during hepatocarcinogenesis.
Regenerative nodules
A RN, also known as a cirrhotic nodule, is a well-defined nodular region surrounded by fibrotic/scar tissue, which has emerged
from the regenerative process of the injured liver tissue. In RNs,
the cells are histologically normal and lack clonal features.18 A
RN is considered a benign hepatocellular nodule.
Dysplastic nodules
DNs are small nodules which are in the precancerous stage
between benign RNs and malignant HCC. DNs usually differ
from the surrounding liver parenchyma in color, texture, and
cellular change.18 DNs are subdivided into low-grade DN and
high-grade DN.
Low-grade DNs show features suggestive of a clonal cell population without significant architectural or cellular atypia (Fig.
2A). Occasionally, low-grade DNs demonstrate large cell change,
although they do not show small cell change. Low-grade DNs can
show a mild increase in cell density with a monotonous pattern.
A nodule-in-nodule pattern is not present in low-grade DNs.18,20
In contrast, high-grade DNs show cytological and architectural atypia, although those changes are insufficient for a diagnosis of malignancy.18 Small cell change is the most frequently
seen cytological atypia. The architectural atypia observed in
high-grade DNs includes the thick cell plates up to three cells
thick and/or pseudoglandular structures (Fig. 2B). The cell denhttp://jpatholtm.org/
220 • Huh J, et al.
A
B
C
D
Fig. 2. Representative pathologic images of multistep hepatocarcinogenesis. (A) Low-grade dysplastic nodule (right of the dashed line)
shows increased cellularity, and residual portal tracts (arrow) are easily identifiable within the nodule. (B) High-grade dysplastic nodule (left of
the dashed line) shows further increased cellularity and frequent unpaired arteries (arrow). (C) Early hepatocellular carcinoma (below the
dashed line) is poorly demarcated but shows unequivocal cytological atypia and stromal invasion (arrow). (D) Advanced hepatocellular carcinoma is well demarcated by a thick capsule and shows overt features of malignancy.
sity of these lesions is usually 1.3–2 times greater than that of
the adjacent cirrhotic parenchyma.19
Early HCC
In 2009, the ICGHN made a consensus for the definition of
early HCC.19 Early HCCs are considered ‘‘in situ carcinoma’’
showing well-differentiated proliferation.18,20 Early HCCs are
referred to as ‘small HCC of the vaguely nodular type.’ The most
important histologic feature that distinguishes early HCCs
from high-grade DNs is stromal invasion, defined as the presence of tumor cells invading the portal tracts or fibrous septa
(Fig. 2C). Early HCCs also show various combinations of the
following histologic features: “(1) increased cell density more
than two times that of the surrounding liver parenchyma and
with an increased nuclear/cytoplasm ratio and irregular, thin
trabecular pattern; (2) varying numbers of portal tracts within
the nodule (intratumoral portal tracts); (3) a pseudoglandular
http://jpatholtm.org/
pattern; (4) diffuse fatty change; and (5) various numbers of unpaired arteries.”19
There may be confusion regarding the terminology of early
HCC and small HCC. By the definition of the IWP consensus
in 1995, small HCC is a tumor less than 2 cm, whereas early
HCC refers to well-differentiated HCC of the vaguely nodular
type during the hepatocarcinogenesis process. The question has
remained for small HCCs with moderate or poor differentiation. After much debate, such tumors are now termed “small
progressed HCC” or “small HCC of the distinctively nodular
type.” In Table 1, the terminology and histologic characteristics
of these small, hepatocellular lesions are summarized.
Progressed HCC
Progressed HCCs are overtly malignant hepatocellular lesions. Small lesions with a maximum diameter less than 2 cm
usually have distinctly nodular macroscopic features,19 while
http://dx.doi.org/10.4132/jptm.2015.04.15
Pathology and MRI for Hepatocarcinogenesis • 221
Table 1. Terminology and histologic characteristics of these small (less than 2 cm) hepatocellular lesions
Terminology
Feature
Histologic characteristic
Regenerative nodules
Gross
Microscopic
Gross
Well-defined rounded regions of the cirrhotic parenchyma surrounded by scar tissue
Phenotypically normal cells
Distinctly nodular lesions which differ from adjacent cirrhotic parenchyma with regard to size,
color, texture, and degree of bulging at the cut surface
Divided into low-grade DNs and high-grade DNs
– Low-grade DN: a clonal cell population without significant architectural atypia and with a mild
increase in cell density
– High-grade DN: a clonal cell population with cytological and architectural atypia although not
sufficient for a diagnosis of malignancy
Vaguely nodular lesions with indistinct margins
Well-differentiated histology of HCC with increased cell density and an irregular, thin-trabecular
pattern; the stromal invasion is the most helpful feature to differentiate early HCC from
high-grade DN
Distinctly nodular lesions
Well (G1) to moderately (G2) differentiated histology of HCC
Dysplastic nodules
Microscopic
Early HCCs (=small HCCs
of the vaguely nodular type)
Gross
Microscopic
Progressed HCCs (=small HCCs
of the distinctly nodular type)
Gross
Microscopic
DN, dysplastic nodule; HCC, hepatocellular carcinoma.
large lesions greater than 2 cm in diameter, which are termed
“large HCCs,” have variable macroscopic features. Although
three common macroscopic patterns of large HCCs have been
proposed,21 six macroscopic patterns, which were proposed by
the Korean Liver Cancer Study Group, are more widely accepted
in Korea.22 Briefly, expanding nodular pattern is defined by one
single, dominant mass and is the most common type. In these
tumors, mosaic architecture is frequently observed, characterized
by the multiple sub-nodules separated by fibrous septations and
foci of hemorrhage or necrosis.23 Nodular and perinodular extension type and infiltrative pattern show a dominant mass with infiltration into adjacent hepatic parenchyma along < 50% of tumor border in the former and ≥ 50% in the latter. Those tumors
are usually associated with poorly differentiated cancer cells that
spread into the surrounding sinusoids and cell plates.17,24 Cirrhotomimetic pattern represents widespread infiltration by innumerable small nodules that frequently replace the whole liver.21
In addition, multinodular confluent type and pedunculated type
have also been described.22 These progressed HCCs with both
small and large lesions frequently show macroscopic vascular
invasion with involvement of portal veins and less frequently
hepatic veins. Sometimes, bile duct invasion may be seen macroscopically.
On histology, the main hallmark of HCC is that the malignant cells resemble the normal liver, both in architecture and cytology. Progressed HCCs can show different degrees of hepatocellular differentiation ranging from well-differentiated to poorly
differentiated. Based on the degree of nuclear anaplasia, the Edmondson and Steiner system was proposed and is widely used to
divide HCC into four grades from I to IV.17,25 The common histological patterns include (1) trabecular pattern, where tumor
http://dx.doi.org/10.4132/jptm.2015.04.15
cells with hepatocellular differentiation are arranged in plates of
various thickness, separated by sinusoid vascular spaces (Fig. 2D);
(2) pseudoglandular pattern, where gland-like dilatation of the
canaliculi are present between tumor cells forming the lumen;
(3) compact pattern, which is composed of thick trabeculae compressed into a compact mass; (4) scirrhous pattern, where desmoplastic stroma divides tumor cell masses into smaller nests;
and (5) fibrolamellar pattern, which shows characteristic lamellar collagen bundles running between large glassy tumor cells.
RECENT ADVANCES IN MAGNETIC
RESONANCE IMAGING TECHNIQUES
Recently, the diagnosis of hepatocellular carcinoma has become primarily based on imaging.26 In clinical practice, computed tomography (CT) is the most widely used imaging modality to diagnose HCC. With the dramatic technical advances
in MRI, it is currently more useful than other imaging modalities for diagnosing HCC because it provides better soft-tissue
contrast and information regarding cellularity, tissue components, and hemodynamic changes of the hepatocellular nodules.
In the recent past, the spatial resolution and scan speed were
generally better on CT than on MRI;27,28 however, recently developed MRI units have fast scanning with high spatial resolution, comparable to CT scanning. Therefore, the use of MRI for
the diagnosis of HCC has greatly increased.
Nonradiologist physicians may not be familiar with MRI sequences and the information that can be obtained from those
sequences. Indeed, there are many sequences of liver MRI which
may cause confusion. In addition, the interpretation of MRI
largely depends on which contrast agent is used. We summarize
http://jpatholtm.org/
222 • Huh J, et al.
the commonly used sequences in Table 2 and illustrate the representative images of such sequences in Fig. 3.
T2-weighted images
T2-weighted imaging (T2-WI) highlights the differences in
the T2 relaxation time of tissues. Sequences for T2-WI are the
basic components of MRI, and are quite helpful for the differential diagnosis of liver tumors. For example, hepatic cysts and
hemangiomas show very high T2 hyperintensity, while HCCs
show intermediately high T2 hyperintensity (Fig. 3A).29
For routine liver MRI, two kinds of T2-WI sequences are
used: sequences moderately weighting T2, including fast spin-
Table 2. Commonly used MRI sequences for liver imaging
MRI sequences
Information
T2-weighted images
Helpful for differential diagnosis
Hepatic cysts and hemangiomas show very high T2 hyperintensity, while HCCs
show intermediately high T2 hyperintensity
Helpful for detecting the intralesional fat component
T1-weighted dual gradient-echo images
(in-phase and opposed-phase)
Multiphasic dynamic imaging (arterial phase, portal-venous phase, and
three-minute equilibrium phase)
Hepatobiliary phase imaging (i.e., 20-minute delayed image)
Diffusion-weighted imaging
Evaluate the hemodynamic pattern of hepatic tumors
HCCs typically show arterial enhancement and delayed washout
When gadoxetic acid is used as a contrast agent, the hepatobiliary phase is used
to improve the detection and characterization of hepatocellular nodules
Helpful for the detection and characterization of hepatocellular nodules
MRI, magnetic resonance imaging; HCC, hepatocellular carcinoma.
A
In
Out
Cross
B
Fig. 3. Routine magnetic resonance imaging sequences. (A) T2-weighted imaging is helpful for the differential diagnosis of liver tumors. Hepatocellular carcinoma (HCC) usually shows intermediate high-signal intensity (arrowheads on the left), whereas hepatic cysts show bright
high-signal intensity (arrow on the right). (B) In-phase and opposed-phase images provide information regarding the fat or iron content of hepatocellular nodules. The fat component of a nodule is seen as high-signal intensity on in-phase imaging (arrowhead on the left) and as lowsignal intensity on opposed-phase imaging (arrow on the middle). On histology of the resected specimen, the nodule is confirmed as a fatcontaining HCC.
(Continued to the next page)
http://jpatholtm.org/
http://dx.doi.org/10.4132/jptm.2015.04.15
Pathology and MRI for Hepatocarcinogenesis • 223
AP
PVP
EP
HBP
C
DWI
ADC
D
Fig. 3. (Continued) (C) Multiphasic dynamic images and hepatobiliary-phase images. After contrast injection, T1-weighted images are obtained in the arterial phase (AP), portal-venous phase (PVP), three-minute, delayed equilibrium phase (EP), and 20-minute, delayed hepatobiliary phase (HBP) to provide hemodynamic information regarding liver tumors. An HCC (arrowheads) shows typical hemodynamic features,
including enhancement on AP, and washout on PVP and EP. On HBP, the HCC is seen as a hypodense mass. (D) Diffusion-weighted imaging (DWI) and the apparent diffusion coefficient (ADC) map are helpful for evaluating the cellularity of a liver tumor. HCC mostly shows high
signal intensity on DWI (arrow on the left) and low signal on the ADC map (arrowheads on the right).
echo or turbo spin-echo, and sequences exaggerating T2 of tissues, including single-shot fast spin-echo or half-Fourier acquisition single-shot turbo spin-echo.29
T1-weighted, dual gradient-echo sequence (in-phase and
oppposed-phase)
A T1-weighted, dual gradient-echo sequence is composed of
http://dx.doi.org/10.4132/jptm.2015.04.15
an in-phase image and an opposed-phase image. These images
are routine components of the liver MRI protocol, as they can
evaluate the fat content of tissues.30 They are primarily used to
identify diffuse or focal hepatic steatosis or to detect the fatty
component of liver tumors, such as fat-containing, dysplatic
nodules or HCC. When comparing the signal intensity (SI) between in-phase and opposed-phase images, the fatty component
http://jpatholtm.org/
224 • Huh J, et al.
of tissue shows a signal drop in the opposed-phase (Fig. 3B).
This sequence is also helpful for detecting the iron component of tissues using the dual-echo approach. In contrast to the
fatty component, the iron component shows a signal drop on inphase images compared to opposed-phase images. Therefore, the
pathological conditions, such as hemochromatosis or hemosiderosis, can be identified.7 It is also helpful to detect iron-containing liver tumors, such as siderotic nodules or iron-containing hepatocellular lesions.
Multiphasic dynamic imaging
In liver MRI, contrast agents have crucial roles in the detection and characterization of HCC, based on evaluation of the hemodynamic pattern of liver tumors and liver parenchyma. Multiphasic dynamic imaging consists of repeated acquisition of T1weighted images (T1-WIs) after contrast agent injection and is
composed of the arterial phase, portal-venous phase, and three
minutes of the equilibrium phase (Fig. 3C). Enhancement in the
arterial phase and washout in the portal or equilibrium phase is
regarded as a characteristic feature of HCC on both dynamic CT
and dynamic MRI.31
Hepatobiliary phase images
The hepatobiliary phase refers to a 20-minute delayed phase
following injection of gadoxetic acid (Fig. 3C). Therefore, the
hepatobiliary phase is only performed when gadoxetic acid is
used as the contrast agent. Gadoxetic acid is a dual-function
agent allowing both dynamic imaging and hepatobiliary-phase
imaging. It has characteristics like extracellular contrast agents
and can be used in dynamic MRI within three minutes after
contrast agent injection. In the hepatobiliary phase, gadoxetic
acid is taken up by cells that express the OATP receptor. Normal hepatocytes usually express abundant OATP receptors,
while HCCs or liver metastases lack OATP receptors. This results in improved lesion-to-liver contrast because normal liver
parenchyma shows high SI while liver tumors show dark SI in
the hepatobiliary phase of gadoxetic-acid–enhanced MRI.32
Gadoxetic acid is excreted into the biliary system. In the hepatobiliary phase it is possible to observe the biliary excretion of
gadoxetic acid, which thus allows functional biliary imaging. In
liver tissue in which the bile duct is obstructed, biliary excretion
is not observed. Regarding liver tumor evaluation, the hepatobiliary phase is sometimes helpful for obtaining a differential
diagnosis. For example, focal nodular hyperplasia (FNH) has a
functioning, hepatocyte-expressing OATP receptor, although it
has no biliary excretion system. Therefore, gadoxetic acid is rehttp://jpatholtm.org/
tained for a long time within an FNH nodule. FNH shows high
SI in the hepatobiliary phase, which is helpful for differentiating FNH from HCC.8
Diffusion-weighted imaging
Diffusion-weighted imaging is a sequence to map the diffusion process of molecules, primarily water molecules, in biological tissues. Diffusion is a random motion of water molecules.
In tissues or cells, diffusion of water molecules is restricted due
to the interactions of molecules.33 The degree of diffusion restriction varies across tissues, thus reflecting the microscopic details
of biological tissues. The apparent diffusion coefficient (ADC) is
a quantitative parameter of diffusion restriction calculated from
diffusion-weighted images. The ADC map, together with diffusion-weighted images, is quite helpful for visual assessment and
quantitative analysis of a liver tumor (Fig. 3D).
The diffusion of water molecules is highly restricted in dense
cellular tissue such as HCC, compared to that of normal liver
parenchyma, whereas necrosis or nonviable tumor tissues cause
increased membranous permeability allowing free diffusion of
water molecules.34 Therefore, diffusion-weighted images are
helpful for detecting highly cellular tumors and for differentiating malignant lesions from benign lesions.
MAGNETIC RESONANCE IMAGING
OF ALTERATIONS DURING
HEPATOCARCINOGENESIS
During multistep hepatocarcinogenesis, the important changes in hepatocellular nodules are neo-angiogenesis, cellular differentiation and density, fat or iron accumulation, and biliary
drainage dysfunction (Fig. 1). Recent advances in MR technology allow the evaluation of these pathological and functional
changes.6,35
Alteration of hepatic vasculature
During hepatocarcinogenesis, hemodynamic change occurs in
hepatocellular nodules and can be visualized by radiologic imaging and histopathology.36 The blood flow of RNs is supplied
from both the portal vein (75%–80%) and the hepatic artery
(20%–25%), as with normal liver parenchyma. As the hepatocellular nodules evolve from low-grade DN through high-grade
DN to early HCC, both the intranodular portal blood supply
and the hepatic arterial blood supply tend to decrease.37 The majority of these nodules are still hypovascular on dynamic MRI.9
As the grade of HCCs increases, i.e., Edmondson grade II or
http://dx.doi.org/10.4132/jptm.2015.04.15
Pathology and MRI for Hepatocarcinogenesis • 225
greater, the intranodular portal supply definitely decreases,
whereas the intranodular arterial supply tends to progressively
increase. This increased intranodular arterial input is due to neoangiogenesis of the unpaired artery in the lesion.10 Therefore, the
majority of advanced HCCs show typical hemodynamic features
of arterial enhancement and portal/delayed washout (Fig. 3C).
Cellular change in hepatocellular nodules
As hepatocellular nodules evolve from DNs to HCCs, several
cellular changes occur, including small cell change, increased
cell density, and nodule-in-nodule growth. These cellular changes can be detected in T2-WI and diffusion-weighted images.35
First, cell density can be evaluated by diffusion-weighted imaging and T2-WI. Low-grade DNs show a mild increase in cell
density, and high-grade DNs show a moderate increase in cell
density, i.e., as much as twice that of the surrounding liver parenchyma.11 However, these cellular changes of DNs are usually
insufficient to show overt high SI on diffusion-weighted images
and T2-WI. In contrast, in HCCs, an increase in cell density is
usually sufficiently detectable on diffusion-weighted images or
T2-WIs.38 Small cell change is frequently observed in HCC and
may also contribute to diffusion restriction of water molecules in
the malignant cells seen on diffusion-weighted images (Fig. 3D).
Secondly, the nodule-in-nodule pattern is one of the typical
histologic and imaging features of HCC, although it is uncommon. Usually, cirrhotic nodules and low-grade DNs are seen as
distinct single nodules, while some high-grade DNs contain
sub-nodules which are usually HCC foci, i.e., clones of malignant-transformed cells from DNs during hepatocarcinogenesis.
The nodule-in-nodule pattern can be depicted by either T2-WI
or dynamic MRI.39 If the sub-nodule within the DN shows arterial enhancement, it is easily detected in the arterial phase of dynamic MRI (Fig. 4).
Thirdly, the tumor capsule is a characteristic feature of progressed HCCs.39 It is usually seen as a thin rim of low SI on noncontrast T1-WI. On contrast-enhanced MRI, the tumor capsule
can be progressively enhanced following injection of gadolinium
contrast agent, as the tumor capsule is generally composed of fibrous tissue containing compressed vessels (Fig. 5).12 On T2WI, the tumor capsule may show variable SI as either low SI or
high SI. Although the tumor capsule is regarded as a characteristic finding of progressed HCCs, it may be present in large
DNs and may not be seen in small HCCs. For the diagnosis of
HCC, the presence of a tumor capsule is helpful, although not
essential.
Alterations of the fat/iron composition in hepatocellular
nodules
During hepatocarcinogenesis, iron may accumulate in lowgrade DNs and in some high-grade DNs. These nodules containing an iron deposit are referred to as ‘siderotic nodules’ (Fig.
6). In hepatocytes of siderotic nodules, the iron-transporter system, such as the transferrin transporter, are upregulated.14 However, as these nodules progress into HCCs, the iron-transportation system also alters, and iron utilization increases, thus causing
iron deficiency in HCCs.15 Therefore, with progression to HCC,
iron usually decreases.
These alterations of the fat composition in DNs and HCCs
are often helpful for characterizing hepatocellular nodules on
MRI. On T2-WI or T2*-WI, the iron component is seen as
Fig. 4. Nodule-in-nodule pattern of hepatocellular carcinoma (HCC). On a multiphasic, dynamic magnetic resonance imaging of a 50-yearold patient with HCC, there is a large mass without arterial hypervascularity (arrowheads on the left) and a sub-nodule with strong arterial hypervascularity (asterisk on the left) on the arterial-phase image, i.e., the so-called nodule-in-nodule pattern. The central sub-nodule shows
washout on the portal-venous phase (asterisk in the middle). After the patient was treated with transarterial chemoembolization, lipiodol was
taken up only in the sub-nodule (asterisk on the right). These findings suggest the presence of HCC as a sub-nodule arising from a large
dysplastic nodule.
http://dx.doi.org/10.4132/jptm.2015.04.15
http://jpatholtm.org/
226 • Huh J, et al.
dark SI. On T1-weighted, dual gradient-echo images, the iron
component shows a signal drop in in-phase images compared to
that of opposed-phase images. Iron-containing, hepatocellular
nodules are usually DNs and are unlikely to be HCCs. The development of an iron-deficient sub-nodule within a siderotic
nodule indicates HCC foci arising from the DN. Likewise, if a
siderotic nodule is seen to be iron-free on a follow-up study, it
may suggest its transformation into HCC.17
Fat accumulation within hepatocellular nodules is also altered
during hepatocarcinogenesis. In low-grade DNs, high-grade
DNs, and early HCCs, fat can accumulate focally or diffusely in
the nodules. The intralesional fat accumulation peaks in the early HCC stage and regresses according to the increasing size and
grade of HCCs. Usually, poorly differentiated HCCs or large
HCCs > 3 cm rarely show intralesional fat accumulation.13 The
fat component can be evaluated on T1-weighted, dual gradientAP
echo images. The fatty component of tissue shows a signal drop
in opposed-phase images compared to in-phase images (Fig. 3B).
MAGNETIC RESONANCE IMAGING FINDINGS
OF HEPATOCARCINOGENESIS
Regenerative nodules
On MRI, most RNs are imperceptible and isointense on unenhanced T1-WIs and T2-WIs. Some of these nodules may be
differentiated by unusual imaging features, such as hyperintensity on T1-WIs and hypointensity on T2-WIs. When enhanced
with contrast material, most RNs demonstrate a similar degree
of enhancement with that of the adjacent parenchyma, although
occasionally mild, delayed-phase hypoenhancement or hepatobiliary phase hyperintensity may be seen.27,40
PVP
T2-WI
Fig. 5. Tumor capsule of the hepatocellular carcinoma (HCC). The tumor capsule (arrowheads) is seen as a hypointense rim on the arterialphase (AP) image (left) and as an enhancing rim on the portal-venous phase (PVP) image (middle), indicating a delayed and persistent enhancement pattern. On T2-weighted imaging (T2-WI), the tumor capsule is seen as a hyperintense rim (right).
In
Out
Fig. 6. Siderotic nodule. A 60-year-old patient with liver cirrhosis underwent liver magnetic resonance imaging. On in-phase images, there
are many nodules with low signal intensity (arrowheads on the left), which are not clearly demonstrable on opposed-phase images (right).
This signal drop of nodules on the in-phase image suggests that these nodules contain an iron component (so-called siderotic nodules).
http://jpatholtm.org/
http://dx.doi.org/10.4132/jptm.2015.04.15
Pathology and MRI for Hepatocarcinogenesis • 227
Dysplastic nodules
Common imaging findings of DNs are hyperintensity on T1WIs and isointensity or hypointensity on T2-WIs.27,41 The T1
hyperintensity can be explained by the fact that DNs accumulate copper or iron, which are paramagnetic materials leading to
T1 hyperintensity depending on the concentration. Such intranodular copper or iron accumulation may lead to T2 hypointensity due to the T2-shortening effects. Some DNs, especially
high-grade DNs, may show fatty change manifested as T1 hyperintensity on MRI.
After contrast agent injection, most DNs are usually isointense to the liver parenchyma in the hepatic arterial, portal venous, and hepatobiliary phases. As some DNs show washout or
capsular enhancement in the delayed phase and hypointensity
in the hepatobiliary phase, these findings may be good predictors of pre-malignancy.27
Early HCC
Most early HCCs are either isointense or hyperintense on T1WIs and are mostly isointense on T2-WIs.42 In addition, most
AP
early HCCs are hypovascular, and only 5% of the early HCCs
show arterial hypervascularity on dynamic MRI. These characteristics are nonspecific, suggesting that it is difficult to accurately diagnose early HCC using conventional MRI.
In particular, differentiating early HCC from high-grade DN
on MRI is quite challenging. There are a few differential points.
First, high SI on diffusion-weighted images almost always indicates early HCC. DNs are almost never hyperintense on T2-WI
and diffusion-weighted images.17 Second, nodule hypointensity
on the hepatobiliary phase of gadoxetic-acid-enhanced MRI favors early HCC rather than high-grade DN, as a substantial number of such hypointense nodules show hypervascularity during
the follow-up period (Fig. 7).43
Progressed HCC
The typical MRI findings of HCC, which have been extensively investigated in numerous research studies, mostly apply
to progressed HCC rather than early HCC. The hallmarks of
HCC are arterial hypervascularity and washout on the portalvenous phase and/or equilibrium phase of multiphasic dynamic
PVP
A
AP
HBP
B
Fig. 7. A 65-year-old patient with a liver nodule. (A) On the initial magnetic resonance imaging (MRI), there is a 1.4 cm, hypointense nodule
on the portal-venous phase (PVP, arrowhead) without arterial hypervascularity (arrow) on the arterial phase (AP). This nodule was regarded
as a high-grade dysplastic nodule or early hepatocellular carcinoma (HCC). (B) On the one-year follow-up MRI, the nodule had increased in
size. The nodule showed hypointensity on the hepatobiliary phase (HBP, arrowheads) and arterial hypervascularity on the AP (arrow), which
suggests development of HCC.
http://dx.doi.org/10.4132/jptm.2015.04.15
http://jpatholtm.org/
228 • Huh J, et al.
CT or MRI.4,37 This finding is due to the predominant vascular
supply to HCCs from unpaired hepatic arteries and the absence
of the portal vein supply. These hemodynamic changes are apparent in the progressed HCC rather than the early HCC.
Therefore, it is very helpful to differentiate small progressed
HCC from early HCC. In addition, the nodule margin seen on
MRI is also helpful to differentiate small, progressed HCC, because it is more distinctly nodular than early HCC with its indistinct margin. Indeed, the tumor capsule is a characteristic
feature of progressed HCCs and is seen as a persistent enhancing rim at the periphery of the tumor.39
Progressed HCCs can present as infiltrative masses as well as
expansile nodules/masses. In infiltrative masses, the tumor cells
may infiltrate through the tumor capsule into the surrounding
parenchyma.17 These infiltrative HCCs frequently show vascular
invasion or biliary invasion, thus leading to a poor patient prognosis.
Vascular invasion is common in progressed HCCs, including
portal vein invasion or hepatic vein invasion. As vascular invasion is rarely observed in other types of liver malignancies, this is
a helpful characteristic for diagnosing HCC. Vascular invasion
generally indicates a poor prognosis for the patients, as it is a
route of tumor spread through the liver and of systemic metastasis.26
CONCLUSION
Development Institute (KHIDI), funded by the Ministry of
Health & Welfare, Republic of Korea (Grant No. HI14C1090).
REFERENCES
1.Song P, Tang W, Tamura S, et al. The management of hepatocellular
carcinoma in Asia: a guideline combining quantitative and qualitative evaluation. Biosci Trends 2010; 4: 283-7.
2.Kudo M, Han KH, Kokudo N, et al. Liver Cancer Working Group
report. Jpn J Clin Oncol 2010; 40 Suppl 1: i19-27.
3.Lee SH, Choi HC, Jeong SH, et al. Hepatocellular carcinoma in older
adults: clinical features, treatments, and survival. J Am Geriatr Soc
2011; 59: 241-50.
4.Kudo M. Multistep human hepatocarcinogenesis: correlation of
imaging with pathology. J Gastroenterol 2009; 44 Suppl 19: 112-8.
5.Yoo HJ, Lee JM, Lee MW, et al. Hepatocellular carcinoma in cirrhotic liver: double-contrast-enhanced, high-resolution 3.0T-MR imaging with pathologic correlation. Invest Radiol 2008; 43: 538-46.
6.Choi BI, Lee JM. Advancement in HCC imaging: diagnosis, staging
and treatment efficacy assessments: imaging diagnosis and staging
of hepatocellular carcinoma. J Hepatobiliary Pancreat Sci 2010; 17:
369-73.
7.Henninger B, Zoller H, Rauch S, et al. Automated two-point dixon
screening for the evaluation of hepatic steatosis and siderosis: comparison with R2*-relaxometry and chemical shift-based sequences.
Eur Radiol 2015; 25: 1356-65.
8.Suh CH, Kim KW, Kim GY, Shin YM, Kim PN, Park SH. The diag-
The incidence of small HCCs has recently been increasing
due to a nationwide surveillance program and advances in imaging techniques. It is difficult to correctly diagnose such small
HCCs during histological and radiological examinations. Understanding the important alterations during hepatocarcinogenesis as well as the characteristic MRI and histopathological features will be helpful for managing patients with chronic liver
disease and HCC. There is no doubt that special MRI techniques, such as fat/iron quantification, diffusion-weighted images, and gadoxetic-acid-enhanced MRI, have greatly enhanced
our understanding of hepatocarcinogenesis.
nostic value of Gd-EOB-DTPA-MRI for the diagnosis of focal nodular hyperplasia: a systematic review and meta-analysis. Eur Radiol
2015; 25: 950-60.
9.Krinsky G. Imaging of dysplastic nodules and small hepatocellular
carcinomas: experience with explanted livers. Intervirology 2004;
47: 191-8.
10.Fournier LS, Cuenod CA, de Bazelaire C, et al. Early modifications
of hepatic perfusion measured by functional CT in a rat model of
hepatocellular carcinoma using a blood pool contrast agent. Eur
Radiol 2004; 14: 2125-33.
11.Roncalli M, Terracciano L, Di Tommaso L, et al. Liver precancerous
lesions and hepatocellular carcinoma: the histology report. Dig Liv-
Conflicts of Interest
er Dis 2011; 43 Suppl 4: S361-72.
No potential conflict of interest relevant to this article was
reported.
12.Ishigami K, Yoshimitsu K, Nishihara Y, et al. Hepatocellular carci-
Acknowledgments
13.Kutami R, Nakashima Y, Nakashima O, Shiota K, Kojiro M. Patho-
noma with a pseudocapsule on gadolinium-enhanced MR images:
correlation with histopathologic findings. Radiology 2009; 250: 435-43.
This research was supported by a grant of the Korea Health
Technology R&D Project through the Korea Health Industry
http://jpatholtm.org/
morphologic study on the mechanism of fatty change in small hepatocellular carcinoma of humans. J Hepatol 2000; 33: 282-9.
http://dx.doi.org/10.4132/jptm.2015.04.15
Pathology and MRI for Hepatocarcinogenesis • 229
14.Pascale RM, De Miglio MR, Muroni MR, et al. Transferrin and
29.Bitar R, Leung G, Perng R, et al. MR pulse sequences: what every
transferrin receptor gene expression and iron uptake in hepatocel-
radiologist wants to know but is afraid to ask. Radiographics 2006;
lular carcinoma in the rat. Hepatology 1998; 27: 452-61.
26: 513-37.
15.Holmstrom P, Gåfvels M, Eriksson LC, et al. Expression of iron reg-
30.Kang BK, Yu ES, Lee SS, et al. Hepatic fat quantification: a prospec-
ulatory genes in a rat model of hepatocellular carcinoma. Liver Int
tive comparison of magnetic resonance spectroscopy and analysis
2006; 26: 976-85.
methods for chemical-shift gradient echo magnetic resonance im-
16.Libbrecht L, Craninx M, Nevens F, Desmet V, Roskams T. Predictive value of liver cell dysplasia for development of hepatocellular
carcinoma in patients with non-cirrhotic and cirrhotic chronic viral
hepatitis. Histopathology 2001; 39: 66-73.
aging with histologic assessment as the reference standard. Invest
Radiol 2012; 47: 368-75.
31.Ayyappan AP, Jhaveri KS. CT and MRI of hepatocellular carcinoma: an update. Expert Rev Anticancer Ther 2010; 10: 507-19.
17.Choi JY, Lee JM, Sirlin CB. CT and MR imaging diagnosis and stag-
32.Sun HY, Lee JM, Shin CI, et al. Gadoxetic acid-enhanced magnetic
ing of hepatocellular carcinoma: part I. Development, growth, and
resonance imaging for differentiating small hepatocellular carcino-
spread: key pathologic and imaging aspects. Radiology 2014; 272:
mas (< or =2 cm in diameter) from arterial enhancing pseudole-
635-54.
sions: special emphasis on hepatobiliary phase imaging. Invest Ra-
18.International Working Party. Terminology of nodular hepatocellular lesions. Hepatology 1995; 22: 983-93.
19.International Consensus Group for Hepatocellular Neoplasia; The
International Consensus Group for Hepatocellular Neoplasia.
Pathologic diagnosis of early hepatocellular carcinoma: a report of
the International Consensus Group for Hepatocellular Neoplasia.
Hepatology 2009; 49: 658-64.
20.Park YN. Update on precursor and early lesions of hepatocellular
carcinomas. Arch Pathol Lab Med 2011; 135: 704-15.
diol 2010; 45: 96-103.
33.Taouli B, Ehman RL, Reeder SB. Advanced MRI methods for assessment of chronic liver disease. AJR Am J Roentgenol 2009; 193:
14-27.
34.Taouli B, Koh DM. Diffusion-weighted MR imaging of the liver. Radiology 2010; 254: 47-66.
35.Bartolozzi C, Battaglia V, Bozzi E. HCC diagnosis with liver-specific MRI: close to histopathology. Dig Dis 2009; 27: 125-30.
36.Hayashi M, Matsui O, Ueda K, et al. Correlation between the blood
21.Okuda K, Peters RL, Simson IW. Gross anatomic features of hepa-
supply and grade of malignancy of hepatocellular nodules associat-
tocellular carcinoma from three disparate geographic areas: pro-
ed with liver cirrhosis: evaluation by CT during intraarterial injec-
posal of new classification. Cancer 1984; 54: 2165-73.
tion of contrast medium. AJR Am J Roentgenol 1999; 172: 969-76.
22.Korean Liver Cancer Study Group. Pathology for prediction of liver. General rules for the study of primary liver cancer. Seoul: Korean Liver Cancer Study Group, 2004; 39-40.
23.Choi BI, Lee GK, Kim ST, Han MC. Mosaic pattern of encapsulated
hepatocellular carcinoma: correlation of magnetic resonance imaging and pathology. Gastrointest Radiol 1990; 15: 238-40.
24.Demirjian A, Peng P, Geschwind JF, et al. Infiltrating hepatocellular
carcinoma: seeing the tree through the forest. J Gastrointest Surg
2011; 15: 2089-97.
25.Edmondson HA, Steiner PE. Primary carcinoma of the liver: a
study of 100 cases among 48,900 necropsies. Cancer 1954; 7: 462-503.
37.Choi BI. Hepatocarcinogenesis in liver cirrhosis: imaging diagnosis.
J Korean Med Sci 1998; 13: 103-16.
38.Han JK, Eun HW, Kim SH. Radiologic findings of dysplastic nodule. Korean J Hepatol 2008; 14: 231-4.
39.Hanna RF, Aguirre DA, Kased N, Emery SC, Peterson MR, Sirlin
CB. Cirrhosis-associated hepatocellular nodules: correlation of histopathologic and MR imaging features. Radiographics 2008; 28:
747-69.
40.Trevisani F, Cantarini MC, Wands JR, Bernardi M. Recent advances
in the natural history of hepatocellular carcinoma. Carcinogenesis
2008; 29: 1299-305.
26.Bruix J, Sherman M; American Association for the Study of Liver
41.Aravalli RN, Cressman EN, Steer CJ. Cellular and molecular mech-
Diseases. Management of hepatocellular carcinoma: an update.
anisms of hepatocellular carcinoma: an update. Arch Toxicol 2013;
Hepatology 2011; 53: 1020-2.
87: 227-47.
27.Lee JM, Choi BI. Hepatocellular nodules in liver cirrhosis: MR
evaluation. Abdom Imaging 2011; 36: 282-9.
42.Thorgeirsson SS, Grisham JW. Molecular pathogenesis of human
hepatocellular carcinoma. Nat Genet 2002; 31: 339-46.
28.Zech CJ, Reiser MF, Herrmann KA. Imaging of hepatocellular car-
43.Ichikawa T, Sano K, Morisaka H. Diagnosis of pathologically early
cinoma by computed tomography and magnetic resonance imag-
HCC with EOB-MRI: experiences and current consensus. Liver
ing: state of the art. Dig Dis 2009; 27: 114-24.
Cancer 2014; 3: 97-107.
http://dx.doi.org/10.4132/jptm.2015.04.15
http://jpatholtm.org/


© Copyright 2026