
Document 142446
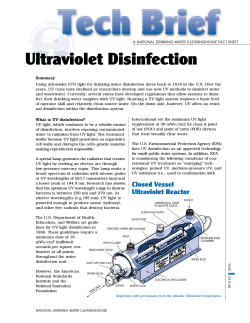
Hydrodynamic Cavitation: for Water Treatment Prof. Aniruddha B. Pandit Institute of Chemical Technology University of Mumbai INDIA Email: [email protected] 1 Nature also utilizes cavitation! • Use of Snapping Shrimp for actually visualizing hydrodynamic cavitation technique • Study carried out at University of Twente, The Netherlands, indicated that the Snapping shrimp throws a cavity, cavity which travels a certain distance and collapses. collapses Frontal View Top View 2 Confirmation by Experiments Measurements using hydrophone indicated that the pressure pulse generated at the collapse is capable of carrying out physical or chemical transformations (Versluis et al., Science, Vo. 289, 2114-2117 (2000)) 3 Replicate Nature !!! • Aim of hydrodynamic cavitation reactors will be to replicate this natural phenomena but at multiple locations simultaneously • Earlier investigations g dealing g with hydrodynamic y y cavitation have been mainly directed towards avoiding it e.g. cavitation erosion of propeller blades of ships • Concentrated efforts by few research groups worldwide have led to harnessing the positive effects of hydrodynamic cavitation 4 Principle of generation Orifice plate Turbulent b l fl fluctuating pressure ffield ld Hydrodynamic cavitation • • • Throttling valve Single hole orifice Multiple orifice plate • Venturi • High speed homogenizer 5 Key Effects in the Cavitating zone Localized intense Pressure & Temperature conditions highly reactive free radicals Concentrated energy at the location of transformation High intensity turbulence,, Increased transport coefficient Order of magnitude reduction in energy requirement for physical/ chemical transformation 6 Engineers Job Control the Phenomena and Use the Effects in Positive Way 7 Hydrodynamic Cavitation Reactors contd… Orifice Plate ¾ Reservoir ¾ Centrifugal Pump ¾ Orifice plate (different configurations in terms of number and diameter of the holes) ¾ Bypass line (for controlling the inlet pressure and the flow rate into the cavitation chamber) P1, P2 = Pressure Gauges; V1, V2, V3 = Control Valves ¾ Cooling water jacket Schematic representation for experimental setup for the orifice plate hydrodynamic cavitation reactor 8 Configurations of Orifice Plate An orifice plate is characterized by ¾ Free area (flow area) ¾ Perimeter of the holes (shear layer) 9 Hydrodynamic cavitation Applications ¾Enzyme recovery, Microbial cell disruption ¾Water & wastewater disinfection ¾Oxidation of pollutants 10 Enzyme recovery Cell Disruption ¾ Experiments with Invertase, Penicillin acylase and yeast Saccharomyces cerevisiae indicate ¾ orifice plate setup gives order of magnitude higher yields ¾ followed by High pressure homogenization & ¾ least is obtained for Sonication ¾ For equivalent protein concentrations in liquid, Magnitudes of energy inputs: ¾ Mixer-blender system = 900 J/ml ¾ Ultrasonic Horn = 1500 J/ml ¾ Pump setup (Hydrodynamic cavitation) = 15 - 20 J/ml 11 Enzyme recovery Cell Disruption The extent of cell disruption in cavitating flow loop increases with: ¾ an increase in the number of passes ¾ an increased pressure drop across the constriction ¾ an increased suspension temperature and ¾ a decreased biomass concentration Location factor is another important concept which decides the location of the desired enzyme in the cell and the type of cell breakage mechanism to be applied to get maximum results from the system 12 Enzyme recovery ¾ Extent of enzyme release for various cavitation numbers 35 Protein a-Glucosidase Invertase G6PDH %R Release 30 25 20 15 10 5 0 0 0.2 0.4 0.6 0.8 1 Cavitation Number Balasundaram & Harrison, Biotechnology and Bioengineering, 94(2) (2006), 303-311 13 Microbial disinfection Bore well water disinfection ¾ Pump with Power consumption of 5.5kW; Speed of 2900 rpm. ¾ The cavitating valve is ball type made of SS. ¾ 75 L of bore well water ¾ Discharge pressure used - 1.72, 3.44 and 5.17 bar ¾ Multiple hole orifice plate placed along the flow of liquid. ¾ The orifice plate had 33 holes of 1 mm diameter and the effective flow area was 25.92 mm2 14 Microbial disinfection contd.. Bore well water disinfection % Total co oliforms killed 100 80 60 5.17 bar 40 0 3.44 bar 1.72 bar 20 0 0 10 20 30 40 50 60 70 Time (mins) Time (Min) Effect of orifice plate on Total coliforms Initial count=50-65 Total coliforms/100ml, Vol. treated=75L 15 Microbial disinfection contd.. Bore well water disinfection 80 70 % Disinfection 60 50 40 30 20 10 0 Total coliforms 5 mg/l H2O2 Fecal coliforms Hydrodynamic cavitation (5.17 bar) Fecal streptococci Hydrodynamic cavitation (5.17 bar)+ 5 mg/l H2O2 Hydrodynamic cavitation coupled with H2O2 disinfection 16 Microbial disinfection contd.. Bore well water disinfection 100 90 80 % Dis sinfection 70 60 50 40 30 20 10 0 Total coliforms 2 mg/l O3 Fecal coliforms Hydrodynamic cavitation (5.17 bar) Fecal streptococci HPC Bacteria Hydrodynamic cavitation (5.17 bar)+ 2 mg/l O3 Hydrodynamic cavitation coupled with Ozone disinfection 17 Microbial disinfection contd.. Sea water disinfection Extent of killing of various microorganisms in multiple holes sharp edge orifice plate 100 Orifice plate 80 Destruction (%) Fraction of open area= 0.75 Flow rate = 1.3 lit/s Pressure = 3.2 kg/cm2 Hole dia. = 2 mm Pipe dia. = 21.5 mm 60 40 20 0 Zooplankton (> 50µ) Phytoplankton (> 10m) Bacteria (Associated with zooplankton) 18 Microbial disinfection contd.. Sea water disinfection Effect of operating parameters 100 Fraction of open area= 0.25 Hole Dia = 2 mm Pipe Dia = 21.5 21 5 mm Destruction (%) D 80 Orifice plate 60 40 20 0 1 2 3 Case Orifice velocity (m/s) Pressure (kg/cm2) Number of Recirculation (cumulative) Energy (kw.hr) Energy per unit volume (kJ/lit) 1 15.8 2 147 0.072 26.14 2 18.9 3 323 0.260 93.81 5 21.6 4 525 0.595 214.42 19 Oxidation of pollutants ¾ Hydrodynamic cavitation for oxidation of Nitro-phenols Kalumuck & Chahine, Journal of Fluids Engineering, 122 (2000), 465-470 20 Oxidation of pollutants contd… ¾ Hydrodynamic cavitation coupled with Fenton’s process Chakinala, Gogate, Burgess & Bremner, Ultrasonics Sonochemistry 15 (2008) 49–54 21 Oxidation of pollutants contd… ¾ Hydrodynamic cavitation for degradation of Chlorocarbons Wu, Ondruschka & Bräutigam, Chem. Eng. Technol., 30(5) (2007), 642–648 22 Modeling of Cavitation 23 Flow Solution to Bubble Dynamics equations Orifice Vena contracta Pressure P1 P2 P2 − PV Cv = 1 ρVO2 2 PV Distance downstream to orifice Pressure recovery with turbulence 24 Pressure fluctuations ¾ With turbulence P = Pv +½ D (Vo2 - Vtd2 ) - ∆P Vtd is the actual turbulent velocity at any point estimated as: Vtd = Vt + V’ sin (2π fT t) Vt is the average velocity at the point, V΄ is the RMS velocity, fT is the frequency of turbulence. V' fT = l dO + d P l = 0.08 2 25 Pressure Profiles using CFD Simulation of Flow field in the cavitation device gives pressure sensed by the cavity while moving through the flow domain 26 Pressure Profiles using CFD contd.. Radial distance along orifice (mm) 18 12 6 0 Paths taken by cavities -6 -12 -18 -20 0 20 40 60 Axial distance along orifice (mm) 80 Pressure sensed by the cavities 27 Single Bubble dynamics simulations Single Cavity Approach ¾ Use of Rayleigh Plesset Equation (Basic approach) d2R 3 dR 2 1 R( 2 ) + ( ) = ρl 2 dt dt 4 µ dR 2σ pi − R ( dt ) − R − p∞ ¾ Estimation of collapse Pressure Pcollapse Ro 3γ 2σ 4µ dR 2σ = ( po + )×( ) − − ( ) Ro R R R dt 28 Bubble dynamics model gives Instantaneous value of ¾ ¾ ¾ ¾ Radius Bubble wall velocity Bubble wall acceleration Pressure inside the bubble as the function of Liquid physicochemical properties Use above parameters for the Quantification of the collapse Pressure Pulse 29 Steady cavitation Pinlet = 11 atm; Gas fraction = 1.0; Orifice dia. = 0.6 mm; Pipe dia. = 38; Number of orifice = 1; Orifice velocity = 36 m/s; Ro = 10 µm; 30 Transient cavitation 800 Xg=1.00 Radius (icrometer) 700 Xg=0.75 600 Xg=0.50 500 Xg=0.25 400 300 200 100 0 0 500 1000 1500 Time (microsec) Pinlet = 3 atm; Orifice dia. = 1 mm; Pipe dia. = 38; Number of orifice = 33; Orifice velocity = 12 m/s; Ro = 10 µm; 31 Cavity collapses in multiple cycle Intensity of final cavity collapse is lower than the transient cavitation but higher than stable oscillatory cavitation. 32 Bulk Pressure (Pa) 40000 30000 20000 10000 0 -10000 0 200 400 600 -20000 Radius (micrometer) Hydrodynamic Cavitation: Transient cavitation -30000 400 300 200 100 0 -40000 0 Time (microsec) P Pressure Recovery R P Profile fil 600 C it Dynamics Cavity D i Profile P fil 3000 1200 2500 Pressure (atm) Temperature (K) 200 400 Time (microsec) 2000 1500 1000 500 0 1000 800 600 400 200 0 0 200 400 Time (microsec) Temperature profile 600 0 200 400 Time (microsec) 600 Collapse Pressure Profile 33 Typical Radicals formation profile at cavity collapse 1.0E+14 1.0E+12 Molecules 1.0E+10 1.0E+08 1.0E+06 1.0E+04 1.0E+02 1.0E+00 412 413 414 415 416 417 418 Time (microsec) H2 H O O2 OH H2 O N2 N2O Ro=10 µm, Xg=1.0 Pin=4 atm, do=1 mm, dp=38 mm, Cv = 1.0 34 Conclusion ¾ Strongly oxidizing OH radicals can degrade the chemical pollutants ¾ The high intensity shock waves are capable of disrupting a variety of aquatic microbes including pathogens ¾ Hydrodynamic cavitation for potable water disinfection coupled with conventional disinfection processes like chlorination, ozonation has allowed more than 2/3rd reduction in disinfecting chemicals usage ¾ Hydrodynamic cavitation reactors offer immediate and realistic potential for industrial scale applications ¾ Scale up is comparatively easier as vast amount of information about the fluid dynamics downstream of the constriction is readily available and the operating efficiency of the circulating pumps which is the only energy dissipating device in the system is always higher at large scales of operation. 35 Cavitation Research Group, UICT Prof A. B. Pandit Shirgaonkar I. Sivakumar M. Mrs. Jyoti K.K. Moholkar V. Gogate P. Kanthale P. Ajay Kumar Mahamuni N N. Senthil Kumar Vichare N. Tatke P. Alve V. Patil M. Gaikwad S. Mahulkar A. Balasubramanhyam A A. 36


© Copyright 2026