
2015 Proceedings - London Swine Conference
PROCEEDINGS of the LONDON SWINE CONFERENCE PRODUCTION TECHNOLOGIES TO MEET MARKET DEMANDS Edited by J.H. Smith April 1st and 2nd, 2015 London, Ontario www.londonswineconference.ca Proceedings of the London Swine Conference Production Technologies to Meet Market Demands A limited number of additional copies of these Proceedings are available for $25 each. The contents of this publication do not necessarily reflect the views of the editor(s) and the steering committee of the London Swine Conference, nor does mention of trade names, commercial products, or organizations imply endorsement. 2015 London Swine Conference and original authors ISBN 978-1-927026-04-5 ii London Swine Conference – Production Technologies to Meet Market Demands April 1and April 2, 2015 TABLE OF CONTENTS Chair’s Message ..................................................................................................................... v Steering and Technical Committees ..................................................................................... vi Sponsors ............................................................................................................................... vii Day 1: Sows – Main Sessions Some Views on the Nature of Science ................................................................................... 1 Joe Schwarz PED – A Canadian Update..................................................................................................... 5 Marty Misener PEDv and the Feed Supply Chain – Risk and Biosecurity .................................................. 11 Timothy Snider Electronic Sow Feeding (ESF) Considerations .................................................................... 13 Thomas D. Parsons Labour Challenges with Piglet Survivability ....................................................................... 25 Julie Menard Day 1: Sows – Workshop Sessions Production and Financial Performance of High-Producing Sow Farms .............................. 31 Thomas E. Stein Using Records and Data Mining to Troubleshoot Problems in Sow Barns ......................... 46 Marsha Van Dinther The New Canadian Code of Practice ................................................................................... 48 Jennifer Brown Practical Labour Tips to Improve Piglet Survivability ........................................................ 54 Julie Ménard Practical Labour Tips to Improve Piglet Survivability ........................................................ 58 Sylvia Meszaros Electronic Sow Feeding: Slat-Level Considerations .......................................................... 64 Thomas D. Parsons London Swine Conference – Production Technologies to Meet Market Demands April 1and April 2, 2015 iii Day 2: Wean to Finish – Main Sessions Trade Stops Here! How Trade Barriers Undermine Canada’s International Competitiveness ..........................70 Kathleen Sullivan The Structure of Ontario’s Hog Business in 10 Years..........................................................80 Blair Cressman and Bob Hunsberger Solving Health Problems with Genetics ...............................................................................84 Graham S. Plastow Are You Camera Ready? ......................................................................................................90 Terry L. Whiting Day 2: Wean to Finish – Workshop Sessions Dynamic Optimization of Production to Market Conditions..............................................108 Francis Simard Benchmarking 2013 Nursery, Finishing, and Wean-to-Finish Closeout Performance ......117 Tom Stein Making Wean to Finish Work ............................................................................................131 Mike Brumm Liquid Feeding: Don’t Let Microorganisms Control Your Profit ......................................135 Evelien van Donselaar Raising Nursery Pigs Without Antibiotics..........................................................................141 Rich van Donkersgoed Troubleshooting with New Technology .............................................................................143 Mike Brumm Troubleshooting for Optimum Nursery and Finisher Barn Performance ...........................149 John Otten Managing Immunity ...........................................................................................................153 Vahab Farzan, Kees de Lange and Brandon N. Lillie iv London Swine Conference – Production Technologies to Meet Market Demands April 1and April 2, 2015 CHAIR’S MESSAGE London Swine Conference – Production Technologies to Meet Market Demands April 1and April 2, 2015 v STEERING COMMITTEE Conference Committee Doug Ahrens, Ontario Pork (Chair) Jaydee Smith, Ontario Ministry of Agriculture, Food and Rural Affairs (Vice-Chair) Bob Friendship, University of Guelph David Hartney, Ontario Pork Industry Council Lori Moser, Ontario Pork Industry Council Doug Richards, Ontario Ministry of Agriculture, Food and Rural Affairs Jean Howden, Ontario Pork Greg Simpson, Hypor Inc Ed Barrie Sponsorship Coordinator – Linda Weitzel, Ontario Pork Industry Council Program Coordinator – Bev DeVries, Ontario Pork Industry Council Registration Coordinator – Sandra McCann, OMAFRA Technical Committee Stewart Cressman (Chair) Greg Simpson, Hypor Inc (co-Chair) Robert Friendship, University of Guelph Kees de Lange, University of Guelph Jean Howden, Ontario Pork Jaydee Smith, OMAFRA Doug Richards, OMAFRA Technical Committee Industry Contributors Beunen, Rick, Topigs-Norsvin Bodenham, Mark, Masterfeeds Cressman, Stewart, Ontario Pork de Lange, C.F.M, University of Guelph DeVries, Stuart, Total Swine Genetics Durand, Jody, Phibro Friendship, Robert, University of Guelph Hartney, Dave, ShurGain/Nutreco Howden, Jean, Ontario Pork Jafarikia, Mohsen, CCSI Johns, Steve, Zoetis Lackey, Ron, OMAFRA Lichty, Jennifer, Hensall Coop Richards, Doug, OMAFRA Sanford, Ernie, Bohringer-Ingelheim Simpson, Greg, Hypor Smith, Jaydee, OMAFRA Smith, Roger, JEFO Squire, Jay, Wallenstein Feed and Supply Vsetula, Carolyn, Zantingh Direct Woods, Drew, Shurgain/Nutreco vi London Swine Conference – Production Technologies to Meet Market Demands April 1and April 2, 2015 SPONSORS London Swine Conference – Production Technologies to Meet Market Demands April 1and April 2, 2015 vii Day 1: Sows – Main Sessions viii London Swine Conference – Production Technologies to Meet Market Demands April 1and April 2, 2015 SOME VIEWS ON THE NATURE OF SCIENCE Joe Schwarcz Director, Office of Science and Society McGill University, Montreal, Quebec Email: [email protected] 1. Science is a process used to search for the truth. It is not a collection of unalterable “truths.” It is, however, a self-correcting discipline. Such corrections may take a long time; bloodletting went on for centuries before its futility was realized. But as more scientific knowledge accumulates, the chance of making substantial errors decreases. 2. Certainty is elusive in science and it is often hard to give categorical “yes” or “no” answers to many questions. To determine if bottled water is preferable to tap water, for example, one would have to design a lifelong study of two large groups of people whose lifestyle was similar in all respects except for the type of water they consumed. This is virtually undoable. We therefore often have to rely on less direct evidence for our conclusions. 3. It may not be possible to predict all consequences of an action, no matter how much research has been done. When chlorofluorocarbons (CFCs) were introduced as refrigerants, no one could have predicted that thirty years later they would have an impact on the ozone layer. If something undesirable happens, it is not necessarily because someone has been negligent. 4. Any new finding should be examined with skepticism. A skeptic is not a person who is unwilling to believe anything. A skeptic, however, requires scientific proof and does not swallow information uncritically. 5. No major lifestyle changes should be made on the basis of any one study. Results should be independently confirmed by others. Keep in mind that science does not proceed by “miracle breakthroughs” or “giant leaps.” It plods along with many small steps, slowly building towards a consensus opinion. 6. Studies have to be carefully interpreted by experts in the field. An association of two variables does not necessarily imply cause and effect. As an extreme example, consider the strong association between breast cancer and the wearing of skirts. Obviously, the wearing of skirts does not cause the disease. Scientists, however, sometimes show a fascinating aptitude for coming up with inappropriate rationalizations for their pet theories. 7. Repeating a false notion often does not make it true. Many people are convinced that sugar causes hyperactivity in children-not because they have examined studies to this effect but because they have heard that this is so. In fact, a slate of studies has demonstrated that if anything, sugar has a calming effect on children. 8. Nonsensical lingo can sound very scientific. An ad for a type of algae states that “the molecular structure of chlorophyll is almost the same as that of hemoglobin, which is responsible for carrying oxygen throughout the body. Oxygen is the prime nutrient and chlorophyll is the central molecule for increasing oxygen available to your system.” This is nonsense. Chlorophyll does not transport oxygen in the blood. London Swine Conference – Production Technologies to Meet Market Demands April 1and April 2, 2015 1 9. There will often be legitimate, opposing views on scientific issues. But the impression that science cannot be trusted because "for every study there is an equal and opposite study" is incorrect. It is always important to examine who carried out a study, how well it was designed and if anyone stood to gain financially from the results. One must be mindful of who is the “they” in “they say that...” In many cases what “they say” is only gossip, inaccurately reported. 10. Humans are biochemically unique. Not everyone exposed to a cold virus will develop a cold. Response to medications can be dramatically different. Eating fish can healthy for many but deadly to those with an allergy. 11. Animal studies are not necessarily relevant to humans although they may provide much valuable information. Chocolate, for example, is safe for humans but is toxic to dogs. Rats do not require vitamin C as a dietary nutrient but humans of course do. Feeding high doses of a suspected toxin to test animals over a short term may not accurately reflect the effect on humans exposed to tiny doses over the long term. 12. Only the dose makes the poison, only the dose makes the cure. It does not make sense to talk about the effect of substances on the body without talking about amounts. Licking an aspirin tablet will do nothing for a headache but swallowing two tablets will make the headache go away. Swallowing a whole bottle of pills will make the patient go away. 13. “Chemical” is not a dirty word. Chemicals are the building blocks of our world. They are not good or bad. Nitroglycerine can alleviate the pain of angina or blow up a building. The choice is ours. Furthermore, there is no relation between the risk posed by a substance and the complexity of its name. Dihydrogen monoxide after all, is just water. 14. Nature is not benign. The deadliest toxins known, such as ricin from castor beans or botulin from the Clostridium botulinum bacterium are perfectly natural. “Natural” does not equate to safe and “synthetic” does not mean dangerous. The properties of any substance are determined by its molecular structure, not by whether it was synthesized in the laboratory by a chemist or by nature in a plant. 15. Perceived risks are often different from real risks. Food poisoning from microbial contamination is a far greater health risk than trace pesticide residues on fruits and vegetables. 16. The human body is incredibly complex and our health is determined by a large number of variables which include genetics, diet, the mother’s diet during pregnancy, stress, level of exercise, exposure to microbes, exposure to occupational hazards and luck! 17. While diet does play a role in health, the effectiveness of specific foods or nutrients in the treatment of diseases is usually overstated. Individual foods are not good or bad, although overall diets can be described as such. The greater the variety of food consumed, the smaller the chance that important nutrients will be lacking in the diet. There is universal agreement among scientists that increased consumption of fruits and vegetables is beneficial. 18. The mind-body connection is an extremely important one. About 40% of people will improve significantly when given a placebo and about the same percentage will exhibit symptoms in response to a substance they perceive as dangerous. The mind is capable of making a heaven of hell, and a hell of heaven. 2 London Swine Conference – Production Technologies to Meet Market Demands April 1and April 2, 2015 19. About 80% of all illnesses are self-limiting and will resolve almost no matter what kind of treatment is being followed. Often a remedy receives undeserved credit. Anecdotal evidence is unreliable because positive results are much more likely to be reported than negative ones. 20. There are no geese that lay golden eggs. In other words, if something sounds too good to be true, it probably is. As H.L. Mencken said, “Every complex problem has a solution that is simple, direct, plausible, and wrong.” 21. Virtually any subject or issue that arises gets more interesting and more complicated on deeper examination. Ours is a fascinating world. 22. Physicians and researchers do not try to hide effective therapies from the public for monetary gain. But peddlers of “natural therapies” often overhype their wares for monetary gain. 22. Nobody has a monopoly on being right. As Will Rogers said, “everybody is ignorant, only on different issues.” London Swine Conference – Production Technologies to Meet Market Demands April 1and April 2, 2015 3 4 London Swine Conference – Production Technologies to Meet Market Demands April 1and April 2, 2015 PED – A CANADIAN UPDATE Martin Misener South West Ontario Veterinary Services 219 Oak Street Stratford, Ontario N5A 8A1 Email: [email protected] ABSTRACT Porcine Epidemic Diarrhea (PED) was first identified in Canada January 22, 2014. Since that first case, two strains of PEDv and Porcine Delta Coronavirus (PDCoV) have been identified. Four provinces, Ontario, Quebec, PEI and Manitoba have had cases on farms. The following information is an update, describing the PED and associated coronavirus situation in Canada as of March 2015. PEI The first case of PED in PEI was identified in February 2014. This was a farrow to finish farm with excellent biosecurity and was infected via feed containing contaminated porcine plasma proteins. As of October 2015 this farm has tested negative and has successfully eliminated PEDv (Personal communication with Dr. Dan Hurnik). PEI is Canada’s first province to eliminate PED. There are no positive cases in any of the other Maritime provinces. QUEBEC The first case of PED in Quebec was identified in February 2014 (Table 1). Quebec reports every site that tests positive, unlike Ontario where new infections are reported as cases and sites infected by pig flow are not officially tracked. In the authors opinion the Quebec methodology is more helpful for containment efforts and should be used in Ontario. Table 1. Current PED situation in Quebec (provided EQSP). Number of Sites Date Site Declared PED Positive by EQSP Region Production Type Current PED Status (as of February 5, 2015) #1 February 22, 2014 Région de Granby, Finishing Negative Montérégie #2 November 6, 2014 Montérégie Finishing Positive #3 January 5, 2015 St-Denis-sur-Richelieu, NurseryFinish Positive Nursery Positive Finishing Positive Montérégie #4 January 5, 2015 St-Denis-sur-Richelieu, Montérégie #5 January 7, 2015 St-Denis-sur-Richelieu, Montérégie (related to pig movement) London Swine Conference – Production Technologies to Meet Market Demands April 1and April 2, 2015 5 #6 January 8, 2015 St-Aimé, Nursery Positive Nursery Positive Nursery Positive Sow Farm Positive Finishing Positive Montérégie #7 January 9, 2015 St-Aimé, Montérégie #8 January 12, 2015 St-Liboire, Montérégie #9 January 12, 2015 St-Hugues, Montérégie # 10 January 17, 2015 Montérégie Ouest (related to pig movement) # 11 February 5, 2015 St-Denis-sur-Richelieu, Finishing Montérégie # 12 February 5, 2015 Granby, Positive (related to pig movement) Finishing Montérégie Positive (related to pig movement) Quebec has also been very aggressive with environmental sampling. The sampling has been used to provide surveillance and then trace back of positive events. It has also been done to identify transmission risks. Over 40,000 samples have been taken. Quebec 2014 Environmental Sampling Results Overview • More than 35 000 test results reported • All PDCoV test results were negative • PCR positive on PEDv: • On trucks and/or docks: at 5 different abattoirs • On trucks : 25 (3 from Québec and 22 from Ontario) • On farm (loading docks) : 2 • Washing stations : 2 • Assembly yards : 1 • On feed ingredients (5 different feed mills): § 6 lots of meat meal § 3 lots of swine protein (4 tests) Quebec 2015 Environmental Sampling Results Overview PED • • • 6 Unloading docks (slaughter plants): 52 positive tests; 13 events Trucks tested at slaughter plants: 18 positive tests; 12 events (7 Québec and 11 Ontario) Swine feed ingredients : 1 positive on swine meal/protein London Swine Conference – Production Technologies to Meet Market Demands April 1and April 2, 2015 PDCoV • Unloading docks and trucks at slaughter plants : all results negative • Delta Coronavirus has not been found in Quebec. ONTARIO The first case of PED was identified January 22, 2014. Up to and including February 20, 2015 there have been 76 cases reported. As mentioned earlier sites exposed through pig flow are not recorded but it is estimated that over 150 pig sites become PED positive due to pig flow from the 76 cases. 17 cases have been linked to infected feed. The infected feed exposure resulted in a much bigger foot print of positive sites in Ontario and therefore made early containment a bigger challenge. Contaminated trucks have since been the predominant means of disease spread. Two strains of PEDV have been identified in Ontario and Delta Coronavirus has and continues to be involved with some active cases. The Ontario Swine Health Advisory Board (OSHAB) is conducting an Area Regional Control and Elimination (ARC&E) effort for PED and related coronaviruses. OSHAB PED ARC&E UPDATE Number of PED Positive Sites in Ontario As of February 20, 2015 there are 108 sites enrolled in the PED/PDCoV ARC&E. These numbers include 44 of the 76 primary cases of PED in Ontario (Table 2). Of the 108 sites enrolled in the ARC&E, 4 of them are infected with Porcine Delta Coronavirus (PDCoV) only. The remaining 60 sites were considered presumed positive due to pig flow based on veterinary notification and/or testing, enrollment details can be seen in Table 3. Based on numbers provided by the veterinarians of record, it is estimated that approximately 25,000 sows have been impacted by PED in Ontario. PED Elimination Progress Guidelines to establish Presumed Negative PED Site Status at previously positive sites have been developed by OSHAB and can be seen at prrsarce.ca/arce-resources. These criteria have been used to assess elimination success. To date, 82 sites or 76% of the sites enrolled in the OSHAB ARC&E have eliminated PED and/or PDCoV. Elimination by site type is presented in Figure 1. This leaves 26 sites out of 108 enrolled in the ARC&E still working towards elimination with a number of new cases included in this number (Figure 2). Table 2. Summary of the primary PED cases enrolled in the OSHAB ARC&E. PRIMARY CASES TOTAL # Cases enrolled in the PED ARC&E 44 Current Presumed Negative 32 % Presumed Negative 73% London Swine Conference – Production Technologies to Meet Market Demands April 1and April 2, 2015 7 Table 3. Summary of all PED and PDCoV cases enrolled in the OSHAB ARC&E. TOTAL SITES TOTAL # Sites enrolled in the PED ARC&E 108 Current Presumed Negative % Presumed Negative 82 76% Figure 1. PED eliminations by farm type. New and Active PED Sites Enrolled in the OSHAB ARC&E as of February 20, 2015 There are currently 26 sites enrolled in the ARC&E that are still actively working on control, containment and elimination of PED and porcine delta coronavirus (PDCoV); this includes some of the new cases seen in recent months. Review of the biosecurity and case details associated with the 11 new cases to date in 2015 suggest that many of them may have been attributed to transport related issues. Ontario Pork is testing trailers at packing plants and with over 1500 tests trace back has not resulted in any unknown positive farms. 8 London Swine Conference – Production Technologies to Meet Market Demands April 1and April 2, 2015 Figure 2. Illustration of the PED/DCoV status of the sites enrolled in the ARC&E. MANITOBA To date there have been 5 farms infected with PED, and 3 assembly yards. The province has done extensive surveillance sampling and the second case was found through trace back. All 5 sites are working towards elimination and the focus provincially is containment in high traffic assembly points until reintroduction risks have better controls. SASKATCHEWAN, ALBERTA AND BC. Surveillance sampling has identified some virus (a questionable Delta coronavirus in Sask. that may be a bird strain and a PED isolate in Alberta not associated with positive pigs). To date there are no positive cases in these provinces. DISCUSSION AND CONCLUSIONS So far the Canadian PED story is a good news story. The epidemic has not mirrored the one in the United States. It is estimated that over 50% of the U.S. sow herd has been exposed while less than 1% of the Canadian sow herd has been exposed. There are some explanations. Canada has focused control, containment and elimination efforts on all phases of pork production while the US focus was primarily on sow herds. The feed risk was identified very early in the Canadian epidemic and measures were taken to reduce this risk. High risk points of contact have been contained more effectively and because growing pig sites have been identified packing plant contamination has been more manageable. Finally, the Canadian industry had almost a year to prepare after the disease had entered the U.S. What’s next? By the time this information is presented we will have a much clearer picture as to how many active sites there will be heading into the warmer months. It would London Swine Conference – Production Technologies to Meet Market Demands April 1and April 2, 2015 9 be useful to record site status not just cases. In Ontario, Quebec and Manitoba one of the main hurdles to provincial elimination is contamination of assembly yards. To initiate efforts to eliminate virus at these sites we first must control against reinfection. High risk returning trucks from U.S. must have a sanitation solution. Recent work with baking contaminated trailers may be part of this solution. Also change of site status on farms will require speed and accurate diagnosis to allow for diversion of cull animals away from negative assembly yards. We have successfully eliminated PED from all kinds of herds and all kinds of facilities (including farrow to finish and solid floor straw bedded facilities) so whatever the case load is in April there will be less positive sites by October 2015. 10 London Swine Conference – Production Technologies to Meet Market Demands April 1and April 2, 2015 PEDV AND THE FEED SUPPLY CHAIN – RISK AND BIOSECURITY Timothy Snider Health Assurance Veterinarian, PIC North America 100 Bluegrass Commons Blvd Ste 2200, Hendersonville, TN 37075 Email: [email protected] INTRODUCTION The role of contaminated feed in the transmission of Porcine Epidemic Diarrhea Virus (PEDV) has been the trigger for several research projects and industry wide speculation since its emergence in the USA in April 2013. The emergence of the PEDV in Canada, in January 2014, intensified the focus upon ingredients of porcine origin as a contaminant that could transform swine feed and the components of swine feed (e.g. basemix) into a fomite that might facilitate the transmission of infectious pathogens into non-positive swine herds (i.e. naïve and negative). In addition to the risks associated with both ingredients of porcine (i.e. rendered, spray dried, and hydrolyzed products) and non-porcine (i.e. non porcine animal based ingredients, plants, microbial culture, mining, and synthetic) origin, other risks have been identified within the swine feed supply chain. A specific focus has been the biosecurity risks associated with the manufacturing and distribution of both feed ingredients and feed. Veterinarians and other swine industry professionals have been asked to assess these risks and make recommendations on their management. Dr. Snider’s presentation will focus upon the feed supply chain research projects he took part in as a past member of the faculty at the University of Minnesota as well as his field work as a breeding stock health assurance veterinarian. RESOURCES Sampedro, F et al. Jan 2015. Risk assessment of feed ingredients of porcine origin as vehicles for transmission of Porcine Epidemic Diarrhea virus (PEDv). 2014 National Pork Board Project 14-164. Snider, T et al. Mar 2015. Biological Hazard Analysis and Biosecurity Assessment for Feed Manufacturing and Distribution in the Swine Feed Supply Chain. 2015 AASV Proceedings. Stevenson GW et al. 2013. J VET Diagn Invest 25: 649. USDA - Entry Assessment for Exotic Viral Pathogens of Swine. July 2013. London Swine Conference – Production Technologies to Meet Market Demands April 1and April 2, 2015 11 12 London Swine Conference – Production Technologies to Meet Market Demands April 1and April 2, 2015 ELECTRONIC SOW FEEDING (ESF) CONSIDERATIONS Thomas D. Parsons School of Veterinary Medicine, University of Pennsylvania 382 West Street Road, Kennett Square, PA 19348 E-mail: [email protected] ABSTRACT Our work has focused on the implementation of electronic sow feeding (ESF) on commercial farms in the US and Canada. Today over 150,000 sows on 65 farms are being feed via an ESF based on the system that we prototyped at the University of Pennsylvania almost 15 years ago. We have employed a variety of approaches to ESF including static vs dynamic pens and pre- vs post-implantation group formation. These choices were dictated by farm specific details and none were found to preclude outstanding production. We have identified several opportunities associated with the implementation of electronic sow feeding for the improvement of sow herd nutrition and management. This includes improved feed utilization by the reduction of feed needed to maintain individual animal body condition, better matching of feed delivered to changing nutritional needs of sow during gestation through the use of software controlled feeding curves, automated control of gilt estrus via the delivery of Matrix to selected individual animals feeding in the ESF station, and a practical solution to regulating the amount and timing of a feedback program in pen gestation to stimulate immunization against autogenous pathogens. The electronic identification of the sows via an RFID tag also opens the door for additional digital management of the herd such as spray marking of animals requiring vaccination or selection of animals to move to farrowing. However, these advantages of ESF cannot be captured without some forethought on how the barn will be staffed, how these people will be trained, and gilts will enter the herd both at start-up and for the rest of the life of the ESF facility. Taken together though, we see ESF as the only alternative to the gestation stall that can be a tool for producers to both advance the management and improve the economics of their herd. INTRODUCTION Scientific evidence remains equivocal with regard to what is the best way to house gestating sows1,2. However, 9 U.S. states have joined the precedent of the European Union and instituted legislation to phase out the use of gestational stalls. Recently (24 months) upwards of sixty large national companies in the retail and food service industry have pledged to eliminate gestation stalls from their supply chain over a 5 to 10 year time horizon. Over the same time period, several packers have also committed to moving some or all of their company owned sows out of stalls and in some instances have also signaled a similar intention for those that supply them with fat hogs. Furthermore in Canada, a new codes of practice was released in July of 2014 that also places restrictions on the use of gestation stalls. If a producer plans to build new sow facilities and/or plans to stay in the business long enough to re-capitalize their existing sow facilities, they will likely need to confront the decision about whether to continue to work with gestation stalls or explore what is the best option for pen gestation. There are several viable alternatives to the gestation stall for sow housing and feeding, each with its unique strengths and weaknesses. Consulting veterinarians, educators, extension agents and other advisers must recognize the importance of identifying the option that best matches the needs and abilities of a particular producer. London Swine Conference – Production Technologies to Meet Market Demands April 1and April 2, 2015 13 Many producers are expressing concern, anxiety and frustration given the possibility of having to transition from gestation stalls to pen gestation. The goal of this paper is to address both some of the advantages and challenges associated with implementing electronic sow feeding (ESF), an alternative to the gestation stalls. EXPERIENCE WITH ELECTRONIC SOW FEEDING In 2001, ESF was implemented at the University of Pennsylvania School of Veterinary Medicine’s Swine Center. The facility was built for teaching veterinary students and to provide a demonstration herd for alternatives to the gestation stall. By 2005, the basic model that was prototyped at the Swine Center was being implemented with our guidance on commercial herds. Today, our ESF system is feeding of over 150,000 sows on 65 farms across the US and Canada. The farms range in size from 100 to 10,000 sows, utilize a variety of common genetic suppliers, and are either family-owned and operated or company-owned and run with hired labor. The best farms are pushing above 30 pigs weaned per sow per year, which for most US genetics is exemplary. Larger production systems with conventional barns that have implemented ESF provide the opportunity to compare results between stalls and ESF under relatively similar conditions (same genetics, nutrition, and management). Such comparisons typically reveal that the ESF barns are doing as well or in some cases better than the conventional stall barns. Thus, ESF if properly managed is not a barrier to outstanding production. STRATEGIES FOR IMPLEMENTING ESF There are several strategies for the implementation of ESF based on the availability of existing facilities and or access to ground for new construction. We conceptualize this opportunities into three types of projects: new construction, expansion or renovation. Table 1 summarizes the relative proportion of each type of project for which we have been involved. New construction typically offers the best end result as you have total control over the footprint of the barn and can design the gestation area without compromise. However, this option requires the availability of appropriately permitted land for construction. Expansion is most often used when an existing stalled barn is not totally depreciated or defunct and there is adjacent land available for building. If the herd size is expanded then the existing crates can be used as post-implantation stalled housing for gestating sows prior to moving to a pen situation in the newly constructed addition. However, not all farms may have the luxury of expanding their herd and a market for more piglets. Finally, renovation or retrofitting is used when it is impossible to expand the foot print of the gestation building. It always requires some degree of compromise when laying out the gestation area as existing attributes of the building may not be changeable (or at least not in an affordable way). Location of solid areas of flooring would be the most common example of compromise encountered when converting a partially slatted stall barn to ESF. Table 1. Proportions of strategies used for implementation of ESF. Project Type New construction Expansion Renovation 14 % of Farms 35 27 38 % of Sows 31 48 21 London Swine Conference – Production Technologies to Meet Market Demands April 1and April 2, 2015 FLOW OF ANIMALS IN ESF BARN There are also several different ways to organize the flow of animals through an ESF barn. Our producers have implemented a variety of different combinations of both group structure and timing of group formation. These different options are briefly described here. Group Structure Static – Group is constituted once, social hierarchy stabilizes, and the group is left intact for the duration of gestation. Both fallout and the fact that stable groups are an all-in-all out system impede optimal space utilization of the facility, but static groups can simplify the management paradigms. Dynamic – Group constituency is constantly changing. Essentially it is a continuous flow system and hence space utilization can be optimized. Works much better with a large group as the turnover of animals would be disruptive to the social order if it were strongly established. Goal is to remove and replace 10 to 20% of the group size on a weekly or bi-weekly basis. Thus, the physical integrity of the breeding group is degraded as multiple stages of gestation are housed in the same pen. This will require some adjustments to management protocols. Timing of Group Formation Pre-Implantation – Sows are crated after weaning and bred in the stalls. Groups are constituted as soon as animals are out of standing heat. This spares sows the potential of injury if they were allowed to ride each other while in heat. Fertilized eggs are still free floating as they migrate down the Fallopian tubes into the uterus prior to the onset of implantation. Any physical skirmishes that might be expected during the formation of a new group do not negatively impact the free floating embryos prior to implantation. This systems works well with large groups as the social hierarchy within the group is minimal and any repeat breeders can simply be rebreed and left in place. There is a limited time window during which to move these animals and reproductive losses can be incurred if the farm is not religous about moving bred animals out of stalls into crates. However, these barns often achieve a higher level of success with pen management as essentially all the gestating herd is housed in pens. Post-Implantation – Sows are crated after weaning and bred. Groups are constituted only after being confirmed pregnant at ~35 days. Implantation is complete before mixing sows, minimizing the possible reproductive negative impact. This approach is initially attractive as it leaves the basic reproductive management of the sow unaltered from a crated barn and physical integrity of breeding group can be left intact if farm size is large enough. More than 1/3 of the animals are housed in crates at any one time. Trends Over the 10 years that we have been working with producers on implementing ESF on commercial farms some trends have emerged (Figure 1). Average farm size has more than double as our ESF system became more accepted and subsequently implemented by larger farms. As expected during this same time period the percentage of the number of sows housed in static pens increased. The ability to capture the advantages of static pens requires a large enough farm to have at least enough animals in breeding group to fill a pen and effectively utilize a single feeder. In our experience this is somewhere between a farm London Swine Conference – Production Technologies to Meet Market Demands April 1and April 2, 2015 15 size of 1200 and 2400 sows depending upon how the gilts are managed on the farm. Also during this same time period we saw the percentage of the number of sows subjected to pre-implantation group formation drop dramatically. The high percent of pre-implantation sows in the early days was related to a desire by these early innovators to participate in niche markets that required the amount of time that a sow was crated to be minimal. As farm size increased, it became more common to see post-implantation group formation coupled with static pens. However, it is important to realize these choices are farm specific and that none of these approaches superimpose limitations on success. Figure 1. Trends in commercial farms implementing ESF. ADVANTAGES OF ESF Feed Utilization ESF provides the opportunity for true individual animal nutrition. How common is it to find in a stalled gestation barn a thin sow between two over-conditioned sows? And unfortunately the solution is often to feed the under conditioned sow more and provide additional feed for the over conditioned neighbors to steal. With ESF, the sows enter the feeder one at a time. The feed is dropped in small portions (typically ~100 grams per drop) and in rapid succession (10-15 seconds between drops). The presence of the RFID tag is checked by the computer before each feed drop and this process of checking and feeding recurs until the sow reaches her allotment for the day or leaves the station. This insures each sows gets their feed allotment for the day. Several of our farms report between 0.25 16 London Swine Conference – Production Technologies to Meet Market Demands April 1and April 2, 2015 and 0.50 lbs a day per sow feed savings compared to their crated barns. For a 5,000 sow unit this would approach 0.5 to 1.0 ton a day feed savings. It is interesting to note that this is in contrast to what has been observed for another gestation stall alternative, floor drop feeding in small pens with stanchions. There an increase in feed utilization of 0.25 to 0.50 lbs per day per sow is reported compared to crated barns. The feed savings associated with ESF systems represents a real opportunity to reduce the operating costs of sow gestation and is likely realized by a variety of factors. Improved feed utilization results from being able to deliver the feed to only one sow for which it is intended, less wastage of feed as the sow is not in a competitive feeding environment, and improved ability to match the feed fed to the nutritional needs of the sow (see next section). Meeting the Nutritional Needs of the Sow Today, how sows are fed in gestation is limited by our ability to make mechanical adjustments to an individual animal’s feed box. This impacts both our ability to match feed delivered to the body condition of individual sows as well as adjust feed quantity provided on different days of gestation. With ESF body condition adjustments can be automated. The software is configured with a body condition score-parity matrix that specifies for any given combination of parity and body condition score what percentage of the sow’s daily allotment will be feed (Table 2). Table 2. Example of a body condition score-parity matrix used with ESF. Body Condition Score 1.5 2.0 2.5 3.0 3.5 4.0 4.5 1 123 117 111 105 100 95 90 2 121 114 107 100 95 90 85 Sow Parity 3 4 121 121 114 114 107 107 100 100 95 95 90 90 85 85 5 124 116 108 100 95 90 85 6+ 130 120 110 100 95 90 85 All values are expressed as a percentage of the standard feed curve. We recommend that while the sow is still standing in a breeding crate, but prior to moving to a pen, her RFID tag is scanned with the ESF system’s handheld computer/tag reader to confirm both the presence and the functionality of the tag. At this time the animal should be body condition scored and that information entered into the handheld device. Once the handheld is synched to the main ESF computer system, condition score is correlated with her parity to determine her daily feed allotment in the ESF system. Systematic condition score checks throughout gestation, usually coupled with other management activities in the pen, are used to optimize the amount of feed that a sow is receiving. The ease with which feed amounts can be adjusted to meet different body condition scores provides the vehicle for increased feed savings that result from the optimization of supplying the right amount of feed to the right animal. Pregnancy is a dynamic physiological state that would be best managed by having a similarly dynamic nutritional program that address the changing needs in terms of both London Swine Conference – Production Technologies to Meet Market Demands April 1and April 2, 2015 17 feed quantity and feed composition. Nutritional research on these topics has been likely limited by the practical constraint of changing feedboxes during gestation. ESF now lifts that constraint and demands a more detailed information on how best to feed sows during different stages of gestation. The use of multiple feed dispensers on the electronic sow feeder allows for dynamic changes in diet composition either by blending different ratios of complete feed or by top-dressing specific supplements in small quantities such as lysine at specific times in gestation. We have largely focused the implementation of simple feed curves that provide different quantities of feed for different days of gestation. An example is shown in Figure 2 (black line). The salient feature of this feed curve include: 1) 0 to 4 days, feed is dropped to reduce protein levels during early embryonic life3,4; 2) 5 to 74 days is a period for the adjustment of body condition where this level is increased or decreased if the animal’s body condition score deviates from a 3.05,6; 3) 75 to 90 days feed is reduced to enhance mammary tissue development7; 4) and on day 91 feed is increased to capture rapid fetal growth8,9; 5) at day 112 feed is reduced in anticipation of farrowing10,11. Another interesting facet of ESF is that changes in feed quantity do not need to be abrupt. It is trivial to obtain a 2.5 pound bump in feed over a 10 day period by instructing the software to increase the amount of feed fed by 0.25 pounds per day. The feed curve described here is in contrast to the previous curve (Figure 2-gray line) used on this farm in their crated facilities where there was a 1 pound bump at 80 days and another at 1 pound bump at 90 days. The latter curve was originally used in the ESF barns and resulted in sows becoming over conditioned. The total feed savings between these two curves from day 4 to 112 of gestation is 35.25 pounds or 0.33 pounds per sow per day. The subsequent improvements in body condition resulted in increased farrowing ease and increased feed intake during lactation12,13. Figure 2. A sow feeding curve (see text for explanation). 18 London Swine Conference – Production Technologies to Meet Market Demands April 1and April 2, 2015 Digital Management of the Herd The electronic identification of the sows via an RFID tag also opens the door for additional digital management of the herd such as spray marking of animals requiring vaccination or selection of animals to move to farrowing. Most ESF systems provide the opportunity to selectively dispense to individual animal at specific times as a top dressing to their feed small quantities of medications or nutritional supplements. We have utilized this microdoser feature of ESF to automate estrus control and autogenous material feedback in our ESF barns. Estrus Control - A critical element in a highly productive herd is the appropriate management of a gilt pool to insure that regular farrowing targets are achieved. Oral progesterone analogs such as altrenogest (Matrix, Intervet) when dosed daily to individual animals have been employed to control the female pig’s reproductive cycle and synchronize inseminations to meet breeding targets and efficiently fill farrowing rooms. Group housing greatly complicates the administration of these synchronization programs. However, this challenge is remedied by the addition to an electronic sow feeder of a microdoser suitable for dispensing small quantities such as required by pharmaceutical agents. Computer control of this device promises to provide the opportunity to synchronize the estrous cycle and farrowings of selective animals within group housing as we have recently reported.14 A total of 95 gilts were feed Matrix (Intervet) daily for 14 days via a small quantity dispenser on an electronic sow feeding (ESF) system. Gilts were observed for estrus and bred during a 4 to 9 day window following cessation of Matrix administration. Gilts were scanned trancutaneously to image both the ovaries and uterus prior to first Matrix feeding; the last day of Matrix feeding; and twice daily during estrus. After determining the linear range over which the micro-dosers dispensed, different dilutions of liquid Matrix in a dry feed carrier were compared to insure flow-ability through the dispenser. A final dose of 35 ml of Matrix per pound of feed was used and dispensed for ~15 sec to supply 15 mg of altrenogest per animal per treatment day. A subset of 15-20 animals in a pen of ~60 gilts were administered Matrix via the electronic sow feeder and this treatment regime was repeated with 5 separate groups of gilts. Seventy-eight gilts or 82% exhibited estrus 4 to 9 days following the last dose of Matrix and reflected a significant degree of synchronization when compared to randomly cycling gilts (Figure 3, X2 = 55.3, p<0.001). The onset of estrus from last treatment had a mean interval of 5.8 +/- 0.2 days. These animals were inseminated and 61 or 78% were pregcheck positive by ultrasonography. Those bred 4 to 6 days post-matrix farrowed with an 84% rate whereas gilts bred 7 to 9 day post-treatment farrowed with a rate of 69%. Gilts averaged per litter 11.2 +/- 0.4 born alive; 0.7 +/- 0.2 stillborns, and 0.1 +/- 0.1 mummies. Automated synchronization of estrus, insemination, and farrowing in a subset of group housed gilts was achieved via ESF. Farrowing performance of these animals was consistent with industry expectations. Autogenous Immunization - Another standard practice that is complicated by the implementation of group housing can be a feedback program to stimulation immunization to autogenous pathogens. Floor feeding of autogenous pathogens is problematic in terms of assuring that all animals are uniformly dosed with autogenous pathogens at the appropriate time during gestation. We have recently reported how to use electronic sow London Swine Conference – Production Technologies to Meet Market Demands April 1and April 2, 2015 19 Figure 3. Synchronization of estrus using Matrix. feeders to address this challenge.15 In this case, the small quantity dispenser was implemented to deliver a small quantity of biologically active material such as incubated piglet feces commonly used in feedback programs. After validating the delivery system, we compared the efficacy of the automated feedback of autogenous pathogens to that of a commercially available pre-farrowing vaccine in controlling pre-weaning piglet diarrhea. We found that the maximal amount of fluid that could be added to the carrier was 6 ml per 1 lb of feed and that the biological activity of this “soup” in the carrier resulting from the incubation of fecal material acidified electrolytes was ~18 hours. These parameters were used to institute the on-farm automated delivery of autogenous pathogens via ESF on a 1400 sow farm. Gilts were randomly assigned to one of four treatment groups at breeding. NT was control (n=14), FB received the automated feedback of autogenous pathogens at 5 and 3 weeks prior to farrowing (n=15). VC was injected with Farrowsure B (Pzifer Animal Health, New York, NY), at 5 and 3 weeks prior to farrowing (n=19), FB + VC received both autogenous feedback and injection with the commercially available prefarrowing vaccine (n =8). Both litter and piglet prevalence of diarrhea in the automated feedback and vaccine group was not significantly different from control animals. However, in the group given both feedback and vaccine the litter and piglet prevalence of diarrhea was reduced more than 50% (Figure 4, p< 0.00025, Exact Binomial Test). Examination of the inoculant isolated Rotavirus from the mixture and supports the notion of synergistic activity between the vaccine that covers microlobiolgic challenges such as E. coli and the automated feedback program that covers virologic insults such as Rotavirus. These findings demonstrate the practical and effective implementation of an automated feedback system for autogenous pathogens in group-housed gestating sows. 20 London Swine Conference – Production Technologies to Meet Market Demands April 1and April 2, 2015 Figure 4. Effect of three treatments on prevalence of diarrhea in piglets. INDIVIDUAL ANIMAL CARE One of the biggest challenges I see during the transition to pen gestation is inability to maintain the same level of individual animal care as routinely achieved in the crated barn. The larger pen usually the larger the challenge as it is increasingly more difficult to use the physical location of the animal as the identifier of an animal and or the problem to be managed. Thus, barn staff needs to more skilled at identifying individual animals within the group as well as recognizing problems within the pen. Several things can be done to facility the successful management of these challenges: • • • • • • Uniquely label all physically identifiable locations with in the barn. This would involve pens as well as demarcated sleeping areas. This allows barn staff to better communicate to management or fellow workers where problem sows are likely to be located. Assigning 300 to 400 individual sows per employee for them to monitor and observe daily in an effort make the barn staff more accountable for the well-being of specific animals. Use feed order through ESF station to identify animals that are at greatest risk of needing individual animal attention. Non-eaters would be the highest priority to investigate, then followed by the last 10% of the animals to eat. We recommend that you empirically determine how long it takes for 90% of your herd to eat and then daily printout a list of animals that have not eaten by this time of day. Our research has found that this last 10% of the animals to eat in a day are much more likely than the rest of their pen mates to be lame or injured and in need of individual care16. Not have too many sick pens in the barn as this forces the barn staff to identify problems early and treat the animals while they remain in the ESF pens. Organize staff’s work schedule such that they spend much of their day either in or around the ESF pens. This increases the window of opportunity to observe animals in need of individual attention. Clearly mark animals identified as needing attention such that they can be easily be found in the future. London Swine Conference – Production Technologies to Meet Market Demands April 1and April 2, 2015 21 TRAINING OF PIGS Pigs are inherently smart animals and highly motivated to eat. So training gilts to use the ESF station is not difficult. However, it is of critical importance to the success of an ESF barn as if gilt is not trained properly she cannot be feed properly. Given that there is no analogous activity in a crated barn, some farms struggle to identify the time and labor resources needed for gilt training. The gilt training program needs to be integrated into the farm’s gilt development program and thus will vary some from farm to farm. There is very little science to direct us on gilt training. However, based on empirical experience, the points of emphasis may include crate breaking gilts before ESF training, the use of training feeders modified to accommodate the smaller size of gilts, and dedi-cated pens with additional gating to facilitate animal control during training (Figure 5). Identifying the correct individual or individuals to train gilts is also important to the success of the process. No gilt should enter the herd without being fully trained as they will become a problem in the future and are at greatest risk of prematurely leaving the herd. Figure 5. Illustration of the use of additional gating to facilitate training. BARN START-UP The requirement to train incoming gilts places a new set of constraints on barn start-ups. Some thought needs to be given to the timing and magnitude of gilt deliveries, where these animals will be placed in the barn, how they will be feed prior to training, and the availability of labour to carry out the training in a timely fashion. It may be advantageous to hire employees slated to work in farrowing during this phase of the barn start-up. They can provide some of the additional labor required for training of gilts and at the same time provides employees with some cross training on the ESF system that might be helpful in the long run. 22 London Swine Conference – Production Technologies to Meet Market Demands April 1and April 2, 2015 TRAINING OF PEOPLE In the end, people make the most difference as there are far more ways to make ESF not work than work. It is important that the barn staff is enthusiastic and committed to the project. This is easy to achieve on owner-operator farms as their personal investment is often at stake. However on farms with hired labor, the people part can be more challenging, particularly if the workers are resistant to change and comfortable in a crated barn. Less pig experience and an on-the-job worker training program can in some cases be preferable to trying to re-educate experienced workers. Identifying who has what responsibilities in the gestation area and then finding a management scheme that holds individual workers accountable for these responsibilities is important. The barn staff must take ownership of the ESF and the individual animals that it is feeding. Training of staff to be successful in ESF barns provides an important opportunity for the veterinary profession to help our industry transition away from gestation stalls as demanded by the market place. CONCLUSIONS Our work has identified several opportunities associated with the implementation of electronic sow feeding for the improvement of sow herd nutrition and management. This includes improved feed utilization by the reduction of feed needed to maintain individual animal body condition, better matching of feed delivered to changing nutritional needs of sow during gestation through the use of software controlled feeding curves, automated control of gilt estrus via the delivery of Matrix to selected individual animals feeding in the ESF station, and a practical solution to regulating the amount and timing of a feedback program in pen gestation to stimulate immunization against autogenous pathogens. The electronic identification of the sows via an RFID tag also opens the door for additional digital management of the herd such as spray marking of animals requiring vaccination or selection of animals to move to farrowing. However, these advantages of ESF cannot be captured without some forethought on how the barn will be staffed, how these people will be trained, and how gilts will enter the herd both at start-up and for the rest of the life of the ESF facility. Taken together though, we see ESF as the only alternative to the gestation stall that can be a tool for producers to both advance the management and improve the economics of their herd. ACKNOWLEDGEMENTS Many people have participated the development of ideas detailed here and include Drs. Zachary Matzkin, Ines Rodriguez, and Meghann Pierdon as well as Mark Lewis, Mark Ebaugh, Jeff Schoening, Bruce Schroeder and the staff at Schauer Agrotronics, Prambachkirchen, Austria. REFERENCES 1. Rhodes, R. Tracy, et al. "A comprehensive review of housing for pregnant sows." Journal of the American Veterinary Medical Association 227.10 (2005): 1580-1590. 2. McGlone, J. J., et al. "Review: Compilation of the scientific literature comparing housing systems for gestating sows and gilts using measures of physiology, behavior, performance, and health." The Professional Animal Scientist 20.2 (2004): 105-117. London Swine Conference – Production Technologies to Meet Market Demands April 1and April 2, 2015 23 3. Dyck, G. W., et al. “Progesterone and luteinizing hormone concentration in serum of pregnant gilts on different levels of feed consumption.” Can. J. Anim. Sci. (1980) 63:579-585. 4. Jindal, R., et al. "Effect of nutrition on embryonal mortality in gilts: association with progesterone." Journal of animal science 74.3 (1996): 620-624. 5. Everts, H. “Nitrogen and energy metabolism of sows during several reproductive cycles in relation to nitrogen intake.” Ph.D. dissertation, Wageningen Agricultural University,The Netherlands (1994). 6. Boyd, R. D., and K. J. Touchette. “ Current concepts in feeding prolific sows.” Proc. 13th Annual Carolina Swine Nutr. Conf., Nov. 11, (1997) Raleigh, NC. 7. Weldon, W. C., et al. "Effects of increased dietary energy and protein during late gestation on mammary development in gilts." Journal of animal science69.1 (1991): 194-200. 8. Ullrey, D. E., et al. "Growth of the swine fetus." Journal of Animal Science 24.3 (1965): 711-717. 9. Noblet, J., et al. "Studies on the energy metabolism of the pregnant sow."British Journal of Nutrition 53.02 (1985): 251-265. 10. Weldon, W. C., et al. "Postpartum hypophagia in primiparous sows: I. Effects of gestation feeding level on feed intake, feeding behavior, and plasma metabolite concentrations during lactation." Journal of animal science 72.2 (1994): 387-394. 11. Dourmad, J. Y. "Effect of feeding level in the gilt during pregnancy on voluntary feed intake during lactation and changes in body composition during gestation and lactation." Livestock Production Science 27.4 (1991): 309-319. 12. Xue, JinLiang, et al. "Glucose tolerance, luteinizing hormone release, and reproductive performance of first-litter sows fed two levels of energy during gestation." Journal of animal science 75.7 (1997): 1845-1852. 13. Sinclair, A. G., V. C. Bland, and S. A. Edwards. "The influence of gestation feeding strategy on body composition of gilts at farrowing and response to dietary protein in a modified lactation." Journal of animal science 79.9 (2001): 2397-2405. 14. Van Blarcom, J., et al. “Automated control and synchronization of gilt inseminations via electronic sow feeding.“ (2012) Proceedings of American Association of Swine Veterinarians. 15. Parsons, T.D., et al. “Automated feedback of autogenous pathogens in large pen gestation to reduce piglet diarrhea.“ (2012) Proceedings of American Association of Swine Veterinarians. 16. Katz, J., et al., “Use of daily feeding order at an electronic sow feeder (ESF) to improve the individual animal care of group housed sows“ (2013) Proceedings of American Association of Swine Veterinarians. 24 London Swine Conference – Production Technologies to Meet Market Demands April 1and April 2, 2015 LABOUR CHALLENGES WITH PIGLET SURVIVABILITY Julie Ménard F. Ménard Inc. 251, route 235, Ange-Gardien, Québec CANADA J0E 1E0 Email: [email protected] ABSTRACT People are the most important asset to the breeding herd. The best productivity is generally associated with people having certain characteristics. The challenge is to find these people, train them, give them responsibilities and goals, motivate them and retain them. INTRODUCTION I am a swine practitioner working for F. Ménard for the last 28 years. My specializations are sow herd health, production and management. For the last year and a half, I have been in charge of people working on sow farms. More than 110 employees take care of the piglets in the company’s 19 sow facilities. F. Ménard is a vertically integrated company where all the elements are the same for every sow farm. Indeed, all of them receive the same feed, the same genetics, have similar buildings and the same management practices (SOP’S). Differences in results are generally associated with health and people. GOALS AND RESULTS The goal of F. Ménard breeding herds is to produce the maximum number of high quality piglets with the lowest cost. he best F. Ménard sow farm in 2014 produced close to 31 pigs/sow/year and shipped 3,029 kg of pork/sow/year to market. n 2014, some farms weaned 12.3 piglets per farrowing, while others weaned less than 11.0. Why are there such large differences between farms? Because of the people. Figure 1 on the incidence of pre-weaning mortality per day post farrowing shows that the first 4 days following birth are crucial. The reasons for mortality are mainly crushed and non-viable piglets (Figure 2). The farms that saved the most piglets are the farms that care! These are the ones that keep piglets warm at birth, check for adequate colostrum intake, find the good milking mothers and are there to save piglets. Some of my best farm people told me once: “Les mises bas, ça nous tient à coeur!”. Another farm mentioned: “Les porcelets, c’est de la vie”. We need these people. THE CHILEAN MODEL Some years ago, I went to the Banff Pork Seminar to specifically meet Dr. Gonzalo Castro. Dr. Castro is from Agricola Super in Chile, and was giving a presentation on the impact of people on production efficiency. In 1995, his 30,000 sow production company was already producing 25 pig/sow/year and pre weaning mortality was at 7%. I was very impressed by these results and I got the chance to go and visit Agricola Super in Chile. My goal was to discover their secrets. My ultimate surprise was that nothing special was done. Only a few London Swine Conference – Production Technologies to Meet Market Demands April 1and April 2, 2015 25 simple things: having clear goals, follow scientific knowledge, applying the same techniques every day, putting good people at the right place and working as a team. I wanted to be as good as Gonzalo and the Chileans, in other words, F. Ménard should become one of the most competitive production systems in the world. And from then on, we started to build our 20-year strategy. PEOPLE ARE THE KEY! A recent article on 40 PSY gave a very good resume of what is important to achieve such high productivity. “Do everything right and proactively, have an eye on every little detail. People management is key to achieve this.” For the last 20 years, F. Ménard has built a complete development program for people. The ingredients of that strategy are: 1. Hire good people 2. Train them 3. Find the best farm to put them in 4. Give clear production objectives 5. Motivate them 6. Continue to educate them throughout their career 7. Become a family member Hire good people During the first interview it is important to look at the interests of the “candidate”. Check that he or she has an open mind to learn and if he/she loves animals. These are much more important criteria than experience with pigs. Train them All the new employees are going to be trained in our main school farm or satellite farms. These are generally high performing farms and the staff in place will show them how to run a farm by themselves. We then evaluate the recruit regularly on their competencies and try to improve their weaknesses. Find the best farm for them Once we know the strengths and the personality of the new stock person, we offer him a farm where he will complement the team already in place. He will then become a manager and collaborate to improve that farm. We always try to hire people who have the temperament to work within a group with a common goal. Give production objectives The production objectives such as total born, born alive and number weaned are fixed every year and are very clear. The piglets have to be of good weight, healthy and alive up to the slaughtering process. People are rewarded on these objectives. 26 London Swine Conference – Production Technologies to Meet Market Demands April 1and April 2, 2015 Figure 1. Piglet mortality rates post farrowing. Figure 2. Causes of pre-weaning mortality. London Swine Conference – Production Technologies to Meet Market Demands April 1and April 2, 2015 27 Motivate them Farm people are motivated by different things. Their salary is based on performance such as the number of pigs weaned/sow/year. Every month, the 19 company farms are compared to each other based on farm results in a published report in order to stimulate healthy competition. Finally, there is a yearly contest where the best achieving farm will receive a special trophy, brought back from the year before, during the annual producers meeting. People develop ownership of their farm and want to be the best! Continue to educate them throughout their career I always want each producer to become better over the years. I share all the new research regarding health, production or genetics with my farm employees. I think that farm people are just like students at school and their knowledge has to increase throughout the year. We regularly give them presentations where they have the chance to exchange and learn from each other. This process is highly appreciated by the producers. Become a F. Ménard family member F. Ménard maternity department is run like a large family. The basic values are respect and mutual help. Each member is important. The best performing employees have the opportunity to become farm supervisors and oversee 7 to 10 farms. They can also advise on ways to improve our methods and can train new employees. We like to reward good stock people! The features of the best farrowing barn people Some people are better at improving piglet survivability than others. Here is the list of features that makes the best candidates: 1. Motivated and positive 2. Good observation skills 3. Good Judgment 4. Quick to intervene 5. Decision makers 6. Always want to improve/be competitive 7. Attention to detail 8. Question themselves 9. Honest 10. Proud 11. Passionate The best farrowing barn managers have all these features and will challenge me, question our methods and help us to grow. I am continuously looking to find this type of person. CONCLUSION In conclusion, the best results are always associated with the best farm people. We must work every day to find these exceptional people, keep them motivated and help them grow. It is a continuous challenge, but also very rewarding. 28 London Swine Conference – Production Technologies to Meet Market Demands April 1and April 2, 2015 ACKNOWLEDGMENT I would like to thank all the farm people at F. Ménard who work every day to improve the results of the breeding herd. These are great people who have helped me grow as well. RESOURCES Castro, G. 1997. The impact of people on production efficiency. Advances in pork production. Vol 8: 91-102 Hemsworth, P.H., Barnett, J.L., Coleman, G.J. and Hansen, C., 1989. A study of the relationships between the attitudinal and behavioural profiles of stockpersons and the level of fear of humans and reproductive performance of commercial pigs. Appl. Anim. Behav. Sci., 23: 301-314. Ravel, A., D’Allaire, S., Bigras-Poulin, M., 1996. Influence of management, housing and personality of the stockperson on preweaning performances on independent and integrated swine farms in Quebec. Prev. Vet. Med. 29: 37-57. Ter Beek, V., 2014. 40 PSY – People management is key. Pig Progress. November 2014. London Swine Conference – Production Technologies to Meet Market Demands April 1and April 2, 2015 29 Day 1: Sows – Workshop Sessions 30 London Swine Conference – Production Technologies to Meet Market Demands April 1and April 2, 2015 PRODUCTION AND FINANCIAL PERFORMANCE OF HIGHPRODUCING SOW FARMS Thomas E. Stein Founder & Executive Chairman, MetaFarms, Inc. 421 W Travelers Trail, Burnsville, MN 55337 USA Email: [email protected] Sow productivity and sow farm performance are the foundations of modern, integrated pork production. Most pork producers consider the production of weaned pigs to be a cost centre and rely on the growth phases (nursery-finishing or wean-to-finish) to fully realize the value of high-quality weaned pigs. Above-average sow productivity results in a lower average cost per weaned pig. Benchmark analysis of the largest pork producers in North America consistently shows that weaned pig cost ranks as one of the most important factors in overall profitability of pork production systems. Lower weaned pig cost correlates strongly with higher profitability. The Top 25% ranked on overall company profitability had consistently lower weaned pig costs (Bilbrey 2008; Bilbrey 2011). Sow Farms Ranked on Pigs Weaned/Mated Female/Year Over the past ten to fifteen years, sow productivity has improved substantially in North America. It wasn’t long ago that an average sow farm’s performance would have been 20 to 21 pigs weaned/mated female/year (PWMFY), 2.2 litters/mated female/year (LMFY), and 12.0 total pigs born. Today, those averages are 24 PWMFY, 2.3 LMFY, and 13.1 total pigs born. Overall sow productivity is up, mainly due to increased litter size but also to improvement in farrowing rate, non-productive days, and LMFY. Table 1 shows current reproductive performance from the US and Canada (75% US, 25% Canadian) summarized from 246 sow farms using the MetaFarms’ Sow Manager™ software. A few definitions are in order for terms you may not have seen before. Total Productivity Index™ (TPI) is an overall index developed by MetaFarms to combine both biological performance (PWMFY) and throughput (pigs weaned per space per year). It comes from an old rule-of-thumb that to calculate the weekly number of weaned pigs produced by a sow farm, one can simply multiply the average sow inventory by a factor of 0.40, viz. a 2,500-sow farm would average more-or-less around 1,000 weaned pigs per week. The calculation is the reverse, i.e. the weekly average for numbers of pigs weaned divided by the average sow inventory. At MetaFarms we converted this to a whole number (multiplying the result by 100) and called it the Total Productivity Index™. It is very useful as both a quick method of assessing sow productivity as well as understanding weekly weaned pig flow from a group of sow farms. Notice the wide gap between the Bottom and Top performing sow farms on TPI (Table 1), with the worst at 37.9 and the best at 53.5. It highlights the fact that even in what one might consider generally above-average sow farms in North America there remains a large gap in overall sow farm productivity. You can also see this gap reflected in pounds weaned per sow per year (266 v. 388 lbs). The calculations for % Pregnant at day 35, at day 72, and at day 105 each represent the inverse of the drop-out rate at those particular gestation days for cohorts of sows served, London Swine Conference – Production Technologies to Meet Market Demands April 1and April 2, 2015 31 i.e. the losses due to repeat service, pregnancy loss, deaths, and culls. It’s interesting that the best farms start with a high 35-day pregnancy rate and maintain it all the way through to farrowing while the worst farms start with a somewhat (but not terribly) lower 35-day pregnancy rate and experience substantially more dropouts at each measured point during gestation. They end with a much lower farrowing rate than the best farms (79.5% v. 88.9%). Pigs weaned per sow lifetime in Table 1 show that sow longevity continues to be an issue in sow farm performance. Williams et al. (2011) suggested a target of 55 or more and an intervention level of 50 or less. We believe this reflects a difference in calculation methods and should be rationalized as even the Top 10% at 48 pigs weaned/sow lifetime hardly approached Williams’ intervention level. As you review the sow culling and mortality rates, keep in mind that sow farms with higher productivity are mathematically biased to have higher culling and mortality rates. Why is that? The true biology of culling and death is best represented as the probability of culling or death within a reproductive cycle, i.e. the number culled or died during a parity cycle divided by the number of sows started in that cycle. Sow farms with the same probability of culling or death can have very different culling or death rates depending on their productivity. Let’s say two farms both have 4% probability of sow death, in other words the biology of sow death is the same between the farms; the one with 2.5 LMFY will have an annual sow death rate of 2.5 x 0.04 = 10% while the one at 2.14 will be 2.14 x 0.04 = 8.5% even though there is no real difference. Culling rates are affected more dramatically: at a 0.20 probability of culling, the high productivity farm will have an annual culling rate of 50% while the other will be at 42.8%. Based on this reasoning, it’s unlikely that the differences in sow culling and death rates seen in Table 1 are as wide as they look. A study of Table 1 shows multiple opportunities for improvement in the underlying factors affecting sow farm productivity: (1) pigs weaned per sow lifetime and sow longevity; (2) farrowing rate; (3) non-productive days; (4) total birth loss (stillborn + mummified); (5) post-weaning sow performance; and (6) pre-weaning mortality. This last item in particular has not improved at all over the past 15 years. I thought it would be interesting to compare sow farm productivity between the farms on the MetaFarms software with the data that PigCHAMP published for 2013 (Table 2). But I didn’t expect the numbers to be as close and consistent as they are. It tells me that it doesn’t take all that many sow farms to provide a reasonably accurate and representative picture of sow farm performance and productivity in the US and Canada. Sow Farm Productivity Across (A Few) Countries With the MetaFarms Sow Manager customer base we have the opportunity to compare sow farms in the US with those in Canada along with a few in Australia (Table 3). You’d think you’d have to take the Australian numbers with a grain of salt since sample size is so low. But earlier this year, in conversation with a group of Australian veterinarians, they thought the numbers representative of the situation there. And a test of reasonableness against benchmark data from Australia confirmed it as well. I guess it’s the trade-off that the country is willing to accept between genetic lag and keeping disease out. 32 London Swine Conference – Production Technologies to Meet Market Demands April 1and April 2, 2015 Canadian sow farms have higher productivity than US farms. Canadian sow farm performance has been consistently above the US, going as far back as some of my earliest benchmarking with PigCHAMP data. No surprise in this data as it continues to be a real phenomenon. Percentile Distributions and Report Cards Table 4 shows the percentile distributions across the MetaFarms customer database for many of the familiar numbers reported for sow farm performance. Keep in mind that with percentiles, each item is ranked independently of the others. You take one line item (say, PWMFY), rank all the farms top to bottom on that number, and find the various percentiles. Remember that a percentile represents a single number, not an average, so for PWMFY the 90th percentile is the single number at which 90% of the sow farms (in this dataset) are below and 10% are above. Since there were 292 sow farms, the 90th percentile says that 29 farms were at or above 27.3 PWMFY and 263 farms were below it. I like to use percentile distributions to create report cards for sow farms that highlight a farm’s strengths and weaknesses. Every sow farm has a mix of these. While the best farms are always strong in the ultimately key areas like litter size, you can find many sow farms that put together a solid mix of performance across things like farrowing rate and pre-wean mortality to end up ranking in the Top 33%. I always reverse the direction of certain (obvious) line items for the ones where a high number is bad and a low is good. (They are marked with an asterisk (*) in Table 4). That way you can use percentiles for line items like grades for different subjects on a student’s report card where 90% is an A and 20% is not. Figure 1 shows an example of a report card based on this approach. It’s real data from a farm in the upper Midwest. These guys are below average and not just by a small margin. I’d give this farm a grade of D. But they have some strengths, some important ones, especially Litter Size (both Total Born and Live Born are way above the 50th percentile). If you’re going to have a strength, that’s the one to have. They also have better than average Lactation Daily Gain which gives them above 50th percentile in Lbs Weaned/Sow/Year. But they lose those advantages by having weaknesses in Farrowing Rate, Stillbirths, and Pre-Weaning Mortality. Looking at the % Pregnant at key times during gestation, you can see their real weakness is coming out of the gate, i.e. the % Pregnant at Day 35 is awful. They’re losing the farrowing rate game with poor conception in the first 35 days. Internal Sow Farm Benchmarking You can think of percentile distributions and report cards as one way to do external benchmarking. Figures 2 and 3 show examples of internal benchmarking for companies with several to many sow farms. Basically a sow farm comparison report but with the winners of each performance parameter identified by highlighting the cell. Figure 2 shows it with the actual performance numbers while Figure 3 shows how each farm ranks on each performance number. Producers and consulting vets find this report format very useful. We’ve even had one veterinarian tell us that this is the only report the sow farm team looks at during the vet’s monthly consulting visit. London Swine Conference – Production Technologies to Meet Market Demands April 1and April 2, 2015 33 34 London Swine Conference – Production Technologies to Meet Market Demands April 1and April 2, 2015 Sow Farm Performance Trends Benchmarking sow farms has three main objectives (besides creating motivation and a sense of urgency, something not to be taken lightly). First, figuring out where the farm sits competitively in comparison to peers; that’s the point of the Top-Bottom analysis ranking on PWMFY. Second, identifying each farm’s strengths and weaknesses, i.e. where are the opportunities to improve; that’s where Report Cards and Scorecards are helpful. But as important, and maybe more, is to understand the rate of change (hopefully, rate of improvement) over time for a farm or a company’s group of farms against the industrywide rate of change. It’s not easy to find good comparison data. Figure 4 shows an excellent analysis of trends in farrowing rate and litter size over 10 years (Aparicio M et.al, 2014). Data (2003-2012) come from 165 sow farms (100,000+ sows; 2.1million farrowings) in Spain, Portugal, Italy, Brazil, Mexico and Colombia. It looks like farrowing rate is improving at the rate of 0.4% units/year and total born litter size by .16 units/year. These would be minimum thresholds to benchmark rates of improvement in your client’s farms. Weaned Pig Cost Keep in mind that weaned pig cost can change dramatically, and has in the past 3-4 years, mainly due to big changes in feed cost. Nevertheless, at any given time, it is sow productivity that drives variation in weaned pig cost structure across sow farms. Table 5 shows weaned pig cost for the Top and Bottom ranked sow farms illustrating an $8/pig cost difference between the Top and Bottom 10%. Table 6 gives a cost item breakdown for the average sow farm. And Table 7 shows a test of reasonableness for the MetaFarms numbers coming from John McNutt’s analysis of 2013 weaned pig costs across a large group of Midwestern hog operations (McNutt, 2014). Focus on the columns labelled “Breed to Wean” and you can see his estimates for the 50th and 90th percentiles on weaned pig cost. The McNutt and the MetaFarms costs are very close and satisfy the need to see similar cost structure coming from two independent sources. REFERENCES Aparicio M, de Andres MA, Morales J, Pallas R, Nazare Lisboa M, and PiNeiro C. Evolution of sow productivity in last ten years in American and European swine herds. In Proceedings, American Association of Swine Veterinarians 45:429-430, 2014. Bilbrey G. Benchmarking and cost-production relationships. Advances in Pork Production 19:4146, 2008. Bilbrey G. Benchmarking – Production practices used by the most profitable companies. Advances in Pork Production 22:105-108, 2011. McNutt J. Year-End 2013 Estimated Benchmarks for Cost of Production in Hogs. https://www.linkedin.com/pulse/article/20141111171947-113975325-2013-swine-productionbenchmarks?trk=prof-post Stein TE. Benchmarking non-productive days across sow farms. In Proceedings, American Association of Swine Veterinarians 44: 449-450, 2013. Stein TE. Benchmarking weaned sow cohort performance across sow farms. In Proceedings, American Association of Swine Veterinarians 45:475-476, 2014. Williams NH, Klenk S, and Christianson W. Production costs in the Americas. Advances in Pork Production 22: 277-282, 2011. London Swine Conference – Production Technologies to Meet Market Demands April 1and April 2, 2015 35 36 London Swine Conference – Production Technologies to Meet Market Demands April 1and April 2, 2015 London Swine Conference – Production Technologies to Meet Market Demands April 1and April 2, 2015 37 38 London Swine Conference – Production Technologies to Meet Market Demands April 1and April 2, 2015 London Swine Conference – Production Technologies to Meet Market Demands April 1and April 2, 2015 39 40 London Swine Conference – Production Technologies to Meet Market Demands April 1and April 2, 2015 London Swine Conference – Production Technologies to Meet Market Demands April 1and April 2, 2015 41 42 London Swine Conference – Production Technologies to Meet Market Demands April 1and April 2, 2015 London Swine Conference – Production Technologies to Meet Market Demands April 1and April 2, 2015 43 44 London Swine Conference – Production Technologies to Meet Market Demands April 1and April 2, 2015 London Swine Conference – Production Technologies to Meet Market Demands April 1and April 2, 2015 45 USING RECORDS AND DATA MINING TO TROUBLESHOOT PROBLEMS IN SOW BARNS Marsha Van Dinther Production Manager, South West Ontario Veterinary Services 219 Oak St., Stratford, Ontario Email: [email protected] How we manage sow barns has dramatically changed over the last ten years. Tools such as data benchmarking have given producers the ability trouble shoot problem areas within their systems as well as run day to day tasks. Data management is a vital part of running a successful business. Accurate data collections on-farm becomes especially critical. Collecting data from your farm to enable management and staff to identify areas to improvement, where they are exceling, and allows you to benchmark your production against industry. Identifying areas of concern ultimately allows a system to work more efficiently by accepting tighter production margins which help to keep costs as low as possible. Benchmarking is the process of comparing one’s performance against others in your industry. It will identify where your system rank compared to other within that database. This can help identify who is achieving the highest production and look at what they might be doing in order to get there. Often the best managed systems are continually looking to improve their on-farm practices to maintain a competitive edge in our industry. Data collection and benchmarking allows systems to fine tune their processes and keep current as to how they compare to others in the industry. When comparing yourself to others it is imperative that you compare apples to apples and therefore is important to understand how to interpret this information. A large component of what our data team and management staff do is look at production graphs and identify any areas where production may vary. It is therefore extremely important to be able to look at accurate and up to date data. Many factors play a role in what can cause data variation. Some of those factors might include parity, born alive, weaning intervals or weaned pigs per sow. These factors can sometimes be very difficult to identify as concerns when you are walking through a barn. Performance monitors give you a snapshot of what is happening on your farm. These monitors allow you to see big picture areas of concern, from there, you can look closer at specific detailed reports to be able to identify where some of the key issues may be hiding. One of the detailed reports you can generate is a farrowing rate monitor. This performance monitor specifically shows you farrowing information and can allow you to see a 16 week window of what is coming down the pipeline. If you are having a concern with conception for example, you would be able to have a closer look at where the conception failures are happening. Is the problem happening on a specific day of the week? Is there a concern with a specific service technician? Being able to look at these specific variables is a great way to help identify where problems in a herd may be coming from. 46 London Swine Conference – Production Technologies to Meet Market Demands April 1and April 2, 2015 Principals of the information are driven by: • Results/ information systems • Inputting information weekly • Accurate data integrity • Complete information What this delivers: • To do the day to day work on farm • To intervene early if needed • To solve problems • To form a basis of continual improvement on- farm What are we looking at???? • Incomplete data • Errors in data • Different ways of entering the data If entering data on farm, make sure you understand the software program: • How to input the data properly • What information gets entered • What reports do I want to generate Having accurate data on- farm helps identify areas that need refining and also highlights when you have made improvements. Benchmarking with good data against good data increases the chance of success and continued improvement. London Swine Conference – Production Technologies to Meet Market Demands April 1and April 2, 2015 47 THE NEW CANADIAN CODE OF PRACTICE Jennifer Brown Prairie Swine Centre, Saskatoon, SK Email: [email protected] INTRODUCTION In Canada, Codes of Practice are established for each livestock industry that define the basic level of care that is expected from producers. Codes are developed by the National Farm Animal Care Council, following a process described as ‘science-based’ and ‘consensus based’. Code development committees include participation from a wide spectrum of individuals, including scientists, producers, veterinarians, transporters, government agencies, retailers, processors and animal rights organizations. Codes of Practice are reviewed and updated periodically, with a new swine code being released in March of 2014 (NFACC, 2014). The new Code of Practice for the Care and Handling of Pigs includes a number of changes that impact production practices and housing for Canadian pigs. The most significant changes in the new code are related to sow housing, pain control at castration and tail docking, space allowances and enrichment. For all aspects of production, the code includes both ‘requirements’, where the expected standards or outcomes to be met are clearly stated, and ‘recommended practices’, which describe practices over and above the requirements which can be implemented on-farm to further improve animal production and wellbeing. Pig producers should be familiar with the code to know how these changes will impact their farm and to begin planning for any changes needed to meet the requirements. The Canadian Pork Council is now responsible for revising CQA and ACA programs to incorporate the code changes, and once completed, producers will be audited on these requirements. This article highlights the key changes found in the new Code of Practice, and discusses practical ways that these requirements can be met. GROUP SOW HOUSING Code Requirements Section 1 of the code describes housing requirements for pigs in all stages of production. For gestating gilts and sows, the code requires that: “For all holdings newly built or rebuilt or brought into use for the first time after July 1, 2014, …sows must be housed in groups.” Stalls can be used during breeding and for up to 35 days after breeding to ensure that mixing stress does not impact embryo implantation. For existing farms that do not undergo renovation, stall housing is permitted until July 1, 2024. “As of July 1, 2024, mated gilts and sows must be housed: In groups; or in individual pens; or in stalls, if they are provided with the opportunity to turn around or exercise periodically, or other means that allow greater freedom of movement.” 48 London Swine Conference – Production Technologies to Meet Market Demands April 1and April 2, 2015 At this time, acceptable methods for providing ‘periodic exercise’ have not been defined but these should be clarified by 2019. Requirements for sow stalls have also been defined, indicating that when housed in stalls they must allow sows to: “stand up …without simultaneously touching both sides of the stall; lie down without their udders protruding into adjacent stalls; stand up without touching the top bars; stand in a stall without simultaneously touching both ends of the stall.” Group housing options Unlike stall systems, there are many different ways that sows can be managed in groups. These include different feeding systems, mixing strategies, and flooring types. The cost and management of each system will be different, so it is up to producers to select the option that best fits their herd flow and management style. A loss in production can be expected during the initial implementation of groups as herd numbers may need to be reduced to accommodate renovations, normal management will be disrupted and sows, barn staff and management procedures must adapt to the new system. However, once group housing has been implemented production levels should return to previous levels – for the most part this will depend on the design and management of the system. Studies in Europe have shown that, on average, production levels in group housing are as good or better than in stalls. The difference is largely due to higher fitness levels in group-housed sows which has been shown to increase bone strength and muscle mass, and reduce heart rate and farrowing interval (Marchant and Broom, 1996, Anil et al, 2005). Currently there are five main options for feeding sows in groups: Floor feeding, Shoulder stalls, Electronic Sow Feeder (ESF), Free-access stalls, and Free-access ESF. There is a large amount of information available describing the pros and cons of each system – several internet sites are listed at the end of this article. Competitive feeding systems: Floor feeding and shoulder stalls are competitive feeding systems where sows receive their feed in a common area and actively compete for access to feed. Because of the competition, small group numbers are recommended (eg up to 25 sows), and sow groups must be selected carefully based on similar size, body condition and parity in order to ensure that subordinate sows are not bullied or displaced at feeding. Competitive systems require more hands-on management of sows, with daily checks during feeding to observe that all sows are up and actively feeding. Sows which are lame or fall behind in condition must be removed to relief (comfort or hospital) pens, with a recommendation for provisions for 5% of gestating sows in relief pens in these systems. Barn conversions for competitive feeding systems are attractive from a cost perspective. Often an existing stall gestation or finisher room can be adapted, using an existing feed delivery system, and with minor changes to flooring. Competitive systems are more commonly seen on smaller farms and in older barns where the producer can provide much of the labor needed for installation, and the barn may not warrant a more expensive renovation. Space requirements for sows in these systems are greater due to the fact that smaller groups require more space per sow to minimize conflicts between sows. The costs of renovation should be carefully weighed against the potential for higher feed London Swine Conference – Production Technologies to Meet Market Demands April 1and April 2, 2015 49 consumption, lost production and injury, and the extra time needed to manage these systems well. Non-competitive feeding systems: ESF, free-access and free-access ESF are known as non-competitive feeding systems because sows are isolated during feeding. This allows for greater control of individual feed intake, with the potential for feed savings, especially in ESF and free-access ESF systems where animals can be placed on individual feed curves. Both types of ESF systems require the use of RFID tags which allow sensors to identify individual animals as they enter the feeder. Feed is delivered in small allotments, so that if the sow exits the feeder she can return later in the day to obtain the rest of her feed allowance. The feed deliveries are reset electronically each day, with the most common reset times between midnight and 10am, depending on management preference. Sows soon become aware of the reset time, and dominant sows will typically be first to access the feeder after reset (Strawford et al., 2008). ESF systems are designed to feed up to 60 sows per station, with some manufacturer’s recommending as many as 80 sows per feeder. ESFs are designed for sows to move through the feeder, entering at the rear and exiting from the front, and offer more technological methods for sorting and marking sows, and are consequently more expensive than free-access ESF. Free-access ESF stations are typically run at a ratio of 20 sows per feeder, with sows entering and exiting from the rear and are less expensive to install. While a large amount of research has been done on ESF systems, free-access ESF is a new system developed in Canada that has yet to be studied in any depth. Free-access stalls are designed with self-closing gates that are operated by the sows. Each sow has a stall, and each pen includes a loafing area outside of the stalls where sows can co-mingle. Free-access stalls are very easy to manage: each sow has a feeding stall so animals obtain their full ration, however, since sows choose the stall they enter, all sows are fed the same amount and any requiring extra feed must be topped up by hand. Although they are very welfare-friendly and easy to manage, free-access systems do require a large amount of floor space and penning, with the result being that they are the most expensive system to install. PAIN CONTROL AT CASTRATION AND TAIL DOCKING The code requires that castration performed after 10 days of age must be done, “with anesthetic and analgesic to help control pain.” Also, as of July 1, 2016, castration at any age, “must be done with analgesics to help control post-procedure pain.” Similarly, as of July 1, 2016, tail-docking performed at any age, “must be done with analgesics to help control post-procedure pain.” Due to the painful nature of these procedures, protocols must be in place describing the procedure and equipment used, and staff must be well trained on how to perform them. This also applies to other elective husbandry procedures such as teeth clipping, ear notching, tattooing, and tusk trimming for boars. Producers should work with their herd veterinarian to develop effective and workable protocols for implementing pain control. Surgical castration is typically done between 1 and 5 days of age, for the primary purpose of reducing boar taint in the meat of male pigs. Historically, it was believed that neonates were not fully developed, and therefore did not feel pain to the same degree as mature 50 London Swine Conference – Production Technologies to Meet Market Demands April 1and April 2, 2015 animals. This idea has now been disproven, and it is now accepted that young animals experience pain that is similar and possibly greater than in adults. As of July 1, 2016, the code will require pain relief to treat post-procedural pain at castration and tail docking. The emphasis on ‘post-procedure pain’ means that pain control is not required during castration. The drugs needed to provide anesthesia during castration are typically expensive and some require the presence of a veterinarian to administer, with options including lidocaine hydrochloride injection or anesthetic gases such as halothane. Providing pain control post-procedure is much simpler, the most promising options include the NSAID drugs, Metacam and ketoprofen. Ideally, drugs such as Metacam and ketoprofen should be injected 15 to 30 minutes before castration in order to be effective immediately after the procedure. This raises the question of how best to implement these practices during piglet processing; repeated handling of pigs to inject, wait, and then process pigs will be more time consuming and will also result in greater handling stress for piglets. Due to the addition of another injection at processing, the use of needleless injection systems will likely increase in order to improve efficiency and reduce needling errors. Over the coming year, we can expect to see veterinary recommendations as how to best implement these methods in practice. SPACE ALLOWANCES Space allowances required for sows, weaners and grow-finish pigs are defined in section 1.2 of the code. For sows, the requirements are general, stating that: “…sows must be able to stand, move about and lie down without interference with each other in a way that compromises welfare…”. Guidelines for recommended space allowances in group gestation are outlined in appendix B, and are derived from multiple studies on sow space requirements. A range of space allowances is given, eg. 19-24 ft2/sow. Smaller groups of animals will need larger space allowances, while larger groups (e.g. over 40) will have more space to share overall, and can cope with the lower allowances. In terms of reducing aggression and improving sow welfare, more space is better. For weaner and grow-finish pigs, a k factor is used to define space requirements. The k value is useful as it is a constant that can be used to calculate the space needed for any weight of pig. The code requires that “Pigs must be housed at a space allowance of k ≥0.0335.” For weaner pigs, a short-term decrease of 15% is permitted at the end of the nursery phase, and up to 20% crowding is allowed at this time if it can be demonstrated that the higher densities do not compromise the welfare of the animals as determined by ADG, mortality, morbidity and treatment records, and the absence of vices such as tailbiting. For grow-finish pigs, some leeway is also given at the end of production, with a 10% decrease allowed, and up to 15% permitted if the producer can similarly demonstrate there are no adverse effects on production, disease or vices. A survey of finisher pig space allowances on 35 Canadian farms was conducted by Prairie Swine Centre in 2013, and found that if a 10% ‘first pull’ shipping strategy was used, approximately 46% of London Swine Conference – Production Technologies to Meet Market Demands April 1and April 2, 2015 51 farms were potentially in compliance with the 15% space restriction allowance, but would need to demonstrate the absence of adverse effects due to crowding. A similar survey of weaner pig space allowances was less encouraging. Of 21 farm sites surveyed across the country, 24% of farms met the k = 0.0335 code requirement, a further 62% met the code with space restrictions of 15-20%, and 14% did not meet the code (Table 1). Little research has been done on space allowances in nursery, and studies are ongoing in Canada to determine the effects of crowding on nursery pigs. This information will be useful in subsequent revisions to the code or practice. Table 1. Compliance of surveyed farms with Code and estimated cost to meet Code. Code: k=0.0335 15% reduction 20% reduction (k= 0.0285) (k= 0.268) Non-compliant % of farms 24% 38% 24% 14% % of pigs 12% 56% 19% 13% Additional space to meet k=0.0335 (000’s ft2) 990 196 129 Cost/pig space $30 $3 $2 Total industry cost $106 M $12 M $8 M ENRICHMENT The provision of enrichment to pigs is new a code requirement that will require some innovation on the part of producers. The code states that: “Pigs must be provided with multiple forms of enrichment that aim to improve the welfare of the animals through the enhancement of their physical and social environments.” The provision of enrichment has been shown to be beneficial for pigs by reducing the development of abnormal behaviours and vices, increasing normal exploratory behavior, and improving the pig’s ability to adapt to changes in the environment. A number of enrichment options are available, many of which can be produced on-farm at low cost. In general, enrichments should be safe for pigs, easily cleaned, and preferably soft/malleable as pigs prefer materials they can bite or chew. Enrichment objects should be suspended to avoid fouling, but should be near the floor as many pigs like to manipulate them while lying. Novelty is an important factor, so ideally different objects should be used, and can be cleaned and rotated around the room. Enrichments for nursery pigs can include a variety of rubber toys, suspended above the floor. For finisher pigs, sections of chain, wood mounted in a holder or on a chain, and short sections of PVC pipe have been used successfully. 52 London Swine Conference – Production Technologies to Meet Market Demands April 1and April 2, 2015 Straw is known to be a preferred enrichment, but is difficult to provide in fully slatted systems. On partial slats, a small quantity of straw can be provided on solid areas or in a rack or hopper, and will generally be consumed before it enters the pits. SOW HOUSING RESOURCES: Prairie Swine Centre: http://www.prairieswine.com/the-science-of-ethology/ Manitoba Pork: http://manitobapork.com/manitobas-pork-industry/animal-care/tools-forgroup-housing/ Ontario Pork: http://www.ontariopork.on.ca/ProductionStandards/AnimalCareResources.aspx Australian Pork: http://australianpork.com.au/latest-news/successful-group-housingsystems-for-dry-sows-workshop/ REFERENCES Anil L., Anil S.S., Deen J., Baidoo S.K. & Wheaton J.E. (2005) Evaluation of well-being, productivity, and longevity of pregnant sows housed in groups in pens with an electronic sow feeder or separately in gestation stalls. American Journal of Veterinary Research 66:1630-1638. Marchant J.N. & Broom D.M. (1996) Effects of dry sow housing conditions on muscle weight and bone strength. Animal Science 62:105-113. National Farm Animal care Council, 2014. Code of Practice for the Care and Handling of Pigs. Canadian Pork Council. Strawford, M.L., Y.Z. Li, and H.W. Gonyou, 2008. The effect of management strategies and parity on the behavior and physiology of gestating sows housed in an electronic sow feeding system. Can. J. Anim. Sci. 88: 559-567. London Swine Conference – Production Technologies to Meet Market Demands April 1and April 2, 2015 53 PRACTICAL LABOUR TIPS TO IMPROVE PIGLET SURVIVABILITY Julie Ménard F. Ménard Inc. 251, route 235, Ange-Gardien, Québec, CANADA J0E 1E0 Email: [email protected] INTRODUCTION The ultimate goal of a farrowing facility management system is to produce a high number of mature and healthy weaned piglets. The older and bigger the piglet is at weaning, the higher the gain, the better the feed efficiency and the lower the cost up to slaughter. Management around the farrowing process therefore has a great impact over the entire life of the pig. A bit of history In the years 1990-2000, farrowing operations were very intensive. All the sows were induced at 114 days of gestation, they were sleeved to prevent stillbirths, oxytocin was used a lot and many sows were treated for anorexia. A majority of piglets were cross fostered, the goal being that all litters had the same number of piglets of same size whatever the mother. In early 2000, PRRSV was very aggressive and caused a lot of abortions. Piglets were shedding the virus at weaning and a high percentage of mortality was recorded in nurseries and amongst finishers. The McRebel technique, consisting of avoiding cross fostering was a new way to cut the PRRSV disease cycle. At the same time, work done by a European genetics company was suggesting the minimization of prostaglandin and oxytocin use in order to limit the use of hormones. Finally, following research done at the University of Kansas, a trend of 21 day weaning age replaced the former 14 to 17 days. From then on, we completely changed our way of managing piglets. We turned to a more natural way. F. MÉNARD APPROACH Choose the good sows The first thing to improve the survivability of piglets is to have good sows. Thus genetic choice has a major impact on total number born but also milking ability, mothering temperament and weight of piglets at birth. Some genetics companies are even breeding for piglet survivability. Finally, the number of functional teats is extremely important in order to wean the maximum number of piglets on their original mother. Keep your sows in good body condition and feed them well Body condition at farrowing has an important impact on milk production and feed intake. It is therefore fundamental to keep sows in uniform body condition for her entire gestation and lactation periods. Overweight sows will crush more piglets, will have more stillbirths 54 London Swine Conference – Production Technologies to Meet Market Demands April 1and April 2, 2015 and less appetite during lactation. Underweight sows will get shoulder ulcers and thus suffer pain and have less feed intake. Both extremes are not desirable. An extra amount of feed from 90 to 115 days of gestation will, in general, increase piglet birth weight and vitality therefore improving their colostrum intake. Respect the natural gestation time for sows A few years ago, the F. Menard research teams looked at the impact of gestation length on piglet weaning weight. We observed a positive relationship between these two elements. We cannot say if this is associated with a larger birth weight or better piglet maturity and therefore colostrum intake, but all the data was along this line. From then on, in 2011, F. Menard recommendations were to stop inducing sows before 115 days of gestation. This new practice has helped us decrease pre-weaning mortality. Give the research to your people and let them improve their practices In 2011, the more proactive producers began to stop inducing their sows completely and did the minimum cross fostering and operations. They just focused on the small details that make a difference for piglet vitality. Here is what I collected from their experience. Before farrowing One of the very first steps to improve piglet survivability is to get the farrowing rooms ready. Remove feces behind the sows continuously before and during farrowing. Put recycled paper mats and drying agent down. Adjust heat lamps to a good height and turn them on. It is important to create an environment appropriate for the maximum comfort of piglets at birth. Sanitation of the rooms between batches is also extremely important. At farrowing The recommendations are: no induction, do not use oxytocin, minimum sleevings, dry the piglets and no teeth clipping. The result is: a more natural farrowing process leading to fewer sows off feed, less antibiotic treatment, less cannibalism and less crushed piglets. Overall, sows are calmer. At the same time piglets are heavier, stronger, and more vigorous and therefore have a greater colostrum intake. All these factors then contribute to better milk production by the sows and like my producers say: it requires less work for better results. All you need is to observe. Cross fostering The principles of cross fostering are very simple. 1. Leave the maximum number of piglets on their own mother 2. Push the lactation for each individual sow It is not unusual to have sows milking up to 15 piglets. The key is keep the litter intact, big and small brothers and sisters together as long as they have a functional teat to milk. In the days following farrowing, those piglets that are really missing milk will be reallocated to a mother with milk, but in general it represents a very small percentage of piglets. The real work is at birth. The more judicious work done around farrowing, the less there is to do after. London Swine Conference – Production Technologies to Meet Market Demands April 1and April 2, 2015 55 Culling the right sows Producing more piglets means keeping only the high performing sows. It is therefore essential to respect a very severe culling process. The sows we get rid of are: • Those weaning less than 9 piglets because of a bad udder or crushing. • Those with a long farrowing process • Those with bad legs • Finally, the cannibals CONCLUSIONS Weaning a high number of piglets does not require magical solutions. Respecting the natural behavior and biology of the sow and letting her milk her piglets is the key. Then, the details observed by the producer in order to give optimal care and environment make the difference for piglet survivability. Attentive, knowledgeable stock people are the ones who will wean the most piglets. 56 London Swine Conference – Production Technologies to Meet Market Demands April 1and April 2, 2015 London Swine Conference – Production Technologies to Meet Market Demands April 1and April 2, 2015 57 PRACTICAL LABOUR TIPS TO IMPROVE PIGLET SURVIVABILITY Sylvia Meszaros Barn Manager, Cudworth Pork Investors Group Box 179, Cudworth, Saskatchewan S0K 1B0 Email: [email protected] INTRODUCTION The Cudworth Pork Investors Group (CPIG) is a 1200 sow closed farrow-to-finish multiplier unit. The community of Cudworth is populated with approximately 800 people, and is located in North Central Saskatchewan. The closest hog barn is well over an hour’s drive away. CPIG has been in operation for 20 years with the same local owners and management, and have many long-term employees. We have remained successful through the years, and there are many very important factors that have contributed to that sustainability, such as our professionals; the vets, nutritionists, technical service people; the genetics; our location; barn design; water; on-site feed mill with the owners providing the grain; and last, but not least, I am blessed with a pretty dynamic team. Today I have been asked to speak on “Practical labour tips to Improve Piglet Survivability”, and I will share what I believe are the four key areas that always need to be addressed with the keenest ‘attention to detail’ to keep the pre-weaning mortality below 10%. 1) Sanitation 2) Feeding our Sows and Pre & Post Farrowing 3) Standard Operating Procedures – Day One and onward 4) The People behind the Pigs We are very diligent in our record-keeping, so we can very quickly pinpoint disease or management problems. Always be honest with record-keeping. Don’t record a ‘lay-on’ as a stillborn when it isn’t. It is too easy to skew records to make your department’s statistics look good. Always know that what you see, is what it is. 1) SANITATION “Clean” is Healthy Pressure washers and all staff need to understand that a clean environment is essential to promote the well-being of animals and crucial to disease control. Staff members need to have equipment and products that work well. Pressure washers should be recognized as key employees. Prepping a room • • 58 Remove all left-over feed. Scrape down manure. London Swine Conference – Production Technologies to Meet Market Demands April 1and April 2, 2015 • • • Wet down the entire penning and floors, degrease, and allow to sit for 30 minutes. Then wash the entire room, including walls. Once this is completed, do a final rinse, and when you are satisfied with the cleanliness, disinfect. How clean is ‘clean enough’? Don’t be afraid to be fussy, and don’t settle for anything less than the standards you have set for your unit. When is a room considered ready to load sows? • • • • The next morning, once it is dry. Never before maintenance is done, including water nipples, heat lamps, ventilation and inlets, and any damage that could cause discomfort to the sows and pigs. All crates include a 12”x12” black rubber mat, set directly under the side heat lamp, which is set at 18”. All crates include a back lamp that is turned on 3 days prior to due date, and shut off after processing, to discourage piglets from laying there. There is also a side lamp that remains on the entire time. In Summary Bottom Line: Clean is Healthy Good management is about providing our sows with a suitable clean and warm environment,. We then know that we can maintain the well-being of our animals, when we provide these things for them. Furthermore, a clean environment is much more pleasant for us to work in, as well. 2) FEEDING OUR SOWS AND PRE AND POST-FARROWING Sows are brought into crates no more than 6 days prior to due date and no less than 3 days. Gilts are always loaded in the first 6 stalls, to enable more effective monitoring. Sows and gilts transition from being fed 5.5 pounds of feed once a day, to being fed 2 pounds twice a day. We are very strict on the 2 pounds per feeding, to the point of cutting a scoop down that will only fill 2 pounds. When the sows are over-fed prior to farrowing, there is the potential to have trouble with udder edema, which leads to very poor milk let-down. Feeding the Sows All sows come to the crates with their individual cards and their previous feed card. Any and all information regarding the sow is documented and is very valuable to the farrowing technician. Information on the cards include early/late farrowings, savaging, history of stillborns, illness, quality of teats and underlines, good milker, good mom, etc. The farrowing technician will examine the feed card. We find that 90% of our sows do pretty much the same as they did the previous time in the crates. It is beneficial to document what you learn from each sow in the long run, as you will find she can be London Swine Conference – Production Technologies to Meet Market Demands April 1and April 2, 2015 59 predictable throughout her parities. The exception, of course, is cases of lameness and illness. Feed Card Our sows are fed twice per day, and we make sure she gets up each time. Be honest on your feed card. I want to see a perfect intake, but that is not what I am looking for. The only time we do not follow this feeding regime, because it works so well for us, is when she tells us she does not want to eat. Then, we ask “Why?” Some reasons could be: • Past history • Fever • Discharge • Lameness • Hard udder • Unhappy gilt. Every morning, any un-eaten feed is removed, and the sow’s feeder is cleaned. The only department in the barn, where it is ‘okay’ to waste feed, is in the farrowing crates. It is imperative that the lactating sow has fresh feed. It is crucial to continuously challenge her. If she isn’t eating, she cannot produce enough milk. In Summary Feeding a lactating sow is truly an art. If we want these girls to eat 30-40 pounds per day, we need to figure out how to do it, and how to do it well. We are asking that she wean big, healthy pigs. Then, within 5 days of weaning, be in good enough condition to re-breed, and to do it for several parities. 3) STANDARD OPERATING PROCEDURES – DAY ONE AND ONWARD Day One At 7am feeding: • Flip the ID cards of the sows that have or are farrowing • Scrape. Everyone gets up at every feeding, unless they are farrowing. • Assist immediately if your sow is in distress and if she has few dry piglets. • Document stillborns and mummies as you are behind her cleaning up. Administer 1cc of Oxytocin if you are confident she is finished. This is to ensure she is cleaned out. • When the sow is finished farrowing, the back heat lamps are turned off to encourage the piglets to stay up front. Processing litters: • Litters must be completely dry to process. • When you are in the crate retrieving your piglets, check out your sow’s udder. • Sex-separate in the cart. Document m/f/wt/stillborns. All females are tagged. • All needle teeth are clipped to the gums. • Umbilical cords are snipped and sprayed with Betadine solution. • All runt litters receive “Pig Kare” – liquid energy. 60 London Swine Conference – Production Technologies to Meet Market Demands April 1and April 2, 2015 Our fostering technique It is very important to have litters with as many siblings together as possible, creating equal and competitive families. This ensures maximum colostrum intake. Our fostering strategy is usually based on the needs of the weakest pigs. We strive to eliminate starveouts and reduce the competition for small piglets. This should be done early enough to reduce variability in the litter and to ensure piglets have latched on to their new mom. The ideal time to foster a pig is as soon as it has been processed, provided that the piglets that are moved within this period are onto another sow that is at a similar stage, and once you know they have received colostrum from their own mom. On big litters when we are unable to downsize litters promptly, we do ‘split suckling’. We put half of the litter in a ring under the heat lamps (usually the biggest pigs) leaving the smaller pigs total access to the sow’s udder. We try to do that 3 times per shift. Litters are usually left alone until Day 4, unless, of course, if there is a starve-out or you have to downsize. Day Four The complete litter is picked up and put in the processing cart. All of the pigs receive 2cc of iron, males are castrated, and all pigs have their tail docked, leaving them a little longer for breeding stock. All wounds are sprayed with a Betadine solution. This is an opportunity to pull the 13th and 14th pigs and the starve-outs and put onto a nurse sow. Select a docile sow with a good teat profile and good feed intake. Her existing litter has to be 10 days old and weigh 4 kg’s, and they will be moved to a piggy deck. During the lactation phase, the sow is monitored daily for feed intake, condition, and spirit. Piglets are monitored for lameness, illness, and fallouts, and are treated accordingly. In Summary Becoming efficient at these tasks sets you up for good results throughout the sows lactating period. Attention to detail is beneficial to the success of that room’s mortality as well as it’s weaning weights, return to estrus, etc. Understand and implement your fostering strategies, and do a good job. Always try to be consistent, and don’t deviate. 4) THE PEOPLE BEHIND THE PIGS We all know that if it wasn’t for the people, we wouldn’t have pig barns. Not everyone is going to be a passionate pork producer, or perhaps not even a good one, but there are attitudes and encouraging direction in which we can lead them to success. Keys to Success for Managers It’s all about the staff, first and foremost. As Managers, “Walk the Walk”, “Talk the Talk”. Be knowledgeable. Be fair, and listen. Have a good sense of humour. Be a holder of high standards, and don’t deviate from that. Be generous with compliments in regard to their skills. London Swine Conference – Production Technologies to Meet Market Demands April 1and April 2, 2015 61 Keys to Success for Employees Husbandry skills This is a vital skill for employees. The best stock people like their pigs, have a good understanding of their needs, and are determined to meet their needs. Always provide the pigs a high level of care, which results in optimum health, welfare, and performance. Use your Six Senses: Hearing → Pigs talk, you just have to listen. Sight → You have to ‘look’ to see. Learn what to look for. Touch → Hot, cold, bumpy, raised, etc. Smell → Rancid feed, E-coli scours/dehydration scours, environment issues. Taste → OK, maybe not so much… Common Sense This is the most important. Think things through. ‘Doing nothing’ is far worse than doing something. Use your ‘Common Sense’. Attention to detail This is a crucial skill to have. It is when you are thorough in accomplishing a task, with concern for all the areas involved, no matter how small. Always perform your work with care and attention. Always check what you do for completeness, accuracy, and pride. Team performance The best success is when a team performs together, respects each other and the company they work for, and have the desire for all to succeed. It is about helping each other and being proud of all accomplishments, big and small, for everyone. Know your targets, know your results. Know the standards of the company. Be proud of your accomplishments. IN SUMMARY Lowering your pre-weaning mortality is attainable and sustainable if you give attention to details to the 4 key areas we have covered today. Use all resources available to you – professionals, vets, nutritionists, and technical service people. Initial and on-going training for staff is essential and beneficial. ACKNOWLEDGEMENTS Our statistics are compiled using the FARMS program. 62 London Swine Conference – Production Technologies to Meet Market Demands April 1and April 2, 2015 London Swine Conference – Production Technologies to Meet Market Demands April 1and April 2, 2015 63 ELECTRONIC SOW FEEDING: SLAT-LEVEL CONSIDERATIONS Thomas D. Parsons School of Veterinary Medicine, University of Pennsylvania 382 West Street Road, Kennett Square, PA 19348 E-mail: [email protected] ABSTRACT Practical considerations regarding the implementation of electronic sow feeding (ESF) are discussed in detail. A variety of solutions have been identified to be successful in North America and farm specific details will determine which option is the best solution. INTRODUCTION Electronic sow feeding (ESF) is the only alternative to gestation stalls that provides true individual animal nutrition. For producers with high production expectations, it is likely the best choice. ESF also promises the opportunity to further automate sow management (eg spray marking of animals requiring vaccination or selection of animals needing to move to farrowing). ESF farms are pushing above 30 pigs weaned per sow per year and thus the technology itself, if properly managed, is not a barrier to outstanding production. Our experience is drawn from the feeding of over 150,000 sows with ESF on 65 farms in both the US and Canada. The farms range in size from 100 to 10,000 sows, utilize a variety of common genetic suppliers, and are either family-owned and operated or company- owned and run with hired labor. We do not face the same detailed regulations as found in the EU or such guidelines as exist in Canada. Thus we have more flexibility in our solutions to pen gestation. Outlined below is a brief overview of a variety of topic we have found important. SLAT LEVEL CONSIDERATIONS Parity Segregation We routinely recommend that farms practice some degree of parity segregation when organizing the flow of their animal through a pen gestation barn. Gilts are one of the most valuable assets on the farm and the farms that have elected to flow the gilts separately from higher parity sows are afforded several opportunities. These animals can be feed differently (e.g. different ration than the sows) and managed differently (perhaps attended to by best available labor). When mixed with higher parity sows, the smaller, still growing gilt can be at a disadvantage and suffer negative consequences from being at the bottom of the social order. It may also be possible to segregate smaller P1 animals with gilts or to further subdivide the older parity sows (eg P2’s from the rest) in an effort to reduce stress and competition in the pen environment. Group Structure Dynamic – Group constituency is constantly changing. Essentially this is a continuous flow system and hence space utilization can be optimized. Dynamic flows are required on small farms where the weekly breeding group is less than that supported by a single ESF station. This will range between 50 and 75 sows depending upon the manufacturer of the 64 London Swine Conference – Production Technologies to Meet Market Demands April 1and April 2, 2015 ESF station. We have used dynamic flows on 700 sow farms, on 1400 sow farms that choose to flow gilts separately from the rest of the herd, and on 2800 sow farms in combination with static pens (see below). Dynamic flows work very well with big groups of sows as the social hierarchy is less rigid and thus the addition and or removal of animals from the pen is more easily accomplished. We have been able to take sows in and out of big dynamic pens essentially at will and with impunity. Dynamic flow also works well pre-implantation systems as the 21 day returns to heat can be simply rebred and left in the pen to join the appropriate farrowing group. One major challenge to the implementation of a dynamic system is the loss of the physical integrity of breeding group. To appropriately flow the big group dynamic system, the weekly breeding group is divided and spread across several different pens. Management practices need to be adapted to accommodate the distributed nature of individual breeding groups which often involves an increased reliance on management and ESF system software and its ability to color mark or sort out specific animals within a pen. Static – Group is constituted once, social hierarchy stabilizes, and the group is left intact for the duration of gestation. The implementation of static groups is often attractive because the physical integrity of the breeding group is typically left intact and some semblance of a breeding snake can be organized in the gestation barn. However, variations in weekly breeding targets, and any unanticipated fallout from a group can lead to suboptimal space utilization of the facility as stable groups function as an all-in-all out flow. We recommend static groups on large farms where a weekly breeding group is as large as or larger than the optimal number of sows supported by a single ESF station. A 1400 sow unit with a weekly breeding target of ~70 sows is the minimal sized system facility for implementation of static groups. However, if one chooses to flow gilt separately from sows as we recommend, this reduces the number of sows available in week to constitute a static group to ~54 head and depending upon the ESF station maybe too small to fully utilize its capacity. We most often start the implementation of static groups with 2800 sow barns. Here we would have about 90 sows and 30 gilts comprising the weekly breeding group. We make one static group of ~75 sows per week and then run the gilts and remaining sows in separate dynamic flows. This captures the convenience of a static system, but helps maximize space and feeder utilization as expected from a dynamic flow. Static flows are simplest with 5600 or larger sow units. We more often see static flows coupled to post-implantation systems. On farms that are weaning and refilling farrowing rooms several days a week, they may constitute a static pen, but emptying it dynamically, e.g. over a 3 or 4 day window. This can lead to some sub-optimal space utilization in gestation, but helps to maximize weaning age. In sum, the decision about group structure largely depends on farm size. For farms practicing parity segregation of gilts in gestation, dynamic groups are used for herds of 1200 sows or less, static groups for herds of 5000 or more, and herds with size in between these can use some combination of static and dynamic groups optimize animal flow and productivity. Time of Group Formation Pre-Implantation – Sows are crated after weaning and bred in the stalls. Groups are constituted as soon as animals are out of standing heat. The pre-implantation system also allows a sow earlier access to the ESF station during its production cycle which has the London Swine Conference – Production Technologies to Meet Market Demands April 1and April 2, 2015 65 potential to provide a more sophisticated nutritional program than could be achieved in a gestation stall. The pre- implantation system minimizes the number of gestation stalls in the facility (e.g. typically 2 weeks of production or less) and prioritizes the management of sows in pens. However, a pre-implantation system may be less forgiving to implement as there is a 3 to 5 day critical window for moving of animals into pens that must be respected to insure high farrowing rates and large litter sizes. Post-Implantation – Sows are crated after weaning and bred. Groups are constituted only after being confirmed pregnant at ~35 days. Implantation is complete before mixing sows, minimizing the possible reproductive negative impact. This approach is initially attractive as it leaves the basic reproductive management of the sow unaltered from a crated barn and physical integrity of breeding group can be left intact if farm size is large enough. Our experience is that both pre- and post-implantation systems can support good production. Some of our best ESF herds are above 30 pigs weaned per sow per year and are using a pre-implantation system. Thus, pre- implantation group formation is not unto itself a barrier to a highly productive sow herd. Figure 1 demonstrates that ESF barns with pre-implantation group formation can achieve high levels of production. Farrowing rate data from 14 weeks of production on a 2400 sow farm is presented and all groups are statically indistinguishable from 90%. This figure also highlights how neither static nor dynamic group formation precludes productivity. On this farm, the 1st 75 to 80 sows breed in each week are placed in a static pen while the remaining sows in the breeding group enter dynamic pens. Gilts flow separate from sows and also enter dynamic pens. Farrowing rates from these 3 different types of flow are not statistically different from each other. This example represents one of the better comparisons between different animal flow options in ESF as it is made with a single barn and thus genetics, nutrition, and management are the same across all three different types of flows. Design of Pens While ESF is an outstanding way to feed sows, it per se does not do much to help mitigate the untoward effects of animal-animal aggression common in groups of pigs. Successful implementation of ESF also requires the management of social hierarchy in pen gestation. There are several important details in the design of the pen layout that helps to insure success. Some factors to consider are: Space Allowance – Many of our farms were designed with pens having a stocking density of 18 to 20 sq ft (1.67 to 1.86 sq m) per head. As producers have become more accepting of alternatives to gestation stalls and are more open to questions of how best to implement these alternatives, we have been putting some barns in at 22 sq ft (2.04 sq m), which is similar to the European standard for a pen with more than 40 sows. As stocking density decreases (or space allowances increase), the social dynamics for the sows are less intense and thus management of the pens are more forgiving. On new construction, larger space allowances translate into increased construction cost whereas on a retrofit this can result in loss of inventory. Feeder Capacity – We target the placement of ~75 animals per electronic sow feeder. Pen Size – For dynamic pens, we favor the use of pens with 2 or 3 feeders per pen or at least 150 sows per pen so that the social hierarchy is less well maintained and thus makes it easier to introduce new animals. As the number of animals in the pen increases the harder 66 London Swine Conference – Production Technologies to Meet Market Demands April 1and April 2, 2015 it is for barn staff to provide quality individual animal care and thus why we typically do not use more than 3 feeders per pen and thus resulting in a maximum number of animals in a pen to ~230 head. With static pens, we use a single feeder with 75 to 80 head per pen. In pre-implantation barns, we typically place 80 to 85 head in static pens to anticipate the standard fallout out a few sows at 21 days post-breeding. These recycling animals are moved from the pens to the breed row to be inseminated again and space utilization in the pen is optimized. Pen Shape – We prefer a rectangular shape. The feeder is placed in the fence line of one of the long sides of the pen to accommodate automated sorting of animals from the pen. The rectangular shape insures that there is sufficient flight distance for a sow to escape her aggressor and increases the amount perimeter for a given square foot of pen as sows like to lie along the perimeter. This pen design tends to creates a natural traffic zone for sows to move unimpeded to and from the feeder. Pen Dividers – We recommend the use of pen dividers along the back wall of the pen to create “bedrooms” for the sows. This further increases the perimeter of the pen which promotes orderly laying patterns and allows for the development of social sub-populations in the pen. We often observe the same animals lying in the same bedroom. We recommend that farmers label each of these laying areas as a convenient reference with which workers can find animals. Solid Laying Areas – We recommend that the flooring of the bedrooms be solid. We are not legislated in our country with regard to flooring and requirements for solid areas. However, the animals will prefer the solid area for laying compared to a slat and thus this helps to further order the pen. Waterer Placement – We prefer to place the waterers close to the entrance and the exit of the feeders. This discourages animals from sleeping there and creating congestion around the station. ACKNOWLEDGEMENTS Many people have contributed to the development of ideas detailed here and include Drs. Zachary Matzkin, Ines Rodriguez, and Meghann Pierdon as well as Mark Lewis, Mark Ebaugh, Jeff Schoening, Bruce Schroeder and the staff at Schauer Agrotronics, Prambachkirchen, Austria. London Swine Conference – Production Technologies to Meet Market Demands April 1and April 2, 2015 67 100% 90% 80% Farrowing Rate 70% 60% 50% 40% 30% 20% 10% 0% Sow Static Sow Dynamic Gilt Dynamic Figure 1. Reproductive performance on a pre-implantation ESF farm. Three types of animal flow are represented from the same 2400 sow farm. Number of breedings contributing to the farrowing rate for each flow type are: sow static = 1128 sows; sow dynamic = 426 sows; gilt dynamic = 415 gilts. 68 London Swine Conference – Production Technologies to Meet Market Demands April 1and April 2, 2015 Day 2: Wean to Finish – Main Sessions London Swine Conference – Production Technologies to Meet Market Demands April 1and April 2, 2015 69 TRADE STOPS HERE! HOW TRADE BARRIERS UNDERMINE CANADA’S INTERNATIONAL COMPETITIVENESS Kathleen Sullivan Kathleen Sullivan Consulting Ottawa, Canada E-mail: [email protected] ABSTRACT In 2014, Canada exported $3.7 billion in pork products to 100 countries around the world. Over 90 percent of Canada’s pork exports are going to just ten countries, including the U.S., Japan, Russia, China and Mexico. Exports are now driving the growth in Canada’s domestic pork production. The Canadian hog industry has significant opportunities abroad, particularly in the wake of the many new trade agreements Canada has or is negotiating with major pork markets including the EU and Japan. However, Canada’s pork industry must have a solid and strategic understanding of international trade; including the mechanics and benefits of international trade deals and the perils and disruptive impact of trade barriers imposed by our major trading partners, in order to maintain its competitiveness in international markets. TRADE MATTERS Since 1995, Canada’s pork production has increased by almost 60 percent, even though domestic pork consumption has fallen and pork imports are on the rise (Table 1). Table 1. Canada’s pork production, trade and domestic consumption. Production (000 MT)i Exports (000 MT)ii Imports (000 MT)iii Domestic Disappearance (000 MT) Per Capita Consumption KG (Carcass)iv 1995 1275.8 357.0 40.2 814.8 27.8 2000 1640.0 636.7 74.1 880.5 28.7 2005 1918.5 1030.5 137.1 742.6 23.0 2010 1933.6 1098.2 182.4 746.7 22.0 2011 1969.6 1152.7 191.5 731.8 21.4 2012 1999.5 1189.4 221.1 769.8 22.2 1183.6 201.2 745.3 21.2 232% 400% -9% -24% Year 2013 Growth 70 57% London Swine Conference – Production Technologies to Meet Market Demands April 1and April 2, 2015 Exports are now responsible for all of the growth in Canada’s domestic pork production. Today two-thirds of Canada’s pork is exported. Canada is the fifth largest exporting country in the world, after Germany, the United States (U.S.), Denmark and Spain, and the third largest exporting region after the European Union (EU) and the U.S. (Table 2). Table 2. Global pork exports, 2011v. Quantity (tonnes) Value (US $000) World Position Germany 2,225,570 $6,640,321 1 United States 1,925,976 $5,865,108 2 Denmark 1,594,878 $4,395,891 3 Spain 1,214,441 $3,717,779 4 Canada 1,088,283 $2,905,684 5 Netherlands 1,073,371 $2,800,864 6 Country In 2014, Canada exported $3.7 billion in pork products to 100 countries; with over 90 percent of products going to just ten countries, including the U.S., Japan, Russia, China and Mexico (Figure 1). The industry’s increasing reliance on export markets necessitates a solid and strategic understanding of international trade; including the mechanics and benefits of international trade deals and the perils and disruptive impact of trade barriers imposed by our major export partners. Figure 1. Canadian domestic exports of pork and pork productsvi. London Swine Conference – Production Technologies to Meet Market Demands April 1and April 2, 2015 71 THE EVOLUTION OF TRADE DEALS Free Trade Agreements (FTAs) are legally binding treaties between two or more countries. FTAs include measures designed to reduce trade barriers and to facilitate the smooth movement of goods, services, capital, people and ideas across national borders. Multilateral FTAs The first major multilateral FTA was the General Agreement on Tariffs and Trade (the GATT), which was implemented in 1947 by 23 countries accounting for 80 percent of world trade.vii The GATT’s focus was to reduce tariffs on industrial goods. The GATT also introduced the concept of most-favoured-nation (MFN) – a provision requiring that each WTO member receive the same tariff treatment as that extended to any other country competing in the same market. Since 1947, the GATT has expanded to include additional members and new areas of trade. In 1995, the provisional organization overseeing the GATT became the World Trade Organization (WTO). Today, the WTO has 160 members and is responsible for four international trade agreements: the GATT, the General Agreement on Trade in Services (GATS), the Agreement On Trade-Related Intellectual Property Rights (TRIPS) and the Agreement On Trade-Related Investment (TRIMS). The WTO and its predecessor organization have overseen many rounds of trade negotiations since 1947. Most important for agriculture was the WTO Uruguay Round launched in 1986 and concluded in 1994. The WTO Uruguay Round Agreement was the first major trade agreement to include agriculture and it contained the most comprehensive and far-reaching multi-lateral agriculture commitments ever negotiated, including: • Tariffication – WTO members agreed to replace any existing import restrictions with tariffs. For example, if a domestic policy resulted in domestic prices being 90% higher than world prices, a new tariff of around 90% was introduced in its place. • Tariff Quotas – WTO members agreed to “lock in” existing import volumes using a system of tariff rate quotas (TRQs). Under the TRQ system, imports would be subject to low rates of duty up to a predetermined limit that reflected historical imports, while imports over that limit could be subject to significantly higher rates of duty. • Tariff Cuts – Developed countries agreed to cut tariffs on agriculture goods by an average of 36%, in equal steps, over six years. Developing countries agreed to make 24% cuts over 10 years. In the WTO Uruguay Round Agreement, WTO members also agreed to reduce domestic agriculture support programs that had a direct effect on production and trade, and to reduce export subsidies. The WTO Uruguay Round was the first and most important agriculture deal. Notwithstanding the progress made in the Uruguay Round, it was just a first step in liberalizing agriculture trade. Further attempts to expand agriculture commitments took place in the WTO’s Doha Development Round. These talks were launched in 2001 but disintegrated in 2008 and have yet to produce any significant results. Even today, global 72 London Swine Conference – Production Technologies to Meet Market Demands April 1and April 2, 2015 agriculture tariffs remain significantly higher than tariffs on other products, like industrial goods and textiles. Regional and Bilateral Trade Deals While efforts have been underway to expand trade liberalization through the WTO, countries have also focused on bilateral and regional trade deals. Today, there are 398 Free Trade Agreements in force around the world.viii The three largest and most significant of these include: • The European Economic Area (EEA), which came into force January 1, 1994, and includes 27 of the 28 European Union countries; as well as Iceland, Liechtenstein and Norway. The EEA ensures the free movement of people, goods, services and capital across its member countries. The EEA has a population of 509 million people and a GDP of US$18 trillion. • The North American Free Trade Agreement (NAFTA), which came into effect January 1, 1994, incorporate the Canada-U.S. Free Trade Agreement and eliminated most tariffs between Canada, the U.S. and Mexico. Agriculture was the only topic not negotiated trilaterally in the NAFTA. The Canada-U.S. agriculture agreement contains a number of restrictions on sugar, peanuts, dairy, and poultry products. The NAFTA members have a population of 444.1 million, a GDP of US$17 trillion and annual trade of US$946.1 billion.ix • The Association of Southeast Asian Nations (ASEAN)-China Free Trade Area (ACFTA), came into effect January 1, 2012, between China and the ten members of the ASEAN. The ACFTA reduced to zero tariffs on 7,881 product categories, or 90 percent of imported goods. The ACFTA countries have a population of 1.9 billion, a GDP of US$5.8 trillion and a trade volume of almost US$950 billion.x FTAs Impacting Canada’s Hog Industry In the 1990s and early 2000s Canada focused on concluding the WTO Uruguay Round negotiations. During that time, Canada also concluded a number of bilateral trade deals with relatively small trading partners; however, few of these had any significant impact on Canada’s pork sector. In recent years, with implementation of the Canada-Korea FTA in 2015, the signing of the Canada-EU CETA in 2014, Canada’s membership in the Trans Pacific Partnership and Canada’s FTA negotiations with major economies like Japan, this situation has changed. Today, Canada has free trade deals with the U.S., Mexico and Chile that provide duty free access for Canadian pork products, while Canada’s new FTA with South Korea will eliminate tariffs over 5 to 13 years. Canada is also negotiating FTAs with Japan and Australia. While the EU is not one of Canada’s major pork export markets today, the Canada-EU CETA raises the potential for significant new exports into that region. Under the CETA, which was signed in August 2014, Canada will have 80,549 tonnes of tariff free pork access to the EU, phased in over six years, as well as immediate duty free access for London Swine Conference – Production Technologies to Meet Market Demands April 1and April 2, 2015 73 processed pork products. It has been estimated that when fully implemented, the CETA will result in $400 million in Canadian pork exports to that region. Table 3. FTAs between Canada and its major pork export markets - pre 2015. 2014 Pork Exports (CDN $ mill) Existing Trade Deals Current Pork Tariffs New or Future Trade Deals U.S. $1,450.0 NAFTA 0% TPP Japan $ 951.4 WTO MFN 4.3% TPP, Canada/Japan FTA Russia $ 330.8 WTO MFN 20% - China $ 202.2 WTO MFN 15% - Mexico $ 189.2 NAFTA 0% TPP South Korea $ 97.3 WTO MFN Up to 25%* Canada-Korea FTA Australia $ 94.3 WTO MFN 5% TPP Taiwan $ 55.2 WTO MFN 15% - Philippines $ 48.1 WTO MFN 30 – 35% - Chile $ 40.3 Canada-Chile FTA 0% TPP Export Market * South Korea: Under the Canada-South Korea FTA, which came into effect January 1, 2015 pork tariffs will be eliminated over 5-13 years. NON-TARIFF TRADE ISSUES In addition to tariffs, Canadian pork exporters often encounter non-tariff trade barriers – measures implemented by an importing country ostensibly to protect animal, food or human safety. For example, before accepting Canadian pork products, an importing country will generally require confirmation that Canada’s meat inspection system is equivalent to its own, assurance that the actual processing facility meets its own processing standards, and product registration and certification by the Canadian Food Inspection Agency (CFIA). An importer may also limit imports of pork products based on the use of certain inputs, like ractopamine, or on the presence or risk of certain diseases, like Trichinosis or PRRS. While FTAs permit countries to implement domestic measures to protect health and sanitation, non-tariff barriers are sometimes introduced merely to block trade. As tariffs on agriculture products come down, countries are becoming increasingly creative in using non-tariff measures to protect their domestic agriculture sectors. Non-tariff barriers can add significant cost to Canadian pork products, reduce Canada’s competitiveness and, in extreme cases, close markets entirely. While bilateral and international dispute mechanisms have been set up to resolve complaints about trade distorting non-tariff barriers, these processes are often slow and not always effective. 74 London Swine Conference – Production Technologies to Meet Market Demands April 1and April 2, 2015 United States While the U.S. is Canada’s largest and most stable pork export market, U.S. mandatory Country of Origin Labelling (COOL) is the most costly non-tariff trade barrier Canada’s pork industry is currently facing. U.S. COOL was introduced in 2008 and requires U.S. retailers to label fresh beef, pork and other food products with their country of origin. Under COOL, meat can only be labelled as being a product of the U.S. if the source animal is born, raised and slaughtered there. Meat from animals that are born or raised in other countries but slaughtered in the U.S. must be segregated and labelled to indicate the countries where birth, raising and slaughter occurred. Canada has argued that COOL discriminates against Canada by adding costs to U.S. producers, processors, distributors, and retailers that use Canadian animals and therefore must segregate Canadian and American animals during each stage of the production process. By contrast, those handling U.S. animals don’t incur these costs.xi After Canada filed a complaint with the WTO in 2008, the WTO determined, in 2012, that COOL violates the U.S.’s trade obligations. In response, in May 2013, the U.S. announced changes to COOL, but the new requirements only increased discrimination. Canada complained again and, in October 2014, the WTO determined that the revised COOL violated the U.S.’s international commitments. The U.S. has appealed this decision. To date, the WTO COOL complaint has lasted for seven years. Canada’s hog industry estimates that COOL has resulted in over $400 million a year in losses over that time period. Even if the U.S. loses this final WTO appeal, Canada’s only legal recourse will be to impose retaliatory tariffs on U.S. products as a form of compensation for the damages COOL has caused. Unfortunately, Canada cannot impose any retaliatory measures against the U.S. until all appeals have been concluded – likely in mid 2015. In the mean time, Canada has developed a retaliation list, which, in addition to cattle, hogs, beef and pork, includes apples, cherries, corn, rice, maple syrup, sugar, chocolate, pasta, baked goods, potatoes, frozen orange juice, ketchup, wine, jewellery, stainless steel, parts for heating appliances, grinding balls for mills, swivel seats, wooden office furniture and mattresses. Japan Japan is a large and stable export market for Canadian pork. In 2014, Canada exported $951 million in pork products to Japan, representing over one quarter of Canadian pork shipments. Today, Japan is Canada’s second largest pork market, and Canada is Japan’s third largest pork supplier, after the U.S. and the E.U. Japan’s pork tariffs are relatively low. The major barrier to trade is Japan’s Gate Price System. During the WTO Uruguay Round negotiations, Japan declined to establish tariffs and tariff rate quotas for pork products. Instead, Japan implemented a system of Gate Prices (minimum import prices). If pork imports are valued at or above the Gate Price, the importer pays only the simple tariff (4.3 percent for fresh, chilled or frozen meat). If pork imports are valued below the Gate Price, the importer must pay the difference between the Gate Price and the import value in addition to the 4.3 percent tariff, which is applied at the London Swine Conference – Production Technologies to Meet Market Demands April 1and April 2, 2015 75 Gate Price value.xii In practice, importers and exporters work hard to assemble mixed high and low priced products to avoid a shipment falling below the Gate Price. This practice is, however, complicated. Japan also has an emergency tariff measure on pork with a “snap back” mechanism to return the Gate Price to a higher bound level whenever total imports in a given quarter are 19% higher than the previous three-year average from the start of the Japanese fiscal year to the end of that quarter. This effectively raises the minimum import price of pork. The snapback has not been triggered since 2004, but it is automatic and will be triggered whenever the snapback conditions are met, creating the possibility of considerable market fluctuations for suppliers.xiii Many consider that moving from a Gate Price to a tariff system will only be possible through WTO multilateral negotiations, however, others suggest there may be sufficient negotiating leverage through the TPP to encourage Japan to modify this system. Russia In recent years, Russia has become a large and important export market for Canadian pork products. However Russia has proven to be unpredictable and Canada’s pork sector has encountered a number of challenges in that market. In 2012, without notice, Russia introduced a ban on the importation of meat derived from animals raised using ractopamine. Russia also suspended the certifications of many Canadian pork establishments. The impact was significant. By 2012, Canada’s pork exports to Russia had grown to 207,123 tonnes valued at almost $500 million. In 2013, after the ban was imposed, Canadian pork exports dropped by more than half to 92,600 tonnes valued at $260 million. Table 4. Canadian pork exports to the Russian Federation. 2008 CDN $000 Tonnes 2009 2010 2011 2012 2013 $287,653 $101,800 $185,390 $358,687 $492,036 $260,237 129,730 58,872 87,131 142,478 207,123 92,614 In 2013, Canada was able to negotiate with Russia and secure Russia’s agreement to accept Canadian pork produced under either the EU Ractopamine-Free Pork Certification Program or the Canadian Ractopamine-Free Pork Certification Program. At the time, thirty-five Canadian pork establishments met those requirements. Considerable progress was being made to increase exports when, in August 2014, Russia placed a one-year embargo on agriculture imports, including pork imports, from countries that had imposed economic sanctions against Russia. The products embargoed by Russia included over 90 percent of Canada’s pork exports to that country. The impact on Canadian exports has been devastating. In 2014, monthly exports to Russia peaked in June at $63.5 million. By August, when the embargo was announced, monthly exports dropped to just $6.9 million (Figure 2). The situation was exacerbated when, in fall 2014, Russia imposed restrictions on the import of all Canadian pork products in response to ractopamine concerns. Pork fat and offal, which were initially exempted from 76 London Swine Conference – Production Technologies to Meet Market Demands April 1and April 2, 2015 Russia’s embargo, were caught by this new ban, which essentially shut down all Canadian pork exports to Russia. China China is the largest pork producer in the world, accounting for half of the world’s pork production and consumption. China’s pork imports, 790,000 tonnes in 2014, although large in relative terms, account for less than 2% of that country’s domestic consumption.xv China’s main sources of imported pork are the U.S., the EU (Germany) and Canada. Figure 2. 2014 Canadian pork exports to Russia ($ million).xiv Although China is a member of CODEX and a signatory to the WTO SPS Agreement, China is not consistent in recognizing, adopting or applying international standards. Canada experienced this in 2009 when China imposed bans on imports of pork from several Canadian provinces and imposed certain restrictions on all Canadian imports with the discovery of H1N1 in Canada. Access was eventually resumed but only after almost a year of diplomatic and political engagement. Today, Canada faces challenges with China’s zero-tolerance policy for residues of veterinary health products, including antibiotics, and for its ban on the growth promotant ractopamine. In 1992, China banned the use of all beta-agonists, including ractopamine. Although Codex has established a maximum residue level (MRL) for ractopamine, China has yet to recognize that MRL. Today, China accepts meat from animals raised under Canada’s Ractopamine Free Pork protocol but suspends any establishment found to have a violation. Because of Canada’s high health standards, it has become a centre for livestock genetics. China traditionally has high incidence of disease in its swine herd, driving the importation of foreign, including Canadian, breeding stock. However, China’s health protocols governing the importation of live animals exceed international standards. Typically, it takes three months for live hogs to be approved for shipment to China. This varies from typical procedures in other countries, which generally take just one month. The European Union In August 2014, Canada and the EU signed the Canada-EU CETA. When the CETA is fully implemented, Canada will have over 80,000 tonnes of duty-free pork access to the London Swine Conference – Production Technologies to Meet Market Demands April 1and April 2, 2015 77 E.U. The CETA will also provide immediate duty-free access for all processed pork products. Notwithstanding this significant new market access, there are a number of key non-tariff issues that are a barrier to current trade and will continue to impede Canadian pork exports to the EU if not resolved. Canada strategically leveraged the CETA negotiations to pursue a number of these. Key among the outstanding issues with the EU is processing plant facility approvals. Before a country will allow imports of meat, it must be satisfied that the exporting country’s processing plants meet the importing country’s standards. In April 2005, Canada and the EU agreed to mutually recognize the equivalence of the majority of each side's domestic food safety measures for pork, under the Canada-EU Veterinary Agreement. However, pork establishments wishing to export to the EU must still meet certain EUspecific requirements. To date, only 2 Canadian slaughter establishments and 3 Canadian processing plants have met the EU requirements. Table 5. Post-CETA market access (tonnes). Year Existing New CETA Total Duty Free EU TRQ Duty Free Access Pork Access 1 5,549 12,500 18,049 2 5,549 25,000 30,549 3 5,549 37,500 43,049 4 5,549 50,000 55,549 5 5,549 62,500 68,049 6 5,549 75,000 80,549 Canada has been actively seeking system-wide recognition from the EU of the equivalency of Canada’s meat inspection system. If achieved, Canada and the EU would accept exports of products from plants approved under the other jurisdiction’s plant inspection system. During CETA negotiations, Canada secured a commitment from the EU to resolve the question of systems equivalency within a year. CONCLUSIONS Exports are now responsible for all of the growth in Canada’s domestic pork production. Today two-thirds of Canada’s pork is exported and Canada is the fifth largest exporting country in the world and the third largest exporting region after the European Union (EU) and the U.S. The Canadian hog industry has significant opportunities abroad, particularly in the wake of the many new trade agreements Canada has or is negotiating with major pork markets including the EU and Japan. However, regardless of whether Canada has an FTA with a country or not, non-tariff trade barriers – measures implemented by an importing country 78 London Swine Conference – Production Technologies to Meet Market Demands April 1and April 2, 2015 ostensibly to protect animal, food or human safety – will continue to act as significant impediments to trade. Canada’s pork industry must have a solid and strategic understanding of international trade, including the mechanics and benefits of international trade deals and the perils and disruptive impact of trade barriers imposed by our major trading partners in order to maintain its competitiveness in international markets. REFERENCES i 2012. Supply and Disposition of Meats – Canada. Statistics Canada, Agriculture Division, Agriculture Commodities Section. ii Canadian Domestic Exports of Pork and Pork Products. Statistics Canada. CATSNET Analytics. iii Canadian Imports of Pork and Pork Products. Statistics Canada. CATSNET Analytics. iv Per Capita ConsumptionPoultry and Other Animal Protein Sources Comparison. Source: Statistics Canada - CANSIM Tables 002-0010 and 051-0001. Calculations done by AAFC-AID, Market Information Section. http://www.agr.gc.ca/eng/industry-marketsand-trade/statistics-and-market-information/by-product-sector/poultry-andeggs/poultry-and-egg-market-information canadian-industry/industry-indicators/percapita-consumption/?id=1384971854413. v Canadian Agriculture at a Glance - The changing face of the Canadian hog industry. Yan Brisson, Agriculture Division Catalogue no. 96-325-X — No. 005. Source: Food and Agriculture Organization of the United Nations, 2011 (consulted March 24, 2014). vi Statistics Canada, CATSNET Analytics. vii The GATT’s Contribution to Economic Recovery in Post-War Western Europe, Board of Governors of the Federal Reserve System International Finance, Discussion Papers,, Number 442, March 1993. http://www.federalreserve.gov/pubs/ifdp/1993/442/ifdp442.pdf viii Regional Trade Agreements. WTO. https://www.wto.org/english/tratop_e/region_e/region_e.htm ix http://www.naftanow.org/facts/default_en.asp x ASEAN, External Trade Statistics. Posted in ASEAN Statistics on Thursday, 24 July 2014. http://www.asean.org/images/2015/January/external_trade_statistic/table18_asof04Dec14.pdf xi United States Country-of-Origin Labeling (COOL) – Fact Sheet. Agriculture and Agrifood Canada. Modified 2014-11-24. http://www.agr.gc.ca/eng/industry-markets-andtrade/agri-food-trade-policy/trade-advocacy/us-trade-advocacy/united-states-countryof-origin-labeling-cool-fact-sheet/?id=1416856287926 xii Pork Policies in Japan. Electronic Outlook Report from the Economic Research Service. United States Department of Agriculture. March 2013. Kakauyu Obara, John Dyck, and Jim Stout. xiii Canadian Pork Market Access Issues. Report for Canada Pork International Annual Meeting. Toronto, Ontario. February 16-17, 2011. xv China - Peoples Republic of Livestock and Products Semi-annual. Gain Report Number 14008. February 19, 2014. Approved By: Michael Riedel. Prepared By: Ryan R. Scott and Zhang Jianping . London Swine Conference – Production Technologies to Meet Market Demands April 1and April 2, 2015 79 THE STRUCTURE OF ONTARIO’S HOG BUSINESS IN 10 YEARS Blair Cressman1 and Bob Hunsberger2 1 Ontario Territory Manager, Zoetis Canada Inc. 2 Hog Producer, Breslau, ON Outline Our goals with this presentation are to present an over-view that producers, and other industry participants, can use as an aid when thinking about the future of their farms and businesses. Farm businesses will face decisions about expansion or contraction, selling or finding successors, implementing new technologies and upgrades, complying with new regulations, meeting societal expectations, and managing price risks and costs along the way. We do not have definitive answers or recommendations. We don’t know what will happen in the future, and neither does anyone else. What we hope to do is raise points for consideration, present some of our thoughts and ideas, and have some fun discussing the topic. We will begin by reviewing the recent past. The industry had a very good 2014, but prior to that there had been several years of tight or negative margins. Current producers are survivors. We will discuss some of the strengths, weaknesses, opportunities, and threats facing the industry and include some thoughts about how to mitigate the weaknesses and threats while capitalizing on the strengths and opportunities. Our argument will be that Ontario hog farmers are nationally, continentally and globally competetive. We believe that Ontario is one of the lowest cost places in the world to raise pigs. The same is not true for the primary processing sector. Ontario and all Canadian packers need to improve their focus and enhance their competitive position in North America. We believe that communication with consumers and society will be an increasingly important function, and it is one that farmers have not done well enough in the past. There are also some wild cards that may affect hog production in the next 10 years. Things like trade disruptions, political actions, and belief systems of soccer moms can rapidly change the landscape. Developing technologies may also become factors. Some of those technologies will help the industry be more competitive and some, like tissue cultured meat, could be disruptive. The Recent Past Producing hogs has been a roller coaster ride in the last 10 years. The 3 years of 2007, 2008 and 2009 resulted in heavy losses for hog producers. The next 2 years, 2010 and 2011, were approximately break-even years. The next year, 2012, reverted to losses, and then recovery began in 2013. That year made back all of the losses of 2012. However, 2014 was the most profitable year in the experience of any of us at this conference. In fact, we believe that 2014 made more money than the cumulative profits since Jan 1, 2000. Throughout this time frame, Canadian producers were helped by a low Canadian dollar during some years. From 2000 to 2007 the dollar strengthened from $1.50 per $1US to par. With the exception of a brief period in late 2008 the C$ stayed at, or near, par with the 80 London Swine Conference – Production Technologies to Meet Market Demands April 1and April 2, 2015 $US until mid 2014. The result of this currency pricing is that from January 1, 2000 to January 1, 2015 the Canadian hog price was increased by more than $20.50/Ckg. Predictions are for the C$ to remain below par for the foreseeable future. This will improve the price for Canadian producers relative to the Americans. Ontario corn prices have been very low, in recent years, relative to US prices. Iowa, the centre of global corn production, has had higher prices because of increased corn demand resulting from ethanol production in that state. For most of the last several years, Ontario corn has had lower corn prices than Iowa. This has helped our competitive position. Disease prevalence has challenged Ontario producers. Circo Virus, H1N1 and PED have significantly affected Ontario farmers. The loss of packing capacity with the closure of Quality Meat Packers and disruptions to trade have also been negative impacts in Ontario and all of Canada. The effects of animal welfare concerns are just beginning to be felt but will increase in the next 10 years. Ontario Industry Strengths and Weaknesses Ontario is characterized by land-based family farms. Many farms use a corn, soybeans, wheat rotation and store the corn crop on the farm, often in a high moisture silo. While this is not a unique Ontario system, it is best operated here. The climate is ideal for allowing corn to be harvested at the optimum time for high moisture storage. This system generally does not result in the lowest feed conversion and best growth numbers, but because of the costs avoided, it generally results in one of the best profit levels. Risks are also spread over both hog production and cropping enterprises thus adding resilience. Ontario hog farmers are among the most competitive in the world. Often land-based farms use liquid feeding systems. This facilitates the use of food industry by-products and also reduces costs. The commercial feed industry in Ontario uses food industry by-products as well. These factors keep Ontario’s feed supplies cost competitive. As noted previously, Ontario corn costs are among the lowest in North America. Ontario has a good herd health status and competitive genetic suppliers. Some will argue that Ontario genetics are superior to US hogs. We think that, while there are excellent genetic suppliers in Ontario, the evidence shows that the average US market hog is superior to the average Ontario hog. The packing industry is a challenge for Ontario and for all of Canada. Unique to Ontario is the one-way valve on pig flow. Pigs can leave the province more readily than they can enter. Within Canada, Quebec is the only logical destination or source for the southwestern Ontario industry. However, Quebec is more willing to buy than to sell hogs. There have been times when market hogs moved from Quebec to Ontario, but these times have been intermittent and sporadic. For hog movements between Ontario and the US, it has been much easier to export than to import. The red tape has been an import deterrent. Being a hog exporter, and importing essentially no pigs, has helped Ontario’s health status but has discouraged investments in packing plants. That is likely to continue, and we predict that in 10 years, Ontario will be exporting as many or more hogs than we do today. London Swine Conference – Production Technologies to Meet Market Demands April 1and April 2, 2015 81 Canadian packers are smaller and slower than their US competitors. This results in higher costs, but there are ways to compensate. Canadian packers need to look at more automation and more on-site processing of by-products. The smaller size of Ontario packers makes it harder to supply retailers with enough product volume for large feature pricing. This almost assures that US product will continue to come into Canada. A recent negative factor for Ontario packers has been lower meat returns. The primal cut prices in Ontario have been generally lower than the USDA reported prices. This has been influenced by MCOOL. It is important for Ontario to have free trade in pork products with the US. Ontario is within a day’s drive of 50% of the population of North America and trade barriers can negate that advantage. Canada exports more than 60% of the pork that we produce, and that number is likely to increase in the next 10 years. This puts us at risk to trade barriers raised by other nations. Recent examples are the Russian embargo and the Chinese ractopamine ban. International trade is susceptible to political actions, and these can be unexpected and irrational. Another challenge facing the entire pork industry is production transparency. Ontario is especially susceptible to this due to the proximity of a large population. While most people are not animal activists, nor do they support activist activities, our industry has not done enough to communicate what we do on farms and in plants and why we do it. Some of our accepted, routine practices are hard to explain to non-farm people. This will be more of an issue in the next 10 years, and it behoves us to be proactive with communication. Other challenges for Ontario include aging of the farm population, steady or declining domestic pork consumption, and high land values and capital costs. Ontario Industry Opportunities The announcement of a planned new packing plant in Michigan is good news for Ontario farmers. While the major hog supply for that plant will be from local Michigan farmer/investors, there may be opportunities for Ontario producers to be secondary suppliers. That plant will be efficient and well run. Ontario has an opportunity to take a leadership role in consumer communication. Farm and Food Care, in Guelph, has a good team of knowledgeable people. They are developing many educational resources, and they’re communicating effectively. The Ontario pork industry, both farmers and packers, should support them and take communication training. Ontario’s proximity to population centres can be an asset and presents an opportunity to lead with transparency. The pork industry will see new technologies developed and implemented in the next 10 years. Equipment that reduces piglet losses is one example. Ontario/Canada lags the world leaders in sow productivity, and there are opportunities to improve our competitive position by getting more pigs and more pork per sow. There may be an opportunity to increase pork consumption in North America. The longheld theory that saturated animal fats cause high cholesterol and heart disease has been 82 London Swine Conference – Production Technologies to Meet Market Demands April 1and April 2, 2015 largely disproven. In fact, there is solid science to say that a higher fat diet is healthier than a high carbohydrate diet. There may be justifiable reasons to eat more bacon! Ontario Industry Threats A significant threat is environmental pressure. There are well-educated, knowledgeable people who believe that livestock agriculture produces an unacceptable environmental impact. They have some valid points that we need to address. One example is the storing and spreading of raw manure. This can result in excessive methane and nitrous oxide production. Both of those gases are more potent greenhouse gases than carbon dioxide. This is a significant threat. A related threat is our lack of attention to phosphorous use. When we apply enough manure to supply the nitrogen needs for a corn crop, we over-supply phosphorous. Too much phosphorous is ending up in the Great Lakes, particularly Lake Erie, and agriculture is a major cause of that. Hog manure is one of the sources. Environmental issues, as well as production practices, have the potential to become hot media topics. The media frequently oversimplify complex issues (antibiotic resistance) or just get things wrong. A flashy headline sells better than a complex discussion. One example is the W5 stories on animal abuse and bad production practices. Another is the reporting (since corrected) on the vaccine-autism link. Our science needs to be clear and solid. Our communication needs to be professional and effective. We have not done well enough in this area. Another evolving technology that could be significant is the tissue culturing of meat. We know how to do this now. It is not yet cost competitive and probably will not be within 10 years, but it is a developing technology that may be a factor in the future. CONCLUSIONS Ontario farmers, both land-based family operations and larger systems, will remain globally competitive. Farms will continue to get bigger and fewer. Efficiencies and productivity will continue to increase. Packers will continue to search for a place in the sun. There is room for one, or possibly two, competitive packers in Ontario. Ontario does not hold significant appeal for foreign or multinational investors. This is true for both producers and packers. BACKGROUND READING AND REFERENCES Minger, Denise 2013. Death By Food Pyramid. Primal Blueprint Publishing. 23805 Stuart Ranch Rd. Suite 145, Malibu, CA 90265 Teicholz, Nina 2014. The Big Fat Surprise. Simon & Schuster. 1230 Avenue of the Americas, New York, NY 10020 Tavris, Carol and Elliot Arnson 2007. Mistakes Were Made (But Not by Me). Harcourt Inc. 6277 Sea Harbor Drive, Orlando, FL 32887-6777 Nowakowski, Kelsey March 2015. Antibiotic Resistance. National Geographic Vol. 227:3 Achenbach, Joel. March 2015. The Age of Disbelief. National Geographic Vol. 227:3 London Swine Conference – Production Technologies to Meet Market Demands April 1and April 2, 2015 83 SOLVING HEALTH PROBLEMS WITH GENETICS Graham S. Plastow Department of Agricultural, Food and Nutritional Science, University of Alberta 1400 College Plaza, 81215-122 St, Edmonton, Alberta, T6G 2C8 E-mail: [email protected] ABSTRACT Maintenance of health continues to be one of the biggest challenges for efficient pork production. The challenge is likely to increase in the future in the face of the challenge of PRRSV, new diseases, and pressure to reduce the use of antibiotics in agriculture. Whilst there is probably genetic variation in susceptibility for all diseases little has been done to make use of it to date. This paper will discuss some examples and present recent results on PRRS and PCVAD, as well as suggested next steps and the potential for using genome editing as a weapon against disease. INTRODUCTION Canada has a high health status in relation to pig breeding and this is a competitive advantage in terms of being a world leader in the supply of pig genetics across the globe. Although it is possible to maintain this status through strict biosecurity and isolation at the top of the production pyramid, it soon breaks down at the commercial level. Instead, a range of additional management measures are required including vaccination, and threesite and all-in-all-out production. When disease occurs then one of the most important impacts, in addition to the cost of treatment and mortality, is the cost of morbidity, or put another way the impact on growth. This is an aspect that is sometimes overlooked as people talk about disease resistance, and think of a bullet-proof animal, perhaps as a result of the success of vaccination, rather than differences in levels of susceptibility. Although there are some examples of genetic resistance to disease in pigs, in most cases this is not achievable, instead we should focus on reducing the impact of disease when it occurs and how genetics can impact this component of health. One of the questions concerns whether it is possible to tackle each specific disease through genetics. The answer probably depends on the importance of the disease and whether resistance truly occurs. For example, large scale efforts may be justified in the case of PRRS, where the prevalence, cost and success of alternatives, suggest we may welcome any additional help. The latest estimate for the impact of PRRS indicates an annual cost of $664 million to the US industry alone (Holtkamp et al. 2013). An earlier estimate for Canada estimated the cost of PRRS at $130 million per year (Mussell 2010). However, in most cases unless there is evidence for resistance an alternative may be required. RESISTANCE Disease resistance is where an animal remains completely unaffected by a pathogenic agent even when it is exposed to it. The most obvious example, is where the target tissue or cells of an animal do not express the receptor that allows the pathogen to bind to cells as the first step of infection. Here we can point to the coronaviruses which have a restricted host range. For example, Transmissible Gastroenteritis Virus (TGEV) infects pigs but not 84 London Swine Conference – Production Technologies to Meet Market Demands April 1and April 2, 2015 man, whereas the opposite is the case for the related human coronavirus (HCoV-229E). The receptor for both viruses is aminopeptidase N (Delmas et al. 1992), however, differences in the structure of the host proteins leads to the difference in the host range of the viruses. People are resistant to TGEV although they also produce the protein. Resistance is due to differences in the sequence of the aminopeptidase between pigs and man. The same protein is also the receptor for another member of the coronaviruses, Porcine Epidemic Diarrhea Virus (PEDV) (Li et al. 2007, Park et al. 2015). Interestingly differences in susceptibility also depend on the cell type. For example, TGEV has both enteric and respiratory tropism whereas Porcine Respiratory Coronavirus (PRCV) shows only respiratory tropism. The difference appears to be due to an attachment factor that is required for the enteric tropism. The N-terminal domain of TGEV is required for binding to this factor and this feature is deleted in PRCV (which is closely related to TGEV) (Reguera et al. 2014). Resistance also occurs for E.coli associated scours and for both of the major determinants: E. coli F18 and E. coli K88 (or F4). Mortality from E coli F18 in naïve herds can be very high. Unlike K88 scours, F18 only occurs post weaning. This is because E coli binds to a specific receptor on the gut epithelium, however, the receptor is only present after weaning. This in part relates to the timing of the expression of the fucosyltransferase gene FUT1; when it is silent all piglets are resistant to E coli F18. In addition, a polymorphism in this gene determines variation in the susceptibility of pigs to Escherichia coli F18 postweaning (Meijerink et al. 2000, Frydendahl et al., 2003). Animals homozygous for the recessive resistant allele are completely resistant to infection by E. coli F18. Importantly, not only is mortality due to E.coli F18 decreased to zero, but the growth of the pigs is significantly higher than the surviving pigs of the susceptible genotype. van der Steen et al. (2005) reported a difference in growth rate between the resistant and susceptible pigs surviving challenge of 0.07 kg/d (P < 0.001). In this case it is clear that the benefit of breeding resistant pigs comes from reduced morbidity as well as mortality. Selection for resistance may be a useful strategy when it is identified, although its use will depend on the importance of the disease and the availability of alternatives such as vaccination. It should also be remembered that if resistance is available then its frequency can be increased relatively rapidly by screening for sires that contain two copies of the resistant allele (see van der Steen et al. 2005). However, it will be necessary to give up selection pressure for other traits. Susceptibility to a disease is often much more complicated than the example of E. coli F18. Resistance of this type may not exist for a number of reasons, for example, the receptor may be essential for the normal development or function of the animal so that it cannot be lost. VARIATION IN SUSCEPTIBILITY Although variation in susceptibility to most diseases can be observed it is usually described as being polygenic and due to different mechanisms of resistance. In these cases all of the animals become infected, but the impact of the disease and the time to recovery differs between individuals. Such differences could be related to the amount of the pathogen the individual is exposed to as well as many different management factors, but even when these aspects are well controlled, we still observe variation. The challenge experiments with Porcine Reproductive and Respiratory Syndrome Virus (PRRSV) conducted at Kansas State University show this very clearly. The viral load produced by the animals and their growth London Swine Conference – Production Technologies to Meet Market Demands April 1and April 2, 2015 85 varies greatly (Boddicker et al. 2012). Indeed, in some cases the PRRSV-infected animals continue to grow as fast as uninfected controls. Similar results have been obtained with PCV2 at the University of Nebraska (Engle et al. 2014). Nowadays we can use genome wide analysis studies (GWAS) to identify the genetic factors influencing this variation. In the case of both of these diseases the majority of the variation was polygenic, that is a relatively large number of genes distributed across the genome are involved and each explains a small proportion of the variation observed. Even so, some regions have been found to explain a relatively large amount of the variation. For PRRSV one region on chromosome 4 was found to explain more than 10% of the variation in viremia and growth after infection (Boddicker et al. 2012). The affect is dominant, so that only one copy of the beneficial allele is required to obtain the benefit. Excitingly this effect was confirmed for a second strain of the virus (Hess et al. 2014) suggesting that it could be possible to select for pigs that are less impacted by PRRSV when the positive allele is present. Sequencing of blood samples from pigs showing different viremia and growth responses appears to have identified the causative mutation responsible for reduced susceptibility (Koltes et al. unpublished results). In a separate study a significant genomic component associated with PRRSV antibody response and the number of still born piglets was identified in an outbreak herd (Serao et al. 2014). The effect observed on antibody response was relatively large and suggests that response to vaccination may be a useful indicator of variation in the impact of reproductive PRRS. Challenge experiments with Salmonella typhimurium showed significant variation in the shedding of the bacterium. Some pigs persistently shed Salmonella whereas others are able to clear the infection relatively quickly (Uthe et al. 2009). Again the variation has a genetic component suggesting it might be possible to reduce Salmonella shedding and indirectly improve food safety by selecting for pigs that more rapidly clear the infection. In this case sequence analysis of differences in gene expression in blood samples from persistent and low shedding animals identified genes whose expression level was associated with variation in shedding (Kommadath et al. 2014). Furthermore, when blood taken from the same animals prior to infection was analyzed, this difference was also present. This is another exciting finding as it suggests it may be possible to use this measure to identify animals that will clear Salmonella much more rapidly when they become infected, so that the amount of Salmonella present in lairage can be reduced. This in turn would have a beneficial effect on the effectiveness of post-mortem control of Salmonella contamination. Historically vaccination has been the most effective tool for the control of infectious diseases in animals. While vaccination is important to the swine industry, not all vaccinated pigs go on to develop a protective immune response. Another option might therefore be to select for animals that respond more effectively to vaccination. Efforts are underway to use the next-generation sequencing approaches mentioned above to see if the early molecular interactions that control response to vaccination correlate with and are predictive of a protective immune response. RESILIENCE As noted in the introduction it may not make sense to try to investigate the genetics of susceptibility for all diseases. An alternative may be to try to improve the ability of animals to respond to any infection in a way that minimizes the impact of the disease. This is now termed resilience, but is also sometimes referred to as robustness. Whilst it has 86 London Swine Conference – Production Technologies to Meet Market Demands April 1and April 2, 2015 been defined as an aim for improving pig health for a long time, results have been mixed up until now. Early work was carried out in Canada by Wilkie and Mallard (1999), who created a measure for immune response. However, despite initial promising results this did not in the end lead to a practical tool to improve the performance of pigs. One concern was that the pigs with the high response which were then selected displayed negative pleiotropic effects for other traits. Similar results were mentioned in relation to poultry. This did not stop others trying and Bishop and colleagues took a similar approach but testing for better innate immunity (Clapperton et al. 2009). Again promising results were obtained and these authors concluded that the “results suggest a role for using some immune traits…as predictors of pig performance under the lower health status conditions associated with commercial farms.” More recently Mallard and colleagues have developed an assay that is used to identify cattle that have superior antibody-mediated (AMIR) and cell-mediated immune responses (CMIR) (Wagter and Mallard 2007). These high responders have been shown to have a lower incidence of different diseases. For example, high AMIR cows were shown to have lower occurrence of mastitis, improved vaccine response, and increased milk and colostrum quality (Wagter et al. 2000). These traits are heritable and most recently significant genetic variation in the traits was found to be associated with DNA markers on chromosome 23 which is the location of the major histocompatibility complex (MHC) in cattle (Thompson-Crispi et al. 2014). This offers the potential for incorporating this trait as part of genomic selection applied in dairy cattle. Another example, this time from sheep, points to the potential of relatively simple tests to identify animals that are able to better resist infection. In this study, a multivariate analytical approach using a single blood sample enabled the researchers to rank sheep in terms of their susceptibility to nematode infection (Andronicus et al. 2014). GENOME EDITING A discussion of genomics and pig health would not be complete without including at least a brief mention of genome editing. The development of this technology – a very precise way of introducing sequence changes – represents a significant change in possibilities including the potential to create animals resistant to disease (Lillico et al. 2013). Recent gene edits in pigs include the generation of GDF8 (myostatin) mutants to increase muscle, and constructs designed to provide resistance to diseases including PRRS and Foot and Mouth Disease (Kang et al. 2014) as well as African Swine Fever Virus (Lillico et al 2013). This approach offers the potential to introduce new variation and opportunities for improving pig health. However, significant thought is needed in terms of the acceptability of the science and its application in terms of food production. Will consumers distinguish between gene editing and Genetic Modification (GM)? One of the advantages claimed for some GEs is that they “leave no detectable footprint”. Whilst technically this may be a useful attribute it may increase consumer resistance to the technology and products derived from it. CONCLUSIONS Variation in susceptibility to different swine diseases has probably been identified in all cases that have been investigated. There are clear examples where it is possible to select for resistance to a pathogen, such as E. coli F18, which is responsible for edema disease, a significant problem in some regions. However, there are still very few examples where genetics has been used to help improve pig health. One reason for this is the complexity of London Swine Conference – Production Technologies to Meet Market Demands April 1and April 2, 2015 87 the trait, in most cases animals are not resistant to a disease, instead they vary in their susceptibility to the disease agents. Another reason is the difficulty in adding a specific disease trait into selection indices. In addition, although we now have the possibility of adding genetics to our toolbox for health it is still difficult to demonstrate the potential of the approach. The availability of new high throughput genomics tools provides the opportunity to change this situation. Results from challenge experiments with PRRSV and PCV2 point to the potential to select for animals that continue to grow when faced with PRRS and PCVAD. In addition, the results from other species suggest it may also be possible to select for animals that are more resilient in the face of disease challenge. This is an attractive approach, if it is successful, as it aims to improve the overall health of animals and to reduce the impact of infection by different disease agents. This may help address some of the application issues identified above. Although the concept is relatively old, we now have many more tools to explore the potential and to help understand the pros and cons of selecting for more resilient animals. We can also begin to look at the interaction between the environment and management (including nutrition) and genotype using these tools. For example, the gut microbiome may play an important role in the development of a successful immune response, and this may in turn be influenced by diet as well as the genotype of the animal. Canadian researchers and their industry partners are at the forefront of these efforts and will be exploring resilience using genomics tools beginning in 2015. ACKNOWLEDGEMENTS I would like to thank my many colleagues working on the genomics of swine health, and especially Tom Alexander and Stephen Bishop who helped stimulate my interest in the field. Thanks also to John Harding for suggestions to improve this paper. The work described here is supported by funding from Genome Canada, Genome Alberta, Alberta Livestock and Meat Agency, Genome Prairie (grant number 2209-F), Canadian Swine Health Board, PigGen Canada, and the PRRS Host Genetics Consortium (PHGC). The PCVAD work was supported by Genome Canada and a Strategic Investment Program Grant from the Institute of Agriculture and Natural Resources of the University of Nebraska – Lincoln, by the Undergraduate Creative Activities and Research Experiences (UCARE) Program of the University of Nebraska – Lincoln, the Nebraska Tobacco Settlement Biomedical Research Development Funds, the University of Nebraska Agricultural Research Division and Hatch funds. LITERATURE CITED Andronicus, N.M., J.M. Henshall, L.F. Le Jambre, P.W Hunt, and A.B. Ingham. 2014. A one shot blood phenotype can identify sheep that resist Haemonchus contortus challenge. Veterinary Parasitology 205: 595-605. Boddicker, N., E.H. Waide, R.R.R. Rowland, J.K. Lunney, D.J.Garrick, J.M. Reecy, and J.C.M. Dekkers. 2012. Evidence for a major QTL associated with host response to Porcine Reproductive and Respiratory Syndrome Virus challenge. Journal of Animal Science 90: 1733-1746. Clapperton, M., A.B. Diack, O. Matika, E.J. Glass, C.D. Gladney, M.A. Mellencamp, A. Hoste, and S.C. Bishop. 2009. Traits associated with innate and adaptive immunity in pigs: heritability and associations with performance under different health status conditions. Genetics Selection Evolution 41: 54. Coddens, A., F. Verdonck, P. Tiels, K. Rasschaert, B.M. Goddeeris, and E. Cox. 2007. The age-dependent expression of the F18+E. coli receptor on porcine gut epithelial cells is positively correlated with the presence of histo-blood group antigens. Veterinary Microbiology 122: 332-341. 88 London Swine Conference – Production Technologies to Meet Market Demands April 1and April 2, 2015 Delmas, B., J. Gelfi, R. LèHaridon, L.K. Vogel, H. Sjöström, O. Norén and H. Laude. 1992. Aminopeptidase N is a major receptor for the enteropathogenic coronavirus TGEV. Nature 357: 417-420. Engle, T., E. Jobman, T. Moural, A. McKnite, J. Bundy, S. Barnes, E. Davis, J. Galeota, T. Burkey, G. Plastow, S. Kachman, and D. Ciobanu. 2014. Variation in time and magnitude of immune response and viremia in experimental challenges with Porcine circovirus 2b. BMC Veterinary Research 10:286. Frydendah l, K., Kare Jen sen , T., Strod l Andersen , J., Fredholm, M., Evans, G., 2003. Association between the porcine Escherichia coli F18 receptor genotype and phenotype and susceptibility to colonization and postweaning diarrhoea caused by E. coli O138:F18. Vet. Microbiol. 93(1), 39-51. Hess, A., N. Boddicker, R.R.R. Rowland, J.K. Lunney, G.S Plastow, and J.C.M. Dekkers. 2014. Genetic Parameters and Effects for a Major QTL of Piglets Experimentally Infected with a Second Porcine Reproductive and Respiratory Syndrome Virus. Proceedings, 10th World Congress of Genetics Applied to Livestock Production. Holtkamp D, J. Kliebenstein, J. Zimmerman, E. Neumann, H. Rotto, T. Yoder, C. Wang, P. Yeske, C. Mower and C. Haley. 2013. Assessment of the economic impact of porcine reproductive and respiratory syndrome virus on United States pork production. J. of Swine Health and Production 21: 72-84. Kang, Q., Y. Hu, Y. Zou, W. Hu, L. Li, F. Chang, Y. Li, D. Lu, Z. Sun, R. Zhang, X. Hu, Q. Li, Y. Dai, and N. Li. 2014. Improving pig genetic resistance and muscle production through molecular biology. Proceedings, 10th World Congress of Genetics Applied to Livestock Production. Kommadath, A., H. Bao, A.S. Arantes, G.S. Plastow, C.K. Tuggle, S.M.D. Bearson, L.L Guan, and Paul Stothard. 2014. Gene co-expression network analysis identifies porcine genes associated with variation in Salmonella shedding. BMC Genomics 15: 452. Li, B.X., J.W. Ge, and Y.J. Li. 2007. Porcine aminopeptidase N is a functional receptor for the PEDV coronavirus. Virology 365: 166-172. Lillico, S, C. Proudfoot, D.F. Carlson, D. Stverakova, C. Neil, C. Blain, T. King, W.A. Ritchie, S. Tan, A. Mileham, D. Mclaren, S.C. Fahrenkrug, and B. Whitelaw. 2013. Live pigs produced from genome edited zygotes. Scientific Reports, 3: 2847, pp. 1-4. Meijerink, E., Neuenschwander, S., Fries, R., Dinter, A., Bertschinger, H.U., Stranzinger, G.,Vögeli, P., 2000. A DNA polymorphism influencing alpha(1,2)fucosyltransferase activity of the pig FUT1 enzyme determines susceptibility of small intestinal epithelium to Escherichia coli F18. Immunogenetics. 52(12), 129-136. Mussell, A. 2010. Towards a PRRS Eradication Strategy. in Canadian Swine Health Board (CSHB) Forum. October, 2010 Quebec City, QC, Canada. Park, J-E., E-S. Park, J-E. Yu, J. Rho, S. Paudel, B-H. Hyun, D-K. Yang, and H-Y. Sin. 2015. Development of transgenic mouse model expressing porcine aminopeptidase N and its susceptibility to porcine epidemic diarrhea virus. Virus Research 197: 108-115. Reguera, J., G. Mudgal, C. Santiago, and J.M. Casasnovas. 2014. A structural view of coronavirus–receptor interactions. Virus Research 194: 3-15. Serao, N.V.L., O. Matika, R.A. Kemp, J.C.S. Harding, S.C. Bishop, G.S. Plastow, and J.C.M. Dekkers. 2014. Genetic analysis of reproductive traits and antibody response in a PRRS outbreak herd. Journal of Animal Science 92: 2905-2921. Thompson-Crispi, K.A., M. Sargolzaei, R. Ventura, M. Abo-Ismail, F. Miglior, F. Schenkel, and B.A. Mallard. 2014. A genome-wide association study of immune response traits in Canadian Holstein cattle. BMC Genomics 2014, 15:559. Uthe, J.J., Y. Wang, L. Qu, D. Nettleton, C.K. Tuggle, and S.M.D. Bearson. 2009. Correlating blood immune parameters and a CCT7 genetic variant with the shedding of Salmonella enterica serovar Typhimurium in swine. Veterinary Microbiology 135: 384-388 van der Steen, H.A.M, G.F.W. Prall, and G.S. Plastow. 2005. Application of genomics to the pork industry. Journal of Animal Science 83: E1-E8. Wagter, L., and B.A. Mallard. 2007 Method of Identifying High Immune Response Animals. University of Guelph. (7,258,858). 21-8-2007. US. Wagter, L., B.A. Mallard, B.N. Wilkie, K.E. Leslie, P. Boettcher, and J.C. Dekkers. 2000. A quantitative approach to classifying Holstein cows based on antibody responsiveness and its relationship to peripartum mastitis occurrence. Journal of Dairy Science 83: 488-298. Wilkie, B. and B. Mallard. 1999. Selection for high immune response: an alternative approach to animal health maintenance? Veterinary Immunology and Immunopathology 72: 231–235. London Swine Conference – Production Technologies to Meet Market Demands April 1and April 2, 2015 89 ARE YOU CAMERA READY? Terry L. Whiting Office of the Chief Veterinarian, 545 University Crescent, Winnipeg, Manitoba, Canada R3T 5S6 Email: [email protected] ABSTRACT In any society, the way animals are treated by people reflects a common morality; a largely unspoken framework which allows the individual to recognize “wrong” treatment of animals, and similar violations of the social order or breaches of core fundamental social norms, when they see it. Modernization with loss of clan and neighbour has included a massive urbanization of the population and isolation of the individual resulting in deep anxieties within a changing society. In the last three decades the use of animals for food and fiber in western societies has become increasingly politicized as an “animal” transforms into more of an idea than a physical reality. Ideologies of animal use and food choice have become a method for the individual to express ideas, identity and moral convictions. The assignment of ideological values to food and food choices has facilitated expression of consumer concern related to some aspects of agriculture, biotechnology, methods of production, environment protection and animal welfare. New social cause activist groups have emerged; often focused on a single animal welfare issue. The motivation for membership in such socio-moral groups is not collective material benefit; but, an individual expressive reward realized by solidaristic interaction with like minded or prestigious people within the group. Changing the background common morality is slow in free democratic societies, but is possible (elimination of skin pigment based human slavery). Also; people no longer expect to smoke in indoor public spaces; drinking and driving is no longer a source of humour. Moral cause activists, somewhat dissatisfied with the speed of democratic change, use emotional language and images; what Greenpeace cofounder Bob Hunter coined ‘mind-bombs’ in their quest of public persuasion. Visual mind bombs shock and may convince people that some human actions are wrong. For over 50 years anti-sealing activists have employed mind-bombs to transform seal pups into babies and seal hunters into barbarians in the shared consciousness of European Market political elite. This paper will describe in part, how activist groups try to exploit media to participate in moral panic. A “moral panic” is an intense feeling expressed in a population about an issue that appears to threaten the social order or core fundamental social norms. “Panic” suggests that time is of the essence. The media are key players in expressing moral norms, and in the generation and dissemination of moral indignation. INTRODUCTION In a democratic society, the public expects to have its opinion count. In considering the complex processes in agriculture and animal use, the public is likely to become engaged (believe food production is their business, compared to “none of my business”) when they believe there is significant injury or risk to themselves (BSE in Britain), or when practices result in animal suffering or damage to the environment (Burmeister 2002). Media has been instrumental in feeding and is a beneficiary of public concern (both informed and uninformed) over perceived food safety risks, “unnatural” farming practices, animal 90 London Swine Conference – Production Technologies to Meet Market Demands April 1and April 2, 2015 welfare questions and possible environmental dangers of agriculture. The articulation of the moral connotations of animal use and the political positioning and lobbying of those convictions has become a significant growth industry in Europe and to a increasing extent in North America (Tonsor and Wolf, 2010). Society has been undergoing significant and stressful changes that have accelerated in the recent past. In 1920 in the United States, the average household income of farmers was only 40% of the average for non-farmers. By the 1990s, farm household income was on average actually greater than that of non-farmer household income. Those who remained in farming also became better educated. Between 1950 and 1980 the proportion of farmdwelling American males holding a high-school degree quadrupled, almost catching up with the growing proportion of urban-dwelling HS graduates. For those who left farming, of course, living circumstances also improved. Between the late 19th Century and the late 20th Century, the percentage of citizens employed in farming in the United States fell from 50% to just 3%; in Germany from 47% to just 3%, and in Denmark from 48% to just 6%. This dramatic migration of labour out of farming facilitated rapid growth in the industrial sector, where parallel applications of new science were boosting productivity and income to new levels (Paarlberg 2009). Since the 1960s activists have been conducting campaigns to elevate ‘Global Consciousness’ with emotional language and images – what Bob Hunter, a Greenpeace founder, imaginatively coined as ‘mindbombs’; images that stick in the mind and help induce the “something must be done” mentality such as occurred in the public debate over the War in Vietnam (Figure 1). The goal of social cause action groups is to influence people so they believe that some practices and choices that have become embedded in our culture, are wrong, environmentally, morally, and devalue humanity; not wrong in the connotation of error, but wrong in the connotation of sin. Over time, animal activists have helped to transform how many people think about other species, turning whales into majestic beings, dolphins into friendly playmates, and seals into cuddly babies, to name just three (Dauvergne and Neville 2011). Figure 1. A Vietnamese photographer, Nick Ut, Associated Press, Saigon, took the Pulitzer prize-winning photograph on June 8, 1972 on Route 1 near Trang Bang, Vietnam after a USAF aerial napalm attack on a civilian target. One of the most iconic images of the Vietnam War, it was published on the front page of the Telegraph (United Kingdom). The image in this construction confirms that dropping napalm from planes on villages and surrounding area will cause “forest fires”. London Swine Conference – Production Technologies to Meet Market Demands April 1and April 2, 2015 91 Since the 1990s, there have been growing discussions of new media political innovation such as internet activism and how new media can be used effectively by a variety of political movements. The novel multi-organization, apparent cooperation, extent and impromptu nature of the ‘Battle for Seattle’ against the World Trade Organization (WTO) meeting in December 1999 came as a considerable surprise to the organizers. Physical protests can create media images that communicate to a very broad audience who self generate the sought for opinion (Nickerson 1998). Thus, a multi-faceted, well organized, protest action surfaced in resistance to neo-liberal institutions and their related globalization policies, while democracy, social justice and a better world including an antimodern animal production goal were championed (Kahn and Kellner, 2004). MORALIZATION OF FARMING In some social circles the act of eating has progressed from being a source of nutrition and sensory pleasure to being a social marker, an aesthetic experience, a source of meaning and a metaphor, and often a declaration of moral entity (Rozin, 1996). “Moral (Ethical) Vegetarians” claim to be mindful of both short and long-term consequences of individual choice and although personal health is recognized as a partial motivator for a vegan choice there is a much broader commitment to vegetarianism as a way of life (Fox and Ward 2008, DeGrazia 2009). Moral vegetarians view meat avoidance as a moral imperative and are upset by others who participate in meat consumption. This is in stark contrast to health or religious motivated vegetarians who are generally neutral to the food choices of other people (Rozin et al., 1997). Recent study of adolescent vegetarianism identified a largely female phenomenon characterised by meat avoidance, weight loss behaviours and a high concern with body appearance (Worsley and Skrzypiec, 1997; 1998). Teenage vegetarians are more likely to be Caucasian, from a higher socio-economic stratum, practice various weight control strategies and also have an increased concern for; the environment, animal welfare, and gender equality compared to non-vegetarian peers (Perry et al., 2001; Janda and Trocchia 2001). Vegetarianism among teenage women is different from traditional western and eastern culture vegetarianism, which has primarily a nutritional or religious basis. The prevalence of vegetarianism (those who do not consume red meat) in one South Australia study is 8-10% for teenage women and 1-2% for teenage men (Worsley and Skrzypiec, 1998). The prevalence of vegetarian tendencies however was 32-37% for teenage women. Teenage vegetarians believe that meat production is morally wrong for animal welfare reasons and harms the environment. Moral vegetarianism may be seen as an extreme example of a general trend in public opinion of farming practices. It is based on a mix of animal welfare, human health and environmental quality concerns (Fessler et al., 2003) and is in fact a manifestation of a philosophy of life (Lindeman and Sirelius 2001, Fox and Ward 2008). This gender related, anti-meat focus should be of concern to livestock producers as women may have a disproportionate future influence in food purchasing patterns for families, as is currently the case. Moralization is a process that works at both individual and cultural levels and involves the acquisition of moral qualities by objects or activities that previously were morally neutral. Moralization is the process where a preference is converted into a value (Rozin et al., 92 London Swine Conference – Production Technologies to Meet Market Demands April 1and April 2, 2015 1997). When behaviour becomes moralized the individual will seek multiple justifications for the relevant conviction. In the anti-factory-farm movement a combination of justification arguments including the destruction of the family farm, environmental concerns, animal welfare concerns and revulsion at “un-natural” husbandry practices are evoked in rationalizing and articulating an anti-intensive farming world view (Rowan et al., 1999). Moralization is a gradual conversion of individual preference into societal values. A critical difference between preferences and values is that values are much more likely to be transmitted within the family environment and values are subject to institutional and legal support (Rosin et al., 1997). POST-CITIZEN SOCIAL MOVEMENTS Being active in a union is intended to help the individual to better pay and work conditions; as a citizen I have a right to join a union in the hope of personal gain. Motivated individuals organized and were members of women’s suffragette (right to vote) movements in the late 19th and early 20th century. The political agitation was to benefit a whole class of people; to which the social movement activists were a member. In contrast, the movement for the abolition of slavery was initiated and sustained by non-slaves who believed they have responsibilities beyond that of a self interested citizen. Abolition was the initial large post-citizen movement. The post-citizen social movements, sometimes referred to as “post materialist” social movements tend to be composed of those individuals who are well educated, have reached a comfortable level of affluence and whose participation within that movement is not motivated by the promise of direct economic, political, and/or social benefits. Although legal limitation on the human use of animals originated at the same Victorian era as many other social movements such as antislavery, women emancipation, increasing general literacy, poverty alleviation, workplace safety, care of orphans, health care for the indigent and unemployed, child protection and later the human rights and labour movements most of these social idea, once achieved, have been integrated into the governance of the modern welfare state (or it’s residual structure). Animal welfare law originated with Victorian, usually female, moral evangelists who sought a better world by improving the moral nature of the wretched masses (dangerous classes) by restricting coarse forms of entertainment and callous exploitation of animals (Lowe and Ginsberg, 2002). The reality that the Victorian industrialists became wealthy by the unconscionable exploitation and union breaking of the same wretched masses their spouses were bent on morally improving, did not seem to come to mind. The fiscal resources to sustain a social movement require security enjoyed by individuals of means and leisure as only these members of society can pursue post-materialist values, they can travel to meetings and associate with like minded enlightened individuals where they can participate in self-expression, contribute to the literature and print media, and pursue quality of life issues. SOCIAL MOVEMENTS AND THE SACRED TEXT Most radical social paradigm shifts in the way things are perceived, and often spawning enhanced government oversight, occur subsequent to a landmark publication that I will define as the Sacred Text. Most Sacred texts are in the form of a book. Upton Sinclair published a novel, The Jungle in 1906. Intended as a cautionary tale of the central evil of London Swine Conference – Production Technologies to Meet Market Demands April 1and April 2, 2015 93 unrestricted capitalism and to recruit social support for organized labour, the book was an exposé of the dangerous and callous exploitation of new immigrant workers in the massive meat processing industry in Chicago. It became arguably one of the most politically influential American novels of the past century; not as a promotion of unionization of labour, but as a testament for the requirement of government oversight in food safety. In 1904, Sinclair spent seven weeks in disguise, working undercover in Chicago's meatpacking plants to research this novel (sound familiar?), however; he was relatively unrestricted by the limitations of his own observations. Translated into 17 languages within months, The Jungle sold 5,500 copies in just one day. Before the year (1906) was out, The US Meat Inspection Act (MIA) was passed, authorising the secretary of agriculture to inspect meat and condemn any found unfit for human consumption. On the same day as passage of the MIA, the Pure Food and Drug Act (USA) was passed, which prohibited the manufacture, sale or transport of adulterated food products or poisonous patent medicines. As the United States was the primary export market for beef and pork from Canada, the Canadian Meat Inspection System was implemented to maintain equivalency. A largely ignored authoritative and referenced 1906 report of the Department of Agriculture’s Bureau of Animal Husbandry provided a pointby-point refutation of the worst of Sinclair’s allegations, some of which they labelled as “willful and deliberate misrepresentations of fact” (U.S. Congress 1906). Being counter factual is a common feature of this genre of social-sacred literature (Schoenbrod and Wilson, 2003). For the environmental movement, Rachel Carson’s Silent Spring (1962), where she postulated that environmental DDT residue was responsible for fragile egg shell in raptors, largely unconfirmed (Spring 2014) spurred a reversal in US national pesticide policy, which led to a nationwide ban on DDT and other pesticides. Silent Spring inspired a grassroots environmental movement that led to the creation of the U.S. Environmental Protection Agency (Paull, 2013). There was added drama as the author died of cancer in 1964 at the age of 55. Dichlorodiphenyltrichloroethane (DDT) is a potent insecticide identified in 1939 as such by Swiss scientist Paul Hermann Müller. Müller was awarded the 1948 Nobel Prize in Physiology and Medicine for his efforts and the contribution of DDT to humanity. DDT was heavily used during World War II, on clothing and tents and other housing to prevent malaria in US troops in the Asian Arena. DDT became the global insecticide of choice in households, for agriculture, and for public health vector-control projects. Sprayed on smooth surfaces such as painted plaster it has residual effectiveness for six months and it is very low cost (Walker 2000). By 1949, the US was malaria free subsequent to a holistic eradication program including DDT. Negative effects on people, if in fact there are any, are very difficult to scientifically identify despite significant political pressure to do so (Eskenazi et al., 2009). Between 1955 and 1969, the Global Malaria Eradication Campaign also relied heavily on DDT. In Europe, India, South America, Africa, wherever it was used widely, DDT cut malaria rates dramatically and saved millions of lives (Mandavilli, 2006). However; influenced by the popularization of counter-factual information in Silent Spring and its environmental evangelists, the World Bank made a national ban of DDT a condition for loans to countries endemic for malaria (Curtis and Lines, 2000). The Stockholm Convention of 2001 heavily supported by the USA sought a global ban on DDT, which 94 London Swine Conference – Production Technologies to Meet Market Demands April 1and April 2, 2015 was largely implemented through the United Nations and as conditional on US International Aid (Roberts et al., 1997, 2001). Since the 1972 U.S. national ban on DDT, and requiring a ban to access US Foreign Aid, more than 50 million people have died of malaria; about 90 percent of whom resided in sub-Saharan Africa, and most of who were children younger than five. The political fallout of Silent Spring has resulted in more human deaths than WWI (15 million), more than twice the Joseph Stalin accomplishment estimated at 20 million, but doesn’t yet match the estimated 66 million human death loss of WWII (Necrometrics, 2011). Carlson has a heroic legacy in the environmental movement and an alternate legacy in the third world as an exemplary practitioner of genocide; people are still dying of DDT preventable malaria while WWII is over and Stalin is dead and the gulag archipelago dismantled. In the area of farm animals, Animal Machines, Ruth Harison, 1964, describes aspects of modern intensive poultry and livestock farming. It was published in seven countries and was the inspiration for the European Convention for the Protection of Animals Kept for Farming Purposes (Cottrel, 2000). Within the year the British Government has established the Bramwell Committee, who in their “Report on Conditions of Animals Raised under Intensive Conditions” (1965) proposed five freedoms for all farm animals: 1.freedom from malnutrition 2.freedom from discomfort 3.freedom from disease 4.freedom from fear or distress 5.freedom to express normal behaviour . These five animal needs for good health and welfare are still relevant to the Canadian Codes of Practice development. More recently the Pew Commission may have been an attempt to create a “Sacred Text” for salvation of livestock and the souls of man. In spring 2008, the Pew Commission on Industrial Farm Animal Production (PCIFAP) completed a two-year investigation of factory farming practices in the United States. At the end of its 1,100-page report, critical of modern livestock production in the extreme, the Commission recommended among many other changes a ten-year timeline for the termination of the most intensive production techniques, including battery cages for egg layers, gestation crates for sows, and force feeding birds to harvest their fatty livers for foie gras. A five year review of the impact of the PCIFAP report on livestock farming concludes that there has been little overall improvement in relation to the concerns expressed (Kim et al., 2013). In comparison to Animal Machines, or Silent Spring, the Pew Commission report, although comparable in counterfactual construction (AVMA, 2009) and free on the Internet, has had limited or no uptake by society at large (Jenkins, 2009). This example illustrates that some deliberate attempts at creating a sacred text fail (PCIFAP) and some novels can become sacred text (The Jungle). The American Veterinary Medical Association critique of the PEW commission report is completely focused on the factual errors in the document. If the PEW report is considered as a sacred text factual accuracy is irrelevant as it depends on confirmation bias in the reader (Nickerson, 1998). THE ART OF DECEPTION (PERSUASION) The most competent deception generating machine is the media both thorough apparent incompetence (news) and intent (advertizing, editorializing). Consider any current newsworthy event (disaster, murder mayhem, war, scandal); by choice of words, choice of visuals, selective omission, and varying credibility ascribed to the primary source, each London Swine Conference – Production Technologies to Meet Market Demands April 1and April 2, 2015 95 independent news hawker can deliver a radically different impression of what actually happened. The news consumer who is uncertain about the quality of an information source will infer that the source is of higher quality when its reports conform to the consumer’s prior expectations. So even when “common opinion” is counter-factual, the choice to slant information to agree with the consumer’s erroneous prior opinion is a common media bias (Groseclose and Milyo, 2005). Where there is a very low probability that a popular lie will be confronted with the truth the more willing media outlets are to represent unverifiable information as the truth. There is more bias in coverage of a foreign war, the progress of the “war on terror/drugs”, discussion of the impact of alternative tax policies, or summary of scientific evidence about global warming; these are all contexts where outcomes are difficult or impossible to observe and are often not realized until long after the report is made (Gentzkow and Shapiro, 2005). SOCIAL MOVEMENT ORGANIZATION Each of the major domestic political movements of the 1960s and 1970s, civil rights, feminist, and environmental, struggled with internal debates over the direction the movement should take. In the end, they evolved in the direction of mainstream American politics and away from broad, systemic critiques of Western society (although those critiques certainly remain and are sometimes explicit). It is not possible to say which of these directions the animal rights movement will take, but it seems clear that the movement is, at the very least, similar in the activists it attracts and serious in its goals, funding sources and potential to previous influential social movements (Jamison and Lunch, 1992). Social movements of the past half century have been marked by substantial periods of activity, where multiple movements have come together to achieve compatible ends. These movements can pool resources and draw on different constituencies to build broader political and financial support, leading to a greater visibility and potential for successes. On the other hand, there tend to be substantial differences in the demographics and philosophical positions of activists within these two movements, which may influence the framing of issues and direction of the movement coalition. MASS MEDIA, MORAL CRUSADES AND MORAL PANIC Rules, social norms and especially law are products of someone’s initiative. People who exhibit this desire to make rules usually intended for the betterment of humanity are commonly identified as “moral entrepreneurs” (Becker, 1997). Moral entrepreneurs are so convinced of their infallibility they are able to campaign to use collective force against individuals of a different opinion. A familiar example is the American temperance movement during the 19th century led by the Womens Temperance Union (WTU). The WTU believed that alcohol was the cause of degraded morality, violence, child abandonment, as well as well as difficult economic conditions in the family and community of the consumer. The temperance movement was also perceived to be tied in with both religious renewal and progressive politics, particularly the vote for women (Gusfield, 1955). Moral reformism of this type suggests the approach of a dominant class toward those less favourably situated in the economic and social structure. Moral 96 London Swine Conference – Production Technologies to Meet Market Demands April 1and April 2, 2015 crusaders, typically strongly class aware, want to help those beneath them to achieve a better status. Initially a true temperance (alcohol in moderation) movement, in the 1830s a more extreme form of temperance emerged called teetotalism, which promoted the complete abstinence first as an individual then as a society, from consumption of alcohol. Alcohol was considered the route of all evil by the WTU and it became popular opinion that elimination of alcohol consumption would improve the world (Gusfield, 1955). The Klu Klux Klan was a strong supporter of Prohibition (Pegram 2008). After campaigning for almost exactly 100 years, prohibition was established in the United States. Requiring a constitutional amendment, it was a nationwide ban on the sale, production, importation, and transportation of alcoholic beverages that remained in place from 1920 to 1933. Prohibition coincided with a serious period of social disruption, expansion and increased violence of organized crime, police corruption, expanding annual budgets for the F.B.I. and widespread general non-compliance; eventually calling for the repeal of the constitutional amendment (Waldrep, 2008). Currently Mexico is experiencing similar social costs related to the US “War on Drugs” where the violence and corruption of US consumption has been largely outsourced to south of the Rio Grande (Freeman, 2006, Gonzales, 2009) The idea of moral panic entered the criminology academia via a book (sacred text?) in 1972 (Cohen 1972). Cohen launched the term moral panic defined as: A condition, episode, person or group of persons emerges to become defined as a threat to societal values and interests; its nature is presented in a stylized and stereotypical fashion by the mass media; the moral barricades are manned by editors, bishops, politicians and other rightthinking people; socially accredited experts pronounce their diagnoses and solutions; ways of coping are evolved or...resorted to; the condition then disappears, submerges or deteriorate and becomes less visible. Sometimes the subject of the panic is quite novel and at other times it is something which has been in existence long enough, but suddenly appears in the limelight. Sometimes the panic passes over and is forgotten except in folklore and collective memory; at other times it has more serious and long-lasting repercussions and might produce such changes as those in legal and social policy or even in the way society conceives itself (Cohen 1972:9). A moral panic describes a social or societal response characterized by seemingly irrational and disproportionate societal reactions to unsubstantiated threats posed by some person or group of people. Mass media contributes to initiating and sustaining the irrational fear or concern, the disproportionality is often precipitated by a crisis sensitive government actors over-response (Hier, 2008). There must be a widespread belief that the problem at hand is real, it poses a threat to society, and something has to be done about it (e.g.“reefer madness”, war on drugs). One of the most widely recognized historical moral panics was the massive identification and systematic murder of witches for several centuries in the European Middle Ages (Midelfort, 2011). Up to half a million people, 85% women were killed for consorting with the devil between roughly 1400 and 1650 C.E. (Goode and BenYehuda 1994a). But; by calling it a witch craze, we judge the behaviour as foolish and London Swine Conference – Production Technologies to Meet Market Demands April 1and April 2, 2015 97 even deluded or demented, what seemed only reasonable or plausible and responsible action at the time. In 1994 a second related book was published: Moral panics: The social construction of deviance (Goode and Ben-Yehuda, 1994b) which further operationalized the concept with five core components: 1) Concern – There must be belief that the behaviour of the group or behaviour in question is likely to have a negative effect on society; 2) Hostility – Hostility towards the group in question increases, and they become "folk devils". A clear division forms between “them” and “us”; 3) Consensus – Though concern does not have to be nationwide, there must be widespread acceptance (especially among “white” people) that the group in question poses a very real threat to society. It is important at this stage that the “moral entrepreneurs” are vocal and the “folk devils” appear weak and disorganised; 4) Disproportionality – The action taken is disproportionate to the actual threat posed by the accused group. 5) Volatility – Moral panics are highly volatile and tend to disappear as quickly as they appeared due to a wane in public interest or news reports changing to another topic (Zgoba, 2004). In many moral panics the participants have urgency and the attitude this must be dealt with before it is too late (Rohloff, 2011). A recent example of moral panic is the 2008 bankruptcy of Hallmark/Westland Meat Packing Company. This California-based company was forced into bankruptcy due to costs from a meat recall and ensuing private litigation (Perry and Brandt, 2008). The company recalled just over 143 million pounds (65 million kilograms) of raw and frozen beef products, the largest meat recall to date in the United States, following an investigation into animal cruelty of downer cows pre-slaughter. Remarkably, USDA has no power to recall meat; all meat recalls in the United States are voluntary industry actions (Brougher et al. 2011). A Humane Society of the United States (HSUS) soldier collected undercover video showing downer dairy cows among other things being moved by crews using forklifts. The USDA had been a major customer of Hallmark/Westland for products for the National School Lunch Program, the Emergency Food Assistance Program and the Food Distribution Program on Indian Reservations. Media and internet coverage was immediate and extensive (Torrez, 2014). In reconstructing of the moral panic of Hallmark/Westland beef recall using the GoodeBen-Yehuda model; society was justified in having concern if cattle unable to walk were being ground into burger to feed to children. This is a clear fact not in dispute. Is there underlying hostility to industrial meat processors? It is a dirty job, and the meat complex in the USA has not been a “good citizen”; as a union breaker and now a primary employer of unauthorized workers and new Americans of Mexican origin (Tanger, 2006; Aguirre, 2012). Americans have a volatile and affective response to immigrants; when the economy is good, all are welcome and when the economy slows down illegal immigrants are vilified for taking American Jobs that Americans would probably reject on issues of pay and workplace safety in any situation (Tanger 2006). Since the presence of working illegal aliens in the US workforce has detrimental effects on the wages and working conditions of all workers, and the systemic union breaking behaviour of the large slaughterhouse companies in the past 25 years (Kandel and Parrado, 2005), there may be significant societal hostility to the US meatpacking industry. The single worker convicted, Rafael Sanchez Herrara, spent 6 months in jail and then was deported to Mexico (Martin and Contreras, 2008). Consensus appeared to materialize rapidly as the HSUS (The Humane Society of the United States was the origin of the video clips) has a professional internet 98 London Swine Conference – Production Technologies to Meet Market Demands April 1and April 2, 2015 presence and the graphic video of rough handling of cows was presented to maximise common person outrage. The question of (dis)proportionality was not a media message of the discourse at the time; but, the recall and destruction of 143 million pounds of beef, on a trumped up BSE risk, when the slaughter of downer cows was legal in the USA (Torrez, 2014) was extraordinarily dis-proportional to the near zero food safety risk. The USDA face saving was a wilful act of counterfactual cognition. Considering the feature of volatility this incident resulted in the State of California writing a no-downer law that was later ruled unconstitutional by the US Supreme Court (Vesilind 2013, Torrez 2014), so as a moral panic, the Hallmark/Westland lasted longer than most, but achieved little substantive change in cull cow marketing in California (Cassuto 2014). The USDA changed rules to no longer slaughter downer cows for human consumption in 2009. Similar to the Hallmark incident Australian Broadcasting Corporation’s investigative news program “Four Corners” broadcast on May 30, 2011 an undercover exposé of the treatment of Australian cattle exported live to Indonesia for slaughter. “A Bloody Business” was watched by about 500,000 viewers, caused an unprecedented public reaction of anger from the general public. Demands from animal protectionists (prepared in advance) in Animals Australia and the Royal Society for the Prevention of Cruelty to Animals-Australia (RSPCA) for an immediate ban on the trade provided a quick fix. In 2011 the RSPCA also published a graphic review of the fate of Australian slaughter cattle in Indonesia (Jones 2011). In the aftermath of the Four Corners report the over 25 year crusade led by Animals Australia and the RSPCA seemed to be on the verge of success (Munro 2015). Rational persuasive arguments for the elimination of live animal export had proven ineffective for decades (Morfuni, 2011). On Tuesday 31st May 2011 Agriculture Minister Joe Ludwig announced the suspension of live cattle exports to the 11 Indonesian abattoirs investigated by ABC's Four Corners. The ban was extended; Wednesday June 8, 2011 Prime Minister Gillard announced a suspension on the live cattle trade to Indonesia (ABC-1 2011). Demonstrating remarkable volatility; in just a few weeks; media and public interest in the issue gradually declined and the government lifting the ban on July 6, 2011 (Coghlan, 2014). Munro (2015) suggests that for a media-movement campaign to succeed, it must be characterised by three elements: first, the activists or social movement must have standing, that is, credibility and be worthy of support; the second characteristic is whether the movement’s preferred frame is adopted by the media; finally, success depends on a social movement’s capacity to garner active sympathy for their cause. The Four Corners story aired by the national broadcaster in association with respected animal protectionists, generated widespread public condemnation of the live animal trade and for an animal welfare issue, this was unprecedented in Australia. The media were initially successfully coopted to further the activist goals. Yet the initial outrage did not convert to rational action. Within 2 weeks of broadcasting the storey; Tiplady (et al. 2013) initiated a public survey to measure the impact of the Bloody Business narrative on the average Australian. Most Australians discussed the media coverage with others afterwards but fewer than 10% contacted politicians or wrote to newspapers. The public were emotionally affected by the media coverage of cruelty to cattle but that this did not translate into significant behavioural change. Social Movement theorists suggest that social movement entrepreneurs need to construct their campaigns in ways that balance short-lived, emotion-charged rhetoric London Swine Conference – Production Technologies to Meet Market Demands April 1and April 2, 2015 99 (recruitment and attention getting phase) and the more enduring cognitive dimension whereby animal protection is seen as a rational and righteous philosophical movement of justice for all creatures (Monro, 2015). The non-human victims featured in the Four Corners exposé were soon to be replaced by their human counterparts in the farming sector; sections of the print media took up the grievances of dozens of individual farming families who had been hurt economically by the government’s banning of the trade. Public and media interest in the crusade peaked early and high (hot) then gradually declined. The most visible residual effect is the compulsory Exporter Supply Chain Assurance Scheme. ESCAS was designed to ensure that Australian livestock exported for feeder and slaughter purposes are handled in accordance with international animal welfare standards (after they leave the regulatory control of Australia) and to provide a mechanism to deal with animal welfare issues when they occur, preventing the need for trade suspensions. It is a trade regulation where the industry implements sanctions against non-compliant companies (Smietanka, 2013; Gov. Aust. 2015). There is some question whether the ESCAS would withstand a World Trade organization review for compliance with international trade law (Hastreiter, 2013; Chaudhri, 2014). NEW FORMS OF CITIZEN ACTION Other forms of social action have emerged since the moral panic construct was developed that clearly do not conform to this hypothetical model. On November 30, 1999, representatives of 135 countries in the World Trade Organization (WTO) met in Seattle to agree on an agenda for the next round of negotiations. They were greeted by 30,000 to 40,000 protesters, primarily from organized labour, environmental, and human rights organizations who, for a time, blocked their entry into the meeting hall. The root of their protest was that the WTO, in developing its rules and procedures for promoting free trade, had not given adequate, or any, consideration to labour rights, environmental problems, human rights or economic equity put at risk by unregulated international trade (DeMichele, 2008). This populist display did not conform to what sociologists understood about the nature of “Moral Panic”. As it did not meet the disproportionate criteria, it was a significant within movement consensus (not social consensus) and significant hostility toward a vilified entity. The WTO’s power and practice were not eradicated following the protests, but some of the momentum of multi-lateral trade schemes seems to have stalled. The current and prolonged stalling of multi-lateral trade talks (Wu et al 2013), would suggest the "Battle in Seattle" was a significant and successful collective mobilization and probably resulted in increasing confidence and solidarity of protesters. This production of personal and group identity may increase the probability of similar protests organization and delivery in the future. The average rational citizen would conclude that the protesters’ actions did not deriving from ‘irrational’ emotions and ‘exaggerated’ beliefs, and actions were proportional to the ‘real’ threats of global corporatization of society and the natural resources of the planet (Hier, 2008). Occupy Wall Street (OWS) is the name given to a new-variant protest movement that began on September 17, 2011, in Zuccotti Park, located in New York City’s Wall Street financial district (Figure 2). The academic literature on this movement is still in development. The movement as a concrete idea/belief has become global as the Occupy 100 London Swine Conference – Production Technologies to Meet Market Demands April 1and April 2, 2015 Movement Against Social and Economic Inequality Worldwide. The Canadian, anticonsumerist, pro-environment group/magazine Adbusters initiated the web-based call for the 2011 protest. As a movement, it is focused on human welfare and the actual growing disparity between the rich and the poor of the world; counter to the trickle down promises of neo-liberalism/free-trade apologists. Agriculture practices were not directly in focus, only as far as they affect poverty in third world countries such as the Monsantoization of seed, and the monoculture intensive farming dialogue (green revolution). The main focus of Occupy is confronting the pernicious outcomes of unregulated capitalism worldwide and the unprecedented concentration of money and power in the hands of very few individuals and the expanding gulf between the rich and the poor in all countries of the world (Tabb, 2012; Kohn, 2013). It is a general concern that the top 1% of the world’s population is in control of 25% of the gross productivity of the planet (Gitlin, 2013). The highly technologically savvy approach to direct action in the OWS movement was a similar surprise to the status quo as was the battle in Seattle. Figure 2. The Wall Street Bull or the Bowling Green Bull is a bronze sculpture created and owned by Arturo Di Modica that stands in Bowling Green Park in the Financial District in Manhattan, New York City. This poster1, a promotional image from the Occupy Wallstreet movement, is included in this paper to contrast the horror-realism genre of Figure 1. Both images having the political purpose to change the perceptions of the public. In most social actions, people march so that the public becomes aware of their demands. The Occupy movement was distinct in they specifically had no demands. In my response to this image; I see what is best and beautiful about humanity (intelligence, self control, grace, respect and culture) contrasted with what is the most ugly; specifically the aggressive, belligerent, destructive force unpredictably on the move, which is the state of cannibalistic capitalism that has evolved under the neo-liberal political shift in the West since the empire of Thatcherism. The bull was placed on this spot in 1987. DISCUSSION In consideration of two very large social changes in the past 30 years; namely the cultural shift to near universal condemnation of driving while impaired and the reasonably proportional restrictions due to health concerns around second hand smoke, did not require a panic of any kind. Both initiatives benefited from having no rational opposition; no-one could rationally promote impaired driving or expensive self mortification. In addition, 1 "Wall-Street-1" Licensed under Fair use via Wikipedia http://en.wikipedia.org/wiki/File:Wall-Street-1.jpg#mediaviewer/File:Wall-Street-1.jpg London Swine Conference – Production Technologies to Meet Market Demands April 1and April 2, 2015 101 both had strong grassroots involvement articulating concern; Mothers Against Drunk Driving and public health education of the populace about second hand smoke and the protection of children. When a consensus appeared to be present in society at large, municipalities and sub-national enforcement infrastructure converted the common moral conviction into a compulsory legal framework of where one can and cannot smoke, and a blood alcohol level above which operating a motor vehicle is a violation of the common morality of society. Compliance appears to be very good with little official enforcement of either significant social paradigm shift. These rather significant shifts in public behaviour did not require the recruitment of hostility or disproportionality and the changes seem relatively permanent (no volatility). Presumably the animal activist core does not believe that rational democratic progress can be made at all, or fast enough for their satisfaction in relation to improving animal protection. As a producer, it is difficult to prevent the hidden camera exposé of modern livestock production. The hidden camera crowd has months to wait for that 20 second visual clip which can function as their political poster. What is also characteristic is that animal action groups rarely report to the local animal care enforcement police as providing the opportunity for good policing is counter to their political aim. To date, most attempts to vilify producers have really failed to trigger a moral panic, subsequent to activist’s direct accusation of deviant behaviour at the method of production, or the corporate owner. The activist is attempting to label the common modern method of farming as a form of deviance; and the farmer as a deviant to generate hostility. Consumers, urban dwellers and farmers all have concern about the safety of food and the comfort and well being of livestock. The undercover video is an attempt to generate a “moral panic”; however, the secondary feature “something extreme must be done now before it is too late” panic is a difficult sell to a fairly sceptical and well educated populace. In well documented moral panics around crime related to new street drugs (crack cocaine), or epidemic gun violence (biker gang) there is energy; there is fascination and something edging on enjoyment: moral panics, like crime, are seductive events. However; the potential moral hazards such as the padding of police budgets usually leaks in to the public media discussion to provide a balance or backlash. The husbandry of pigs is not, on face value, an exciting focus upon which a consensus of the population would direct moral outrage. There is also some scientific literature to suggest that more recent moral panics are harder to trigger as society becomes less homogeneous, leading to increasing difficulties to achieve consensus. Many of the recently emerged social concerns are more risk based then ethics-based, such as GM foods, antibiotic use in livestock production, and emerging infectious agents such as Influenza-A (Howarth, 2013). The BSE crisis had a moral component as most of the public did not realize that inedible protein and fat from the meatpacking industry was reconstituted as cattle feed (recruitment of repugnance) and it became fairly clear that the government delayed communicating a suspicion of risk to human health for some time. Risk is a very difficult concept to achieve agreement on (Lee, 2010). CONCLUSION Animal protection activists are to be expected to continue to actively criticize modern farming practices. The undercover camera approach appears to have become the weapon of choice to draw emotional attention to a cause. What has been documented in other 102 London Swine Conference – Production Technologies to Meet Market Demands April 1and April 2, 2015 social movements; is to make the issue stick in the mind of the average citizen emotionally laden visual images must be followed up with an appealing rational and do-able goal. In the Four Corners incident in Australia, the media was not in the least controlled by the animal advocate groups. Hungry for new low cost sensational images, the farmer in distress, as a direct result of possible disproportionate government action in closing the ports, was a natural continuation of the story line by the media that allowed the “treatment of animals narrative” to be eclipsed. The moral crisis model is just one of many academic approaches to try and explain how post-modern society, where individuality is supreme, establishes agreed to group moral values. The Hallmark Meat and the live animal export issues appear to fit fairly well into this construct. If this moral crisis model is more or less true, there is still a risk from moral entrepreneurs to successfully trigger disproportionate government or customer response. Such as was the unilateral early eradication of sow stalls in Britain, a decade before the general European Union target of 2013. Also over time, images and media constructs may accumulate and build a hostility foundation in preparation for the next moral panic opportunity. Producers and the industry should put energy into controlling what we can influence, consensus, hostility and disproportionality. As an industry and as a farmer concern about where your food comes from and that production animals have a decent life is a justified and righteous prerogative of the consumer. Many livestock industries have a prepared position that articulates our agreement with responsible farming which is already partially covered by the Code of Practice and visible with the implementation of on farm welfare audits. As an industry and as individuals we can have an effect on societal hostility. By being model corporate and individual citizens we can accumulate a stockpile in our individual and collective social reserve of positive attitudes from the general public. This means things like responsible management of manure, treating staff well; and giving back to the community has a palpable value over and above being the right thing to do. Maintaining active engagement of the government departments of agriculture is important to maintain a buffer of knowledge and trust in the civil service to balance pressures from small vocal interest groups upon individual politicians. We should all be aware that it is not acceptable to make a living by the exploitation of animals. It is, however, acceptable and an honour to provide healthy food of animal origin for people when we respectfully raise and care for livestock. REFERENCES ABC-1 2011. A Bloody Business [Video on the Internet] Available from: http://www.abc.net.au/4corners/special_eds/20110530/cattle/ (almost 46 min long) Aguirre, A.,Jr. 2012. Arizona's SB1070, latino immigrants and the framing of anti-immigrant policies. Latino Studies, 10(3); 385-394. Anonymous 2010. United states: Arizona, rogue state; lexington. The Economist, (2010, Jul 31). 396: 25. AVMA. 2009. The American Veterinary Medical Association. Response to the Final Report of the Pew Commission on Industrial Farm Animal Production. Available From https://www.avma.org/Advocacy/National/Other/Documents/pew_report_response.pdf Becker, H.S. 1997. Moral entrepreneurs In: Outsiders: Studies in the Sociology of deviance. pp. 10-13. The Free Press of Glencoe, Glencoe, Illinois (Simon & Schuster NY) London Swine Conference – Production Technologies to Meet Market Demands April 1and April 2, 2015 103 Brougher, C.M. and G.S. Becker. 2011. The USDA's Authority to Recall Meat and Poultry Products. Congressional Research Service, Library of Congress. Burmeister, L. 2002. Lagoons, litter and the law: CAFO regulation as social risk politics. South. Rura.l Sociol. 18(2); 56-87. Carson, R. 1962. Silent Spring. Houghton Mifflin Harcourt, Boston Cassuto, D.N. 2014. Meat Animals, Humane Standards and Other Legal Fictions. L. Cult. Hum. 10(2), 225-236. Chaudhri, R. 2014. Animal welfare and the WTO: The legacy and implications of live animal restrictions under international trade law. Fed. L. Rev. 42: 279-307. Coghlan, S. 2014. Australia and Live Animal Export: wronging nonhuman animals. J. Anim. Ethics. 4(2), 45-60. Cohen, S. 1972. Folk Devils and Moral Panics: The Creation of the Mods and Rockers. MacGibbon & Kee, London Cottrel, A. 2000. A tribute to Ruth Harrison. Animal Welfare Institute, Animal Welfare Quarterly Available on the Internet https://awionline.org/awi-quarterly/2000-fall/tribute-ruth-harrison Curtis, C.F. and J. D. Lines. 2000. Should DDT be banned by international treaty?. Parasitology Today, 16(3), 119-121. Dauvergne, P. and K.J. Neville. 2011. Mindbombs of right and wrong: cycles of contention in the activist campaign to stop Canada's seal hunt. Environmental Politics. 20(2), 192-209. DeGrazia, D. 2009. Moral vegetarianism from a very broad basis. J. Moral Philo. 6(2): 143-165. DeMichele M. 2008. Policing protest events: The great strike of 1877 and the WTP protests 1999. Am. J. Crim. Just. 33: 1-18. Eskenazi, B., J. Chevrier, L.G. Rosas, H.A. Anderson, M.S.R. Bornman, H. Bouwman, and D. Stapleton. 2009. The Pine River statement: human health consequences of DDT use. Environ. Health Persp. 117(9): 1359-1367. Fessler, D.M.T., A.P. Arguello, J. M. Mekdara, and R. Macias. 2003. Disgust sensitivity and meat consumption: a test of emotivist account of moral vegetarianism. Appetite 41: 31-41. Fox, N., and K. Ward. 2008. Health, ethics and environment: a qualitative study of vegetarian motivations. Appetite, 50(2): 422-429. Freeman, L. 2006. State of Siege: drug-related violence and corruption in Mexico. WOLA Special Report, Washington Office on Latin America, June. Gentzkow, M. and Shapiro, J. 2005. Media bias and reputation (No. w11664). National Bureau of Economic Research. Available from http://core.ac.uk/download/pdf/6894218.pdf Gitlin, T. 2013. Occupy’s predicament: the movement and the prospects for the movement. Brit. J. Sociol. 64(1): 3-25. Gonzalez, F.E. 2009. Mexico’s drug wars get brutal. Current History, 108(715): 72-76. Goode, E. and N. Ben-Yehuda. 1994a. Moral panics: Culture, politics, and social construction. Ann. Rev. Sociology, 20(3):149-171. Goode, E., and N. Ben-Yehuda. 1994b. Moral panics: The social construction of deviance. John Wiley & Sons, New York Government of Australia 2015. Exporter Supply Chain Assurance System Report. is available at www.agriculture.gov.au. Groseclose, T., and J. Milyo. 2005. A measure of media bias. Quart. J. Econ. 121(4): 1191-1237. Gusfield, J.R. 1955. Social Structure and Moral Reform: A Study of the Woman's Christian Temperance Union. Amer. J. Sociol. 61 :221-231. Harrison, R. 1964. Animal Machines: The new factory farming industry. Vincent Stuart Ltd. London. Hastreiter, M.T. 2013. Animal welfare standards and Australia’s live exports industry to Indonesia: Creating an opportunity out of crisis. Wash. U. Global Stud. L. Rev.2: 181-203. Heir, S.P. 2008. Thinking beyond moral panic: Risk, responsibility and the politic of moralization. Theoret. Criminol. 12(2): 173-190 Howarth, A. 2013. A ‘superstorm’: when moral panic and new risk discourses converge in the media. Health, Risk and Society 15(8): 681-698. 104 London Swine Conference – Production Technologies to Meet Market Demands April 1and April 2, 2015 Jamison, W.V. and W.M. Lunch. 1992. Rights of animals, perceptions of science, and political activism: Profile of American animal rights activists. Sci. Tech. Human Values, 17(4), 438-458. Janda, S, and P. J. Trocchia. 2001. Vegetarianism: toward a greater understanding. Psychol. Marketing 18: 1205-1240 Jenkins, P. 2009. Failure to launch, Why do some social issues fail to detonate moral panics? Brit. J. Criminology. 49: 35-47. Jones, B. 2011. The slaughter of Australian cattle in Indonesia: an observational study. RSPCA Australia, 47 pages. Kahn, R. and D. Kellner. 2004. New media and internet activism: From the 'Battle of Seattle 'to blogging. New Media & Society, 6(1): 87-95. Kandel, W. and Parrado, E.A. 2005. Restructuring of the US meat processing industry and new Hispanic migrant destinations. Pop. Develop. Rev. 31(3), 447-471. Kim, B.F., L.I. Laestadius, R.S. Lawrence, R.P. Martin, S.E. McKenzie, K.E Nachman, T.J. Smith, and P. Truant. 2013. Industrial Food Animal Production in America: Examining the Impact of the Pew Commission’s Priority Recommendations. John Hopkins, Center for a Liveable Future. http://www.jhsph.edu/research/centers-and-institutes/johns-hopkins-center-for-a-livablefuture/_pdf/research/clf_reports/CLF-PEW-for%20Web.pdf Kohn, M. 2013. Privatization and protest: Occupy Wall Street; occupy Toronto, and the occupation of public space in a democracy. Perspectives on Politics 11(1): 99-110. Lee, T. 2010. Why They Don’t Trust the Media: An Examination of Factors Predicting Trust. Amer. Behav. Sci. 54(1):8-21. Lindeman, M, and M. Sirelius. 2001. Food choice ideologies: the modern manifestations of normative and humanist views of the world. Appetite 37: 175-184 Lowe, B.M. and C.F. Ginsberg. 2002. Animal rights as a post-citizenship movement. Soc. & Anim. 10(2), 203-216. Mandavilli, A. 2006. "DDT returns." Nature Medicine 12.8: 870-871. Martin, A. and A.F. Contreras. 2008. “Slaughterhouse orders largest recall ever of ground beef”, The New York Times, 18 February, p. A10. Midelfort, H.C.E. 2011. Witch craze? Beyond the legends of panic. Magic Ritual & Witchcraft 6(1): 1133. Morfuni, L. 2011. Pain for profit: An analysis of the live export trade. Deakin L. Rev.16: 497-538. Munro, L. 2015. The live animal export controversy in Australia: A moral crusade made for the mass media. Soc. Movem. Stu. 14(2): 214-229. Necrometrics 2011. Source List and Detailed Death Tolls for the Primary Megadeaths of the Twentieth Century. Database on the Internet, available from http://necrometrics.com/20c5m.htm Nickerson, R.S. 1998. Confirmation bias: A ubiquitous phenomenon in many guises. Rev. Gen. Psychol. 2(2): 175-. Paarlberg, R. 2009. The ethics of modern agriculture. Society, 46(1): 4-8. Paull, J. 2013. The Rachel Carson: Letters and the Making of Silent Spring, SAGE Open. July-September 1-12 Available from, http://orgprints.org/22934/7/22934.pdf Pegram, T.R. 2008. Hoodwinked: The Anti-Saloon League and the Ku Klux Klan in 1920s Prohibition Enforcement. J. Gilded Age Prog. Era. 7(1): 89-119. Perry, C.L., M.T. McGuire, D. Neumark-Sztainer and M. Story. 2001. Characteristics of vegetarian adolescents in a multiethnic urban population. J. Adolesc. Health 29: 406-416 Perry, N. and Brandt, P. 2008. A case study on cruelty to farm animals: Lessons learned from the Hallmark Meat Packing case. Mich. L. Rev. First Impressions, 106: 117-122. Pew Commission. 2008. Final Report: Putting Meat on The Table: Industrial Farm Animal Production in America Available From http://www.ncifap.org/ Roberts, D., R. Bate, and R. Tren. 2001. The United Nations’ Scientific Fraud against DDT. Amer. Enter. Inst. Pub. Polic. Res. Jan Available from http://www.aei.org/wp-content/uploads/2011/10/2011-HPO01-g.pdf London Swine Conference – Production Technologies to Meet Market Demands April 1and April 2, 2015 105 Roberts, D.R., L.L. Laughlin, P. Hsheih, and L.J. Legters. 1997. DDT, global strategies, and a malaria control crisis in South America. Emerg. Infec. Dis. 3(3): 295-302. Rohloff, A. 2011. Extending the concept of moral manic: elias, climate change and civilization. Sociology, 45(4): 634-649. Rowan, A.N., H. O’Brien, L. Thayer, and G. J. Patronek.1999. Farm animal welfare; the focus of animal protection in the USA in the 21st century. Tufts Center for Animals and Public Policy 99pp Rozin, P. 1996. Towards a psychology of food and eating: from motivation to module to model to marker, morality meaning and metaphor. Curr. Dir. Psycol. Sci. 5: 18-24 Rozin, P., M. Markwith, and C. Stoess. 1997. Moralization and becoming a vegetarian: the transformation of preferences into values and the recruitment of disgust. Psychol. Sci. 8: 339-342. Schoenbrod, D.S. and C. Wilson. 2003. What Happened to the Skeptical Environmentalist. NYL Sch. J. Hum. Rts. 46: 581-614. Schweitzer, M.E., S.E. Brodt, and R.TCroson. 2002. Seeing and believing: Visual access and the strategic use of deception. Int. J. Conflict Manage. 13(3): 258-375. Smietanka, A. 2013. Live Export: a cruel and risky industry. Issues. 103(Jun): 4-6.Control Publications Pty. Ltd. Victoria. Spring, R.C.S. 2014. Pollutants in food chains: impacts on birds. [Monograph on the Internet] University of Liverpool. Available from http://pcwww.liv.ac.uk/aquabiol/BIOL367_Web/lect_notes/Pesticides%20in%20food%20chains.doc Summers, C. 2001. Battle in Seattle: Free Trade, Labor Rights, and Societal Values. J. Int. Law. 22(1): 61-90. Tabb, W.K. 2012. Extending occupy Wall Street’s message and critique. Int. Crit. Thought. 2(3): 265275. Tanger, S.E. 2006. Enforcing corporate responsibility for violations of workplace immigration laws: The case of meatpacking. Harv. Latino L. Rev. 9: 59-89. Tiplady, C.M., D.A.B. Walsh, and C.J. Phillips. 2013. Public response to media coverage of animal cruelty. J. Agric. Enviro. Ethics. 26(4): 869-885. Tonsor, G.T. and C.A. Wolf. 2010. Drivers of resident support for animal care oriented ballot initiatives. J. Agric. Appl. Econ. 42(3): 419-428. Torrez, M. 2014. Health and Welfare Preempted: How National Meat Association v. Harris Undermines Federalism, Food Safety and Animal Protection. J. Food L. Policy, 10: 35-72. U.S. Congress. 1906. House Committee on Agriculture, Hearings on the So-called “Beveridge Amendment” to the Agriculture Appropriation Bill, 59th Congress, 1st Session, 1906, p. 194. Available from. https://archive.org/stream/cataloguepublic00docugoog/cataloguepublic00docugoog_djvu.txt Vesilind, P. A., Preempting Humanity: Why National Meat Ass'n v. Harris Answered the Wrong Question (June 17, 2013). 65 Me. L. Rev. 685 (2013). Available at SSRN: http://ssrn.com/abstract=2280430 Waldrep, C. 2008. National policing, lynching, and constitutional change. J. South. Hist.74(3): 589-626. Walker, K. 2000. Cost-comparison of DDT and alternative insecticides for malaria control. Med. Vet. Entomol. 14(4): 345-354. Worsley, A. and G. Skrzypiec. 1997. Teenage vegetarianism: Beauty or the beast? Nutrit. Res. 17: 391404. Worsley, A. and G. Skrzypiec. 1998. Teenage vegetarianism: prevalence, social and cognitive context. Appetite 30: 151-170. Wu M., Moore M., Ramos KS, Lewis J, Schwab S. 2013. The proliferation of regional trade agreements; (Re-)Shaping the trade landscape with multilateralism on pause. American Society of International Law. Proceedings of the Annual Meeting. Apr 3-Apr 6, 2013, Washington, DC Young, J. 2011. Moral panics and the transgressive other. Crime Media Cult. 7(3): 245-258. Zgoba K.M. 2004. Spin doctors and moral crusaders: the moral panic behind child safety legislation. Crim. Just. Stud. 17(4): 385-404. 106 London Swine Conference – Production Technologies to Meet Market Demands April 1and April 2, 2015 Day 2: Wean to Finish – Workshop Sessions London Swine Conference – Production Technologies to Meet Market Demands April 1and April 2, 2015 107 DYNAMIC OPTIMIZATION OF PRODUCTION TO MARKET CONDITIONS Francis Simard Nutreco Canada, 731 principale, St-Elzear, QC, G0S 2J0 Email : [email protected] Collaborators: Drew Woods and Neil Ferguson, Nutreco Canada ABSTRACT Pork producers have been used to constant evolution in rapidly changing markets and in order to maximize profits – in this situation, dynamic optimization of production should be considered. Least cost formulation is readily used to minimize feed costs for a defined set of performance expectations. Does feeding pigs the cheapest feed always provide the best financial returns? Will feeding diets that minimize feed efficiency return the cheapest feed cost or highest profit? In some situations, yes, but in many cases not. Should the pigs be shipped at a constant carcass weight? To answer all these questions, dynamic optimization based on economic returns is absolutely necessary as a means to improve profitability at the farm level at all times! INTRODUCTION Two definitions of optimization include “to make the best or most effective use of” (Oxford) or “to make perfect, effective or functional as possible” (Webster) (Ferguson, 2014). Dynamic can be defined as “always active or changing” (Webster) or “system characterized by constant change, activity or progress” (Oxford). Dynamic optimization then means “to make the best of a system that is constantly changing”. Pork producers have been used to evolving in markets that are constantly moving up or down. During the last few years in particular, pork and commodity prices have been especially volatile (Figures 1 and 2). Figure 1. Quebec weekly pork price changes since 2006. Source: Mercier, 2014 108 London Swine Conference – Production Technologies to Meet Market Demands April 1and April 2, 2015 London Swine Conference – Production Technologies to Meet Market Demands April 1and April 2, 2015 109 Figure 2. Quebec weekly corn price ($/t) since 2009. Source: Mercier, 2014 These constantly changing situations offer pork producers opportunities or challenges to increase their revenue or in many instances reduce their loss. OPTIMIZATION PROCESS Least cost formulation is readily used to minimize feed costs for defined sets of performances. Does feeding pigs the cheapest feed always provide the best financial returns? Will feeding diets that minimize feed efficiency return the cheapest feed cost or highest profit? In some situations, yes, but in many cases no. An alternative is to use optimization, based on economic returns, as a means to improve profitability at the farm level. Because to my experience, a producer’s main objective is to make more money! To implement this type of complexity of merging both biological and economical responses, in commercial practice, integrated simulation models are necessary (Ferguson, 2008). Multiple simultaneous simulations involving many thousands of iterations are required before deriving an optimal solution. Certain minimum criteria are required for the optimization process including: 1) Ingredient and diet costs; 2) ability to predict animal responses; 3) knowledge/data of the variation in responses between individual animals; 4) fixed and variable production costs: and 5) definition of revenue generating processes such as grading grids. Figure 3 illustrates these relationships. Optimization can be run on many important aspects including nutrient requirement, feeding program, and shipping strategy. Decisions on the results of these optimization will primarily be based on financial outcomes but can also be oriented to improve ADG or Feed efficiency if they are identified as limiting factors on the farms. It is important to note that the optimum solution among various objectives will differ. One has to remember that every optimization is done within specific market conditions (hog price, ingredient costs, grading grid). Every time, one of the market condition key parameters moves up or down, it is important to re-evaluate the solution to make sure the answer is always optimized to maximize in most cases, financial outcomes. Production conditions (health, stocking 110 London Swine Conference – Production Technologies to Meet Market Demands April 1and April 2, 2015 density, barn conditions) will also influence the optimal solution and whenever they also change significantly, the optimized solution should be reviewed. Figure 3. The main component of the optimization process (Ferguson, 2013). An essential component of optimization is the variation among individual pigs within a batch of pigs. Each individual pig will have different optimum performance and economic responses to nutrient intakes, because of their differences in genetic potential, size, and ability to cope with social stressors. There is sufficient between-animal variation in protein and fat deposition, feed intake, and subsequent efficiency of nutrient utilization to ensure differences in the optimum responses between the ‘average’ individual pig and the combined average of all pigs in the batch (Ferguson 2014). OPTIMIZING SHIPPING STRATEGIES In recent years cost of production has often been used as a key metric on a regular basis. We can all agree it is important to know, analyze, and lower, the cost of production on swine operations, especially during tough times. However, we cannot overlook revenues as swine production is a business and to keep it viable we need keep our revenues as high as possible. With this in our mind, every producer should evaluate the rationale behind each shipping strategy in order to better understand what will get the maximum returns. To facilitate the decision-making process, sophisticated simulation models, like Watson S, involving stochastic optimization, are required to collectively consider 1) individual animal performances and economics over time; 2) the method of payment or grading grid (index and bonus/discount system); 3) a proposed method or criteria for selecting pigs to be shipped; and 4) changes in price over time. To initiate the optimization, it is necessary to define the weekly range of either 1) the proportion of pigs shipped, or 2) the minimum acceptable shipping weights. Watson S will generate performance and economic data for each individual pig and determine the optimum shipping strategy for the whole batch of pigs, including how many and what week they will be shipped. London Swine Conference – Production Technologies to Meet Market Demands April 1and April 2, 2015 111 Scenario 1 Take the following scenarios as example: - Pork prices : 1.20 and 1.80 $/kg Average feed prices : 360 $/t - Last week of shipment : 19 - Grid: Sofina Heavy The best indexes in the Sofina Heavy grid are seen between 88 and 106 kg. If a producer wants to play it safe, 97 kg is the middle of the window that will give the best average index. However, the 18 kg range also offers the possibility to adjust the shipping weight according to the highest margin in a specific condition. Figure 4. Sofina 2015 heavy grid. Table 1 presents the best possible shipping strategy for maximizing profit with a hog price of 1.20 $/kg. Watson S shows the weekly shipping percentages to obtain the target carcass weight and what those will yield in terms of index and revenue on the grid being used. In this situation Watson S suggest keeping to the left of the grid and lower the carcass weight to reduce the loss. Weekly shipping will be affected accordingly. Shipping strategy must be dynamic and capable of responding to market conditions in real time. Watson S is capable of determining optimal strategies on the fly and allows us to find solutions in constantly changing market. For example if the price were to increase to 1.80 $/kg the target weight and the percent shipped each week would be much different. In fact, the recommendation would be an extremely different shipping strategy (Table 2), increasing the carcass weight by 4 kg and totally changing the weekly shipping percentage. Figure 5 shows how the producer has to change their shipping strategy to increase carcass weight from 96.3 to 100.5 kg. Table 1. Optimum shipping strategy for 1.20 $/kg hog price. Hog price : 1.20 $/kg Week 14 15 16 17 18 19 Average 112 % Shipped Live weight Carcass 1.20 $/kg (kg) weight (kg) 6 124 99.5 25 122.5 97.8 22.5 121 96.4 26 121 96.4 9 118.5 94.3 11.5 116 92.5 100 120.7 96.3 Average Index 109.7 110.3 110.5 110.4 110.6 109.6 110.3 London Swine Conference – Production Technologies to Meet Market Demands April 1and April 2, 2015 Table 2. Optimum shipping strategy for 1.80 $/kg hog price. Hog price : 1.80 $/kg Week 14 15 16 17 18 19 Average % Shipped Live weight Carcass 1.80 $/kg (kg) weight (kg) 6 126 101 15 126.5 101.2 15 126.9 101.2 25 127.3 101.2 19 127.3 101.7 20 120.9 96.3 100 125.7 100.4 Average Index 109.3 109.9 109.8 109.7 109.7 110 109.8 96.3 kg 100.5 kg Figure 5. Weekly shipping strategy for two hog prices of 1.20 and 1.80 $kg. What if the shipping strategy is not adjusted to market conditions? How much do I lose? Traditionally, producers were used to shipping pigs to maximize average index thinking it was the best way to maximize revenue and margin. In a dynamic shipping strategy, index is only a component of the equation used to calculate margin. Table 3 shows how sometimes average index and profit do not always go in the same direction and can be misleading. In this example, using a hog price of 1.80 $/kg profit is increasing linearly from 96 to 100.4 kg carcass weight even though index is reduced. London Swine Conference – Production Technologies to Meet Market Demands April 1and April 2, 2015 113 Table 3. Profit difference between for different carcass weight at 1.80 $/kg hog price. Hog price 1.80 $/kg Carcass weight (kg) Index 96.3 97.8 98.9 100.4 110.3 110.2 110 109.8 Profit difference ($/pig) 0.79 1.31 1.85 OPTIMUM FEEDING PROGRAM Each feeding program includes three main components: energy level, amino acid level and quantity of each phase. Unfortunately there is no one size fits all feeding program, it should all be farm specific. Use of integrated simulation models that are merging both biological and economical responses, like Watson S, are necessary to develop individual and specific farm feeding programs. However, since market conditions change over time, optimal feeding programs have to be dynamic. To demonstrate this concept, a 3 energy concentration x 2 amino acid level x 2 feeding budget program was evaluated over time on the basis of margin over feed cost (Table 4). Table 4. Feeding program. Programs 4A1 4A2 4B1 4B2 3A1 3A2 3B1 3B2 2A1 2A2 2B1 2B2 114 Feed cost $/t Energy level (High, Amino acid level Feeding program (A or B) (High, Medium, Medium and Low) (High, Medium) Low) H H A H H H B H H M A H H M B H M M M M H H M M L L L L H H M M A B A B A B A B London Swine Conference – Production Technologies to Meet Market Demands April 1and April 2, 2015 M M M M L L L L Figure 6 shows that the feed program will have an important impact on feed conversion. As expected, feed conversion ratio is linearly related to feed density. What about feed cost per pig? 2.74 2.75 Feed conversion 2.72 2.69 2.66 2.66 2.63 2.6 2.7 2.69 2.61 2.62 2.65 2.7 2.67 2.66 2.62 2.59 2.57 2.54 4A1 4A2 4B1 4B2 3A1 3A2 3B1 3B2 2A1 2A2 2B1 2B2 Programs Figure 6. Impact of different feeding programs on feed conversion. Using these strategies at two different times of the year, we were able to show that depending on the commodity prices, the programs that will render the lowest feed cost can change and one has to be dynamic to adjust accordingly (Figures 7 and 8). Figure 7 demonstrates that in some market conditions, the low density programs will result in the lowest feed cost. However, figure 8 shows that with different market conditions, the best feed cost comes with the highest density program. It is therefore very important to be aware of any important price movement namely of the corn and soybean meal and reevaluate the feed program accordingly. For sure, genotype, health & well-being & pig flow have to be kept in mind to make sure other production parameters are not jeopardized by these optimizations. 1.4 Relative feed cost ($/pg) 1.2 1 0.8 0.6 0.4 0.2 0 -0.2 -0.4 -0.6 0.25 0.21 0.05 0 4A1 4A2 4B1 4B2 3A1 3A2 3B1 3B2 2A1 2A2 2B1 2B2 -0.03 -0.08 -0.21 -0.16 -0.07 -0.32 -0.32 -0.36 Programs Figure 7. Relative feed cost per pig in relation to feed program. London Swine Conference – Production Technologies to Meet Market Demands April 1and April 2, 2015 115 1.34 Relative feed cost ($/pg) 1.4 1.2 0.9 1 0.73 0.8 0.6 0.45 0.4 0.2 0 0.63 0.15 0 0.29 0.25 0.7 0.37 0.06 4A1 4A2 4B1 3A1 3A2 4B2 3B1 2A1 3B2 2A2 2B1 2B2 Programs Figure 8. Relative feed cost per pig in relation to feed program. SUMMARY Market conditions that swine producers operate in will continue to constantly evolve. In order to be successful producers will have to be aware of theses changing market conditions and dynamically optimize their shipping and feeding strategy to maximize profitability, not only daily gain, feed conversion or looking at the lowest feed cost per ton. To perform this operation, strategic utilization of integrated simulation models, with the capacity to optimize, can play a significant role in choosing the best strategy for the moment. REFERENCES DePietre, D. (2013) Productivity and optimal returns. Advances in Pork Production 24:143-148. Ferguson, N.S. (2008) Application of an integrated management system to improve performance and profitability in finishing pigs. Advances in Pork Production 19:85-91. Ferguson, N.S. (2014) Optimization: A paradigm Change in Nutrition and Economic Solutions. Advances in Pork Production 25:121-127. Mercier, R. (2014) Coût de production 2014. Réunion annuelle 2014. Nutreco Canada Woods, D. (2015) Is your shipping strategy optimal. Technical Bulletin. Nutreco Canada. 116 London Swine Conference – Production Technologies to Meet Market Demands April 1and April 2, 2015 BENCHMARKING 2013 NURSERY, FINISHING, AND WEAN-TOFINISH CLOSEOUT PERFORMANCE Tom Stein MetaFarms, Inc., 421 W Travelers Trail, Burnsville, MN 55337 Email: [email protected] INTRODUCTION We are reporting results from analysis of the MetaFarms’ Finishing Manager database that show averages for nursery, finishing and wean-to-finish closeouts. For 2013, the dataset included over 17,000 anonymous and confidential closeouts, all based on a standardized set of business logic and calculation algorithms, which allows our analysts and users to make apples-to-apples comparisons of performance across and within companies using this software. AVERAGE CLOSEOUT PERFORMANCE The table below shows benchmarking averages and distributions for 2013. These results are from both Canadian and US pork producers. We converted Canadian metric data to the imperial system. 2013 Nursery No. Closeouts 7,307 No. Pigs 13,128,104 Start Wt 13.0 Avg Out Wt w/o Dead Wt 52 Sub-Stnd Sales as % of Pigs Out Avg Cull Wt Market Sales as % of Pigs Out Inv Adjust as % of Pigs Out 0.22% Lb Feed Per Hd 63 Feed Cost per Lb Gain Prod $0.3737 Avg Feed Med Costs Per Pig $0.4375 Avg Other Med Costs Per Pig $0.8057 Actual Sqft/Pig 2.8 Mortality as % of Pigs In 3.6% ADG 0.82 FCR 1.64 ADFI 1.38 Adjusted FCR 1.66 Avg DOF 47 Days To First (Top-Out) Sale Avg Feed Cost/Ton $462 Avg Corn Cost/Bu $6.57 Avg DDGS Cost/Ton $243 Avg SBM Cost/Ton $448 DDGS % 8.2% Finishing W2F 8,003 14,320,145 52 271 1.7% 215 93% 0.28% 611 $0.4371 $1.63 $1.62 7.2 4.4% 1.82 2.83 5.16 2.65 119 103 $310 $6.78 $251 $451 19.6% 1,889 3,863,086 13.5 271 1.8% 212 91% 0.20% 665 $0.4199 $1.99 $2.86 7.0 6.3% 1.58 2.60 4.11 163 149 $325 $6.58 $253 $453 2.4% The wean-to-finish closeouts represent single-stock groups only, which makes for cleaner set of numbers especially for comparison with the combined nursery-finishing performance data. You can add the cumulative feed averages (674 lb) and compare to the wean-to-finish number (665 lb). Same thing for mortality, average days-on-feed, and medication costs per pig. And for numbers London Swine Conference – Production Technologies to Meet Market Demands April 1and April 2, 2015 117 such as Average Daily Gain or Feed Conversion, you can figure a weighted average of nursery and finishing performance to compare with wean-to-finish numbers. When comparing nursery + finishing to wean-to-finish groups, we see the same pattern as last year: there seems to be an advantage to wean-to-finish barns with pig performance showing lower mortality, fewer days on feed, and less feed/pig at the same Average Out Weight. Also, keep in mind that the Cumulative Feed/Pig for Finishing Closeouts represents only the finishing phase feed; it doesn’t include the Nursery phase. PERCENTILE DISTRIBUTIONS FOR CLOSEOUT PERFORMANCE While averages are helpful they also hide a lot of information that shows you where you stand in comparison to your peers. That’s why we have provided tables for the percentile distributions of nursery, finishing and wean-to-finish closeout performance. The reporting period for the data in in the next three tables is January 1 through December 31, 2013. Weights are in lbs., costs are in $USD. Each parameter represents an independent percentile distribution which means that you should read across a row for each item and not down a column. A reminder on how to read percentiles: any particular percentile number means that x% of all the closeouts are below that number and 1 – x% are above it. For example, the 20th percentile for nursery average daily gain is .69lb/day, which means that 20% of all the closeouts had lower ADG and 80% were higher. In these tables, we didn’t reverse any item’s order to make the percentiles read “bad to good.” If you want to use these to make a report card for your system, where the 90th percentile always means ‘good’ and the 10th always means ‘bad’, you should reverse the ones where a high number is ‘bad’ such as mortality % or feed conversion. Percentile Distrbution Across NURSERY Closeouts (Jan-Dec 2013) Percentiles 10 20 30 40 50 60 70 80 90 Start Wt 11.8 12.0 12.1 12.5 12.9 13.2 13.6 14.0 14.6 Actual Sqft/Pig 2.24 2.50 2.65 2.76 2.85 2.95 3.01 3.11 3.31 Avg Out Wt w/o Dead Wt 37.3 41.1 45.0 48.7 51.9 55.0 58.1 61.6 66.4 Lb Feed Per Hd 36.7 43.4 49.5 56.0 62.0 67.9 73.9 81.3 91.7 Feed Cost per Lb Gain Prod $0.2896 $0.3165 $0.3359 $0.3532 $0.3695 $0.3846 $0.4035 $0.4285 $0.4655 Avg Feed Med Costs Per Pig $0.2006 $0.2540 $0.2807 $0.3063 $0.3478 $0.4028 $0.4888 $0.5807 $0.7929 Avg Other Med Costs Per Pig $0.0765 $0.1387 $0.2066 $0.4715 $0.7007 $0.9770 $1.3172 $1.4709 $1.6584 Mortality as % of Pigs In 0.9% 1.3% 1.7% 2.1% 2.6% 3.1% 3.8% 5.0% 7.3% ADG 0.64 0.69 0.74 0.77 0.81 0.85 0.90 0.94 1.00 FC 1.34 1.44 1.51 1.57 1.62 1.67 1.74 1.82 1.96 ADFI 1.09 1.16 1.23 1.29 1.35 1.41 1.49 1.58 1.71 Adjusted FCR (55lb) 1.37 1.47 1.53 1.58 1.63 1.69 1.76 1.84 1.98 Avg DOF 36.0 39.0 41.1 44.1 47.1 49.4 52.0 54.3 57.0 Avg Feed Cost/Ton $375 $399 $418 $435 $452 $469 $492 $522 $561 Avg Corn Cost/Bu $4.74 $5.81 $6.31 $6.65 $6.93 $7.09 $7.21 $7.35 $7.56 Avg DDGS Cost/Ton $214 $221 $229 $234 $240 $248 $257 $263 $271 Avg SBM Cost/Ton $416 $422 $428 $437 $446 $452 $463 $474 $486 DDGS % 3.3% 4.3% 5.0% 5.6% 6.5% 7.7% 9.6% 11.9% 16.2% 118 London Swine Conference – Production Technologies to Meet Market Demands April 1and April 2, 2015 Percentile Distribution for WEAN-TO-FINISH Closeouts (Jan-Dec 2013) 10 20 30 40 Percentiles 50 60 70 80 90 Start Wt 12.0 12.3 12.7 13.0 13.2 13.6 14.0 14.4 15.3 Actual Sqft/Pig 6.6 6.8 6.9 6.9 7.0 7.1 7.2 7.4 7.7 255.8 261.9 265.5 268.9 271.5 274.2 277.2 281.0 285.4 Avg Out Wt w/o Dead Wt Sub-Stnd Sales as % of Pigs Out Market Sales as % of Pigs Out 3.9% 2.9% 2.3% 1.8% 1.5% 1.1% 0.7% 0.1% 0.0% 83.9% 87.7% 89.6% 91.1% 92.3% 93.4% 94.2% 95.0% 95.9% Lb Feed Per Hd 739.0 710.9 694.4 678.0 664.6 651.9 638.8 620.8 595.7 Feed Cost per Lb Gain Prod $0.4730 $0.4541 $0.4405 $0.4304 $0.4217 $0.4126 $0.4016 $0.3872 $0.3676 Avg Feed Med Costs Per Pig $3.7890 $3.0504 $2.5939 $2.1845 $1.7314 $1.3847 $1.0562 $0.7224 $0.4698 Avg Other Med Costs Per Pig $5.6227 $3.9500 $3.4370 $2.9632 $2.5881 $2.1227 $1.7176 $1.3021 $0.8837 11.0% 8.6% 7.2% 6.1% 5.3% 4.6% 3.9% 3.3% 2.5% ADG 1.44 1.49 1.53 1.55 1.58 1.61 1.64 1.67 1.72 FC 2.39 2.46 2.51 2.55 2.59 2.63 2.69 2.75 2.83 ADFI 3.71 3.84 3.93 4.02 4.09 4.18 4.27 4.39 4.54 170.1 187.7 198.2 206.6 213.0 220.1 228.9 238.7 251.6 Avg DOF 150 154 157 160 162 165 168 172 176 Days To First STD Sale 137 141 144 146 148 151 154 157 163 $286.23 $301.87 $312.11 $320.58 $327.57 $334.11 $341.54 $349.36 $358.13 Mortality as % of Pigs In Avg Cull Wt Avg Feed Cost/Ton Avg Corn Cost/Bu Avg DDGS Cost/Ton $5.01 $5.76 $6.18 $6.63 $6.93 $7.11 $7.24 $7.36 $7.50 $222.24 $230.69 $236.02 $244.45 $256.53 $263.10 $267.82 $271.36 $280.43 DDGS % Avg SBM Cost/Ton 0.4% 1.6% 2.1% 2.3% 2.5% 2.7% 2.9% 3.1% 3.4% $423.58 $432.61 $439.92 $445.04 $452.10 $459.94 $466.80 $476.64 $491.63 Percentile Distributions Across FINISHING Closeouts (Jan-Dec 2013) 10 20 30 40 Percentiles 50 60 70 80 90 Start Wt 36.9 41.4 45.5 49.4 52.6 55.7 59.4 62.8 68.5 Actual Sqft/Pig 6.7 6.8 6.9 7.1 7.2 7.3 7.4 7.5 7.6 255.8 261.6 265.2 268.3 271.3 274.1 277.1 280.9 286.3 Avg Out Wt w/o Dead Wt Sub-Stnd Sales as % of Pigs Out 0.0% 0.1% 0.3% 0.7% 1.2% 1.6% 2.1% 2.8% 3.9% Market Sales as % of Pigs Out 86.1% 89.3% 91.4% 92.7% 93.7% 94.6% 95.5% 96.2% 97.1% Lb Feed Per Hd 538.1 564.3 581.3 595.5 608.3 622.1 638.0 657.5 685.3 Feed Cost per Lb Gain Prod $0.3765 $0.4003 $0.4149 $0.4273 $0.4380 $0.4496 $0.4616 $0.4771 $0.4980 Avg Feed Med Costs Per Pig $0.3511 $0.5060 $0.6920 $1.0312 $1.4345 $1.9208 $2.2961 $2.6009 $3.2119 Avg Other Med Costs Per Pig $0.5527 $0.7026 $0.8449 $1.0128 $1.2384 $1.4450 $1.8047 $2.4439 $3.5868 Mortality as % of Pigs In 1.7% 2.3% 2.8% 3.3% 3.8% 4.4% 5.2% 6.1% 7.7% ADG 1.63 1.70 1.74 1.78 1.82 1.86 1.90 1.95 2.02 FC 2.51 2.63 2.71 2.78 2.84 2.89 2.95 3.03 3.14 ADFI 4.49 4.71 4.88 5.02 5.14 5.28 5.44 5.60 5.84 Adjusted FCR 2.38 2.51 2.58 2.64 2.70 2.76 2.82 2.90 3.01 Avg Cull Wt 159.5 182.0 195.6 206.7 215.6 225.5 237.6 252.5 271.9 Avg DOF 104 108 112 115 119 122 125 129 134 Days To First STD Sale 87 92 97 100 104 107 111 114 119 $268.39 $286.59 $298.79 $305.99 $311.59 $319.35 $327.71 $336.47 $344.21 Avg Feed Cost/Ton Avg Corn Cost/Bu Avg DDGS Cost/Ton DDGS % Avg SBM Cost/Ton $5.60 $6.25 $6.58 $6.71 $6.98 $7.10 $7.23 $7.37 $7.58 $221.68 $228.71 $234.93 $242.88 $249.51 $258.82 $265.00 $272.08 $279.05 9.9% 14.9% 17.3% 18.1% 18.9% 20.3% 22.7% 25.0% 29.4% $418.04 $428.52 $436.66 $444.45 $451.44 $457.91 $465.15 $473.46 $485.49 London Swine Conference – Production Technologies to Meet Market Demands April 1and April 2, 2015 119 YEAR-OVER-YEAR COMPARISON OF AVERAGE CLOSEOUT PERFORMANCE The next three tables show year-over-year comparisons by production phase. We added some items in 2013, that’s why you’ll see blanks in the 2012 column. Adjusted FCR uses the formula published by Kansas State (Goodband et al, 2008) that adjusts nursery ADG to an out weight of 55lb and adjusts finishing ADG to an in-weight of 50lb and an out-weight of 250lb. In 2013, nursery mortality was 20% higher (3.6 v. 3.0%), ADG was slightly lower and Average Out Weight was down about 4%. Days-on-feed was also down by a bit over one day which might have contributed to the lower Average Out Weight. NURSERY Closeout Averages 2012 2013 No. Closeouts 6,295 7,307 No. Pigs 12,461,844 13,128,104 Start Wt 13.0 13.0 Actual Sqft/Pig Avg Out Wt w/o Dead Wt Lb Feed Per Hd Feed Cost per Lb Gain Prod 2.80 54.0 51.9 67.0 63.4 $0.3508 $0.3737 Avg Feed Med Costs Per Pig $0.4375 Avg Other Med Costs Per Pig $0.8057 Inventory Adjustment % 0.22% Mortality as % of Pigs In 3.0% 3.6% ADG 0.84 0.82 FC 1.64 1.64 ADFI 1.36 1.38 Adjusted FCR Avg DOF 1.66 48.0 46.7 Avg Feed Cost/Ton $432 $462 Avg Corn Cost/Bu $6.44 $6.57 Avg DDGS Cost/Ton $243 Avg SBM Cost/Ton $448 DDGS % 8.2% Mortality in finishing closeouts was up about 7% in 2013 while feed conversion and average daily gain were slightly better. Start Weight was 4% lower. Feed cost per ton was up by 9% most likely due to higher corn costs ($6.78/bu v. $6.38/bu). Mortality was also up (by almost 7%) in 2013 wean-to-finish closeouts. Even with a higher mortality, the Average Out Weight was slightly higher, Average Daily Gain was better, and Average Days-on-Feed was shorter by one day. The % Sold as Market Hogs was up and consequently the % Sold as Sub-Standard (Lightweight) was down. 120 London Swine Conference – Production Technologies to Meet Market Demands April 1and April 2, 2015 FINISHING CLOSEOUT AVERAGES 2012 2013 No. Closeouts No. Pigs Start Wt Avg Out Wt w/o Dead Wt Sub-Stnd Sales as % of Pigs Out Market Sales as % of Pigs Out Inv Adjust as % of Pigs Out Lb Feed Per Hd Mortality as % of Pigs In ADG FCR Adjusted FCR (50-250) ADFI Actual Sqft/Pig Avg Cull Wt Avg DOF Days To First (Top-Out) Sale Feed Cost per Lb Gain Avg Feed Med Costs Per Pig Avg Other Med Costs Per Pig Avg Feed Cost/Ton Avg Corn Cost/Bu Avg DDGS Cost/Ton DDGS % Avg SBM Cost/Ton 7,405 13,946,859 55.0 270.0 1.8% 90% 612 4.1% 1.80 2.92 5.25 120 $0.4106 $281.13 $6.38 8,003 14,320,145 52.8 271.1 1.7% 93% 0.28% 611 4.4% 1.82 2.83 2.65 5.16 7.2 215 119 103 $0.4371 $1.63 $1.62 $309.76 $6.78 $251.28 19.6% $451.37 W2F Averages 2012 2013 No. Closeouts No. Pigs Start Wt Avg Out Wt w/o Dead Wt Sub-Stnd Sales as % of Pigs Out Market Sales as % of Pigs Out Inv Adjust as % of Pigs Out Lb Feed Per Hd Mortality as % of Pigs In ADG FC ADFI Actual Sqft/Pig Avg Cull Wt Avg DOF Days To First (Top-Out) Sale Feed Cost per Lb Gain Prod Avg Feed Med Costs Per Pig Avg Other Med Costs Per Pig Avg Feed Cost/Ton Avg Corn Cost/Bu Avg DDGS Cost/Ton DDGS % Avg SBM Cost/Ton 1,476 2,822,284 13.5 270.0 2.6% 89% 661 5.9% 1.57 2.64 4.12 163 $0.3652 $294.50 $6.55 1,889 3,863,086 13.5 270.9 1.8% 91% 0.20% 665 6.3% 1.58 2.60 4.11 7.0 212 163 149 $0.4199 $1.99 $2.86 $324.87 $6.58 $252.94 2.4% $453.44 London Swine Conference – Production Technologies to Meet Market Demands April 1and April 2, 2015 121 NURSERY PERFORMANCE -- EFFECT OF START WEIGHT, DAYS-ON-FEED, MORTALITY, SQ FT/PIG, and % DDGS IN DIET For the next five tables, you should read down each column for performance associated with any certain level or category and then across the columns for comparing, to see if there are real differences by level. For average start weights in nursery groups, note the huge performance penalty for groups with very light (< 10lb) average Start Weights and a substantial (but not quite as bad) a penalty even for groups with light (10-11 lb.) average Start Weights. There is a positive effect of Start Weight on Average Daily Gain, i.e. the higher the Start Weight the higher the Average Daily Gain. Days-on-Feed (DOF) is the biggest driver of nursery closeout performance outcomes. Mortality increases as DOF go up. As DOF goes up, Average Daily Gain (ADG), Feed Conversion Ratio (FCR), and Average Daily Feed Intake (ADFI) change due to growth curve effects, i.e. longer DOF groups represent larger ‘slices’ of the growth curve which means you should expect higher ADG, higher (worse) FCR, and larger ADFI. It’s obvious that you need to control for average DOF when ranking, indexing or comparing nursery closeout performance. Nursery groups with higher mortality levels have lower ADG, higher (worse) FCR, and lower feed intake (ADFI). They also have higher Feed Cost/Lb Gain. Interestingly, higher mortality groups have lower medication costs. If you think higher med costs means more aggressive medication action then you might read these data as saying it worked to reduce or prevent mortality in nursery groups. Benchmarking Nursery Closeouts by Start Weight Average Start Weight (Lbs) No. Closeouts No. Pigs Start Wt Actual Sqft/Pig Avg Out Wt w/o Dead Wt Lb Feed Per Hd Feed Cost per Lb Gain Prod Avg Feed Med Costs Per Pig Avg Other Med Costs Per Pig Mortality as % of Pigs In ADG FC ADFI Adjusted FCR Avg DOF Avg Feed Cost/Ton Avg Corn Cost/Bu Avg DDGS Cost/Ton Avg SBM Cost/Ton DDGS % 122 9 - 10 10 - 11 11 - 12 12 - 13 13 - 14 14 - 15 15 - 16 16-17 45 46,552 9.5 2.6 42.5 53.3 $0.3557 $0.3793 $1.54 8.2% 0.71 1.67 1.23 1.77 46.5 $446.14 $7.01 $247.96 $439.23 4.4% 158 241,043 10.6 2.9 48.4 58.5 $0.3433 $0.4226 $1.32 6.8% 0.78 1.57 1.28 1.63 47.3 $441.49 $6.55 $249.35 $442.16 5.5% 824 2,086,876 11.6 2.9 52.7 67.9 $0.3661 $0.4596 $1.02 3.9% 0.82 1.67 1.41 1.68 49.3 $443.23 $6.73 $247.56 $451.32 7.5% 2,881 4,988,911 12.3 2.9 49.9 60.7 $0.3772 $0.4041 $1.07 3.9% 0.80 1.62 1.34 1.66 46.2 $468.56 $6.64 $242.03 $449.14 8.6% 1,921 3,348,363 13.4 2.7 53.1 64.4 $0.3708 $0.4583 $0.56 3.2% 0.83 1.63 1.39 1.64 46.7 $459.28 $6.48 $241.75 $448.23 7.6% 984 1,734,898 14.4 2.6 53.8 64.9 $0.3763 $0.4717 $0.68 3.1% 0.85 1.65 1.43 1.66 45.9 $462.45 $6.46 $241.80 $444.02 9.4% 341 484,283 15.4 2.7 56.2 67.8 $0.3876 $0.4503 $0.83 2.8% 0.86 1.67 1.45 1.66 46.8 $467.54 $6.34 $247.41 $449.66 8.3% 89 100,120 16.4 2.6 56.7 68.0 $0.3948 $0.4289 $0.79 3.2% 0.86 1.71 1.48 1.70 46.0 $464.03 $6.54 $246.00 $440.96 8.3% London Swine Conference – Production Technologies to Meet Market Demands April 1and April 2, 2015 Benchmarking Nursery Closeouts by Average Days-on-Feed Average Days-on-Feed No. Closeouts No. Pigs Start Wt Actual Sqft/Pig Avg Out Wt w/o Dead Wt Lb Feed Per Hd Feed Cost per Lb Gain Prod Avg Feed Med Costs Per Pig Avg Other Med Costs Per Pig Mortality as % of Pigs In ADG FC ADFI Adjusted FCR Avg DOF Avg Feed Cost/Ton Avg Corn Cost/Bu Avg DDGS Cost/Ton Avg SBM Cost/Ton DDGS % 21 - 28 28 - 35 35 - 42 42 - 49 49 - 56 56 - 63 63 - 70 93 128,168 13.4 2.4 33.0 28.3 $0.4213 $0.2863 $0.52 2.3% 0.73 1.41 1.23 1.58 25.4 $610.82 $6.38 $243.40 $453.83 6.1% 480 865,878 13.1 2.4 36.5 34.0 $0.4085 $0.3174 $0.64 2.4% 0.73 1.49 1.19 1.63 32.2 $553.04 $6.46 $243.08 $449.24 6.2% 1,778 2,450,279 12.9 2.6 42.6 44.9 $0.3819 $0.3579 $0.87 2.9% 0.76 1.54 1.23 1.64 38.8 $497.64 $6.57 $239.26 $448.24 6.9% 1,826 3,720,056 13.1 2.8 51.5 60.5 $0.3671 $0.4693 $0.71 3.4% 0.83 1.62 1.36 1.64 45.6 $457.72 $6.58 $245.60 $448.24 8.1% 2,124 4,331,301 13.0 3.0 58.3 75.5 $0.3671 $0.5442 $0.81 4.2% 0.85 1.70 1.45 1.68 52.4 $432.91 $6.67 $244.97 $446.26 8.6% 828 1,342,990 12.9 3.0 64.5 90.1 $0.3610 $0.4659 $1.10 4.5% 0.87 1.77 1.54 1.70 58.5 $406.97 $6.41 $237.28 $448.37 9.6% 135 208,720 12.9 3.0 70.1 105.6 $0.3803 $0.6131 $0.96 6.7% 0.88 1.89 1.66 1.77 65.0 $406.26 $6.41 $243.84 $443.66 11.9% Benchmarking Nursery Closeouts by Mortality 1 - 2% 2 - 3% 3 - 4% 919 1,717,900 13.3 2.6 49.2 56.1 $0.3640 $0.4227 $1.01 0.6% 0.84 1.53 1.35 1.58 41.9 $482.73 $6.41 $242.14 $455.11 8.8% 1,793 3,359,999 13.1 2.9 52.0 62.1 $0.3625 $0.4428 $0.87 1.5% 0.85 1.60 1.39 1.62 45.1 $457.81 $6.42 $240.70 $449.85 9.1% 1,516 2,912,395 13.0 2.9 53.5 65.8 $0.3635 $0.4580 $0.65 2.5% 0.84 1.63 1.42 1.64 47.0 $450.70 $6.52 $239.96 $448.71 9.0% 1,003 1,866,246 12.9 2.9 53.6 67.2 $0.3721 $0.4535 $0.70 3.5% 0.83 1.66 1.42 1.67 48.1 $450.38 $6.63 $242.37 $446.08 8.2% Average Mortality % 4 - 5% 5 - 6% 6 - 7% 7 - 8% 8 - 9% 9 - 10% >= 10% 155 220,792 12.8 3.0 50.9 63.9 $0.4071 $0.3981 $0.62 7.5% 0.75 1.72 1.32 1.75 49.4 $480.82 $6.73 $245.12 $441.29 6.2% 139 189,306 12.7 2.6 48.8 61.1 $0.4188 $0.4412 $0.39 8.5% 0.72 1.75 1.30 1.80 48.7 $485.87 $6.64 $245.11 $441.78 6.9% 98 146,602 12.7 3.2 48.2 59.3 $0.4113 $0.4393 $0.40 9.5% 0.70 1.71 1.30 1.76 48.8 $486.50 $6.71 $249.97 $441.47 7.5% 383 465,988 12.4 2.4 48.1 60.1 $0.4407 $0.3912 $0.57 16.0% 0.68 1.82 1.26 1.87 50.5 $497.76 $6.99 $251.55 $441.41 5.3% London Swine Conference – Production Technologies to Meet Market Demands April 1and April 2, 2015 123 No. Closeouts No. Pigs Start Wt Actual Sqft/Pig Avg Out Wt w/o Dead Wt Lb Feed Per Hd Feed Cost per Lb Gain Prod Avg Feed Med Costs Per Pig Avg Other Med Costs Per Pig Mortality as % of Pigs In ADG FC ADFI Adjusted FCR Avg DOF Avg Feed Cost/Ton Avg Corn Cost/Bu Avg DDGS Cost/Ton Avg SBM Cost/Ton DDGS % < 1% 637 1,208,347 12.9 2.9 53.8 67.7 $0.3725 $0.4362 $0.65 4.5% 0.82 1.67 1.41 1.67 48.8 $452.18 $6.66 $243.68 $444.69 7.8% 399 640,577 12.8 2.8 52.5 65.7 $0.3796 $0.4456 $0.87 5.5% 0.79 1.69 1.36 1.70 49.1 $453.70 $6.68 $244.99 $443.65 7.6% 265 399,952 12.8 2.9 50.5 63.2 $0.3942 $0.4080 $0.56 6.5% 0.75 1.71 1.32 1.74 48.9 $466.46 $6.74 $244.62 $441.31 6.7% Benchmarking Nursery Closeouts by Sq Ft/Pig No. Closeouts No. Pigs Start Wt Actual Sqft/Pig Avg Out Wt w/o Dead Wt Lb Feed Per Hd Feed Cost per Lb Gain Prod Avg Feed Med Costs Per Pig Avg Other Med Costs Per Pig Mortality as % of Pigs In ADG FC ADFI Adjusted FCR Avg DOF Avg Feed Cost/Ton Avg Corn Cost/Bu Avg DDGS Cost/Ton Avg SBM Cost/Ton DDGS % < 2.0 2.0-2.2 2.2-2.4 2.4-2.6 2.6-2.8 33 55,190 13.0 1.9 41.2 43.1 $0.3502 $0.3935 $1.28 2.8% 0.75 1.41 1.27 1.52 36.5 $486.38 $5.52 $237.08 $439.25 11.2% 114 280,393 13.2 2.1 42.9 42.9 $0.3783 $0.4098 $0.51 1.8% 0.79 1.43 1.20 1.53 37.2 $534.48 $6.18 $241.11 $448.42 6.5% 72 153,875 13.5 2.3 45.7 47.2 $0.4001 $0.5755 $1.05 2.9% 0.82 1.49 1.24 1.56 39.4 $549.43 $6.30 $243.17 $450.97 6.3% 210 338,250 13.6 2.5 50.3 54.7 $0.3668 $0.3530 $0.73 2.8% 0.83 1.51 1.28 1.55 43.3 $490.12 $6.33 $244.71 $448.78 6.9% 294 699,688 12.6 2.7 55.8 68.1 $0.3466 $0.4334 $0.83 3.1% 0.89 1.57 1.43 1.56 47.6 $443.40 $6.52 $249.31 $444.23 9.6% Sq Ft / Pig 2.8-3.0 3.0-3.2 397 939,511 12.5 2.9 59.5 78.6 $0.3540 $0.3462 $1.18 2.8% 0.91 1.67 1.52 1.64 51.1 $424.35 $6.44 $238.80 $443.85 13.7% 266 529,410 12.6 3.1 62.2 86.2 $0.3627 $0.3298 $1.06 2.9% 0.94 1.74 1.64 1.68 52.2 $419.41 $6.65 $245.78 $442.64 13.8% 3.2-3.4 3.4-3.6 > 3.6 124 246,559 12.4 3.3 59.1 81.6 $0.3708 $0.3479 $1.07 3.1% 0.91 1.76 1.60 1.72 50.6 $425.39 $6.41 $239.71 $439.61 11.4% 61 205,292 12.4 3.5 61.5 79.9 $0.3437 $0.3804 $1.19 2.7% 0.92 1.64 1.52 1.58 52.3 $423.77 $6.43 $240.01 $443.36 15.6% 47 206,483 12.2 3.7 61.0 79.9 $0.3301 $0.2901 $1.09 2.0% 0.91 1.68 1.52 1.63 52.8 $398.16 $6.23 $235.35 $441.06 16.6% Benchmarking Nursery Closeouts by DDGS % in Diet No. Closeouts No. Pigs Start Wt Actual Sqft/Pig Avg Out Wt w/o Dead Wt Lb Feed Per Hd Feed Cost per Lb Gain Prod Avg Feed Med Costs Per Pig Avg Other Med Costs Per Pig Mortality as % of Pigs In ADG FC ADFI Adjusted FCR Avg DOF Avg Feed Cost/Ton Avg Corn Cost/Bu Avg DDGS Cost/Ton Avg SBM Cost/Ton DDGS % 124 < 3% 3 - 5% 5 - 7% DDGS % in Diet 7 - 9% 9 - 11% 235 296,787 13.2 2.5 47.0 51.8 $0.3888 $0.4822 $0.33 3.8% 0.78 1.53 1.27 1.60 42.8 $507.62 $6.53 $240.79 $448.20 1.7% 727 738,542 12.7 2.6 47.1 54.3 $0.3680 $0.4000 $0.68 5.6% 0.74 1.61 1.21 1.68 45.9 $456.07 $6.54 $242.75 $441.20 4.1% 760 879,991 13.2 2.5 51.5 64.1 $0.3846 $0.4078 $0.58 5.0% 0.76 1.69 1.31 1.72 49.3 $458.43 $6.60 $241.42 $444.48 5.9% 367 608,213 13.1 2.4 51.2 61.8 $0.3749 $0.4356 $0.76 3.0% 0.80 1.63 1.32 1.66 46.9 $463.68 $6.33 $244.90 $448.21 8.0% 286 568,830 13.1 2.6 51.0 61.1 $0.3700 $0.4964 $0.80 2.9% 0.82 1.63 1.35 1.66 45.2 $458.11 $6.17 $242.65 $447.14 9.9% 11 - 13% 13 - 15% 217 474,934 13.2 2.9 54.2 67.2 $0.3643 $0.6043 $0.94 2.5% 0.86 1.65 1.41 1.65 47.6 $446.23 $6.42 $245.31 $452.45 11.9% London Swine Conference – Production Technologies to Meet Market Demands April 1and April 2, 2015 141 365,169 13.0 3.1 56.7 70.4 $0.3347 $0.6610 $0.98 2.9% 0.87 1.62 1.43 1.60 49.3 $415.21 $6.43 $244.48 $448.03 14.0% > 15% 387 1,210,713 13.1 3.1 60.5 76.8 $0.3309 $0.5934 $1.19 2.7% 0.90 1.65 1.49 1.61 52.0 $407.84 $6.58 $243.70 $443.42 19.0% There is definitely a density effect on performance in the nursery (as many studies have shown). Lower density levels (e.g. 3 sq ft and above) are associated with lower mortality, higher ADG, better FCR, and higher feed intake (ADFI). They stay on feed longer, have lower feed cost/lb gain, and lower feed cost/ton. The Average Out Weight of lower density groups is much higher due to both the biological performance improvement as well as the longer days-on-feed. Groups fed higher levels of DDGS as a % of diet have lower feed cost/lb gain, lower mortality, better ADG, worse FCR, and higher feed intake. However, they were also on feed longer (9 more days) so the improvement in ADG and ADFI with a worsening of FCR may be due (at least partially) to the longer days-on-feed, i.e. a growth curve effect rather than a true biological correlation with % DDGS. Keep in mind that the effect on mortality (higher DDGS%, lower mortality) is NOT a growth curve effect or a consequence of longer time on feed. In fact, both this year and last we’ve seen (in general) the longer pigs are on-feed, the higher the mortality. In this case, it’s the opposite which is a meaningful observation. Is feeding DDGS to nursery pigs somewhat protective against mortality? FINISHING PERFORMANCE -- EFFECT OF START WEIGHT, DAYS-ON-FEED, MORTALITY, SQ FT/PIG, AND %DDGS Finishing groups with lighter Average Start Weights suffer a performance penalty: higher mortality, lower ADG, and lower feed intake. Feed conversion, average daily gain, and feed intake are likely due to growth curve effects (although not completely). The higher mortality in lighter start weight groups is NOT a growth curve effect, it is real. The lighter the Average Start Weight the longer a group is on-feed (higher Average DOF). Average Start Weight drives Average Days-on-Feed; that is, the lower the Start Weight the longer the Average Days-on-Feed. The longer groups are on-feed, the higher the Mortality %, the lower the Average Daily Gain, the higher (worse) the Feed Conversion. Feed medication costs per pig are higher in groups that are on-feed longer. Benchmarking Finishing Closeouts by Average Start Weight (Lbs) Average Start Weight (Lbs) 30 - 35 35 - 40 40 - 45 45 - 50 50 - 55 55 - 60 60 - 65 65 - 70 70 - 75 75 - 80 No. Closeouts No. Pigs Start Wt Actual Sqft/Pig Avg Out Wt w/o Dead Wt Sub-Stnd Sales as % of Pigs Out Market Sales as % of Pigs Out Lb Feed Per Hd Mortality as % of Pigs In ADG 420 541,055 32.5 7.0 266.7 1.8% 89.7% 603.3 5.8% 1.79 813 1,133,315 37.5 7.0 270.3 1.8% 90.9% 612.5 5.1% 1.79 922 1,550,158 42.5 7.0 270.8 1.9% 91.8% 617.4 4.8% 1.80 1,088 1,990,930 47.5 7.0 271.1 1.7% 92.8% 621.7 4.5% 1.81 1,258 2,268,355 52.4 7.2 270.2 1.8% 92.8% 615.5 4.5% 1.81 1,154 2,161,191 57.4 7.3 271.7 1.5% 93.3% 613.0 4.1% 1.84 989 1,971,164 62.1 7.3 272.7 1.5% 93.7% 608.8 3.8% 1.86 601 1,209,633 67.2 7.3 272.9 1.8% 93.4% 605.9 3.9% 1.85 300 606,634 72.1 7.3 272.6 1.5% 93.7% 583.7 3.5% 1.87 171 365,751 76.9 7.3 275.1 1.7% 93.7% 587.8 3.5% 1.87 FCR Adjusted FCR (50-250) ADFI Avg Cull Wt Avg DOF Days To First (Top-Out) Sale Feed Cost per Lb Gain Avg Feed Med Costs Per Pig Avg Other Med Costs Per Pig Avg Feed Cost/Ton Avg Corn Cost/Bu Avg DDGS Cost/Ton DDGS % Avg SBM Cost/Ton 2.62 2.50 4.65 218.5 129 113 $0.4142 $1.66 $1.68 $320.82 $6.51 $249.89 19.4% $452.81 2.66 2.60 4.76 216.0 129 113 $0.4266 $1.64 $1.51 $321.36 $6.85 $253.17 19.7% $449.70 2.73 2.63 4.91 217.7 126 111 $0.4276 $1.82 $1.51 $313.69 $6.76 $249.39 20.1% $452.27 2.81 2.67 5.07 215.6 123 106 $0.4339 $1.72 $1.59 $310.78 $6.77 $251.15 20.2% $449.42 2.86 2.68 5.17 214.9 119 103 $0.4406 $1.65 $1.68 $308.93 $6.83 $250.03 19.1% $452.53 2.89 2.67 5.32 216.0 115 100 $0.4430 $1.54 $1.69 $306.57 $6.78 $250.31 19.5% $453.84 2.92 2.69 5.44 210.5 112 98 $0.4485 $1.37 $1.62 $307.55 $6.83 $256.44 18.4% $451.93 2.97 2.65 5.50 214.3 110 96 $0.4478 $1.35 $1.69 $301.63 $6.74 $252.05 19.5% $447.15 2.94 2.60 5.47 208.6 106 92 $0.4378 $1.58 $1.72 $299.73 $6.75 $253.32 18.6% $452.13 3.00 2.65 5.62 214.6 105 91 $0.4389 $1.22 $1.90 $293.88 $6.78 $250.24 23.4% $444.32 London Swine Conference – Production Technologies to Meet Market Demands April 1and April 2, 2015 125 Benchmarking Finishing Closeouts by Average Days-on-Feed Average Days on Feed 90-100 100-110 110-120 120-130 130-140 140-150 No. Closeouts No. Pigs Start Wt Actual Sqft/Pig Avg Out Wt w/o Dead Wt Sub-Stnd Sales as % of Pigs Out Market Sales as % of Pigs Out Lb Feed Per Hd Mortality as % of Pigs In ADG FCR Adjusted FCR (50-250) ADFI 357 690,295 70.0 7.1 266.2 1.8% 93.3% 549.6 3.1% 2.00 2.85 2.59 5.62 1,601 3,212,375 62.1 7.3 269.9 1.6% 93.8% 589.6 3.5% 1.94 2.87 2.67 5.54 2,235 3,992,410 54.7 7.2 270.7 1.8% 93.1% 604.0 4.1% 1.85 2.83 2.64 5.23 2,344 3,916,845 48.0 7.1 271.9 1.6% 92.2% 619.9 4.6% 1.77 2.80 2.64 4.97 1,122 1,879,600 42.5 7.0 273.6 1.7% 91.2% 642.6 5.8% 1.70 2.83 2.68 4.81 238 437,056 39.9 7.2 273.6 1.6% 89.5% 674.6 7.0% 1.60 2.92 2.69 4.72 Avg Cull Wt Avg DOF Days To First (Top-Out) Sale Feed Cost per Lb Gain Avg Feed Med Costs Per Pig Avg Other Med Costs Per Pig Avg Feed Cost/Ton Avg Corn Cost/Bu Avg DDGS Cost/Ton DDGS % Avg SBM Cost/Ton 202.8 97 85 $0.4290 $1.74 $1.53 $302.73 $6.88 $256.00 17.5% $453.58 208.3 106 92 $0.4400 $1.53 $1.80 $307.62 $6.94 $260.72 16.7% $449.34 214.7 115 101 $0.4346 $1.50 $1.72 $308.49 $6.79 $251.70 19.0% $450.44 216.8 125 110 $0.4341 $1.66 $1.61 $311.40 $6.70 $247.25 20.5% $452.41 225.9 134 116 $0.4438 $1.78 $1.48 $314.69 $6.78 $253.36 21.0% $450.79 220.8 144 118 $0.4500 $1.98 $1.20 $309.07 $6.78 $243.89 19.5% $455.10 Benchmarking Finishing Closeouts by Mortality % Average Mortality % <1% No. Closeouts No. Pigs Start Wt Actual Sqft/Pig Avg Out Wt w/o Dead Wt Sub-Stnd Sales as % of Pigs Out Market Sales as % of Pigs Out Lb Feed Per Hd Mortality as % of Pigs In ADG FCR Adjusted FCR (50-250) ADFI Avg Cull Wt Avg DOF Days To First (Top-Out) Sale Feed Cost per Lb Gain Avg Feed Med Costs Per Pig Avg Other Med Costs Per Pig Avg Feed Cost/Ton Avg Corn Cost/Bu Avg DDGS Cost/Ton DDGS % Avg SBM Cost/Ton 126 144 184,461 53.6 7.2 270.3 1.3% 96.8% 585.4 0.7% 1.92 2.73 2.48 5.19 220.1 113 100 $0.4102 $1.45 $1.35 $306.89 $6.67 $255.99 18.7% $454.27 1 - 2% 2 - 3% 3 - 4% 982 1,542 1,541 1,786,750 2,912,996 2,904,731 55.0 55.4 54.9 7.2 7.2 7.1 273.1 273.0 271.3 1.6% 1.3% 1.6% 95.9% 95.1% 93.6% 600.1 602.6 602.8 1.6% 2.5% 3.5% 1.91 1.87 1.84 2.78 2.79 2.82 2.60 2.62 2.62 5.29 5.23 5.16 221.3 216.8 216.2 114 116 117 100 101 102 $0.4181 $0.4286 $0.4357 $1.51 $1.65 $1.75 $1.42 $1.44 $1.50 $303.89 $308.24 $310.44 $6.60 $6.71 $6.76 $247.18 $250.64 $252.09 20.8% 20.4% 19.0% $451.83 $452.16 $449.39 4 - 5% 5 - 6% 1,214 923 2,239,549 1,613,930 53.2 51.0 7.1 7.1 271.0 270.5 1.7% 1.7% 92.4% 91.1% 611.3 617.5 4.5% 5.5% 1.82 1.79 2.84 2.85 2.67 2.69 5.15 5.11 213.4 211.1 119 121 103 105 $0.4396 $0.4437 $1.73 $1.80 $1.65 $1.87 $310.49 $311.65 $6.83 $6.85 $251.25 $251.84 19.4% 19.0% $451.23 $452.54 6 - 7% 7 - 8% 8 - 9% 9 - 10% > 10% 574 953,400 50.3 7.1 269.9 2.0% 89.7% 621.2 6.4% 1.76 2.88 2.66 5.10 214.4 123 106 $0.4508 $1.63 $1.95 $312.60 $6.91 $253.92 19.7% $450.23 387 590,154 48.0 7.2 268.9 1.8% 88.8% 628.0 7.5% 1.73 2.89 2.72 5.02 215.6 126 108 $0.4503 $1.49 $1.95 $312.53 $6.91 $252.85 18.4% $452.16 236 413,610 46.5 7.2 268.7 2.4% 87.2% 634.1 8.4% 1.71 2.93 2.74 5.00 211.7 127 109 $0.4592 $1.53 $2.13 $314.19 $6.96 $253.53 19.7% $449.86 144 233,625 47.6 7.1 266.9 2.9% 85.9% 628.0 9.4% 1.72 2.94 2.68 5.04 210.2 125 107 $0.4567 $1.40 $1.90 $311.71 $6.94 $254.20 18.9% $452.70 316 486,939 44.7 7.2 265.9 3.3% 83.2% 643.5 13.1% 1.65 2.97 2.68 4.96 201.7 130 110 $0.4649 $0.98 $2.48 $312.35 $6.85 $251.89 19.4% $452.15 London Swine Conference – Production Technologies to Meet Market Demands April 1and April 2, 2015 Benchmarking Finishing Closeouts by Sq Ft/Pig Sq Ft / Pig No. Closeouts No. Pigs Start Wt Actual Sqft/Pig Avg Out Wt w/o Dead Wt Sub-Stnd Sales as % of Pigs Out Market Sales as % of Pigs Out Lb Feed Per Hd Mortality as % of Pigs In ADG FCR Adjusted FCR (50-250) ADFI Avg Cull Wt Avg DOF Days To First (Top-Out) Sale Feed Cost per Lb Gain Avg Feed Med Costs Per Pig Avg Other Med Costs Per Pig Avg Feed Cost/Ton Avg Corn Cost/Bu Avg DDGS Cost/Ton DDGS % Avg SBM Cost/Ton 6.6-6.8 6.9-7.0 7.0-7.2 7.2-7.4 7.4-7.6 7.6-7.8 7.8-8.0 354 449,826 46.2 6.7 272.0 1.1% 93.8% 582.9 374 490,421 45.8 6.9 273.3 0.8% 94.7% 581.4 376 722,249 55.0 7.1 271.7 2.2% 94.2% 606.0 487 1,042,378 57.9 7.3 272.3 1.9% 93.6% 614.5 371 751,287 56.8 7.5 274.2 1.2% 94.2% 611.6 157 344,206 54.8 7.7 275.0 1.1% 94.8% 618.0 101 194,370 55.4 7.9 275.1 1.3% 94.4% 623.0 3.9% 3.4% 3.1% 4.0% 4.1% 3.7% 3.2% 1.85 2.61 2.52 4.84 236.4 121 104 $0.4269 $2.34 $1.09 $327.20 $6.76 $255.06 16.5% $441.04 1.84 2.58 2.49 4.73 245.9 123 107 $0.4185 $2.42 $1.23 $325.65 $6.53 $254.09 18.4% $445.61 1.90 2.82 2.65 5.37 222.0 114 99 $0.4346 $1.58 $1.18 $308.95 $6.77 $258.14 16.1% $466.43 1.89 2.90 2.65 5.48 218.4 112 98 $0.4354 $1.44 $1.28 $301.16 $6.79 $254.41 17.5% $451.62 1.90 2.84 2.63 5.39 223.6 113 99 $0.4308 $1.38 $1.15 $304.61 $6.80 $250.27 18.8% $441.82 1.88 2.83 2.65 5.32 216.8 116 99 $0.4434 $1.39 $1.79 $313.12 $6.92 $250.44 20.6% $444.55 1.92 2.87 2.72 5.49 210.0 114 100 $0.4429 $1.54 $1.25 $308.79 $6.83 $248.70 21.6% $450.33 Benchmarking Finishing Closeouts by % DDGS in Diet % DDGS in Diet No. Closeouts No. Pigs Start Wt Actual Sqft/Pig Avg Out Wt w/o Dead Wt Sub-Stnd Sales as % of Pigs Out Market Sales as % of Pigs Out Lb Feed Per Hd Mortality as % of Pigs In ADG FCR Adjusted FCR (50-250) ADFI Avg Cull Wt Avg DOF Days To First (Top-Out) Sale Feed Cost per Lb Gain Avg Feed Med Costs Per Pig Avg Other Med Costs Per Pig Avg Feed Cost/Ton Avg Corn Cost/Bu Avg DDGS Cost/Ton DDGS % Avg SBM Cost/Ton < 5% 5 - 10% 149 197,086 56.9 7.2 269.6 1.9% 93.8% 617.7 3.5% 1.82 2.94 2.72 5.35 217.8 115 97 $0.4700 $1.01 $1.22 $322.19 $6.94 $268.34 2.5% $451.41 215 233,541 54.3 7.0 272.6 1.2% 92.7% 622.1 5.0% 1.80 2.89 2.69 5.21 222.4 119 99 $0.4718 $2.08 $1.22 $327.88 $7.12 $258.59 7.3% $454.19 10 - 15% 15 - 20% 20 - 25% 25 - 30% 355 536,595 51.1 7.1 273.0 1.4% 92.8% 626.1 4.9% 1.82 2.87 2.70 5.20 213.5 121 104 $0.4493 $1.87 $1.73 $315.70 $6.78 $255.51 12.9% $448.91 1,292 1,925,331 48.3 6.9 271.8 1.1% 93.8% 591.9 4.2% 1.81 2.68 2.56 4.85 230.5 123 105 $0.4322 $1.78 $1.69 $323.55 $6.69 $252.35 17.9% $445.61 824 1,349,395 52.9 7.3 271.6 1.7% 92.9% 614.7 4.3% 1.80 2.84 2.70 5.12 212.2 120 104 $0.4354 $1.57 $1.84 $306.17 $6.68 $249.60 22.3% $456.30 389 573,533 49.7 7.0 274.2 1.0% 93.0% 637.4 4.7% 1.78 2.87 2.72 5.10 220.5 125 107 $0.4460 $1.83 $1.47 $311.28 $6.80 $245.32 27.3% $452.90 London Swine Conference – Production Technologies to Meet Market Demands April 1and April 2, 2015 > 30% 318 664,143 53.8 7.3 276.9 1.2% 93.8% 658.4 3.9% 1.78 3.00 2.77 5.30 216.7 125 109 $0.4357 $1.67 $1.18 $290.00 $6.59 $237.89 34.4% $438.84 127 Finishing groups with higher levels of mortality tend to have lighter start weights, much lower % of sales as market hogs, much higher % of sales as sub-standard (lightweight) hogs, higher (worse) feed conversion, lower feed intake (ADFI), much higher feed cost/lb gain, and higher medication costs. As a consequence of higher mortality and its associated effects, the higher mortality groups are on-feed longer. Looking at density in finishing groups (sq ft/pig), you can see there’s less of an effect on performance when compared with the nursery phase. Higher density groups tended to have a higher start weight and that drives some of the changes in daily gain, feed intake and feed conversion. Higher density groups have higher (worse) feed conversion, higher feed cost/lb gain, and higher dietary DDGS%. Interestingly, they have lower feed medication costs. No big effects are associated with a wide variation in dietary DDGS%. Groups with a higher DDGS% were on-feed longer (higher Average Days-on-Feed), had slightly lower average daily gain, higher (worse) feed conversion, and lower feed cost/lb gain. No surprises here, these effects are what you’d expect with increasing DDGS%. WEAN-TO-FINISH PERFORMANCE -- EFFECT OF START WEIGHT, DAYS-ON-FEED AND MORTALITY. There is a performance penalty associated with the 10-11 lb. Average Start Weight category but relatively less than in nursery groups. Groups with lower start weights tend to stay on-feed longer, have more sub-standard (lightweight) pig sales and fewer market hog sales as a % of all sales, lower feed cost/lb gain, and higher medication costs per pig. There are definite effects of Days-on-Feed on wean-to-finish performance, and you can read the data as saying longer days-on-feed are a consequence of the associated biological performance. Groups with more days-on-feed have higher mortality, much lower average daily gain, higher (worse) feed conversion, and lower feed intake (ADFI). It’s counter-intuitive but groups with higher days-on-feed also have lower feed medication costs. It appears that in wean-to-finish groups, producers have more ability to use time to their advantage, i.e. allow slower-growing groups to remain on-feed until the group reaches a realistic target market weight. In contrast to finishing groups, the Average Start Weight in wean-to-finish groups is not the biggest driver of DOF. Instead, it’s more about lower feed intake and lower ADG. Wean-to-finish groups with higher mortality levels have much lower out weights even though they are on-feed much longer (more Average Days-on-Feed). They sell a higher percent of sales as substandard (lightweight) pigs and a much lower percent as market hogs. They have the ‘highmortality’ cluster of biological effects: lower average daily gain, higher (worse) feed conversion, lower feed intake, higher feed cost/lb gain, and higher medication costs. REFERENCES Goodband RD, MD Tokach, SS Dritz, JM DeRouchey, and JL Nelssen. Feeding and feeder management influences on feed efficiency. In Proceedings, Leman Swine Conference Nutrition Workshop: Focus on Feed Efficiency, pp 20-27, 2008. Stein TE. Benchmarking – The importance of knowing your farm financially and productively. In Proceedings, Manitoba Swine Seminar, pp 47-55, 2014. 128 London Swine Conference – Production Technologies to Meet Market Demands April 1and April 2, 2015 Benchmarking Wean-to-Finish Closeouts by Average Start Weight Average Start Weight (Lbs) No. Closeouts No. Pigs Start Wt Actual Sqft/Pig Avg Out Wt w/o Dead Wt Sub-Stnd Sales as % of Pigs Out Market Sales as % of Pigs Out Lb Feed Per Hd Mortality as % of Pigs In ADG FCR ADFI Avg Cull Wt Avg DOF 11-12 lb 12-13 lb 13-14 lb 14-15 lb 15-16 lb >= 16 168 412,903 11.6 7.4 267.9 2.2% 89.4% 665.9 7.8% 1.53 2.61 4.00 212.3 167 546 1,235,843 12.5 6.9 270.8 1.8% 91.2% 660.7 6.2% 1.57 2.58 4.05 214.6 164 585 1,114,584 13.4 7.1 270.4 1.8% 90.8% 661.9 6.6% 1.59 2.59 4.11 209.9 162 306 563,999 14.4 7.0 271.3 1.8% 91.3% 666.8 5.7% 1.61 2.61 4.18 216.4 160 171 311,067 15.4 7.0 274.5 1.9% 91.9% 683.9 5.4% 1.60 2.66 4.26 207.9 162 93 185,234 16.9 7.2 272.1 0.9% 91.7% 676.2 6.6% 1.58 2.67 4.23 208.5 161 Days To First (Top-Out) Sale 154 150 149 147 148 148 Feed Cost per Lb Gain Avg Feed Med Costs Per Pig Avg Other Med Costs Per Pig Avg Feed Cost/Ton Avg Corn Cost/Bu Avg DDGS Cost/Ton DDGS % Avg SBM Cost/Ton $0.4167 $1.69 $3.79 $319.62 $6.66 $255.05 2.5% $445.58 $0.4132 $1.68 $2.85 $323.24 $6.68 $249.99 2.3% $450.68 $0.4198 $2.17 $2.99 $326.53 $6.58 $254.34 2.3% $454.10 $0.4211 $2.24 $2.67 $325.50 $6.45 $252.03 2.7% $459.75 $0.4331 $2.22 $2.38 $327.92 $6.30 $254.54 2.5% $460.00 $0.4315 $1.68 $2.17 $323.82 $6.73 $256.50 2.7% $447.75 Benchmarking Wean-to-Finish Closeouts by Average Days-on-Feed Average Days on Feed 140-150 150-160 160-170 170-180 >= 180 No. Closeouts No. Pigs Start Wt Actual Sqft/Pig Avg Out Wt w/o Dead Wt Sub-Stnd Sales as % of Pigs Out Market Sales as % of Pigs Out Lb Feed Per Hd Mortality as % of Pigs In ADG FCR ADFI Avg Cull Wt 166 280,457 13.7 6.8 265.4 2.2% 92.1% 622.0 4.5% 1.71 2.48 4.23 229.4 569 1,056,722 13.6 7.1 269.0 2.1% 91.8% 652.9 5.3% 1.64 2.57 4.20 208.6 667 1,403,565 13.4 7.1 272.2 1.7% 91.2% 672.6 6.6% 1.56 2.61 4.10 209.9 340 794,883 13.2 7.2 276.2 1.6% 90.1% 693.8 7.7% 1.50 2.67 4.01 212.3 110 282,507 13.0 7.1 273.8 1.3% 88.5% 698.3 8.9% 1.40 2.73 3.85 217.6 Avg DOF Days To First (Top-Out) Sale Feed Cost per Lb Gain Avg Feed Med Costs Per Pig Avg Other Med Costs Per Pig Avg Feed Cost/Ton Avg Corn Cost/Bu Avg DDGS Cost/Ton DDGS % Avg SBM Cost/Ton 147 139 $0.4132 $2.39 $2.84 $334.35 $6.72 $257.37 2.1% $462.73 155 143 $0.4206 $2.28 $2.67 $328.81 $6.64 $253.03 2.5% $449.02 165 150 $0.4196 $1.81 $2.90 $323.40 $6.46 $252.20 2.3% $454.64 174 158 $0.4187 $1.61 $3.08 $317.77 $6.57 $256.12 2.5% $455.30 185 167 $0.4298 $1.56 $2.94 $317.20 $6.71 $243.56 2.7% $445.27 London Swine Conference – Production Technologies to Meet Market Demands April 1and April 2, 2015 129 Benchmarking Wean-to-Finish Closeouts by Mortality % Average Mortality % 130 < 3% 3-5% 5-7% 7-9% 9-11% 11-13% > 13% No. Closeouts No. Pigs Start Wt Actual Sqft/Pig Avg Out Wt w/o Dead Wt Sub-Stnd Sales as % of Pigs Out Market Sales as % of Pigs Out Lb Feed Per Hd Mortality as % of Pigs In ADG FCR 300 603,770 13.6 7.1 274.3 1.8% 95.1% 661.3 2.2% 1.67 2.54 559 1,094,989 13.5 7.1 271.9 1.8% 93.3% 660.2 4.0% 1.62 2.57 423 888,072 13.4 7.0 271.6 1.7% 91.1% 672.9 5.9% 1.56 2.62 262 548,201 13.5 6.9 269.2 1.9% 88.9% 671.4 7.9% 1.53 2.64 155 328,229 13.3 6.7 268.4 1.8% 87.1% 665.5 9.8% 1.53 2.65 76 149,616 13.5 7.0 267.4 1.7% 84.7% 668.2 11.8% 1.51 2.66 114 250,209 13.0 7.0 263.8 2.1% 80.6% 658.7 18.0% 1.48 2.67 ADFI Avg Cull Wt Avg DOF Days To First (Top-Out) Sale Feed Cost per Lb Gain Avg Feed Med Costs Per Pig Avg Other Med Costs Per Pig Avg Feed Cost/Ton Avg Corn Cost/Bu Avg DDGS Cost/Ton DDGS % Avg SBM Cost/Ton 4.24 221.3 156 143 $0.4124 $2.17 $2.24 $325.28 $6.60 $251.71 2.3% $461.47 4.15 213.1 159 147 $0.4189 $2.22 $2.79 $328.00 $6.60 $251.49 2.4% $452.57 4.09 211.3 165 151 $0.4200 $1.80 $3.15 $323.34 $6.54 $254.84 2.4% $453.13 4.05 206.4 167 153 $0.4234 $1.61 $3.12 $324.04 $6.54 $252.85 2.5% $450.98 4.04 208.0 166 153 $0.4236 $1.88 $3.27 $321.18 $6.54 $253.78 2.7% $449.83 4.01 201.6 167 154 $0.4199 $1.74 $3.62 $319.93 $6.58 $251.92 2.3% $448.89 3.97 211.5 168 155 $0.4307 $1.96 $3.09 $324.41 $6.71 $258.37 2.7% $453.13 London Swine Conference – Production Technologies to Meet Market Demands April 1and April 2, 2015 MAKING WEAN TO FINISH WORK Mike Brumm Brumm Swine Consultancy Inc. PO Box 2242, North Mankato, MN 56002 E-mail: [email protected] ABSTRACT Wean-to-finish facilities have proven to be very popular with Midwestern US producers. A reasonable estimate is that at least 40% of all pigs weaned in the US are weaned into wean-finish facilities. The popularity is driven by less lender risk versus financing a ‘nursery moved to finisher’ set of facilities, less pig movement, less cleaning of facilities and more flexibility in the timing of pig movement if the pigs are stocked at anything more than single stock (generally 7.2 ft2 (0.67 m2)/pig). Making it work means aggressive use of zone heating for three seasons of the year, careful selection of feeders and drinkers to accommodate both newly weaned pigs and slaughter weight pigs and attention to ventilation details. The labour challenge is that a producer or contract grower starts pigs in facilities once every six months in WTF facilities versus every seven to eight weeks in a swine nursery meaning their skill level in dealing with fallout pigs, scours, respiratory challenges, etc. may not be as sharp, especially if pig arrival coincides with planting or harvest activities. If a portion of the pigs are removed at 6-10 weeks post wean due to overstocking, record keeping for the pig flow can be challenging since weights are not recorded for the pigs remaining and often not recorded on the pigs relocated. If the pigs are split into multiple facilities the record challenges are compounded making identification of management weak-links much more challenging. MAKING IT WORK Wet and chilled pigs are the biggest wean-finish management challenge that I commonly see. Unlike weaned pigs in a nursery setting, pigs are now housed in a facility where the ventilation system must be capable of not only a winter minimum of 2 cfm/pig but also the summer maximum for heat relief (100+ cfm/pig) if the facility is fully mechanically ventilated. Most grow-finish facilities are designed for a minimum ventilation rate of 4 to 5 cfm per pig. If the wean-finish facility is single stocked, this is 2x the minimum requirement. Unless the ventilation system is modified this results in excessive heating expense for the facility. Getting ventilation inlet velocity correct is critical to both air quality and dry floors in wean-finish management. Wet floors often occur when the inlet velocity is not maintained and air ‘drops’ from the ceiling inlet into the manure pit. Much of the pen ends up with ‘stale’ air and pens remain wet from the lack of air movement over the floor surface. The simple solution often used is to increase the minimum ventilation rate, rather than correcting the inlet velocity problem. London Swine Conference – Production Technologies to Meet Market Demands April 1and April 2, 2015 131 In addition, pigs are housed on concrete floors that may be either partial or fully slatted. Typical concrete slats in US facilities have a 5” top with a 1” slot. Pigs don’t target the direction of their urination or defecation so much of the material ends up on the top of the slat. The newly weaned pigs easily slip into the 1” slot so they quickly learn to only walk on the solid portion of the slat, meaning they track manure about the pen, rather than working the manure through the slot in the slat. This is why nurseries have gone to fully slatted floors using plastic materials, woven wire or tri-bar with a much higher percentage of open area and smaller ‘tops’ that don’t easily accumulate fecal material. While a few systems in the US practice wean-finish with no supplemental heat or floor mats, the vast majority use either heat lamps or propane fired brooders to create comfort zones for the weaned pigs. In fully slatted facilities they use either rubber mats or disposable mats (often ¼” Masonite board) in the comfort zone to isolate the pig from the cold concrete slats and to provide a surface to sprinkle feed 2 times per day to entice pigs to eat dry feed. One production system that utilizes large pens has a 4’ x 10’ solid concrete area in the pen that they hang the propane brooder above for the solid, heated surface sleeping area. When zone heating is used, producers often don’t adjust their set points for room temperature. While the goal of radiant zone heating is a mat surface temperature of 90-94F at weaning, producers often don’t lower the room set point in the ventilation controller. This results in pigs either ignoring the desired sleeping area due to excessive heat or sleeping in a pattern that results in a very large donut hole around the core of the radiant heat zone. The recommendation is to heat the animal room to 75-78F so the pigs effectively utilize the radiant heat zone. Done correctly, pigs sleeping on the solid surface form a 1-1.5 pig ‘pile’ in the center of the radiant zone. A vast majority of the propane brooders that are used for zone heat are connected to 2stage regulators resulting in hi/lo radiant heat output from the brooders. Increasingly these regulators are being connected to the ventilation controller to limit the ventilation system from increasing heat removal until the brooder is on low output. In older facilities with manually adjusted hi/lo valves not connected to the ventilation controller, the controller settings need to be modified to minimize excessive heat loss from the ventilation system. In this situation the room set point should be set at approximately the same setting as the set point for the hi/lo brooder, assuming the ventilation system begins to increase speed or add a fan when the temperature is above this set point. The furnace OFF temperature should be set to the desired room temperature so heat is not added to the room when conditions are above this temperature. Thus the controller set point is often 88-90F while the furnace OFF setting is 78F. This prevents the ventilation system from ramping up until the brooders are on the low output setting. Sleeping zone and room temperature management is more difficult to manage with heat lamps since the economics of automated heat lamp controls don’t work very well for a system that is only used 2x per year. If heat lamps are utilized the electric supply to the service panel for the room and the supply lines to the room may need to be upgraded for the increased demand. 132 London Swine Conference – Production Technologies to Meet Market Demands April 1and April 2, 2015 Getting the correct feeders and drinkers for pigs at weaning is an additional challenge, especially when adapting wean-finish in existing grow-finish facilities. If wet-dry feeders are currently being used in grow-finish, additional drinkers for weaned pigs must be added to pens. The water to the feeder is typically turned off for 3 weeks when wet-dry feeders are used for wean-finish because of the difficulties with the weaned pig learning how to manipulate the drinker in the feeder, highly fermentable feed ingredients staying the in the wet feed trough too long and becoming moldy, excessive wet feed having to cleaned from the feeder frequently, etc. If the facility currently has dry feeders, do the partitions between the feeder holes need to be modified to prevent weaned pigs from becoming caught in the feed trough? Estimates of feeder sizing for wean-finish are limited in the literature. Some producers add feeder spaces at weaning when pens are double stocked while others feel they are successful with existing grow-finish feeder capacity. When feeders are added, some have utilized nursery feeders that have a drop-tube added to the feed line while others use removable pans of some type that are hand filled from the feeders in the pen. Many now use gruel feeding to provide additional feeder space at weaning. These small, round plastic feeders lock into the concrete slatted floor and typically service 8-12 pigs/feeder. At weaning a limited amount of dry feeder is placed in the feeder 2-4x daily and the feeder is then filled with water making a wet feed for pigs to investigate and consume within 30-45 minutes. By 7 days after weaning no water is added as the pigs make the transition from wet to dry feed intake. In many cases only 1 feeder is added per pen of 50-60 double-stocked pigs but the experience is fewer fall-out pigs when the feeders are used in this manner. When wet/dry and dry feeders are sized correctly for grow-finish pigs (at least 14” wide feeder hole), 3 pigs are commonly observed in an eating space during the first week after weaning. In many cases it actually appears that pigs are adopting a posture similar to their suckling posture. As long as the feeder lip height is 4-5” from the pen floor this posture does not appear abnormal or to be limiting feed intake. By the time pigs are approximately 55 lb, there is room for only 1 pig per eating space. If bowl drinkers are utilized, the front lip of the drinker should be 4” from the floor so weaned pigs can easily access the drinker. Water pressure should be 20 psi so the drinker valve is relatively easy for the pigs to manipulate. An increasing number of wean-finish production systems are adding some type of nipple drinker to the pens for the first 2-3 weeks post weaning. Often these are either water ‘bars’ that have 4 to 8 nipple drinkers or swing drinkers located in the dunging area of the pen. The thought process is that pigs that are still looking to access nutrients via ‘sucking’ behavior have this need met in terms of water at least. There is limited production system data that suggests fewer fall-out pigs when at least 1 nipple drinker is provided in a pen at weaning. Once the pigs are weaned 2-3 weeks these drinkers are turned off and hung on the ceiling until the next weaned pigs arrive with the pigs drinking from devices that have less water wastage such as wet/dry feeders or bowls. London Swine Conference – Production Technologies to Meet Market Demands April 1and April 2, 2015 133 Getting gating correct is important for wean-finish. Most facilities in the US use horizontal rod gating between pens. In older facilities converted to wean-finish the gating is most often replaced to get the gaps between rods correct. In general there should be no opening in gating or gate connections to posts, feeders, etc. greater than 2” at any location lower than 12” to the pen floor. Openings larger than this result in weaned pigs becoming trapped in the gating as they poke their heads through openings looking for their mothers during the first days after weaning. Stocking density at weaning has been the subject of much discussion and research. Many production systems double-stock pens at weaning. In general this is the more economical method of making wean-finish work since there are more pigs per space, resulting in a lower cost of gain and as described above, a better fit to grow-finish ventilation sizing. Another advantage of double-stocking wean-finish versus swine nurseries is the flexibility when it comes time to move pigs to grow-finish facilities. With nurseries, pig movements are dictated by the next wean event destined for the nursery. This results in limited flexibility in movement dates. On the other hand, with double-stocked wean-finish facilities, there is quite a bit of flexibility in when 50% of the pigs must be removed. The timing of the removal is often dictated by when the subsequent grow-finish facility is available, rather than by the next weaning event. The downside of double-stocking is the mix of facilities required to make it function. The double stocked wean-finish facility is utilized by a group of pigs for approximately 6 months, while the grow-finish facility the excess pigs are removed to is utilized 4.5 months per turn. Keeping facilities paired up can become a problem for smaller production systems that try and utilize double-stock management. Production records (daily gain and feed conversion) can be much harder to attain when double-stock is utilized. While pig weights can be captured for the pigs relocated to growfinish facilities at the time of sort-down from double-stock, pig weights and feed remaining at the wean-finish site are most often only estimated. Records on the overall group are available at slaughter but they often don’t make sense depending on when the sort-down occurred and what percent of the pigs weaned are actually removed at sort-down and if some pigs were removed to another location and co-mingled with pigs from other flows. Some production systems actually weigh a subset of pigs remaining at the wean-finish facility to get a closer estimate of pig weight and capture feed weights with load cells on feed bins. They then report all performance as nursery and grow-finish data sets. A big concern for wean-finish with contract growers is the skill level required to start weaned pigs. With wean-finish, growers use their pig starting skills only 2x per year while growers with nurseries utilize this skill every 6-8 weeks. This skill level can become really challenging if newly weaned pigs are placed in facilities at times of the year when contract growers are trying to plant or harvest field crops. 134 London Swine Conference – Production Technologies to Meet Market Demands April 1and April 2, 2015 LIQUID FEEDING: DON’T LET MICROORGANISMS CONTROL YOUR PROFIT Evelien van Donselaar Selko Feed additives, Jellinghausstraat 24, 5048AZ Tilburg, Netherlands E-mail: [email protected] To optimize feed utilization, good hygiene practices are of high importance. Organic acids are an ecologically wide-ranging solution for feed preservation. The usage is safe for humans and animals, and above all it results in more efficient use of resources. INTRODUCTION Livestock producers have a challenging business dealing with an increasing pressure on the feed market and a growing concern for sustainable production. The supplies are scarce and the global population is expected to increase from seven billion today to nine billion in 2050, of which three billion people will reach the middle class. Consequently more people will be able to purchase, and demand high quality nutrition such as animal proteins. In contrast there are still over 1 billion people suffering from malnutrition. The livestock industry has a shared responsibility to use sustainable and affordable nutritional solutions, aiming to produce enough animal proteins to satisfy increasing demands. An interesting opportunity is to increase the efficiency of the feed to food cycle. Yearly, one third of all food production is left unused because of losses in production and waste. (FAO, 2001) Globally this is more than one billion tonnes of food spoiled each year. Inedible or unmarketable products can be converted into animal feeds, reducing nutrient spoilage. The effectiveness of using organic acids for the preservation of animal feeds and co-products continually becomes better researched and validated for this purpose. Protection against spoilage due to microbiological contamination has shown to be essential to increase the sustainable use of liquid feed ingredients. HARMFUL MICROORGANISMS Almost all raw materials have a natural flora, consisting of desirable lactic acid bacteria. Many also have an undesired microflora (Coliforms, Salmonellas, Yeasts and Moulds). Generally, the dominant microflora that develops in liquid feed is lactic acid bacteria (LAB). However this depends on the overall feed hygiene as well as operating temperatures and particularly the feed ingredients used (e.g. by-products from brewing and ethanol production), in which yeasts will dominate. LAB fermentation is beneficial as it produces organic acids, primarily lactic acid, which in dry diets has beneficial effects on the feed intake, daily gain and FCR of piglets (Table 1). It seems likely that it also has similar effects in liquid feeding systems. (Brooks et al., 2001) Table 1: Effect of lactic acid percentage in diets on the performance of pigs (% increase over negative control) (Roth et al., 1993). Lactic acid % 0.8 1.6 2.4 Daily gain Feed intake FCR + 4.7 + 8.1 + 7.3 + 6.1 + 6.1 + 5.4 +1.2 -1.8 -1.8 London Swine Conference – Production Technologies to Meet Market Demands April 1and April 2, 2015 135 Yeast fermentation is not desirable. Yeasts are facultative anaerobes; as a result they are capable of proliferating in liquid feed materials. Growing yeasts are not desired because they consume sugars and essential amino acids such as lysine, quickly bringing down the nutrient values. The dry matter content decreases and the water, pH level and CO2 content of the feed increases (Canibe et al., 2009). The degradation of the feed due to yeasts lowers the palatability, decreasing feed intake and the animal’s performance. Moulds are organisms which mainly grow under aerobic conditions on the surface of feed materials or compound feed in the presence of moisture. They prefer starch rich materials like grains and grain co-products. Once moulds are visible the contamination level exceeds 1.000.000 cfu/ per gram, and if the typical muddy fragrance can be recognized the level may be in the range of 500.000 cfu per gram. Under stressful conditions like very wet seasons, moulds will produce naturally occurring toxic substances called mycotoxins. Both moulds and yeasts are not pH sensitive and can proliferate from a pH of 1.5 up to pH 9. Enterobacteriaceae represents a large family of bacteria including among others Salmonella and Escherichia coli. Under suboptimal conditions they may lead to infections resulting into severe diarrhea and rapid spread via the manure to other animals. Since Enterobacteriaceae are sensitive to low pH levels they can easily be controlled in liquid feed. PRESERVATION STARTS WITH RAW MATERIALS There are a number of liquid by-products produced in the food and biofuels industries that are well suited and economical as a raw material source in swine liquid feeding systems. However, some of the challenges of using liquid by-products involve variability in nutrient content, consistency of supply, and close proximity of by-product production to swine farms in order to minimize transportation cost. Braun and de Lange (2004) described and summarized some of the common by-products used in liquid feeding systems. These include those from milk processing (sweet whey, acid whey, butter milk), bakery waste (bread, cookies, crackers, and miscellaneous confectionaries), candy (sugar syrup), brewer’s wet yeast (by-product of beer manufacturing), and liquid by-products from ethanol production (corn condensed distiller’s solubles and corn steep water). To preserve co-products natural acidic fermentation should be stimulated (Shurson, 2010). This causes the pH to lower and limits the growth of microorganisms. Nevertheless, a successful fermentation process depends on environmental influences such as hygiene, atmosphere, temperature and content of the feed (McDonald et al., 1991). Strong microbial development in a co-product makes it difficult to predict the quality and nutrient content. Brewer’s yeast tends to contain high levels of live yeast due the production technology used in the beer production process. The yeast reduces the dry matter content, additionally essential amino acids like lysine can be affected by degradation (Table 2). Safeguarding this raw material via using a synergistic blend of organic acids (Selko-LF) delivers a solution to extend the shelf life while maintaining nutritional value. Negative effects from yeasts on the animals are limited when keeping a maximum yeast count rule of 100.000 CFU/gr (colony forming units) in single co-products. Maintaining a co-product based liquid feed below this level can be challenging as indicated in Figure 1. This overview summarizes yeast analysis performed on 1240 single co-products samples in 2013. Co-products derived from the dairy industry are particularly often found with high 136 London Swine Conference – Production Technologies to Meet Market Demands April 1and April 2, 2015 levels of yeast. Generally 39.4 % samples exceeded the recommended level of ≤100.000 cfu/gram. This clearly indicates that prevention of yeast contamination is highly desirable. Table 2. Preservation of brewer's yeast using a synergistic blend of organic acids (SelkoLF) maintains dry matter and essential amino acid levels. Day 1 Day 14 Analysis Untreated 0.2% Selko-LF Untreated 0.2% Selko-LF Yeasts (CFU/ ml) 250.000.000 75.000 <100 <100 Dry Matter (%) 17,0% 17,0% 11,8% 15,4% Lysine in Dry Matter (%) 3,2% 3,2% 1,1% 3,5% Figure 1. The microbial analysis of yeast contamination in 1240 samples of various co-products.(Selko Laboratory 2013). IMPORTANCE OF MICROBIAL CONTROL IN LIQUID FEED SYSTEMS Liquid feeding alters both the physical-chemical properties of the diet and its microbiology. Both of these factors are important in terms of pig health and performance. Not all producers have access to liquid co-products. However, a similar benefit can be obtained even when traditional dry diets are fed in liquid form. Lactobacillus spp., which occurs naturally on cereal grains, proliferates in wet feed and reduces the pH. Adding water to the meal produces a pH of 5.8, while soaking the mixture for 24 h results in a multiplication of Lactobacilli which produce lactic acid and reduce the pH to 4.1. As this refers to a wild fermentation it is of key importance that the desired Lactobacilli starts to proliferate and not the yeasts (Brooks, 2001). Therefore in this process hygiene measurements are of key importance. Currently, in Ontario about 20% of market pigs (~1 million/year) are raised on liquid feeding systems. Based on the benefits of liquid feeding over dry feeding, the number of pigs raised on liquid feeding systems in Ontario is expected to increase rapidly over the next few years. Furthermore, the use of liquid co-products derived from the food industry is likely to increase liquid feeding and may include feed fermentation technology (SLFA). London Swine Conference – Production Technologies to Meet Market Demands April 1and April 2, 2015 137 Various studies indicate that liquid feeding: • Can improve nutrient utilizations • Reduces environmental impact • Improves animal performance • Enhances gut health • Reduces the needs for feed medication Since pipelines of wet feeding systems are not sterilized between feedings it is inevitable that they are microbiologically active. Addition of organic acids to liquid feed in order to improve its biosafety by impeding the proliferation of microbiota is a relatively common practice. The antibacterial activity of organic acids is related to the reduction of pH in the liquid feed, as well as to their ability to dissociate, which is determined by the pKa-value of the respective acid, and the pH of the surrounding milieu. Research (Mikkelsen and Jensen, 2000, Canibe and Jensen 2003, Cherrington et al 1991) proves that not only the feed content is better preserved but also that feeding liquid feeds with a low pH limits harmful Enterobacteria along the gastrointestinal tract in sows and piglets. The undissociated acids have the ability to enter the bacteria; once in the bacterial cell, the acid releases the proton in the more alkaline environment, resulting in a decrease of intracellular pH. This influences microbial metabolism inhibiting the action of important microbial enzymes and forces the bacterial cell to use energy to release protons, leading to an intracellular accumulation of acid anions. The acid anion seems to be very important in relation to the antibacterial effect of organic acids. (Lückstädt and C.,Mellor, S. 2011). Feed hygiene in relation to torsions Growing pigs fed liquid whey occasionally suffer from “colonic bloat”. The condition is characterized by sudden death and after autopsy by distention and intense reddening of the colon and lower small intestine (McCausland et al., 1980). Literature shows there are several factors which can induce torsions in pigs of which whey fermentation is most often discussed. It can also be related to dominant animals which hastily consume a large quantity of feed in a very short period of time; this will entail incomplete digestion due to insufficient stomach acidification and therefore inadequate antibacterial control (Figure 2). Figure 2. Sensitivity of various groups of micro-organisms in relation to pH (Selko Feed Additives). Non-digested nutrients stimulate multiplication of bacteria in the intestine, producing excessive quantities of gas. The gas disables intestinal mobility, stopping peristaltic movements, enabling the micro flora and yeasts to continue to produce gasses. Research 138 London Swine Conference – Production Technologies to Meet Market Demands April 1and April 2, 2015 by Canibe et al. (2003) showed that liquid feed contained higher yeast counts compared to dry feed. Since the yeasts are not pH sensitive they have the ability to pass the stomach and remain active in the small intestine (Table 3). Table 3. Microbial counts (log cfu/gr sample) along the gastrointestinal tract of pigs fed with different diets: dry feed (DF), non fermented liquid feed (NFLF) and Fermented liquid feed(FLF) (Canibe & Jensen 2003). Microbial Analysis Lactic acid bacteria Enterobacteria Yeast Location intestine Stomach DF Diet NFLF FLF Small Intestine Stomach Small Intestine Stomach Small Intestine <5.3 7.9 9.0 <6.3 3.8 5.5 <3.4 <3.4 <6.5 5.7 6.6 3.7 3.9 7.2 <3.2 <4.1 5.4 7.0 The enhanced intestinal pressure may result in lesions in the intestinal wall, or upward displacement of the intestine. The pressure on the abdominal organs can involve vascular obstruction, slowing down blood circulation and creating anaerobic circumstance, initiating frequent Clostridium positive findings during autopsy. The hypothetical cascade is visualized in Figure 2. Figure 2. Illustration of the hypothetical relation between feed hygiene, torsions and Clostridium. Maintaining a healthy intestinal status and therefore highly performing animals starts by managing feed hygiene. Synergistic blends of organic acids (Selko-LF) have a broad spectrum antimicrobial strength again yeast, mould and enterobacteriaceae. Additionally they will reduce the stomach pH in presence of feed, thereby supporting the natural barrier against bacteria. London Swine Conference – Production Technologies to Meet Market Demands April 1and April 2, 2015 139 SUMMARY Microbiological hygiene shows to be an essential step towards a more sustainable and efficient feed to food production cycle. It combines the interests of the farmer, food industry and society in a positive manner. To optimize feed utilization, good hygiene practices are of essential importance. Specialized synergistic blends of acids make sustainable feeding more available, they are easy to implement and highly efficient. The addition of organic acids to liquid feed can be used as a means of increasing the biosafety and maintaining nutritional quality of liquid feeding and liquid feeding systems ensuring good animal performance. REFERENCES: Braun, K. and K. de Lange. 2004. Liquid swine feed ingredients: Nutritional quality and contaminants. Proc. ANAC Eastern Nutrition Conference, May 11-12, 2004, Ottawa, Ontario, Canada. 17 pp. Brooks, P.H., Beal, J.D., Niven, S., 2001. Liquid feeding of pigs: potential for reducing environmental impact and for improving productivity and food safety. Recent Adv. Anim. Nutr. Aust. 13, 49–63. Canibe, N. Jensen, B.B.(2012) Fermented liquid feed – Microbial and nutritional aspects and impact on enteric diseases in pigs. Animal Feed Science and Technology 173(1-2):17-40. Canibe, N. Højberg, O., Badsberg, J.H., Jensen, B.B. (2007) “Effect of feeding fermented liquid feed and fermented grain on gastrointestinal ecology and growth performance in piglets” J. Anim. Sci.(85) 29592771 Canibe, N., and Jensen, B.B.(2003) “Fermented and nonfermented liquid feed in growing pigs: Effect on aspects of gastrointestinal ecology and growth performance” ” J. Anim. Sci.(81) 2019-2031 Canibe, N., and Jensen, B.B.(2009) “Fermented liquid feed - Feed processing has a big impact on microbial degradation of free lysine during fermentation.” Book of Abstracts - Dpp 2009. 2009. p. 62-62. Cherrington, C.A., Hinton, M., Mead, G.C., Chopra, I., 1991. Organic acids: chemistry, antibacterial activity and practical applications. Adv. Microb. Physiol.32, 87–107. FAO (2011)“Global food losses and food waste- extent causes and prevention” Food and Agriculture Organization of the United Nations. Study conducted for the international congress ‘SAFE FOOD!’. Lückstädt, C.,Mellor, S. 2011. The use of organic acids in animal nutrition, with special focus on dietary potassium diformate under European and Austral-Asian conditions. Recent Advances in Animal Nutrition. Australia 18,123-130. McCausland, I.P. and Southgate, W., (1980) “Intestinal rupture in sows fed whey” Australian Veterinary Journal, Vol. 56, April 1980. McDonald, P., Henderson, A.R., and Heron, S.J.E. (1991) “The biochemistry of silage” 2nd ed. Chalcombe Publications Marlow United Kingdom Mikkelsen, L. L., and B.B. Jensen (2000) “Effect of fermented liquid feed on the activity and composition of the microbiota in the gut of pigs” Pig News Inf. (21) 59N-66N. Jensen, B.B., Mikkelsen, L.L., 1998. Feeding liquid diets to pigs. In: Garnsworthy, P.C., Wiseman, J. (Eds.), Recent Advances in Animal Nutrition. Nottingham University Press, pp. 107–126. Roth, F.X., Kirchgessner, M., Eidelsburger, U., 1993. Zur nutritiven Wirksamkeit von Milchsäure in der Ferkelaufzucht. Agribiol. Res. 46:229-239. Shurson, J. 2010. What we know about feeding dried distillers grains with soluble (DDGS) to swine. Dekalb Feeds Summer Seminar, La Crosse, WI. July 26-28. www.SLFA.ca, Swine Liquid feeding Association Wilkinson, J.M. and Bolson, K.K. (1996) “The production of silage and hay in Europe in North America” 42-43 Proceedings of the 11th International Silage conference University of Wales, United Kingdom. 140 London Swine Conference – Production Technologies to Meet Market Demands April 1and April 2, 2015 RAISING NURSERY PIGS WITHOUT ANTIBIOTICS Rich van Donkersgoed W-F Production Supervisor, Black Creek Livestock Email: [email protected] ABSTRACT There is a growing demand for meat raised without the use of antibiotics. The consumer is increasingly being educated that this choice comes at a cost and they are increasingly willing to for pay it. Producers have an opportunity to retain a portion of this price increase, to make their operation more profitable. There are a number of challenges that come with antibiotic free pork production. Producers need to weigh the pros and cons for their operation, to determine if it will be feasible and profitable. The tools allowable in each antibiotic free system must be assessed for desired effect before they are incorporated into the system. This discussion will focus on the nursery stage of production, from a farm level perspective. WEIGHING THE PROS AND CONS Pros of antibiotic free production at a nursery stage are mainly to produce a market hog that can be marketed as antibiotic free, or raised under certain restrictions for marketing purposes. Other pros can include a reduction in production costs from reduced antibiotic use and, by default, a higher health status (a higher health status may be necessary to maintain an antibiotic free program). Also, by default, facilities may get some overdue attention, to make sure environment, feeders and water are not causing undue stress to the pigs that prior medication use may have masked. Cons of antibiotic free production at a nursery stage are fairly straight forward. Disease can rob the extra profits that the program is supposed to incur. Minor issues can become major, when left delayed, or unchecked. Nursery managers can become frustrated if production lags, or mortality and morbidity increase. TOOLS AVAILABLE TO THE NURSERY Weaned Pigs • • • Start with the highest health you can. Disease challenges can be debilitating. Start with the biggest pig the sow barn can produce. Increasing weaning age and weight allows for easier transition into the nursery and less complex diet requirements. Four week weaning is a good age and size. Cull the junk. Placing compromised pigs, with the hopes of saving that pig and getting an antibiotic free premium, can decrease overall health and cause an increase in treatments. Environment • Place pigs into washed and disinfected facilities. Starting clean is easier than dealing with bugs that build up. London Swine Conference – Production Technologies to Meet Market Demands April 1and April 2, 2015 141 • • • • Make sure equipment is functioning properly and there isn't anything that could cause open wounds, or injury. Control birds and rodents. Maintain good biosecurity. Warm and dry the nursery before pigs enter. Chilling will compromise immunity and allow disease to prevail. Good drying agents can help keep flooring dry and bacteria reduced. Ventilate to prevent humidity and ammonia. Air quality is paramount to good health. Water • • • Flush water lines, before entry, so the first drink is a fresh one. Test water quality regularly, for coliform and E. coli. Acidify water, to control gut bacteria. Feed • • • Keep feed fresh with multiple feedings. Feed on floor, or trays to encourage group feeding activity in the first days. Use good quality feed. Properly balanced rations, free of toxins. Other Additives • • • • • Zinc is becoming a controversial additive, but works to control E. coli in early stages of the nursery. Electrolytes can be added to the water to reduce weaning stress. Essential oils can be used to alleviate some respiratory stress. Probiotics and prebiotics can improve immunity. Vitamins can also be pulsed to battle times of low immunity. CONCLUSION Nothing can replace good health and management. When attempting to run antibiotic free, all other tools should be reviewed for times when health is suppressed. There should always be an option to treat any pigs that need intervention to maintain health and wellbeing. Those animals may come off the antibiotic free program, but they should not be subjected to undue suffering in order to stay on the program. 142 London Swine Conference – Production Technologies to Meet Market Demands April 1and April 2, 2015 TROUBLESHOOTING WITH NEW TECHNOLOGY Mike Brumm Brumm Swine Consultancy Inc. PO Box 2242, North Mankato, MN 56002-2242 E-mail: [email protected] ABSTRACT Trouble shooting begins with the identification of a problem. The advent of all-in/all-out flows have allowed producers to monitor grow-finish performance at the time of last pig removal and identify performance limitations. Having a set routine to troubleshoot facilities makes sure you don’t miss items during the effort to remove these limitations. My routine includes 1) a walk around of the exterior to identify ventilation issues and observe rodent control; 2) observation of pig behavior to identify abnormal sleeping patterns/locations, etc.; 3) observation of the status of the ventilation system to identify this as a possible limitation to performance and profit; 4) observation of feeder sizing and adjustment to identify how the biggest cash expense is being delivered to the growing pigs; 5) observation of the water delivery system including flow rate and medicator connections; and 6) observation of sick pen status to observe what is being done to assist pigs in recovery from disease challenges. WHAT’S NORMAL? In my experiences, the industry wide implementation of all-in/all-out production flows and the resulting improvements in record keeping have improved the identification of problems and highlighted the need for more aggressive management to be able to remain competitive in the industry. All-in/all-out has allowed us to capture performance data, and recently two different data sets are available that highlight ‘normal’ performance in production facilities. While these data sets have some overlap between producers providing input, for the most part they represent different segments of the US and North American production industry (Table 1). The data reviewed by Stalder (2014) includes the majority of the production systems in the Southeast and southern plains regions. It also includes several of the larger production systems in the upper Midwest. The systems in this data set tend to use diets with higher levels of dietary fat additions and often pellet their diets in owned/controlled feed mills. The data from the MetaFarms record system tends to represent more upper Midwest and Canadian producers. In many instances they have on-farm feed processing or use toll mills with limited pelleting capabilities. The diets tend to include higher levels of DDGS as an ingredient due to the localized availability and pricing of this ingredient. Exterior Walk Around When you’re inside of facilities with producers, it is not possible to be sure of fan models, brands, condition of soffits, etc. Thus a walk-around of the exterior prior to entry lets you note such items as barrier rodent control, condition of fans, brand/size/model of fans, attic inlet sizes and cleanliness, location of pit pump-out ports, emergency curtain drop London Swine Conference – Production Technologies to Meet Market Demands April 1and April 2, 2015 143 connections, etc. It also lets you listen to pig behaviors – are they normal or is there evidence of discomfort in their vocalizations? Table 1. 2013 US pig performance as reported by two record summaries. Item Nursery Grow-Finish Wean-Finish Stalder MetaFarms Stalder MetaFarms Stalder MetaFarms Start Wt, lb Out Wt, lb Avg. days on feed Daily gain, lb/d 13 52 13.5 50.9 52 272.1 271 274.0 271 45 47 123 119 165 163 0.83 0.82 1.81 1.82 1.58 1.58 Daily feed, lb/d 1.38 5.16 4.11 Feed:Gain 1.48 1.64 2.66 2.83 2.50 2.60 Mortality, % 3.9 3.6 5.0 4.4 6.9 6.3 No. Companies 41 44 26 No. Farms 616 1561 886 No. closeouts 7307 8003 1889 Observation of Pig Behaviour If there are windows on entry doors I spend time observing pig behavior. Where are the pigs sleeping, how active are they, are the pen floors wet or dry, etc.? Are the pigs piled or spread out, are the lying areas where you would expect them to be or are they in abnormal locations? Are pigs fighting for water access or in hot weather, are they fighting for a location where they can get their skin wet to increase evaporative cooling? A few minutes of observation of the un-interrupted behavior prior to entry often lets you know where to begin as you investigate the pig’s environment. Status of Ventilation System Operation The ventilation system in most negative pressure systems is comprised of adjustable inlets and exhaust fans connected to a controller. The controller (using temperature probes) determines which fans to turn on/off or which furnaces to turn on/off in response to the selections set by the producer. Assuming the minimum ventilation was sized correctly for moisture removal heat production by the pigs is the driving force for all of the controller settings. By balancing estimates of heat production by growing pigs and heat loss from the building shell (dependent on the amount of insulation) and ventilation air it is possible to predict which fan should be operating at a given combination of outside air temperature and pig weight (Table 2.). When you walk into a room, which fan(s) is operating and should you expect that fan to be functioning? What about furnace operation? Again, is the system functioning as expected? 144 London Swine Conference – Production Technologies to Meet Market Demands April 1and April 2, 2015 Table 2. Typical balance point temperatures for US grow-finish fully slatted facilities with variable speed fans for stage 1 and 2. Stage 1 50% Stage 2 100% 50% Stage 3 Stage 4 100% 100% 100% 28 37 Curtain Sided Pig Set cfm/pig Wt Point lb F 50 72 39 55 61 66 70 69 100 68 9 37 47 54 61 64 150 65 -21 19 34 43 42 56 200 62 -53 -1 19 31 43 49 28 48 4.7 9.4 14.1 19 Estimated Balance Point Temperature - Degree F Insulated Side Wall Tunnel Pig Set cfm/pig Wt Point lb F 50 72 36 54 91 99 70 73 100 68 4 35 47 54 60 66 150 65 -28 16 33 43 52 59 200 62 -62 -4 18 31 43 53 4.7 9.4 14.1 19 Estimated Balance Point Temperature - Degree F In the US the vast majority of production facilities use ceiling inlets to distribute incoming air. These are normally installed with the expectation of 0.05-0.1” w.g. static pressure between the attic and the animal room. When adjusted correctly to attain this pressure, the incoming air velocity at the inlet should be 800-1000 fpm. In facilities with 7.5-8 ft ceilings, this means the incoming air stream should be evident at 5.5 ft above the floor when you are 14-15 ft from the inlet opening. Higher ceilings means the incoming air stream should be evident at 5.5 ft above the floor even further back from the inlet. If this is not happening, is it because the inlets are in need of repair or because the attic opening is restricting total airflow into the facility? If the inlets are actuated (mechanically controlled) and linked to the fan staging in the ventilation controller, are the settings in the controller correct and/or do the inlets need to be adjusted because of loose ropes, broken ropes, etc.? London Swine Conference – Production Technologies to Meet Market Demands April 1and April 2, 2015 145 Feeder Sizing and Adjustment The feeder is the control point for the largest expense in pork production. In a typical small pen grow-finish facility in the US a 2-sided feeder is the eating location for 66 pigs (33 pigs per 10 x 23.5 ft pen). Based on the ‘average’ MetaFarms performance numbers in Table 1 each pig consumes 620 lb of feed. At 2.65 groups of pigs per year in a typical facility, the total feed disappearance per feeder per year becomes 108,438 lb of feed. If feed averages $0.12/lb, this is $13,013 in expense per feeder. This math illustrates the importance of correct feeder settings. The best method I know of to get consistent feeder adjustment in production facilities is to take a digital picture of a feeder in the facility that both the manager and the employee/son-in-law/contract grower agree is correct. Print this picture and post it in the facility as the daily reference guide. The daily question then becomes – are the feeders adjusted to match the picture? This is a lot simpler than asking daily care-givers if the feeder is adjusted to 40% pan coverage? Getting the feeder sized correctly so the pig has a ‘quality’ eating experience is important. Incorrect feeder dimensions leads to excessive wastage or a reduction in feed intake. New production facilities currently under construction in the US are now installing feeders with a minimum of 14” wide feeder spaces with some producers selecting feeders with up to 16” wide spaces in anticipation of slaughter weights continuing to increase. Nursery feeders have not undergone a similar increase in dimensions. The vast majority of nursery feeders installed and offered for sale in the US have feeder holes that are 6 in. x 6 in.. Based on the shoulder width dimensions of Petherick (1983), feeder spaces for 55 lb pigs should be 8” wide to accommodate an eating pig at every feeding space at the same time. Drinker Sizing, Adjustment and Plumbing Research on the appropriate number of pigs per drinker is very limited, and drinker designs keep evolving making application of research data new designs difficult. Regardless of the type of drinker (nipple, cup, pan) the recommended flow rate from the delivery device is 34 cups per minute for grow-finish pigs. A common limit to water flow is the connection of the water medicator to the drinking water delivery lines. I’ve seen 1200 pigs forced to drink from a medicated delivery line that was restricted to ¼” diameter by the hose connection with the medicator. Going from a 3/4” PCV delivery line (common in most facilities) to even 3/8” restriction reduces flow to 23% of the original volume. Sick Pen Details Is the sick pen located for the convenience of the producer or with the idea of making it the best pen in the facility? Sick pens should be thought of as intensive care pens. If conditions in the sick pen aren’t better than pens in the general population, what reason do you have to expect a pig to recover from an illness or injury when they get pulled to this pen? Do pigs get ‘lost’ in the sick pen versus either graduating to a recovery pen or being euthanized in 7-10 days following their placement in the pen? 146 London Swine Conference – Production Technologies to Meet Market Demands April 1and April 2, 2015 Are sick pens sized correctly relative to the number of pigs in the facility and are they being used? All too often I see pens of pigs overcrowded because producers fail to remove disadvantaged pigs to pens left empty at the time of pig placement for this purpose. It is not unusual to see upwards of 4 empty pens in a facility as pigs approach market weight because of this failure. Assuming the initial stocking density of the facility was 100% of the capacity, this means pigs in all pens are unnecessarily crowded and have a slower daily gain and lower feed intake as a result. LITERATURE CITED Petherick, J.C. 1983. A biological basis for the design of space in livestock housing. In: Baxter, S.H., M.R. Baxter and J.A.S.C. MacCormack (eds.) Farm Animal Housing and Welfare. Martinus Nijhoff Publisher, Boston, pp 103-120. Stalder, K.J. 2014. 2014 U.S. Pork Industry Productivity Analysis. http://www.pork.org/Research/default.aspx#.VBxX3KOxURo. Accessed February 6, 2015. Stein, T. 2014. Benchmarking 2013 nursery, finishing, and wean-to-finish closeout performance. MetaFarms, Inc. Burnsville, MN 55337. London Swine Conference – Production Technologies to Meet Market Demands April 1and April 2, 2015 147 148 London Swine Conference – Production Technologies to Meet Market Demands April 1and April 2, 2015 TROUBLESHOOTING FOR OPTIMUM NURSERY AND FINISHER BARN PERFORMANCE John Otten Production System Manager, South West Veterinary Services and Professional Pork Alliance 219 Oak St., Stratford, Ontario Email: [email protected] NURSERY MANGEMENT Introduction Nursery feeding and management remain more “art than science” than any other phase of production. Development of standard protocols that apply to all pigs must always recognize the unique needs of different sub-groups within the total weekly weaning. Nonetheless, as more research on critical topics such as the thermal environment, housing and feed management and nutrition, advances can be made. Clearly, improvements achieved in nursery management will pay big dividends in terms of overall performance, including that in grow out. Failure to manage the nursery properly may cause any number of problems, including • increased mortality • lower nursery exit weights • Higher feed conversations • increased medication to handle individual and group health problems • lower ADG and higher cost per kg of gain Housing Management Thermal Environment • • • • • • • • Current recommendations tend to keep our nurseries slightly warmer than necessary, resulting in lowered feed intakes and poorer growth. If we lower the temperature but keep the pig comfortable we will be able to give the conditions for optimum feed intake from a thermal aspect. Piglets preferred cooler temperatures at night. Between 10:00 pm and 6:00 am, the piglets selected temperatures that were about 3ºC to 4ºC lower than during the daytime. Allowing adequate space that if we keep pigs in a nursery up to 25kg body weight then 2.85-3.0 square feet is ideal. If we raise pigs into the 30 plus kgs then we need to be over 3.0 square feet and maybe closer to 3.5 square feet. This will depend on the housing cost and the improved performance of the pig. Leaving pigs in nurseries to a heavier weight can be hard on the hardware of the nursery especially plastic flooring. Pending pig flow and the number of sites employed. All In All Out is the best way to manage flow and segregation. Humidity is a real enemy to nursery pig health. Aim for 60 to 65% humidity. London Swine Conference – Production Technologies to Meet Market Demands April 1and April 2, 2015 149 Feed Management • • • • • • • • Keep feeders with at least 50% of trough covered in feed. Avoid letting feeder get empty – keep feed in front of pigs at all times. Keep feeder trough partitions in good repair to avoid pigs wasting and playing with feed. Follow the recommended feed budget set out by feed supplier or nutritionist recommendations. Important to track feed budgets and check pig performance to how the feed budget was recommended. When feeding the very early diets to small pigs keep small amounts in the feeder to keep it fresh. The need for higher amino acids for different genotypes can help the pigs to be less aggressive and improve health. In some cases this is the issue with ear tip necrosis. Small pigs may need special feeders that are round and red, and feed placed two times a day and wetted to make a gruel. Piglet Management • • • • • • • • • The room, including all equipment, must be thoroughly cleaned and disinfected. Ensure the room was dried and prior to pigs arriving bring the room to desired temperature for new piglets. Watch piglets for comfort and lying patterns to determine if environment is too cool or too hot. Bring the barn temperature down as pig grow. Too warm and feed intake will suffer. An average of 28ºC is a reasonable starting point. Piglet behavior will reveal if the temperature is too high or too low. The temperature can be dropped by 0.5ºC per day, until 26ºC is reached, at which time the temperature should drop 1 to 2ºC per week. Sort pigs by size to help pig compete at the feeder and to manage feed for smaller pigs. Ensure water flow is adequate Walk each pen daily and ensure all pigs are eating or are not healthy and remove and give attention for treatment and feeding. Take time to walk pens and the barn noting all environment factors that keep pig comfortable. Setting up for Finishing • • • 150 Good management that includes environment, feeding and sorting of nursery pigs enhances performance at the finisher. A finisher can tell when the truck is unloading and the pigs settle in for a day whether the group will be a good group or it may have challenges over and above the health status and genotype of pig. The person who spent time and detail on the pigs at the nursery always pays off in fast start at the finisher and a good finish. London Swine Conference – Production Technologies to Meet Market Demands April 1and April 2, 2015 • This sets the bar high for the finisher to continue the effort to raise high performing pigs with the least amount of troubleshooting. FINISHER MANAGEMENT Expectations of Ideal Finisher Pig Performance for Average Daily Gain (ADG) • • • • • • • ADG of 950 > grams per day. This is an excellent number and the barn will show good robust growth. It like being able to see the growth of this kind of performance on a weekly bases. As high ADG performance is desired there are factors that assists this performance like the feed energy level we feed the pigs. Consider what the cost per kg of gain is with the extra energy to achieve fast growing pigs to ensure it is profitable especially at lower hog prices. Genetic Sire Lines can be selected to enhance this trait Giving a little extra space per pig or close to 8 square feet would be ideal. Ventilation: All equipment has to work properly to achieve good growth performance. No out of feed events. This happens more than one thinks. Know and maintain your feed equipment and settings for timing the feed delivery duration. Expectations of Ideal Finisher Pig Performance for Feed Conversion (F/C) • • • • • • • A conversion of 2.6 is optimum with pigs going to 125 kg or greater. Operate the barn with a good temperature range. Not too hot, warm, cool, and cold. Manage humidity and air speed. Avoid overcrowding. Lower feed conversion is energy of feed dependent and the cost of this needs to be considered. Phase feed can reduce cost. Sire Line dependent as some sire lines can be selected to improve this aspect. Expectations of Ideal Finisher Pig Performance for Mortality • • • • • Ideal mortality of 2% or less. This is pending good barn bio-security and pig population health status. See every pig every day by walking the pens and getting all the pigs up and walking with you daily. Remove and treat pigs daily that need the help. Monitor daily water intake. Early indicator of a potential health challenge. Great finishing barn performance seldom happens on its own. The person(s) that are in charge of the care of the pigs will have good interaction with the pigs on a daily bases. And cover all of the points mentioned in previous sections. Expectations from a good finisher barn appear to be what the rest of the production chain from sow barn and nursery would achieve. London Swine Conference – Production Technologies to Meet Market Demands April 1and April 2, 2015 151 The Sow herd would think they sent out good piglets to the nursery in good health and proper weight. They feel if there is no bad news that all went well. Same as the expectation from a nursery barn; pigs went out in good shape and health and there should be no issues. However during the course of the 16-18 weeks it take to finish the pig to market and achieve optimum earnings for this pig, all may not go well. The finisher pig pays all the bills right back to the day the pig was conceived. A tall order and leaving some profit at each stage of life/change of markets is ideal Managing a finishing barn or operation requires as much detail as sow and nursery barn. Establishing good strong daily routines and follow up with issues for pig health and barn operations help to achieve great finishing barn performance. 152 London Swine Conference – Production Technologies to Meet Market Demands April 1and April 2, 2015 MANAGING IMMUNITY Vahab Farzan1, Kees de Lange2, Brandon N. Lillie3, 1 Department of Population Medicine, 2Department of Animal and Poultry Science 3 Department of Pathobiology University of Guelph, Guelph, Ontario, CANADA E-mail: [email protected]; [email protected]; [email protected]; ABSTRACT On commercial swine farms clinical and sub-clinical disease continue to contribute to losses in production efficiencies, lowering profits. Various approaches are available to reduce the negative impact of disease, including nutrition, genetic selection, and various aspects of on farm management. In terms of nutrition, feeding newly-weaned pigs, low complexity diets (e.g., reduced level of blood plasma and milk products and fish meal) increases their susceptibility to disease, which can be attributed to a large extent to the dietary fatty acid profile. The optimum inclusion level of fish oil in corn and soybean meal based nursery diets is about 2.5%, reducing the dietary ratio between omega-6 and health benefit providing omega 3 fatty acids from about 18 in diets with no fish oil to 3. Various approaches are being pursued to genetically select pigs that have improved resistance to multiple pathogens or a particular pathogen (i.e., PRRSV), or to identify genetic defects that may render pigs more susceptible to disease. Based on these approaches various genetic markers have been identified. However further validation of these markers under a range of commercial settings is required to clearly validate the benefit from a disease standpoint and to verify that selecting for improved immunity has no undesirable consequences for other production parameters. On-farm studies are conducted in Ontario to establish the prevalence of a number of pathogens on different farms and among pigs within farms, to relate pathogen load to reductions in animal performance, to identify socalled biomarkers for pathogen load and reduction in performance, and to establish the effect of pig genotype and feeding-programs on the pig’s ability to cope with pathogens. These studies illustrate the large variability in nursery pig performance in Ontario, and the close association between expression of some genes in the liver, as well as plasma levels of selected cytokines and acute phase proteins, with nursery performance. These relationships should be explored further and will help us to identify approaches to minimize the negative effects of sub-clinical disease on pig performance, wellbeing and profits. INTRODUCTION In spite of high levels of biosecurity, sub-clinical levels of disease are present on most commercial swine operations and contribute to losses in production efficiencies and, as a result, reduced profits. Approaches to reduce the negative effects of disease on animal productivity should thus be explored, including nutrition, genetic selection and breeding, and many aspects of on-farm management (i.e., biosecurity, vaccination and medication programs, environmental stressors, etc.). In this manuscript a brief overview of the development of the immune system of pigs is provided, followed by some discussion on nutritional, genetic means, and farm management factors to improve the pig’s (immune) London Swine Conference – Production Technologies to Meet Market Demands April 1and April 2, 2015 153 response to a disease challenge while highlighting the findings of on-farm studies conducted recently in Ontario. IMMUNE SYSTEM DEVELOPMENT IN YOUNG PIGS The immune system is a highly complex system, and involves many tissues in the pig’s body including lymph nodes, lymphoid follicles, tonsils, thymus, and spleen. In fact, and based on the presence of immune cells, the gut is the body’s largest immune organ. This reflects that most of the interactions between the animal and its ‘external’ environment occur on the very large intestinal surface. In simple terms there are three main components of immune function that are relevant to young pigs (Colditz, 2002): (1) passive immunity, which is largely based on the (dietary) supply of antibodies through colostrum, milk, possibly creep feed and other supplements; (2) innate immunity: the first line of defence to microorganisms if they pass the natural barrier (e.g. skin, mucus, commensal microorganisms). The innate immune response involves cytokines, complement proteins, phagocytes, toll-like receptors, and natural killer cells; it is not-specific to any disease, does not include a ‘memory’ of previous exposure to pathogens, is not long-lasting, but is the first step towards development of adaptive immunity (3) adaptive (acquired) immunity (cell-mediated and humoral immunity), which is primed by innate immunity, and consists B and T lymphocytes, antibodies, and cytokines; it ‘remembers’ previous exposure to pathogens and vaccines, and is specific and long-lasting. Important indicators of the activity of the immune system that can be monitored to assess the animals’ response to pathogens are (Colditz, 2002; Rakhshandeh and de Lange, 2011): (a) white blood cells counts and types: white blood cells or leukocyte are involved in various aspects of innate and adaptive immunity include: i) phagocytic cells (e.g. neutrophils and macrophages) that ingest, kill, and digest invaded bacteria. Macrophages will also process the microorganisms and present it to other leukocytes that are responsible for antibody response (B-cells) or cell-mediated response (T-cells). ii) monocytes: B lymphocyte (B cells) that recognize pathogens and start the process of making antibodies to specific infections and T lymphocyte (T cells) that are responsible for cell-mediate immune response in different ways such as cytokine secretion, killing infected cells, and activating B cells. The numeration of various subtype s of T-cells (e.g. CD4 or CD4 T-cells) may be a suitable indicator to evaluate cell-mediated immune response after exposure to a pathogen. (b) cytokines (e.g., various interleukins: IL, tumor necrosis factors: TNF) and acute phase proteins (e.g., haptoglobin, albumin, reactive protein C, serum amyloid A) that are produced during exposure to pathogens. Cytokines orchestrate the local and whole body response to a disease challenge. (c) antibodies (immunoglobulins) including IgG, IgM, IgA, IgE, and IgD. IgG is the major immunoglobulin in serum and colostrum accounting for more than 80% total 154 London Swine Conference – Production Technologies to Meet Market Demands April 1and April 2, 2015 immunoglobulin. IgM is in serum, colostrum, and milk and accounts for 5-10% of total immunoglobulin in serum and colostrum. IgA has two forms: dimeric (secretory) IgA which is the major mucosal immunoglobulin in the gut lumen in pigs and in milk, and monomeric IgA, which is found in serum. Dimeric IgA is found in colostrum but does not have the secretory chain. Secretory IgA plays a very significant role in mucosal immunity; it binds to infectious agents preventing the attachment of microbial agents to epithelial cells. Some of these compounds, and especially the so-call pro-inflammatory cytokines (IL-1, IL-6 and TNF-α), have a direct effect on liver and muscle tissues and redirect the use of nutrients from growth towards supporting the immune response to pathogens. These proinflammatory cytokines also influence key hormones that regulate growth and energy expenditure such as insulin like growth factor (IGF-1) and insulin. It is well established that piglets are born with highly immature immune systems and rely heavily on passive immunity obtained through colostrum and milk. By about 4-6 weeks of age the innate and adaptive immune systems are reasonably well developed so that piglets can mount their own immune response to a (sub-clinical) disease challenge or vaccination. Based on these simple principles piglets are most susceptible to a disease challenge right around the time of early-weaning, and when pigs are exposed to a number of stressors associated with weaning, which further depresses immune function. IMPACT OF NUTRITION ON THE IMMUNE RESPONSE The relationship between the complexity of nursery diets and the ability of newly-weaned piglets to deal with a disease challenge has been well-established. For example, the large study by Skinner et al. (2014; involving about 1000 pigs) conducted at the University of Guelph illustrates that when newly-weaned pigs (at a weaning weight of about 7.0 kg) are fed low complexity phase I and phase II diets under relatively disease free-conditions, nursery performance was only slightly reduced when compared to pigs fed more typical and complex phase I and II diets. Somewhat surprisingly pigs on the low complexity diet showed compensatory growth during the late nursery and early grower phases, resulting in no difference in overall growth performance and feed efficiency between weaning and market weight. In this study feed costs per pig were more than $2/pig lower for pigs receiving the low complexity nursery diets, which contained no blood plasma, blood meal, oat grouts, barley, acidifiers, antibiotics, and only minimal amounts of fish meal and whey in the phase I diet. However, when pigs were exposed to a rather severe disease outbreak (e.g., Streptococcus suis), performance of pigs on the low complexity feeding program was compromised (Table 1). Based on these observations, further studies have been conducted at the University of Guelph to better understand how diet complexity affects the pigs’ immune response to a disease challenge and to identify dietary means to manipulate this immune response. London Swine Conference – Production Technologies to Meet Market Demands April 1and April 2, 2015 155 Table 1. Effect of nursery diet complexity and in-feed antibiotics on pig growth performance1. All pigs2 Pigs exposed to a severe disease challenge2 Complex Simple Complex Simple Item SEM (n=15) Body weight, kg Day 119, kg 109.7 110.6 111.4 108.4 0.86 Average daily gain, g Nursery, wk 1 to 6 538 473 533 415 10.4 Wean-to-Finish 872 872 880 853 28.4 Gain:Feed Nursery, wk 1 to 6 0.62 0.59 0.64 0.59 0.04 Wean-to-Finish 0.43 0.43 0.44 0.44 0.01 1 Dietary treatments were diet complexity (Complex, with antibiotics vs Simple without antibiotics; see text and Skinner et al., 2014 for details) fed from weaning to 63 d of age (i.e. in the nursery). All pigs received common grower and finisher diets thereafter. 2 All pigs: 15 pens of pigs per treatment; Pigs exposed to a severe disease challenge: 3 pens of pigs. These subsequent studies revealed that the dietary fat source (e.g., fish vs. corn oil) appears more important than the inclusion of highly digestible, functional animal proteins (e.g., milk and plasma proteins) for mounting an immune response. The inclusion of these functional animal proteins in the phase I diet stimulates feed intake and body weight gains, especially during week 1 post-weaning, but it has very limited effects on the pigs’ ability to respond to an immune challenge at 6 weeks of age. It was further established that optimum inclusion level of fish oil in nursery diets is about 2.5%, reducing the dietary ratio between omega-6 and omega 3 fatty acids from about 18 in diets with no fish oil to 3. The inclusion of 2.5% fish oil in low complexity diets improved growth performance and the piglet’s ability to mount both an innate (e.g., increased levels of haptoglobin) and adaptive (increased anti-ovalbumin IgG following vaccination) immune response (Table 2). We are now exploring alternative sources of omega-3 fatty acids. In regards to amino acid nutrition, research conducted at the University of Guelph and elsewhere has shown that exposure to disease reduces the daily amino acid requirements, simply because the effective growth performance potential of pigs is reduced (Williams et al., 1997). However, mounting an immune response slightly increases maintenance requirements for a selected number of amino acids that are quantitatively more important during a disease challenge: tryptophan, methionine + cysteine, and possibly threonine. In practical terms this means that the optimal dietary amino acid balance is slightly different for pigs with sub-clinical levels of disease (see review Rhakshadah and de Lange, 2012). It is beyond this article to discuss the important roles of vitamins, minerals, feed additives and dietary energy sources on immune function, piglet and gut health. For reviews on these topics the reader is referred elsewhere (Klasing and Leshchinsky, 2000; Rakhshandeh and de Lange, 2011). 156 London Swine Conference – Production Technologies to Meet Market Demands April 1and April 2, 2015 Table 2. Effect of inclusion of different levels of fish oil in low protein quality diets on growth performance of post weaning pigs, as well as indicators of the immune response following vaccination on d 6 and 20 after weaning. Treatment1 Item High Low0 Low1.25 Low2.5 Low5 SEM Average daily gain, g Phase I, d 0 to 7 109b 61.4a 87.8b 97.1ab 69.8a 9.22 Phase II, d 7 to 21 389 387 385 374 359 19.1 Phase III, d 21to 42 656 616 627 651 608 27.4 Nursery, d 0-42 448 427 433 441 415 16.2 Gain:Feed Phase I, d 0 to 7 0.570bc 0.396a 0.514bc 0.562c 0.438ab 0.043 Phase II, d 7 to 21 0.743 0.772 0.762 0.773 0.773 0.017 Phase III, d 21to 42 0.651 0.666 0.632 0.638 0.637 0.027 Nursery, d 0-42 0.754 0.766 0.749 0.768 0.762 0.022 Serum haptoglobin, g/L day 22 after weaning 1.05 1.40 0.95 1.00 0.85 0.05 Anti-ovalbumin IgG, arbitrary units, (optical density) day 34 after weaning 0.92 0.80 0.82 0.70 0.68 0.08 1 Dietary treatments were nursery High protein quality (High; see text), Low Protein Quality (Low), Low protein Quality + 1.25% Fish Oil (Low1.25), Low protein Quality + 2.5% Fish Oil (Low2.5), and Low protein Quality + 5% Fish Oil (Low5)fed from weaning to 21 d post weaning. All pigs received common phase 3 diets thereafter. Each mean represents observations on 6 pens. a-c Values with different letters within the same row differ (P < 0.05). GENETICS AND THE IMMUNE RESPONSE Another approach to managing for immunity is through management of animal genetics and selection for genotypes associated with improved immunity. Selection in animal production has been done at some level since early domestication. With time, selection approaches became more refined as we became more precise in measuring what we wanted to change (the phenotype) as well as improving our understanding of how animals passed on their traits. This latter aspect has progressed to the level of looking at things at the DNA level looking for associations of specific genetic variants (including singlenucleotide polymorphisms or ‘SNPs’ as well as other larger gene variants) with desired traits. Original selection was based on observed differences in the animals, and indeed even with the advent of genetic selection, initial progress, and to date the areas with the greatest gains, has been in traits or phenotypes that are easy to observe and quantify – largely more classical production traits. Advances in selecting or managing genetics for immune traits have been more difficult to achieve but the area is poised to provide significant gains in the future. One of main challenges in using genetics to improve immunity is in defining and, more importantly measuring that which we wish to change. While it is easy to measure the number of piglets per sow, or meat traits, it is much more difficult to measure “immunity”. This is partly because immunity is such a complex process involving myriad genes and proteins, and, as mentioned above, reflects a combination of passive immunity, innate London Swine Conference – Production Technologies to Meet Market Demands April 1and April 2, 2015 157 immunity, and adaptive immunity. It is further complicated by the fact that immunity has no single parameter that can be measured. We can measure the number of overtly sick pigs, or the number of deaths or culls as a measure of impaired immunity, but this does not capture the total impact of immunity on a herd. Immunity, and disease associated with insufficient immunity, will also contribute to a diverse range of parameters such as growth rate, piglets weaned or even piglets born per sow. Finally, immunity is also impacted by many other factors, including nutrition (as mentioned above), the presence and nature of the infectious organisms, and the environment, making it challenging to tease out the impact of specific genotypes on overall immunity. Despite the above mentioned challenges, the rapid development of novel technologies (including next generation sequencing and SNP Chips) to improve our ability to investigate things at the genetic level have led to recent advancements in the genetics of immunity. Two main approaches have been taken. One is to look at immunity or resistance to, or tolerance of, a specific pathogen, such as the Porcine Reproductive and Respiratory Syndrome Virus (PRRSV). The other approach is to try to improve broad immunity to the range of pathogens an organism would be exposed to. Both of these approaches are important and both are making progress. Genetic resistance to single pathogen When a single pathogen (e.g. PRRS virus) makes a very significant economic impact on production it can be worth searching for genetic markers of impaired immunity or resistance to that single organism. For example, in a controlled study conducted by a large international group in the US, both viral load and growth rate were shown to have a significant heritability (h2=0.31 and 0.30, respectively); showing that the host immunity / response to PRRSV has a significant genetic component (Boddicker et al., 2012) The group then genotyped these pigs for ~60 000 SNPs spread throughout the genome and found an area on pig chromosome 4 that was significantly associated with both viral load and growth rates in the same PRRSV challenged pigs. Finally, a potential causative mutation has been identified (Boddicker et al. 2014; Boddicker et al., 2013; Boddicker et al., 2012). While these results are promising as far as the potential ability to select for pigs with slightly better resistance and/or tolerance for PRRSV infection, further work validating this work in situations with mixed infections and on commercial farms need to be done; these studies are underway. Genetic resistance to multiple pathogens The other approach being utilized in research on genetic management of immunity is to focus not on a single disease, but to look for genetic variants that impact immunity to a broad range of pathogens. This can be done many ways, including by looking at adaptive immune parameters, and select for animals that response well to intervention strategies such as vaccinations, or by looking for genetic markers that impact immune factors involved in the immune response to a wide range of the common viral and bacterial pathogens that impact swine production. Use of the former approach has had significant progress in dairy cattle where the High Immune Response technology is commercially available. This approach selects for animals based on simple tests that assess both antibody and cell-mediated immunity (Thompson-Crispi et al., 2014a; Thompson-Crispi et al., 2014b). Animals that are high immune responders respond better to vaccines and have 158 London Swine Conference – Production Technologies to Meet Market Demands April 1and April 2, 2015 reduced levels of disease. Similar research has been done in pigs (Mallard et al. 1998; Mallard et al., 1992) however the approach is not yet commercially available. The other approach in genetic management for broad immunity involves looking for genetic variants or defects in genes that encode proteins involved in the immune response to a wide range of pathogens; often these are part of the innate immune system. By comparing the DNA sequence of these genes between healthy animals and diseased animals, genetic variants can be identified that are more frequent in pigs with these common infectious diseases. For example, in one study (Table 3), the MBL2 G(-1081)A SNP was much more frequent in animals with common infectious diseases such as pneumonia or enteritis, diagnosed by post-mortem evaluation, as compared to healthy animals. Similar results were found when looking at specific bacterial (Table 4) and viral pathogens (Keirstead et al 2011). Similar to the other studies, these initial studies suggest selecting for improved immunity should be possible, however further validation studies under a range of commercial settings are required to clearly validate the benefit from a disease standpoint, and to verify that selecting for improved immunity has no undesirable consequences for other production parameters. Table 3. Frequency of variant positive genotypes in diseased groups in collagenous lectin gene SNPs. Genotype Healthya Diseased Pneumonia Enteritis Serositis Septicemia (n=1324) (n=461) (n=294) (n=227) (n=64) (n=97) 13 4 3 3 FCN-α G(1139)A 56.0 61.5 58.8 64.7 59.4 59.8 15 5 3 3 1 FCN-β G(−779)C 3.1 3.9 4.5 4.5 1.6 3.11 MBL1 G(271)T 18.714 29.7 21.6 25.2 24.92 26.71 9 4 3 2 MBL1 C(273)T 31.4 46.9 53.4 54.0 54.7 50.5 12 5 4 3 MBL1 C(687)T 15.5 23.4 27.8 33.8 32.4 35.3 14 1 2 13.9 15.3 17.3 9.4 11.3 MBL1 C(int)T 11.4 MBL2 T(−2148)C 55.121 67.2 69.1 68.5 69.4 69.01 7 5 3 4 MBL2 G(−1636)T 56.5 70.3 70.1 71.7 71.8 70.4 14 2 1 2 MBL2 G(−1081)A 16.6 30.3 31.1 33.8 37.5 33.0 13 5 4 3 79.4 79.0 75.4 79.7 82.5 MBL2 C(−251)T 82.3 SP-A G(439)A 18.812 25.13 24.74 29.7 21.6 26.46 8 4 3 2 SP-A G(500)T 22.3 28.4 26.8 26.7 31.3 22.7 15 2 1 2 SP-A T(599)A 45.8 74.3 75.4 73.3 73.4 66.0 Comparison of the percentage of animals with at least one variant allele between the healthy reference population and different disease groups. BOLD = the variant allele is significantly more frequent in the diseased group at p < 0.01 after controlling the FDR. 1,2,3 etc. represent number of animals with a miss call for that SNP in that group (e.g. in the healthy controls group, the FCN-α G(1139)A had 13 miscalls meaning the number of data points is = 1324 − 13 or 1311). a The healthy reference population was weighted to reflect the crossbred status of commercial pigs (50% Duroc, 25% Yorkshire/LW, 25% Landrace). From Keirstead et al, 2011. London Swine Conference – Production Technologies to Meet Market Demands April 1and April 2, 2015 159 Table 4. Frequency of variant positive genotypes in pigs diagnosed with different bacterial pathogens in collagenous lectin gene SNPs. Genotype Healthya E. coli: Salmonella H. Mycoplasma APP S. suis Typhimurium parasuis spp. (n=47) (n=26) (n=103) (n=1324) K88 (n=40) (n=34) (n=25) 13 FCN-α 56.0 65.0 70.6 48 54.31 53.8 58.81 G(1139)A FCN-β 3.115 7.5 9.1 8.72 4.3 0 4.02 G(−779)C MBL1 G(271)T 18.714 22.5 26.5 12 34 7.7 24.3 9 1 MBL1 C(273)T 31.4 58.8 48.9 60.0 66.7 65.4 63.1 12 1 1 MBL1 C(687)T 15.5 41.7 22.5 26.9 50.0 42.4 36.31 14 MBL1 C(int)T 11.4 8.8 8 14.9 23.1 15.5 35.0 MBL2 55.121 72.5 85.3 80 70.2 65.4 72.8 T(−2148)C 72.5 85.3 78.32 74.5 65.4 MBL2 56.57 74.51 G(−1636)T 41.71 30.8 MBL2 16.614 42.5 44.1 40.4 36.9 G(−1081)A MBL2 82.313 75.0 79.4 83.31 72.3 88.5 79.6 C(−251)T 22.5 27.31 8.31 34 7.7 24.51 SP-A G(439)A 18.812 8 1 SP-A G(500)T 22.3 22.5 26.5 12.5 38.3 7.7 24.3 15 1 SP-A T(599)A 45.8 70.8 76.9 80.0 79.4 83 79.6 Comparison of the percentage of animals with at least one variant allele between the healthy reference population and different bacterial pathogen groups. BOLD = the variant allele is significantly more frequent in the bacterial group at p < 0.01 after controlling the FDR. 1,2,3 etc. represent number of animals with a miss call for that SNP in that group (e.g. in the healthy controls group, the FCN-α G(1139)A had 13 miscalls meaning the number of data points is = 1324 − 13 or 1311). a The healthy reference population was weighted to reflect the crossbred status of commercial pigs (50% Duroc, 25% Yorkshire/LW, 25% Landrace). From Keirstead et al, 2011. ONTARIO ON-FARM RESEARCH Given the complex interactions between exposure to pathogens, feeding program, pig genotype and other management factors, there is a need to assess some of these interactions under Ontario conditions. In these studies the presence of pathogens and animal performance is monitored. Where appropriate these measurements are combined with characterization of feeding programs, pig genotypes and indicators of immune system activation. The effects of subclinical infections on growth performance Exposure to microbial pathogens has a negative impact on animal productivity. A metaanalysis study concluded that pigs on PRRS negative farms had a better performance compared to pigs on PRRS positive farms, and that vaccination against PCV2 increases the average daily gain in pigs (Keirstead et al, 2011). Similarly, pigs that appeared clinically healthy but carrying Salmonella grew slower than pigs not shedding Salmonella (Farzan and Friendship, 2010). Another example of the relationship between health and 160 London Swine Conference – Production Technologies to Meet Market Demands April 1and April 2, 2015 performance is that anti-coccidial treatment can not only improve weight gain in suckling piglets, but can also shorten the feeding period, and improve feed conversion in growerfinisher pigs. Our recent study conducted on eight farms in Ontario has also shown that nursery pigs with more prevalent subclinical infection have reduced average daily gain (Tables 5 and 6). Table 5. Subclinical infection with Salmonella, Brachyspira, PRRS virus, Swine influenza virus, and MRSA in 168 nursery pigs on 8 Ontario farms. Farm Number of positive pigs (%) Salmonella Brachyspira PRRS virus Swine influenza MRSA virus 1 0 0 21 (100) 0 17 (81) 2* 6 (30) 0 0 0 12 (60) 3 0 0 17 (85) 0 16 (80) 4 0 0 0 3 (14) 7 (33) 5 9 (45) 0 1 (5) 0 0 6 0 3 (14.3) 10 (48) 0 15 (71) 7 0 2 (9.5) 0 0 1 (5) 8 0 2 (9.5) 0 0 Total 15 (9.3) 7 (4.2) 49 (30) 3 (1.8) 68 (41) *Farrow-feeder operation with no in-feed medication. Table 6. Growth performance parameters in 168 nursery pigs on 8 Ontario farms. Mean (Standard deviation) Farm Sow parity Age at weaning ( day) Weight at weaning (kg) 1 2.3 (1.9) 26.7 (1.2) 6.2 (1.5) 2* 3.6 (2.3) 22.7 (3.4) 6.4 (1.7) 3 2.3 (3.2) 34.4 (7.2) 8.9 (2.0) 4 2.3 (1.2) 28.3 (1.0) 6.7 (1.9) 5 4.9 (2.2) 31.0 (2.9) 7.9 (1.8) 6 3.1 (1.8) 18.7 (0.5) 7.0 (1.5) 7 3.6 (2.2) 26.0 (0.7) 8.2 (1.8) 8 4.1 (2.9) 22.4 (2.0) 5.8 (1.3) Total 3.3 (2.4) 26.4 (5.6) 7.1 (2.0) ADG (kg) 0.40 (0.06) 0.27 (0.08) 0.40 (0.09) 0.37 (0.08) 0.36 (0.1) 0.34 (0.05) 0.39 (0.1) 0.30 (0.03) 0.35 (0.09) *Farrow-feeder operation with no in-feed medication. Immune response and growth performance The negative impact of exposure to microbial pathogens on growth performance may in part be explained by the fact that the cytokine response, especially interleukin (IL)-1β, IL6, and tumor necrosis factor (TNF)-α, which are generated in response to an immune system challenge, can modify nutrient utilization and metabolism in pigs, having a direct effect on liver, brain, muscle and fat tissue (Dionissopoulos et al., 2006). These cytokines are involved in lowering appetite and re-directing nutrients that may be available for growth towards supporting the immune response. London Swine Conference – Production Technologies to Meet Market Demands April 1and April 2, 2015 161 Our most recent study has concluded that pigs seropositive for PRRSV were less likely to have increased IGF-1 expression compared with pigs that were seronegative for PRRSV (Slifierz et al, 2014). Other research has demonstrated that pigs co-infected with PRRSV and M. hyopneumoniae have significantly reduced serum concentrations of IGF-1 despite similar feed intake when compared with a control group (Roberts and Almond, 2003). Infection with PRRS virus in pigs changes the serum levels of haptoglobin, C-reactive protein, serum amyloid A, IFN-γ, IFN-α, and IL-1. Similarly, Salmonella infection or vaccination against Salmonella with live vaccines in pigs affects the serum concentration of IL-8, IL-1β, IFN-γ, IL-6, and TNF-α. Gene expression and/or concentration of specific cytokines (interleukins) may also change in pigs infected with microbial agents or vaccinated against specific infectious disease. We have recently shown that IGFBP-3, IGF-1, and GHR expression in the liver was significantly associated with growth performance in pigs (Slifierz et al, 2013). In this study IGFBP-3 expression in the liver was negatively associated with growth performance but expression of GHR in the liver was positively associated with growth performance in nursery pigs. Impact of farm management factors on growth performance In addition to feed quality, health, innate immunity, genetics, and other factors may impact the growth rate in different stages of production, including sow productivity, farm management, and nutrition. Feed type, as an example, may have impact on growth rate. A meta-analysis study has shown that pigs fed with a wet-dry feed had increased growth rate, feed intake, and final body weight compared to those fed using conventional dry feeders (Nitikanchana et al, 2010). Further, it has been shown that season of birth, birth weight, and weaning weight may explain almost two thirds of the variation in body weight at the end of the nursery period (Paredes et al, 2012). Our study in nursery pigs on Ontario farms has shown that the two-third of total variation in body weight at end of nursery was due to pig effect (Slifierz et al, 2013). In this study the weight at weaning was positively associated with body weight at 5 weeks post-weaning. However, growth performance was negatively associated with age at weaning. Average daily gain (ADG) ranged between 0.27kg to 0.40 kg (Table 6) and was associated with weaning weight in which the heavier weaned pigs had a higher ADG. However, the impact of birth weight on survival rate and weight gain up to slaughter weight is unclear. Some studies have concluded that birth weight has a significant positive impact on growth rate up to market weight, time to marketing, and carcass quality, while others have described no relationship between body weight at the end of the nursery and subsequent growth performance. The controversies in research findings of the factors associated with growth rate may be in part explained by the fact that the multifactorial nature (feed, health, management, and genetics) of growth rate on pig farms has not been appropriately considered. We are currently conducting a longitudinal study to explore the relationship between growth performance, diet, health, and genetics in pigs from birth up to marketing under farming conditions. The current research is investigating the main parameters that are known to impact growth performance and resistance to infectious agents and shedding of pathogens during the various stages of growth, including under commercial farming 162 London Swine Conference – Production Technologies to Meet Market Demands April 1and April 2, 2015 conditions and relate these to productivity up to market weight and carcass quality, particularly in pigs fed with alternative less expensive diets. ACKNOWLEDGEMENTS We would like to thank Swine Innovation Porc, Ontario Pork, OMAFRA, the Canadian Centre for Swine Improvement, and Alliance Genetics Canada for their financial and inkind support. We also thank the following people for their contributions: M. Ainslie, B. Bloomfield, R. Fisher, R. Friendship, S. Hooda, M. Jafarikia, N. Karrow, H. Reinhardt, D. Skinner, M. Slifierz, B. Sullivan, D. Vandenbroek, D. Wey, and J. Zhu. LITERATURE CITED Boddicker N.J., A. Bjorquist, R.R.R. Rowland, J.K. Lunney, J.M. Reecy, and J.C. Dekkers, 2014. Genome-wide association and genomic prediction for host response to porcine reproductive and respiratory syndrome virus infection. Genet. Sel. Evol. 4:46: doi: 10.1186/1297-9686-4618. Boddicker N.J., D.J. Garrick, R.R.R. Rowland, J.K. Lunney, J.M. Reecy, and J.C. Dekkers, 2013. Validation and further characterization of a major quantitative trait locus associated with host response to experimental infection with porcine reproductive and respiratory syndrome virus. Anim. Genet. 45(1):48-51. Boddicker N.J., E.H. Waide, R.R. Rowland, J.K. Lunney, D.J. Garrick, J.M. Reecy, and J.C. Dekkers, 2012. Evidence for a major QTL associated with host response to porcine reproductive and respiratory syndrome virus. J. Anim. Sci. 90(6):1733-46. Colditz, I.G. 2002. Effects of the immune system on metabolism: implications for production and disease resistance in livestock. Livest. Prod. Sci. 75:257-268. Dionissopoulos L, Dewey C, de Lange CFM, and Namkung H. 2006. Interleukin-1 receptor antagonist increases lean mass and decreases the cytokine response in a model of sub-clinical disease in growing pigs. Anim. Sci. 82: 509-515. Farzan A, Friendship RM. 2010. A clinical field trial to evaluate the efficacy of vaccination in controlling Salmonella infection and the association of Salmonella-shedding and weight gain in pigs. Can J Vet Res.;74(4):258-63. Hathaway, M.R., W.R. Dayton, M.E. White, T.L. Henderson, and T.B. Henningson: Serum insulinlike growth factor I (IGF-I) concentrations are increased in pigs fed antimicrobials. J Anim Sci 1996, 74(7):1541-1547. Hooda, S., R. E. Fisher, N. A. Karrow, and C. F. M. de Lange. 2015. Effects of reducing the dietary Omega-6 to Omega-3 fatty acid ratio in low protein quality nursery diets on growth performance and immune response in starter pigs. Proc. 2015 Mid-West American Society of Animal Science Meeting. Des Moines, Iowa, March 2015. J. Anim. Sci. 92 (accepted). Klasing, K.C. and V. Leshchinsky. 2000. Interaction between nutrition and immunity. In (Eds. M.E. Gershwin, J.B. German and C.L.Keen): Nutrition and immunology. Humana Press: Burbank, Los Angeles County, California, USA .pp. 363-373. Keirstead, N.D., M.A. Hayes, G.E. Vandervoort, A.S. Brooks, E.J. Squires, and B.N. Lillie. 2011. Single nucleotide polymorphisms in collagenous lectins and other innate immune genes in pigs with common infectious diseases. Vet Immunol Immunopathol. 15:142(1-2):1-13 Mallard, B.A., B.N. Wilkie, B.W. Kennedy, J. Gibson and M. Quinton. 1998. Immune responsiveness in swine: eight generations of selection for high and low immune response in Yorkshire pigs. Proceedings of the 6th World Congress on Genetics Applied to Livestock Production, Armidale. pp. 1-8 London Swine Conference – Production Technologies to Meet Market Demands April 1and April 2, 2015 163 Mallard, B.A., B.N. Wilkie, B.W. Kennedy and M. Quinton. 1992. Use of estimated breeding values in a selection index to breed Yorkshire pigs for high and low immune and innate resistance factors. Anim. Biotech. 3:257-280 Nitikanchana, S., S.S. Dritz, M.D. Tokach, R.D. Goodband, J.M. Derouchey, and J.L. Nelssen. 2012. Meta-analysis comparing growth performance, carcass characteristics, and water usage of pigs fed using conventional dry or wet-dry feeders. Proc. 22nd IPVS Congress, JeJu, Korea, p.147. Paredes, S.P., A.J. Jansman, M.W. Verstegen, A. Awati, W. Buist, L.A. den Hartog, H.M. Van Hees, N. Quiniou, W.H. Hendriks, and W.J. Gerrits. 2012. Analysis of factors to predict piglet body weight at the end of the nursery phase. J Anim Sci; 90(9):3243-51 Rakhshandeh, A., and C.F.M. de Lange. 2011. Immune system stimulation in the pig: effect on performance and implications for amino acid nutrition. In (van Barneveld R.J., Ed.) Manipulating pig production XIII. Australasian Pig Science Association Inc. Werribee, Victoria, Australia. pp. 31-46. Roberts, N.E. and G.W. Almond. 2003. Infection of growing swine with porcine reproductive and respiratory syndrome virus and Mycoplasma hyopneumoniae–effects on growth, serum metabolites, and insulin-like growth factor-I. Can Vet J. 44(1):31–37. Skinner, L.D. C. L. Levesque, D. Wey, M. Rudar, J. Zhu, and C.F.M. de Lange. 2014. Impact of nursery feeding program on subsequent growth performance, carcass quality, meat quality, physical and chemical body composition of growing-finishing pigs. J. Anim. Sci. 92:10441054. Slifierz, M.J., R. Friendship, C.F. de Lange, M. Rudar M, and A. Farzan A. 2013. An epidemiological investigation into the association between biomarkers and growth performance in nursery pigs. BMC Vet Res.9:247-255. Slifierz, M.J., R. Friendship, C.F. de Lange, D. Slavic, H. Grgic, and A. Farzan. 2014. Immunomodulatory factors and infectious agents associated with the hepatic gene expression of the IGF system in nursery pigs. Animal. 8(5):844-51. Thompson-Crispi, K.A., H. Atalla, F. Miglior, and B.A. Mallard BA. 2014a. Bovine mastitis: frontiers in immunogenetics. Front Immunol. 5:493. doi: 10.3389/fimmu.2014.00493 Thompson-Crispi, K.A., M. Sargolzaei M, M. Abo-Ismail, F. Miglior, F. Schenkel and B.A. Mallard. 2014b. A genome-wide association study of immune response traits in Canadian Holstein cattle. BMC Genomics. 15:599. doi: 10.1186/1471-2164-15-559. Williams, N.H., T.S. Stahly, and D.R. Zimmerman. 1997. Effect of level of chronic immune system activation on the growth and dietary lysine needs of pigs fed from 6 to 112 kg. J. Anim. Sci. 75:2481-2496. 164 London Swine Conference – Production Technologies to Meet Market Demands April 1and April 2, 2015


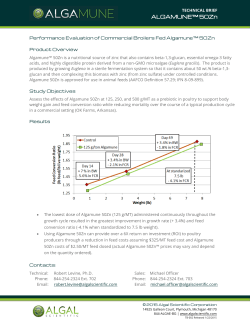


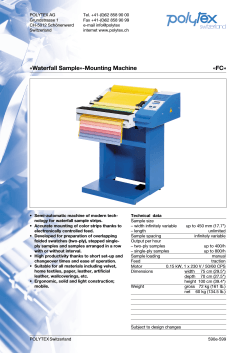
© Copyright 2026