
Nitrogen Transfers and Transformations in Row-Crop
9
Millar, N. and G. P. Robertson. 2015. Nitrogen transfers and transformations in
row-crop ecosystems. Pages 213-251 in S. K. Hamilton, J. E. Doll, and G. P.
Robertson, editors. The Ecology of Agricultural Landscapes: Long-Term
Research on the Path to Sustainability. Oxford University Press, New York,
New York, USA.
Nitrogen Transfers and
Transformations in Row-Crop
Ecosystems
1
Neville Millar and G. Philip Robertson
Nitrogen (N) is an essential constituent of both proteins and nucleic acids, crucial
components of all living things. Humans depend on agricultural systems to provide most of their daily protein, prompting Liebig (1840) to note that agriculture’s
principal objective is the production of digestible N. Today’s intensive agriculture is built on a foundation of N augmentation via the use of synthetic fertilizers
and cultivation of N-fixing crops on a massive scale. Globally, the addition of
this fixed N to cropping systems is now greater than natural terrestrial N fixation
(Galloway et al. 2004, Vitousek et al. 2013) and is a pervasive and fundamental feature of modern crop management (Robertson and Vitousek 2009). The net
benefit to humans of this additional N to agriculture is immense—it has enabled
greater food production and unprecedented increases in human population (Smil
2002). At the same time, however, this anthropogenic acceleration of the global
N cycle has caused serious environmental problems including contributing to climate change and stratospheric ozone depletion, eutrophication and harmful algal
blooms, poor air quality, biodiversity loss, and degradation of drinking water supplies (Galloway et al. 2008).
Here, we summarize findings on the cycling of N in agricultural ecosystems of
the Kellogg Biological Station Long-term Ecological Research site (KBS LTER).
KBS LTER results illustrate a number of opportunities to manage agricultural N in
ways that improve N conservation and reduce the escape of fixed N to the environment; they also reveal needs for future research to fill knowledge gaps and more
fully document the complex cycling of N in cropping systems that range from conventional to organic and from annual to perennial.
© Oxford University Press 2015
213
214 Ecology of Agricultural Ecosystems
The Agricultural Nitrogen Cycle
A comprehensive understanding of the agricultural N cycle requires knowledge of
the transfers (movement) of N into and out of the soil–plant system (e.g., precipitation, gas exchange, leaching) as well as the exchange of N between compartments
within the system (e.g., biological assimilation and release). Transformations in the
chemical form of N, often mediated by microbes, determine the availability and
mobility of N in soils and water.
Nitrogen Inputs and Outputs
1
New N is added to cropping systems through biological N fixation, N deposition,
and the application of compost, manure, and synthetic fertilizers (Fig. 9.1). In any
cropping system, to remain sustainable, the amount of N added must replace the
N removed in crop yield and in environmental losses. The amount of N removed
with crop harvest varies widely, largely as a function of crop species and growing
conditions. In high-yielding annual grain systems, 100–270 kg N ha−1 are typically
removed during harvest (Robertson 1997).
In annual cropping systems of the KBS LTER Main Cropping System Experiment
(MCSE; Table 9.1), average harvest N removals range from 34 kg N ha−1 yr−1 by winter
wheat (Triticum aestivum L.) in the Biologically Based system to 163 kg N ha−1 yr−1
by soybean in the No-till system (Table 9.2). Among perennial crops, Poplar (Populus
spp.) harvest removes only 107 kg N ha−1 after 10 years of growth, or an annualized average of 10.7 kg N ha−1 yr−1, whereas alfalfa harvest removes 215 kg N ha−1
yr−1. The Early Successional system is not harvested but with each annual burn loses
[NOx]
[N2], [N2O]
Denitrificatio
n
Harvest-N
Plant-N
Fire
[N2]
N fixatio n
H a r ve s t
Grazing
u pta k e
nt N
nt N
Microbial-N
m m o b i z at i o n
il
Pl a
Ni
E
Nm
Sediment-N
Pl a
ro
sio
n
M a n u re
uptak
Soil organic-N
e
Cell death
Animal-N
in
er
a li
za
t io
n
Fertilizer-N
Precipitation-N
[N2O]
+
NH4
n
Fertilizatio
ion
N deposit
-
Nitrification
NO3
Leach
i
ng
tion
tiliza
Fer eposition
d
N
Groundwater-N
Figure 9.1. Schematic representation of the major elements of the terrestrial nitrogen (N)
cycle. Processes mediated by soil microbes appear in bold, and gases appear in brackets.
Redrawn from Robertson and Groffman (2015) with permission from Elsevier Limited.
Nitrogen Transfers and Transformations 215
Table 9.1. Description of the KBS LTER Main Cropping System Experiment (MCSE).a
Cropping
System/Community
Dominant Growth Form Management
Annual Cropping Systems
Herbaceous annual
Prevailing norm for tilled corn–soybean–winter
wheat (c–s–w) rotation; standard chemical inputs,
chisel-plowed, no cover crops, no manure or compost
No-till (T2)
Herbaceous annual
Prevailing norm for no-till c–s–w rotation;
standard chemical inputs, permanent no-till, no
cover crops, no manure or compost
Reduced Input (T3)
Herbaceous annual
Biologically based c–s–w rotation managed to
reduce synthetic chemical inputs; chisel-plowed,
winter cover crop of red clover or annual rye, no
manure or compost
Biologically Based (T4)
Herbaceous annual
Biologically based c–s–w rotation managed
without synthetic chemical inputs; chisel-plowed,
mechanical weed control, winter cover crop of
red clover or annual rye, no manure or compost;
certified organic
1
Conventional (T1)
Perennial Cropping Systems
Alfalfa (T6)
Poplar (T5)
Coniferous Forest (CF)
Herbaceous perennial
5- to 6-year rotation with winter wheat as a
1-year break crop
Woody perennial
Hybrid poplar trees on a ca. 10-year harvest
cycle, either replanted or coppiced after harvest
Woody perennial
Planted conifers periodically thinned
Successional and Reference Communities
Early Successional (T7)
Herbaceous perennial
Historically tilled cropland abandoned in 1988;
unmanaged but for annual spring burn to control
woody species
Mown Grassland (never
tilled) (T8)
Herbaceous perennial
Cleared woodlot (late 1950s) never tilled,
unmanaged but for annual fall mowing to control
woody species
Mid-successional (SF)
Herbaceous annual +
woody perennial
Historically tilled cropland abandoned ca. 1955;
unmanaged, with regrowth in transition to forest
Deciduous Forest (DF)
Woody perennial
Late successional native forest never cleared
(two sites) or logged once ca. 1900 (one site);
unmanaged
Site codes that have been used throughout the project’s history are given in parentheses. Systems T1–T7 are
replicated within the LTER main site; others are replicated in the surrounding landscape. For further details, see
Robertson and Hamilton (2015, Chapter 1 in this volume).
a
~41 kg N ha−1 to the atmosphere. These N removals represent the minimum amount
of N that must be replaced annually to avoid N depletion—the minimum because not
included are additional N losses by other pathways such as leaching and denitrification
(Fig. 9.1). Although a small amount of N is added as deposition (see Nitrogen
Deposition below), most N is replaced by either biological or industrial fixation of
atmospheric N2 or by application of organic N fertilizers such as compost or manure.
216 Ecology of Agricultural Ecosystems
Table 9.2. Nitrogen (kg N ha−1 yr−1) contained in crop components and removed
in harvest of MCSE systems.a
Component
MCSE System
Annual Cropsb
Conventional
No-Till
Reduced
Input
Biologically
Based
Perennial Crops
Successional
Alfalfac Poplard
Early
Successionale
Grain
84
88
80
61
Stover
22
f
26
f
25
f
18f
Grain
138
163
151
148
Stover
21f
21f
19f
18f
Grain
61
66
57
34
Straw
9
10
10f
6f
1
Corn
109
96
81
Soybean
Wheat
Harvested Ng
97
215
11
41
Mean, n = 6 replicated plots.
Crop N in different components calculated as biomass × N content. Values are the average annual N amount in each
crop component over 18 years (1993–2010), covering six 3-year rotations of the annual cropping systems.
c
Annual N in alfalfa calculated as the sum of N harvested annually and averaged over 1993–2010 (15 years with crop
present).
d
N removed in aboveground woody biomass at clear-cut harvest of 1999 (107 kg N ha-1) divided by the number of
growth years (10; 1989–1998).
e
N in aboveground biomass volatilized by burning and calculated from aggregated postfrost aboveground biomass
and surface litter.
f
Not harvested (left on soil surface).
g
N removed at harvest of annual crops (corn–soybean–wheat) determined as the annual sums of N removed in grain
(corn, soybean, and wheat) plus harvested straw for wheat as noted, averaged over 18 years (1993–2010) covering
six 3-year rotations. N removed in wheat straw is based on the straw N content and the ratio of grain to aboveground
biomass at peak biomass.
a
b
Nitrogen Fertilizers
In 1900 agriculture used very little inorganic N fertilizer, with less than 0.5 Tg of
N applied to crops worldwide, mainly as nitrate from Chile and as ammonium sulfate derived from coke-oven gas. The Haber–Bosch process—the production of
ammonia from its constituent elements N2 and H2—was industrialized by 1913 in
Germany (Leigh 2004). Global ammonia production was ~2.4 Tg yr−1 N in 1946 and
today is ~133 Tg yr−1, most of which is used to make N fertilizers (Kramer 2004).
Synthetic or industrially fixed N differs from organic N sources in that most
synthetic N is immediately available for plant uptake, whereas most organic N
must first be mineralized to NH4+ and then nitrified to NO3− (see Internal Nitrogen
Transformations below) before it is available to plants (Robertson and Vitousek
2009). In the United States, synthetic fertilizer accounts for ~60% of the total
N added to agricultural land; legume N fixation and manure make up most of
Nitrogen Transfers and Transformations 217
1
the rest (IPNI 2012). In North America, most synthetic fertilizer N is applied
as anhydrous ammonia (27% of inputs), urea ammonium nitrate (24%), or urea
(23%) (IFA 2011).
Synthetic fertilizers used in the MCSE include different combinations of ammonium nitrate (applied in N–P–K formulations) and urea ammonium nitrate (UAN)
(Table 9.3). Rates of N application in the Conventional and No-till systems have
ranged from 112–163 kg N ha−1 yr−1 for corn (Zea mays L.) and from 56–90 kg N
ha−1 yr−1 for winter wheat. The Reduced Input system receives ~one-third of the
synthetic inputs of the Conventional system (Table 9.3). No synthetic N fertilizer
is applied to the Biologically Based system or to soybean and Alfalfa (Medicago
sativa L.), and no system receives manure or other organic N forms. Poplars receive
between ~120 to 160 kg N ha−1 at or shortly after planting.
Decisions about N fertilizer rates in MCSE annual crops are guided by MSU
Extension recommendations as well as past practice and best judgment. Prior
to 2008, Extension recommendations for the Conventional and No-till corn and
wheat rotations were based on the yield goal approach (Warncke et al. 2004),
which calculates base rates from past yields and projected yield increases. Since
2008 recommendations for corn have been based on the Maximum Return to
Nitrogen approach (MRTN; Warncke et al. 2009), now used by seven U.S. Corn
Belt states including Michigan (ISU 2004). For MRTN, N is applied on the basis
of statewide N response trials weighted by the price of fertilizer and corn to provide an economically optimized N rate. In 2011 we applied 156 kg N ha−1 to the
Conventional and No-till corn in the MCSE. This is very close to the Economic
Optimum Nitrogen Rate (EONR) of 155 kg N ha−1 based on 5-year average
corn yields for different N-fertilizer levels in the adjacent Resource Gradient
Experiment (Fig. 9.2; Robertson and Hamilton 2015, Chapter 1 in this volume).
For wheat, a yield goal approach still guides N rate recommendations; in 2010
we applied 89 kg N ha−1 to wheat, which exceeded the EONR rate of 68 kg
N ha−1 based on the average yields (2007 and 2010) for wheat in the Resource
Gradient Experiment (Fig. 9.2). The EONR is always less than the agronomic
maximum nitrogen rate, the rate at which agronomic yields are maximized (Fig
9.2), because at some point the cost of additional N fertilizer is greater than the
income provided by more yield.
Over the 1993 to 2010 period, corn in the Conventional and No-till systems
received 141 kg N ha−1 yr−1, on average. This value is close to the statewide and
national averages of 134 and 149 kg N ha−1 yr−1 for the same period (NASS 2014).
For wheat over this period, we added 76 kg N ha−1 yr−1, on average, ~29% lower
than the average N rate applied to wheat in Michigan (107 kg N ha−1 yr−1) between
2004 and 2009, but very close to the national average (75 kg N ha−1 yr−1) for the
same period (NASS 2014).
Nitrogen Fixation
Approximately 78% of the atmosphere is composed of dinitrogen gas (N2), which
is unusable by most organisms because of the strong triple bond between two
Table 9.3. Nitrogen fertilizer application rates (kg N ha−1 yr−1) and cover crops in the
MCSE annual cropping systems (1989–2010).
Year
Crop(s)a
Conventional
No-till
Reduced Input
Biologically
Based
Rate (Formulation; Timing)b
Rate (Formulation;
Timing)b + Cover Cropc
Cover Cropc
1989
Corn1 or
wheat2
123 (34-0-0; Sd) 123 (34-0-0; Sd)
28 (34-0-0) + RC
RC
1990
Soybean1 or
corn2
0
28 (34-0-0) + CC
CC
1991
Corn1 or
soybean2
123 (34-0-0; Sd) 123 (34-0-0; Sd)
0
0
1992
Soybean1 or
wheat2
0
0
28 (34-0-0) + RC
RC
1993
Corn
28 (UAN; Pl)
84 (34-0-0; Sd)
28 (UAN; Pl)
84 (34-0-0; Sd)
28 (UAN; Pl) + CC
CC
0
Soybean
0
0
0
0
Wheat
56 (34-0-0)
56 (34-0-0)
28 (34-0-0) + RC
RC
1996
Corn
28 (UAN; Pl)
28 (UAN; Pl)
135 (34-0-0; Sd) 135 (34-0-0; Sd)
28 (UAN; Pl) + CC
CC
1
1994
1995
1997
Soybean
0
0
0
0
1998
Wheat
56/(34-0-0)
56 (34-0-0)
28 (34-0-0) + RC
RC
1999
Corn
28 (UAN; Pl)
87 (34-0-0; Sd)
28 (UAN; Pl)
87 (34-0-0; Sd)
28 (UAN; Pl) + CC
CC
2000
Soybean
0
0
0
0
2001
Wheat
78 (UAN; split)
78 (UAN; split)
47 (UAN) + RC
RC
2002
Corn
30 (19-17-0; Pl)
125 (UAN; Sd)
30 (19-17-0; Pl)
125 (UAN; Sd)
30 (19-17-0; Pl) + RC
RC
2003
Soybean
0
0
0
0
2004
Wheat
36 (19-19-19; Pl) 36 (19-19-19; Pl)
54 (UAN; Sd)
54 (UAN; Sd)
54 (UAN; Sd) + RC
RC
2005
Corn
34 (19-17-0)Pl
123 (UAN)Sd
34 (19-17-0)Pl
123 (UAN)Sd
34 (19-17-0; Pl) + RC
RC
0
2006
Soybean
0
0
0
2007
Wheat
35 (19-19-19; Pl) 35 (19-17-0; Pl)
54 (UAN; Sd)
54 (UAN; Sd)
54 (UAN; Sd) + RC
RC
2008
Corn
33 (19-17-0; Pl)
113 (UAN; Sd)
33 (19-17-0; Pl) + RC
RC
33 (19-17-0; Pl)
113 (UAN; Sd)
2009
Soybean
0
0
0
0
2010
Wheat
89 (UAN; split)
89 (UAN; split)
50 (UAN) + RC
RC
From 1989 to 1992, different crops were grown in the Conventional and No-till systems (denoted as superscript 1) than
in the Reduced Input and Biologically Based systems (denoted as superscript 2).
b
Nitrogen was applied as ammonium nitrate (N–P–K content: 34-0-0, or 19-17-0, or 19-19-19) and urea ammonium
nitrate (UAN; 28% N) at planting (Pl) and/or as a side-dressing (Sd). For wheat, a split application of UAN was applied
in some years.
c
Cover crops were red clover (RC, Trifolium pratense L.) and crimson clover (CC, Trifolium incarnatum L.) which are
grown prior to corn and plowed under before planting in spring. Wilke (2010; Table 14) estimated aboveground N in red
clover at spring harvest as 67 and 59 kg N ha−1 in the Reduced Input and Biologically Based systems, respectively. No
data available for crimson clover.
a
1
Nitrogen Transfers and Transformations 219
Figure 9.2. Yield responses to incremental increases in synthetic N fertilization rate in corn
and winter wheat at the KBS LTER Resource Gradient Experiment. Economic Optimum
Nitrogen Rates (EONR; dashed lines) were calculated as the weighted mean of four yield
response curves (quadratic, quadratic-plateau, linear-plateau, and spherical) using the
International Plant Nutrition Institute Crop Nutrient Response Tool (CNRT) v4.5; http://
nane.ipni.net/article/NANE-3068). The EONRs for rainfed and irrigated corn are based on
average yields for the 2003, 2004, 2005, 2008, and 2011 crop years, and EONRs for rainfed
and irrigated wheat are based on average yields for the 2007 and 2010 crop years. The agronomic optimum nitrogen rates (AONR) were 191 and 198 kg N ha–1 for rainfed and irrigated
corn, respectively, and for rainfed and irrigated wheat, 94 and 108 kg ha–1, respectively (not
shown for clarity).
N atoms. Biological N fixation (BNF) is the dominant process by which this N
becomes reactive:
N2 + 8 H+ + 6 e− → 2 NH3 + H2
Most BNF is carried out by bacteria possessing the nitrogenase enzyme, and in terrestrial ecosystems most BNF is plant-associated (Vitousek et al. 2013).
Plant-mediated N fixation is largely facultative: where soil N is readily available, plants allocate less fixed carbon (C) to BNF bacteria and less N is fixed. Thus,
fixation rates can vary widely even within the same crop species. Soybeans when
N-fertilized, for example, fix very little N, but when grown in infertile soil without
added N, they can fix 98% of a 200 kg ha−1 N requirement (Ruschel et al. 1979).
In the MCSE Conventional system, soybeans fix 56–58% of their aboveground
N needs based on 15N natural abundance experiments (Gelfand and Robertson, in
220 Ecology of Agricultural Ecosystems
press), or 92 kg N ha−1 yr−1 (Table 9.4). This percentage agrees closely with recent
reviews (Herridge et al. 2008, Salvagiotti et al. 2008).
Cover crops are a second major source of BNF in the MCSE Reduced Input
and Biologically Based systems (Table 9.4). Wilke (2010), based on 15N natural
abundance, estimated that BNF in red clover accounted for 55 and 72% of its total
aboveground N in these respective systems. BNF in the successional communities
of the MCSE has not been measured but based on legume biomass, and N content
is likely ~10 kg N ha−1 yr−1 in the Early Successional community and negligible in
the Mid-successional system. No more than 7 kg N ha−1 yr−1 is likely fixed in the
mature Deciduous Forest system (Cleveland et al. 1999).
Nitrogen Deposition
1
Nitrogen oxides (NO and NO2, referred to as NOx) are emitted from industrial
combustion and other sources, including agricultural soils. Oxidation of NOx
results in increased atmospheric N deposition to ecosystems, which in turn causes
higher regional watershed N fluxes (e.g., Jaworski et al. 1997), increased soil N2O
Table 9.4. Biological N fixation (BNF) by legumes, aboveground N, and percentage
of aboveground N derived from BNF in annually harvested MCSE systems.a
Variable
Annual Crops
Conventional No-Till
Reduced
Input
Perennial Cropsd
Biologically
Based
Alfalfa
Legume aboveground N (kg N ha−1 yr−1)b
Soybean
159
184
Red clover
Alfalfa
Total aboveground N (kg N ha−1)c
170
166
56
63
215
342
383
398
341
92
107
99
96
31
45
215
BNF (kg N ha yr )
−1
−1 b
Soybeane
Red cloverf
Alfalfa
157
g
Aboveground N met by BNF (%)
27
28
33
41
73
Mean, n = 6 replicated plots (SE not shown).
N in legume aboveground biomass and N from BNF per year (de facto per 3-year rotation for soybean and red
clover) for each N-fixing crop (as described below) averaged over six rotations (1993–2010).
c
N in grain and stover/straw of corn, soybean, and wheat plus N in harvests of the cover crops red clover (1995–2008)
and cereal rye (2006–2009) per 3-year rotation averaged over six rotations (1993–2010).
d
For alfalfa, legume aboveground N, total aboveground N, and N from BNF determined per year averaged over
1993–2010 (15 years with crop present).
e
BNF of soybean estimated as 58% of the total aboveground N uptake (Gelfand and Robertson, in press; Salvagiotti
et al. 2008).
f
BNF of red clover estimated from the percentage of BNF-derived N (55 and 72% for Reduced Input and Biologically
Based systems, respectively; average of fall 2007 and spring 2008 harvest data from Wilke 2010; Figure 9).
g
BNF of alfalfa estimated as 73% of the total aboveground N uptake (Yang et al. 2010).
a
b
Nitrogen Transfers and Transformations 221
1
emissions (Butterbach-Bahl et al. 2002, Ambus and Robertson 2006), and changes
in species composition (Bobbink et al. 1998, 2010). Chronic increases in atmospheric N deposition have been shown to decrease plant species diversity even at
moderate levels (e.g., 10 kg N ha−1 yr−1; Stevens et al. 2004, Clark and Tilman
2008). In agricultural systems, N deposition could be considered a free fertilizer
input and, in locations where deposition is high, may need to be considered when
making fertilizer N recommendations.
Between 1989 and 2010, KBS received, on average, 6.3 ± 1.3 kg N ha−1 yr−1
via wet precipitation (NH4 + NO3; NADP/NTN 2011). At sites in Michigan, dry
deposition of N (HNO3 + NO3 + NH4) between 1989 and 2010 was ~one-third that
of wet N deposition (CASTNET 2011). Using this ratio, an annual average total N
deposition (wet and dry) at KBS during this period was ~8.4 kg N ha−1 yr−1. This
estimate is lower than the earlier estimate of 14.2 kg N ha−1 yr−1 by Rheaume (1990)
for Kalamazoo County between 1986–1987. The declining trend for wet deposition of NO3− at KBS (Fig. 9.3) is likely due to the drop in NOx emissions following
adoption of air-quality regulations and emission-control technologies (Greaver et
al. 2012; Hamilton 2015, Chapter 11 in this volume).
Nitrogen fertilizer rates for wheat and corn at the MCSE are ~10 to 15 times
higher than atmospheric N deposition levels, so N deposition has little impact in
these systems. In the successional and forested systems, however, the present rate
of atmospheric N deposition represents a 2- to 3-fold increase over preindustrial
levels and likely has profound ecological effects in these N-limited ecosystems
(Galloway et al. 2004, Dentener et al. 2006).
Figure 9.3. Wet nitrogen (NH4–N, NO3–N) and total wet nitrogen ([NH4 + NO3]–N) deposition (kg N ha–1 yr–1) at KBS for 1989–2010. Data from NADP/NTN (2011).
222 Ecology of Agricultural Ecosystems
Internal Nitrogen Transformations
Microbial activity mediates the major N transformations within the ecosystem,
including mineralization, immobilization, nitrification, and denitrification (Fig. 9.1).
Mineralization and Immobilization
1
Nitrogen mineralization is the conversion of organic N to soluble inorganic forms
that can be taken up by plants and other microbes (Robertson and Groffman 2015).
If plant residues are rich in N, microbes release inorganic N in excess of their needs
to the soil solution. Nitrogen immobilization is the uptake of N by soil microbes—
the reverse of mineralization. If plant residues are low in N, microbes scavenge
additional soluble N from their surroundings, immobilizing it in microbial biomass.
In soil, both processes occur simultaneously, and the balance is known as net mineralization. When net mineralization is positive, inorganic N is added to the soil
solution; when net mineralization is negative, inorganic N is removed from the soil
solution.
At the MCSE, net N mineralization over the growing season (April to October)
is greater in the Reduced Input and Biologically Based systems (178 and 163 kg N
ha−1) than in the Conventional and No-till systems (99 and 113 kg N ha−1), respectively (Table 9.5; Robertson et al. 2000). Higher rates reflect the build-up of mineralizable N and soil organic matter (Syswerda et al. 2011) in these cover-cropped
systems and, in particular, the importance of leguminous cover crops in providing
inorganic N to the subsequent primary crop (Sánchez et al. 2001). The cover crop
effect is also seen in the N content of soils—inorganic N concentrations are about
as high in the Reduced Input and Biologically Based systems as they are in the fully
fertilized Conventional and No-till systems (Fig. 9.4). Moreover, N appears to be
more available, especially as nitrate, from June through August (Fig. 9.5), the portion of the growing season when plant uptake is greatest.
Among the perennial crops, net N mineralization between April and October
(Table 9.5) is slightly higher in Alfalfa (192 kg N ha−1) than in the annual cropping
systems with legume cover crops, but considerably lower in Poplar (62 kg N ha−1).
Low N mineralization in Poplar may reflect this system’s lower quality (higher
C:N ratio) leaf litter, and is associated with low soil inorganic N pools (Figs. 9.4
and 9.5). Among the successional systems, net N mineralization generally followed the pattern Deciduous Forest > Mid-successional > Early Successional
> Mown Grassland (never tilled) (Table 9.5). Net N immobilization appears to
only occur in the Mown Grassland (never tilled) system and only during July and
August (Fig. 9.6).
Total soil N contents of the A/Ap horizon of the Mown Grassland (never tilled)
system (5.95 Mg N ha−1) and the late successional Deciduous Forest (5.33 Mg N
ha−1) represent indigenous (precultivation) soil N, and are about 50–65% higher
than total soil N in the annual cropping systems (~3.6 Mg N ha−1; Table 9.5). This
difference reflects the loss of soil organic N due to a century or more of cultivation, which accelerated the mineralization of soil organic matter (Paul et al. 2015,
Chapter 5 in this volume) and subsequent N loss by various pathways—including
Nitrogen Transfers and Transformations 223
Table 9.5. Mean total soil N content, relative nitrification rate, and net N
mineralization rate during the growing season in the A/Ap horizon of MCSE soils.a
System
Total Nb
(g kg soil−1)
(Mg ha−1)
Relative
Net N Mineralization
Nitrificationc (%) Rated (kg ha−1 season−1)
Annual Cropping Systems
Conventional
1.12
3.58
79
99
No-till
1.21
3.63
76
113
Reduced Input
1.24
3.72
80
178
Biologically Based
1.17
3.51
79
163
Poplar
1.17
3.28
32
62
Alfalfa
1.35
4.05
75
192
Na
na
60
na
3.90
42
90
Perennial Cropping Systems
Coniferous Forest
Successional and Reference Communities
Early
1.30
2.48
5.95
28
27
1.36
4.08
31
113
Deciduous Forest
2.05
5.33
72
137
1
Mown Grassland
Mid-successional
n = 6 plots for all systems, except Mown Grassland (n = 4) and the Mid-successional, Coniferous, and Deciduous
Forest systems (n = 3). na = not available.
b
Calculated from Syswerda et al. (2011).
c
Percentage of net mineralizable N as nitrate at the end of in situ incubations averaged over 18 years (1993–2010),
covering six 3-year rotations of the annual cropping systems (Robertson et al. 1999).
d
Determined by extrapolation of daily net N mineralization rates (modified from Robertson et al. 2000, Table 1) over
the growing season (April to October, 1989–1995).
a
harvest, which removes ~0.1 Mg ha−1 yr−1 from cropped systems (Table 9.2). The
proportion of total N in the A/Ap horizon that is mineralized each year ranges from
0.5% (Mown Grassland never tilled system) to 4.8% (Reduced Input system; calculated from Table 9.5), which is consistent with values reported for cropping systems
elsewhere in the U.S. North Central Region (Cassman et al. 2002).
Temporal and spatial patterns in rates of net N mineralization with respect
to crop N requirements largely determine the degree of N synchrony within the
system (Robertson 1997). Where N mineralization is asynchronous with plant
growth—as might happen, for example, when N mineralization occurs largely
in the spring prior to crop growth or in the fall after plant senescence—the mineralized N will be susceptible to loss. Such asynchrony is unfortunately a normal situation for annual row-crop production in temperate climates. Managing
the system to maximize synchrony is an important strategy for conserving N in
cropping systems (e.g., McSwiney et al. 2010). Synthetic fertilizers owe their
effectiveness to adding a large pulse of available N to soil just as crops enter
their prime growth phase. Reproducing this pulse with biological management
is an extraordinary challenge, although evidence from the Reduced Input and
1
224 Ecology of Agricultural Ecosystems
Figure 9.4. Soil inorganic N pools of nitrate and ammonium (µg N g soil-1) in MCSE systems for 1993–2010. Mean ± SE for all measurements during the period.
Biologically Based systems suggests that the leguminous cover crop may provide much of this timely input (Fig. 9.5). Residue placement can also better
ensure the timely mineralization of N from soil organic matter (Loecke and
Robertson 2009).
Manipulating N mineralization offers a primary opportunity to improve N synchrony. Particulate organic matter (POM) measurements could be used to estimate
N mineralization if combined with information about the previous year’s crop and
cover crop production (Willson et al. 2001). Permanganate Oxidizable Carbon
(POXC) has also been shown to be a quick and inexpensive assay for assessing
management changes associated with changes in the labile C pool, which can
reflect key processes such as N mineralization (Culman et al. 2012).
Nitrification
Autotrophic nitrification is the microbial oxidation of NH4+ to nitrite (NO2−) by
ammonia oxidizers and then to nitrate (NO3−) by nitrite oxidizers (Robertson
and Groffman 2015). In most soils, the NO2− produced rarely accumulates as it
is quickly oxidized to NO3−. Nitrification can also produce the gas nitric oxide
(NO) as a by-product of the chemical breakdown of hydroxylamine (NH2OH) during NH3 oxidation, and, when oxygen (O2) is limiting, produce both NO and N2O
1
Nitrogen Transfers and Transformations 225
Figure 9.5. Monthly A) ammonium and B) nitrate concentrations (µg N g soil–1) in MCSE
systems for 1989–1995. Mean ± SE for all measurements within each month.
via NO2− reduction—effectively becoming denitrifying nitrifiers (Zhu et al. 2013,
Robertson and Groffman 2015).
Phillips et al. (2000a) found larger populations of nitrifiers in the MCSE
Conventional and No-till systems than in the Poplar and Early Successional systems, likely due to N fertilizer addition. However, nitrifier abundance, even when
high, still constitutes a relatively small proportion of the total microbial population. Phillips et al. (2000b) found no detectable differences in the species composition of ammonia oxidizers in these systems—all were dominated by members of
1
226 Ecology of Agricultural Ecosystems
Figure 9.6. Net N mineralization rates (μg N g soil–1 day–1) during the growing season
(April to October) in the MCSE systems for 1989–1995 (except no data 1991). Mean ± SE
for all measurements within each month.
Nitrosospira cluster 3. On the other hand, Bruns et al. (1999) did find more, but less
diverse, culturable ammonia oxidizers (also Nitrosospira) in Conventional system
soils than in Early Successional or Mown Grassland (never tilled) systems. The
recent discovery of Archaeal nitrifiers and their likely prevalence in many soils
promises to transform our community-level understanding of nitrifiers at the KBS
LTER as elsewhere (Robertson and Groffman 2015).
In most aerated soils, nitrification is controlled primarily by factors that affect
NH4+ availability and rates can be inferred by measuring changes in NH4+ and
NO3− in soil incubations. In most soil incubations, where plant uptake and leaching
losses are excluded, much of the mineralized N typically ends up as NO3− rather
than NH4+ (Robertson and Groffman 2015). In all annual cropping systems as well
as the Alfalfa and Deciduous Forest systems, the proportion of net mineralized N
that exists as NO3− at the end of the incubation—here called relative nitrification
(Robertson et al. 1999)—is high (70–80%, Table 9.5), indicating rapid nitrification of NH4+ as it is formed during mineralization. In contrast, relative nitrification
is low (28–42%) in the Poplar, Early Successional, Mid-successional, and Mown
Grassland (never tilled) systems. Low relative nitrification may reflect edaphic,
plant, or other conditions that affect nitrifier communities or otherwise delay
nitrification.
Nitrification is typically rapid in cultivated soils and may be regarded as a gateway to N loss (Robertson 1982); only after NH4+ is transformed into NO3− is N
readily lost from most ecosystems. Nitrate can be quickly leached from soils and
also serves as the substrate for denitrification, which produces the gases N2 and N2O.
Nitrogen Transfers and Transformations 227
Nitrogen Loss from Cropping Systems
Hydrologic Losses and Fate
1
A significant amount of the N fertilizer applied to cultivated crops is lost in agricultural drainage waters, primarily as highly mobile NO3−. Other forms of reactive N in
the soil solution (e.g., NH4+, dissolved organic nitrogen [DON]) are typically present in such small quantities that they are unimportant sources of N loss, even in fertilized soils (Hamilton 2015, Chapter 11 in this volume; cf. van Kessel et al. 2009).
Syswerda et al. (2012) estimated NO3− leaching losses from MCSE systems by
combining measured NO3− concentrations in water draining the root zone (sampled
at 1.2-m depth) with modeled rates of water loss. Nitrate losses varied with tillage
and the intensity of management inputs. Among the annual cropping systems, average annual losses followed the order Conventional (62.3 ± 9.5 kg N ha−1 yr−1) >
No-till (41.3 ± 3.0) > Reduced Input (24.3 ± 0.7) > Biologically Based (19.0 ± 0.8)
management. Among the perennial and unmanaged ecosystems, NO3− losses followed the order Alfalfa (12.8 ± 1.8 kg N ha−1 yr−1) = Deciduous Forest (11.0 ± 4.2)
>> Early Successional (1.1 ± 0.4) = Mid-successional (0.9 ± 0.4) > Poplar (<0.01 ±
0.007 kg N ha−1 yr−1) systems (Fig. 9.7).
Figure 9.7. Nitrate leaching losses (kg NO3-–N ha-1 yr-1) in MCSE systems for 1995–2006.
Mean ± SE (n = 3 replicate locations). Modified from Syswerda et al. (2012).
228 Ecology of Agricultural Ecosystems
1
These patterns suggest the potential for management intervention to significantly reduce NO3− leaching from cropping systems: (1) compared to conventional
management, no-till cultivation reduced NO3− losses by 33%; (2) the incorporation of cover crops as a substitute for N fertilizer reduced losses by 60–70%;
and (3) substituting perennial crops (alfalfa and hybrid poplars) for annual crops
reduced losses by 80–100%. In annual crops, most NO3− loss takes place during
periods when plants are absent—the fall and spring for those systems without cover
crops (e.g., Syswerda et al. 2012). Management to conserve NO3− might thus be
best focused on reducing losses during these periods.
Nitrate lost to groundwater is later discharged from seeps, springs, and drains
into streams and rivers (Mueller and Helsel 1996, Crumpton et al. 2008), where it
can be further transformed or transported to lakes, estuaries, and marine systems
(Howarth et al. 1996, Alexander et al. 2000). In the U.S. Corn Belt, NO3− concentrations in ground and surface waters often exceed the 10 mg N L−1 maximum contaminant level for drinking water set by the U.S. Environmental Protection Agency
(Jaynes et al. 1999, Mitchell et al. 2000).
Much of the NO3− entering wetlands and small headwater streams is likely to be
transformed to the inert N2 form (Hamilton 2015, Chapter 11 in this volume), albeit
with some production and emission of N2O (Paludan and Blicher-Mathiesen 1996,
Stadmark and Leonardson 2005, Beaulieu et al. 2011). Nitrate concentrations in
headwater streams often limit denitrification (Inwood et al. 2005) and are the best
predictor of N2O emissions rates from streams around KBS (Beaulieu et al. 2008).
On an areal basis, these streams have higher N2O emission rates (on average, 35.2
μg N2O-N m−2 hr−1; Beaulieu et al. 2008) than annual crops of the MCSE (on average, 14.5 μg N2O-N m−2 hr−1; Robertson et al. 2000), though their regional contribution is small because of a much smaller areal extent.
Losses via denitrification can be extremely high at the interface where emerging groundwater enters surface water bodies (e.g., Cooper 1990, Whitmire and
Hamilton 2005) as well as along subsurface flow paths (e.g., Pinay et al. 1995). In
a headwater stream at KBS, Hedin et al. (1998) and Ostrom et al. (2002) showed
that substantial amounts of NO3− are removed from flow paths prior to stream entry
when sufficient dissolved organic carbon (DOC) is available to support denitrification. Subsurface N chemistry and δ15N natural abundance analyses suggest that a
narrow near-stream region is functionally the most important location for denitrifier
NO3− consumption. These studies suggest that managing these areas to provide sufficient DOC—for example, by planting perennial vegetation streamside—could be
an effective mitigation strategy for reducing the impact of leached NO3− on aquatic
systems.
Denitrification
Denitrification is the stepwise reduction of soil NO3− to the N gases NO, N2O,
and N2. Four denitrification enzymes—nitrate reductase (Nar), nitrite reductase
(Nir), nitric oxide reductase (Nor), and nitrous oxide reductase (Nos)—are usually
induced sequentially under anaerobic conditions (Tiedje 1994, Robertson 2000). A
wide variety of mostly heterotrophic bacteria can denitrify (Schmidt and Waldron
Nitrogen Transfers and Transformations 229
1
2015, Chapter 6 in this volume), using NO3− rather than O2 as a terminal electron
acceptor during respiration when O2 is in short supply.
In well-aerated soils, denitrification mainly occurs within soil aggregates and particles of organic matter, where O2 is depleted because its consumption by microbial
activity is faster than its replacement by diffusion (Sexstone et al. 1985). Other factors can also be important, including denitrifier community composition (Schmidt
and Waldron 2015, Chapter 6 in this volume). Cavigelli and Robertson (2000, 2001),
for example, found numerically dominant denitrifying taxa in MCSE Conventional
system soils that were absent in Mown Grassland (never tilled) soils, and vice versa.
They also found that taxa differed in the sensitivities of their Nos enzymes to O2,
and thus in their abilities to reduce N2O to N2 under identical C, NO3−, and O2 conditions (Fig. 9.8). This study provided an early example of the importance of microbial diversity for ecosystem function, which has subsequently become an important
research topic (Schmidt and Waldron 2015, Chapter 6 in this volume).
Denitrification in normally unsaturated soils is highly episodic, occurring primarily after wetting events that create anoxic microsites in soil layers where NO3−
and labile C are abundant. Because denitrifying enzymes are induced sequentially,
there can be a lag period just after wetting when N2O is a dominant end product
(Robertson 2000). Bergsma et al. (2002), for example, used 15N tracers at KBS to
show that in soils from the Conventional system, the N2O mole fraction ((N2O/[N2O +
N2]) after a wetting event depended on whether or not the soils had been wetted
Relative Rate of N2O Production
(ΔN2O/Δ[N2O + N2])
1.0
0.8
Conventional, pH 5.7
0.6
Conventional, pH 6.6 (Native)
Mown Grassland, pH 5.7
Mown Grassland, pH 6.9 (Native)
0.4
0.2
0
0
0.05
0.10
0.15
Oxygen Added (mL)
Figure 9.8. N2O as a proportion of total N gas production (N2O / [N2O + N2]) at four oxygen
and two pH levels (native and adjusted) for soil from the Conventional and Mown Grassland
(never tilled) MCSE systems. Mean ± SE (n = 3 for Conventional; n = 2 for Mown Grassland
systems). Redrawn from Cavigelli et al. (2000) with permission of the Ecological Society of
America; permission conveyed through Copyright Clearance Center, Inc.
230 Ecology of Agricultural Ecosystems
1
2 days prior to the measurement period, which considerably reduced the proportion
of N2O emitted, vs. immediately prior to measurement. In contrast, prior wetting
had no effect on the mole fraction in the Early Successional system—further illustrating presumed differences in denitrifier communities.
Measuring denitrification rates in the field is difficult (Groffman et al. 2006).
Fluxes of N2 cannot be assessed directly because the comparatively small amount
of N2 produced by denitrification cannot be readily differentiated from the very
large atmospheric background. Consequently, we must rely on inference from laboratory incubations (e.g., Robertson and Tiedje 1985, Weier et al. 1993) or mass
balance techniques where denitrification rates are assumed to be the difference
between total N inputs (e.g., N fixation, fertilization, and deposition) and measurable outputs (e.g., leaching, harvest, and erosion).
In a novel approach to directly measure denitrification in situ, Bergsma et al.
(2001) used an 15N-gas nonequilibrium technique to measure simultaneous fluxes
of N2O and N2 from an MCSE soil planted to winter wheat. The N2O mole fraction
ranged from <0.004 to 0.14, with an average of 0.008 ± 0.004 when both gases were
above the detection limit, showing that N2O production is only a small fraction of
total N gas production (N2O + N2). If generalizable, this suggests that N2 emissions
from U.S. Midwest row crops may, on average, be substantially greater than N2O
emissions. If so, then extrapolation suggests that total losses of N from denitrification in these systems are of similar importance to the hydrologic losses discussed
earlier (Fig. 9.7). Although similar findings have been estimated from mass balance
approaches elsewhere (e.g., Gentry et al. 2009), N losses from denitrification in
KBS LTER soils remain highly uncertain.
Nitrous Oxide (N2O) Emissions
Nitrous oxide is produced primarily by denitrifying and nitrifying bacteria; other
sources appear unimportant in agricultural soils (e.g., Robertson and Tiedje 1987,
Crenshaw et al. 2008). The extent to which N2O is produced by denitrifiers vs.
nitrifiers in agronomic systems is a source of controversy; knowing this could
be valuable for designing N2O mitigation strategies. Nitrous oxide isotopomer
analysis (the intramolecular distribution of the 14N and 15N isotopes; Ostrom and
Ostrom 2011) is the only current field-based technique that can unambiguously
differentiate between these two processes without significantly altering microbial activity. Ostrom et al. (2010a) measured isotopomer site preference to show
that denitrification is the dominant source of N2O in the Mown Grassland (never
tilled) community following tillage of a subplot; in that experiment, denitrification accounted for 53–100% of the N2O produced over a diurnal cycle. Using
the same approach in no-till wheat of the Resource Gradient Experiment, Ostrom
et al. (2010b) showed that denitrification dominated regardless of N fertilizer rate
(0, 134, and 246 kg N ha−1).
Nitrogen availability, on the other hand, is the single best predictor of overall N2O emissions across both unmanaged and cropped ecosystems at KBS LTER
(Gelfand and Robertson 2015, Chapter 12 in this volume) as elsewhere (Matson and
Vitousek 1987; Bouwman et al. 2002a, b). In cropped systems, paired comparisons
Nitrogen Transfers and Transformations 231
1
of N2O production in fertilized vs. unfertilized soils suggest that ~1% of added N
is converted to N2O, and this is the factor currently used by most national greenhouse gas (GHG) inventories to estimate N2O production (IPCC 2006; Gelfand and
Robertson 2015, Chapter 12 in this volume). However, the response curves of N2O
emission vs. N fertilizer rate are beginning to illustrate a more nonlinear relationship that suggests N2O fluxes increase disproportionately as fertilizer rates exceed
the crop’s capacity to utilize added N (Shcherbak et al. 2014).
McSwiney and Robertson (2005), for example, reported a nonlinear, exponentially increasing N2O fertilizer response along the nine N fertilizer rates in
corn at the KBS LTER Resource Gradient Experiment. They found that N2O
emissions more than doubled at N fertilizer rates greater than the level at which
yield was maximized. Likewise, across six N fertilizer rates in winter wheat,
Millar et al. (2014) also found an exponential increase in N2O emissions with an
increasing N rate. Hoben et al. (2011) confirmed this relationship in commercial
corn fields across Michigan (Fig. 9.9), and Grace et al. (2011) used this relationship to revise estimates for N2O emissions from corn in the U.S. North Central
Region for 1964–2005 from 35% to 59% of all GHG emissions associated with
corn, and the revised N2O emission was equivalent to 1.75% of N fertilizer
400
Corn
Wheat
20
10
300
200
0
0
50
100
150
200
N2O Emission (g N2O–N ha-1 season-1)
N2O Flux (g N2O–N ha-1 day-1)
30
500
250
Fertilizer Rate (kg N ha )
-1
Figure 9.9. Nitrous oxide (N2O) response to increasing N fertilizer rates for wheat (g
N2O-N ha–1 season–1) at the KBS LTER Resource Gradient Experiment (adapted from Millar
et al. 2014), and for corn (g N2O-N ha–1 day–1) in five commercial corn fields in Michigan
(redrawn from data presented in Hoben et al. 2011). For wheat, emissions were measured
using automated sampling chambers; values are means determined from sub-daily fluxes
over 47 days (right axis) ± SE (n = 159 – 230, repeated measures). For corn, emissions were
measured using manual sampling chambers; values are means (left axis) ± SE (n = 32, 8 site
years × 4 replicate blocks).
232 Ecology of Agricultural Ecosystems
1
inputs. This agrees well with the estimate by Griffis et al. (2013) of 1.8% based
on tall tower measurements of atmospheric N2O at an agricultural landscape in
central Minnesota (USA). Millar et al. (2010, 2012) used this relationship to
develop a methodology for C markets to better incentivize N2O mitigation via
improved N fertilizer management.
Temporal variability severely challenges accurate estimates of annual N2O
fluxes from agricultural systems. As for denitrification, N2O emissions are often
stimulated by episodic agronomic and environmental events, including fertilization, tillage, rainfall, and freeze-thaw cycles (e.g., Wagner-Riddle et al. 2007,
Halvorson et al. 2008). Episodic N2O fluxes can constitute a substantial portion
of long-term total N2O emissions (Parkin and Kaspar 2006), questioning the
validity of annual emission estimates based on infrequent sampling (Smith and
Dobbie 2001). Automated chamber methods where fluxes are measured several
times a day address the issue of the temporal variability, and at KBS as elsewhere, such measurements reveal a substantial amount of diel and day-to-day
variation (Ambus and Robertson 1998).
Agronomic Nitrogen Balances in Annual MCSE Ecosystems
Although we do not have sufficient knowledge of all N fluxes in the MCSE to
construct complete N budgets for each system, we can construct simple agronomic
budgets (e.g., Vitousek et al. 2009) for the annual cropping systems that are informative. Estimates of N in agronomic inputs (from fertilizer additions and BNF)
less outputs (in harvest) provide a first-order measure of surplus N. The balance
(Table 9.6) is instructive: the Conventional system has an overall balance of +7 kg
N ha−1 yr−1, followed by No-till (0 kg N ha−1 yr−1), Reduced Input (–28 kg N ha−1
yr−1), and Biologically Based (–34 kg N ha−1 yr−1). The Conventional system closely
compares to the balance of +10 kg N ha−1 yr−1 (Table 9.6) for a generalized U.S.
Midwest (Illinois) corn–soybean rotation determined by Vitousek et al. (2009).
That the Conventional System is in near balance (only ~7% of estimated inputs
are not removed by harvest) and the No-till is in exact balance suggests conservative
N management in these systems (Table 9.6). As noted earlier, N fertilizer for corn is
applied at rates recommended by university extension based on an EONR approach.
The negative surpluses in the Reduced Input and Biologically Based systems are
striking, and likely indicate cover crop scavenging of N that would otherwise be
lost to the environment by leaching and denitrification. Alternative explanations are
that soil organic matter could be providing additional N or that BNF by the cover
crops could be underestimated. However, soil organic matter is accreting in these
systems rather than declining (Syswerda et al. 2011), and thus is a sink not a source
of N. And while rates of BNF in the Reduced Input and Biologically Based systems
are only 12–16 kg N ha−1 yr−1 greater than in the Conventional system, which seems
low, recall that leguminous cover crops are grown during only one of the MCSE’s
three rotation phases (preceding wheat). For this phase, rates of BNF for red clover
are 31 and 45 kg N ha−1 yr−1 for the Reduced Input and Biologically Based systems,
respectively (Table 9.4), which is a reasonable range for red clover (Schipanski and
Drinkwater 2011) and for winter cover crops in general (Parr et al. 2011).
Nitrogen Transfers and Transformations 233
Table 9.6. Agronomic N inputs, N outputs and surplus (difference) for corn–
soybean–wheat rotations in the U.S. Midwesta and the annual MCSE systems.b
Agronomic N Inputs,
Outputs, and Balance
U.S. Midwest
MCSE System
Conventional
No-Till
Reduced
Input
Biologically
Based
Agronomic Inputs (kg N ha−1 yr−1)
Fertilizer
93
73
73
25
0
BNF
62
31
36
43
47
155
104
109
68
47
81
Total
Agronomic Outputs (kg N ha−1 yr−1)
145
97
109
96
Total
Harvest
145
97
109
96
81
Surplus
+10
+7
0
–28
–34
Values for the U.S. Midwest from Vitousek et al. (2009) for a tile-drained corn–soybean rotation in Illinois.
Values for MCSE systems from Tables 9.2, 9.3, and 9.4, annualized to crop rotation cycle.
a
1
b
Worth noting is that the overall balance for each system is the sum of balances
for individual crops within each 3-year rotation, and that year-to-year balances differ by crop. In the Conventional and No-till systems, for example, only wheat has
an agronomic N budget in approximate balance; corn has a significant N surplus,
and soybean a significant N deficit. On average for 1993–2010, wheat in these
systems had a 3 kg N excess (76 kg N fertilizer less 73 kg N harvest), corn had a
55 kg N ha−1 yr−1 excess (141 kg N from fertilizer inputs less 86 kg N harvested),
and soybean had a 51 kg N deficit (100 kg N from BNF less 151 kg N harvested). N
balance over the entire rotation, then, is the result of soybean’s deficit being made
up by corn’s excess.
That leaching and presumably denitrification losses are significant in all systems, but especially in the annual cropping systems (see the prior section above),
suggests that overall N budgets are substantially out of balance: in the annual cropping systems, more N appears to be lost via harvest, leaching, and denitrification
than is being gained via N deposition, BNF, and N fertilizer. This suggests either
that BNF has been underestimated, and that (1) more N is being mineralized from
soil organic matter than is being immobilized annually; (2) N leaching losses have
been overestimated; or (3) there is an unrecognized N source such as atmospheric
NH3 adsorption. This apparent imbalance is a major knowledge gap that deserves
future attention.
Mitigation of Excess Nitrogen
The main management challenge for mitigating reactive N in the environment is
to maximize the efficiency with which N is used in agricultural systems (CAST
2011)—for field crops, this means implementing practices that minimize fertilizer
234 Ecology of Agricultural Ecosystems
use and maximize N conservation. Robertson and Vitousek (2009) organized practices to improve the N Use Efficiency (NUE) of high-productivity cropping systems
into four strategies: (1) provide farmers with decision support to better match fertilizer N rates to crop N requirements; (2) adjust the rotation to add crops and cover
crops that will improve uptake of added N; (3) better manage the timing, placement,
and formulation of N fertilizers—including organic—to better synchronize N additions with plant N needs; and (4) manage hydrologic flow paths to capture and
process the N leached from farm fields. Tillage management provides a fifth option
for some soils. KBS LTER results inform all strategies and as well the degree to
which farmers are likely to adopt various strategies (Swinton et al. 2015, Chapter
13 in this volume).
Nitrogen Fertilizer Rate
1
As noted earlier, a direct relationship exists between crop yield and N fertilizer
rate up to the point at which crop N needs are met. In recent years, hundreds of
N-response trials conducted throughout the U.S. Midwest (e.g., Vanotti and Bundy
1994) have contributed to a database sufficient to support the new MRTN approach
based on the EONR (ISU 2004, Sawyer et al. 2006).
At KBS LTER, the difference between the traditional Agronomic Optimum
N Rate (AONR) and the EONR approach illustrates potential fertilizer savings.
Results from the Resource Gradient Experiment (Fig. 9.2) suggest that applying N
fertilizer at economic optimum rates could result in a potential savings of 23% on
N fertilizer costs for corn and 36% for wheat, assuming a typical fertilizer to crop
price ratio of 0.10. That NO3− leaching also increases substantially at N fertilizer
rates in excess of crop N demand (e.g., Andraski et al. 2000, Gehl et al. 2006) suggests that the EONR approach could mitigate other forms of N in the environment
in addition to N2O.
Cover Crops
Winter cover crops can capture N that would otherwise be available for loss following annual crop harvest. During active growth in the fall and spring, winter cover
crops take up mineralized N and/or residual N fertilizer, which can then become
available to the next crop upon remineralization (Rasse et al. 2000, Strock et al.
2004). Much of the N immobilized by the cover crop presumably would be otherwise lost as leached NO3− (Feyereisen et al. 2006) or as N2O and N2 via denitrification (Baggs et al. 2000a).
In the KBS LTER Living Field Lab Experiment (Snapp et al. 2015, Chapter 15
in this volume), McSwiney et al. (2010) found that the inclusion of cereal rye as a
winter cover crop in a conventional corn system maintained corn yield, while significantly reducing N2O and NO3− losses, particularly at N fertilizer rates in excess
of corn N requirements. They calculated apparent N recoveries of >80% for N
fertilizer rates up to 101 kg N ha−1 when cover crops were included; typical estimates for row crops without cover crops range from 30% to 60% (e.g., Cassman
et al. 2002). Cover crops also significantly reduced NO3− leaching compared to
Nitrogen Transfers and Transformations 235
systems without cover crops (Syswerda et al. 2012). This reduction could be linked
to increased evapotranspiration and soil nitrogen scavenging in cover crop systems.
When legumes are included as cover crops, as in the MCSE Reduced Input
and Biologically Based systems, there is the potential benefit of N input by BNF.
Although BNF will be low when adequate soil N is available, winter legumes can
provide the same degree of soil inorganic N scavenging as their nonleguminous
counterparts and have the additional advantage of a low C:N biomass that decomposes rapidly after spring killing, making more N available earlier for the growth
of the summer crop (Fig. 9.5; Corak et al. 1991, Crandall et al. 2005). Crop residue
quality (e.g., C:N ratio, lignin content) has also been shown to affect denitrification rates and N2O emissions (Baggs et al. 2000b; Millar and Baggs 2004, 2005).
Cost savings from avoided N fertilizer use could be put toward cover crop seed and
planting expenses.
Fertilizer Formulation, Placement, and Timing
1
Applying an appropriate form of N when and where the crop can best use it can
readily improve ecosystem NUE. Fertilizer N should ideally be applied in several doses to match the timing of crop N demand—this ensures the greatest synchrony between fertilizer addition and crop need. However, except where N might
be applied continuously in irrigation water, weather and the availability of equipment and labor typically limit N applications to no more than two per season—in
corn, a starter rate at planting and the remainder just before the rapid growth stage.
Worse, for about one-third of U.S. cropland, fertilizer N is applied once in the fall—
months before active crop growth (Randall and Sawyer 2008, Ribaudo et al. 2011).
Long-term paired comparisons show lower corn yields and 15–40% greater NO3−
losses with fall vs. spring fertilizer applications (e.g., Randall and Mulla 2001,
Randall and Vetsch 2005). Bundy (1986) concluded that fall-applied N is usually
10–15% less effective for crop utilization than spring-applied N.
Fertilizer placement also affects NUE. The spatial arrangement of available
N vis-à-vis the distribution of plants and their roots (e.g., Van Noordwijk et al.
1993) affects the likelihood of N uptake vs. N loss. Placing synthetic fertilizers in
a concentrated band within or very close to crop rows, rather than between them as
is more common, can increase NUE and reduce surface N loss (Malhi and Nyborg
1985, CAST 2011). Injecting anhydrous ammonia into soil near rows rather than
broadcasting over the soil surface can decrease N leaching and volatilization by as
much as 35% (Achorn and Broder 1984). And broadcasting it has been shown to
double N2O emissions (Venterea et al. 2010) when compared to broadcast urea.
The location and particle size of plant residue also have an impact on its N
release and uptake. Loecke and Robertson (2009) found that N in red clover residue
is more likely to be taken up by corn if the residue is sufficiently aggregated to concentrate mineralized N in small patches, but not so large as to inhibit decomposition
by creating anoxic microsites.
Fertilizer placement at the field scale can also greatly influence NUE. That soil
nitrogen availability is spatially variable in predictable patterns (Fig. 9.10) is well
known from studies at the KBS LTER (Robertson et al. 1993, 1997; Senthilkumar
1
236 Ecology of Agricultural Ecosystems
Figure 9.10. Isopleths for A) soil nitrate (5.7-15.1 mg N g soil–1) and B) net N mineralization (0.30-0.70 mg N g–1 d–1) across the 48-ha MCSE prior to plot establishment. Shading
patterns denote five equal increments in levels for each variable across its range. Distance
unit in meters. Redrawn from Robertson et al. (1997) with permission of the Ecological
Society of America; permission conveyed through Copyright Clearance Center, Inc.
et al. 2009) and elsewhere, and yield patterns are concomitantly related to nutrient availability (Robertson 1997, Kravchenko and Bullock 2000, Kravchenko
et al. 2006, Kravchenko and Robertson 2007). Applying fertilizer in a spatially
targeted manner that recognizes this variability can concentrate N on those areas
of a field with the highest yield potential and avoid adding N to those areas not
likely to be N responsive. For most fields, less fertilizer N will be added using this
approach than applying a generally recommended rate to the entire field. (e.g.,
Mamo et al. 2003, Scharf et al. 2005). On-the-go fertilizer placement, which uses
spectral reflectance of the canopy to spatially judge real-time crop N needs (Raun
et al. 2002, Li et al. 2009, Scharf and Lory 2009), is a promising technology for
improving NUE.
Better management of crop residues can undergird, supplement, and even
replace synthetic fertilizers. The quality of organic residues plays an especially
important role and can influence N availability by (1) adding N to soils, (2) affecting N mineralization–immobilization patterns, (3) serving as an energy source for
microbial activities, and (4) acting as precursors to N sequestration in soil organic
matter (Palm and Rowland 1997; Paul et al. 2015, Chapter 5 in this volume).
Nitrogen Transfers and Transformations 237
1
Decomposition of crop residues and resultant N release are governed by climatic, edaphic, and resource quality factors (Swift et al. 1979).
Of these factors, resource quality is likely the easiest for farmers to manage,
but its impact is often difficult to assess. Farmers use a variety of organic inputs,
ranging from crop residues to manures, which vary widely in N content. And only
a minority of the N from a winter cover crop may be available for the following
summer crop (e.g., 4–35%; Ranells and Wagger 1997). Knowing how the quality
of applied organic materials (e.g., C:N ratio, mineralizable C and N content, and
lignin content) affects N mineralization and immobilization rates (Aulakh et al.
1991, Wagger et al. 1998) is critical for predicting the effect of organic residues on
N availability for annual crops.
Due to its effect on available N, residue quality has also been shown to affect
denitrification rates and N2O emissions (Aulakh et al. 2001, Baggs et al. 2000a,
Millar et al. 2004). In laboratory incubations using KBS soils, Ambus et al. (2001)
found that high-quality (1.88% N) pea residues resulted in greater N2O emissions
than low-quality (0.63% N) barley residues, when both were separately incorporated into soil, either as ground or coarsely cut residues. That study also showed
how residue particle size and placement affected both N2O emissions and NO3−
leaching potentials.
Managing Hydrologic Flow Paths to Retain or Remove Reactive N
Hydrologic export of reactive N from agricultural systems to ground and surface
waters causes well-documented problems, including the degradation of drinking
water by excessively high concentrations of NO3−, eutrophication of downstream
surface waters including marine coastal zones, and additional emission of N2O to
the atmosphere (Galloway et al. 2008; Hamilton 2015, Chapter 11 in this volume).
These problems have motivated research to understand how we can manage landscapes to retain or remove reactive N from hydrologic flow paths. Three strategies that specifically apply to agricultural watersheds are discussed in this section
(Robertson et al. 2007, Robertson and Vitousek 2009).
First, riparian and other downslope conservation plantings can be managed to
keep NO3− leached from cropped fields from entering local waterways (Liebman
et al. 2013). Native or planted perennial vegetation in stream riparian (buffer) zones
can immobilize N in growing biomass and soil organic matter (Lowrance 1998).
It is well established that waterway grass (filter) strips can also trap soil particles
that would otherwise erode organic N into surface waters. Such measures offer the
additional benefits of mitigating sediment and phosphorus losses to surface waters.
Second, restoring stream channels and small wetlands in agricultural watersheds
can promote denitrification and other microbial processes that convert NO3− to inert
or less mobile forms of N (Mitsch et al. 2001). Denitrification is the main process through which streams can permanently remove N (Mulholland et al. 2009).
The effectiveness of wetlands in reducing N export from agricultural fields is
largely dependent on the magnitude and timing of NO3− inputs and the capacity
of the system to denitrify or accumulate N in plant biomass and organic detritus.
Channelization effectively turns headwater streams and wetlands into pipes that
238 Ecology of Agricultural Ecosystems
are less conducive to N retention (Opdyke et al. 2006) because water moves out
faster and its N has less contact with stream edges and sediments, particularly during periods of high flow (Peterson et al. 2001, Royer et al. 2006, Alexander et al.
2009). Restoring stream channels and small wetlands to intercept leached N has the
potential to significantly reduce downstream NO3− loadings.
Additionally, the third strategy involves targeting landscape positions that contribute disproportionately to watershed N fluxes (Robertson et al. 2007; Robertson
and Vitousek 2009; Hamilton 2015, Chapter 11 in this volume). It is increasingly
clear that much nonpoint source pollution from agriculture arises from relatively
small fractions of the landscape (Giburek et al. 2002). Planting forage or other
perennial crops such as cellulosic biofuels in these areas (Robertson et al. 2011)
could reduce landscape-level N outputs. Restoring or expanding wetlands in lowlying areas could even convert these areas from N sources to N sinks.
Tillage Management to Mitigate N Loss
1
Tillage affects a number of factors that influence N conservation: physical factors
such as soil bulk density, water-holding capacity, drainage, aeration, and aggregate
stability; chemical factors such as C and N stores and availability; and biological
factors such as microbial activity, rates of decomposition, the presence of earthworms and other invertebrates, and plant root distributions. Few other management
practices have such far-reaching effects on cropping system N cycling.
Historically, tillage is responsible for most soil organic matter loss in cultivated
ecosystems (Paul et al. 2015, Chapter 5 in this volume) and thereby the loss of most
soil organic N stores. On conversion from native vegetation or long-term fallow,
most of the N initially harvested in subsequent crops is derived from decomposition (Robertson 1997). Once soil organic N pools are depleted—typically, a few
decades in temperate regions, more quickly in the tropics (Robertson and Grandy
2006)—legumes and fertilizers are required to replace the soil’s lost capacity to
supply N. Because herbicides can now provide weed control as effectively as tillage, conservation tillage (including no-till) can be practiced to conserve organic C
and N in soil and thereby restore many of the fertility benefits of less disturbed soils
(e.g., Franzluebbers and Arshad 1997, Lal 2004).
Although the many benefits of no-till are well known (e.g., Blevins et al. 1977,
Phillips et al. 1980), benefits related to NO3− and N2O conservation are less clear.
Comparisons of no-till vs. conventional tillage systems have shown no significant
difference in NO3− leaching (e.g., Cabrera et al. 1999, Mitsch et al. 1999, Smith
et al. 1990), or have demonstrated that no-till leaches either more (Tyler and Thomas
1977, Chichester 1977) or less (Rasse and Smucker 1999, Ogden et al. 1999) NO3−.
Syswerda et al. (2012) argue that much of this ambiguity is due to experiment duration. They note that most studies last only 2–3 years and begin shortly after no-till
establishment. Short-term studies may mask long-term effects that emerge only
over periods with both higher and lower rainfall levels (e.g., Cabrera et al. 1999).
And studies conducted too soon after a change in management can misrepresent
the long-term effects that emerge after equilibration (Rasmussen et al. 1998). In
addition to short duration, many studies are performed in small plots, which cannot
Nitrogen Transfers and Transformations 239
1
readily account for the effects of spatial variation at realistic field scales (Robertson
et al. 2007).
Syswerda et al. (2012) made similar comparisons of no-till vs. conventional tillage, but examined NO3− losses over an 11-year period that began 6 years after notill establishment. On average, they found NO3− leaching losses from the MCSE
No-till and Conventional systems represented 50 and 76%, respectively, of the total
N applied to these systems. NUE was higher in the No-till system despite 16%
higher drainage losses (388 vs. 334 mm H2O yr−1, respectively), suggesting that
channelized flow in the better-structured no-till soils allows water to leave the profile before it has equilibrated with NO3− in small pores (Rasse and Smucker 1999).
Higher plant demand for NO3− may also have contributed to lower no-till fluxes as
the No-till system had somewhat higher average yields (Grandy et al. 2006; Smith
et al. 2007; Robertson et al. 2015, Chapter 2 in this volume) and therefore more N
uptake.
No-till management can also affect N2O emissions from soil, although such effects
are not consistent. Comparisons of N2O emissions in the MCSE Conventional and
No-till systems have shown no consistently significant differences (e.g., Robertson
et al. 2000, Grandy et al. 2006, Gelfand et al. 2013). This is in agreement with other
(Parkin and Kaspar 2006, Dusenbury et al. 2008, Sey et al. 2008, Gregorich et al.
2008) but not all (e.g., Liu et al. 2006, Omonode et al. 2011) similar studies. Van
Kessel et al. (2013) concluded through meta-analysis that it typically takes at least
10 years before no-till soils exhibit lower N2O fluxes, in which case we can expect
the MCSE No-till system to emit less N2O in coming years.
Summary
Nitrogen is an essential nutrient for crop growth and the N demands of today’s
intensive cropping systems are met primarily by synthetic N fertilizer application.
Direct consequences of over-applying N fertilizer are substantial losses of reactive
N to the environment in the form of NO3− leached to ground and surface waters
and N2O emitted to the atmosphere. The environmental costs of excess N loading
include coastal zone eutrophication, compromised drinking water and air quality,
climate warming, stratospheric ozone depletion, and biodiversity loss. However,
cropping systems can acquire N through legume N fixation, manure addition, and
crop residue return—offering many options for N management at the farm scale.
Results from KBS LTER research underscore the value of practical agronomic
practices that improve N retention in row crops. Potential interventions include
increasing rotational complexity with different primary and cover crops; using
no-till management; and improving N synchrony with better rate, timing, placement, and formulation of N fertilizers, so crop N needs are met more precisely.
Residue management can also contribute to N conservation. Improved landscape
management can partially mitigate N leaching losses from the farm field through
measures such as maintaining or planting riparian vegetation, restoring stream
channels and small wetlands, and the targeted planting of forage or other perennial crops such as cellulosic biofuels. The most poorly known N cycle fluxes at
240 Ecology of Agricultural Ecosystems
the KBS LTER are emissions of N2 and NOx, both from denitrification. Providing
farmers with strategies or incentives that reduce N fertilizer use while maintaining
high agronomic yield is a logical first step in mitigating agriculture’s impact on the
environment.
References
1
Achorn, F. P., and M. F. Broder. 1984. Mechanics of applying nitrogen fertilizer. Pages
493–506 in R. D. Hauck, editor. Nitrogen in crop production. Soil Science Society of
America, Madison, Wisconsin, USA.
Alexander, R., R. Smith, and G. Schwarz. 2000. Effect of stream channel size on the delivery
of nitrogen to the Gulf of Mexico. Nature 403:758–761.
Alexander, R. B., J. K. Bohlke, E. W. Boyer, M. B. David, J. W. Harvey, P. J. Mulholland,
S. P. Seitzinger, C. R. Tobias, C. Tonitto, and W. M. Wollheim. 2009. Dynamic modeling of nitrogen losses in river networks unravels the coupled effects of hydrological and
biogeochemical processes. Biogeochemistry 93:91–116.
Ambus, P., E. S. Jensen, and G. P. Robertson. 2001. Nitrous oxide and N-leaching losses
from agricultural soil: influence of crop residue particle size, quality and placement.
Phyton (Austria) 41:7–15.
Ambus, P., and G. P. Robertson. 1998. Automated near-continuous measurement of carbon
dioxide and nitrous oxide fluxes from soil. Soil Science Society of America Journal
62:394–400.
Ambus, P., and G. P. Robertson. 2006. The effect of increased N deposition on nitrous oxide,
methane, and carbon dioxide fluxes from unmanaged forest and grassland communities
in Michigan. Biogeochemistry 79:315–337.
Andraski, T. W., L. G. Bundy, and K. R. Brye. 2000. Crop management and corn nitrogen
rate effects on nitrate leaching. Journal of Environmental Quality 29:1095–1103.
Aulakh, M. S., J. W. Doran, D. T. Walters, A. R. Mosier, and D. D. Francis. 1991. Crop
residue type and placement effects on denitrification and mineralization. Soil Science
Society of America Journal 55:1020–1025.
Aulakh, M. S., T. Khera, J. Doran, and K. Bronson. 2001. Denitrification, N2O and CO2
fluxes in rice-wheat cropping system as affected by crop residues, fertilizer N and
legume green manure. Biology and Fertility of Soils 34:375–389.
Baggs, E. M., R. M. Rees, K. A. Smith, and A. J. A. Vinten. 2000a. Nitrous oxide emission
from soils after incorporating crop residues. Soil Use and Management 16:82–87.
Baggs, E. M., C. A. Watson, and R. M. Rees. 2000b. The fate of nitrogen from incorporated cover crop and green manure residues. Nutrient Cycling in Agroecosystems
56:153–163.
Beaulieu, J. J., C. P. Arango, S. K. Hamilton, and J. L. Tank. 2008. The production and emission of nitrous oxide from headwater streams in the Midwestern United States. Global
Change Biology 14:878–894.
Beaulieu, J. J., J. L. Tank, S. K. Hamilton, W. M. Wollheim, R. O. Hall, Jr., P. J. Mulholland,
B. J. Peterson, L. R. Ashkenas, L. W. Cooper, C. N. Dahm, W. K. Dodds, N. B. Grimm,
S. L. Johnson, W. H. McDowell, G. C. Poole, H. M. Valett, C. P. Arango, M. J. Bernot,
A. J. Burgin, C. L. Crenshaw, A. M. Helton, L. T. Johnson, J. M. O’Brien, J. D. Potter,
R. W. Sheibley, D. J. Sobota, and S. M. Thomas. 2011. Nitrous oxide emission from
denitrification in stream and river networks. Proceedings of the National Academy of
Sciences USA 108:214–219.
Nitrogen Transfers and Transformations 241
1
Bergsma, T. T., N. E. Ostrom, M. Emmons, and G. P. Robertson. 2001. Measuring simultaneous fluxes from soil of N2O and N2 in the field using the 15N-gas “nonequilibrium”
technique. Environmental Science and Technology 35:4307–4312.
Bergsma, T. T., G. P. Robertson, and N. E. Ostrom. 2002. Influence of soil moisture and
land use history on denitrification end-products. Journal of Environmental Quality
31:711–717.
Blevins, R. L., G. W. Thomas, and P. L. Cornelius. 1977. Influence of no-till and
N-fertilization on certain soil properties after five years of continuous corn. Agronomy
Journal 69:383–386.
Bobbink, R., K. Hicks, J. Galloway, T. Spranger, R. Alkemade, M. Ashmore, M. Bustamante,
S. Cinderby, E. Davidson, F. Dentener, B. Emmett, J. W. Erisman, M. Fenn, F. Gilliam,
A. Nordin, L. Pardo, and W. De Vries. 2010. Global assessment of nitrogen deposition
effects on terrestrial plant diversity: a synthesis. Ecological Applications 20:30–59.
Bobbink, R., M. Hornung, and J. G. M. Roelofs. 1998. The effects of air-borne nitrogen pollutants on species diversity in natural and semi-natural European vegetation. Journal of
Ecology 86:717–738.
Bouwman, A. F., L. J. M. Boumans, and N. H. Batjes. 2002a. Emissions of N2O and NO
from fertilized fields: summary of available measurement data. Global Biogeochemical
Cycles 16:1058–1070.
Bouwman, A. F., L. J. M. Boumans, and N. H. Batjes. 2002b. Modeling global annual N2O
and NO emissions from fertilized fields. Global Biogeochemical Cycles 16:1080–1090.
Bruns, M. A., J. R. Stephen, J. I. Prosser, and E. A. Paul. 1999. Comparative diversity of
ammonia-oxidizer 16S rRNA gene sequences in native, tilled, and successional soils.
Applied and Environmental Microbiology 65:2994–3000.
Bundy, L. G. 1986. Timing nitrogen applications to maximize fertilizer efficiency and crop
response in conventional crop production. Journal of Fertilizer Issues 3:99–106.
Butterbach-Bahl, K., L. Breuer, R. Gasche, G. Willibald, and H. Papen. 2002. Exchange of
trace gases between soils and the atmosphere in Scots pine forest ecosystems of the
northeastern German lowlands 1. Fluxes of N2O, NO/NO2 and CH4 at forest sites with
different N-deposition. Forest Ecology and Management 167:123–134.
Cabrera, M. L., D. M. Endale, D. E. Radcliffe, J. L. Steiner, W. K. Vencill, L. Lohr, and
H. H. Schomberg. 1999. Tillage and fertilizer source effects on nitrate leaching in cotton
production in Southern Piedmont. Pages 49–50 in J. E. Hook, editor. Proceedings of the
22nd Annual Southern Conservation Tillage Conference for Sustainable Agriculture.
Special Publication 95, Georgia Agricultural Experiment Station, Tifton, Georgia, USA.
Cassman, K. G., A. Dobermann, and D. T. Walters. 2002. Agroecosystems, nitrogen-use
efficiency, and nitrogen management. Ambio 31:132–140.
CAST (Council for Agricultural Science and Technology). 2011. Carbon sequestration and
greenhouse gas fluxes in agriculture: challenges and opportunities. Task Force Report
No.142, CAST, Ames, Iowa, USA.
CASTNET (Clean Air Status and Trends Network). 2011. Download data. U.S. Environmental
Protection Agency, Washington, DC, USA. <http://java.epa.gov/castnet/reportPage.do>
Accessed December 19, 2011.
Cavigelli, M. A., and G. P. Robertson. 2000. The functional significance of denitrifier community composition in a terrestrial ecosystem. Ecology 81:1402–1414.
Cavigelli, M. A., and G. P. Robertson. 2001. Role of denitrifier diversity in rates of nitrous
oxide consumption in a terrestrial ecosystem. Soil Biology & Biochemistry 33:297–310.
Chichester, F. W. 1977. Effects of increased fertilization rates on nitrogen content of runoff
and percolate from monolith lysimeters. Journal of Environmental Quality 6:211–217.
242 Ecology of Agricultural Ecosystems
1
Clark, C. M., and D. Tilman. 2008. Loss of plant species after chronic low-level nitrogen
deposition to prairie grasslands. Nature 451:712–715.
Cleveland, C. C., A. R. Townsend, D. S. Schimel, H. Fisher, R. W. Howarth, L. O. Hedin,
S. S. Perakis, E. F. Latty, J. C. Von Fischer, A. Elseroad, and M. F. Wasson. 1999. Global
patterns of terrestrial biological nitrogen (N2) fixation in natural ecosystems. Global
Biogeochemical Cycles 13:623–645.
Cooper, A. B. 1990. Nitrate depletion in the riparian zone and stream channel of a small
headwater catchment. Hydrobiologia 202:13–26.
Corak, S. J., W. W. Frye, and M. S. Smith. 1991. Legume mulch and nitrogen fertilizer effects
on soil water and corn production. Soil Science Society America Journal 55:1395–1400.
Crandall, S. M., M. L. Ruffo, and G. A. Bollero. 2005. Cropping systems and nitrogen
dynamics under a cereal winter cover crop preceding corn. Plant and Soil 268:209–219.
Crenshaw, C. L., C. Lauber, R. L. Sinsabaugh, and L. K. Stavely. 2008. Fungal control of
nitrous oxide production in semiarid grassland. Biogeochemistry 87:17–27.
Crumpton, W. G., D. A. Kovacic, D. L. Hey, and J. A. Kostel. 2008. Potential of restored and
constructed wetlands to reduce nutrient export from agricultural watersheds in the Corn
Belt. Pages 29–42 in Upper Mississippi River Sub-basin Hypoxia Nutrient Committee
(UMRSHNC). Final report: Gulf Hypoxia and Local Water Quality Concerns
Workshop, American Society of Agricultural and Biological Engineers (ASABE), St.
Joseph, Michigan, USA.
Culman, S. W., S. S. Snapp, M. A. Freeman, M. Schipanski, J. Beniston, R. Lal,
L. E. Drinkwater, A. J. Franzluebbers, J. D. Glover, A. S. Grandy, J. Lee, J. Six,
J. E. Maul, S. B. Mirksy, J. T. Spargo, and M. M. Wander. 2012. Permanganate oxidizable carbon reflects a processed soil fraction that is sensitive to management. Soil
Science Society America Journal 76:494–506.
Dentener, F., J. Drevet, J. F. Lamarque, I. Bey, B. Eickhout, A. M. Fiore, D. Hauglustaine,
L. W. Horowitz, M. Krol, U. C. Kulshrestha, M. Lawrence, C. Galy-Lacaux, S. Rast,
D. Shindell, D. Stevenson, T. Van Noije, C. Atherton, N. Bell, D. Bergman, T. Butler,
J. Cofala, B. Collins, R. Doherty, K. Ellingsen, J. Galloway, M. Gauss, V. Montanaro,
J. F. Müller, G. Pitari, J. Rodriguez, M. Sanderson, F. Solmon, S. Strahan, M. Schultz,
K. Sudo, S. Szopa, and O. Wild. 2006. Nitrogen and sulfur deposition on regional and
global scales: a multi-model evaluation. Global Biogeochemical Cycles 20:GB4003.
Dusenbury, M. P., R. E. Engel, P. R. Miller, R. L. Lemke, and R. Wallander. 2008. Nitrous
oxide emissions from a northern great plains soil as influenced by nitrogen management
and cropping systems. Journal of Environmental Quality 37:542–550.
Feyereisen, G. W., B. N. Wilson, G. R. Sands, J. S. Strock, and P. M. Porter. 2006. Potential
for a rye cover crop to reduce nitrate loss in southwestern Minnesota. Agronomy
Journal 98:1416–1426.
Franzluebbers, A. J., and M. A. Arshad. 1997. Particulate organic carbon content and potential mineralization as affected by tillage and texture. Soil Science Society of America
Journal 61:1382–1386.
Galloway, J. N., F. J. Dentener, D. G. Capone, E. W. Boyer, R. W. Howarth, S. P. Seitzinger,
G. P. Asner, C. C. Cleveland, P. A. Green, E. A. Holland, D. M. Karl, A. F. Michaels,
J. H. Porter, A. R. Townsend, and C. J. Vöosmarty. 2004. Nitrogen cycles: past, present,
and future. Biogeochemistry 70:153–226.
Galloway, J. N., A. R. Townsend, J. W. Erisman, M. Bekunda, Z. C. Cai, J. R. Freney, L.
A. Martinelli, S. P. Seitzinger, and M. A. Sutton. 2008. Transformation of the nitrogen
cycle: Recent trends, questions, and potential solutions. Science 320:889–892.
Gehl, R. J., J. P. Schmidt, C. B. Godsey, L. D. Maddux, and W. B. Gordon. 2006. Post-harvest
soil nitrate in irrigated corn: variability among eight field sites and multiple nitrogen
rates. Soil Science Society of America Journal 70:1922–1931.
Nitrogen Transfers and Transformations 243
1
Gelfand, I., and G. P. Robertson. 2015. Mitigation of greenhouse gas emissions in agricultural ecosystems. Pages 310–339 in S. K. Hamilton, J. E. Doll, and G. P. Robertson,
editors. The ecology of agricultural ecosystems: long-term research on the path to sustainability. Oxford University Press, New York, New York, USA.
Gelfand, I., and G. P. Robertson. 2015. Nitrogen uptake, fixation, and response to N fertilizer
by soybean in US Midwest Biogeochemistry (in press).
Gelfand, I., R. Sahajpal, X. Zhang, C. R. Izaurralde, K. L. Gross, and G. P. Robertson. 2013.
Sustainable bioenergy production from marginal lands in the US Midwest. Nature
493:514–517.
Gentry, L. E., M. B. David, F. E. Below, T. V. Royer, and G. F. McLsaac. 2009. Nitrogen
mass balance of a tile-drained agricultural watershed in east-central Illinois. Journal of
Environmental Quality 38:1841–1847.
Giburek, W. J., C. C. Drungil, M. S. Srinivasan, B. A. Needleman, and D. E. Woodward.
2002. Variable source area controls on phosphorus transport: bridging the gap between
research and design. Journal of Soil and Water Conservation 57:534–543.
Grace, P., G. P. Robertson, N. Millar, M. Colunga-Garcia, B. Basso, S. H. Gage, and
J. Hoben. 2011. The contribution of maize cropping in the Midwest USA to global
warming: a regional estimate. Agricultural Systems 104:292–296.
Grandy, A. S., T. D. Loecke, S. Parr, and G. P. Robertson. 2006. Long-term trends in nitrous
oxide emissions, soil nitrogen, and crop yields of till and no-till cropping systems.
Journal of Environmental Quality 35:1487–1495.
Greaver, T. L., T. J. Sullivan, J. D. Herrick, M. C. Barber, J. S. Baron, B. J. Cosby, M. E. Deerhake,
R. L. Dennis, J.-J. B. Dubois, C. L. Goodale, A. T. Herlihy, G. B. Lawrence, L. Liu,
J. A. Lynch, and K. J. Novak. 2012. Ecological effects of nitrogen and sulfur air pollution in
the US: what do we know? Frontiers in Ecology and the Environment 10:365–372.
Gregorich, E. G., P. Rochette, P. St.-Georges, U. F. McKim, and C. Chan. 2008. Tillage
effects on N2O emission from soils under corn and soybeans in Eastern Canada.
Canadian Journal of Soil Science 88:153–161.
Griffis, T. J., X. Lee, J. M. Baker, M. P. Russelle, X. Zhang, R. Venterea, and D. B. Millet.
2013. Reconciling the differences between top-down and bottom-up estimates of nitrous
oxide emissions for the U.S. Corn Belt. Global Biogeochemical Cycles 27:746–754.
Groffman, P. M., M. A. Altabet, J. K. Böhlke, K. Butterbach-Bahl, M. B. David,
M. K. Firestone, A. E. Giblin, T. M. Kana, L. P. Nielsen, and M. A. Voytek. 2006.
Methods for measuring denitrification: diverse approaches to a difficult problem.
Ecological Applications 16:2091–2122.
Halvorson, A. D., S. J. Del Grosso, and C. A. Reule. 2008. Nitrogen, tillage, and crop rotation effects on nitrous oxide emissions from irrigated cropping systems. Journal of
Environmental Quality 37:1337–1344.
Hamilton, S. K. 2015. Water quality and movement in agricultural landscapes. Pages 275–
309 in S. K. Hamilton, J. E. Doll, and G. P. Robertson, editors. The ecology of agricultural ecosystems: long-term research on the path to sustainability. Oxford University
Press, New York, New York, USA.
Hedin, L. O., J. C. von Fischer, N. E. Ostrom, B. P. Kennedy, M. G. Brown, and
G. P. Robertson. 1998. Thermodynamic constraints on nitrogen transformation and
other biogeochemical processes at soil-stream interfaces. Ecology 79:684–703.
Herridge, D. F., M. B. Peoples, and R. M. Boddey. 2008. Global inputs of biological nitrogen
fixation in agricultural systems. Plant and Soil 311:1–18.
Hoben, J. P., R. J. Gehl, N. Millar, P. R. Grace, and G. P. Robertson. 2011. Nonlinear nitrous
oxide (N2O) response to nitrogen fertilizer in on-farm corn crops of the US Midwest.
Global Change Biology 17:1140–1152.
244 Ecology of Agricultural Ecosystems
1
Howarth, R. W., G. Billen, D. Swaney, A. Townsend, N. Jaworski, K. Lajtha, J. A. Downing,
R. Elmgren, N. Caraco, T. Jordan, F. Berendse, J. Freney, V. Kudeyarov, P. Murdoch,
and Z. L. Zhu. 1996. Regional nitrogen budgets and riverine N&P fluxes for the drainages to the North Atlantic Ocean: natural and human influences. Biogeochemistry
35:75–139.
IFA (International Fertilizer Industry Association). 2011. IFADATA statistics. Paris, France.
<http://www.fertilizer.org/ifa/ifadata/search>
Inwood, S. E., J. L. Tank, and M. J. Bernot. 2005. Patterns of denitrification associated
with land use in 9 midwestern headwater streams. Journal of the North American
Benthological Society 24:227–245.
IPCC (Intergovernmental Panel on Climate Change). 2006. 2006 IPCC guidelines for
national greenhouse gas inventories. National Greenhouse Gas Inventories Programme,
Institute for Global Environmental Strategies (IGES), Hayama, Japan.
IPNI (International Plant Nutrition Institute). 2012. 4R plant nutrition: a manual for improving the management of plant nutrition. T.W. Bruulsema, P. E. Fixen, and G. D. Sulewski,
editors. IPNI, Norcross, Georgia, USA.
ISU (Iowa State University). 2004. Corn nitrogen rate calculator: a regional (Corn Belt)
approach to nitrogen rate guidelines. Iowa State University Agronomy Extension,
Ames, Iowa, USA. <http://extension.agron.iastate.edu/soilfertility/nrate.aspx>
Jaworski, N. A., R. W. Howarth, and L. J. Hetling. 1997. Atmospheric deposition of nitrogen
oxides onto the landscape contributes to coastal eutrophication in the northeast United
States. Environmental Science & Technology 31:1995–2004.
Jaynes, D. B., J. L. Hatfield, and D. W. Meek. 1999. Water quality in Walnut Creek Watershed:
herbicides and nitrate in surface waters. Journal of Environmental Quality 28:45–59.
Kramer, D. A. 2004. Nitrogen. Pages 53.1–53.18 in Minerals yearbook, Metals and minerals
2004, Vol. 1, U.S. Geological Survey, Washington, DC, USA.
Kravchenko, A. N., and D. G. Bullock. 2000. Correlation of corn and soybean grain yield
with topography and soil properties. Agronomy Journal 92:75–83.
Kravchenko, A. N., and G. P. Robertson. 2007. Can topographical and yield data substantially
improve total soil carbon mapping by regression kriging? Agronomy Journal 99:12–17.
Kravchenko, A. N., G. P. Robertson, X. Hao, and D. G. Bullock. 2006. Management practice effects on surface total carbon: difference in spatial variability patterns. Agronomy
Journal 98:1559–1568.
Lal, R. 2004. Soil carbon sequestration to mitigate climate change. Geoderma 123:1–22.
Leigh, G. J. 2004. The world’s greatest fix: a history of nitrogen and agriculture. Oxford
University Press, New York, New York, USA.
Li, F., Y. Miao, F. Zhang, Z. Cui, R. Li, X. Chen, H. Zhang, J. Schroder, W. R. Raun, and
L. Jia. 2009. In-season optical sensing improves nitrogen-use efficiency for winter
wheat. Soil Science Society of America Journal 73:1566–1574.
Liebig, J. 1840. Chemistry in its application to agriculture and physiology. Taylor & Walton,
London, UK.
Liebman, M., M. J. Helmers, L. A. Schulte, and C. A. Chase. 2013. Using biodiversity to link
agricultural productivity with environmental quality: results from three field experiments in Iowa. Renewable Agriculture and Food Systems 28:115–128.
Liu, X. J., A. R. Mosier, A. D. Halvorson, and F. S. Zhang. 2006. The impact of nitrogen
placement and tillage on NO, N2O, CH4 and CO2 fluxes from a clay loam soil. Plant and
Soil 280:177–188.
Loecke, T. D., and G. P. Robertson. 2009. Soil resource heterogeneity in the form of aggregated litter alters maize productivity. Plant and Soil 325:231–241.
Nitrogen Transfers and Transformations 245
1
Lowrance, R. 1998. Riparian forest ecosystems as filters for nonpoint-source pollution.
Pages 113–141 in M. L. Pace and P. M. Groffman, editors. Successes, limitations, and
frontiers in ecosystem science. Springer-Verlag, New York, New York, USA.
Malhi, S. S., and M. Nyborg. 1985. Methods of placement for increasing the efficiency of
nitrogen fertilizers applied in the fall. Agronomy Journal 77:27–32.
Mamo, M., G. L. Malzer, D. J. Mulla, D. R. Huggins, and J. Strock. 2003. Spatial and
temporal variation in economically optimum nitrogen rate for corn. Agronomy Journal
95:958–964.
Matson, P. A., and P. M. Vitousek. 1987. Cross-system comparisons of soil nitrogen transformations and nitrous oxide flux in tropical forest ecosystem. Global Biogeochemical
Cycles 1:163–170.
McSwiney, C. P., and G. P. Robertson. 2005. Nonlinear response of N2O flux to incremental fertilizer addition in a continuous maize (Zea mays sp.) cropping system. Global
Change Biology 11:1712–1719.
McSwiney, C. P., S. S. Snapp, and L. E. Gentry. 2010. Use of N immobilization to tighten the
N cycle in conventional agroecosystems. Ecological Applications 20:648–662.
Millar, N., and E. M. Baggs. 2004. Chemical composition, or quality, of agroforestry residues influences N2O emissions after their addition to soil. Soil Biology & Biochemistry
36:935–943.
Millar, N., and E. M. Baggs. 2005. Relationships between N2O emissions and water-soluble
C and N contents of agroforestry residues after their addition to soil. Soil Biology &
Biochemistry 37:605–608.
Millar, N., J. K. Ndufa, G. Cadisch, and E. M. Baggs. 2004. Nitrous oxide emissions following incorporation of improved-fallow residues in the humid tropics. Global
Biogeochemical Cycles 18:GB1032. doi:1010.1029/2003GB002114
Millar, N., G. P. Robertson, A. Diamant, R. J. Gehl, P. R. Grace, and J. P. Hoben. 2012.
Methodology for quantifying nitrous oxide (N2O) emissions reductions by reducing nitrogen fertilizer use on agricultural crops. American Carbon Registry, Winrock
International, Little Rock, Arkansas, USA.
Millar, N., G. P. Robertson, P. R. Grace, R. J. Gehl, and J. P. Hoben. 2010. Nitrogen fertilizer
management for nitrous oxide (N2O) mitigation in intensive corn (Maize) production:
an emissions reduction protocol for US Midwest agriculture. Mitigation and Adaptation
Strategies for Global Change 15:185–204.
Millar, N., D. W. Rowlings, P. R. Grace, R. J. Gehl, and G. P. Robertson. 2014. Non-linear
N2O response to nitrogen fertilizer in winter wheat using automated chambers (in
review).
Mitchell, J. K., G. F. McIsaac, S. E. Walker, and M. C. Hirshi. 2000. Nitrate in river and
subsurface drainage flows from an east central Illinois watershed. Transactions of the
ASAE 43:337–342.
Mitsch, W. J., J. W. Day, Jr., J. W. Gilliam, P. M. Groffman, D. L. Hey, G. W. Randall, and
N. M. Wang. 2001. Reducing nitrogen loading to the Gulf of Mexico from the
Mississippi River Basin: strategies to counter a persistent ecological problem.
BioScience 51:373–388.
Mitsch, W. J., J. W. Day, J. W. Gilliam, P. M. Groffman, D. L. Hey, G. W. Randall, and
N. Wang. 1999. Reducing nitrogen loads, especially nitrate-nitrogen, to surface water,
groundwater, and the Gulf of Mexico: Topic 5 report for the integrated assessment
on hypoxia in the Gulf of Mexico. NOAA Coastal Ocean Program Decision Analysis
Series No. 19, Silver Spring, Maryland, USA.
246 Ecology of Agricultural Ecosystems
1
Mueller, D. K., and D. R. Helsel. 1996. Nutrients in the nation’s waters—too much of a
good thing? National Water-Quality Assessment Program, U.S. Geological Survey,
Washington, DC, USA.
Mulholland, P. J., R. O. Hall, D. J. Sobota, W. K. Dodds, S. E. G. Findlay, N. B. Grimm,
S. K. Hamilton, W. H. McDowell, J. M. O’Brien, J. L. Tank, L. R. Ashkenas,
L. W. Cooper, C. N. Dahm, S. V. Gregory, S. L. Johnson, J. L. Meyer, B. J. Peterson,
G. C. Poole, H. M. Valett, J. R. Webster, C. P. Arango, J. J. Beaulieu, M. J. Bernot,
A. J. Burgin, C. L. Crenshaw, A. M. Helton, L. T. Johnson, B. R. Niederlehner,
J. D. Potter, R. W. Sheibley, and S. M. Thomas. 2009. Nitrate removal in stream ecosystems measured by N-15 addition experiments: denitrification. Limnology and
Oceanography 54:666–680.
NADP/NTN (National Atmospheric Deposition Program/National Trends Network). 2011.
NADP/NTN monitoring location MI26, Kellogg Biological Station. NADP/NTN
Coordination Office, Illinois State Water Survey, Champaign, Illinois, USA. <http://
nadp.sws.uiuc.edu/sites/siteinfo.asp?net=NTN&id=MI26>
NASS (National Agricultural Statistics Service). 2014. Homepage. U.S. Department of
Agriculture, Washington, DC, USA. <http://www.nass.usda.gov/>
Ogden, C. B., H. M. Van Es, R. J. Wagenet, and T. S. Steenhuis. 1999. Spatial-temporal
variability of preferential flow in a clay soil under no-till and plow-till. Journal of
Environmental Quality 28:1264–1273.
Omonode, R. A., D. R. Smith, A. Gal, and T. J. Vyn. 2011. Soil nitrous oxide emissions in
corn following three decades of tillage and rotation treatments. Soil Science Society
America Journal 75:152–163.
Opdyke, M. R., M. B. David, and B. L. Rhoads. 2006. Influence of geomorphological variability in channel characteristics on sediment denitrification in agricultural streams.
Journal of Environmental Quality 35:2103–2112.
Ostrom, N. E., L. O. Hedin, J. C. von Fischer, and G. P. Robertson. 2002. Nitrogen transformations and NO3− removal at a soil-stream interface: a stable isotope approach.
Ecological Applications 12:1027–1043.
Ostrom, N. E., and P. H. Ostrom. 2011. The isotopomers of nitrous oxide: analytical considerations and application to resolution of microbial production pathways. Pages 453–476
in M. Baskaran, editor. Handbook of environmental isotope geochemistry. Springer
Berlin, Heidelberg, Germany.
Ostrom, N. E., P. H. Ostrom, H. Gandhi, N. Millar, and G. P. Robertson. 2010b. Isotopologue
data reveal denitrification as the primary source of nitrous oxide at nitrogen fertilization gradient in a temperate agricultural field. Geochimica et Cosmochimica Acta
74:A780.
Ostrom, N. E., R. Sutka, P. H. Ostrom, A. S. Grandy, K. H. Huizinga, H. Gandhi, J. C. von
Fisher, and G. P. Robertson. 2010a. Isotopologue data reveal bacterial denitrification
as the primary source of N2O during a high flux event following cultivation of a native
temperate grassland. Soil Biology & Biochemistry 42:499–506.
Palm, C. A., and A. P. Rowland. 1997. A minimum dataset for characterization of plant quality for decomposition. Pages 379–392 in G. Cadisch and K. E. Giller, editors. Driven by
nature. CAB International, Wallingford, UK.
Paludan, C., and G. Blicher-Mathiesen. 1996. Losses of inorganic carbon and nitrous oxide
from a temperate freshwater wetland in relation to nitrate loading. Biogeochemistry
35:305–326.
Parkin, T. B., and T. C. Kaspar. 2006. Nitrous oxide emissions from corn-soybean systems in
the Midwest. Journal of Environmental Quality 35:1496–1506.
Nitrogen Transfers and Transformations 247
1
Parr, M., J. M. Grossman, S. C. Reberg-Horton, C. Brinton, and C. Crozier. 2011. Nitrogen
delivery from legume cover crops in no-till organic corn production. Agronomy Journal
103:1578–1590.
Paul, E. A., A. Kravchenko, A. S. Grandy, and S. Morris. 2015. Soil organic matter dynamics: controls and management for sustainable ecosystem functioning. Pages 104–134
in S. K. Hamilton, J. E. Doll, and G. P. Robertson, editors. The ecology of agricultural
ecosystems: long-term research on the path to sustainability. Oxford University Press,
New York, New York, USA.
Peterson, B. J., W. M. Wollheim, P. J. Mulholland, J. R. Webster, J. L. Meyer, J. L. Tank,
E. Marti, W. B. Bowden, H. M. Valett, A. E. Hershey, W. H. McDowell, W. K. Dodds,
S. K. Hamilton, S. Gregory, and D. D. Morrall. 2001. Control of nitrogen export from
watersheds by headwater streams. Science 292:86–90.
Phillips, C. J., D. Harris, S. L. Dollhopf, K. L. Gross, J. I. Prosser, and E. A. Paul. 2000b.
Effects of agronomic treatments on the structure and function of ammonia oxidizing
communities. Applied and Environmental Microbiology 66:5410–5418.
Phillips, C. J., E. A. Paul, and J. I. Prosser. 2000a. Quantitative analysis of ammonia oxidising bacteria using competitive PCR. FEMS Microbial Ecology 32:167–175.
Phillips, R. E., R. L. Blevins, G. W. Thomas, W. F. Frye, and S. H. Phillips. 1980. No-tillage
agriculture. Science 208:1108–1114.
Pinay, G., C. Ruffinoni, and A. Fabre. 1995. Nitrogen cycling in two riparian forest soils
under different geomorphic conditions. Biogeochemistry 30:9–29.
Randall, G. W., and D. J. Mulla. 2001. Nitrate-N in surface waters as influenced by climatic
conditions and agricultural practices. Journal of Environmental Quality 30:337–344.
Randall, G. W., and J. E. Sawyer. 2008. Nitrogen application timing, forms, and additives. Pages 73–85 in Final report: Gulf Hypoxia and Local Water Quality Concerns
Workshop. Upper Mississippi River Sub-basin Hypoxia Nutrient Committee
(UMRSHNC), American Society of Agricultural and Biological Engineers (ASABE),
St. Joseph, Michigan, USA.
Randall, G. W., and J. A. Vetsch. 2005. Nitrate losses in subsurface drainage from a
corn-soybean rotation as affected by fall vs. spring application of nitrogen and nitrapyrin. Journal of Environmental Quality 34:590–597.
Ranells, N. N., and M. G. Wagger. 1997. Nitrogen-15 recovery and release by rye and crimson clover cover crops. Soil Science Society of America Journal 61:943–948.
Rasmussen, P. E., K. W. T. Goulding, J. R. Brown, P. R. Grace, H. H. Janzen, and
M. Korschens. 1998. Long-term agroecosystem experiments: assessing agricultural
sustainability and global change. Science 282:893–896.
Rasse, D. P., J. T. Ritchie, W. R. Peterson, J. Wei, and A. J. M. Smucker. 2000. Rye cover
crop and nitrogen fertilization effects on nitrate leaching in inbred maize fields. Journal
of Environmental Quality 29:298–304.
Rasse, D. P., and A. J. M. Smucker. 1999. Tillage effects on soil nitrogen and plant biomass
in a corn alfalfa rotation. Journal of Environmental Quality 28:873–880.
Raun, W. R., J. B. Solie, G. V. Johnson, M. L. Stone, R. W. Mullen, K. W. Freeman,
W. E. Thomason, and E. V. Lukina. 2002. Improving nitrogen use efficiency in cereal
grain production with optical sensing and variable rate application. Agronomy Journal
94:815–820.
Rheaume, S. J. 1990. Geohydrology and water quality of Kalamazoo County, Michigan,
1986–88. Water-Resources Investigations Report 90–4028, U.S. Geological Survey,
Books and Open-File Reports Section, Lansing Michigan, Denver, Colorado.
248 Ecology of Agricultural Ecosystems
1
Ribaudo, M., J. A. Delgado, L. Hansen, M. Livingston, R. Mosheim, and J. Williamson.
2011. Nitrogen in agricultural systems: implications for conservation policy. U.S.
Department of Agriculture, Economic Research Service., Washington, DC, USA.
Robertson, G. P. 1982. Nitrification in forested ecosystems. Philosophical Transactions of
the Royal Society of London 296:445–457.
Robertson, G. P. 1997. Nitrogen use efficiency in row crop agriculture: crop nitrogen use
and soil nitrogen loss. Pages 347–365 in L. Jackson, editor. Ecology in agriculture.
Academic Press, New York, New York, USA.
Robertson, G. P. 2000. Denitrification. Pages C181–C190 in M. E. Sumner, editor. Handbook
of soil science. CRC Press, Boca Raton, Florida, USA.
Robertson, G. P., L. W. Burger, C. L. Kling, R. Lowrance, and D. J. Mulla. 2007. New
approaches to environmental management research at landscape and watershed scales.
Pages 27–50 in M. Schnepf and C. Cox, editors. Managing agricultural landscapes for
environmental quality. Soil and Water Conservation Society, Ankeny, Iowa, USA.
Robertson, G. P., J. R. Crum, and B. G. Ellis. 1993. The spatial variability of soil resources
following long-term disturbance. Oecologia 96:451–456.
Robertson, G. P., and A. S. Grandy. 2006. Soil system management in temperate regions.
Pages 27–39 in N. Uphoff, A. S. Ball, E. Fernandes, H. Herren, O. Husson, M. Laing,
C. Palm, J. Pretty, P. Sanchez, N. Snanginga, and J. Thies, editors. Biological approaches
to sustainable soil systems. CRC Press, Boca Raton, Florida, USA.
Robertson, G. P., and P. M. Groffman. 2015. Nitrogen transformations. Pages 421–426 in
E. A. Paul, editor. Soil microbiology, ecology and biochemistry. Fourth edition.
Academic Press, Burlington, Massachusetts, USA.
Robertson, G. P., K. L. Gross, S. K. Hamilton, D. A. Landis, T. M. Schmidt, S. S. Snapp,
and S. M. Swinton. 2015. Farming for ecosystem services: an ecological approach to
row-crop agriculture. Pages 33–53 in S. K. Hamilton, J. E. Doll, and G. P. Robertson,
editors. The ecology of agricultural ecosystems: long-term research on the path to sustainability. Oxford University Press, New York, New York, USA.
Robertson, G. P., and S. K. Hamilton. 2015. Long-term ecological research at the Kellogg
Biological Station LTER Site: conceptual and experimental framework. Pages 1–32 in
S. K. Hamilton, J. E. Doll, and G. P. Robertson, editors. The ecology of agricultural
ecosystems: long-term research on the path to sustainability. Oxford University Press,
New York, New York, USA.
Robertson, G. P., S. K. Hamilton, S. J. Del Grosso, and W. J. Parton. 2011. The biogeochemistry of bioenergy landscapes: carbon, nitrogen, and water considerations. Ecological
Applications 21:1055–1067.
Robertson, G. P., K. M. Klingensmith, M. J. Klug, E. A. Paul, J. R. Crum, and B. G. Ellis.
1997. Soil resources, microbial activity, and primary production across an agricultural
ecosystem. Ecological Applications 7:158–170.
Robertson, G. P., E. A. Paul, and R. R. Harwood. 2000. Greenhouse gases in intensive agriculture: contributions of individual gases to the radiative forcing of the atmosphere.
Science 289:1922–1925.
Robertson, G. P., and J. M. Tiedje. 1985. An automated technique for sampling the contents
of stoppered gas-collection vials. Plant and Soil 83:453–457.
Robertson, G. P., and J. M. Tiedje. 1987. Nitrous oxide sources in aerobic soils: nitrification, denitrification, and other biological processes. Soil Biology and Biochemistry
19:187–193.
Robertson, G. P., and P. M. Vitousek. 2009. Nitrogen in agriculture: balancing the cost of an
essential resource. Annual Review of Environment and Resources 34:97–125.
Nitrogen Transfers and Transformations 249
1
Robertson, G. P., D. A. Wedin, P. M. Groffman, J. M. Blair, E. Holland, D. Harris, and
K. Nadelhoffer. 1999. Soil carbon and nitrogen availability: nitrogen mineralization, nitrification, and soil respiration potentials. Pages 258–271 in G. P. Robertson,
C. S. Bledsoe, D. C. Coleman, and P. Sollins, editors. Standard soil methods for
long-term ecological research. Oxford University Press, New York, USA.
Royer, T. V., M. B. David, and L. E. Gentry. 2006. Timing of riverine export of nitrate and
phosphorus from agricultural watersheds in Illinois: implications for reducing nutrient
loading to the Mississippi River. Environmental Science & Technology 40:4126–4131.
Ruschel, A. P., P. B. Vose, R. L. Victoria, and E. Salati. 1979. Comparison of isotope techniques and non-nodulating isolines to study the effect of ammonium fertilization on
nitrogen fixation in soybean, Glycine max. Plant and Soil 53:513–525.
Salvagiotti, F., K. G. Cassman, J. E. Specht, D. T. Walters, and A. Dobermann. 2008.
Nitrogen uptake, fixation and response to fertilizer N in soybeans: a review. Field Crops
Research 108:1–13.
Sánchez, J. E., T. C. Willson, K. Kizilkaya, E. Parker, and R. R. Harwood. 2001. Enhancing
the mineralizable nitrogen pool through substrate diversity in long term cropping systems. Soil Science Society of America Journal. 65:1442–1447.
Sawyer, J. E., E. D. Nafziger, G. W. Randall, L. G. Bundy, G. W. Rehm, and B. C. Joern.
2006. Concepts and rationale for regional nitrogen rate guidelines for corn. Iowa State
University Extension Publication PM2015, Ames, Iowa, USA.
Scharf, P. C., N. R. Kitchen, K. A. Sudduth, J. G. Davis, V. C. Hubbard, and J. A. Lory. 2005.
Field-scale variability in optimal nitrogen fertilizer rate for corn. Agronomy Journal
97:452–461.
Scharf, P. C., and J. A. Lory. 2009. Calibrating reflectance measurements to predict optimal
sidedress nitrogen rate for corn. Agronomy Journal 101:615.
Schipanski, M. E., and L. E. Drinkwater. 2011. Nitrogen fixation of red clover interseeded
with winter cereals across a management-induced fertility gradient. Nutrient Cycling in
Agroecosystems 90:105–119.
Schmidt, T. M., and C. Waldron. 2015. Microbial diversity in agricultural soils and its relation to ecosystem function. Pages 135–157 in S. K. Hamilton, J. E. Doll, and G. P.
Robertson, editors. The ecology of agricultural ecosystems: long-term research on the
path to sustainability. Oxford University Press, New York, New York, USA.
Senthilkumar, S., A. N. Kravchenko, and G. P. Robertson. 2009. Topography influences
management system effects on total soil carbon and nitrogen. Soil Science Society of
America Journal 73:2059–2067.
Sexstone, A. J., N. P. Revsbech, T. P. Parkin, and J. M. Tiedje. 1985. Direct measurement
of oxygen profiles and denitrification rates in soil aggregates. Soil Science Society of
America Journal 49:645–651.
Sey, B. K., J. K. Whalen, E. G. Gregorich, P. Rochette, and R. I. Cue. 2008. Carbon dioxide
and nitrous oxide content in soils under corn and soybean. Soil Science Society of
America Journal 72:931–938.
Shcherbak, I., N. Millar, and G. P. Robertson. 2014. A global meta-analysis of the nonlinear
response of soil nitrous oxide (N2O) to fertilizer nitrogen. Proceedings of the National
Academy of Sciences USA 111:9199–9204.
Smil, V. 2002. Nitrogen and food production: proteins for human diets. Ambio 31:126–131.
Smith, K. A., and K. E. Dobbie. 2001. The impact of sampling frequency and sampling
times on chamber-based measurements of N2O emissions from fertilized soils. Global
Change Biology 7:933–945.
Smith, R. G., F. D. Menalled, and G. P. Robertson. 2007. Temporal yield variability under
conventional and alternative management systems. Agronomy Journal 99:1629–1634.
250 Ecology of Agricultural Ecosystems
1
Smith, S. J., J. S. Schepers, and L. K. Porter. 1990. Assessing and managing agricultural
nitrogen losses to the environment. Advances in Soil Science 14:1–43.
Snapp, S. S., R. G. Smith, and G. P. Robertson. 2015. Designing cropping systems for ecosystem services. Pages 378–408 in S. K. Hamilton, J. E. Doll, and G. P. Robertson,
editors. The ecology of agricultural ecosystems: long-term research on the path to sustainability. Oxford University Press, New York, New York, USA.
Stadmark, J., and L. Leonardson. 2005. Emissions of greenhouse gases from ponds constructed for nitrogen removal. Ecological Engineering 25:542–551.
Stevens, C. J., N. B. Dise, J. O. Mountford, and D. J. Gowing. 2004. Impact of nitrogen
deposition on the species richness of grasslands. Science 303:1876–1879.
Strock, J. S., P. M. Porter, and M. P. Russelle. 2004. Cover cropping to reduce nitrate loss
through subsurface drainage in the northern US Corn Belt. Journal of Environmental
Quality 33:1010–1016.
Swift, M. J., O. W. Heal, and J. M. Anderson. 1979. Decomposition in terrestrial ecosystems.
University of California Press, Berkeley, California, USA.
Swinton, S. M., N. Rector, G. P. Robertson, C. B. Jolejole-Foreman, and F. Lupi. 2015.
Farmer decisions about adopting environmentally beneficial practices. Pages 340–359
in S. K. Hamilton, J. E. Doll, and G. P. Robertson, editors. The ecology of agricultural
ecosystems: long-term research on the path to sustainability. Oxford University Press,
New York, New York, USA.
Syswerda, S. P., B. Basso, S. K. Hamilton, J. B. Tausig, and G. P. Robertson. 2012.
Long-term nitrate loss along an agricultural intensity gradient in the Upper Midwest
USA. Agriculture, Ecosystems and Environment 149:10–19.
Syswerda, S. P., A. T. Corbin, D. L. Mokma, A. N. Kravchenko, and G. P. Robertson. 2011.
Agricultural management and soil carbon storage in surface vs. deep layers. Soil
Science Society of America Journal 75:92–101.
Tiedje, J. M. 1994. Denitrifiers. Pages 245–267 in R. W. Weaver, J. S. Angle, P. S. Bottomley,
D. Bezdecik, S. Smith, A. Tabatabai, and A. Wollum, editors. Methods of soil analysis.
Part 2, Microbiological and biochemical properties. Soil Science Society of America,
Madison, Wisconsin, USA.
Tyler, D. D., and G. W. Thomas. 1977. Lysimeter measurements of nitrate and chloride
losses from soil under conventional and no-tillage corn. Journal of Environmental
Quality 6:63–66.
van Kessel, C., T. Clough, and J. W. van Groenigen. 2009. Dissolved organic nitrogen: an overlooked pathway of nitrogen loss from agricultural systems? Journal of
Environmental Quality 38:393–401.
van Kessel, C., R. Venterea, J. Six, M. A. Adviento-Borbe, B. Linquist, and K. J. van
Groenigen. 2013. Climate, duration, and N placement determine N2O emissions in
reduced tillage systems: a meta-analysis. Global Change Biology 19:33–44.
van Noordwijk, M., P. C. de Ruitet, K. B. Zwart, J. Bloem, J. C. Moore, H. G. van Faassen,
and S. L. G. E. Burgers. 1993. Synlocation of biological activity, roots, cracks and
recent organic inputs in a sugar beet field. Geoderma 56:265–276.
Vanotti, M. B., and L. G. Bundy. 1994. An alternative rationale for corn nitrogen-fertilizer
recommendations. Journal of Production Agriculture 7:243–249.
Venterea, R. T., M. S. Dolan, and T. E. Ochsner. 2010. Urea decreases nitrous oxide emissions compared with anhydrous ammonia in a Minnesota corn cropping system. Soil
Science Society America Journal 74:407–418.
Vitousek, P. M., D. N. L. Menge, S. C. Reed, and C. C. Cleveland. 2013. Biological nitrogen
fixation: rates, patterns and ecological controls in terrestrial ecosystems. Philosophical
Nitrogen Transfers and Transformations 251
1
Transactions of the Royal Society of London Biological Sciences. <http://dx.doi.
org/10.1098/rstb.2013.0119>
Vitousek, P. M., R. Naylor, T. Crews, M. B. David, L. E. Drinkwater, E. Holland, P. J. Johnes,
J. Katzenberger, L. A. Martinelli, P. A. Matson, G. Nziguheba, D. Ojima, C. A. Palm,
G. P. Robertson, P. A. Sanchez, A. R. Townsend, and F. S. Zhang. 2009. Nutrient imbalances in agricultural development. Science 324:1519–1520.
Wagger, M. G., M. L. Cabrera, and N. N. Ranells. 1998. Nitrogen and carbon cycling in relation to cover crop residue quality. Journal of Soil and Water Conservation 53:214–218.
Wagner-Riddle, C., A. Furon, N. L. McLaughlin, I. Lee, J. Barbeau, S. Jayasundara,
G. Parkin, P. Von Bertoldi, and J. Warland. 2007. Intensive measurement of nitrous
oxide emissions from a corn-soybean-wheat rotation under two contrasting management systems over 5 years. Global Change Biology 13:1722–1736.
Warncke, D., J. Dahl, and L. Jacobs. 2009. Nutrient recommendations for field crops in
Michigan. Michigan State University Extension Bulletin E2904 (revised August 2009),
Michigan State University, East Lansing, Michigan, USA. See also the Soil Fertility
and Nutrient Management Program website at http://www.soil.msu.edu/
Warncke, D., J. Dahl, L. Jacobs, and C. Laboski. 2004. Nutrient recommendations for field
crops in Michigan. Michigan State University Extension Bulletin E2904, Michigan
State University, East Lansing, Michigan, USA. See also the Soil Fertility and Nutrient
Management Program website at http://www.soil.msu.edu/
Weier, K. L., J. W. Doran, J. F. Power, and D. T. Walters. 1993. Denitrification and the dinitrogen/nitrous oxide ratio as affected by soil water, available carbon, and nitrate. Soil
Science Society of America Journal 57:66–72.
Whitmire, S. L., and S. K. Hamilton. 2005. Rapid removal of nitrate and sulfate by freshwater wetland sediments. Journal of Environmental Quality 34:2062–2071.
Wilke, B. 2010. Challenges for developing sustainable nitrogen sources in agriculture: cover
crops, nitrogen fixation and ecological principals. Dissertation, Michigan State
University, East Lansing, Michigan, USA.
Willson, T. C., E. A. Paul, and R. R. Harwood. 2001. Biologically active soil organic matter
fractions in sustainable cropping systems. Applied Soil Ecology 16:63–76.
Yang, J. Y., C. F. Drury, X. M. Yang, R. De Jong, E. C. Huffman, C. A. Campbell, and V.
Kirkwood. 2010. Estimating biological N2 fixation in Canadian agricultural land using
legume yields. Agriculture, Ecosystems and Environment 137:192–201.
Zhu, X., M. Burger, T. A. Doane, and R. W. Horwath. 2013. Ammonia oxidation pathways
and nitrifier denitrification are significant sources of N2O and NO under low oxygen
availability. Proceedings of the National Academy of Sciences USA 110:6328–6333.

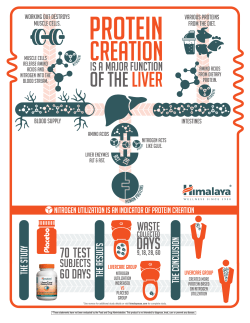


© Copyright 2026