
The Costs of HIV Treatment, Care, and Support Services in Uganda MEASURE
The Costs of HIV Treatment, Care,
and Support Services in Uganda
MEASURE Evaluation
TECHNICAL REPORT
The Costs of HIV Treatment, Care,
and Support Services in Uganda
BY
Scott Moreland
Futures Group/MEASURE Evaluation
Eve Namisango
African Palliative Care Association
Alexander Paxton
Futures Group/MEASURE Evaluation
Richard A. Powell
HealthCare Chaplaincy
February 2013
This research has been supported by the President’s Emergency Plan for AIDS Relief (PEPFAR) through the United States Agency for International
Development (USAID) under the terms of MEASURE Evaluation cooperative agreement GHA-A-00-08-00003-00 which is implemented by the Carolina
Population Center, University of North Carolina at Chapel Hill with Futures Group, ICF International, John Snow, Inc., Management Sciences for Health,
and Tulane University. Views expressed are not necessarily those of PEPFAR, USAID, or the United States government.
TR-13-94 (May 2013). Cover photo: Arne Hoel, World Bank.
Acknowledgements
The authors would first like to acknowledge the financial support of USAID for this study under MEASURE
Evaluation project (Cooperative Agreement Number: GHA-A-00-08-00003-00). We are also grateful for several people who helped with the design and execution of the study. These include Dr. Faith Mwangi-Powell who,
while Executive Director of the African Palliative Care Association (APCA), was inspirational and supportive of
the study. Mark Tusiime of CDC also provided valuable guidance on the study design. Clare Grace Nampijja
Nsubuga, as part of the study team, assisted with data collection and logistics. Joseph Mabirizi of MEASURE
Evaluation provided valuable assistance with data collection and training. We are also grateful to Dr. Jacinto
Amandua, Commissioner for Clinical Services at the Ministry of Health, and to Dr. Flora Banage of CDC/
Uganda, for their helpful comments during the results-sharing meeting held in October, 2012. Lastly, we are
indebted to the staff at each of the sampled facilities for their cooperation and time and to the 637 adult patients
and 208 care-givers of HIV+ children who participated in the interviews. Ultimately, we hope the patients and
staff in the facilities, as well as the Ugandan HIV and AIDS care and support program, will benefit from the
results of this study.
ii
THE COSTS OF HIV TREATMENT, CARE, AND SUPPORT SERVICES IN UGANDA
Executive Summary
The costs of HIV care services in 12 Ugandan public and non-public facilities that provide HIV care and support services were studied. The aims included: to determine the average annual unit cost per patient (adult and
child) for specific HIV treatment, care and support services; to establish the key cost components or “drivers” of
such HIV treatment, care and support services; to determine what costs are borne by patients (“out-of-pocket
costs”) that are not incurred in a clinical facility; and to compare cost variation by level of service delivery. Data
was collected at the facility level on major cost elements, staffing, patient loads and services provided. These were
used to estimate the per-patient costs, including for both anti-retroviral therapy (ART) and non-ART patients.
The study covered both adult and pediatric patients. Patient-level information was also gathered on services
received, physical functionality, socio-economic background characteristics and costs incurred by patients in
receiving care.
Results showed that the annual facility-level cost of providing HIV treatment, care and support to adult HIV
patients ranges from UGX 254,000 to UGX 824,000 ($116.28 to $376.20) across the 12 sites, with a median
cost of UGX 567,000 ($258.78).1 When restricted to adults on ART, annualized costs ranged from UGX
403,000 to UGX 1,330,000 ($183.54 to $606.48), with a median of UGX 734,000 ($335.16). For children,
we found that costs ranged from UGX 190,000 to UGX 1,869,000 ($86.64 to $852.72), with a median cost
of UGX 630,000 ($287.28).
The main cost drivers for both adults and children are ARVs and laboratory tests. Among all adults, ARVs account for some 51% of costs and for children ARVs account for 69%. For laboratory services the percentages
are 21% and 16% respectively. First-line drugs account for the largest share of ARVs.
The study also found that among the facilities contacted, public hospitals had a higher cost per adult patient
than did non-public, not-for-profit hospitals but only by around 12% (UGX 655,018 vs. UGX 582,894.)
Public hospitals had lower staff costs per patient while laboratory costs were higher. By contrast public health
centers have much lower per-patient costs than non-public health centers for adults (UGX 335,625 vs. UGX
512,073.) The major factor here was much cheaper staffing costs in public health centers (UGX 28,850 vs.
UGX 168,845.) Similar patterns were found for children.
Regarding patients’ out-of-pocket expenses on transportation and the value of time lost in seeking and getting
treatment for patients on ART, annualized adult costs were UGX 266,814 and for children UGX 174,090. The
largest component of this cost was the value of time lost.
Septrin/cotrimoxazole as a prophylaxis was the most frequent service and was received among 90% of adults
and children in the sample. ART was received by 83% of adults and 73% of children. Adherence counseling
was the top ranking service among children (91%) and was third in line for adults (78%). Pain control using
non-opioids and pain assessment were in the top ten services received by adults (45% and 44% respectively),
but did not rank in the top ten services for children. Lastly of interest was that among adult respondents, 42%
had received family planning counseling.
1
The exchange rate used was UGX 2,200 per US$, the average during 2010.
THE COSTS OF HIV TREATMENT, CARE, AND SUPPORT SERVICES IN UGANDA
iii
Table of Contents
Section 1: Introduction and Objectives . . . . . . . . . . . . . . . . . . . . . . . . . . . . . . . . . . . . . . . . . . . . . . . . . . . . .1
Section 2: Background and Rationale . . . . . . . . . . . . . . . . . . . . . . . . . . . . . . . . . . . . . . . . . . . . . . . . . . . . . 3
Section 3: Methods . . . . . . . . . . . . . . . . . . . . . . . . . . . . . . . . . . . . . . . . . . . . . . . . . . . . . . . . . . . . . . . . 5
Section 4 Data Collection . . . . . . . . . . . . . . . . . . . . . . . . . . . . . . . . . . . . . . . . . . . . . . . . . . . . . . . . . . . . 11
Section 5: Results . . . . . . . . . . . . . . . . . . . . . . . . . . . . . . . . . . . . . . . . . . . . . . . . . . . . . . . . . . . . . . . . 15
Section 6: Discussion and Summary Results . . . . . . . . . . . . . . . . . . . . . . . . . . . . . . . . . . . . . . . . . . . . . . . . . 33
References . . . . . . . . . . . . . . . . . . . . . . . . . . . . . . . . . . . . . . . . . . . . . . . . . . . . . . . . . . . . . . . . . . . . . 35
Appendix 1: Sample Size Calculation for Patient Interviews . . . . . . . . . . . . . . . . . . . . . . . . . . . . . . . . . . . . . . . 37
Appendix 2: Information Sheet . . . . . . . . . . . . . . . . . . . . . . . . . . . . . . . . . . . . . . . . . . . . . . . . . . . . . . . . 39
Appendix 3: Consent Form . . . . . . . . . . . . . . . . . . . . . . . . . . . . . . . . . . . . . . . . . . . . . . . . . . . . . . . . . . . 41
Appendix 4: Demography Questionnaire . . . . . . . . . . . . . . . . . . . . . . . . . . . . . . . . . . . . . . . . . . . . . . . . . . 43
Appendix 5: Client Service Receipt Inventory . . . . . . . . . . . . . . . . . . . . . . . . . . . . . . . . . . . . . . . . . . . . . . . . 45
Appendix 6: Costing Tool . . . . . . . . . . . . . . . . . . . . . . . . . . . . . . . . . . . . . . . . . . . . . . . . . . . . . . . . . . . . 47
Appendix 7: HIV Cost Study Summaries . . . . . . . . . . . . . . . . . . . . . . . . . . . . . . . . . . . . . . . . . . . . . . . . . . . 51
Appendix 8: List of Facilities by Clinic Number and Name . . . . . . . . . . . . . . . . . . . . . . . . . . . . . . . . . . . . . . . . . 53
iv
THE COSTS OF HIV TREATMENT, CARE, AND SUPPORT SERVICES IN UGANDA
Section 1 Introduction and Objectives
MEASURE Evaluation and The African Palliative Care Association (APCA) conducted
a follow-up study to the HIV care services costing study component of the public health
evaluation (PHE) that was completed in 2009 with King’s College London in association with APCA and MEASURE Evaluation [1]. This new study took place in selected
public and private not-for-profit health facilities across Uganda. The study sought to
provide a broader, more comprehensive insight into the costs of providing HIV care at
differing levels of service delivery in Uganda. The specific objectives included:
• To determine the average annual unit cost per patient (adult and child) for specific
HIV treatment, care and support services;
• To establish the key cost components or “drivers” of such HIV treatment, care and
support services;
• To determine what costs are borne by patients (“out-of-pocket costs”) that are not
incurred in a clinical facility, and;
• To compare cost variation by level of service delivery facility.
THE COSTS OF HIV TREATMENT, CARE, AND SUPPORT SERVICES IN UGANDA
1
Section 2 Background and Rationale
Like many countries in sub-Saharan Africa, Uganda is being hit hard by the AIDS
epidemic. Despite early success in reducing the HIV prevalence rate, recent evidence
suggests that the prevalence rate has risen from 6.4% in 2005 to 7.3% in 2011. This
implies an HIV-positive population of over 1.1 million in 2011 [2]. Moreover, it is
estimated that the number of new infections is double the number of those newly
enrolling in anti-retroviral treatment programs [3].
Globally, in 2008 alone over US$16.8 billion was expended on HIV control [4].
Anti-retroviral therapy (ART) is central to HIV care, contributing significantly to
the cost burden to treatment interventions (more specifically, the ART medicines)
[5]. Currently, 54% of people eligible for ARVs globally and 56% of people in subSaharan Africa receive treatment [4]. Confronted by potentially diminished external
donor funding in the current adverse financial climate, and the transitioning of HIV
from an emergency to a chronic condition [6], many African countries will have to
assume responsibility for the costs of HIV care in the future. Indeed, informed fiscal
budgeting (including the extent to which programs can reduce per-patient costs) will
increasingly be needed over the longer term to ensure that the goal of universal access
to ART is realized.
Despite the importance of care and treatment in national responses to the HIV epidemic, estimating the costs of AIDS programs is a relatively recent development [7].
Moreover, differences in relative pricing structures, program protocols, what programs
include in their definition of ‘care and treatment’ and costing methodologies render the
comparison of study results problematic. Notable recent cost studies include those by
McCoy, et.al. [8], Menzies, et.al. [9], Rosen, et.al. [10], Bikilla, et.al. [5], Martinson,
et.al. [11], Koenig, et.al. [12], and Harling and Wood [13]. Moreover, very few studies have examined the costs for ART programs. Consequently, a costing study of HIV
care and support services, that includes ART, could generate useful insights and reliable
information for policymakers into the costing profile of different intervention components, as well as the amount of monetary resources required to sustain or expand HIV
care and support programs, thereby enabling informed resource-allocation decisions.
The current study is a follow-on to a previous study in Uganda that was funded
through MEASURE Evaluation [1] and that included a cost component. That study
was part of a larger care and support public health evaluation that included the financial costs of service provision at 6 PEPFAR sites. However, there were only 6 sites
surveyed by the study and it was felt that they were not representative of the profiles
of the majority of the typical sites offering HIV care services across Uganda; they had
been chosen because they were large clinical sites with the institutional capacity and
patient throughput necessary to support the evaluation.
Consequently, this study sought to provide a broader, more accurate insight into the
costs of HIV care at differing levels of service delivery in Uganda. The present study
gathered data from 12 sites and included adult as well as pediatric patients.
THE COSTS OF HIV TREATMENT, CARE, AND SUPPORT SERVICES IN UGANDA
3
While the vast majority of the HIV infected population in Africa is adult, pediatric
HIV and AIDS care exists on the continent. For example, of the estimated 1.1 million
HIV+ people in Uganda [14], 10% are calculated to be children, who also account
for 22% of all new infections [15]. In terms of treatment, the country’s Ministry of
Health reports that of 248,222 clients on ART as of September 2010, 19,854 (8%)
were children; similarly among the 18,314 newly enrolled patients during the JuneSeptember 2010 period, 2,000 (11%) were children. The Simms et.al. [1], study only
considered adult patients; indeed, few costing studies investigate pediatric services.
Since pediatric HIV care involves the use of unique staff cadres, (e.g., play therapists,
child psychologists, pediatric nurses), costing profiles can differ from those for adult
patients. Indeed, one recent study in Ghana conducted among a purposive sample of
15 clinical care sites found that the cost per year for a pediatric client was about 10%
higher than that for an adult (i.e., US$663.48 versus US$608.76), with the greater
expense attributable to providing ARVs to the children [16].
4
THE COSTS OF HIV TREATMENT, CARE, AND SUPPORT SERVICES IN UGANDA
Section 3 Methods
3.1
STUDY DESIGN
This was a cross sectional study of service delivery sites with descriptive and analytical
components. Cost data were collected directly from each site as well as from a sample
of adult and pediatric patients presenting at HIV clinics.
3.2
PARTICIPATING FACILITIES
In order to be broadly reflective of current service provision across Uganda, participating sites are comprised of public and private not-for profit health facilities across
Uganda providing comprehensive HIV clinical care, that includes ARVs. Additionally,
sites were included if they were:
• Focused on the care and treatment of HIV-positive people;
• Provided services in a clinical setting;
• Already providing services widely in the clinical setting (i.e., they were not formative sites with fledgling care and treatment services), and;
• ART accredited centers.
3.3
SELECTION AND RECRUITMENT PROCESS
The study selected a purposive sample of 12 of Uganda’s accredited ART centers.2
The sites reflect key characteristics thought to influence unit cost, including: level of
service delivery; major implementing partner; and type of ownership [16].
The main criterion for site selection for this study, however, was the level of facility
service provision. According to a recent ART report published by the Ministry of
Health, Uganda and the STD/AIDS Control Program, in September 2010 there were
419 health facilities providing adult ART services and 309 providing pediatric services
(see Table 1) [17]. Of these, 306 (representing 74% of those providing adult services
and 83% of those providing pediatric services), are at levels HC III and above.
2
The study team considered using a random sample of sites instead of a non-random, purposive sampling approach.
To ensure that the study was completed at relatively low cost, over a short period of time, with sites that were
reflective of current service provision, a purposive sample was selected.
THE COSTS OF HIV TREATMENT, CARE, AND SUPPORT SERVICES IN UGANDA
5
Table 1
Coverage of ART Services by Level, September 2010
Providing adult ART
Providing pediatric ART
Type of service
N
%
Cumulative
%
N
%
Cumulative
%
Regional referral hospitals
15
4
4
15
5
5
General hospitals
101
24
28
89
29
34
Health centre IV
139
33
61
117
38
72
Health centre III
55
13
74
37
12
83
Health centre II
3
1
75
2
1
84
Research and specialized clinics
36
9
83
31
10
94
Private, for-profit
70
17
100
18
6
100
419
100
309
100
Total
Source: Ministry of Health, STD/AIDS Control Program (2010) The Status of Antiretroviral Therapy Service Delivery in Uganda.
Kampala, Uganda: Ministry of Health, Table 3.1
The proportional distribution of these sites is shown in Table 2 in the middle column.
We attempted to apply this percentage distribution to the target number of 12 sites
for this study whilst bearing in mind the need to select at least two regional referral
hospitals with different main donor partners to allow for a comparison of costs based
on donor.
Table 2
Sampling Proportional to Size and Distribution of Sites Selected by Level
Number of facilities
providing ART
% total
Number of sites to
sample
15
5
1
General hospitals
101
33
4
Health center IV
135
44
5
Health center III
55
18
2
306
100
12
Level
Regional referral hospitals
Total
The final study sites selected are shown in Table 3 and their locations on the map in
Figure 1.
6
THE COSTS OF HIV TREATMENT, CARE, AND SUPPORT SERVICES IN UGANDA
Total
306
100
12
The final study sites selected are shown in Table 3 and their locations on the map in Figure 1.
Figure 1
Table 3
Site Locations
Figure 1: Site Locations
Participating Sites by Type and Location
Site name
Level of service
delivery
Gulu Regional Referral Hospital
Regional Referral Hospital Public
Gulu
Infectious Diseases Institute,
Page
MOH
Mbarara Regional Referral Hospital
Regional Referral Hospital Public
Mbarara
MJAP, MOH
Mbuya Reach Out
AIDS clinic
NGO
Kampala
PEPFAR
Mukuju Health Centre IV
Health Centre IV
Public
Kayunga
Baylor Uganda, MOH
Busiu H/CIV
Health Centre IV
Public
Mbale
STAR E/PIDC, MOH
Vikira Hospital
General Hospital
PNFP
Fort portal AIDS RELIEF, MOH
Arua Regional Referral Hospital
General Hospital
Public
Arua
Medicins sans Frontiers,
MOH
Kayunga Hospital
General Hospital
Public
Kayunga
Walter Reed, MOH
St Joseph’s Hospital Kitgum
General Hospital
PNFP
Kitgum
Catholic Relief Services
Kawempe H/CIV
Health Centre IV
Public
Kampala
Infectious Diseases Institute,
PEPFAR, MOH
Holy Cross Kikyusa
Health Centre III
Public
Luwero
Holy Cross / MOH
Kiswa H/C III
Health Centre III
Public
Kampala
Infectious Diseases
Institute/ PEPFAR / MOH
THE COSTS OF HIV TREATMENT, CARE, AND SUPPORT SERVICES IN UGANDA
Type of
ownership District
Main implementing
partner(s)
7
8
3.4
3.4.1
PATIENT INTERVIEWS
Sample Size
The study aimed to conduct 600 interviews (an average of 50 per site) with adults and
200 (an average of approximately 16 per site) with children (or their care-givers.) The
numbers constituting each sample were determined to ensure a reasonable representation of the site populations and to facilitate any required sub-group analysis, rather
than to test a hypothesis. Sampling at the facility level was based on the sampling-bysize approach, using the formula below:
n
N
× ni
n = the total number of HIV/AIDS clients at the specific facility;
N = the total number of HIV/AIDS for all participating facilities;
ni = the total sample size required for the study for the specific target group (i.e., 600
adults and 200 pediatric)
Routine statistics on the total number of clients served in 2010 for each of the participating study sites were obtained from the Ministry of Health national HIV treatment, care and support records. This was used to calculate the number of patients to
interview per site. Sample calculations for each site are found in Appendix 1. In those
instances where the calculated sample size was less than five, we increased the target
number of respondents to ten, especially for pediatric patients.
3.4.2
Inclusion criteria
The study focused on ambulatory HIV/AIDS only and patients were consecutively
recruited if they fulfilled the following inclusion criteria:
Adults:
• Patients (male and female) aged 18 years or over;
• Patients diagnosed HIV positive;
• Patients know of their diagnosis;
• Patients with sufficient cognitive ability to answer the study questions, and;
• Patients who have been receiving HIV care and support services for at least one
month.
Children:
• Care-givers (male or female) aged 18 years or over of child patients (aged 0–17)
years) diagnosed HIV positive;
• Care-givers know of the child’s diagnosis;
• Care-givers with sufficient cognitive ability to answer the study questions, and;
• Care-givers of child patients who have been receiving HIV care and support services for at least one month.
8
THE COSTS OF HIV TREATMENT, CARE, AND SUPPORT SERVICES IN UGANDA
3.4.3
Recruitment procedure
Following the reading of an information sheet (see Appendix 2), participants were
provided a written informed consent on a form (see Appendix 3) to participate in
the study. These documents were translated into the relevant local languages (i.e. Runyakitara, Luganda, Luo and Lugisu), and were read aloud by the researchers if the
participant was illiterate. Participants were given a small compensation (i.e., $2.28)
for their time in the form of refreshment.
3.4.4
Sampling procedure
Patients were consecutively recruited into the study if they fulfilled the above study
inclusion criteria. Since ART is one of the primary cost drivers of HIV care, and based
upon routine statistics findings for the Simms et. al., study [1], the proportion of
pre-ART and on-ART patient sub-groups targeted for selection was 30% and 70%,
respectively. While service utilization may be predicted by staging levels, the irregular recording of that data means patients were not stratified further by that variable;
rather, selection was stratified by ART status and data was collected on WHO clinical
staging. In those instances where this data was unavailable, patients were staged by
facility health workers using Ministry of Health Uganda staging guidelines.
3.4.5
Conduct of patient interviews
Patient interviews were conducted in privacy and anonymously. The patient interview
instruments are found in Appendices 4 and 5. Respondents were informed about the
objectives of the study and that the data collected were treated confidentiality and
only accessed by the investigators. Written informed consent was obtained from all
respondents before the start of the interview, with interviews lasting approximately
15–20 minutes each.
3.5
KEY INFORMANT INTERVIEWS
The key informants who provided information on service costs data were purposively
selected to ensure interviews with the most informed staff about the respective costing
components. These key informants included: clinicians, nurses, social workers, pharmacists/dispensers, hospital administrators or managers, and accountants.
THE COSTS OF HIV TREATMENT, CARE, AND SUPPORT SERVICES IN UGANDA
9
Section 4 Data Collection
4.1
TYPES OF COST DATA COLLECTED
The study captured data on both financial and economic costs. The data collection
instruments for the costs are found in Appendix 6. Financial cost is a measure of the
amount of money spent on a resource or on a health program. Economic cost refers to
the entire cost borne by society and, as such, is based on the concept of opportunity
cost, defined as the value of the next best forgone alternative use for a resource.
Costed inputs included direct and indirect costs.
4.1.1
Direct costs
Direct costs are costs of inputs used in service delivery that can be directly assigned to
patients (e.g., the cost of staff servicing a patient, the cost of medicines and supplies
used, and the cost of diagnostic and other tests performed). In this study, case-specific
direct costs were collected based on the services received by the patient in the previous
30 days prior to the survey.
These included:
• staff time in caring for clients;
• drugs to prevent and treat opportunistic infections;
• ARV drugs;
• medical consumables and supplies used for clinic visits;
• laboratory testing;
• medical equipment;
• vehicles used directly for client care, and;
• physical infrastructure used for client care.
4.1.2
Indirect costs
Indirect costs cannot be directly identified with a service or product—rather, they are
the costs of supporting direct cost activities. Indirect costs incurred by patients were
calculated as the value of foregone productivity because of illness using the human
capital approach, which uses lost earnings as a substitute for the impact that the illness
or disability has on the individuals and society [18, 19]. Data were collected on costs
to program clients (e.g., client time, transport, meals, out-of-pocket payments, user
fees for services or drugs, and so forth).
Waiting time at the facility was also captured to provide an insight into lost working
time. The opportunity cost of the lost working time in the respective settings was
obtained in monetary terms to capture a wider component of patient costs. Major
non-market resource inputs to the HIV treatment, care and support programs (e.g.,
patient/family leisure time) were documented alongside other costs when reporting
the results [18].
THE COSTS OF HIV TREATMENT, CARE, AND SUPPORT SERVICES IN UGANDA
11
At the facility level, indirect costs can be seen as costs of resources and inputs shared
among all patients at the health facility. While it is impossible to assign these cost
types to a specific patient, they nevertheless can be assigned to classes of patients.
Indirect costs included the labor cost of administrative staff, overhead expenses (e.g.,
office supplies, travel expenses, communication, etc.), depreciation of equipment and
assets (e.g., equipment and furniture in the clinical and diagnostic units) and equipment and building used generically at a facility.
4.2
PEDIATRIC PATIENTS
To estimate the costs of providing HIV care, treatment and support to children, the
study used a similar approach that was used for the adults, with some minor adjustments to the data collection instruments. Also, children’s care givers were interviewed,
rather than the children themselves, when completing the services use tool and in
answering questions about out-of-pocket costs incurred.
4.3
VALUATION OF INPUTS
As a general rule, the value of an input should reflect its economic (opportunity)
cost [18]. In most cases, the economic cost is the same as the financial cost (i.e., the
amount paid for the input). In other cases, the economic cost differs if the input was
not purchased at the market price (e.g., donated drugs or volunteer labor).
This study aimed to identify both the financial and market costs of inputs (where a
difference may exist). For donated or subsidized inputs, the study used market prices.
The prices for medicines and medical supplies were obtained from either the National
Medical Stores or Joint Medical Stores for the fiscal year 2009/10. If not available, the
2008/09 prices were used. For laboratory tests, the study used prices from the National Referral Hospital. For capital inputs, 2010 replacement prices from the market
were considered.
4.4
PATIENT BACKGROUND DATA
In addition to out-of-pocket and service utilization data, we collected basic socio-demographic and clinical data (e.g., functionality) to profile the sample. Data collected
included a patient’s age, sex, level of education, socio-economic level and assets. Physical functionality was scored using the Eastern Cooperative Oncology Group (ECOG)
scale [20].
4.5
STUDY LIMITATIONS
Like any study, the present study has limitations. First, while the study gathered cost
information from 12 sites across the country that represent a cross-section of public
and private sites at various levels, it cannot be considered as comprehensive and using
the results to draw general conclusions, especially at the national level, should be approached with caution. Second, while the cost elements that were included are fairly
exhaustive, we did not capture all of the costs. We had intended, for example, to capture “up-stream” costs incurred at central level by the Ministry of Health in overseeing
12
THE COSTS OF HIV TREATMENT, CARE, AND SUPPORT SERVICES IN UGANDA
the national HIV/AIDS care program and similarly by donors and the INGOs that
provide services, but these data are not included. Thirdly, we did not have information
on the length of time HIV patients in the facilities had been diagnosed or how long
they had been in treatment and been on ARVs. This could be important since it would
influence the relative importance of ARVs as a cost driver.
THE COSTS OF HIV TREATMENT, CARE, AND SUPPORT SERVICES IN UGANDA
13
Section 5 Results
5.1
SITE DESCRIPTIONS
This study incorporated 12 clinics that were purposefully chosen to represent a variety
of geographic areas and facility types. In 2011, these sites cared for a total of 137,779
unique patients: 58,579 (43%) patients received some form of HIV-related care, and
33,019 (24%) were on antiretroviral therapy (ART) at some point in the year. Of the
HIV patients, 14% were pediatric. The clinics ranged in size from 1,506 to 20,974
patients per year. All clinics have a significant portion of patients that are HIV-positive
(see Table 4), and all see at least 750 HIV patients per year (Figure 2). Clinics 7 and 12
have the highest volumes of HIV patients and the highest HIV-related expenditures.
Table 4
Numbers and Percentages of HIV Patients at Each Site3
Site
Clinic 1
Clinic 2
Clinic 3
Clinic 4
Clinic 5
Clinic 6
Clinic 7
Clinic 8
Clinic 9
Clinic 10
Clinic 11
Clinic 12
HIV+ adults
Adult patients
on ART
HIV+
pediatrics
Pediatric
patients on
ART
All HIV+
patients
677
246
100
40
777
28
10
4
2
32
2,503
1,370
408
211
2,911
43
23
7
4
50
6,115
2,300
2,700
1,500
8,815
32
12
14
8
46
2,254
860
237
147
2,491
Total
% of all patients
Total
% of all patients
Total
% of all patients
Total
% of all patients
Total
17
7
2
1
19
2,757
1,492
309
188
3,066
64
34
7
4
71
5,300
2,500
2,230
1,200
7,530
38
18
16
9
54
9,893
7,931
650
485
10,543
% of all patients
Total
% of all patients
Total
% of all patients
Total
47
38
3
2
50
7,184
2,950
417
101
7,601
95
39
5
1
100
918
652
112
72
1,030
61
43
7
5
68
2,998
2,336
362
252
3,360
51
40
6
4
57
976
300
118
26
1,094
14
4
2
<1
16
8,905
5,460
456
400
9,361
65
40
3
3
68
% of all patients
Total
% of all patients
Total
% of all patients
Total
% of all patients
Total
% of all patients
Source: Ministry of health, Uganda, Health Management Information System, Routine Statistics, 2012
3
Appendix 8 provides a list of clinic numbers and clinic names.
THE COSTS OF HIV TREATMENT, CARE, AND SUPPORT SERVICES IN UGANDA
15
Figure 2
Figure 2
5.2
Annual HIV Patients: Adult and Pediatric
PER-PATIENT COST OF HIV CARE: ADULT PATIENTS
Figure 3 presents the estimated total expenditures on adult HIV care for each clinic.
The cost of HIV care per adult patient varies greatly across the sites surveyed. Costs
Per-patient
cost252,000
of HIV care:
Adult patients
range
from UGX
($114.54)
to UGX 841,000 ($383.04) (see Table 5 and
Figure4),3 presents
the estimated
on adult HIV
for each
Figure
with a median
cost of total
UGXexpenditures
568,000 ($258.78).
Thecare
survey
sites clinic.
were The cost of
HIV
care
per
adult
patient
varies
greatly
across
the
sites
surveyed.
Costs
range
from UGX 254
purposefully selected, so we cannot assume that the sites are statistically representathousand ($102) to UGX 841 thousand ($336) (see Table 2 and Figure 4), with a median cost of
tive. However, for illustrative purposes we provide summary statistics of the study
UGX 568 thousand ($227). The survey sites were purposefully selected, so we cannot assume
population.
Across the 50,480 adult HIV patients in the study, the mean annual cost
that the sites are statistically representative. However, for illustrative purposes we provide
of summary
care per patient
is UGX
($243.64).Across
The biggest
drivers
of the
cost
statistics
of the536,000
study population.
the 50,480
adult
HIVannual
patients
in the study,
perthe
patient
adult cost
HIVofcare
areper
antiretroviral
medications
(ARVs)
at UGX
meanof
annual
care
patient is UGX
544 thousand
($218).
The273,000
biggest drivers of
($124.26)
percost
person
lab of
tests
at UGX
111,000
($50.16) permedications
person. On (ARVs)
averageat UGX 273
the annual
per and
patient
adult
HIV care
are antiretroviral
forthousand
all 12 clinics,
ARVs
constituted
51%
of costs
and
labs
21% of ($44)
costs.per
Seeperson.
Figure 6.On average
($109)
per person
and lab
tests
at UGX
111
thousand
for all 12 clinics, ARVs constituted 51% of costs and labs 21% of costs. See Figure 6.
The higher average costs seen at Clinics 2 and 9 are primarily due to higher ARV
Theper
higher
average
seensites
at Clinics
2 and5).
9 are
higher ARVcost
costs per
costs
patient
thancosts
at other
(see Table
Theprimarily
relativelydue
lowtoper-patient
patient
than
at
other
sites
(see
Table
2).
The
relatively
low
per-patient
cost
at
Clinics
at Clinics 6 is due to low expenditure on ARVs. Figure 5 presents the percentage cost 6 is due
to low expenditure on ARVs. Figure 5 presents the percentage cost breakdown for each clinic.
breakdown for each clinic.
P a g e 15
16
THE COSTS OF HIV TREATMENT, CARE, AND SUPPORT SERVICES IN UGANDA
Table 5
Adult Patients: Total and Per-Patient Annual Costs of HIV Care (in Thousands of UGX)
Site
Clinic 1
Clinic 2
Clinic 3
Clinic 4
Clinic 5
Clinic 6
Clinic 7
Clinic 8
Clinic 9
Clinic 10
Clinic 11
Clinic 12
Weighted
mean*
Total cost
Per patient
Total cost
Per patient
Total cost
Per patient
Total cost
Per patient
Total cost
Per patient
Total cost
Per patient
Total cost
Per patient
Total cost
Per patient
Total cost
Per patient
Total cost
Per patient
Total cost
Per patient
Total cost
Lab cost
Building,
utilities,
rental
Total
Staff
ARVs
Other
drugs
36,097
73,958
5,363
61,480
64,830
241,728
53
109
8
91
96
357
241,688
1,231,600
138,475
198,400
252,339
2,062,503
97
492
55
79
101
824
149,167
1,264,083
50,037
595,660
29,785
2,088,733
24
207
8
97
5
342
46,136
794,715
44,981
688,280
135,608
1,709,720
20
353
20
305
60
759
245,784
745,128
62,052
260,600
358,073
1,671,637
89
270
23
95
130
606
145,028
705,466
57,071
397,840
40,385
1,345,791
27
133
11
75
8
254
200,614
3,283,487
40,150
2,392,210
524,449
6,440,910
20
332
4
242
53
651
1,212,979
1,455,749
69,016
477,740
463,250
3,678,734
169
203
10
67
64
512
60,003
615,602
18,047
58,460
19,750
771,862
65
671
20
64
22
841
149,184
1,159,026
33,423
136,920
204,367
1,682,919
50
387
11
46
68
561
3,105
190,192
7,591
32,900
485
234,274
14
195
8
34
2
252
306,621
2,264,159
41,048
292,020
2,213,169
5,117,017
Per patient
34
254
5
33
249
575
Per patient
55
273
11
111
85
536
* weighted by adult HIV patients at each clinic
THE COSTS OF HIV TREATMENT, CARE, AND SUPPORT SERVICES IN UGANDA
17
Figure 3
Figure 3
Figure 3
Total Annual Cost of HIV Care (Millions of UGX)
Figure 4
Figure 4
Figure 4
Annual Cost Per Adult HIV Patient (UGX)
Figure 5
Figure 5
Adult HIV Cost Distribution
P a g e 17
P a g e 17
18
Figure 6
THE COSTS OF HIV TREATMENT, CARE, AND SUPPORT SERVICES IN UGANDA
Distribution of Cost Elements Adults- 12 Sites
Staff
Figure 6
Figure 6
Distribution
of Cost
Elements
Distribution
of Cost Elements
Adults—12
SitesAdults- 12 Sites
Building/Utilities
16%
Staff
10%
Lab Cost
21%
ARVs
51%
Other Drugs
2%
5.3
PER-PATIENT COST OF HIV CARE: PEDIATRIC PATIENTS
It is useful to examine pediatric patients separately due to their unique treatment
P a g e 18
regimens. For this population, annual per-patient costs range from UGX 190,000
($86.64) to UGX 1,869,000 ($852.72) (see Table 6 and Figure 7). The median cost of
annual pediatric HIV care is UGX 631,000 ($286.82). The mean annual cost of care
for the 8,099 pediatric HIV patients is UGX 584,000 ($265.45). As with adult HIV
care, the biggest drivers of cost are ARVs and lab tests at UGX 402,000 ($183.54) and
UGX 94,000 ($43.32) per person per year, respectively, constituting 69% and 16%
of costs respectively.
Per-patient costs vary greatly between clinics. Clinic 12’s high cost per pediatric patient is largely due to very high expenditures on ARVs, lab tests, and buildings/utilities/rental (Table 6). Conversely, Clinic 3 has very low expenditures per patient in all
cost categories.
The data show that for children, on average 69% of costs are going for ARVs and 16%
for lab costs (Figures 8 and 9.) This is a higher proportion than we found for adults.
THE COSTS OF HIV TREATMENT, CARE, AND SUPPORT SERVICES IN UGANDA
19
Table 6
Pediatric Patients: Total and Per-Patient Annual Costs of HIV Care (in Thousands of UGX)
Site
Clinic 1
Clinic 2
Clinic 3
Clinic 4
Clinic 5
Clinic 6
Clinic 7
Clinic 8
Clinic 9
Clinic 10
Clinic 11
Clinic 12
Weighted
mean*
Total cost
Per patient
Total cost
Per patient
Total cost
Per patient
Total cost
Per patient
Total cost
Per patient
Total cost
Per patient
Total cost
Per patient
Total cost
Lab cost
Building/
utilities/
rental
Total
Staff
ARVs
Other
drugs
5,332
21,408
1,264
3,210
9,576
40,790
53
214
13
32
96
408
39,396
137,827
15,540
64,020
41,132
297,915
97
338
38
157
101
730
65,863
392,063
6,935
34,960
13,151
512,973
24
145
3
13
5
190
4,851
97,113
5,799
17,620
14,259
139,641
20
410
24
74
60
589
27,547
247,395
3,263
7,860
40,132
326,197
89
801
11
25
130
1,056
64,414
1,007,165
7,189
46,040
16,992
1,141,800
29
452
3
21
8
512
13,181
563,902
11,005
239,710
34,458
862,256
20
868
17
369
53
1,327
70,408
54,446
990
8,820
26,890
161,554
Per patient
169
131
2
21
64
387
Total cost
7,321
61,941
697
2,890
2,410
75,259
65
553
6
26
22
672
18,013
239,093
2,510
19,840
1,999
281,456
Per patient
50
660
7
55
6
778
Total cost
375
19,816
5,634
11,140
59
37,025
Per patient
14
168
48
94
2
314
Per patient
Total cost
Total cost
15,701
410,749
6,718
305,890
113,330
852,388
Per patient
34
901
15
671
249
1,869
Per patient
41
402
8
94
39
584
* weighted by pediatric HIV patients at each clinic
20
THE COSTS OF HIV TREATMENT, CARE, AND SUPPORT SERVICES IN UGANDA
Figure 7
Figure 7
Total Cost Per Pediatric HIV Patient (UGX)
Figure 8
Figure 8
Pediatric HIV Cost Distribution
Figure 8
Figure 9
Figure 9
Distribution of Cost Elements Pediatric Patients—12 Sites
Figure 9
THE COSTS OF HIV TREATMENT, CARE, AND SUPPORT SERVICES IN UGANDA
P a g e 20
P a g e 21
21
5.4
COSTS FOR PATIENTS ON ART
The figures reported above are averaged across all HIV patients in the study; however,
the cost of care for HIV patients on ART is much greater than the cost of care for HIV
patients who are not on an ART regimen. It is logical to examine these groups separately, as the proportion of patients on ART may differ from site to site. Moreover, the
proportion of HIV patients in the study population that are on ART is 56%, which
is twice the reported national average of 28%. This may be due to the fact that we
purposely selected ART-accredited facilities. Therefore, the average per-patient cost of
HIV care in the study population is likely considerably greater than the true national
average. In order to separate the confounding effects of the number of patients on
ART, we estimated the per-patient costs at each clinic for both ART and non-ART
patients with HIV. The cost of antiretroviral medications was applied only to those
patients on ART, and other costs were split proportionally between ART and nonART patients.
As can be seen in Table 7, per-patient annual costs for adult patients on ART range
from UGX 403,000 to 1,330,000 ($183.54 to $606.48). In contrast, HIV-positive
adult patients who are not on ART incur annual costs ranging from UGX 57,000 to
406,000 ($26.22 to $184.68). Figure 10 graphically displays these results for adults,
and Figure 11 displays the same results for pediatric patients.
Adults on antiretrovirals (ARVs) incurred an average annual per-patient cost of UGX
757,000 ($345.42). HIV-positive, non-ART adults incurred a cost of UGX 252,000
($115.14). Pediatric patients on ART have an annual cost of UGX 916,000 ($418.38).
HIV-positive pediatric patients who are not on ART incur an average annual cost of
UGX 142,000 ($64.98). The average annual cost of ARVs per patient on ART is UGX
485,000 ($221.16) for adults and UGX 704,000 ($321.48) for pediatric patients.
22
THE COSTS OF HIV TREATMENT, CARE, AND SUPPORT SERVICES IN UGANDA
Table 7
Annual Per-Patient Costs of HIV Care for ART and Non-ART Patients (in Thousands of UGX)
Adults
Paediatrics
Table 4: Annual per-patient costs
of HIV care for ART and non-ART
patients (in thousands of
Site
ART
Clinic 1
548
Clinic 2
Site
Clinic 1
Clinic 2
Clinic 3
Clinic 4
Clinic 5
Clinic 6
Clinic 7
Clinic 8
Clinic 9
Clinic 10
Clinic 11
Clinic 12
1,231 ART
684 548
1,330 1231
835 684
1330
403 835
733 403
803 733
1,114 803
1114
671 671
691 691
735 735
Minimum
Maximum
Maximum Median
Mean
Median
Weighted Mean*
Mean
403
403 1330
1,330 734
734 815
757
815
Clinic 3
Clinic 4
Clinic 5
Clinic 6
Clinic 7
Clinic 8
Clinic 9
Clinic 10
Clinic 11
Clinic 12
Minimum
Weighted mean*
Non-ART
UGX)
248
Adults
332
Non-ART
135
248
332
406
135
336
406
121
336
319
121
319
309
309
170
170
175
175
5757
320
320
57
57
406
279
406
244
279
252
244
ART
Non-ART
729
194
Pediatrics
1,046
392
ART
Non-ART
306
729
194 45
1046
392 179
840
306
45 255
1,571
840
179
900
1571
255 60
1,622
900
60 459
1622
459 257
796
796
257 119
979
979
119
1,066
1066
117 117
920
920
158 158
1995
969 969
1,995
306
306
1995
950
1,995
1064
950
916
1,064
45
969 45
187 969
267 187
142
267
916
142
*weighted by number of patients of that category at each clinic
757
252
* weighted by number of patients of that category at each clinic
Figure 10
Figure 10
Cost Per Adult HIV Patient: ART vs. non-ART (UGX)
P a g e 23
THE COSTS OF HIV TREATMENT, CARE, AND SUPPORT SERVICES IN UGANDA
23
Figure 11
Figure 11
5.5
Cost Per Pediatric HIV Patient: ART vs. non-ART (UGX)
FIRST- AND SECOND-LINE ARVS
In order
better understand
Firstand to
second-line
ARVs the disparities in per-patient ARV costs, ARVs were clasfirst- and
second-line
for analysis.
FiguresARV
12 and
13ARVs
revealwere
that classified
for
Insified
orderinto
to better
understand
the drugs
disparities
in per-patient
costs,
into
adult
and
pediatric
patients,
first-line
drug
costs
varied
considerably
between
clinics.
first- and second-line drugs for analysis. Figures 12 and 13 reveal that for adult and pediatric
Second-line
drugdrug
costscosts
madevaried
up a relatively
smallbetween
proportion
of expenditures
mostcosts made
patients,
first-line
considerably
clinics.
Second-lineatdrug
For adult
Clinics
9 and 11 hadat
almost
second-line
drug
expenses
upclinics.
a relatively
smallpatients,
proportion
of expenditures
most no
clinics.
For adult
patients,
Clinics 9 and
all.almost
However,
Clinic 5 had
an expenses
especially at
large
on second-line
drugs large
11athad
no second-line
drug
all. expenditure
However, Clinic
5 had an especially
expenditure
on second-line
drugs
compared
to first-line.
patients,
when compared
to first-line.
Forwhen
pediatric
patients,
Clinics 4,For
11,pediatric
and 12 had
no Clinics 4,
11,
and
12
had
no
second-line
drug
expenses,
and
Clinics
3
and
6
had
greater
expenditures
on
second-line drug expenses, and Clinics 3 and 6 had greater expenditures on secondsecond-line
drugs
than
first-line.
line drugs than first-line.
These
clinics do
do not
not
Theseresults
resultsshould
shouldbe
beinterpreted
interpreted with
withcaution.
caution. Differences
Differences between
between clinics
necessarily reflect efficiency or quality of care because they may be attributable to variance in
necessarily reflect efficiency or quality of care because they may be attributable to varipatient populations, case mix, resource restrictions, or preferred drug regimens at each clinic,
ance in patient populations, case mix, resource restrictions, or preferred drug regimens
among other causes. Furthermore, some ARVs can be used as first and second line drugs.
at each clinic, among other causes. Furthermore, some ARVs can be used as first and
Precise data was not available on the number of doses of each ARV that were used for first- or
secondline
linetherapy.
drugs. Precise
data wasisnot
available
the number
doses
of each
ARV
secondOur analysis
based
on theonmost
commonofuse
of each
ARV,
as provided
were
used for. first- or second-line therapy. Our analysis is based on the most combythat
local
physicians
mon use of each ARV, as provided by local physicians.
P a g e 24
24
THE COSTS OF HIV TREATMENT, CARE, AND SUPPORT SERVICES IN UGANDA
Figure 12
Figure 12
Figure 12
ARV Costs Per Adult Patient: First- and Second-Line Drugs (UGX)
Figure 13
Figure 13
5.6
Figure
13 Per Pediatric Patient: First- and Second-Line Drugs (UGX)
ARV Costs
STAFF COSTS
While staffing is not the primary driver of costs at most of the clinics, patient to staff
ratios reveal much about the use of resources and provide clues about the resources
available to each clinic. A clinic with exceptionally low staff costs per patient may
suffer from a large patient burden. Therefore, patient-staff ratios may be an indirect
indicator of quality of care. Here, we examine staffing levels for clinical, non-clinical,
P a g e 25
and all staff (Figure 14). All types of patients (not just HIV) are considered. Administrative staff is not included.
P a g e 25
Significant disparities in patient burden are immediately apparent. Clinics 3 and 11
have the highest patient-staff ratios for clinical staff at 1902 and 1741 annual patients
per staff member, respectively. This is consistent with the low staff costs per patient
in Tables 5 and 6. Clinic 8 had the highest staff cost per patient and, expectedly, the
lowest patient to staff ratios (Clinical: 237.5, Non-clinical: 84.5, and Total: 62.3).
THE COSTS OF HIV TREATMENT, CARE, AND SUPPORT SERVICES IN UGANDA
25
Figure 14
Figure 14
Patient-Staff† Ratios
† does NOT include administrative staff
†does NOT include administrative staff
5.6
COSTS PER PATIENT BY LEVEL AND OWNERSHIP
We grouped the clinic-level cost data by level (hospital and health center) and by
ownership (public and non-public) and we calculated the average costs per patient
in each of these four categories for adults and for children. The results are shown in
Tables 8 and 9 for adults and children respectively. It can be seen that per patient costs
in public hospitals are higher than in non-public for both adults and children but the
reverse is true in the health centers.
Table 8
Cost Per Adult HIV Patient by Level and Ownership
Public hospitals
Non-public
hospitals
Staff
37,948
68,630
28,850
168,845
ARVs
321,544
330,870
203,725
202,638
11,236
16,590
9,875
9,607
Lab cost
151,599
69,074
81,963
66,501
Building, utilities, rental
132,692
97,731
11,212
64,484
Total
655,018
582,894
335,625
512,073
Type of cost
Other drugs
26
Public health Non-public health
centers
centers
THE COSTS OF HIV TREATMENT, CARE, AND SUPPORT SERVICES IN UGANDA
P a g e 26
Table 9
Cost Per Pediatric HIV Patient by Level and Ownership
Public hospitals
Non-public
hospitals
Staff
41,764
67,900
27,276
168,845
ARVs
690,800
725,019
285,626
130,566
22,308
8,603
4,129
2,375
Lab cost
358,218
41,282
18,677
21,151
Building, utilities, rental
116,036
62,789
8,057
64,484
1,229,127
905,593
343,965
387,421
Type of cost
Other drugs
Total
Public health Non-public health
centers
centers
Looking first at the differences in cost by ownership for hospitals it is notable that cost
per patient for labs are significantly higher in the public sector compared to the nonpublic sector. The same is true for the costs attributed to buildings/utilities/rentals.
These differences more than compensate for the lower staff costs per patient in public
hospitals.
As regards health centers where the public sector per patient cost is lower, we can see
that staff costs are significantly higher per patient for both adults and children as are
the estimated costs for buildings, utilities, and rentals. These differences more than
cancel out the lower ARV costs in the non-public clinics.
5.7
EXTRAPOLATING TO A NATIONAL ESTIMATE
As mentioned previously, study sites were not randomly selected, and therefore are
not nationally representative. Data were collected from ART-accredited centers where
treatment is emphasized. This is evidenced by the large disparity between the study
population and the national population with regards to the percentage of HIV patients on ART. However, it may be useful to use our estimates of the costs of HIV care
to provide a preliminary estimate of national costs. Directly scaling the per-patient
costs of HIV care to the national number of HIV patients is likely to over-inflate
the costs of care due to the difference in ART prevalence between the study population and the national population. Instead, scaling the per-patient costs of ART and
non-ART patients to the national numbers for both adult and pediatric patients will
result in a more accurate estimate of the national cost of HIV care. The Ministry of
Health, Uganda’s HIV Surveillance Report 2011 estimates that there are 1,042,711
adult and 149,661 pediatric HIV patients. Of these, 302,361 adults and 26,699 pediatric patients are on ART therapy. Applying our per-patient ART and non-ART cost
estimates to these patient numbers we arrive at an estimate of UGX 457,421,125,491
($208,584,033) for national HIV spending each year (Table 10). Although we account for differences in ART coverage, this estimate does not model the myriad other likely differences between the study population and the national population that
would affect the cost of HIV care.
THE COSTS OF HIV TREATMENT, CARE, AND SUPPORT SERVICES IN UGANDA
27
Table 10
Estimate of National Annual Cost of HIV Care
National patients
% of national
sampled
Per-patient cost
National cost
estimate
Adult ART
302,361
9
756,814
228,830,925,560
Adult non-ART HIV care
740,350
3
252,061
186,613,293,448
26,699
17
916,383
24,466,511,609
122,962
3
142,405
17,510,394,874
1,192,372
5
542,655
457,421,125,491
Type of care
Pediatric ART
Pediatric non-ART care
Total
5.8
RESULTS AT THE PATIENT LEVEL
There were some 637 adult patients and 208 pediatric patients that were recruited
at the 12 sites. Table 11 shows their demographic characteristics. Among both male
and female adults the largest portion of the sample was in the 25–34 age-bracket with
more females than males. Among pediatric patients the 6–10 age range had the most
patients for both girls and boys. In terms of education, a higher proportion of males
completed secondary than females. Among the pediatric patients’ care-givers, around
60% of both males and females had completed primary and 20% had completed
secondary.
28
THE COSTS OF HIV TREATMENT, CARE, AND SUPPORT SERVICES IN UGANDA
Table 11
Demographic Characteristics of the Participants
Adult patients N = 637
Male n (%)
Female n (%)
Both sexes n (%)
18–24
80 (31.62)
90 (25.78)
179 (28.10)
25–34
115 (45.45)
157 (40.89)
272 (42.7)
35–44
53 (20.95)
114 (29.69)
167 (26.22)
5 (19.8)
14 (3.65)
19 (2.98)
Age group
45+
Education
No education
33 (13.04)
70 (18.23)
103 (16.17)
Completed primary
98 (38.74)
206 (53.65)
304 (47.72)
Completed secondary
92 (36.36)
93 (24.22)
185 (29.04)
Diploma
18( 7.11)
15 (3.91)
33 (5.18)
Degree
12 (4.74)
0 (00)
12 (1.88)
6.0 (3.4)
5.2 (2.5)
Other
Mean number of dependents (sd)
Mean distance to facility (sd)
Pediatric patients N = 208
13.83 (1.16)
Male n (%)
Female n (%)
Both sexes n (%)
0–5
17 (19.32)
39 (32.50)
56 (29.62)
6–10
44 (50.0)
53 (44.17)
97 (46.63)
11–17
27 (30.68)
28 (23.33)
55 (26.44)
12 (13.64)
20 (16.67)
32 (15.38)
Completed primary
52 (59.09)
72 (60.00)
124 (59.62)
Completed secondary
18 (20.45 )
22 (18.33)
40 (19.23)
Diploma
5 (5.68)
3 (2.5)
8 (3.85)
Degree
1 (1.14)
3 (2.5)
4 (1.92)
5.3 (2.5)
5.6 (2.5)
Age group
Education
No education
Other
Mean number of dependents (sd)
Mean distance to facility (sd)
9.91 (2.3)
Note also that adult patients lived on average almost 14 kms from the facility and
children lived nearly 10 kms from the facility.
Table 12 shows the clinical stage of patients. We note that for both age groups and
sexes the largest percentage were in ECOG 1, “fully active”, and WHO stage I
THE COSTS OF HIV TREATMENT, CARE, AND SUPPORT SERVICES IN UGANDA
29
Table 12
Clinical Characteristics of Patients Interviewed
Adult patients N=637
Variable
Male
n (%)
Pediatric patients N=208
Female
n (%)
Both sexes
n (%)
Male
n (%)
Female
n (%)
Both sexes
n (%)
Functional performance (ECOG)
Fully active
151 (59.68)
226 (58.85)
377 (59.18)
56 (63.64)
89 (74.17)
145 (69.71)
Restricted
90 (35.57)
147 (38.28)
237 (37.21)
28 (31.82)
31 (25.83)
59 (23.7)
Ambulatory
12 (4.74)
10 (2.60)
22 (3.45)
4 (4.55)
0(0.00)
4 (1.92)
0 (00)
1 (0.26)
1 (0.16)
0 (0.00)
0(0.00)
0 (0.00)
1
104 (41.11)
152 (39.58)
256 (40.19)
31 (35.23)
56 (46.67)
87 (41.83)
2
86 (33.99)
122 (31.77)
208 (32.65)
29 (32.95)
30 (25.00)
59 (28.37)
3
32 (12.65)
56 (14.58)
88 (13.81)
16 (18.18)
17 (14.17)
33 (15.87)
4
4 (1.58)
19 (4.95)
23 (3.61)
2 (2.27)
1 (0.83)
3 (1.44)
27 (10.67)
35 (9.11 )
62 (9.73)
10 (11.36)
16 (13.33)
26 (12.50)
Limited self-care
WHO clinical stage
Missing
Table 13 shows some results from patient interviews that attempted to ascertain the
private financial burden on patients of their HIV status. Adults claimed to spend
UGX 7,069 on transport and care-givers of pediatric patients UGX 6,779. We also
asked them to estimate the value of time lost due to the illness and we see that among
adults this came to UGX 18,700 for the last 30 days and UGX 11,118 for care-givers
of child patients.
Table 13
Private Cost of illness
Cost category
Adult patients
Paediatric patients
7,069
6,779
18,701
11,118
Mean days lost due to illness in the last 30 days
4.07
2.45
Mean school days lost due to illness in the last 30 days
2.46
Mean amount commonly spent on transport for a single visit (UGX)
Mean value of time lost due to illness in the last 30 days (UGX)
Using the data in Table 13 we extrapolated these to an annual basis in Table 14 where
we present the average annual private burden on patients and/or their care-givers. As
expected, adult annual out-of-pocket and opportunity costs were higher than those
for children and the private costs to patients on ART were higher.
Table 14
Estimated Annual Private Costs Per Patient
Adults
30
Pediatric Patients
Private costs
ART
Non-ART
ART
Non-ART
Transport Costs
42,414
28,276
40,674
27,116
Value of Time Lost
224,400
224,400
133,416
133,416
Total Cost per Patient
266,814
252,676
174,090
160,532
THE COSTS OF HIV TREATMENT, CARE, AND SUPPORT SERVICES IN UGANDA
5.9
SERVICES RECEIVED
We used the Client Services Receipt Inventory (CSRI) to ascertain the kinds of services that were being provided to patients (Appendix 5). The CSRI lists some 54 services
that could be received. In Tables 15 and 16 we present the most often received services
defined by a cut-off or 40% or more of patients. We note that there is considerable
overlap between the services received by adults and children, with ART and related
services topping the list. This is consistent with the cost distribution results seen earlier. It is also interesting and encouraging to see that 42% of adults received family
planning services.
Table 15
Most Often Received Services Among Adult Patients—All Clinics
Question
Table 16
N
%
C43
septrin/cotrimoxazole to take every day
575
90.27
C13
ART/ARV (n = 617)
511
82.82
C5
adherence counseling
496
77.86
C14
assess ART treatment
470
73.78
C39
nutritional advice
439
68.92
C10
prevention with positives
415
65.15
C30
treatment for malaria
311
48.82
C18
non-opioids( e.g., paracetemol)
287
45.05
C15
assessment of pain
279
43.87
C54
infection control training
275
43.17
C6
family planning counseling
267
41.92
Most Often Received Services Among Pediatric Patients—All Clinics
Question
N
%
C5
adherence counseling
186
90.73
C43
septrin/cotrimoxazole to take every day
184
89.76
C13
ART/ARV
149
72.68
C39
nutritional advice
142
69.27
C14
assess ART treatment
136
66.34
C10
prevention with positives
130
63.41
C30
treatment for malaria
104
50.73
C38
Multivitamins
99
48.29
C54
infection control training
95
46.34
C40
malnutrition assessment
84
40.98
The services distribution by clinic is shown in Tables 17 and 18 for adults and for
children. These largely mirror the aggregate results in Tables 12 and 13.
THE COSTS OF HIV TREATMENT, CARE, AND SUPPORT SERVICES IN UGANDA
31
Table 17
Most Often Received Services Among Adult Patients (% of HIV Patients)
Clinic
Services
Table 18
1
2
3
4
5
6
7
8
9
10
11
12
Patients interviewed
39
51
18
21
55
16
145
84
40
54
17
97
Septrin/cotrimoxazole daily
98
86
94
100
95
63
92
98
95
98
95
74
ART/ARV
75
60
61
77
82
63
83
81
80
94
55
91
Adherence counselling
98
68
67
92
93
81
63
99
68
87
70
68
Assess ART treatment
73
50
56
77
84
50
82
61
78
85
45
83
Nutritional advice
88
76
89
92
71
88
52
94
63
96
90
31
Prevention with positives
78
68
83
92
82
100
23
96
63
96
80
49
Treatment for malaria
35
52
44
80
51
44
50
45
58
52
30
56
Non-opioids like paracetamol
43
32
6
46
55
6
40
33
60
67
35
62
Assessment of pain
48
34
17
54
49
13
60
29
58
48
20
37
Family planning counselling
43
32
11
23
53
6
24
63
23
83
20
31
Most Often Received Services Among Pediatric Patients (% of HIV Patients)
Clinic
Services
1
Patients interviewed
32
2
3
4
5
6
7
8
9
10
11
12
22
17
10
16
12
32
26
10
27
6
21
Adherence counseling
78
86
100
89
100
87
87
93
78
96
100
90
Septrin/cotrimoxazole daily
89
81
94
100
100
60
97
89
100
93
50
90
ART/ARV
33
52
65
89
80
60
87
63
89
78
100
95
Nutritional advice
78
86
94
56
60
60
39
93
67
89
100
30
Assess ART treatment
33
52
59
89
80
27
81
59
67
74
100
90
Prevention with positives
67
53
75
96
70
74
100
Treatment for malaria
44
43
47
44
40
60
48
52
67
56
100
70
Multivitamins
22
43
82
67
27
80
42
70
11
59
50
5
Infection control training
78
38
59
33
47
40
16
56
67
67
50
35
Malnutrition assessment
33
100
18
100
7
27
19
15
44
96
50
100
82
THE COSTS OF HIV TREATMENT, CARE, AND SUPPORT SERVICES IN UGANDA
Section 6 Discussion and Summary Results
This study found that the annual facility-level cost of providing HIV care and support to adult HIV patients ranges from UGX 254,000 to UGX 824,000 ($116.28 to
$376.20) across the 12 sites, with a median cost of 567,000 UGX ($258.78). This
range is consistent with a 2011 report funded by the USAID Health Initiatives for the
Private Sector (HIPS) Project that examined a total of six HIV treatment sites from
Uganda’s public and private sectors and from a variety of geographic settings [8]. The
HIPS study found that annual costs ranged from $226.86 to $539.22 per adult patient on ART. This is similar to our results for adult ART patients of between $182.40
and $606.48 per patient per year (Table 4). The study by Menzies, et.al., estimated
that adult annual ART treatment costs are much higher at between $1,079.58 and
$1,102.38 [9].
However, as reported above there have been a few other studies from the last 10 years
that estimate ART costs in sub-Saharan Africa (see Appendix 7), but many of them
utilize cost data that were collected 5–10 years ago. The scale of ART therapy rollout
and increased availability of generic ARVs in recent years make it likely that these
older estimates are no longer reliable.
For children, we found that costs ranged from UGX 190,000 to UGX 1,869,000
($86.64 to $852.72), with a median cost of UGX 630,000 ($287.28). At sites where
per-patient pediatric HIV care costs were the greatest, above-average ARV costs were
the primary causes. The data show, then, that HIV care costs for children are higher
than for adults. Few studies have examined the cost of HIV care for pediatric patients
specifically. The Menzies, et.al., data for Uganda show a lower pediatric care cost compared to adults of between $395.58 and $517.56 per year.
The WHO estimates per capita health expenditures in Uganda in 2010 ($141.36)
which translates into annual expenditures of UGX 10.7 trillion for the 2011 population [21]. Using the estimated average costs of care found in this study and using the
actual numbers of reported HIV adult and pediatric patients in 2011 we estimated
a total care and support burden of UGX 447 billion. Using the WHO figure as an
estimate of total health care expenditures and our figures for HIV care and support
translates into a care and support burden of HIV/AIDS of 4.2% of total health care
expenditures in the country.
The main cost drivers for both adults and children are ARVs and laboratory tests.
Among all adults, ARVs account for some 51% of costs and for children ARVs account for 69%. For laboratory services the percentages are 21% and 16% respectively.
So the main costs per patient are accounted for by direct services to the patients. Regarding ARVs we also looked at the distribution of costs between first and second line
drugs. At this point, for the sample of clinics we visited (with one exception: Clinic
6) first line drugs account for the largest share of ARVs. As the HIV-population ages
and when and if resistance to first line drugs builds, this situation may dramatically
THE COSTS OF HIV TREATMENT, CARE, AND SUPPORT SERVICES IN UGANDA
33
change in the future resulting in an increase in costs since second line drugs are more
expensive. Also, given the large proportion of total costs that is comprised of ARV
cost, the trend of per patient cost over time is likely to closely mimic the price trends
of these pharmaceuticals. Moreover, sites may benefit from some standardization of
drug regimens to avoid unnecessary expenditures on more expensive drugs.
The study also found that among the facilities contacted, public hospitals had a higher
cost per adult patient than did non-public hospitals but only by around 12% (UGX
655,018 vs. UGX 582,894.) Public hospitals had lower staff costs per patient while
laboratory costs were higher. By contrast public health centers have much lower nonpublic health centers for adults (UGX 335,625 vs. UGX 512, 073.) The major factor
here was much cheaper staffing costs in public health centers (UGX 28,850 vs. UGX
168,845.) Similar patterns were found for children.
We collected information from patients about some of their out-of-pocket expenses
on transportation, and the value of time lost in seeking and getting treatment. For
those patients on ART, annualized adult costs were UGX 266,814 and for children
UGX 174,090. The largest component of this cost was the value of time lost. These
out-of-pocket costs amount to a high burden for individuals when compared to per
capita income. The World Bank estimates current gross domestic income (GNI) per
capita at $581.40 in Uganda [22]. Converting this to local currency means a GNI per
capita of UGX 1,275,000. Thus for adults, out-of-pocket expenses amount to 20% of
GNI per capita and for children 13% of GNI per capita.
There were only minor differences in the rankings of the most-often received services
by adult and pediatric patients in the study sample. Septrin/cotrimoxazole as a prophylaxis, the most frequent service, was received among 90% of adults and 90% of
children. ART was received by 83% of adults and 73% of children among patients
sampled. Adherence counseling was the top ranking service among children (91%)
and was third in line for adults (78%.) Pain control using non-opioids and pain assessment were in the top ten services received by adults (45% and 44% respectively), but
did not rank in the top ten services for children. We found it interesting that among
our adult respondents, 42% had received family planning counseling.
Our estimate of the overall current annual burden of HIV on national health care
costs is low at 4.2%. However, this is likely to increase in the future. First, universal
access targets for ART, if met, will increase the proportion of patients on ART and
therefore the costs. Also, recent upward trends in prevalence, together with an increased population and longer survival of those on ART, points to increased numbers
of HIV+ patients and costs in the future. Since ARV and laboratory costs are the main
cost drivers for both children and adult patients, costs are tied directly to the number
of patients. Given that drug and lab costs are determined largely by the international
market there is not much that Uganda’s service providers can do to reduce costs without changing regimens or reducing service levels. It is therefore important that the
Ministry of Health, Uganda’s effort to purchase ARVs at the most favorable prices
remains a priority. This will be increasingly the case in the likely event that donor
funding for HIV care and support, including ARVs, decreases in the future.
34
THE COSTS OF HIV TREATMENT, CARE, AND SUPPORT SERVICES IN UGANDA
References
1. Simms V, Harding R, Penfold S, Namisango E, Downing J, Powell RA, Mwangi-Powell F, Nkurunziza GB,
Kwebiiha CN, Kataike J, Moreland S, Higginson IJ (2010). PEPFAR Public Health Evaluation, Care and
Support: Phase 2 Uganda. London: King’s College London and MEASURE Evaluation.
2. Uganda Ministry of Health and ICF International (2012). 2011 Uganda AIDS Indicator Survey: Key Findings. Calverton, Maryland, USA: MOH and ICF International.
3. Nantulya VM. “Our HIV/AIDS Epidemic: What each one of us must do?” Uganda AIDS Commission,
http://www.aidsuganda.org/documents/Our%20HIV%20Epidemic.pdf.
4. UNAIDS report on the global AIDS epidemic 2012.
5. Bikilla AD, Jerene D, Robberstad B, Lindtjorn B (2009). “Cost estimates of HIV care and treatment with
and without anti-retroviral therapy at Arba Minch Hospital in southern Ethiopia.” Cost Effectiveness and
Resource Allocation, 7:6.
6. Institute of Medicine (2007). PEPFAR Implementation: Progress and Promise. Washington DC: National
Academies Press).
7. Kombe G, Dutta A, Baruwa E, Resch S (2009). “Sustaining HIV Services: HAPSAT estimates of resource
needs under alternative policy scenarios.” Presentation. September 15, 2009. Washington, DC: USAID.
8. McCoy K, Kiragga D, Addy B, Feeley FG. “Costs and outcomes of delivering antiretroviral therapy (ART)
in the private and public sectors in Uganda: Final report.” Health Initiatives for the Private Sector (HIPS)
Project. Cardno Emerging Markets USA, Ltd. September 2011.
9. Menzies NA, Berruti AA, Berzon R, Filler S, Ferris R, Ellerbrock TV, et al. “The cost of providing comprehensive HIV treatment in PEPFAR-supported programs.” AIDS. 2011; 25:000–000.
10. Rosen S, Long L, Sanne I. “The outcomes and outpatient costs of different models of antiretroviral treatment delivery in South Africa.” Tropical Medicine and International Health. 2008; 13(8):1005–1015
11. Martinson N, Mohapi L, Bakos D, Gray GE, McIntyre JA, Holmes CB. “Costs of providing care for HIVinfected adults in an urban HIV clinic in Soweto, South Africa.” Journal of Acquired Immune Deficiency
Syndrome. 2009; 50:327–330.
12. Koenig SP, Riviere C, Leger P, Severe P, Atwood S, Fitzgerald DW, et al. “The cost of antiretroviral therapy
in Haiti.” Cost Effectiveness and Resource Allocation. 2008; 6:3.
13. Harling G, Wood R. “The evolving cost of HIV in South Africa: changes in health care cost with duration
on antiretroviral therapy for public sector patients.” Journal of Acquired Immune Deficiency Syndrome. 2007;
45 (3):348–354.
THE COSTS OF HIV TREATMENT, CARE, AND SUPPORT SERVICES IN UGANDA
35
14. Ministry of Health, Kampala, ORC Macro (2006). Uganda HIV/AIDS Sero-Behavioural Survey, 2004–05.
USA: Maryland.
15. Government of Uganda (2010). UNGASS Country Progress Report, January 2008–December 2009. Kampala, Uganda: Government of Uganda.
16. Rosen J, Asante F (2010). Cost of HIV and AIDS Adult and Pediatric Clinical Care and Treatment in Ghana.
Washington, DC: Futures Group, Health Policy Initiative, Task Order 1.
17. Ministry of Health, STD/AIDS Control Programme (2010). The Status of Antiretroviral Therapy Service
Delivery in Uganda. Kampala, Uganda: Ministry of Health.
18. Drummond MF, Schulper MJ, Torrance GW, O’Brien BJ, Stoddart GL (2005). Methods for the Economic
Evaluation of Health Care Programmes. 3rd ed. Oxford, UK: Oxford University Press.
19. Sculpher M (2001). “The role and estimation of productivity costs in economic evaluation.” In: Drummond M, McGuire A (Eds.), Economic Evaluation in Health Care: Merging theory with practice. New York:
Oxford University Press.
20. Oken, M.M., Creech, R.H., Tormey, D.C., Horton, J., Davis, T.E., McFadden, E.T., Carbone, P.P. “Toxicity And Response Criteria Of The Eastern Cooperative Oncology Group.” Am J Clin Oncol 5:649–655,
1982.
21. World Health Organization (2013). Uganda. Retrieved from http://www.who.int/countries/uga/en/
(viewed January 17,2013).
22. World Bank (2013). http://data.worldbank.org/indicator/NY.GNP.PCAP.CD (viewed February 4, 2013).
36
THE COSTS OF HIV TREATMENT, CARE, AND SUPPORT SERVICES IN UGANDA
Appendix 1: Sample Size Calculation for Patient
Interviews
Adult patients
Sample size
Pediatric patients
Sample size
Total number
of patients on
program
Gulu Regional Referral Hospital
2,503
46
408
22
2,911
Mbarara Regional Referral Hospital
8,500
156
650
35
9,150
Mbuya Reach Out
4,034
74
384
20
4,418
Mujuku H/CIV
1,809
33
120
6
1,929
694
13
42
2
736
Virika Hospital
2,998
55
362
19
3,360
Arua Regional Referral Hospital
4,732
87
676
36
5,408
Kayunga Hospital
1,054
19
201
11
1,255
St Joseph’s Hospital Kitgum
3,066
56
309
16
4,716
Kawempe H/CIV
1,384
25
237
13
1,621
Holy Cross Kikyusa
920
17
49
3
969
Kiswa H/C III
902
17
319
17
1,221
32,596
600
3,757
200
Site name
Busiu H/CIV
Totals
THE COSTS OF HIV TREATMENT, CARE, AND SUPPORT SERVICES IN UGANDA
37
Appendix 2: Information Sheet
June 2011
COSTING OF HIV TREATMENT CARE AND SUPPORT SERVICES AT 12 SITES IN UGANDA
You are being invited to take part in a study. Before you decide, it is important for you to understand why the
research is being done, and what it will involve.
Please take time to read / listen to this information carefully and discuss it with friends, relatives and your doctor
if you wish. Please ask us if there is anything that is not clear or if you would like further information. Take
time to decide whether or not you wish to take part.
What is the purpose of the study?
We are trying to establish the cost of providing HIV treatment care and support services at 12 sites in Uganda.
To address this objective we are using two approaches: one involves reviewing facility financial records, and the
second involves interviewing patients / carers on components of care received in the previous thirty days.
Why have I been chosen?
By talking to different patients / carers who are cared for and supported by this organization, we hope to obtain
information on time spent in care, what components of care people receive and costs incurred in care, and this
will help us to estimate the cost of the services. In this way, you have been asked to take part because we would
like to hear your story about the treatment, care and support you / your child receives.
Do I have to take part?
No, you don’t have to take part in the study if you don’t wish to. If you decide to participate, you are free to
withdraw from the discussion at any time, and you don’t have to give a reason. Taking part, withdrawing at any
time, or a decision not to take part at all will not affect the standard of care you receive from this organization
in any way.
What will it involve?
If you do agree to participate, you will be given this information to keep and asked to sign a consent form to
show that you have agreed to take part. A researcher who is working with the African Palliative Care Association (APCA) will arrange a convenient time with you and the other people asked to participate to hold a short
interview.
The discussion will last no more than 15 minutes, unless you wish to talk for longer. After these discussions
there will be no more things for you to do with this study.
Will my taking part in this study be kept confidential?
All the information which we collect will be kept strictly confidential. We will be making notes on the discussion. None of the people who provide your care will be involved in the discussion or have access to the notes.
THE COSTS OF HIV TREATMENT, CARE, AND SUPPORT SERVICES IN UGANDA
39
You will not be identified in any way, and your personal details (for example, your name) will be kept separately
from the information you give. We will NOT let anyone have any information that could identify you. Any
information you give us during the discussion will NOT be kept with anything that could identify you (like
your name or address). You may withdraw your data from the project at any time up until it is used in the final
report.
What happens to the results of the research study?
We will use the interviews in which you participate to write up reports on the costs of HIV treatment, care and
support. Nothing you say will be identified as coming from you.
Who is organizing the research?
This study is being organized by the African Palliative Care Association (APCA) in conjunction with Constella
Features. The Uganda National Council for Science and Technology has reviewed this study and approved it for
your protection.
Who can I contact?
If you would like to talk to someone about the study, or get more information, please contact Eve Namisango,
the Research Coordinator, on 0414 266 251 or the Secretary of the Uganda National Council for science and
Technology on 0414 234 579.
40
THE COSTS OF HIV TREATMENT, CARE, AND SUPPORT SERVICES IN UGANDA
Appendix 3: Consent Form
June 2011
COSTING OF HIV TREATMENT CARE AND SUPPORT SERVICES AT 12 SITES IN UGANDA
Participant’s Statement for Interviews:
• I confirm that I have read and understand the information sheet dated June 2011 for the above study and
have had the opportunity to ask questions.
• I understand that if I decide at any other time during the research that I no longer wish myself to participate
in this project, I can notify the researchers involved and be withdrawn from it immediately without my legal
rights being affected.
• I consent to the processing of personal information about me for the purpose of this research study. I understand that such information will be treated as strictly confidential.
• I agree to take part in the above study.
Print name:
Signature or fingerprint:
Date:
Researcher’s statement
I
(name) confirm that I have carefully explained
the nature and demands of the proposed interviews to the health care professional involved in the pilot study.
Signature:
Date:
THE COSTS OF HIV TREATMENT, CARE, AND SUPPORT SERVICES IN UGANDA
41
Appendix 4: Demography Questionnaire
Demography questionnaire
D1
Facility ID
D2
Type of respondent 1= adult patient 2=carer
P1
For carers only
D3
carer's gender
D4
carer's age
Please indicate the patient's gender
1=male, 2= female
male=1, female=2
I would like to ask you a few questions about your or this child's background:
P2
How old are you (in years)?Write age of the child if it is a carer reporting on behalf of a child
P3
What is the highest level
none=1
of education you attended?
attended primary=2
attended secondary=3
diploma=4
degree or higher=5
P4
On average how much do you earn in a month?
P5
What is the main material
used to make the floors
shillings
natural
earth, mud, sand=1
finished
cement=2
of your house?
linoleum=3
parquet/polished wood=4
tile=5
carpet=6
stone=7
P6
What is the main material
used to make the walls
natural
thatched/straw=1
rudimentary
mud and poles=2
of your house?
un-burnt bricks=3
burnt bricks with mud=4
finished
cement blocks=5
stone=6
Wood timber=7
burnt bricks with cement=8
P7
What is the main material used
natural
thatched=1
to make the roof of your house?
finished
wood/planks=2
corrugated iron sheets=3
asbestos=4
tiles=5
tin=6
cement/concrete=7
P8
What type of toilet do you use at home?
private flush=1
private VIP latrine =2
private traditional pit (covered)=3
private traditional pit (uncovered)=4
public/shared=5
bush/field/other=6
P9
How far from the facility do you
live? (kilometres) If not known,
don't know=888
P10 Using your regular means of transport, how long does it take you to reach this facility
km
mins
P11 How many dependants do you have? for adults and carers only
(family members who are dependent on you including children)
THE COSTS OF HIV TREATMENT, CARE, AND SUPPORT SERVICES IN UGANDA
43
P12
What is the main source of
safe
drinking water for your house?
bottled=0
piped inside house=1
piped outside house (yard, public tap)=2
protected well=3
borehole=4
spring/rain water=5
unsafe
unprotected well=6
river/stream/pond=7
tanker truck=8
P13
What type of fuel does your
electricity=01, lpg/natural gas=02
household mainly use
biogas=03, paraffin/kerosene=04
for cooking?
coal=05, charcoal from wood=06
firewood=07, straw/shrubs/grass=08
dung=10, no food cooked in household=11
P14.1
Does anyone in the
P14.2
household own a …?
P14.3
car
yes = 1, no = 2
bicycle
refrigerator
P14.4
television
P14.5
mobile phone
P14.6
radio
P15 How many working/school days have you or your child lost due to
HIV-related illness in the previous 30 days?
P16 Do you /your child have an informal carer at home? 1 yes 2 No
P17 In the last 30 days how many days did your carer spend attending to you or this child ?
Estimate the money worth of this lost time (how much would you pay
P18 someone to do the work your carer lost or could not do then?Shs
P19
P20
What date did you /this child enrol into this facility?
dd/mm/yy
unknown day= 15, unknown month= 06, unknown year =08/08/888
ECOG rated by the Interviewer
Physical Function of the patient
0= fully active, able to carry on all pre-disease performance without restriction
1=Restricted in physically strenuous activity but ambulatory and able to carry out light work, e.g., light house work, office work
2=Ambulatory and capable of all selfcare but unable to carry out any work activities. Up and about more than 50% of waking hours
3=Capable of only limited selfcare, confined to bed or chair more than 50% of waking hours
4=Completely disabled. Cannot carry on any selfcare. Totally confined to bed or chair
P21
P22
P23
44
date diagnosed HIV+
dd/mm/yy
unknown day= 15, unknown month= 06, unknown year =08/08/888
date started on ARV treatment
dd/mm/yy
unknown day= 15, unknown month= 06, unknown year =08/08/888
777777=not on ARV
Current WHO clinical stage (1-4)
8=don't know
THE COSTS OF HIV TREATMENT, CARE, AND SUPPORT SERVICES IN UGANDA
Appendix 5: Client Service Receipt Inventory
CSRI
date
Facility ID
Please indicate type of clientele
1= Pediatric 2=Adult
Ask the patient /carer if they have received the following care in the last 30 dIf yes, where?
Time spent
Category
with provider
Component of care
Have you/this child received t This facility=1
of care
care from any facility
elsewhere=2
in the last month?
If A=2 or 8, B=7
if A=2 or 8, C=7
B
C
1=yes, 2=no A
Question number
C1
Question section:
Spiritual
visit by pastor etc
C2
prayer with staff
C3
contact with traditional healer
C4
Psychological
pre and post test counselling
C5
adherence counselling
C6
family planning counselling
C7
patient HIV support groups
C8
family counselling
C9
psychiatric therapy
Clinical
C10
in minutes
Prevention
prevention with positives
General
C11
wound care
C12
other nursing care
C13
ART/ARV
C14
assess ART treatment
C15
assessment of pain
C16
strong opioids eg morphine
C17
weak opioids eg codeine
Pain
C18
non-opioids eg paracetemol
C19
treatment for neuropathic pain
Symptom management
C20
anxiety/depression treatment
C21
treatment for nausea/vomiting
C22
treatment for skin rash/itching
C23
treatment for diarrhoea, including ORS or drip
C24
treatment for constipation/laxatives
C25
treatment for genital thrush
C26
treatment for oral thrush/candidiasis
C27
treatment for cryptococcal meningitis
THE COSTS OF HIV TREATMENT, CARE, AND SUPPORT SERVICES IN UGANDA
45
Facility ID
Date
Category
Component of care
of care
Question number
Time spent
care from any facility
this facility=1
with provider
in the last month?
elsewhere=2
in minutes
1=yes, 2=no, 8=don't know
If A=2 or 8, B=7
if A=2 or 8, C=7
A
B
Question section:
C28
treatment for other fungal infections
C29
treatment for herpes (e.g. acyclovir)
C30
treatment for malaria
C31
TB testing
C32
have you/this child received thIf yes, where?
C
TB treatment
C33
therapeutic feeding for severe malnutrition, i.e. drip or
RUTF
C34
treatment for other opportunistic infections
C35
management of cancer
C36
physiotherapy i.e. excercises to help improve movement
Prophylaxis
C37
food
C38
multivitamins
C39
nutritional advice
C40
malnutrition assessment
C41
nutrition counselling
C42
provided access to safe drinking water at home
C43
septrin/cotrimoxazole to take every day
C44
isoniazid (INH) to prevent TB
C45
condoms
C46
mosquito bednets
C47 Social
provide household items
C48
home help e.g. help with bathing, housework, cooking
C49
employment training/IGA
C50
transport/money for bus to care centre
C51
legal services
C52
memory book work
C53
loans/microfinance
C54
infection control training
C55 Did you/this child sleep under a bednet last night?
1=yes, 2=no
C56 Did you/this child take cotrimoxazole yesterday?
1=yes, 2=no
How much have you spent on your care in past month (inclu transport to facility and drugs)
C57
At this facility?
shillings
C58
Anywhere else?
shillings
C59 On transport to the facility today ?
C60
What means of transport do you commonly use to come to the health facility
1 Walking
2 Taxi/Bus
3 Bicycle
4 Motor cycle
End of interview
46
Thank patient
shillings
Complete front cover
THE COSTS OF HIV TREATMENT, CARE, AND SUPPORT SERVICES IN UGANDA
Appendix 6: Costing Tool
Facility number
Date
Completed by :
Type of clinic clientele 1=Adult clinic 2=Pediatric clinic
(1) Patient numbers
1
total number of individuals cared for in past year (2010):
2
# individuals provided with any HIV care in past year (2010), including ART and non-ART:
3
of those, total number of individuals provided with ART in past year (2010):
NB: All following questions refer to HIV care only and in the context of patients being HIV positive
(2) staff
ask a range of staff (doctor, nurse, counsellor, CHW)
staff type
4.1.1
doctor 2
4.2.1
nurse 1
4.2.2
nurse 2
4.3.1
counsellor 1
4.3.2
counsellor 2
4.4.1
community health worker 1
4.4.2
community health worker 2
4.5.2
4.5.3
4.6.0
per week
clinical officer
Dispenser
lab staff
psychiatric nurse
4.7.1
Palliative care nurse
4.8.0
Total hours worked
Pharmacist
4.7.0
4.7.2
Total number of hours spent
with HIV patients per week
doctor 1
4.1.2
4.5.1
Total number of HIV patients
you see in a typical day
Psychologist
Nutritionist
4.9.0
volunteer
4.10.1
play therapist
THE COSTS OF HIV TREATMENT, CARE, AND SUPPORT SERVICES IN UGANDA
47
Facility number
Date
(3) medicines
medicine
5
Abacavir (ABC)
6
Didanosine (ddI)
7
Efavirenz (EFV)
8
Indinavir (IDV)
9
Lamivudine (3TC)
ask pharmacist Option A
OR ask clinician/pharmacist option B
Actual quantity dispensed
Estimated quantity used by typical pt in 3 mths (tabs)
in last 3 mths of 2011 (tabs)
on ART
pre-ART
Lopinavir (LPV) + Ritonavir (RTV)
10
11
Nelfinavir (NFV)
12
Nevirapine (NVP)
13
Stavudine (d4T)
14
Stavudine + Lamivudine
15
Stavudine + Lamivudine + Nevirapine
16
Tenofovir (TDF)
17
Tenofovir + Emtricitabine (FTC)
18
Zidovudine (ZDV)
19
Zidovudine + Lamivudine
20
Zidovudine + Lamivudine + Nevirapine
21
strong opioids e.g. morphine
22
Septrin/cotrimoxazole
23
weak opioids e.g. codeine
non-opioid painkillers (name 3 most common)
24.1
1. ______________________________
24.2
2. ______________________________
24.3
3. ______________________________
*
25
TB treatment
Facility number
Date
(3) medicines continued
medicine
ask pharmacist Option A
OR ask clinician/pharmacist option B
Actual quantity dispensed
Estimated quantity used by typical pt in 3 mths (tabs)
in last 3 mths of 2011 (tabs)
on ART
pre-ART
other antibiotics for opportunistic infections (name 3 most common)
26.1
26.2
26.3
Name 2 most common first line ART regimens:
Actual number of patients
Estimated number of patients on this regimen
on this regimen
27.1
1.___________________________________
27.2
2.___________________________________
28.1
1.___________________________________
28.2
2.___________________________________
Name 2 most common second line ART regimens:
(4) lab tests
ask lab staff and doctor
test
Option A
or Option B
Actual number of tests this facility
Estimated number of tests a typical patient
conducted in last 3 mths
receives in 3 months
on ART
29
liver function test (LFT)
30
AFB smear (TB)
31
CD4 count
32
haematology test (FHG)
33
viral load
48
pre-ART
THE COSTS OF HIV TREATMENT, CARE, AND SUPPORT SERVICES IN UGANDA
Facility number
Date
(5) building infrastructure and utilities (all, not only HIV)
34
ask accountant/manager
Utility costs per month (shillings)
Include water, electricity, generator fuel,
communications, waste disposal etc
35
Transport costs, fuel, drivers, maintenance (shillings)
36
Clinical consumable costs per month (shillings)
Include gloves, syringes, cotton wool
swabs, plasters, soap, sterilising solution etc
37
amount spent on volunteer staff (inclu training,
travel reimbursements, payment in kind) in past 3 months (shillings)
(6) capital costs
38
ask accountant
(operations and maintenance officer)
approximate total facility space (sq m)
39
approximate facility space for HIV care (sq m)
40
rent per month, or estimated rental value
41
number of four-wheeled vehicles
42
number of two-wheeled vehicles
Reliability of the data: -----------------------------------------------------------Sources : ------------------------------------------------------Designations and names of personnel interviewed
THE COSTS OF HIV TREATMENT, CARE, AND SUPPORT SERVICES IN UGANDA
49
Appendix 7: HIV Cost Study Summaries
Source
$ Year (data year)
Country
Number of
facilities
Simms, et.al.
2009 (2009)
Uganda
6
Public PEPFAR-supported Adult HIV+
facilities
$41–719
Simms, et.al.
2009 (2009)
Kenya
6
Public PEPFAR-supported Adult HIV+
facilities
$77–1,160
McCoy, et al.
2010 (2011)
Uganda
6
Public and private; various Adult ART patients
geographic locations
$199–473
Menzies, et al.
2009 (2006–2007)
Uganda
7
Unclear; geography
unclear
Adult and pediatric HIV+
patients
Pre-ART: $142
ART: $843
Adult ART: $947–967
Paediatric ART: $347–454
Rosen, et al.
2006 (2005)
South Africa
4
Public, private, and NGO
Adult ART patients
$756–,126
Bikilla, et al.
2005 (2003–2006)
Ethiopia
1
Public
HIV+ patients over
age 15
ART: $235
Non-ART: $38
Martinson, et al.
2004 (2004–2005)
South Africa
1
NGO
Adult HIV+ Patients
Stable ART: $1,428
Non-Art: $754
Koenig, et al.
2004 (2003–2005)
Haiti
1
Urban HIV clinic (funding
source unclear)
Adult ART patients
$960
Harling, et al.
2004 (2004–2006)
South Africa
1
Public/NGO partnership;
periurban
All HIV+ patients
First year ART: $2,502
Second year ART: $1,372
Setting
THE COSTS OF HIV TREATMENT, CARE, AND SUPPORT SERVICES IN UGANDA
Patient population
Annual per-patient
cost
51
Appendix 8: List of Facilities by Clinic Number and Name
Clinic Number
Clinic Name
1
Busiu
2
Gulu
3
Kawempe
4
Kayunga
5
Kitgum
6
Kiswa
7
Mbarara
8
Mbuya
9
Mukuju
10
Virika
11
Kikyuusa
12
Arua
THE COSTS OF HIV TREATMENT, CARE, AND SUPPORT SERVICES IN UGANDA
53
MEASURE Evaluation
Carolina Population Center
University of North Carolina at Chapel Hill
206 W. Franklin Street
Chapel Hill, NC 27516
www.measureevaluation.org

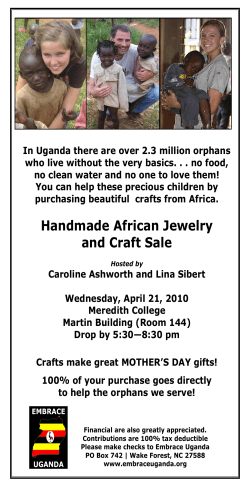


© Copyright 2026