
EC106 Sundays River Draft IDP 2015-16 - MFMA
SUNDAYS RIVER VALLEY MUNICIPALITY DRAFT IDP 2015/2016 1 TABLE OF CONTENTS Chapter 1: EXECUTIVE SUMMARY (i) Mayor‘s Foreword………………………………………………………………………. 4 (ii) Message from the Municipal Manager …………………………………………… 5 1.1. Introduction…………………………………………………………………………….. 6 1.2. Legislation Requirement of the IDP………………………………………………… 6 1.3. The 2014/15 IDP review Process…………………………………………………….. 7 1.4. IDP Institutional Arrangement……………………………………………………….. 15 1.5. Annual Review of IDP…………………………………………………………………. 17 1.6. Provisional Outcomes of the IDP Community Consultation Meetings……… 18 Chapter 2: SITUATIONAL ANALYSIS 2.1. Demographic Profile…………………………………………………………………. 2.2. Institutional Development…………………………………………………………… 2.3. Service Delivery: Roads, Stormwater and Energy………………………………. 2.4. Community and Social Services……………………………………………………. 2.5. Local Economic Development……………………………………………………… 2.6. Good Governance……………………………………………………………………. 2.7. Financial Viability and Management………………………………………………. 25 35 37 40 43 44 45 Chapter 3: STRATEGIC DIRECTION 3.1. Introduction……………………………………………………………………………….. 63 3.2. Vision………………………………………………………………………………………… 63 3.3. Mission………………………………………………………………………………………. 63 3.4. Core Values………………………………………………………………………………… 63 3.5. Strategic Direction………………………………………………………………………… 64 3.6. SWOT Analysis………………………………………………………………………………. 65 3.7. The Sundays River Municipal Management Charter………………………………. 65 Chapter 4: PERFORMANCE MANAGEMENT 4.1. The Nature of Performance Management………………………………………….. 74 4.2. The Management of Performance……………………………………………………. 75 Chapter 5: PROJECTS Sundays River Valley Sub-regional Service Delivery Summit Resolutions…………… 78 Service Delivery Budget Implementation Plan…………………………………………… 87 Annexure Organogram 2 CHAPTER 1: EXECUTIVE SUMMARY 3 (i) MAYORS FOREWORD As we are about to commit resources, time and our energies in a new financial year, it is prudent to reflect on some of the challenges and successes we bring into the year 2015/2016. Sundays River Valley is still home to large amounts of citrus production that assist this region, the Eastern Cape Province and the country in revenue. Closer to home, citrus production makes available thousands of jobs that in their absence the large numbers of people in the Valley and neighboring towns would be hamstrung. In this financial period I have urged all the councilors and the management of the Municipality to work at their level best to make this Municipality the best it can be. We are nonetheless not disillusioned by the challenges we face. We have been at the receiving end of a brutal and financially costly protest that has left our buildings to ruin. This has been a most unfortunate event that we condemn in the strongest way possible. We cannot take for granted our people and the frustrations they have, in the same breath we cannot pretend that the destruction of Municipal buildings is the best way or even the only way to deal with such frustrations. As the leadership of the Municipality we have to work harder to open the lines of communication, to strengthen the avenues of accountability via the ward committee system and the community development worker route. We are still plagued by the appalling conditions of our roads and the quality of drinking water in areas such as Glencorner, Kleinpoort, Nomathamsanqa and Enon and Bersheba. We will work tirelessly with sector departments to bring about change in these areas. The plight of our people is known to us. Now is the time to reconnect with the people of the Sundays River Valley and to recommit our energies into bringing about a positive change into their lives. Nothing is impossible if we work together, pursuing a common goal, coming from all backgrounds and political affiliations. I thank you Mayor ZS Lose 4 (ii) MESSAGE FROM THE MUNICIPAL MANAGER The administration of the Municipality is primarily concerned with the efficient provision of basic services as per local government‘s constitutional mandate. This can be achieved by a capable and competent municipal workforce. As such we have filled all section 56 posts even though we had struggled to fill the position of Chief Financial Officer, which we eventually did fill by the later end of 2013/2014. We are still faced with a challenge of filling critical posts though we endeavor to do this within reasonable. I can gladly say we have competent people in key positions. We are focusing all our energies on improving our performance in critical areas as highlighted by the Auditor General. We are also keeping a keen eye on our spending on grants as well as increasing our revenue. The secret to a wellfunctioning municipality is regular and constant provision of support to lower level employees by management – this allows accountability to flow without complication both internally and externally. This year we will endeavor to bring the Municipality closer to the people. This Municipality will prioritize basic service provision; water and roads will be our primary focus. We will not neglect local economic development – strategic interventions that will enable our local economy to flourish will be enhanced. We already have projects in the pipeline that will allow make a significant impact in the lives of our people. I am alive to the challenges we face as a small Municipality, they require resolve and dedication from the political leadership and from the administrative component. We will work tirelessly to bring about change in this Municipality. I thank you Municipal Manager LMR Ngoqo 5 1.1. INTRODUCTION Sundays River Valley Municipality (SRVM) Integrated Development Plan (IDP) is the principal strategic planning instrument which guides and informs all planning, budgeting, management and decision making processes in the municipality. It is informed by the Municipal Systems Act 2000 (Act No 32 of 2000) which stipulates each elected council must, within a prescribed period after the start of its elected term, adopt a single, inclusive and strategic plan for the development of the municipality which – a) Links, integrates and co-ordinates plans and takes into account proposals for the development of the municipality; b) Aligns the resources and capacity of the municipality with the implementation of the plan; c) Forms the policy framework and general basis on which annual budgets must be based; d) Complies with the provisions of this Chapter; and e) Is compatible with national and provincial development plans and planning requirements binding on the municipality in terms of legislation. The SRVM‘s IDP is also guided by the Constitution, which gives specific powers and responsibilities to local government. The municipality is responsible for providing roads, Electricity (in certain areas), water for household use, sewage and sanitation, storm water systems, refuse removal, fire fighting services, decisions around land use, municipal roads, licensing for street trading, libraries and other services. Lastly, the IDP is informed by national and provincial government priorities, emerging trends and other related issues that provide a framework in which SRVM can ensure developmental local government. 1.2. LEGISLATIVE REQUIREMENTS OF THE IDP The formulation of the IDP must be guided by various pieces of legislation; amongst others are the following: The Integrated Development Planning process originates in the Constitution of the Republic of South Africa (Act 108 of 1996), which enjoins local government to: • Provide democratic and accountable government to all communities; • Ensure the provision of services to communities in a sustainable manner; • Promote social and economic development; • Promote a safe and healthy environment; and • Encourage the involvement of communities and community organisations in matters of local government. 6 Chapter 5, Section 26 of the MSA indicates the core components of an IDP and that such an IDP must reflect the following: The municipal council‘s vision for the long term development of the municipality with special emphasis on the municipality‘s most critical development and internal transformation needs. An assessment of the existing level of development in the municipality, which must include an identification of communities which do not have access to basic municipal services. The council‘s development priorities and objectives for its elected term, including its local economic development and internal transformation needs. The council‘s development strategies which must be aligned with any national and provincial sectoral plans and planning requirements that are binding on the municipality in terms of legislation. A spatial development framework which must include the provision of basic guidelines for a land use management system for the municipality. The council‘s operational strategies. Applicable disaster management plans A financial plan, which must include a budget projection for at least the next three years. The key performance indicators and performance targets determined in terms of Section 41 of the MSA. The Municipal Planning and Performance Management Regulations (of 2001) set out further requirements for an IDP: An institutional framework is required for implementation of the IDP and to address the municipality‘s internal transformation; Investment initiatives; Development initiatives including infrastructure, physical, social and institutional development; and All known projects, plans and programmes to be implemented within the municipality by any organ of state. 1.3. THE 2015/16 IDP REVIEW PROCESS The Municipal Systems Act also provides for the annual revision of a municipality‘s IDP, to ensure that it remains relevant to its specific operating environment including political, socioeconomic or other changes that may occur. This annual review also enables SRVM to update its IDP, based on its overall performance. The following process was followed during the development of the 2015/16 IDP: Preparation process The IDP process plan was developed in August 2014 in line with district framework and incorporated within the Finance: Budget Preparation Timetable: 2015/2016 that was adopted by Council on the 28th of August 2014. 7 Salient aspects of the adopted process plan are reflected below Deliverable /Activity Development of IDP Framework /Process Plan/Budget schedule Tabling of IDP Framework and process plan/Budget schedule to Council for adoption 28 Aug 2014 Review of performance report by internal audit unit. Submission of annual performance report with AFS 29 Aug 2014 Submit adopted Process Plan and Council Resolution to ECDCOGTA Launch and advertisement of the IDP review process SRVM IDP Steering Committee Meeting IDP rep forum meeting with Cacadu District Municipality 18 Sept 2014 Consolidation of quarterly POEs for review by Internal audit First Quarter Performance Report Review of annual Responsibility August 1 2 3 4 September 1 2 3 4 October 1 2 3 IDP Unit/ Cogta EC (Section 31 of MSA) Mayor Internal audit unit IDP and Finance IDP Unit IDP Unit IDP/PMS and Internal IDP/PMS MPAC 8 4 Deliverable /Activity performance by MPAC 19 Sept 2014 IGR forum meeting Community Based Planning roll-out in eight (8) wards Situational analysis – municipal wide analysis SRVM Consultation with CDM and progress reporting 14 Oct 2014 Consultation with District IDP Coordinators 30 Oct 2014 Responsibility Consideration of MEC comments on the IDP New Operating Mediu m-Term expenditure focus 2013/1 4 Budget Input Forms IDP Task Team August 1 2 3 4 September 1 2 3 4 October 1 2 3 IDP Unit & Mayor IDP Unit and External Stakeholders Planning Unit Task team /IDP IDP Unit and CDM planning unit IDP Unit Provide HOD‘s with baseline for new operating MedTerm Expenditure focus Prepare budget documen ts and input forms 9 4 Deliverable Responsibility November /Activity 1 2 3 IDP/Budget IDP Steering Steering Committee Committee meeting to confirm priorities 4 December 1 2 3 4 January 1 2 3 4 Review of IDP Unit / IDP objectives and Task Team strategies Development IDP Unit and confirmation of IDP strategies Compile Draft projects Consultation with Cacadu District Local Municipality on Draft projects 27 Nov 2014 Confirmation of existing Projects and identification of new projects Submission of projects to Finance department Budget Committee Meeting Consolidation of POEs for quarterly assessments Drafting of second quarter performance Planning Unit Ward committees, IDP Unit Finance IDP Unit and CFO and IDP Unit Section managers 56 IDP/PMS 10 Deliverable Responsibility November /Activity 1 2 3 reports Reviewed CFO tariffs and charges Adjustment CFO Budget Consultation CDM planning with CDM unit and SRVM 27 Jan 2015 IDP Unit Annual Report Mayor tabled to Council 30 Jan 2015 Action plan continued… Deliverable Responsibility November /Activity 1 2 3 IDP/Budget IDP Steering Steering Committee Committee meeting to confirm priorities 4 December 1 2 3 4 December 1 2 3 4 January 1 2 3 4 4 January 1 2 3 4 Review of IDP Unit / IDP objectives and Task Team strategies Development IDP Unit and confirmation of IDP strategies Compile Draft projects Consultation with Cacadu District Local Municipality on Draft projects 27 Nov 2014 Confirmation of existing Projects and identification of new projects Submission of projects to Planning Unit Ward committees, IDP Unit Finance IDP Unit and 11 Deliverable /Activity Finance department Budget Committee Meeting Consolidation of POEs for quarterly assessments Drafting of second quarter performance reports Reviewed tariffs and charges Adjustment Budget Consultation with CDM 27 Jan 2015 Annual Report tabled to Council 30 Jan 2015 Responsibility Deliverable /Activity Refinement of Draft IDP/Budget and alignment of budget with sector depts Stakeholder consultation on IDP & Budget IGR forum meeting 24 April 2015 Council approves IDP and Budget 29 May 2014 Publication of approved Responsibility November 1 2 3 April 1 2 4 December 1 2 3 4 May 1 2 4 January 1 2 3 4 4 June 1 2 4 CFO and IDP Unit Section managers 56 IDP/PMS CFO CFO CDM planning unit and SRVM IDP Unit Mayor 3 3 3 IDP Unit/IDP Task Team Mayor and all councillors Council Planning Unit 12 Deliverable Responsibility April /Activity 1 2 IDP/Budget on the website and local newspaper Consolidation Section 56 of POEs for Managers Annual Performance Report 3 4 May 1 2 3 4 June 1 2 3 4 Analysis process The analysis phase involved the performance assessment of 2013-14 IDP, the municipal level of development and service delivery backlogs. Key strategic documents such as the Service Delivery and Budget Implementation Plan (SDBIP) where particular quarters of 2014/2015 were looked at, Mid-year performance 2014/2015, Budget and Annual Report were used to assess the performance of the municipality to get an overall understanding of the developmental status quo. Strategy phase A mini departmental strategic meeting was held in January 2015 to refine and confirm the developmental trajectory of the Municipality taking into account the performance as it had been stated in strategic documents. The strategic phase also involved meetings with the District Municipality (and other LMs in the District) in an effort of synchronising planning and strategic goals. A follow up meeting after the upcoming community engagements will seek to confirm the municipal strategic objectives and priorities for 2015/2016 IDP Review based on the community needs. As some engagements with the community have already occurred the priorities will be outlined below. Strategically, our in-house meeting was attended by Directors, section heads, and middle management personnel. During the meeting Directors presented the municipalities mid-year performance for 2014/15 and re-confirmed the municipality‘s IDP development priorities, namely water supply, road infrastructure development and storm water, electricity supply and management, integrated human settlement, good governance and public participation, sanitation/sewerage, community development, rural development, economic development, waste management and accountability relating to financial management and viability. It was further agreed that the municipality need to come up with the long term strategy to guide development. Project phase During the meeting on the Project phase Directors will identify projects that must be prioritised in the 2015/16 IDP informed by the community priorities, long term sustainable development of the municipality and financial projections. 13 Integration phase A meeting is scheduled to be held in April 2015 with sector departments, para-statals and the private sector in order to compile all projects and programmes that they will implement within the municipality for the 2015/16 financial year. All sector plans/ policies that required a review were reviewed amongst others were the PMS Framework, the SDF, WSDP, etc. Approval phase The draft IDP will be served in Council in May 2015 for adoption. Preceding this will be the planned community engagements, the draft being taken to Council for noting, and thereafter being made public for further elicitation of comments from all affected parties. Furthermore SRVM has scheduled meetings with stakeholders that will be in the planned Rep forum which will enrich this process. Budgeting The IDP can be regarded as a tool that enables the municipality to align its financial and institutional resources based on agreed policy objectives and programmes. As a result the municipal IDP and budget are inevitably linked to one another, which is something that has been emphasized by legislation. Local Government Municipal Finance Management Act, 56 of 2003, section 21 (1) stipulates that the Mayor of a municipality must co-ordinate the processes for preparing the annual budget and for reviewing the municipality‘s integrated development plan and budget-related policies to ensure that the tabled budget and any revisions of the integrated development plan and budget related policies are mutually consistent and credible; at least 10 months before the start of the budget year, table in the municipal council a time schedule outlining key deadlines for the preparation, tabling and approval of the annual budget; the annual review of— (aa) the integrated development plan in terms of section 34 of the Municipal Systems Act; and (bb) the budget-related policies; the tabling and adoption of any amendments to the integrated development plan and the budget-related policies; and any consultative processes forming part of the processes referred to in subparagraphs (i), (ii) and (iii). The Local Government Municipal Planning and Performance Management Regulations, 2001 Section 6 stipulates that: Giving effect to integrated development plan A municipality‘s integrated development plan must inform the municipality‘s annual budget that must be based on the development priorities and objectives referred to in section 26(c) of the Act and the performance targets set by the municipality in terms of regulation l2; and be used to prepare action plans for the implementation of strategies identified by the municipality. 14 The draft budget must be tabled and finally submitted to Council for adoption by May 2015. Implementation and Monitoring of Performance The implementation and monitoring of the IDP is done continuously throughout the year. This phase represents the implementation and monitoring of proposals and projects contained in the IDP. The municipality develops organizational performance management plan which reflects Key Performance Indicators (KPI‘s) and targets linked to the Integrated Development Plan. This plan will be used as a monitoring framework towards the implementation of the IDP and the attached budget thereof. This phase comprises meetings/negotiations with provincial departments in order to monitor progress on provincially/nationally funded projects and meetings on funding, powers, duties and functions etc as contemplated in the IDP document. During this phase the situation regarding the development and review of sectoral strategic plans will also be monitored. The implementation and monitoring phase is a continuous process which commenced July 2014 and continues right through to June 2015. 1.4 IDP INSTITUTIONAL ARRANGEMENTS It is critical that the various IDP stakeholders are not only consulted but also fully involved in the IDP process. To achieve this, the SRVM has approved the specific institutional arrangements as illustrated in the table below. Council Mayor Municipal manager Approve the Process Plan and the IDP. Decide on the Process Plan and to make firm recommendations to Council. Chair meetings of IDP Forum. The Municipal Manager is responsible for managing, monitoring, and implementing the overall IDP process, assisted by the Strategic Support Manager, IDP Assistant Manager, the IDP Steering committee, and officials. The terms of reference include: Preparing the process plan. Undertaking the overall management and coordination of the planning process by: Nominating persons in charge of participation and involvement of all different role-players. Ensuring that the time frames are being adhered to. Ensuring that the planning process is horizontally and vertically aligned and complies with national and provincial requirements. Ensuring that conditions for participation are provided. Proper documentation of the results of the planning of the IDP document. 15 Directors IDP Steering Committee IDP Rep Forum Providing relevant technical, sector and financial information for analysis for determining priority issues. Contributing technical expertise in the consideration and finalization of strategies and identification of projects. Providing operational and capital budgetary information. Being responsible for the preparation of project proposals, the integration of projects and sector programmes. Being responsible for preparing amendments to the draft IDP for submission to the municipal council for approval and the MEC for local government for alignment. The IDP Steering Committee of SRVM assisted the Municipal Manager in guiding the IDP process. It comprised the following members: Municipal manager and Directors IDP Manager The terms of reference of the IDP Steering Committee included the following: Providing terms of reference for the various planning activities. Process, and summarize documents and outputs. Make content recommendations. Define the terms of reference for the IDP Representative Forum. Inform the public about the establishment of the IDP Representative Forum. Identify stakeholders to be part of the Forum in such a way that the public is well represented. The IDP Representative Forum is chaired by the Executive Mayor as the organizational mechanism/platform for discussion, negotiation, and decision-making between stakeholders within the municipal area. The terms of reference for this structure included: Represent the interests of constituents in the IDP process. Provide an organizational mechanism for discussion, negotiation and decision-making between the stakeholders and municipality. Ensure communication between all the stakeholders‘ representatives. Monitor the performance of the planning and implementation process. 16 1.5 ANNUAL REVIEW OF THE IDP The Municipal Systems Act (Act 32 of 2000) requires municipalities in South Africa to review their IDP‟s on an annual basis in order to keep track and remain relevant to the ever changing needs and dynamics in communities. In relation to the illustration below of the evolution of IDP‟s over a 5 year period this process can be described as Review 3 of the IDP of the Sundays River Valley Municipality. The priorities and actions identified in this IDP review will inform the structure of the Sundays River Valley Municipality, the service delivery standards, all financial planning and budgeting as well as performance reporting by the municipality. IDP Review 1 Review 2 2013/14 2014/15 Review 3 Review 4 20122017 2012/13 2015/16 2016/17 This third review of the IDP aims to give stock of what has been achieved thus far and the challenges we are currently faced with. It is important to always be honest and alive to the realities of the time, this will allow the Municipality to plan effectively and realistically. As has been the norm, this review must be read in conjunction and together with the previous years‘ reviews. Although we face challenges relating to resources, aging infrastructure and a turbulent political atmosphere we remain resolute in our aim to realise and fulfil our IDP objectives. The purpose and objectives of the review is to: Reflect and report on the progress made in respect of the implementation of the 5 year IDP Evaluate the appropriateness of the strategies reflected in the 5 year plan and make the adjustments where necessary, especially where changing circumstances within the municipality or externally so demand Determine annual targets and action plans for the next financial year to keep track of the 5 year strategy Inform the annual budget of the municipality To re-affirm Council‘s strategic objectives and the medium term service delivery and development agenda To align the 5 year strategic plan with the longer term Integrated Strategic Development Framework (ISDF) To review the prioritisation of key programmes & projects in each ward through a comprehensive public participation process To ensure that all projects are directed to achieve the strategic objectives of Council To determine the impact of changing external and internal circumstances on the service delivery and development agenda of the municipality 17 To address the recommendations reflected in the assessment letter from the MEC for Local Government in the Eastern Cape in respect of the previous IDP review 1.6 PROVISIONAL OUTCOMES OF THE IDP COMMUNITY CONSULTATION MEETINGS In 2013/14 financial year SRVM engaged into an intensive community consultation that was done at a ward level in line with the community based planning approach. The municipality employed the community based planning approach to stimulate participatory governance by awarding community members a fair opportunity to deliberate on issues affecting them in their respective wards. Furthermore, this approach was implemented to inevitably include the local community in decision-making, planning and generally allowing them to play an active part in their own development. To facilitate this community consultation process, a team consisting of Ward Councilors, Ward Committee Members, Community Development Workers and municipal officials in an effort of making local government account to the citizenry at large engaged with various communities of Sundays River Valley Municipality. Community engagements have not been to the scale and gravity required by the Constitution, as such further engagements are planned in the coming month to enrich the already existing information. The municipality started community engagements on the 27th of February 2015 in Nomathamsanqa with a meeting of all ward representatives. This engagement was attended by the Mayor, Speaker of Council, ward and PR councillors and the management of the Municipality. A summary of the priorities that emerged is listed below. Ward/Area Paterson Ward 7 Kirkwood Issues raised Illegal occupation of houses Repairing of high mast lights Slow progress in the construction of sportfields Lack of political leadership and visibility of political head and structures Cemeteries not cleaned regularly Available sportfield is on private land and local teams have to use such fields. State of internal roads is appalling and presents a danger to pedestrians and motorists alike. Water and sanitation is still a huge problem Drain leakages go unattended for long periods No report back to the community on shoddy work (on roads) by contractors appointed by the Municipality 18 Nomathamsanqa Valencia Bersheba Growing concern that sports and recreational programmes are only happening in Kirkwood. Water and sanitation is still a problem High must lights are not working in Noluthando Street naming is needed Consistent supply of clean water is still a challenge Volunteers at the local library are not getting stipends RDP houses have no water connection Supply of water is not constant The mobile clinic comes once a week but this is not constant as some weeks it does not come. At the conclusion of the above all inclusive meeting, the political leadership of the Municipality together with the heads of the administration drew up a new programme to visit all wards individually to discern and confirm ward priorities from those that were captured on the 27th of February 2015 and those that were captured in the previous years‘ IDP/Budget consultation. Below is a reflection of the ward priorities from those engagements that took place. It is to be noted that the ward consultations are still ongoing and some wards are still to be visited. 17 March – Cllr Qusheka Ward 5 2014/2015 ward priorities 2015/2016 ward priorities Building of RDP Building of houses houses Tarring of roads Upgrading and Electrification of tarring of roads houses especially in Land for a shopping Nomathamsanqa centre and Langbos Visible policing Erection of high Access to mast lights emergency services Electrification of Cleaning of illegal existing houses dumping sites Housing Timeos refuse rectification collection and especially in the access to refuse Ntakazilali area on bags top of the canal. Houses in Identification of Noluthando need land for the building access to water of a shopping No graveyards centre Land for agricultural 19 Improvement in police patrols Improvement in response time of ambulance services Illegal dumping sites to be attended to Refuse waste to be collected timeously to stop illegal dumping Water condition is appalling and needs urgent attention Sewage system in Noluthando area to be attended to promptly Land for cemeteries and livestock Open water canal adjacent Nomathamsanqa and Langbos Hospital condition to be improved Recreational youth programmes activities Youth and empowerment programmes Improvement in the conditions in the clinic Community in need of a big sport centre and hall No toilets in Duka, Mandela, Zwelitsha 19 March 2015 – Cllr Snoek Ward 8 2014/2015 ward priorities 2015/2016 ward priorities Enon, Bersheba, Moreson Income generating People of Moreson and Greenfields etc project /Sustainable want a playground, Employment multi-purpose opportunities centre and a Improved Skills and swimming pool as Education children are Upgrading housing swimming in dirty infrastructure and water canals eliminate informal Installation of settlement geyzers Title deeds Fencing in the Consistent supply existing playground and access to Construction of a clean water soccer field Improved sanitation Upgrade and infrastructure cleaning of the 20 High mast lights / housing electrification Clean and safe Environment (Big rubbish Bins recycling)or refuse removal twice a week Eliminate illegal dumping Control sewer overspill Control vandalism Control stock theft /general Subsistence abuse Community Centre (library, indoor gymnasium, career guidance, shopping centre cemetery in Enon – employing a caretaker was highlighted. Lighting strength of high mast lights is weak Mobile clinic comes once a week – at times it does not arrive. Condition of roads is appalling Toilets in the community hall are not working In need of a site for a graveyard in Bersheba Houses built and transferred to people without access to water Fencing of the water canal Better control system for the community hall, sportfield and graveyard Empowerment for youth – especially in brickmaking Area of greenfields is in need of RDP houses, clean water and electricity 25 March 2015 – Cllr Simpiwe Rune Ward 6 2014/2015 ward priorities Building of RDP houses Electrification of existing houses Housing 2015/2016 ward priorities Land is needed for settlement especially for people in the Molly Blackburn and 21 rectification especially in the Ntakazilali area on top of the canal. Identification of land for the building of a shopping centre Improvement in police patrols Improvement in response time of ambulance services Illegal dumping sites to be attended to Refuse waste to be collected timeously to stop illegal dumping Water condition is appalling and needs urgent attention Sewage system in Noluthando area to be attended to promptly Land for cemeteries and livestock Open water canal adjacent Nomathamsanqa and Langbos Hospital condition to be improved Recreational youth programmes Erection of highmast lights Upgrading and tarring of roads especially in Nomathamsanqa and Langbos Langbos area Rectification of existing RDP houses that are not in a good condition Clean drinking water for human consumption High mast lights Land for cemeteries and livestock Internal roads around Bukani to be graveled while they have not been tarred Enclosure of water canal Emergency services (fire and ambulances) brought closer to the people to increase response time Construction of a playground for children Community engagements in ward 2 (Cllr Adams) and ward 1 (Cllr Kebe) should have taken place but have been rescheduled. Ward 2 was postponed on account of the small number of people present. The leadership of the Municipality thought it 22 imprudent to continue the engagement without a multitude of voices from the community and consequently has set a return date for the community engagement. In ward 1, the people of the ward adjourned the meeting as they are still waiting on the MEC to return and give them a response to the protest that was held in the previous year on the 23rd September 2015. 23 CHAPTER 2: SITUATIONAL ANALYSIS 24 CHAPTER 2 SITUATIONAL ANALYSIS In order to properly plan for the development of the SRVM, it is critical to understand the needs and status quo of the Sundays River Valley‘s population, its relevant demographics as well as the anticipated trends in development for the 2015/16 financial year. 2.1 DEMOGRAPHIC PROFILE 2.1.1 Introduction The analysis section is the cornerstone of the IDP. It provides an assessment of the existing level of development in the municipality. This session analyses the internal and external environmental trends and provides reliable information that may have a potential impact on the attainment of municipality‘s mission and objectives. It focuses on the type of problems faced by the people of Sundays River Valley. The analysis considers people‘s perceptions of their problems, but also facts and figures. The analysis is structured according to the five (5) key performance areas which are premised by the demographic profile. The section is structured as follows: Demographic Profile Basic services and Infrastructure Local Economic Development Institutional Transformation and Organisational Development Good Governance and Public Participation Financial Viability and Management In order to properly plan for the development of the SRVM, it is critical to understand the needs of the Sunday‘s River Valley population, its relevant demographics as well as the anticipated trends in development for the 2014/15 financial year. 2.1.2 Description of the municipal area Sundays River Valley Municipality is in the Eastern Cape and is one of the nine local municipalities in the Cacadu District. It is a Category B municipality with a collective executive system combined with a ward participatory system established in terms of the Local Government Municipal Structures Act 117. 25 It is approximately 50km from Coega Industrial Zone in Nelson Mandela Bay Metro. The municipality can boast its ecotourism and agricultural potential. The Addo Elephant National Park and its citrus production are two important drivers in the Sundays River Valley Municipality. The valley is characterised by harsh climate conditions, with summer temperatures rising in excess of 40 C. Rainfall is spread over the year and is between 250-500mm per annum. The valley is characterised by wide, fertile flood plains and is associated with low-lying land and steep, less fertile soil. The area outside the Sundays River includes the Paterson area, the coastal belt, and the west of Alexandria. 2.1.3 Population Profile Table 2: Distribution of population by Gender (Census 1996, 2001 & 2011) 1996 2001 2011 Male Female Total Male Female Total Male Female Total 21949 22091 44040 21140 22772 43913 27761 26740 54503 Population Growth 30000 25000 20000 15000 Series1 10000 5000 0 Male Female 1996 Male Female 2001 Male Female 2011 26 According to Census 2011, the population of SRV was approximately 54 504 people of whom 72% are Black African, 21% Coloured and 6% White. Between the years of 1996 and 2001, the population showed a slight decrease of 0.29% (127 of the population). However during the years of 2001 and 2011, the population had increased by 19% (10590 of the population). Table 3: Gender by Population group Black African Coloured Indian or Asian White Other Grand Total Male 19 969 5 849 44 1 570 329 27 761 Female 19 147 5 794 52 1 640 110 26 743 Grand Total 39 116 11 644 96 3 209 439 54 504 25000 20000 15000 Male 10000 Female 5000 0 Black African ColouredIndian or Asian White Other Table 4: Geography by Population group Ward 1 Black African Coloured Indian or Asian White Other Grand Total 5 849 103 6 3 47 6 008 27 Ward 2 3 396 3 180 21 655 53 7 305 Ward 3 4 773 2 615 18 268 70 7 743 Ward 4 4 660 66 10 63 33 4 832 Ward 5 5 069 49 3 130 52 5 303 Ward 6 5 102 313 2 276 46 5 739 Ward 7 4 331 2 463 26 1 350 76 8 247 Ward 8 5 936 2 854 10 465 62 9 328 Grand Total 39 116 11 644 96 3 209 439 54 504 Population 10000 8000 6000 Population 4000 2000 0 Ward 1Ward 2Ward 3Ward 4Ward 5Ward 6Ward 7Ward 8 28 Population Ward 8 17% Ward 7 15% Ward 6 11% Ward 5 10% Ward 1 11% Ward 2 13% Ward 3 14% Ward 4 9% The above charts show Ward 8 as having the highest percentage of 17%, followed by Ward 7 which sits on 15% of the total population. The highest percentage of population in Ward 8 may be attributed to the influx of people during the season (citrus production). Ward 4 has the lowest population size of 9%. Table 5: Age in completed years by Population group Age Group 0-4 Black African Coloured Indian or Asian White Other Grand Total 4 179 1 274 12 192 25 5 682 5 -10 3 903 1 389 15 220 13 5 540 11 - 17 4 134 1 583 6 317 7 6 047 18 - 35 13 416 3 545 33 593 314 17 901 36 - 45 5 694 1 613 13 457 45 7 822 46 - 55 3 792 1 216 11 581 21 5 620 56 - 65 2 229 637 4 416 7 3 293 66 - 75 1 184 258 1 226 6 1 675 76 - 85 399 101 - 176 2 678 29 86 - 100 175 25 1 31 - 232 101 - 120 9 5 - - - 14 Grand Total 39 116 11 644 96 3 209 439 54 504 Age Structure The age structure depicted below suggests that Sundays River Valley Municipality has a population is relatively youthful. The age structure mapped in the pyramid below is very similar to that of South Africa as a whole, but with certain notable exceptions: A relative decrease of males aged 40 to 65, possibly indicating out migration A relative increase of men and women aged 25-35, possibly as a result of relatively rapid population growth in the late 1980‘s and low levels of out migration A relative decrease of boys and girls aged 5-20, possibly indicating that they are being raised and educated in areas with better education opportunities. The youthful population suggests a need for prioritization of skills development and employment creation initiatives for youth. 2.1.4 HIV/AIDS Profile HIV/AIDS pandemic has an impact on labour supply, through increased mortality and morbidity. This is compounded by loss of skills in key sectors of the labour market. The long period of illness associated with AIDS reduces labour productivity. One review reported that the annual costs associated with sickness and reduced productivity as a result of HIV/AIDS. These costs reduce competitiveness and profits. Government incomes also decline, as tax revenues fall, and governments are pressured to increase their spending, to deal with the rising prevalence of AIDS, thereby creating the potential for fiscal crises 30 The profile above indicates that the epidemic is reaching a plateau, with some 4 200 people or 9% of the population infected with HIV and some 200-300 AIDS sufferers. The in-migration of job seekers during the citrus season may be viewed as one of the contributory factors for the spread of the virus. At the community based plan meeting held on the 3 rd January 2012, ward committees expressed concern about the figure and opined that the cases may be more. They further revealed other prevalent sicknesses in their communities such as tuberculosis, high blood pressure and arthritis. 2.1.5. The Development Diamond The Development Diamond measures the extent of inequality (Gini Coefficient), underdevelopment (the Human Development Index or HDI), Poverty and illiteracy. The Development Diamonds reflect the racially skewed ongoing effects of the Apartheid system that officially ended in 1994. Whites experience almost no poverty, a high HDI, less than 5% illiteracy and relatively low inequality. 31 Africans experience high poverty (although lower than the national average), a low HDI, very high illiteracy and high inequality. 32 Coloureds experience lower poverty and illiteracy, a higher HDI, less illiteracy and roughly the same level of inequality. 33 In the SRVM, the number of African in poverty is equal to the national average of 40%. SRVM has more illiterate number of African and historically disadvantaged individuals (HDI) than the national average. The inequality levels (measured by the Gini Coefficient) are better in SRVM as compared to the national statistics. 34 2.2 INSTITUTIONAL DEVELOPMENT • • • • Council is fully constituted by 16 Councillors (12ANC,3DA & 1Independent); Audit Committee is established & functional MPAC is established and fully functional. Ward Committees established in all wards – whilst they are meeting according to council schedule but their functionality and effectiveness are questionable. Positions in Organogram 2014/15 = 229 Filled = 159 December 2014 Vacant = 70 December 2014 Staff turnover rate = exact number not available Some positions have Job descriptions and all posts have been graded. LM is composed of 4 Directorates excluding the Municipal Manager‘s Office, all Section 56 Manager‘s positions are filled and no vacancies reported at this level as at 31December 2014. The biggest challenge with using the manual document system is that it takes time, documents are easily lost and the safe keeping of such documents is always a risk. No By-laws were adopted in the current year. Information systems are disintegrated Not all Municipal policies are reviewed. Reviews occur annually when and where such is necessary Governance The institution has experienced a number of challenges, to name but a few these include: 35 Public Participation programmes remain to be a challenge ,due to sessions not materilising. Local Labour Forum is established to hormonise relations with unions – Initially meeting could not materlised due to absence of employer component, until Council intervened. On account of the fire to our buildings we now use a Manual document management system. Archiving of information is affected by the damage of the Metrofiles system that the Municipality was using. A New system needs to be purchased to ensure compliance with the Act accordingly (We are starting from scratch with the compilation of documentation). ITC • • • ITC Policies were adopted in 2011. Website design is pending, based on promised support from Cogta. During burning of offices information was lost. However, back-up system saved VIP payroll, Pastel Financial system & Meter Readings. The challenge is to virtualise information back onto running of the system effectively and efficiently with the correct information for billing. New servers of the above systems got burnt and destroyed. This also includes the email server. 36 2.3. SERVICE DELIVERY: ROADS AND STORM WATER AND ENERGY The Extent of Infrastructure Backlog [Overview] MUNICIPAL COMPREHENSIVE INFRASTRUCTURE PLANS (CIPS) QUARTERLY REPORT Infrastructure Category Total HH (Units) Served HH Backlog Backlog (Units) (Units) (Costs R’000) Water 11 529 11 310 219 48 000 Sanitation 11 529 10 284 1245 32 000 Electricity 11 529 10 952 577 32 000 Refuse Collection 11 529 11 408 121 8 000 Roads 11 529 11529 157km 761 000 Community Halls 11 529 11 529 4 halls 48 000 Sports Facilities 11 529 11 529 4 sportsfields 21 000 Comments: Challenges and Recommendation: 37 ROADS There is a big challenge of roads and storm-water in the SRV area with 137 km of road needed to be upgraded. This is planned in phases (over 10 years to be exact). Developmental strategies relating to the roads network involve the surfacing of gravel roads as well as the upgrade of bulk storm-water. The current roads backlog is at 139.926 km at an estimated cost of R541,956,440.00 Kirkwood - Local Distributors, 8,29km Parerson - Local Distributors, 4.04km Paterson - Internal Roads, 20.82km Kirkwood - Local Distributors Kirkwood - Internal Roads Kirkwood - Internal Roads, 61.48km Addo - Internal Roads, 57.63km Addo - Local Distributors Addo - Internal Roads Parerson - Local Distributors Paterson - Internal Roads Addo - Local Distributors, 7.30km 38 The funding required in order of magnitude is illustrated below; Length of Bulk Roads (m) Length of Internal Roads (m) Moses Mabhida 2,283.44 18,402.01 R 50 565 330.48 Emsengeni 2,091.96 9,073.97 R 28 473 555.19 0 16,023.79 R 57 278 184.76 1,458.09 3,336.43 R 13 331 030.75 Bersig 800.21 3,160.51 R 10 373 351.74 Enon 1,659.18 11,487.77 R 32 294 270.14 Langbos / Nomathamsanga 4,228.34 35,264.56 R 94 948 834.43 0 5,178.94 R 11 694 239.06 Valencia 3,071.07 17,182.98 R 51 988 566.19 Patterson 4,037.98 20,815.85 R 62 444 277.46 SUB TOTAL 19,630.27 139,926.81 Area Kirkwood Town Aqua Park Addo ADD PROFESSIONAL FEES 14% SUB TOTAL ADD VAT @ 14% TOTAL PROGRAMME COST TOTALS R 413 391 640.21 R 62 008 746 R 475 400 386 14% R 66 556 054 R 541 956 440 39 Water, Storm-water and Sanitation The extent of challenge in access to water is: • Shortfall of 4,9ML Capacity of shortage of Portable Water • Additional Storage of Raw Water Dams & Water Loses • Ageing Infrastructure (Enon, Kleinpoort, Glencorner. The cost estimate for water is: • Kirkwood Bulk WTW is R24,172,515.83 • Surrounding Areas is R 34,755,034.83 At least 11 310 out of 11 529 households have access to water (98%). SRVM need to accelerate the implementation of RBIG Programme and lobby for funding. Sanitation At least 10 284 out of 11 529 households have access to waterborne sanitation services( 89% ). The extent of the challenge for sanitation include: • • • Paterson Sewer Network Zuney VIP Toilets Aqua Park, Moses Mabida & Langbos blockages One amongst the interventions required is to fast track the Kirkwood Bulk Water Initiative so that the sewer network can obtain self cleaning velocity and prevent blockages. The actions undertaken to date are: • NURCHA has completed an assessment of the Paterson Bulk Infrastructure. • DoHS have Allocated R35mil for the Bulk Infrastructure for Langbos and Molly Blackburn. 40 Electricity: At least 10 952 out of 11 529 households have access to electricity (94.5%). The Municipalities area of jurisdiction is the following areas: Kirkwood, Bersig, Moses Mabida and Aqua Park for electrical infrastructures. The outlining areas are serviced by ESKOM. A fully costed master plan is in place and requires the following funding: Short term – R4,123,147 Medium Term – R28,857,573 Long term - R14,242,838 SRV is in the process of rolling out its street lighting project to avert among other things the increase of crime in dark areas. This project is however negatively influenced by cash flow problems. Refuse removal: 11 408 households out of 11529 households have access to refuse removal services (98.9%) Human Settlement Approximately 3880 households ought to be built (housing backlog). Rectification is urgently required in many of the wards (Bergsig & Paterson 450 more than others). The extent of the challenge is mainly around: • Shortage of Land & Funding • Bulk Infrastructure challenges Enon The actions that are being undertaken to date are: • Housing Sector Plan updated • DoHS allocated Bulk funding for Langbos & Mollyblackburn. • 80 Units for Addo 801 • Enon/Bersheba 450 • Bersig 6 • The Department needs to assist the municipality in purchasing Habata land in Addo and provide funding for Enon Greenfields – (R45,856,500.00) 41 Building Regulations - National Building Regulations are being complied with. Building control policies and procedures are in place to ensure enforcement. 2.4 COMMUNITY AND SOCIAL SERVICES PUBLIC AMENITIES: There are 10 Community Halls in LM area. There are 6 Sports fields. There is 1 Public swimming pools. CEMETERIES – There are 12 cemeteries and 6 have reached capacity. LIBRARIES - There are 8 Libraries and other areas are serviced by mobiles. SOLID WASTE MANAGEMENT Landfill Sites: LM has 2 unlicensed sites and 2 licenced sites. The municipality is challenged with illegal dumping and random dumping. Measures to control and eliminate this challenge are in place with little reported success. Integrated Waste Management Plan (IWMP) has been developed but needs to be reviewed. The LM has engaged co-operatives in the waste collection services: 4 have been established. ENVIRONMENTAL MANAGEMENT 42 Integrated Environmental Management Plan (IEMP) has been not developed. There are 0 estuaries that give life to aquatic life. Climate Change Strategy has not been developed. COMMUNITY SAFETY There are 3 police stations within the LMs jurisdiction. Community Safety Forums are functional. Crimes cover: Stock theft, Robbery with aggravating circumstances, burglary of non-residential and residential properties. Drug related crimes also need serious attention. SRVM needs assistance in the following critical areas: • DEDEA to assist SRVM with additional funding. • DEDEA to assist SRVM to get additional funding from DEA (National-EPIP). • Multipurpose facilities are needed in all major towns 2.5 LOCAL ECONOMIC DEVELOPMENT LED Strategy – was last adopted in 2012. The situation analysis has been updated during 2014/15 financial year through the assistance of local government and ECSECC. There is no museum within the municipal area and its establishment is very significant. Tourism: Tourism destinations within municipal boundaries are: Addo Elephant National Park, Shamwari, annual festival (Kirkwood Wildlife, Rose Festival, 4x4 rides). The Local Tourism Organisation was funded by the District Municipality. List heritage sites: 1) Moravian Church 2) Fallen Heroes Monument 3) Slaagboom 43 -406 jobs were created in 2013/14. - 34 SMME that were supported in 2013/14; in terms of Skills Development and Training (21), Funding (2) and Registrations(11). - 11Jobs created from July 2014 to Dec.2014. - Activities done in supporting SMMEs from July 2014 to Dec. 2014 - SMME in Construction Information Sharing (CIBD, SEDA, NEDBANK) workshop was held to capacitate construction SMME - SMME Database Registration (SEDA) – All three towns were visited. List economic growth pillars / drivers Agriculture Tourism Construction Community / Social Services 2.6 GOOD GOVERNANCE There is a challenge between planning, integration and reporting between the municipality and sector departments – the communication gap was left to the communications officer to facilitate, the absence of a person in that crucial post has hamstrung the Municipality‘s planning and integration. This notwithstanding, the office of the MM together with that of the Mayor has tried to constantly liaise with sector departments. This has been incorporated in the performance plan of the MM. Information gap between management (admin decision makers) and Communities; limited funding to address issues/needs raised by communities. Also, ward committees and CDWs are established to bridge the gap. 44 2.7 FINANCIAL VIABILITY AND MANAGEMENT 2.7.1. Key Issues for Financial Viability The financial sustainability of the municipality remains our main priority despite serious cash flow challenges currently being experienced due to amongst other things declining collection rates, historic expenditure patterns and a general lack of ―doing business smarter‖. Some improvements have been achieved in the pursuit of clean audit and financial viability in terms of the following areas. Free Basic Services unit has been established Restructuring of the organogram to assist with capacity issues Long existing debt has been settled It should be noted that the municipality is heavily reliant on grant transfers as its main source of income. These grant transfers usually have a condition attached to it so making it impossible to spend as the municipality wishes. This depicts that as a whole the municipality cannot attend to core service delivery priorities in order to address social ills and backlogs. 2.7.2. Budget Expenditure Review A. Revenue Management Date cleansing is being performed to ensure the integrity of billing information and accuracy of customer accounts Acquisition of meter reading equipment to eliminate estimates and inaccuracy Updating and re-registering of indigent list to ensure effective targeting and improved systems B. Collection of Outstanding Debt There are high levels of debt to suggest deficient efforts to collect billed revenues due to: Payment levels that are under 50% Poor implementation of the debt and credit control policy Tariffs are not cost-reflective and municipality subsidies customers for electricity 45 Large number of indigents not registered, however a robust drive to register indigents is now underway C. Under spending on Repairs and Maintenance The medium to long-term consequences of under-spending on repairs and maintenance shortens the useful life of assets and thus necessitates earlier replacement. SRVM under spends on repairs and maintenance due to: Increasing expenditure trend-Cash flow constraints Insufficient budget to ensure the continued provision of services D. Spending on non-priorities SRVM prioritises cost items that have a direct impact on communities, however few exceptions are noticed with respect to: Expenditure not budgeted for Cost associated with long standing staff suspensions and legal costs The absence of procurement plan to manage cash throughout the year 2.7.3. Financial Plan The municipality has a three year budget projection in line with Section 26(h) of the MSA and other Treasury requirements. The budget for 2015/16 provides a three year strategy to try and restore the balance in terms of personnel costs, general expenses, repairs and maintenance and provision toward bad debt. The municipality has the following policies: Asset Management policy, Indigent Support policy, Rates policy, Credit control policy, Financial Management Policy, Bank & Investment policy, Write Off policy, Supply Chain Policy, and Tariff Policy of which the municipality is in the process of reviewing these policies for the 2015/16 financial year. These policies upon approval by Council will be promulgated into by laws and gazetted thereafter. Although the determination of tariffs is in many instances politically orientated, it ought to be based on sound, transparent and objective principles at all times. It is important to identify the following user categories to be able to consider any forms of subsidization needs of communities: 46 Users who are unable to make any contribution towards the consumption of municipal services and who are fully subsidized in terms of basic package of municipal services. Users who are able to afford a partial contribution and who are partially subsidized only Users who can afford the cost of the services in total The borrowing policy, funding and reserves and long-term financial plan are included in the financial management policy. Rates by-laws were approved by Council and gazette. The municipality is in the process of reviewing all by-laws. The municipality valuation roll has been implemented in 2014/15 financial year. 47 EC106 Sundays River Valley - Table A1 Budget Summary Description R thousands Financial Performance Property rates Service charges Investment revenue Transfers recognised - operational Other own revenue 2011/12 2012/13 2013/14 2015/16 Medium Term Revenue & Current Year 2014/15 Expenditure Framework Audited Audited Audited Original Adjusted Full Year Pre-audit Outcome Outcome Outcome Budget Budget Forecast outcome Budget Year Budget Year Budget Year 2015/16 +1 2016/17 +2 2017/18 12 266 35 712 168 43 932 9 460 13 014 38 376 285 42 787 11 830 13 933 45 222 549 50 327 12 718 14 623 25 362 213 54 456 14 354 14 623 42 514 213 53 137 15 598 14 623 42 514 213 53 137 15 598 14 623 42 514 213 53 137 15 598 14 798 45 400 192 63 546 14 310 15 016 48 936 203 66 925 14 840 15 226 52 881 215 71 164 15 369 101 538 106 293 122 749 109 008 126 084 126 084 126 084 138 246 145 921 154 855 and contributions) Employee costs 28 007 Remuneration of councillors 3 800 Depreciation & asset impairment 17 388 Finance charges 2 404 Materials and bulk purchases 14 250 Transfers and grants 8 102 Other expenditure 26 401 Total Expenditure 100 352 Surplus/(Deficit) 1 185 Transfers recognised - capital 17 200 Contributions recognised - capital & contributed assets – 31 682 4 930 13 797 2 720 24 163 – 42 410 119 702 (13 408) 22 965 – 37 677 5 519 19 310 328 26 551 8 043 61 919 159 347 (36 598) 21 616 – 48 164 5 231 17 500 1 038 14 178 7 244 52 135 145 490 (36 483) 25 147 – 45 929 5 117 17 500 1 038 19 226 10 798 42 566 142 174 (16 090) 24 147 – 45 929 5 117 17 500 1 038 19 226 10 798 42 566 142 174 (16 090) 24 147 – 45 929 5 117 17 500 1 038 19 226 10 798 42 566 142 174 (16 090) 24 147 – 48 106 5 347 17 500 1 088 24 381 11 442 77 737 185 601 (47 356) 28 620 – 50 857 5 347 18 463 1 153 26 849 12 119 82 500 197 287 (51 366) 24 434 – 53 854 5 377 19 441 1 217 29 885 12 805 87 431 210 011 (55 156) 25 655 – 9 556 (14 982) (11 336) 8 057 8 057 8 057 (18 736) (26 932) (29 501) Total Revenue (excluding capital transfers Surplus/(Deficit) after capital transfers & 18 385 contributions Share of surplus/ (deficit) of associate Surplus/(Deficit) for the year Capital expenditure & funds sources Capital expenditure Transfers recognised - capital Public contributions & donations Borrowing Internally generated funds Total sources of capital funds – – – 18 385 – 9 556 – (14 982) – (11 336) – 8 057 8 057 8 057 (18 736) – (26 932) – (29 501) – 52 572 50 926 – – 1 646 52 572 16 485 16 277 – – 207 16 485 21 616 17 770 – – 3 846 21 616 26 975 25 685 – – 1 290 26 975 27 618 24 685 – – 2 933 27 618 27 618 24 685 – – 2 933 27 618 27 618 24 685 – – 2 933 27 618 29 374 28 630 – – 744 29 374 24 434 24 434 – – – 24 434 25 655 25 655 – – – 25 655 48 2.7.4. Financial Strategies A. Revenue Enhancement Strategy A comprehensive revenue enhancement strategy is undertaken and it includes: Cleaning of the debtor database to ensure that all consumers are levied for all services received at the correct tariff for such service. Reviewing and formalising an indigent policy for the municipality. Ensuring that all consumers that qualify in respect of such approved indigent policy are registered. Implementing credit control measures to significantly improve payment levels and ensure that consumers that can pay do so. Reviewing Council‘s tariff policy in respect of the subsidy of free basic services and to ensure that the actual cost of services is recovered through the respective tariffs. Restructuring of the operational budget to ensure that the budget is cash funded and that it reflects actual payment levels in respect of bad debt provision. Investigating distribution losses in respect of electricity and water to ensure that electricity and water purchased is billed Appointment of a debt collection agency to assist in collecting outstanding debt Restructuring offices to ensure efficiency in operations Engagements with service providers are underway to ensure that the best financial recovery plan is in place, taking into account the organisational and community factors to address cash flow problems of the municipality. It is envisaged that the plan will be implemented with no delays in the 2015/16 financial year. B. Asset Management Strategy The municipality completed GRAP 17 implementation during 2013/14 financial year and has now a comprehensive database of all assets within the organisation. An asset management accountant has been appointed during 2014/15 to head asset management section. Asset management policy was adopted by council which clearly identifies roles & responsibilities of all as well as identifying the need to have an asset maintenance plan and is also being reviewed annually. It should be noted that municipal assets were destroyed in the 2014/15 financial year and this will have a negative impact on the total assets of the institution. C. Supply Chain Management Strategy 49 Sundays River Valley municipality has a centralised system of supply chain. The supply chain unit is headed by a Supply chain practitioner. Procurement clerks have been appointed. All bid committee are functional. The supply chain management policy has been reviewe8d. SCM manager will be appointed in 2014/15 financial year so as to head the SCM unit and minimise non-compliance within the section. 2.7.5. Introduction-Change In Accounting Policy Accounting policy is the specific principles, bases, conventions, rules and practices applied by the municipality in preparing and presenting financial statements. The 2013/14 annual financial statements were prepared in accordance with Generally Recognized Accounting Practice Standards, National Treasury formats. Basis used to prepare the municipality’s annual financial statements Accrual basis of accounting Standards of GRAP approved by the Accounting Standards Board. Assets, liabilities, revenue and expenses have not been offset except when offsetting is required or permitted On the basis of a going concern 2.7.6. Summarized Financial Statements It is the responsibility of the accounting officer to make sure that the annual financial statements are prepared based on the prescribed format and submitted to Auditor General on time as prescribed by the MFMA. An AFS process plan was developed to safeguard against noncompliance and compilation of the AFS. It has been implemented from March and will be an on-going process till AFS are submitted. The Financial Statements listed below relate to the previous 2 years of audited financial information 2012/13 and 2013/14 financial years. 50 SUNDAYS RIVER VALLEY MUNCIPALITY STATEMENT OF FINANCIAL POSITION AS AT 30 JUNE 2014 2014 R 2013 R ASSETS Current assets 17 809 034 31 124 696 Cash and cash equiv alents 6 999 209 6 290 990 Trade Receiv ables from exchange transactions 9 955 781 23 725 942 Trade Receiv ables from non- exchange transactions 696 039 949 759 Inv entories 158 005 158 005 395 710 602 399 907 841 Non-current assets Other Assets Property, plant and equipment -10 500 366 676 589 370 571 903 670 507 982 932 28 363 506 28 363 506 413 519 636 431 032 537 38 274 314 31 794 439 4 140 158 3 774 463 269 980 262 178 3 010 137 2 609 713 908 443 960 859 3 073 282 612 595 Current portion of finance lease liability 26 872 314 23 574 631 Non-current liabilities 17 287 911 27 091 086 Retirement benefit obligation 3 383 048 3 612 000 Other financial liabilities 4 153 983 6 888 143 404 173 767 737 9 346 707 15 823 206 55 562 225 58 885 525 Intangible assets Inv estment properties Total assets LIABILITIES Current liabilities Trade and other payables from exchange transactions Consumer deposits Current prov isions Other financial liabilities Current portion of unspent conditional grants and receipts Non-current finance lease liability Non-current prov isions Total liabilities 51 Table 24: Income statement as at 30 June 2014 SUNDAYS RIVER VALLEY MUNICIPALITY STATEMENT OF FINANCIAL PERFORMANCE FOR THE YEAR ENDING 30 JUNE 2014 2 014 R 2 013 R Revenue Property rates 13 933 13 014 45 222 38 365 Rental of facilities and equipment 128 115 Interest earned - external inv estments 549 285 Interest earned - outstanding receiv ables 7 058 4 649 Fines 2 013 1 907 Licences and permits 1 989 1 327 Agency fees 1 121 1 577 72 717 65 752 Other income 417 2 266 Total revenue 145 147 129 258 37 677 31 682 5 519 4 930 Bad debts impairment 42 097 15 822 Depreciation and amortisation expense 19 310 13 797 Repairs and maintenance 11 816 11 843 Property rates - penalties imposed and collection charges Serv ice charges Gov ernment grants and subsidies Expenses Employee related costs Remuneration of councillors Finance costs Bulk purchases 328 2 720 14 734 12 320 Grants and subsidies expensed 8 043 Contracted Serv ices 1 885 2 446 17 926 24 142 159 336 119 702 General expenses Total expenses Gain / (loss) on sale of assets Profit / (loss) on fair v alue adjustment - 52 Financial Analysis-Selected Financial Indicators The selected trends and financial ratios relating to Sundays River Valley Municipality for the period under review are listed below. These provide a platform to analyze the current financial situation of the municipality. The trends and ratios have been divided into the following categories; Income and Expenditure Revenue management/Liquidity Borrowing management 53 Table 26: Income and Expenditure Total Income 2014 2013 R R 145 147 220 129 257 582 11% 8% 159 335 559 119 701 546 25% 16% Surplus/(Deficit) -14 188 339 9 556 036 Budgeted expenditure 122 692 115 122 723 225 0% 17% Salaries and Wages-Actual 37 677 431 31 681 858 Salaries and Wages-Budgeted 37 436 367 31 231 890 % of expenditure to operational budegt 31% 25% % of increase/decrease ov er prev ious years 16% 12% Councilors Allow ances-Actual 5 519 224 4 930 220 Councilors Allow ances-Budget 5 165 691 4 862 412 3% 4% 11% 23% 11 816 419 11 842 927 10% 10% % increase/decrease ov er prev ious years Total expenditure % increase/decrease ov er prev ious years % increase/decrease ov er prev ious years % of expenditure to operational budegt % of increase/decrease ov er prev ious years Repairs and M aintenance-Actual % of expenditure to total budget Grant Transfer-Actual 53 136 620 50 326 809 Grant Transfer Receiv ed 73 481 000 66 671 361 % of expenditure spent General Expenses 72% 75% 17 936 786 24 142 270 54 Total income versus Total expenditure Income The following table indicates how the actual income was realized in comparison to the budget provided for the past two financial years: REVENUE 2013/14 ACTUAL 2013/14 BUDGET % REALISED 2012/13 ACTUAL 2012/13 BUDGET % REALISED PROPERTY RATES 13 933 346 10 429 144 134% 13 014 347 16 065 692 81% SERVICE CHARGES 45 221 884 19 772 000 229% 38 364 656 36 697 986 105% INTEREST: DEBTORS 7606613 2 353 503 323% 4 934 484 2 218 647 222% LICENSES & PERMITS 1 989 209 1 211 504 164% 1 327 117 1 121 000 118% 128 021 126 755 101% 114 658 117 053 98% FINES 2 012 548 2 653 000 76% 1 907 308 1 067 834 179% AGENCY FEES 1 120 957 1 266 926 88% 1 577 044 1 173 134% 72 717 340 81 016 103 90% 65 751 795 83 438 000 79% 409 302 7 232 000 6% 2 255 173 4 553 269 50% RENTAL GOVERNMENT GRANTS OTHER INCOME Expenditure Salaries and wages represent 24% of total expenditure and an increase of 3% over the previous year. The councilor‘s allowance represents 3% of total expenditure. 55 Repairs and maintenance represents only 10% of the total expenditure. The municipality has to keep its repairs and maintenance expenditure between 10-15% of the budgeted expenditure. General expenditures have decreased by 35% as compared to the previous year and represents 11% of total expenditure. 2.7.7. Income Introduction Realistic anticipated income is guided by a tariff structure that is fair, equitable and economical. Income is supplemented from various source but directed to spending on basic service. Income balance is determined by the need to break-even with mandatory and involuntary spending in the pursuit of legislative requirements and the purpose of existence The following describes the various types of income with their annual growth indicators. i) RATES 13-Jun 12-Jun Budget 10 429 144 16 065 692 Actual 13 933 346 13 014 347 Water Service Authority (WSA) The municipality, through a unique situation for this district, was empowered as a WSA in 2005. This authority allows us to make all decisions related to water, sanitation and related matter. The option of being a Water Services Provider (WSP) was also taken. A section 78 process was undertaken by the Cacadu District Council and it was decided that the Municipality will not make use of an external services provider in this regard 56 ii) WATER 2013/14 Budget Actual 2012/13 7 350 000 11 355 107 20 027 989 12 753 630 Regional Energy Distribution (RED): Zone 3 REDS is part of government initial to rationalize the Energy Distribution Industry. The Municipality forms part of the REDS 3. This will have a noticeable impact on the income and the management responsibilities of the municipality. This is so as electricity is a major source of income. The service area is shared with Eskom. The future uncertainty is what we have to watch. No new area were developed whose billing and income was the property of the municipality. iii) ELECTRICITY 57 2013/14 Budget Actual 2012/13 9 778 000 15 089 680 14 489 075 15 621 776 iv) REFUSE vi) 2013/14 2012/13 Budget 2 338 000 3 607 400 Actual 3 518 543 3 545 461 SANITATION 2013/14 2012/13 Budget 4 306 000 6 645 034 Act ual 7 197 178 6 455 128 58 vii) GRANTS a) Equitably Share 2013/14 2012/13 Budget 40 404 000 36 314 000 Actual 40 404 000 36 314 214 Council‘s equitable share allocation was increased by 13.51% from R36 314 000 to R40 404 000 and remains council‘s major source of income. The following demographic data (from the 2011 Census statistics) was used for calculating council‘s equitable share and MIG allocations: Free Basic Services Free Basic Services is regulated by Council‘s Indigent Policy. It pivots on an income threshold of R1 260 and has two distinct categories, namely: Category A- Income less than R1 260 -100% subsidy Category B- Income from R1 260 to R2 520 -50% subsidy Every household receive 6 kiloliters of water free irrespective of income level as part of the free basic water system. The following services are subsidized: Water (6KL) Sanitation Electricity (50Kwh) Refuse Rates (Limited to RDP value) 59 2.7.8. Capital Expenditure Table 27: Capital expenditure – audited results Asset 2013/14 2013/14 actual budget Furniture - % spent 2012/13 2012/13 actual budget % spent - Infrastructure 17 769 675 21 646 000 82.09% 16 277 489 35 951 000 45.28% Office 713 513 1 222 000 58.39% 473 284 5 127 000 9.23% 0 3 618 000 0.00% 155612 4865000 3.20% 3 132 724 - #VALUE! - #VALUE! equipment Community Lease assets Infrastructures are financed solely out of grants received- MIG GOVERNMENT GRANTS AND SUBSIDIES ALLOCATIONS 60 EC106 Sundays River Valley - Supporting Table SA18 Transfers and grant receipts Description Ref R thousand RECEIPTS: 2015/16 Medium Term Revenue & 2012/13 2012/13 2013/14 Audited Audited Audited Original Current Year 2014/15 Adjusted Full Year Outcome Outcome Outcome Budget Budget Forecast Expenditure Budget Year BudgetFramework Year Budget Year 2015/16 +1 2016/17 +2 2017/18 1, 2 Operating Transfers and Grants National Government: Local Gov ernment Equitable Share 34 087 39 552 46 763 51 285 50 085 50 085 61 909 65 160 69 257 31 991 36 314 40 327 46 351 46 351 46 351 55 182 59 228 62 773 998 1 000 2 200 1 000 1 000 1 000 779 890 934 934 934 500 – – – EPWP Incentiv e Municipal Sy stems Improv ement 742 Integrated National Electrification Programme – Finance Management 1 354 1 270 1 650 1 800 MIG 1 800 – Disaster Relief Grant 1 800 – 930 957 1 033 1 679 1 679 1 756 1 875 2 010 2 345 1 243 1 286 1 350 2 396 Provincial Government: Small tow n rev atilazation 333 271 1 507 1 507 1 507 1 507 350 350 350 333 271 350 350 350 350 350 350 350 1 157 1 157 1 157 1 157 1 365 1 464 1 545 1 545 1 662 1 573 1 693 990 1 089 1 170 1 170 1 287 1 198 1 318 375 375 375 375 375 375 375 500 200 – – – – – – – – – – – Library Grant DISRAC District Municipality: – Environmental Health – – Fire Other grant providers: INDIRECT GRANT 9 512 2 784 DWAF 8 126 Other grant providers: 1 386 2 784 500 200 43 932 42 607 50 135 54 456 53 137 53 137 63 921 67 083 71 300 17 200 24 065 23 346 24 147 24 147 24 147 28 620 23 577 23 513 17 200 24 065 23 346 24 147 24 147 24 147 23 620 24 434 25 655 Total Operating Transfers and Grants 5 – – Capital Transfers and Grants National Government: Municipal Infrastructure Grant (MIG) Regional Bulk Infrastructure 5 000 Provincial Government: Other capital transfers/grants [insert – – – – description] 1 000 – – – – – 1 000 District Municipality: – – – – – – – – – – – – – – – – – – Environmental Health Other grant providers: INDIRECT GRANT DWAF Total Capital Transfers and Grants TOTAL RECEIPTS OF TRANSFERS & GRANTS 5 – 61 132 – 66 671 – 73 481 – 78 603 – 77 284 – 77 284 – 92 541 – 90 660 – 94 813 61 CHAPTER 3: STRATEGIC DIRECTION 62 CHAPTER 3: Strategic Direction 3.1 INTRODUCTION This section of the IDP comes immediately after the analysis section (chapter 2) and it details how the Municipality will achieve the targeted results taking into account its situation, needs and prospects. The strategies to be canvassed out assist the Municipality to be able to advance towards its targeted vision. 3.2 VISION: To be a United, Responsive Municipality that is Prosperous and Financially viable, delivering professional and excellent services to its entire community. 3.3 MISSION: Sundays River Valley Municipality will fulfill its Mandate to its Constituencies in a manner that is Accountable; Subscribes to Sustainable Utilization of Resources; and operating in a Democratic, Non-Racial, Non-Sexist and Safe Environment. 3.4 CORE VALUES Dignity Respect Trust Integrity Honesty Diligence Caring Transparency 63 3.5 STRATEGIC DIRECTIONS The Sundays River Valley Municipality is a category B municipality with a Collective Executive System made up of a ward participatory system established in terms of the Local Government: Municipal Structures Act 117. It is one of the nine local municipalities under Cacadu District Municipality. The municipality takes its legislative mandate from the provisions of Section 152 of the South African Constitution which is as follows: To give priority to the basic needs of the local community. To promote the development of the local community. To ensure that all members of the local community have access to at least a minimum level of basic municipal services (this takes precedence over others). To ensure sustainability of services, municipality and settlements. To give effect to the above mandate, the municipality has approved the following priority areas: Provision of Infrastructure and Basic Services. Local Economic Development. Community Services. Institutional Transformation and Development. Good Governance and Public Participation. Financial Viability and Management. 64 3.6 SWOT ANALYSIS STRENGTHS WEAKNESSES Dedicated Leadership Stable Council Fully fledged management team Internal Capacity OPPORTINITIES THREATS Strategic Partnerships Economic Development Social Cohesion PMS for accountability Unstable Communities Lack of Funding Staff morale Destroyed Municipal buildings 3.7 THE SUNDAYS RIVER MUNICIPAL MANAGEMENT CHARTER Municipal management charter according to the SDBIP addresses the following priority areas to ensure financial viability and sustainability of the Sundays River Valley Municipality: Implementation of a credible budget. Effective budget monitoring. Maintain and implement an effective credit control policy. Increase revenue collection with at least 20% to 70%. Review Supply Chain management policy and ensure regular reporting on Supply Chain matters. Effective monitoring of creditors. Effective and up to date billing system. Provision of clean, adequate drinking water to all. Unqualified audit opinion. Develop a credible IDP. 65 Fixing of roads in the municipal area. Good governance. Improved liquidity of the institution and reduction of the debt book (restore the financial viability). Community Engagements The municipality started community engagements on the 27th of February 2015 in Nomathamsanqa with a meeting of all ward representatives. This engagement was attended by the Mayor, Speaker of Council, ward and PR councillors and the management of the Municipality. A summary of the priorities that emerged is listed below. Ward/Area Paterson Ward 7 Kirkwood Issues raised Illegal occupation of houses Repairing of high mast lights Slow progress in the construction of sportfields Lack of political leadership and visibility of political head and structures Cemeteries not cleaned regularly Available sportfield is on private land and local teams have to use such fields. State of internal roads is appalling and presents a danger to pedestrians and motorists alike. Water and sanitation is still a huge problem Drain leakages go unattended for long periods No report back to the community on shoddy work (on roads) by contractors appointed by the Municipality 66 Nomathamsanqa Valencia Bersheba Growing concern that sports and recreational programmes are only happening in Kirkwood. Water and sanitation is still a problem High must lights are not working in Noluthando Street naming is needed Consistent supply of clean water is still a challenge Volunteers at the local library are not getting stipends RDP houses have no water connection Supply of water is not constant The mobile clinic comes once a week but this is not constant as some weeks it does not come. At the conclusion of the above all inclusive meeting, the political leadership of the Municipality together with the heads of the administration drew up a new programme to visit all wards individually to discern and confirm ward priorities from those that were captured on the 27th of February 2015 and those that were captured in the previous years‘ IDP/Budget consultation. Below is a reflection of the ward priorities from those engagements that took place. It is to be noted that the ward consultations are still ongoing and some wards are still to be visited. Cllr Qusheka Ward 5 2014/2015 ward priorities Building of RDP houses Upgrading and tarring of roads 2015/2016 ward priorities Building of houses Tarring of roads 67 especially in Nomathamsanqa and Langbos Erection of high-mast lights Electrification of existing houses Housing rectification especially in the Ntakazilali area on top of the canal. Identification of land for the building of a shopping centre Improvement in police patrols Improvement in response time of ambulance services Illegal dumping sites to be attended to Refuse waste to be collected timeously to stop illegal dumping Water condition is appalling and needs urgent attention Sewage system in Noluthando area to be attended to promptly Land for cemeteries and livestock Open water canal adjacent Nomathamsanqa and Langbos Hospital condition to be improved Recreational youth programmes Electrification of houses Land for a shopping centre Visible policing Access to emergency services Cleaning of illegal dumping sites Timeos refuse collection and access to refuse bags Houses in Noluthando need access to water No graveyards Land for agricultural activities Youth and empowerment programmes Improvement in the conditions in the clinic Community in need of a big sport centre and hall No toilets in Duka, Mandela, Zwelitsha Cllr Snoek Ward 8 Enon, Bersheba, Moreson and Greenfields 2014/2015 ward priorities 2015/2016 ward priorities Income generating project People of Moreson want a playground, /Sustainable Employment opportunities multi-purpose centre and a swimming Improved Skills and Education pool as children are swimming in dirty Upgrading housing infrastructure and water canals eliminate informal settlement Installation of geyzers 68 etc Title deeds Consistent supply and access to clean water Improved sanitation infrastructure High mast lights / housing electrification Clean and safe Environment (Big rubbish Bins recycling)or refuse removal twice a week Eliminate illegal dumping Control sewer overspill Control vandalism Control stock theft /general Subsistence abuse Community Centre (library, indoor gymnasium, career guidance, shopping centre Fencing in the existing playground Construction of a soccer field Upgrade and cleaning of the cemetery in Enon – employing a caretaker was highlighted. Lighting strength of high mast lights is weak Mobile clinic comes once a week – at times it does not arrive. Condition of roads is appalling Toilets in the community hall are not working In need of a site for a graveyard in Bersheba Houses built and transferred to people without access to water Fencing of the water canal Better control system for the community hall, sportfield and graveyard Empowerment for youth – especially in brickmaking Area of greenfields is in need of RDP houses, clean water and electricity Cllr Simpiwe Rune Ward 6 2014/2015 ward priorities Building of RDP houses Electrification of existing houses Housing rectification especially in the Ntakazilali area on top of the canal. Identification of land for the building of 2015/2016 ward priorities Land is needed for settlement especially for people in the Molly Blackburn and Langbos area Rectification of existing RDP houses that are not in a good condition 69 a shopping centre Improvement in police patrols Improvement in response time of ambulance services Illegal dumping sites to be attended to Refuse waste to be collected timeously to stop illegal dumping Water condition is appalling and needs urgent attention Sewage system in Noluthando area to be attended to promptly Land for cemeteries and livestock Open water canal adjacent Nomathamsanqa and Langbos Hospital condition to be improved Recreational youth programmes Erection of high-mast lights Upgrading and tarring of roads especially in Nomathamsanqa and Langbos Clean drinking water for human consumption High mast lights Land for cemeteries and livestock Internal roads around Bukani to be graveled while they have not been tarred Enclosure of water canal Emergency services (fire and ambulances) brought closer to the people to increase response time Construction of a playground for children As was stated previously, the community engagements are still on-going the lists are above are not exhaustive of the ward priorities of the Sundays River Valley. 70 Alignment of national and provincial plans with those of Sundays River Valley National Development Plan Government Outcome Economic growth Outcome 4: Decent employment through inclusive economic growth Outcome 11: Output 3: Implementing the Community Work Programme; Rural development Outcome 7: Vibrant, equitable, sustainable rural communities contributing towards food security for all Agrarian transformation and strengthening of household food security. Economic growth Outcome 4: Decent employment through inclusive economic growth Expand infrastructure Outcome 11: Output2: Improving access to basic services; Consolidation, development and diversification of the manufacturing base and tourism potential. Infrastructure development Building a capable state Outcome 5: Skilled capable workforce to Provincial Growth and Development Strategy – EC. Systematic eradication of poverty through a holistic, integrated and multi-dimensional approach to pro-poor programming. Public sector and institutional SRVM – Strategy 1.Promote employment opportunities through EPWP and CWP 2. Create credible institutional framework for investors and new business entrants to exploit business opportunities. Initiate poverty alleviation and food security programs by availing municipal resources and support (including municipal infrastructure). Facilitate effective branding and marketing of products/services identified in the Tourism Sector Plan. To provide and invest in the economic infrastructure development in all wards by 2017. Development of Skills Plan and 71 support an inclusive growth path transformation. Implementation Strategy 72 CHAPTER 4: PERFROMANCE MANAGEMENT 73 CHAPTER 4: PERFORMANCE MANAGEMENT 4.1 THE NATURE OF PERFORMANCE MANAGEMENT Performance management, as a system and tool of municipal governance, is a legislative imperative. Performance Management System in SRVM is intended to manage and monitor service delivery progress against the identified strategic objectives and priorities in the IDP. It is a system through which the municipality sets targets, monitors, assesses and reviews the organisational and individual‘s employee‘s performance, based on municipality‘s priorities, objectives and measures derived from the municipal integrated development plan. A Performance Management System enables the municipality to conduct a proper planning, measuring, monitoring, reviewing and reporting on its performance. Sundays River Valley Municipality recognizes that there are three separate points of focus when one looks at performance management. In no particular order, one can look at organizational performance (strategic level), secondly the focus could be on the performance of policies or programs (operational level) and lastly one can look at the performance of individuals (individual level). The illustration bellows reflects this. Strategic Organizational performance IDP Level SDBIP/ Operational Departmental Departmental Level Performance Scorecard Performance Individual Level Employee Agreement Performance 74 From the above illustration it is apparent that performance management includes both individual and organizational performance in an integrated set of planning and review procedures which cascade down through the organization to provide a link between each individual and the overall strategy of the organization. The main reason behind performance management in local government is the fulfillment of the twin tasks of improving external accountability while also increasing internal efficiency. 4.2 THE MANAGEMENT OF PERFORMANCE AT SRVM Sundays River Valley Municipality has for some time been without a person dedicated to the role of looking after the performance management system with all its demands and intricacies. This situation has since changed. From February 2014 SRVM has engaged a person skilled in performance management systems. As such, the municipality has seen attempts to bring its KPI‘s within the ‗SMART‘ principle. The 2014/15 financial year also has plans to cascade the PMS reporting tool to lower managerial levels. The Municipality has in 2014/2015 cascaded performance to two departments (Finance & MM‘s Office) as a pilot. There are intentions of cascading to other departments in 2015/2016 (Community Services & Corporate services and Technical). SRVM is particularly mindful of the importance of performance, and it‘s reporting for purposes of identifying prospective problems in implementation and also of the need to be accountable for such performance. The strides taken thus far are modest but nonetheless significant in such a crucial area of municipal governance. The municipality has reviewed and adopted its performance management policies for 2013/14 financial year. Council has adopted the performance plans of s57 Managers and were subsequently forwarded to relevant departments together with the performance agreements. In 2014/2015 the performance management Unit together with the office of the Chief Internal Auditor and the Audit Committee have undertaken a long process of making KPIs and targets SMART(er). The performance management policy was reviewed and adopted by Council in September 2014. Also, the performance agreements of section 57 Managers for the financial year 2014/2015 were adopted and sent to the relevant departments of government. The municipality uses an electronic system that requires Directorates to populate performance information in their discharge. The electronic system with the information fed into it makes it easier to access such information, and to consequently compile the quarterly and annual performance reports mandated by legislation. It also allows management to assess the strides taken to achieve the objectives as set. With the myriad responsibilities of local government, management is aware that it takes continuous attention, dedication and in particular stamina from management to keep focusing on performance management in order to keep it alive in the organization 75 CHAPTER 5: PROJECTS 76 Projects for 2015/16 have not been finalised yet. It however suffices to list the recommendations that were concluded during the service delivery summit that was held on the 15 March 2015. These recommendations will be packaged into projects and timelines during the council strategic session that will be held in April 2015. The attached draft Service Delivery Budget Implementation Plan for 2015/2016 has proposed/draft projects. The list is not final and is subject to change. The main projects that are funded from the R28, 6 million capital budget are: Upgrading of Addo Waste Water Treatment Works Upgrading of gravel roads Upgrading of Paterson Waste Water Treatment Works Rehabilitation of sport fields Community lighting Rehabilitations of Parks and Playgrounds Housing project Various items 77 Sundays River Valley Sub-regional Service Delivery Summit Resolutions 15 March 2015 Reitberg Primary School Background The objectives of the summit were to re-examine the state of the Municipality (governance) and service delivery challenges in order to lobby and leverage resources from the Provincial and National government departments. The resolutions of the four commissions were the following and resolved that: Commission One (1) 1) Governance and Public Participation 1. New Audit Committee appointment must be speeded up and finalized by the end of April 2015. 2. All agendas of Council and its committees must reach councilors on time as per the rules and if not, then action must be taken against those responsible for the compilation and delivery of agendas to councilors. 3. The Chief Whip should submit monthly reports on the attendance of ANC councilors to all council and other meetings that they must attend as well as their punctuality. 4. The Speaker must also submit a monthly report on the attendance of all meeting by all councilors and their punctuality. 5. Council and all its structures and committees must be trained, work-shopped on their roles, functions and responsibilities before the 2nd week of April 2015. 78 6. Special training and induction of the Local Labour Forum (LLF) members must be done urgently- by 15 April 2015. 7. The Mayor must strictly monitor the implementation of all council resolutions on a regular basis. 8. The EXCO must strictly monitor the implementation of all council resolutions on a regular basis. 9. Ward councilors must hold monthly meetings in their wards as well as area meetings in the wards. 10. The assessment and reviewal of ward committee of ward committees by COGTA must be speeded up and training for ward committees should include ward councilors. 11. The stipend for ward committees should be reviewed. 12. A clear public participation programme must be developed to engage communities. 13. The SPU must hold an outreach to communities to explain its role and programmes. 14. Relationship between Community Development Workers (CDW`s), Ward Committees (WC) and councilors must be strengthened and clarified. Commission Two (2) 2) Social and Community Services 79 15. Sector departments to strengthen their interactions with the municipality, as many problems are being experienced by our communities, be it IGR or on one-on-one discussions. For example: Department of Home Affairs – to assist people or children that never had birth certificates Department of Social Development – they are not honouring their schedule of dates, claiming that transport is a problem on their side Department of Health – clinics has got major challenges Department of Education – our high schools needs attention especially Samkelwe and Moses Mabhida, also building of Addo primary in Valencia Department of Safety and Liaison – SAPS to have satellite offices within communities for crime victims. Crime has taken its toll and one will be told there are no Vans to attend cases 16. Government should avail land for Human Settlement, farming and grazing 17. Water canal to be closed as many children and people are dying in it Under the competence of the municipality: 18. The state of the roads – municipality must have MOU with department of Public works in order to maintain the roads. 19. Illegal dumping sites and graveyards – Municipality must use EPWP/Community Based Projects in order to clean our communities and keep dignity of our people. 20. Strengthening oversight and monitoring of our municipal employees that are failing to do their work and drinking during working hours. 80 21. Multi-purpose centers for Kirkwood, Addo, Paterson areas should be prioritized. 22. The municipality must do land audit speedily in order to know which land belongs to who in Sundays River. 23. Street naming process for all the areas that doesn‘t have names should be prioritized because it makes it difficult for Police and Ambulances to find destinations. 24. High mast lights must be installed in dark areas and the current one must be fixed. 25. CoGTA must assist the municipality with CDWs for ward 3, 5 and 6 appointments. 26. Municipality must look at the ageing infrastructure as it might be the reason of the water challenges and leakages. 27. There must be a standing Ambulance and Fire Brigade in Addo for a case of emergency. 28. The municipality must speed up the registration of the Landfill sites and ask for assistance from the relevant departments where necessary. 29. The municipality must educate our communities as they experience vandalism of their own properties. 30. Community halls need renovations and proper fencing. 31. The municipality should not outsource the refuse collection as it is another challenge, they must buy own trucks and hire people to do it. 32. The project of roads must do storm water channel alongside so that the road cannot be damaged by the water when it is raining. 33. Environmental section/inspectors to be visible in our communities and do proper work of monitoring in keeping healthy living standards. 81 34. The community‘s needs and old age home for the elders. 35. There is a need of a library in Nomathamsanqa location, the current library is at the high school and it makes it difficult for people to reach it. 36. Rectification of pre-and-post 1994 RDP houses. 37. Sewerage spillages to be attended as a matter of urgency especially Billet Street in Valencia. 38. Filing of critical positions which are budgeted. 39. Each ward must have equipped offices to assist communities 40. Council to handle matters pertaining land claims 41. FET college to be considered 42. Task team looking at resolutions and attach time frames to resolutions 43. Caucus to sit and assess council performance or resolutions and not only sit for council agenda purpose. Commission Four (3) 1) Service Delivery and Infrastructure 44. Water 44.1 Water tanks should be provided on households with no water connection. 44.2 Scouring of water should be done regularly. 82 44.3 Water quality standards should be maintained. 44.4 Security fencing for all water treatment works dams 44.5 All Water treatment works & dams should be treated as "KEY POINTS" for safety. 45. Energy 45.1 Awareness on energy theft should be done. 45.2 Electricity should be done on areas where there is a layout plan before the development of housing for human settlements. 45.3 Erection of street lights where there is no lights on and its maintenance on existing ones should be done regularly and be monitored. 45.4 High must lights should be erected on settlements where there is no such lights. 46. Roads 46.1 Master Plan should be done. 46.2 Prioritization of Provincial roads that are within the townships like Nomathamsanqa road from R335 towards the township, Mabida road from town to the township, Bersig Road and Valencia whites road. 46.3 All internal roads & streets that are within the access to main road should be paved. 46.4 All gravel roads should be maintained regularly. 46.5 SRVM must have its own budget for funding of internal roads 46.6 SRVM must partner with sector departments in particular Department of Public Works. 46.7 Spending of EPWP Labour Intensive Grant should be monitored. • SRVM should access other modes of funding from the private banking to fast tract the backlog of service delivery 47. Sanitation 47.1 Regular monitoring of sewerage drains to avoid spillage. 47.2 Rapid Responce Unit be formed in order to assist for all reported leakages, spillages and drain blockages. 47.3 Prioritization of bucket system for Paterson as 2014 was said its the year to end bucket system 83 47.4 Finding an immediate solution on collection of bucket in Paterson as it is done at any time during the day. 47.5 All dumping sites, be it illegal or otherwise should be cleaned and monitored regularly. 47.6 Accessing of land for human settlements & expansion of small towns be fast tracked and the Molly land issue with Habata be speedily resolved politically. 47.7 Security fencing of all our sewerage treatment works and be treated as "KEY POINT" for safety. Commission Four (4) 4) Finance and LED 48. In the Revenue section of finance, a free basic services unit has been established through restructuring of finance office. 49. Training for councillors and staff on updating of Indigent Register and free basic services has been conducted and further training will be done for ward committees and community at large. 50. NERSA is currently helping with assessing electricity loss and by-passing. 51. Prepaid meters will have to be put in place and technical service is assisting in costing the project which will assist in increasing revenue. 52. Awareness campaign at the community level must be conducted to update indigent register so we can be able to service the people. 84 53. Review Organorgram to maximise on debt collection function to deal with business and government department that owe the municipality. 54. Reconcile data account. 55. We need intervention to SAN PARKS claim that, they were exempted to pay their full debt. 56. We need assistance to buy prepaid metres so that customers can be billed according to use as we currently losing revenue. 57. We have historical debt to both DWA and AG and we need assistance to clear this debt. 58. We need assist from Human Settlements to determine the correct ownership of houses to allow the proper owners to pay for services rendered. 59. We need to find solution to the water leaks problem to allow for accurate billing, we note that, MISA has come forward to assist in this regard. 60. Systems and controls must be put in place to ensure incorrupt data in our billing system. LED 61. One of the primary challenges is the absent of the LED Manager. 62. Industrialist- Our Local Economic Development sphere is industrial, more intense in citrus farming therefore the municipality needs to work on the skills related to the industry. 85 63. HR Development - College is proposed to train people in various areas 64. There are six proposed catalytic employment projects geared to increase employment 65. Small town revitalization project to develop a plan which will enhance investment and income in the area. 66. Municipality to create enabling environment for economic development so that business can prosper. 67. Sand mining from Paterson to be used to increase revenue 68. The Municipality should use EPWP rout to create jobs 69. The Molly Blackburn piece of land earmarked for development is valued at 1.5 million but the owner wants 6 million therefore council must apply to land affairs for expropriation. 70. Moratorium on land to be lifted and such land to be used to attract investment. 71. MIG allocation for LED 15 % and 5% for SMME`s The summit resolved to establish a task team that will ensure that these resolutions find resonance in the council operations. 86 Objective Key Priority Area Key Performanc e Indicator Annual Target To ensure that the poor households access free basic services and that each household has access to a set of basic household services Access to free basic and household services To ensure compliant reporting in respect of all grants SRVM Community has access to good quality MIG Funding # of households earning less than R1100 per month with access to free basic services # of households with basic level of sanitation # of households with basic level of electricity % of MIG grant funding spent 100% Number of kms of existing roads upgraded 5.5 km Roads & storm-water Budget ed Amoun t Quarter 1 Target Quarter 2 Target Quarter 4 Target 30th June 2014 Ward N/A Quarter 3 Target 31st March 2015 55 110 N/A 55 All wards 110 N/A N/A 55 55 110 N/A N/A 55 55 241470 00 N/A N/A 70% 100% 15 300 062 N/A N/A 0.5km 0.8km 87 Objective Key Priority Area roads built according to applicable standards Improved efficiency in municipal water usage Key Performanc e Indicator Annual Target Budget ed Amoun t Quarter 1 Target Quarter 2 Target Quarter 3 Target 31st March 2015 Quarter 4 Target 30th June 2014 N/A N/A 2.5km 5km Ward to surfaced standards Water resource manageme nt Increase in the number of kms of storm water pipelines to control storm water run off Number of kms of gravel roads drybladed % reduction in reticulation water losses (Bersig, Moses Mabhida, Aqua Park, Msengeni and Kirkwood town) 5kms 120kms O&M Budget N/A N/A 90kms 120kms 30% 2 300 000 N/A N/A N/A 30% 88 Objective Key Priority Area Key Performanc e Indicator Annual Target Quarter 1 Target Quarter 2 Target 80% Budget ed Amoun t - Ensure access and a continuous supply of good quality water and sanitation to each user by 2014 Upgrade electricity network for future developme nt Continuous good quality of water maintained in line with national Water Act % availability of water services to the consumers Electricity % electricity ring fenced for maintenan ce Turnaround time in repairing nonfunctional area lights Number of high mast lights installed Quarter 4 Target 30th June 2014 N/A Quarter 3 Target 31st March 2015 N/A N/A 6% - N/A N/A 6% 6% 5 days O&M N/A N/A 5 days 5 days 2 R400 000 N/A N/A N/A 2 Ward 80% TBA 89 Objective Effective Town Planning administrati on within SRVM jurisdiction To ensure all findings by the Auditors are addressed Key Priority Area Key Performanc e Indicator Annual Target Licensing %complian ce with NERSA assessment (D-form) Timeous approval of building plans Number of repeat findings Number of matters of emphasis reduced % complianc e (especially Fruitless and Wasteful expenditure , irregular and unauthorise Nil Nil Illegal buildings control Repeat findings Matters of emphasis reduced Complianc e Quarter 1 Target Quarter 2 Target 70% N/A N/A Within 10 weeks N/A - 100 complianc e Budget ed Amoun t - Quarter 3 Target 31st March 2015 70% Quarter 4 Target 30th June 2014 Ward N/A Within 10 weeks Within 10 weeks N/A N/A Nil Nil - N/A N/A Nil Nil - N/A N/A 100% complianc e 100% compliance - N/A 90 Objective Key Priority Area Key Performanc e Indicator Annual Target Budget ed Amoun t Quarter 1 Target Quarter 2 Target Quarter 3 Target 31st March 2015 Quarter 4 Target 30th June 2014 Ward d Expenditure and selfinflicted causes of deviations) Development Priority: Institutional Municipal Transformation To improve effectivene ss in municipal governanc e Vacancies % reduction in respect of in vacancy funded rate posts 85% reduction in the vacancy rate - N/A N/A N/A 85% reduction in the vacancy rate - Organizatio n structure 100% progress in the review of the organizatio nal structure i.e. organizatio nal structure submitted to Council - N/A N/A N/A Organogram submitted to Council for approval (100% progress) - % progress in the review of the organizatio nal structure 91 Objective Key Priority Area Key Performanc e Indicator Annual Target To ensure that the municipality has employmen t equity plan and that targets are met Employmen t equity % progress in the review of the employmen t equity plan Reviewed equity plan submitted to Council for approval (100% progress). Implementa tion of the equity plan Capacity building and empowerm ent programme s to ensure skills enhancem ent of staff Skills developme nt % representati on of women at middle manageme nt positions Number of employees trained 50% representati on of women at middle manageme nt positions 20% of total staff employed (total employees is 200) Budget ed Amoun t - Quarter 1 Target Quarter 2 Target N/A N/A Quarter 3 Target 31st March 2015 Draft equity plan tabled to LLF and standing committee for discussion (60% progress) - N/A N/A N/A 750000 N/A N/A 20 Quarter 4 Target 30th June 2014 Ward Comments from consultation incorporate into the plan (85%) - Equity plan submitted to Council for approval (100%) 100% of annual target 20 92 Objective Key Priority Area Key Performanc e Indicator Annual Target Budget ed Amoun t 360000 Quarter 1 Target Quarter 2 Target To ensure effective public participatio n of ward committees . To promote sound labour relations environmen t Ward committees Number of ward committee meetings convened 2 Labour relations Leave manageme nt & administrati on improved to comply with legislation Leave maintenanc e % of labour disputes resolved within bargaining council schedule % age of leave application s processed on time (processing = authorizatio n, capture and filing of leave) To have an effective ICT ICT % developmen t of ICT plan ICT plan submitted to council for adoption Quarter 4 Target 30th June 2014 N/A Quarter 3 Target 31st March 2015 One cycle of ward committee (1)meetings convened N/A 100% of all disputes resolved - N/A N/A 75% 100% 100% - N/A N/A 100% 100% N/A N/A N/A ICT plan submitted to council for adoption (100% Ward One cycle of ward committee (1)meetings convened 93 Objective Key Priority Area Key Performanc e Indicator Annual Target Budget ed Amoun t Quarter 1 Target Quarter 2 Target Quarter 3 Target 31st March 2015 Quarter 4 Target 30th June 2014 Ward ) To improve effectivene ss in municipal governanc e Audit % of 100% N/A progress on implement audit ation of action plan audit from both action plan AG and Internal Audit Number of Nil N/A repeat findings Development Priority: Good governance and Public Participation N/A 50% implement ation of audit action plan 100% implementati on of audit action plan N/A Nil Nil Annual review and developme nt of IDP/Budget District plan incorpora te (50%) Submitted DRAFT IDP for Council approval = 70% Published advert for IDP Enhancing systems for integrated planning and implementa tion % progress of IDP review 100% progress of IDP review 50 000 IDP process plan drafted All all wards consulted on IDP/budget IDP submitted for council approval (100) 94 Objective To enhance Council oversight To ensure effective communic ation and enhanced Key Priority Area Key Performanc e Indicator Annual Target Number of resolutions executed (Council, EXCO and MPAC) All resolutions of Council as per Council minutes All resolutions of EXCO executed as per EXCO minutes All MPAC resolutions addressed Monitoring section 79 and 80 committees Implementa tion of the Communic ation Strategy Number of MPAC meetings held 4 MPAC meetings held Number of stakeholder engageme nt plans executed 2 staff briefing sessions held Budget ed Amoun t - Quarter 1 Target - - - Quarter 2 Target Quarter 4 Target 30th June 2014 Ward All resolutions of Council implemen ted Quarter 3 Target 31st March 2015 All All resolutions resolutions of Council of Council implemen implement ted ed All resolutions of Council implemented - All resolutions of EXCO executed as per EXCO minutes All MPAC resolutions addresse d 1 MPAC meeting held All resolutions of EXCO executed as per EXCO minutes All MPAC resolutions addresse d 1 MPAC meeting held All resolutions of EXCO executed as per EXCO minutes All MPAC resolutions addressed All resolutions of EXCO executed as per EXCO minutes 1 quarterly staff briefing session 1 quarterly staff briefing session 1 quarterly staff briefing session 1 MPAC meeting held All MPAC resolutions addressed 1 MPAC meeting held 1 quarterly staff briefing session 95 Objective Key Priority Area Key Performanc e Indicator Annual Target as per communic ation strategy 4 community outreach awareness campaigns customer care % of complaints captured and resolved 80% of all complaints captured resolved - Implementa tion of vulnerable groups mainstreaming policy Number of vulnerable groups initiative per category (Disabled, Youth, Elderly, Women, Children) 2 initiatives aimed at youth - municipal image Continuousl y ensure good customer care for SRVM's stakeholder s. Representa tion, participatio n and inclusion of the vulnerable groups in the municipal agenda, 2 initiatives for the elderly Budget ed Amoun t - Quarter 1 Target Quarter 2 Target Quarter 3 Target 31st March 2015 2 community outreach awareness campaign Quarter 4 Target 30th June 2014 2 communit y outreach awarenes s campaig n 80% of all complaint s captured resolved 2 communit y outreach awarenes s campaig n 80% of all complaint s captured resolved 80% of all complaints captured resolved 80% of all complaints captured resolved N/A 1 youth initiative N/A 1 youth initiative N/A 1 initiative for the benefit of the elderly complete d. N/A 1 initiative for the elderly completed. Ward 2 community outreach awareness campaign 96 Objective Key Priority Area Key Performanc e Indicator workforce and relevant decision making structures. An effective performanc e manageme nt system compliant with Chapter 6 of the MSA Performanc e Manageme nt Annual Target Quarter 1 Target Quarter 2 Target 2 initiatives for women N/A 2 initiative for Disabled N/A 2 initiatives for Children N/A 1 initiative for the benefit of women conducte d. 1 initiative for the benefit of the disabled conducte d. 1 initiative for the benefit of children conducte d N/A # of signed performanc e agreements 5 performanc e agreement s signed # of performanc e assessments All section 56 managers including Budget ed Amoun t 50 000 5 performa nce agreeme nts signed All section 56 managers assessed All section 56 managers including Quarter 3 Target 31st March 2015 N/A Quarter 4 Target 30th June 2014 N/A 1 Initiative for the benefit of the disabled conducted. N/A 1 initiative for the benefit of children conducted 5 performanc e agreement s reviewed and signed All section 56 managers assessed by N/A Ward 1 initiative for the benefit of women conducted - All section 56 managers including the Municipal 97 Objective Key Priority Area Key Performanc e Indicator Annual Target conducted for all section 56 managers Positive audit opinion Baseline: Disclaimer Budget ed Amoun t Quarter 1 Target Quarter 2 Target the Municipal manager assessed quarterly by the Municipal manager Unqualified audit opinion Portfolio of evidence files up-todate and compliant the Municipal manager assessed by the Performa nce Review Panel Portfolio of evidence files up-todate and compliant 20% 40% Quarter 3 Target 31st March 2015 the Municipal manager Quarter 4 Target 30th June 2014 Portfolio of evidence files up-todate and compliant Portfolio of evidence files up-to-date and compliant Ward manager assessed by the Performance Review Panel Development Priority: Local Economic Development To provide and invest in the economic infrastructur e developme nt in all wards by 2017 Grant expenditure % expenditure on LED grant 100% expenditure on LED grant 60% 100% expenditure expenditure on LED on LED grant grant 98 Objective Key Priority Area Key Performanc e Indicator Annual Target To SMME # of 4 strengthen developme developme developme the nt nt initiatives nt initiatives institutional conducted conducted capacity of SMMEs and Increase the number of viable emerging businesses Development Priority: Community & Social Services Communiti es have sufficient and affordable solid waste disposal options to encourage clean and healthy environmen t Clean up campaigns in targeted areas # of clean up campaigns conducted 2 campaigns conducted Budget ed Amoun t 50 000 Quarter 1 Target Quarter 2 Target 2 initiatives conducte d 2 initiatives conducte d - One clean- up campaig n One clean- up campaig n Quarter 3 Target 31st March 2015 2 initiatives conducted Quarter 4 Target 30th June 2014 One cleanup campaign One clean-up campaign Ward 2 initiatives conducted 99 Objective Key Priority Area Key Performanc e Indicator Annual Target To ensure provision of water quality monitoring and food control Regular water and food quality testing # of water samples tested # of formal food selling premises evaluated. 144 samples 40 formal food businesses evaluated - To ensure the provision of effective and efficient fire and disaster manageme nt services throughout the SRVM Awareness campaigns # of fire awareness campaigns conducted % resolutions implemente d by DMF 6 fire awareness campaigns - 100% implement ation of resolutions - Traffic safety 100 premises inspected for fire safety complianc e 12 road traffic law enforceme nt - To ensure provision of traffic services # of premises inspected for fire safety complianc e Number of road traffic law enforceme Functionalit y of the DMF Inspections for fire safety Budget ed Amoun t - Quarter 1 Target Quarter 2 Target Quarter 3 Target 31st March 2015 36 water samples tested 20 business premises evaluated Quarter 4 Target 30th June 2014 36 water samples tested 20 business premises evaluated 3 campaig ns 36 water samples tested 20 business premises evaluate d 3 campaig ns 3 campaigns 3 campaigns 100% resolutions implemen ted/or otherwise escalated 25 premises inspected 100% resolutions implemen ted/or otherwise escalated 25 premises inspected 100% resolutions implement ed/or otherwise escalated 25 premises inspected 100% resolutions implemented/ or otherwise escalated 3 road traffic law enforcem ent 3 road traffic law enforcem ent 3 road traffic law enforceme nt 3 road traffic law enforcement operations Ward 36 water samples tested 20 business premises evaluated 25 premises inspected 100 Objective including improved revenue enhancem ent Communiti es of SRVM with specific reference Key Priority Area Key Performanc e Indicator Annual Target nt operations conducted operations conducted Revenue collection % improveme nt in traffic fines revenue 5% improveme nt Revenue collection % of traffic fines debt collection Revenue collection % of traffic fines debt collection 25% collected of old traffic fines debt as at 1 July 20145 40% collection of newly transferred traffic debt as of 1 July 2015 100% completion of phase 3 % progress in upgrading of sport fields Budget ed Amoun t - Quarter 1 Target Quarter 2 Target Quarter 3 Target 31st March 2015 operations conducted Quarter 4 Target 30th June 2014 operation s conducte d 2.5% improvem ent in traffic revenue from the baseline N/A operation s conducte d 2.5% improvem ent in traffic revenue from the baseline N/A 2.5% improveme nt in traffic revenue from the baseline 2.5% improvement in traffic revenue from the baseline 75% of annual target collected 100% of annual target collected N/A N/A 75% of annual target 100% of annual target N/A N/A 75% of upgrading 100% of upgrading Ward conducted 101 Objective Key Priority Area Key Performanc e Indicator Annual Target to youth have access to suitable and affordable recreationa l and sport facilities and public amenities. Cemeteries # of cemeteries cleaned % progress in procuring burial register Library outreach Sports and recreation Resource mobilization Multipurpos e centre # of library outreach programme s conducted # of sporting and recreationa l activities conducted % progress in the constructio n of the Multipurpose thusong centre Quarter 1 Target Quarter 2 Target 6 cemeteries cleaned 1cemeter y cleaned 100% completion in procureme nt of burial register 8 N/A 2 cemeteri es cleaned N/A 2 2 8 2 activities N/A Commitme nt letters stating the committed budgets and time frames Budget ed Amoun t - Quarter 3 Target 31st March 2015 2 cemetery cleaned Quarter 4 Target 30th June 2014 funds lobbied through adjustment budget (35%) 2 100% completion in procurement of burial register (50%) 2 2 activities 2 activities 2 activities N/A N/A Commitment letters stating the committed budgets and time frames Ward 1 cemetery cleaned 102 Objective Key Priority Area Key Performanc e Indicator Emergency centre % progress on the Paterson integrated emergency centre Complianc e with grant conditions (FMG) % expenditure on each conditional grant against allocation Timely submission of annual and midyear budget Budget ed Amoun t - Quarter 1 Target Quarter 2 Target Commitme nt letter stating the committed budgets and time frames. Development Priority: Financial Viability and Management N/A To produce financial reports that meet the requiremen ts of the National Treasury Departmen t Between 95% and 100% - Annual budget submitted within prescribed timeframe – Midyear budget submitted within prescribed timeframe - Effecting budgeting process Annual Target Quarter 4 Target 30th June 2014 N/A Quarter 3 Target 31st March 2015 N/A Ward Between 95% and 100% Between 95% and 100% Between 95% and 100% Between 95% and 100% - N/A N/A Midyear budget submitted (30 January) Annual budget submitted - Commitment letter stating the committed budgets and time frames 103 Objective To unsure a sustainable cash flow Key Priority Area Key Performanc e Indicator Annual Target Actuals, Budgets and Variances accurately reported Effective inyear statutory reporting % margin of error Less than 5% Timely submission of reports 12 timely Section 71 report submitted within 10 days of each new month 4 timely section 52d reports submitted within 30 days of each new quarter Timely submission of section 72 report To 60 days Cash manageme nt Number of days creditors Budget ed Amoun t Quarter 4 Target 30th June 2014 Margin of error less than 5% Quarter 3 Target 31st March 2015 Margin of error less than 5% Three (3)timely section 71 reports Three (3)timely section 71 reports Three (3)timely section 71 reports Three (3)timely section 71 reports Section 52d report submitted within 30 days of the new quarter Section 52d report submitted within 30 days of the new quarter Section 52d report submitted within 30 days of the new quarter Section 52d report submitted within 30 days of the new quarter - N/A N/A N/A - 60 days 60 days Timely submission of section 72 report 60 days - Quarter 1 Target Quarter 2 Target Margin of error less than 5% Ward Margin of error less than 5% 60 days - - 104 Objective Key Priority Area Key Performanc e Indicator Annual Target Budget ed Amoun t Quarter 1 Target Quarter 2 Target Quarter 3 Target 31st March 2015 Quarter 4 Target 30th June 2014 Ward 25% increase from previous years‘ collected revenue. 3200 - 25% 25% 25% 25% - - 800 800 800 800 - Deviations constitute not more than 20% of all transactions Deviations constitute not more than 20% of all transactio ns Deviations constitute not more than 20% of all transactions Deviations constitute not more than 20% of all transactions - % Irregular Irregular expenditure expenditure reduced reduced by 80% relative to the previous year Irregular expenditu re reduced by 80% relative to the previous Deviation s constitute not more than 20% of all transactio n Irregular expenditu re reduced by 80% relative to the previous Irregular expenditure reduced by 80% relative to the previous year Irregular expenditure reduced by 80% relative to the previous year - outstanding To ensure debt is managed sustainably To ensure proper procureme nt of goods and services in terms of chapter 11 of the MFMA. Revenue collection enhanced % increase in revenue collected Indigent registration Number of indigents registered % reduction in deviations Supply chain manageme nt Irregular, fruitless, unauthorise d and wasteful expenditure curbed 105 Objective Key Priority Area Key Performanc e Indicator Annual Target fruitless, Reduced to wasteful zero and unauthorise d expenditure reduced Budget ed Amoun t - Quarter 1 Target Quarter 2 Target year year Reduced to zero Reduced to zero Quarter 3 Target 31st March 2015 Quarter 4 Target 30th June 2014 Ward Reduced to zero Reduced to zero - 106
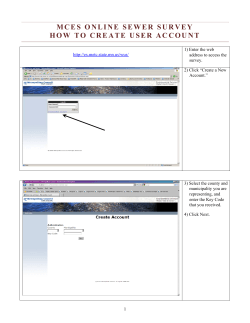


© Copyright 2026