
{4izott - Fakultas MIPA UGM
leirL 61i64 vi'{'u y4. {4izott
Pmceeclings World Geothermal Congress 201
Melbourle" Australia. 19-25 April 2015
5
0r. uJitril
3D Inversion of Magnetotelluric Data from the Sipoholon Geothermal Field, Sumatra,
Indonesia
Sintia W. Niasaril
3.
S3*
(ierlrd Muiiozr, Muhammad Kl'rolid:.
E.di Suirantor and Olirer Ritterl
|GFZ G".rrr",, Resenrch
Ccntre lbr Geosciences. T-elegrulbnberg" 14473 Potsdam. (ierntanv
IPSDG Center
tbr Gcological Ilesources.
3Geophvsics
.I1.
Soekulo-lIatt:a444. -10122 Banciuns. Indonesia
Studv I)rosrar11, Ph-r'sics Departmeul. F. MIPA- UGM. Sekip lltara. 55281 Yogr.akarla, Indolesia
Ke1'rvords: magnetotelluric. lton-r,olcanic geothermal s\sten.t. Sunratta. exploration" -3D inlersion
,\tls'IR-\C't'
The Sipoholon geothermal 1leld has been identified as a nroderate temperature geothenlal s1,st*m based on geothennonretrr,. 'I'hi.
geotherrnal field is charar.terised br' 18 lrot spdrres and located around 1hr-:'far-utung basin" a pull-aparl basin along thc Sumatra
fault. Debates continue on hor lhis geothermal svstern rrorks.
-ll) inversion of magnetotelluric (MT) data has been pertbrmed using the I\{odElvI code. Sir dift-erent schemes (using dit}erent
colnponents. rotation. and error iloor settings) u'ere uscd to invcstigate the effect ofeach scheme on the modcl result. Although the
rnversion results ofthe six schcnrcs erhibit clillerent conductivit-r' contrasts. all ofthem display sinilar structures. A11 models show
a shallorv conductive anomall,, beneath Ihc'l'arulung. busin and a vefiicall-r'elongated conductor at the c:aslcm part of the Tarutung
basin. 1he shallon conduotor beneath the Tanrtung basin rs interpreted as unoonsolidated sediruents of l'olcarric ot'igin. e.g. the
voung Toba TutT(74 ka). Thc vertical conductor coincides with the location ol Panabungan hot spring and normal tirult zones. This
verlical conductir:e z-one indioatcs a circtrlating hot tluid heated up bl deep rnagmatic actrr,itr.'due to the subductiou process.
1.
IN'IRODIiCTIOI\
Magnetotelluric (MT') measuremeilts are used u'idelv for geothemral exploratiou (c.g. Sp:ichak and Manzella. 2009). Ihe M'I
method is a passive electrouragnetic method u,hich uses electrit-. aud nragnetic lield variations olnatural oriein (Vozon 1990). fhe
relaliou hetl'eeu electric and magnetic fields as a function of pelitxl (or frcquencv) delermines the subsurlaoe clectrical
couductivitr, distribution (Tikb onov. 1 950; Caguiard. 195,1 )
As of 2000. three-diurensiollal (-lD) irtversions ol M'f data have beeu used lbr geothermal exploration (Yarnane et a1..2000). '1'hc
developmenl of -lD inlersron of M-1' data is groiving vastl]' along u'ith lhe dcr eloprnent of cornputin.e hards'erc. 'f he present llork
is airncd to irrvestigate. the -lD model ol snbsuri'ace electric ccinduotivitv distribution of the Sipoholon geotl-rermal ll1ed located on
de'nsely populated regions
ot Sumatra" Indonesia (l;igurt:
10t-il!-r'E Ill::
1).
*-
-l'-r"a
llnmJn ,r
Austtxlian'!.,
Bl*ts
Y; *
igq;;. - -
- -,-N$rfilalfsir}lts
-'"'Tlirilsi
--'--- Faults
fs;.lits
@ N*ilsEJ fu,l sFring8 t$H; s-IJ
{& Aeid h.ot Ep}n95,{p.}.l; 1-}1
*
l&*aary,eg
10 Knr
98'
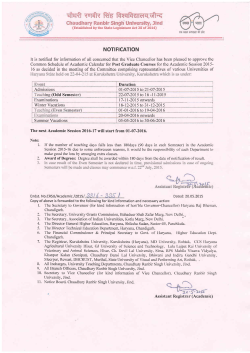
Figurt' 1: Location of hot springs (green circles), inactivtr vrlcinoes (red triangles), faults and thtr 'l'arufung basin. Rctl
r:ilcles indicnte fhe Silangkitang acidic hot springs which are close to n senled sinistral faulf. The gre.y alea inclicrrtes
the distribution of the :rllulium dcposit in the 'Ialufung basin (modificd from Nuliman and trIoecli, 2013). Dashed
red contour marks the high Vp/\rs rnrio (>1.75) at 2 km depths (motlilit'd from X.{uksin et al., 20L3). lnset: \Iap of
Sumatra showing the subduction zone irnd motion of the plate (intlicatcd bl. arrorvs) (mo<Iified lrom Sieh antl
Natarvidjaja,2000).
I
h
Niasari et al.
I'he Sipoholon geothet'ntal tlled is situated in the vicinitv of the Sumatra Fault (Figure 1).'I'he Surnatra Fault rs a i650 krn strrke
slip fault due to obliquc subduotion betu'een the l'-urasizur and Australian plates (Sieh and Nataividjaja.2000). fhe sr.rbductron also
resultcd on magmatic activin'along the Sumatra tault (Sieh and Natat,idiqia. 2000).
l8 hot splings are distributed inside and around the Tarutung basin. including the Panabungan (PNB) hotspring il:igure 1). The
PNB hot spring is locatecl close to a normal fault zone wirich is part of a negatirre florver struchrre of the Surnatra 1-ault in this arca
Q''lukman and Moeck, 2013). Fluid santple s of the PNB show lou' ratio oll deuteliurn and os'gen indicating that the water contains
uragtnaticrvatersliomdepthmiredr.vithsurlacewaters(l,lukman,20 l4). lhePNBfluidsaurplesalsoexhibitner.rtral ptl.indicating
au up-l1ou'zone of the Sipoholon gcolhemral tield (Nukrnan,20l4). Additionall,v" a high Vp,Vs anonralv found beneath the PNB at
2 knr depths interpreted as high l1uid crtntent irl porous media (Muksil ct al.. 2013).
Here. rve perfclrmed separate iurersious to inrestigalc the eflects olthe data components. rotation and error floor settings in the
inversioil model results. particularlv on tht: stmclures close to the PNB. Wc oonrpate horizontal sections of each rnodel as r,ell as
cross section along a profile. Accordingll, interpretation ofthe sttuctnres resulted trorr the inversion is also discussed.
2.
NIAGNI,I'[O'l'ILLURIC I,IETHOD
2. 1
N{agnetotelluric Dirta
On Julv 20 1 l. an MT sutvey consisting of 70 sites rvas conducted to investisate the subsurlace of the Sipoholon geolhermal field.
Site spacing u'as approxitnately I km covering an area ot (2i x 25) kmr. except at some siles tiue to the presence of high r.oltage
por'rer lines and accessibilitv problems. Five componetrts (lir. Iir'" Hr. Hr', and Hz) u,ere measured uith ore additional pernlanent
remote relerence (RR) site. The magnetic f-relds were rreasurt:d using Metronix MF306 and MIr07 induction coils. Non-polarizable
silr,er-silr,er chloride electrodcs measured the horizontal electric fields. A11 sensors rvere connected to the sensor box u'hich s,as
linked to the S.I'}.A.M. (Strort-Period Automatic Magnetotellunc) MkIV real lime M-f svstems. The S.P.A.M. MklV recorded data
in the licquencv rangc 0.00-1 Hz to 10 kHz.
The data were processed usilg the robust processiug algorithms of the EMERALD sottx,arc package (Ritter et al.. 1998:
Weckmann et al., 200-5: Krings. 2007: Chen, 2008). The data processing consists ol trvo steps. thc single site plocessrng and thc
rernote reletence (RR) processing steps. Delay line liltering rvas applrcd to thc single site processing to impror,e thc data qualitl in
high freqLrencv (:'50 Hz). The RR teclurique was applied to irnprove the data qualitv in low frequency 1.:0.1 llz). An EDI l-rle tbr
each site sas created tiom a comhination ofdata tiom single site and remote relerence processiug.
Due to the data qualitl', in this 3D inversion stud\'. \t'o used onlr'51 from 70 MT sites. The phase-tensor ellipse map aud real
inductron \roctors at a period of 1 s ol'thcse i I sites are displayed in Figure 2. Plotting the phase lensor ellipses together lith the
real induction arrouis at certain period gi'r'es not onh,' inforrnatiou about the dirnensionality, but also the about the (possible) strike
direction (}}ooker. 201-l). As shown in Figure 2. the real inductron arror.r,s (Wiese convention) and the ases ol the phase tensor
ellipscs arc noi allavs aiigned. For l-D and 2-D case. the leal induclion arrorvs and the axes of the phase tensor ellipse are
erpected to be collitear (Caldt,ell et a1..2004). Fot a -l-l) case. the ellipse rnajor axis and the real induction arrows are not aligned.
:7
i-
t
Itrt
llY
a..l
q
t
{.
I
i'
F
aa
s
It
10 Krn
t-t
!:i; 'r,.)'f
Iaigure
iJii
5
lij'f
2: Obse'rved phase tensor ellipses *nd real induction arro\\'s (\Yiese conr-ention) at a period of I s. '[he ellipses are
nolmalized with maximum principal axis. C-olours filling the ellipses show- the phase tensor skerv angle (p). Black
lines indicate surface trace of normal faults. Blue line marks a profile shown in l'igure 4. Dashed grey' lines mark the
Sum:rtra fault and the Taruhrng basin. llost of the sites close to the normal faults exhibit high values of p (as
indicated b1' red or blue colouls), indicafing a 3-I) character. Induction vectols displal- stronger conductivity
t:onttast in the rvestern part of the (TB) than in the eastern part. N'Iost of the real induction vectors point alr'11' from
the basin, e.g. to the \\I.
2
Niasari et al.
IIT Data
3D inverse modelling nas carried out using the Mod3t)EM (Egberl and Kelbert, 2012 and Meqbel,2009). For the iflversion. the
data at 5l sites for a period range of 0.001-1000 s u,as used. The data uas selected carefully, omitting noisl,sor,urdings uith largc
scatter or large emor bars. The data consist ofthe lull impedanoe and the vertical nragnetic ttansfer fuuctions (r'TFs). "l'he gdd cell
dimensions were 500 x 500 m in lateral extent tbr the inner grid. with 10 paddrns cells increasing br,a t-actor 1.5 at each direction.
The verttcal grid inoreases by lactor 1.2 starting from 50 m. I'he total numbers ol cells is 80 r 80 x 40.
2.2 3D Inversion of
We perlbrmed six dil'tercut inversion schemes (see 'lable 1 in the follorving section). 3D inversion of models A and B .6,ere oariecl
out to stttdy the sensitivity ol VTFs data. while the -llJ inverston of model A-D rvere carried out to investigate the contluctirritv
colltrasl dependencl on data and grid rotation, especiallv beneath the PNB. Additionally. .ll) inversion of rng{els E and F s,ere
per-lbrmed to analvse the sensitivitv of the diagonal elements of the impedance and the VTF's.
Table 1. Six schemes of the 3D iuversion used in this studv. including the selline oleach schemes.
Model"s
rlallle
Data and grid
rotation (deg)
Data components
A
0
Full impedance
Zxx: Zyy:
5q/o;Zxy: Zyx
B
0
Full irnpedance and VTFs
Zxx:
:
5Yo; Zxy
3o/o;T211- Tzy: 0.03
C
-JO
Full impedance
Zxx:
D
-36
Full impedance and VIFs
Zxx:
E
F
l'irll
0
impedancc ard VTFs
Full irnpedance and VTFs
0
Total iteralion
Global
nurnbers
rn
69
2.1
77
1.8
SYo;Zxy: Zyx:3o/o
114
2.9
:
- Z7x :
9l
2.8
:
-
74
1.6
: Zyx:
67
t.7
Error lloor setting
Zyy
Z3y
:
Zyy
5s/o;
Zxy
3o/o;T7v: Tzy
:
Zxx
:
309'o:
3o:b;
Tzs: Tzy ,', 0.03
Z,v-v
Zxx = Zyy
:
:
0.03
5o/o;
Zxy
Zxy
-
3%
: Z3x:
Z,vx
RMS
isfit
3a/o;Tzx: Tzy = 0.3
3. RESTILI'S
All
models present similar lbafllres (Figure 3), such as a ven resistive bod-v (RI) in the south-rvestemmost region olthe snldy area.
The Pctmial granite bolder liotn srtrlace map lt'orn Nukman and Moeck (20l3) is collocated with I'eature R1. A shallo.r.r colductive
anollall'(Cl) is imaged consistetrth beneath the'IB. The inversion result of model B shorvs t-eature C1 reach I Qm at I km. In
addilion. a conductive anomall, (C2) that coutinues at depth (Figure 4) is located around the PNB hot spring and normal fault.
Featrtre C2 has a rcsistivitY belot' i0 Qrn in all models. but slightlv dill-erent condustance. The lateral resistive discontinuih, is in
good correlation rvith a NW-SE PNB nornral lbult zone liom surl-ace mapping bv Nukman urd Moeck (201-3). Beneath the inactive
Martimbans volcano. a conductive bodl' (C4) n'ith less than 10 Om appears in some models (in model B. C4 is locaterl beneath the
hot springs and a normal t'ault) but not in others (such as A or F).
e
?
!*'0l]L-
EE1:u un hH1
rt'eo.cnrra
\
'
lil
L.-llrjrr:r'.
Figure 3: Resistivity in the Sipoholon area at 1.0 km depth from 3D inversions of MT data Red dots: hot springs; lrlack
dots: MT soundings; thick black lines: Permian granite confour lines from surface mapping; dashed black lines: the
Tarutung basin area. Low resistivity anomalies (< 10 Slm) correspond to red and yellw colourq suctr as those
appearing beneath the Tarutung basin High resistivity anomalies (>100 fkn) correspond to blue colourq such as
those appearing beneaffr the Permian granite in *re Western part of the study area.
Niasari et al.
l'he dift-ercrrces bettleett each rnodel are nurnber ol iteration nccded until the rnodel collvergo and total ltlvlS mrsllts (see T'able 1)
as rell as conductivity conlrasts. Inrersiotr ot un-rotated rnrpedances and VTFs imodel 13) exhibits the strolgest conducti'i1r,
aontl'ast benealh the TR.'fhe rotated itnpedrurces and V'I 1's (model D) displals less condr-rctrr,it\,contiast compared to the urirotated irnpcdattces and VTFs (ntodel B). The nodel result usiug ur error flool ol 30 per cent ol Zxy * Zl..
"t lor the rliagonal
elements (i.c. dolvnlr'eislrtiug thc main diagonal elenicrils) in nrodel E also shou,s lcss eoncluctivit_r,contrast. The preterred
inversiou uodel is ttre inversiou result of urodel R. using un-rotated impedance arr<i V"lFsFigure 4 sltous the complrison belrr.een 2D and ,lD inlersior results of both prcferred modei along a proiilc (indicated by blue line
in Fisure 2). 'lhe 2D ard ,lD inversion approaches har,e some dil'lcrcuces. sucfi as dift'ere1t tnesil col1stfl.rc1io1. Ho1,ever. thc 2D
and -lD inversion results reveal similar conductivifi,structures. such as featLrrcs Rl and il2. The Tarutung basin is represented as a
shallon, coudtt ctor (C i ) u'ith reslstivit\' le ss than 10 Onr at deptir dor,rm to 2 km in bolh approaches. The upper part .f the couc{uotor
ciose to PNB (C2) extends verticallv dotn to -1 knr depths rn both model results. I-lorvever, the lorver pari of this coldsct.r.is r.rot
inraged in thc -ll) inr,ersion result.
-t
,4j
!l
^
l;
g
E.
.u
o
6
u)
nr
14
l')
{])
O
J
;
el
I
:F
+
cr
a
D
(.)
a--1
g]
'10
Dis&nse fkml
if
Iligure 'l: SW-NE resistivifi sections :rcl'oss a profile obtained li'om 2D inr,ersion (abor-e) anel 3D invcrsion (belorv). In1e1te4
triangles: NIT st:rfions. Prolile loc:rtion is shonn as a blue line in the Fizure 2. Lrxr resistiritr anonralies (< 10 Om)
are represented n'ith red and vellort colours and are labelled :rs Cl. I{igh resistir.itv anom:rlies (> 100 flnr) are shorvtr
in blut' colours nnd labelled as R. To clari$,, the smallest cell size used in 2D ancl 3I) inver.siurs are tlifferent (i.t,. ?0
ln and 500 m, respectivelv). I}trth 2D and 3D inversion results display similar str.uctules, such rs a shallorv concluctor
beneath thc 'farufung basin (marked bl black d:rshcd tr:rpt'zium). However, 2l) inversion resulted in clecpcr
extension of structures th:rn 3I) inver.sion.
,1.
DISCTIiSSION
Theresisti"'etrod,vRl (seeFigure -1)attlresurthcecorrespondstothePermiangranite.ThisPermiangranrteintireSWr.esiolt6lthc
studv area (sce Figure l) could be inrpermeablc- so then it gives high lesistrlilr,respollse r{rich means no fluid path.n,ar,s ald no
slsl.eln as indicated bv the absence of anv geothcrnral manil'e-ctation. sur.;h as itol spritl-s. The areabetween the permian granite and
the 1'B at the surt-ace coincides rr'irh t'eathered NIioce.ne andesite lr'hcre the arca shot,s a re.sistivitr. bellveen 50-i00 Onr. In the
Martrmbang lolcano. T'his conductivc zone ocLrurs doun to 2 km depths and might be correlated to thc preience olthermal tluids.
altenratir-e erplanation of C.i is hvdrtr-thermall)' altered Andesitic material due to liigh telrperatures i1 the past u,he. thcr
intrr-rsion of Martinrbang r olcano occurred.
An
The shallou'conduclot (C1). shoxrr in red. bcireath the-{Il is intcrpreted as ulconsoiidated sedimentary filliug. This alllr'rurn
cottles i'om the higher areas to the East and to the West of thc basiu. Frorn a discoltinuitr, in the Vp tomographv nrodel. thc
'l-arLrtung basin nas interprcted
as havirrq a depth c,'f 2 km bl Muksin et al. (20ij). A1 depths. belolrr2 km. lrith resistivitv r.alues
betrl'een 10 and 100 ()nr. the anonralr could be rclated to the Sumatra fault. This conLluctor sepalates R1 and R2 antl coincides lith
a concelllratiotl of locul earthqttake hehteeti 2 knr and i 1 knr depths bencath the Srimatran tault
lMuksin et al.. 20i -1).
Couductor C2 can bc divided inlo nvo parts. the uppel'part dorvn to 4 km depths and the deepcr part belo\li 8 km depths. Thc Lrpper
palt o1'C2 is interpreted as a iluid path uavs. both lr'our the reserloir to the surlace rnanrli:station anLl fi.om the surface tri the
Niasari et al.
reservoir. This intcrpretation is based on strttctural geologr' finding. uhich iuterpret the PNII normal fauh zone as parl ofa negatir.'e
1'loner strltctttt'c and therelbrc of a frachrrc srstern (Nukrnan ar-rd Moeck 201-1, Nukman.20l4). The reserr,oir itsetl'could be around
2 knt depths u'here the highest conductivih occurs (see Irieure 4). Unlike i1 volcaqic geothemral systolns. the reserrroir zole ofthe
Sipoholon uotr-r'olcatric seothermal s1'stetn is not characterised bl the electricallv resistivc proph,vlitic xlteration mrneral. Thc
condrtctive zoue is due to hot salinc u,ater accumulated at depths. -fhe lorver parl of C2 ooLrid be related 10 lluid palh n,ar,s ol
tnagmatic \\'ator \\111ch rnighl be orisinated bl subduction processes at depth. Tliis hot magrnatic uiatcr- as indicatcd tiorn thc geocltemistrrr stud,r'of Nukman (2014), could be the hcat source of 1he Sipoholot geothennal s\rstem.
5. CONCLTJSION
UsiIre the ModllM-lDMT. 1^'e can cultrol the input data. qhelher iirll impedances. VTFs or a combinaliou of both. 'lhis has the
advantage that se can anal.,'se rvhich courprinonts olthe date control the subsnrface inlbrrnalion aad.,lhich componegls have io6er
data qLralit-v. Hor.r,ever. this is computatronallv erpensive.
Although thosc sir models have dill'erent dala input and settings. all of thern rcvcal similar conductiviq,'l-eatures. This mecns that
data arrd giid rotatron is not tiecessarl- for 3D inversion of tlre Sipoholon },,I'f data. Accordingl'n. the conductivilv features appearing
in -lD irrvorsion are also prcsent in 2D inlcrsiou, sr-rggesting 1he robusfiress of lhese t-eatrres. Our results shou that the -lD inver-sion
without rotating data and gnd can be etlbctivelv uscd in a relativel-,'2D s.eological settins. such as il the Sipoholon area.
All
inversion niodels imago a rrertical cotrductor. extending h'onr srirface to approsimately 4 krn depth. in the eastem part o1 1he
Tarulung basin. This r,ertical conciuctor coincides l'ith tire iocation of Panabungan hot spring and normal tault. 'l-his deep reacirine
cortductive zone reveals possible tluid patltu.a-vs" both for recharge of meteoric rvaler and for asccnding magmalic water tionr a
possible deeper reservoir. The geothertnal reservoir in-betr.r'een is heated up bv the circulating hot iluids, 'r.rdrich originate tiom
magmatic aotivilv related to the subduction process. ()ur interpretatidr is consistent'rvith geochemical studies r,vhich indicate
lllagmatic origin for lluids sarr4rlc<i tiom the Panabungan hot spring.
R!]I.!-RIINCES
Booker. J. R.: The Magnetotelluric Pl'rase'I'ensor:
A Critical Revier.. Sun,. Gaapl4-s..35, (20i3).7-:10.
Cagniard, L.: Basic Theorl'of the Magnetotelluric Method of Geophr.sical Prospecting. Geophttsics.lS, (195-1). 605-6-15.
T. G.. Bibbv. Il. M.. and Caldu'ell. C.: The Maqnetotelluric Phase Tensor. Geophl,sical .Iountal Inte*totional, 158-
Caldr,vell,
(2004).457-469
Filterulg von Geophvsikalischen Zeitreihen mit Periodisch Auftrelendcn Multiliequenten Storsignalen. Diploma Tltesis.
Techlischen {Jn ir,ersitiit Berlrn. Ccruan_v (2008)
Chen. X.:
Egbert, G. I).. and Kelbert.
189. (2012). 25t-267.
A.: Compr.rtational Recipes hrr Electromagnetic Inverse Problenrs.
Geophy.sicol ,kttnnal Intentotional.
Krings. 1'.: fhe Inlluence o1 lLobust Statistics. Ilenrote Reference. and Horizontal Maclretic Translbr f unctions on IJata Processing
in Magletotellurics. lLcster /rsslr. Universitet Mtinster. Germanr (2007).
Meqbel,
N. lvI. M.: The electrical conductivih
structure
ol the Dead
Sea Basin derived irom
2D and 3D ilr.ersion ol
magnelotellr.rric data" ]]hL) tlre.srs. Free Universitv of Berlin (2009).
Muksin. U.. Rauer^ K-. and Haberland. C.: Seismic Vp and Vp Vs stmchrre of the geotherrnal area aroutd Tarutung (Nofih
Stttnatra, Indonesia) derived front local earlhquake tonrographr'. Jountal oJ l:olconolog,, tmd (feotkennal Research.26$.
QA13),27 42.
Niasari- S. W.. Murloz. G.. Kholid" M.. and Ritler. O.: 2D eleotrical conductiviti irnage of the Sipoholon geothermal svstemSu
nratra. Indon esia. subniitted in Ge othenn
i c.s.
Nukman. N{.: Geotherntal lisploration Inr,olr'ing Structural Geologv and }lvdro-chernistrv in the Tanrtrrng Basin. Northem Centtal
Surrratra (Indonesia). Phd the.si.s,l;akultiit VI. Technischen IJnrversitat Berlin. Cemranl (201.1).
Nukman. M.. and Moeck, I.: Stmctural Controls ou a Geothennal S-rrstem in the Tanrtr.urg Brsin. North Centlal Surnatrt.Iouma! o/
Asian ]iarrh Sciences,1l. (2013), 86-96
Ritler. O." Junge. A.. and l)awes. G.: Nerv Equipment and Processins lbr Magfietotelluric Remote Ret'ereuce (Jbservatiogs.
G e op hy,si
c
al
.Itt urn ol
httent ati onal. 132.
(I
Sielr. K., and Nataividjaja, lJ.: Neotectonics
28.2e5-28 r26
998).
5.1 5
of the
-548.
Sumatra lrault. Indonesitt^ ,Jounral o.f (ieophtsical Rtseorch. 105. (2000),
A.. Electromasnolic sounding of geothermal zones..Ioumal otApplied Geophvsics,68" (2009),459
478.Tikhonor'. A. N.: On Dctcrtniniug Electrical Characterislics of the deep lar,ers of the [.arth"s crust. I)oi; Akac]. .. auk.,
Spichak" V.. and Manzella"
a_r.ssR.
73, (I950), 29s-297
Vozot1. K.: Magnetotelluncs: Pnnciples and practice. Har:th Planet. Scr.- 99. (1990)..1:lt-47l.Weckmrnn. U.. Magulia. A.^ and
Ilitter. O.: Effectir.'e Noise Separ-atiorl for Magnetotelluric Srngle Site Data Processing Usin-s a lrrequency Domain Selectiol
Scheme. Geoplrysical Jountal International. 761 "(2005). 635-652
Yatnalte. K." Ohsato. K.. Ohmrnato- T.. and Kinr" H. .1.: Three-Dimensiotal Macnctotelluric Inrrestigation in Kakkonda Geothermal
Area. .Iapan, Proceedings. \['orld Geothermal Congress. Kvushu-Tohoku. .lapan (2000).


© Copyright 2026