
Diva User Guide - Mediterranean Oceanic Data Base (MODB)
Diva User Guide
C. Troupin, M. Ouberdous, D. Sirjacobs, A. Alvera-Azcárate,
A. Barth, M.-E. Toussaint, S. Watelet & J.-M. Beckers
(last modified: January 2015)
GeoHydrodynamics and Environment Research, MARE
Departement of Astrophysics, Geophysics and Oceanography
University of Liège
http://modb.oce.ulg.ac.be
Acknowledgments
This document was written for helping oceanographers work with the Diva
software. This would not have been possible without the help of scientists
involved in Data Analysis projects.
We would like to thank:
the participants to the Diva workshops in Liège (November 2006), Calvi
(November 2007, October 2008, October 2009 and November 2010) and
Roumaillac (October 2012) for their numerous valuable comments to improve
the software and the manual;
J. Carstensen (Aarhus University, Denmark) for his contribution in the
implementation of the detrending method;
the National Fund for Scientific Research (FRS-FNRS, Belgium) for
funding the post-doctoral positions of A. Alvera-Azcárate and A. Barth, as well
as supercomputer facilities;
the Fund for Research Training in Industry and Agriculture (FRIA) for
funding Damien and Charles PhD grants.
Prof. Nielsen who developed the parallel skyline solver which we adapted for
use with Diva (Nielsen et al., 2012).
Diva was first developed during E.U. MODB and SeaDataNet projects;
the research leading to the last developments of Diva has received funding from
the European Union Seventh Framework Programme (FP7/2007-2013) under
grant agreement No. 283607, SeaDataNet 2, and from project EMODNET
(MARE/2008/03 - Lot 3 Chemistry - SI2.531432) from the Directorate-General
for Maritime Affairs and Fisheries.
i
Conditions of use
Diva is a software developed at the GeoHydrodynamic and Environmental Research (GHER, http://modb.oce.ulg.ac.be/) group at the University of Liège (http:
//www.ulg.ac.be)) and that will be further developed for SeaDataNet scientific data
c 2006-2015 by the GHER group
products in JRA4 activities. Diva is copyright and is distributed under the terms of the GNU General Public License (GPL):
http://www.gnu.org/copyleft/gpl.html
In short, this means that everyone is free to use Diva and to redistribute it on
a free basis. Diva is not in the public domain; it is copyrighted and there are
restrictions on its distribution (see the license http://www.gnu.org/copyleft/gpl.html
and its associated FAQ http://www.gnu.org/copyleft/gpl-faq.html). For example, you
cannot integrate this version of Diva (in full or in parts) in any closed-source
software you plan to distribute (commercially or not).
If you want to integrate Diva into a closed-source software, or want to sell a
modified closed-source version of Diva, please contact us in person. You can
purchase a version of Diva under a different license, with no strings attached (for
example allowing you to take parts of Diva and integrate them into your own
proprietary code).
All SeaDataNet2 products (data and software) are freely distributed to the scientific community at the following conditions:
X The products should be used for scientific purposes only.
X Articles, papers, or written scientific works of any form, based in whole or in
part on data or software supplied by SeaDataNet, will contain a suitable acknowledgement to the SeaDataNet2 program of the European Union. Related publications (see bibliography) should also be cited.
X The applications of SeaDataNet2 products are under the full responsibility
of the users; neither the Commission of the European Communities nor
the SeaDataNet2 partners shall be held responsible for any consequence
resulting from the use of SeaDataNet2 products.
X The recipient of these data will accept responsibility of informing all data
users of these conditions.
ii
How to use this guide?
This Diva User Guide aims to cover all the aspects of the methods: the theory
(Part I), the two-dimension version (Part II), the climatology production with GODIVA (Part III) and the description of the scripts and the Fortran code (Part IV).
The user who directly wants to perform analysis shall start with Part II, which
describes the input files and provides examples of realistic, simple runs. The
Diva-demecum (Chapter C) is particularly useful to have a small summary of all
the commands and options.
For more theoretical developments, the user is invited to read Part I as well as the
corresponding bibliography.
To make easier the reading of the document, different font colors are used for
different type of files:
• the files (ascii or binary),
• the commands (which can also be ascii files, but that are executable),
• the directories.
Various example files are provided for different situations.
iii
How to cite?
• This document:
Troupin, C.; Ouberdous, M.; Sirjacobs, D.; Alvera-Azcárate, A.; Barth, A.;
Toussaint, M.-E.; Watelet, S. & Beckers, J.-M. (2013) Diva User Guide.
http://modb.oce.ulg.ac.be/mediawiki/index.php/Diva_documents
• and the related peer-reviewed publication:
Troupin, C.; Sirjacobs, D.; Rixen, M.; Brasseur, P., Brankart, J.-M.; Barth,
A.; Alvera-Azcárate, A.; Capet, A.; Ouberdous, M.; Lenartz, F.; Toussaint,
M.-E & Beckers, J.-M. (2012). Generation of analysis and consistent error fields using the Data Interpolating Variational Analysis (Diva). Ocean
Modelling, 52-53: 90–101.
doi:10.1016/j.ocemod.2012.05.002
http://www.sciencedirect.com/science/article/pii/S1463500312000790
BIBTEXcode:
@ARTICLE{TROUPIN2012bOM,
author = {C. Troupin and D. Sirjacobs and M. Rixen and
P. Brasseur and J.-M. Brankart and A. Barth and
A. Alvera-Azc\’{a}rate and A. Capet and M. Ouberdous and
F. Lenartz and M.-E. Toussaint and J.-M. Beckers},
title = {{Generation of analysis and consistent error fields
using the Data Interpolating Variational Analysis (Diva)}},
journal = om,
year = {2012},
volume = {52-53},
pages = {90-101},
doi = {10.1016/j.ocemod.2012.05.002},
url = {http://www.sciencedirect.com/science/article/pii/S1463500312000790}
}
iv
C ONTENTS
1
Installation of the software
1
1.1
Requirements . . . . . . . . . . . . . . . . . . . . . . . . . . . . . . . . . . .
1
1.2
Download and extraction of the archive . . . . . . . . . . . . . . . . . . . . .
2
1.3
Generation of the binaries (executables) . . . . . . . . . . . . . . . . . . . . .
3
1.4
Run tests . . . . . . . . . . . . . . . . . . . . . . . . . . . . . . . . . . . . . .
5
I Diva Theory
7
2
General theory
8
2.1
Data gridding . . . . . . . . . . . . . . . . . . . . . . . . . . . . . . . . . . .
8
2.2
Optimal Interpolation . . . . . . . . . . . . . . . . . . . . . . . . . . . . . . .
10
2.3
Variational Inverse Method . . . . . . . . . . . . . . . . . . . . . . . . . . . .
13
2.4
Additional tools . . . . . . . . . . . . . . . . . . . . . . . . . . . . . . . . . .
20
3
4
5
Determination of analysis parameters
22
3.1
Correlation length . . . . . . . . . . . . . . . . . . . . . . . . . . . . . . . . .
22
3.2
Signal-to-noise ratio . . . . . . . . . . . . . . . . . . . . . . . . . . . . . . . .
22
3.3
Quality control . . . . . . . . . . . . . . . . . . . . . . . . . . . . . . . . . .
26
Error computation
30
4.1
Introduction . . . . . . . . . . . . . . . . . . . . . . . . . . . . . . . . . . . .
30
4.2
Usage of methods . . . . . . . . . . . . . . . . . . . . . . . . . . . . . . . . .
35
4.3
Numerical cost . . . . . . . . . . . . . . . . . . . . . . . . . . . . . . . . . .
36
4.4
Comparison between the methods . . . . . . . . . . . . . . . . . . . . . . . .
37
4.5
Integrals over (sub-)domains . . . . . . . . . . . . . . . . . . . . . . . . . . .
40
Additional constraints and detrending
45
5.1
Adding advection to the cost function . . . . . . . . . . . . . . . . . . . . . .
45
5.2
Adding linear sink(s) and local source(s) . . . . . . . . . . . . . . . . . . . . .
49
5.3
Detrending data by defining groups and classes . . . . . . . . . . . . . . . . .
51
v
II
6
7
8
9
2-D implementation
56
Scripts, input files and directories
57
6.1
List of 2-D tools . . . . . . . . . . . . . . . . . . . . . . . . . . . . . . . . . .
58
6.2
Input files . . . . . . . . . . . . . . . . . . . . . . . . . . . . . . . . . . . . .
60
6.3
Working directories (2-D analysis) . . . . . . . . . . . . . . . . . . . . . . . .
66
Preparation of the input files
68
7.1
Creation of topography . . . . . . . . . . . . . . . . . . . . . . . . . . . . . .
68
7.2
Creation of contours . . . . . . . . . . . . . . . . . . . . . . . . . . . . . . .
75
7.3
Determination of analysis parameters . . . . . . . . . . . . . . . . . . . . . .
79
7.4
Format conversion tools . . . . . . . . . . . . . . . . . . . . . . . . . . . . . .
81
7.5
Misc . . . . . . . . . . . . . . . . . . . . . . . . . . . . . . . . . . . . . . . .
82
Running analysis
84
8.1
Running a simple analysis . . . . . . . . . . . . . . . . . . . . . . . . . . . .
84
8.2
Quality control of data . . . . . . . . . . . . . . . . . . . . . . . . . . . . . .
88
8.3
Running a semi-normed analysis . . . . . . . . . . . . . . . . . . . . . . . . .
89
8.4
Extras . . . . . . . . . . . . . . . . . . . . . . . . . . . . . . . . . . . . . . .
90
8.5
Analysis with advection constraint activated . . . . . . . . . . . . . . . . . . .
91
8.6
Summary: typical execution chains . . . . . . . . . . . . . . . . . . . . . . . .
96
Postprocessing tools
98
9.1
Gnuplot . . . . . . . . . . . . . . . . . . . . . . . . . . . . . . . . . . . . . .
98
9.2
Matlab/ Octave . . . . . . . . . . . . . . . . . . . . . . . . . . . . . . . . . . 100
9.3
Python . . . . . . . . . . . . . . . . . . . . . . . . . . . . . . . . . . . . . . . 104
9.4
NetCDF visualization tools . . . . . . . . . . . . . . . . . . . . . . . . . . . . 106
10 Realistic examples
110
10.1 Complete example . . . . . . . . . . . . . . . . . . . . . . . . . . . . . . . . 111
10.2 Analysis of profiles from a cruise . . . . . . . . . . . . . . . . . . . . . . . . . 118
10.3 Analysis of data from a transect . . . . . . . . . . . . . . . . . . . . . . . . . 120
10.4 Advection constraint . . . . . . . . . . . . . . . . . . . . . . . . . . . . . . . 125
vi
11 Other implementations
128
11.1 Diva-on-web . . . . . . . . . . . . . . . . . . . . . . . . . . . . . . . . . . . 129
11.2 Ocean Data View . . . . . . . . . . . . . . . . . . . . . . . . . . . . . . . . . 132
11.3 Matlab toolbox . . . . . . . . . . . . . . . . . . . . . . . . . . . . . . . . . . 132
III
3-D analysis & climatology production (GODIVA)
12 Diva 3D
134
135
12.1 Input subdirectories . . . . . . . . . . . . . . . . . . . . . . . . . . . . . . . . 135
12.2 Input info files: contour.depth & 3Dinfo . . . . . . . . . . . . . . . . . 138
12.3 3D analyses: inputs preparation
. . . . . . . . . . . . . . . . . . . . . . . . . 142
12.4 Performing 3D analyses: diva3Ddress . . . . . . . . . . . . . . . . . . . . 144
13 Climatology production: Diva 4D
148
13.1 Climatology definition . . . . . . . . . . . . . . . . . . . . . . . . . . . . . . 148
13.2 Diva 4D climatology performance . . . . . . . . . . . . . . . . . . . . . . . . 149
13.3 Input data preparation . . . . . . . . . . . . . . . . . . . . . . . . . . . . . . . 151
13.4 Production of climatologies . . . . . . . . . . . . . . . . . . . . . . . . . . . . 154
IV
Appendix
163
A Problems. . . and solutions!
164
A.1 FAQ . . . . . . . . . . . . . . . . . . . . . . . . . . . . . . . . . . . . . . . . 165
A.2 Error messages . . . . . . . . . . . . . . . . . . . . . . . . . . . . . . . . . . 172
A.3 Solved problems . . . . . . . . . . . . . . . . . . . . . . . . . . . . . . . . . 183
B Diva code
187
B.1 Fortran code . . . . . . . . . . . . . . . . . . . . . . . . . . . . . . . . . . . . 187
B.2 Input and output files for the executables . . . . . . . . . . . . . . . . . . . . . 192
C VADEMECUM
197
C.1 Scripts and actions . . . . . . . . . . . . . . . . . . . . . . . . . . . . . . . . 198
C.2 Workflow . . . . . . . . . . . . . . . . . . . . . . . . . . . . . . . . . . . . . 199
vii
C.3 Input files . . . . . . . . . . . . . . . . . . . . . . . . . . . . . . . . . . . . . 200
C.4 Output files . . . . . . . . . . . . . . . . . . . . . . . . . . . . . . . . . . . . 201
Useful links
202
viii
1 I NSTALLATION
OF THE SOFTWARE
Diva is a software designed to run with any operating system (Microsoft Windows, Linux, Mac
OS X). The main steps for the the installation are described in this chapter. A more detailed and
up-to-date list of instructions is available on the Installation web page of Diva: http://modb.oce.
ulg.ac.be/mediawiki/index.php/Diva_installation
WARNING: IF you have a previous Diva version running on your system, please make a
copy (or save it somewhere) before installing the new version.
Contents
1.1
Requirements . . . . . . . . . . . . . . . . . . . . . . . . . . . . . . . . .
1
1.2
Download and extraction of the archive . . . . . . . . . . . . . . . . . . .
2
1.3
Generation of the binaries (executables) . . . . . . . . . . . . . . . . . . .
3
1.3.1
Compilation . . . . . . . . . . . . . . . . . . . . . . . . . . . . . .
3
1.3.2
Direct copy of pre-compiled binaries . . . . . . . . . . . . . . . . .
5
Run tests . . . . . . . . . . . . . . . . . . . . . . . . . . . . . . . . . . . .
5
1.4.1
Basic test . . . . . . . . . . . . . . . . . . . . . . . . . . . . . . . .
5
1.4.2
Another basic test . . . . . . . . . . . . . . . . . . . . . . . . . . . .
6
1.4.3
Large-memory test . . . . . . . . . . . . . . . . . . . . . . . . . . .
6
1.4
1.1
Requirements
The basic requirements to compile and run Diva are:
1. A command-line interface. With Linux or Mac, the interface is directly available: it is the
shell or terminal. With Windows, it is necessary to install a Unix-like environment such
as Cygwin (http://www.cygwin.com/).
2. A Fortran 95 compiler with preprocessing -cpp possibilities, such as:
• gfortran (http://gcc.gnu.org/wiki/GFortran),
R
• ifort (Intel
, http://software.intel.com/en-us/intel-compilers),
• pgf (Portland Group, http://www.pgroup.com/).
3. The NetCDF library (http://www.unidata.ucar.edu/software/netcdf/) for Fortran. Note that the
library is available in recent versions of the Cygwin installer, but does not properly work
in all cases (and you must add the library nclib=/usr/lib/libnetcdff.dll.a
into the compiling options). When trying to make the Cygwin NetCDF library to work,
you might need to use
[charles@gher13 ~]$ cygcheck netcdfoutput.a
1
Chapter 1. INSTALLATION OF THE
SOFTWARE
1.2. Download and extraction of
the archive
to see which libraries are still missing (in our case sasl) and therefore to install them
with the cygwin installer.
Other requirement :
1. dos2unix (on Linux Ubuntu : sudo apt-get install dos2unix, on Cygwin : launch the
setup.exe and tick “dos2unix”).
For a quick visualization of the results, a software able to read and display the content of a
NetCDF file is recommended:
• ncBrowse (http://www.epic.noaa.gov/java/ncBrowse/, a Java application,
• Ncview (http://meteora.ucsd.edu/~pierce/ncview_home_page.html), a visual browser,
• Panoply (http://www.giss.nasa.gov/tools/panoply/, the NASA data viewer for various data
formats.
1.2
Download and extraction of the archive
Select a directory on your local disk (here we install in a directory ~/Software/) where you
want install Diva and download the archive available at http://modb.oce.ulg.ac.be/mediawiki/index.
php/DIVA#How_to_get_the_code.3F.
[charles@gher13 ~]$ cd Software/
[charles@gher13 Software]$ wget http://modb.oce.ulg.ac.be/
mediawiki/upload/DIVA/releases/diva4.6.4.tar.gz
Extract the archive and go in the main directory:
[charles@gher13 Software]$ tar -xvf diva4.6.4.tar.gz
[charles@gher13 Software]$ cd diva4.6.4/
The directory tree has the following structure:
[charles@gher13 diva4.6.4]$ tree -d -L 2
.
|-- DIVA3D
|
|-- bin
|
|-- divastripped
|
‘-- src
|-- Example4D
|--input
‘-- JRA4
‘-- Climatology
8 directories
2
Chapter 1. INSTALLATION OF THE
SOFTWARE
1.3. Generation of the binaries
(executables)
• DIVA3D/bin/ contains the executables generated by the code compilation. Pre-compiled
executables for various operating systems are provided in the sub-folders.
• DIVA3D/divastripped/ is the main working directory at the 2-D level.
• DIVA3D/src/ contains the Fortran source code. This is where the compilation has to
be done.
• Example4D/ contains a set of input file that cab be used to run a simple test.
• JRA4/Climatology/ is the main working directory at the 3-D and 4-D levels.
1.3
Generation of the binaries (executables)
There are two possibilities to obtain the binaries:
1. Compile the source code.
2. Copy the provided binaries.
The second option is provided for cases where the compilation was not possible, mainly because
of missing libraries (e.g., NetCDF) or Fortran compilers.
1.3.1
Compilation
The Diva Fortran programs compilation is done by running the shell script divacompileall,
which uses a configuration file divacompile_options. In the configuration file
divacompile_options are prescribed the options for Fortran compiler and libraries.
• If you have allready a previous running Diva version and -within it- the file
divacompile_options configured according to your system, you can simply copy it
to the same place in the new version (diva4.6.4/DIVA3D/src/Fortran/) before
running divacompileall.
• If not proceed as follow:
Go in the source directory
[charles@gher13 diva4.6.4]$ cd DIVA3D/src/Fortran/
and edit the configuration file divacompile_options for the compilation according to
your machine.
3
Chapter 1. INSTALLATION OF THE
SOFTWARE
1.3. Generation of the binaries
(executables)
compiler=gfortran
...
DIVA_PARALLEL=1
...
flags=’-O3 -cpp
-DDIVAITERATIVE ’ # ’ -DDIVABINARYFILESMESH -DDIVABIN
...
flagscalc=’ -O3 -cpp
-DDIVAITERATIVE -Wall -fbounds-check’
...
If your installation knows the nf-config or nc-config command, the compiler and the
options for the NetCDF library will be detected automatically during the compilation. If you
want to check before compilation, type:
[charles@gher13 ~]$ nf-config --fc
gfortran
[charles@gher13 ~]$ nf-config --flibs
-L/usr/lib -lnetcdff -lnetcdf
Check the options of this command by typing nf-config, or visit the web page: http://www.
unidata.ucar.edu/software/netcdf/workshops/2011/utilities/Nc-config.html. If you have installed several versions of the NetCDF libraries, you might find several nf-config on your system,
and each of them may provide you different outputs for the two previous commands. In older
versions of NetCDF libraries nc-config was used instead of nf-config.
If neither nc-config nor nf-config is installed, you may have to further edit
divacompile_options:
nclib=/usr/lib/libnetcdff.dll.a
Once this is done, run the compilation script:
[charles@gher13 Fortran] ./divacompileall
and check the content of the log file (compilation.log). You should obtain something
similar to that:
Compilation time: Wed May 22 20:57:28 CEST 2013
compiler:
gfortran
compilation flags: -O3 -cpp -DDIVAITERATIVE
Calc directory:
1/1
program compiled
Extensions directory: 13/13 programs compiled
Mesh directory:
9/9
programs compiled
NC directory:
3/3
programs compiled
PlPlot directory:
1/1
programs compiled
Util directory:
41/41 programs compiled
Pipetest directory:
1/1
program compiled
Stabil directory:
28/28 programs compiled
----------------------------------------------------------
4
Chapter 1. INSTALLATION OF THE
SOFTWARE
1.4. Run tests
TOTAL:
97/97 programs compiled
---------------------------------------------------------Binaries are located in directory:
/home/ctroupin/Software/diva4.6.4/DIVA3D/bin
1.3.2
Direct copy of pre-compiled binaries
If the compilation failed, go in the diva-4.6.1/DIVA3D/bin/ directory and copy directly
the binaries available in the sub-directories. For example for Windows with the Cygwin tool:
[charles@gher13 bin] cp -f cygwin/* .
1.4
Run tests
In the main working directory (GODIVA_mm_yyyy/DIVA3D/divastripped), run one the
two available tests: divatest and divabigtest.
1.4.1
Basic test
divatest creates basic input files (see Chapter 6 for details), performs a simple Diva execution, checks if awk is appropriate, checks if the pipes are supported in your operating system
(O.S.), checks if dos2unix is installed. If divatest hangs during the pipe test, it means
pipes are not supported (as for some gfortran versions) and you can use a CTRL-C to exit. The
analysis output can be checked using any software for reading NetCDF files. In this case we
use ncview (see Chapter 9 for details and installation).
[charles@gher13 divastripped]$ divatest
...
[charles@gher13 divastripped]$ ncview output/ghertonetcdf/
results.nc
The results you obtain have to be similar to those of Fig. 1.1.
5
Figure 1.1: Results obtained with divatest.
1.4.2
Another basic test
divatest0 creates basic input files for a fine mesh and a single data point in the center of the
domain and runs the analysis. You should obtain the Bessel function with a maximum value of
0.5.
1.4.3
Large-memory test
divabigtest creates input files to simulate a case with a large number of data and a very
fine mesh. Again, the results, obtained after a few minutes, are viewable using the command:
[charles@gher13 divastripped] ncview output/ghertonetcdf/
results.nc
and should be close to Fig. 1.2.
Figure 1.2: Results obtained with divabigtest.
Part I
Diva Theory
7
2 D IVA
GENERAL THEORY
This chapter describes the theory behind the Diva interpolation method and compares it with
the Optimal Interpolation.
Contents
2.1
2.2
2.3
2.4
2.1
Data gridding . . . . . . . . . . . . . . . . . . . . . . . . . . . . . . . . .
8
2.1.1
Interpolation versus approximation . . . . . . . . . . . . . . . . . .
9
2.1.2
Objective versus subjective data analysis methods . . . . . . . . . . .
9
2.1.3
Background field and anomalies . . . . . . . . . . . . . . . . . . . .
10
2.1.4
Noise on data . . . . . . . . . . . . . . . . . . . . . . . . . . . . . .
10
Optimal Interpolation . . . . . . . . . . . . . . . . . . . . . . . . . . . . .
10
2.2.1
Mathematical formulation . . . . . . . . . . . . . . . . . . . . . . .
11
2.2.2
Drawbacks of OI . . . . . . . . . . . . . . . . . . . . . . . . . . . .
13
Variational Inverse Method . . . . . . . . . . . . . . . . . . . . . . . . . .
13
2.3.1
Formulation . . . . . . . . . . . . . . . . . . . . . . . . . . . . . . .
14
2.3.2
Resolution by Finite-Element method . . . . . . . . . . . . . . . . .
15
2.3.3
Kernel and correlation function . . . . . . . . . . . . . . . . . . . .
17
2.3.4
Comparison OI–VIM . . . . . . . . . . . . . . . . . . . . . . . . . .
19
2.3.5
Comparison between the spatial interpolation methods . . . . . . . .
19
Additional tools . . . . . . . . . . . . . . . . . . . . . . . . . . . . . . . .
20
2.4.1
Automatic estimation of analysis parameters . . . . . . . . . . . . .
20
2.4.2
Additional physical constraint . . . . . . . . . . . . . . . . . . . . .
20
2.4.3
Multi-dimensional analysis . . . . . . . . . . . . . . . . . . . . . . .
20
2.4.4
DINEOF . . . . . . . . . . . . . . . . . . . . . . . . . . . . . . . .
21
Data gridding
The generation of gridded fields from non-uniformly distributed observations (both in space
and time) is a frequent concern in geosciences. Similarly to Ooyama (1987), we will refer to
an analysis or analysed field as "the estimation of a continuous spatial field of a given variable
from a set of discrete measurements". The range of applications is wide, going from model
initialization to validation exercises or simple plotting purposes.
Mathematically, gridding consists in determining a field ϕ(r) on a regular grid at positions r,
using Nd measurements located in rj , j = 1, . . . , Nd (Fig. 2.1).
In this chapter we consider only two-dimensional cases, but generalization can be done to 3D
and even 4D (using "distance" in time, but being aware of autocorrelations as in seasonal signals).
8
Chapter 2. GENERAL THEORY
2.1. Data gridding
ϕ(xj , yj )
di
2.1.1
Figure 2.1: Schema of the data gridding: the blue
dots indicate data positions, while the nodes of the
grid are the points where the field has to be determined.
Interpolation versus approximation
For obtaining a field on a regular grid, two main techniques have to be distinguished:
1. The interpolation, which implies a strict passage of the solution through the points of
data. Physically, this means that one assumes that there is no error on the data. Among
the methods of interpolation, let us mention: the linear, cubic, inverse distance, optimal
interpolations, the kriging, . . .
2. The approximation (or analysis) provides a solution smoother than the one given by interpolation: in this case, the solution does not necessarily have to contain all the data points.
The solution is close to the data points, so its shape is still influenced by the data. This
technique allows taking into account errors on data, as well as to treat multiple data with
different values at the same location.
Figure 2.2: Interpolation (black line) provides a solution that goes across all the data points, while the
approximation (grey line) has only to be "close" to
the measurements, but with a relative "smoothness".
2.1.2
Objective versus subjective data analysis methods
In geosciences and in particular in oceanography, it is frequent to have error on the measurements and close data points. Hence the approximation methods are preferred to strict interpolation techniques.
We have to differentiate subjective analysis, for which the way the approximation is performed
is decided by hand, and objective analysis, which is based on predefined mathematical operations. Note that beyond these two kinds of analysis, data assimilation uses in addition physical/biochemical dynamic governing equations.
9
Chapter 2. GENERAL THEORY
2.2. Optimal Interpolation
Since data assimilation depends on the region and the model and the subjective analysis is not
sufficiently objective, the objective analysis is chosen here.
2.1.3
Background field and anomalies
The field ϕ(r) can be decomposed as the sum of a background field ϕb and an anomaly ϕ0 :
ϕ(r) = ϕb (r) + ϕ0 (r).
(2.1)
Instead of working with the data themselves, we will work with the anomalies of these data
with respect to the background field. The background field is defined a priori and the anomalies
are calculated with respect to this reference field (e.g., climatological average, linear regression,
theoretical solution).
The anomalies are assumed to be computed as a linear combination of the data, i.e.,
ϕ(r) = ϕb (r) +
Nd
X
wj dj ,
(2.2)
j=1
where dj is the data anomaly at r = rj and wj is the relative weight of the data j. The weighting
functions are the new unknowns to determine: once the background field and the weighting
functions are known, the field ϕ can be computed at any position r, hence gridding is possible.
From here on, we will work with anomaly only and therefore formally use ϕb = 0.
2.1.4
Noise on data
When measuring a field, there is always an uncertainty on the value obtained (whatever the
instrument and the field). Noise does not only take into account instrumental error (which is
generally low), but also:
• the representativeness errors, meaning that what one measures is not always what ones
intends to analyse):
e.g., skin temperature, inadequate scales, . . .
• the synopticity errors, occuring when the measurements are assumed to be taken at the
same time):
e.g., data from a cruise (Rixen et al., 2001).
Because of the multiple sources of error, a perfect fit to data is not advised, and the noise on the
measurements has to be considered during the analysis.
2.2
The Optimal Interpolation method
Before explaining the core of Diva technique, the main principles of Optimal interpolation (OI,
von Storch & Zwiers, 1999; Chilès & Delfiner, 1999) are explained. OI is a popular analysis
10
Chapter 2. GENERAL THEORY
2.2. Optimal Interpolation
tool, owing to its ease of use and the error field associated to the analysis (e.g., Shen et al., 1998;
Kaplan et al., 2000). The first references of the method are Gandin (1965) and Bretherton et al.
(1976).
The idea is to minimise the expected error variance of the analysis. This conditions lead to the
determination of the weights wj (2.2), with the assumption that the true anomaly field ϕt is one
realization out of a zero mean ensemble.
Note that Kriging (Krige, 1951; Matheron, 1963) is an equivalent technique: it uses the same
criterion as OI, but with a different mathematical formulation: the weights wj are chosen from
the study of the covariance between the values as a function of the distance between them.
2.2.1
Mathematical formulation
Let us recall previous notations from section 2.1 and introduce some new ones:
ϕ, the interpolated (or reconstructed) field,
ϕt , the true (unknown) field,
d, the vector containing the Nd data,
r, the vector position.
The principle of OI is to minimize the expected error:
e2 (r) = [ϕ(r) − ϕt (r)]2
(2.3)
where the bar ¯ stands for the statistical average.
Replacing the interpolated anomaly field by a linear combination of the data, we have
e2 (r) =
"N
d
X
#2
wi (r)di (r) − ϕt (r) .
(2.4)
i=1
We now have to determine the weights wi that will minimize (2.4). Let us call w(r), the vector
of size Nd containing the weights applied on the data to interpolate the field at position r. The
previous equation is now written as
e2 (r) = [wT d − ϕt (r)]2
= ϕt (r)2 + wT ddT w − 2ϕt (r)dT w
We define the covariance matrix
D = ddT ,
and the covariance of the data with respect to the real field, which is a function of r:
g = ϕt (r)d.
11
Chapter 2. GENERAL THEORY
2.2. Optimal Interpolation
The expression of the error (2.4) becomes, after some calculation:
e2 (r) = ϕt (r)2 + wT Dw − 2gT w
T
= ϕt (r)2 − gT D−1 g + (w − D−1 g) D(w − D−1 g)
(2.5)
of which the minimum is reached when
w = D−1 g.
The corresponding error value is
min e2 (r) = ϕt (r)2 − gT D−1 g
(2.6)
and the interpolated field is computed as
ϕ(r) =
Nd
X
wi (r)di = gT D−1 d.
(2.7)
i=1
Derivation of the covariances
To determine the data covariance matrix, D, and the covariance of the data with the real field,
g, the following assumptions are generally made:
1. errors i on measurements are not correlated, i.e.,
i j = 2i δij ,
where 2i is the variance of the errors on measurement (i.e., the noise);
2. errors on measurements are not correlated with the real field, i.e.,
i ϕt = 0.
With these assumptions and considering that the data at ri is the sum of the true field at ri and
an error i , we deduce:
Dij = ϕt (ri )ϕt (rj ) + 2 δij
= σ 2 c(ri , rj ) + 2i δij ,
gi = ϕt (r)di ,
= σ 2 c(r, ri ),
(2.8)
(2.9)
where c(r, ri ) is the correlation function and σ is the signal of the data.
In the following, we write D = B + R, where matrix B contains the variance of the true field
and R is the diagonal matrix containing the observational noise.
12
Chapter 2. GENERAL THEORY
2.2.2
2.3. Variational Inverse Method
Drawbacks of OI
There are two main drawbacks when using OI, as detailed in the following paragraphs:
• The numerical cost.
• The specification of the covariances.
As the method requires the inversion of a Nd × Nd matrix (Nd being the number of data), it is
not adapted for situations with large number of observations (number of operations proportional
to Nd3 ). Moreover the method does not always produce the theoretical optimum, specially when
the number of data is not sufficient and the covariances are not correctly specified (e.g., Rixen
et al., 2000; Gomis et al., 2001). Some adaptations have been made to the OI scheme to improve
the numerical efficiency (e.g., Hartman & Hössjer, 2008; Zhang & Wang, 2010).
The quality of OI (and other gridding techniques) relies on the correct specification of the covariances of the observational error and of the background field. The covariance functions used
in OI are not restricted (except that the covariance matrices have to be positive-definite and
symmetric), allowing for example correlated observational errors. Yet in most cases, covariances between two points are parametrized by simple expressions, such as a Gaussian function
depending on the sole distance between the points, leading to isotropic functions, which are not
always well adapted to oceanography. Indeed, wich such functions, the propagation of information through islands and continents is enabled. To circumvent this problem, adaptations of the
OI scheme are necessary in order to allow the use of anisotropic functions (e.g., Tandeo et al.,
2011).
Finally, although OI provides the best analysis in the sense that it gives the minimum expected
error, the method has the drawback of not being fully objective: the covariance of the unknown
field, and the standard deviation of observational errors generally have to be chosen subjectively
by he user.
2.3
The Variational Inverse Method and its implementation
The Variational Inverse Method (VIM) was initially designed for climatology purposes: in that
case, vertical profiles have high vertical resolution and sufficient profiles for all seasons, but
have an irregular horizontal coverage (Brasseur et al., 1996). Thus a spatial analysis on horizontal planes is needed.
Relatively large number of data points in each plane penalizes Optimal Interpolation (OI) methods, because these methods require the inversion of a Nd × Nd matrix (see Tab. 2.2 and eq.
2.6).
This is the reason why VIM resorts to the expertise in efficient finite-element solvers.
Diva stands for Data-Interpolating Variational Analysis and is the implementation of VIM. It is
designed to solve 2-D differential or variational problems of elliptic type with a finite-element
method.
13
Chapter 2. GENERAL THEORY
2.3.1
2.3. Variational Inverse Method
Formulation
We are looking for the field ϕ which minimizes the variational principle over our domain of
interest D:
J [ϕ] =
Nd
X
µj [dj − ϕ(xj , yj )]2 + kϕk2
(2.10)
j=1
with
Z
kϕk =
(α2 ∇∇ϕ : ∇∇ϕ + α1 ∇ϕ · ∇ϕ + α0 ϕ2 ) dD
(2.11)
D
where
• α0 penalizes the field itself (anomalies),
• α1 penalizes gradients (no trends),
• α2 penalizes variability (regularization),
• µ penalizes data-analysis misfits (objective).
Without loss of generality we can chose α2 = 1 (homogeneous function 2.10).
Parameters meaning
˜ = ∇, L being a characteristic
Writing Eq. (2.10) and (2.11) in non-dimensional form (with L1 ∇
length of the problem), we have
J[ϕ] =
Nd
X
Z 2
µ[dj − ϕ(xj , yj )] +
j=1
˜
D
α1 ˜
1 ˜ ˜
2
˜
˜
˜
˜
∇∇ϕ : ∇∇ϕ + 2 ∇ϕ · ∇ϕ + α0 ϕ L2 dD
L4
L
(2.12)
and multiplying by L2 :
J[ϕ] =
Nd
X
j=1
2
2
µL [dj − ϕ(xj , yj )] +
Z ˜
D
˜ ∇ϕ
˜ :∇
˜ ∇ϕ
˜ + α1 L2 ∇ϕ
˜ · ∇ϕ
˜ + α0 L4 ϕ2 dD
˜
∇
(2.13)
Hence α0 fixes the length scale over which variations are significant to move the kernel function
of the norm from one to zero:
α0 L 4 = 1
(2.14)
µL2 fixes the relative weight on data (signal, σ 2 ) versus regularization (noise, 2 ):
µL2 = 4π
σ2
= 4πS/N
2
14
(2.15)
Chapter 2. GENERAL THEORY
2.3. Variational Inverse Method
Finally α1 fixes the influence of gradients:
α1 L2 = 2ξ
(2.16)
where ξ = 1 if penalization on the gradients is enforced, ξ = 0 if no penalization is enforced. ξ
is a non-dimensional parameter close to one if the gradients are to be penalized with a similar
weight than the second derivatives.
Weights on data
A weight µi can be assigned to each data di . This weight expresses the confidence you have
in a particular data. It is expressed as a function of the signal-to-noise ratio and the correlation
length (Brankart & Brasseur., 1996):
µ=
σ 2 4π
2 L2
(2.17)
when ξ = 1. In Diva, the fourth column of the data input file, if present, allows one to apply a
different relative weight to each point.
Background field
Normally, interpolation (and extrapolation) works on anomalies with respect to a background
field (Eq. 2.1). Diva allows you to work with different background fields:
• no treatment is applied (the data you treat are already anomalies);
• the mean of data is subtracted from the data values;
• the linear regression (plane) is subtracted;
• additional subtracted semi-normed field (α0 = 0 and large L) obtained by two consecutive
Diva executions.
In particular when no treatment is applied (with α0 > 0), the minimization forces the analysis
toward zero when there are no data points in a distance comparable to L. This is coherent with
the idea of an anomaly only.
2.3.2
Resolution by Finite-Element method
The minimization of (2.10) is actually performed by a Finite-Element (FE) method, hence the
need for generating a finite-element grid. Because the field to analyse is only defined in the
water, the minimization also works only within the contours defining the coastline or more
generally, the considered isobath.
15
Chapter 2. GENERAL THEORY
2.3. Variational Inverse Method
Thus the grid generation has to be consistent with the coasts existing in the considered region.
The corresponding mathematical problem is referred to the Constrained Triangulation.
To solve Eq. (2.10), the real domain is split into a mesh of Ne triangular finite-elements (Fig. 2.3):
J[ϕ] =
Ne
X
Je (ϕe ).
(2.18)
e=1
3
III
0
1
Figure 2.3: Triangular elements used for
the mesh. This kind of elements are referred to as "Fraeijs de Veubeke" elements, see Brasseur (1994) for details.
One triangular element is made up of 3
sub-triangles and has a total of 12 degrees of freedom.
external connector
internal connector
linear constraint
II
I
2
In each element the solution is a combination of shape functions s (3rd order polynomials) and
the continuity between elements is assured by identification of adjacent connectors:
ϕe (re ) = qe T s(re ),
(2.19)
with q, the connectors (our new unknowns),
re , the position in a local coordinate system.
Substituting (2.19) in (2.18) and using the variational principle (2.10), we get
T
T
Je (qe ) = qe Ke qe − 2qe ge +
Nde
X
µi di
(2.20)
i=1
where Ke is the local stiffness matrix and
g is a vector which depends on local data. Matrix K is decomposed into a norm-related
term and a data related term.
On the whole domain, (2.20) reads
T
T
J(q) = q Kq − 2qe ge +
Nd
X
µi di ,
(2.21)
i=1
of which the minimum is reached when
q = K−1 g.
(2.22)
Matrix K has a size approximatively proportional to the number of degrees of freedom of the
system, but can be very sparse if the elements are properly sorted. In that case the number of
16
Chapter 2. GENERAL THEORY
2.3. Variational Inverse Method
operations to invert it is approximatively proportional to the power 5/2 of the number of degrees
of freedom.
To map the data on the finite element mesh, a transfer operator T2 (depending on the shape
functions) is applied:
g = T2 (r)d,
and to have the solution at any location inside the domain, another transfer T1 is applied:
ϕ(r) = T1 (r)q.
Combining the two previous equations, we obtain the relation between ϕ, the interpolated field
at location r, and the data vector d:
ϕ = T1 (r)K−1 T2 (r)d.
2.3.3
(2.23)
Kernel and correlation function
Kernel functions can be examined by analysing a single point with high signal-to-noise ratio
and no background field (Fig. 2.4). In this particular case, we performed an analysis with a
point located at the center (0, 0) of a square domain. The correlation length is equal to 1 and
the signal-to-noise ratio is taken equal to 1000.
The exact function in an infinite domain is given by
K(r) =
r
L
K1
r
L
,
(2.24)
where r is the Euclidean distance,
L is the correlation length and
K1 is the modified Bessel function (Abramowitz & Stegun, 1964, page 359).
The choice of this correlation model results from the mathematical structure of the variational
method (Brasseur et al., 1996).
Figure 2.5 shows both the exact solution (2.24) and the correlation function by a single point
analysis. The two curves are close to each other, the differences between the two curves being
only due to the boundaries.
In an infinite domain, the correlation function was shown to be proportional to the Kernel of the
VIM norm.
The Kernel function can be used to calibrate Diva parameters (α0 , α1 , µ) so as to fit observed
covariance functions. This principle is used by the tool divafit which helps one to estimate
the correlation length (see Section 7.3.1).
It can also be used for specifying the covariance for error calculations (Chapter 4).
17
Chapter 2. GENERAL THEORY
2.3. Variational Inverse Method
1
5
0.8
0.6
0
+1
Figure 2.4: Analysis of a single data point
with high signal-to-noise ration and no
background field.
0.4
0.2
−5
−5
0
5
0
1
0.8
Figure 2.5: The theoretical Kernel function is given in red, while the black curve
comes from the analysis of a single point
with a unit value.
0.6
Field value
0.4
0.2
0
0
1
2
3
Distance (r/L)
4
5
18
Chapter 2. GENERAL THEORY
2.3.4
2.3. Variational Inverse Method
Comparison OI–VIM
Rixen et al. (2000) compared the two methods by testing quasi-synoptic salinity data. Results
showed that the main differences between OA and VIM occur in coastal areas and around
islands (O(0.10)), whereas the differences range from −0.01 to 0.02 within the domain. The
same conclusions were drawn when they compared OI and VIM in the case of climatological
data set: both fields were nearly identical, except in the vicinity of the coasts (differences of up
to 0.1).
A summary of the main characteristics of the two methods is found in Tab. 2.1.
Table 2.1: Statistical equivalence between OI and VIM (from Rixen et al. (2000))
Minimization
Solution
Data correlation
Data-field covariance
2.3.5
OI
VIM
e2 (r) = [ϕ(r) − ϕt (r)]2
ϕ(r) = cT (r)D−1 d
[D]ij = σ 2 c(ri , rj ) + 2 δij
[c]i = σ 2 c(r, ri )
P d
2
2
J[ϕ] = N
i=1 µi [di − φ(ri )] + kϕk
ϕ(r) = cT (r)D−1 d
[D]ij = K(ri , rj ) + (1/λ)δij
[c]i = K(r, ri )
Comparison between the spatial interpolation methods
Table 2.2 compares characteristics of different spatial interpolation methods:
• the error minimization (min(ε2 )),
• the extension to 3 dimensions (3-D),
• the multivariate analysis,
• the number of operations per analysis,
• the error estimate (ε(r)),
• a priori known parameters,
• the control parameters and
• the treatment of anisotropy.
All the methods compared here are base on a minimisation of the error estimate except the
Cressman method (Cressman, 1959). OI and VIM are similar methods: they use the same
control parameters and require similar a priori information. To work in 3-D and in multivariate
mode, VIM needs a few adaptations. The main difference concerns the number of operations,
which is almost independent on the number of data for VIM.
19
Chapter 2. GENERAL THEORY
2.4. Additional tools
Table 2.2: Characteristics of different methods of data analysis. • denote available features in the
interpolation method, (•) indicate that the feature is available with some adaptations. ε(r) is the error
estimate, Nd the number of data points, Na the number of grid points for analysis, N the number of
EOFs, L the correlation length and σ 2 /2 the signal-to-noise ratio.
Method
Cressman
OI
VIM
DINEOF
2.4
min(2 )
3-D
Multivar
•
•
(•)
•
•
(•)
•
•
•
(•)
•
Ops/anal.
Nd3
Nd Na
+ Nd Na
5/2
Na
5/4
Na
(r)
a priori
C.V.
anis.
•
•
•
w(r/L)
c(r/L)
K(r/L)
–
(L)
L, σ 2 /2
L, σ 2 /2
N
(•)
(•)
(•)
•
Additional tools
Diva software is provided with additional tools designed for parameters adjustment, quality
control of data and application of physical constraints on the analysis.
2.4.1
Automatic estimation of analysis parameters
The correlation length can be estimated, based on the dataset itself. The method performs a
least-square fit of the data covariance function with a theoretical function.
The signal-to-noise ratio λ = σ 2 /2 is estimated with a Generalized Cross-Validation (GCV).
GCV allows estimating global errors and calibration of the analysis parameters.
The tools will be further explained in Chapter 3.
2.4.2
Additional physical constraint
In the base formulation of Diva, the cost function contains a term relative to the regularity of
the reconstructed field and a term relative to the proximity to the observations. We will see in
Chapter 5 that physics (advection, diffusion, source terms) can be added in the cost function.
2.4.3
Multi-dimensional analysis
In order to perform three-dimension analysis (horizontal coordinates and depth), the solution is
to applying successive analysis in horizontal layers, from the deeper to the shallower layer. A
set of scripts (diva3D*) are designed to perform such analysis in an automatic way.
However, the reconstruction of three-dimensional fields of temperature and salinity by stacking of layers of analysed fields may lead to unstable density fields. An algorithm has been
implemented in Diva in order to remove these instabilities.
These topics are addressed in Part III.
20
Chapter 2. GENERAL THEORY
2.4.4
2.4. Additional tools
DINEOF
Diva is mainly designed to work with in situ data, characterized by a scattered spatial distribution. When dealing with satellite images, the spatial interpolation can be made in a clever
way, by using the information contained in the satellite images acquired before in the same
region. This idea is implemented in Data INterpolating Empirical Orthogonal Function (DINEOF; Beckers & Rixen, 2003; Alvera-Azcárate et al., 2005).
This tool is designed to exploit repeated observations with missing data (e.g., a series of collocated satellite images with clouds). For more details about DINEOF, please consult http://
modb.oce.ulg.ac.be/mediawiki/index.php/DINEOF and the other references describing the method:
Alvera-Azcárate et al. (2005, 2007a, 2009); Beckers et al. (2006).
21
3 D ETERMINATION
OF ANALYSIS PARAMETERS
The purpose of this chapter is to describe the tools included in the Diva software and that
provide estimates of the analysis parameters: the correlation length L and the signal-to-noise
ratio λ. The end of the chapter deals with the automatic quality control of data within the
analysis.
Contents
3.1
Correlation length . . . . . . . . . . . . . . . . . . . . . . . . . . . . . . .
22
3.2
Signal-to-noise ratio . . . . . . . . . . . . . . . . . . . . . . . . . . . . . .
22
3.2.1
Generalities . . . . . . . . . . . . . . . . . . . . . . . . . . . . . . .
22
3.2.2
Ordinary Cross Validation (OCV) . . . . . . . . . . . . . . . . . . .
24
3.2.3
Generalised cross validation (GCV) . . . . . . . . . . . . . . . . . .
25
Quality control . . . . . . . . . . . . . . . . . . . . . . . . . . . . . . . . .
26
3.3.1
Quality criteria . . . . . . . . . . . . . . . . . . . . . . . . . . . . .
27
3.3.2
Normalized version . . . . . . . . . . . . . . . . . . . . . . . . . . .
27
3.3.3
Implementation in Diva . . . . . . . . . . . . . . . . . . . . . . . .
28
3.3
3.1
Determination of the correlation length
The correlation length L gives an indication of the distance over which a given data point
influences its neighbourhood (Section 2.3.1). Similarly to other interpolation techniques, it is
an essential parameter for obtaining meaningful results. The value of L can be provided a priori
by the user, or determined using the data distribution itself, as explained in the next Section.
The method to evaluate L is to fit the theoretical kernel of (2.11) (see Fig. 2.5) to the correlation
between data assuming spatial isotropy and homogeneity in correlations. The quality of the fit
will depend on the number of data points: a value of L obtained with few data points has to be
considered with care.
3.2
Determination of the signal-to-noise ratio
Once the correlation length is determined, the next step is to estimate the signal-to-noise ratio.
3.2.1
Generalities
Let us consider the vector d containing the N data anomalies. Objective analysis of d leads to
analysed field with minimal expected error variance. The analysis ϕa at any location r is given
22
Chapter 3. DETERMINATION OF
ANALYSIS PARAMETERS
by
3.2. Signal-to-noise ratio
ϕa (r) = c(B + R)-1 d
(3.1)
where c is a vector containing the background covariance between the point in which the analysis is to be performed and all data point locations. The optimal interpolation is based on the
background covariance matrix B and error covariance matrix R of the data.
˜ the analysis vector at data points. The two vectors d and d
˜ can be related by the
Let us call d,
expression:
˜ = Ad
d
(3.2)
where the matrix A, used to perform the analysis at the data points, is calculated according to
A = B(B + R)-1 .
The data-covariance matrix is the statistical average h
(3.3)
i of data products:
d dT = B + R,
(3.4)
where T it the transposed matrix or vector. For uncorrelated observational errors, error-covariance
matrix R is diagonal, with a variance 2i for point i, i.e.
R = diag(2i )
In that case, we can show that the variance of expected misfit at point i is
di − d˜i
2 = 2i (1 − Aii ).
(3.5)
In practice covariance matrices are known only imperfectly: their structure is often considered
to be fixed, but with imperfectly known amplitude. In other words it is often assumed that
ˆ
B = σ 2 B,
ˆ
R = 2 R,
dT d
= σ 2 + 2 ,
N
(3.6a)
(3.6b)
(3.6c)
where ˆ matrices are fixed and non-dimensional, while the field variance σ 2 and the error
variance 2 are imperfectly known, but their sum equal to the data variance (assuming that
spatial averaging has a similar effect than statistical averaging, the ergodic hypothesis).
By definition of the average error- and field-variance, we have:
23
Chapter 3. DETERMINATION OF
ANALYSIS PARAMETERS
3.2. Signal-to-noise ratio
N
1 X 2
1
i = trace (R) = 2
N i=1
N
1 2
1
σi = trace (B) = σ 2
N
N
1
ˆ =1
⇒ trace R
N
1
ˆ =1
⇒ trace B
N
(3.7)
(3.8)
The unknown parameter that controls the analysis is the ratio of the signal and noise variances,
called signal-to-noise ratio:
σ2
λ= 2,
(3.9)
because matrix A depends only on λ:
ˆ -1 .
ˆ B
ˆ + λ−1 R)
A(λ) = B(
(3.10)
Dividing both sides of Eq. (3.6c) by σ 2 and 2 , we also find that
λ dT d
,
(3.11)
1+λ N
1 dT d
2 =
,
(3.12)
1+λ N
so that knowing λ we can calculate the signal and noise variances from the data values.
σ2 =
3.2.2
Ordinary Cross Validation (OCV)
The objective is to optimize the parameter λ by searching for its value for which the analysis has
a minimal error. For this reason, we need to find a proxy norm that we will be able to minimize.
As the difference of the analysis with the true field is not available, we could try to work with
the difference of the analysed field at the data points with respect to the original data field:
θi2 = (di − d˜i )2 .
(3.13)
If we try to minimize this norm, we will get an infinite signal-to-noise ratio and a perfect dataanalysis fit. This is because the analysis at the data point is directly influenced by the corresponding data.
To avoid this inconvenience, the solution is to calculate the difference of the data value with respect to the analysed field in which the data under investigation was not taken into account. This
is called the Ordinary Cross Validation and is, with a practical trick, implemented in divacv.
To make this estimate robust, the analysis has to be repeated over a large number of data points,
increasing the computing cost, so that OCV is generally too expensive to perform unless a trick
as in divacv can be used (there the analysis can be done without actually disregarding a data
point but by correcting the difference as shown in the next section).
Variants of OCV take out several points at once to calculate error estimates and repeat the exercise several times to make estimates robust. In Diva this options are available in divacvrand.
A variant is divacvclasses in which all data from a given class (e.g. specific year) are set
aside and the analysis compared to.
24
Chapter 3. DETERMINATION OF
ANALYSIS PARAMETERS
3.2.3
3.2. Signal-to-noise ratio
Generalised cross validation (GCV)
According to Craven & Wahba (1978), modifying the error estimate as follows:
(di − d˜i )2
θˆi2 =
.
(1 − Aii )2
(3.14)
allows one to keep the data during the analysis and will reduce the computing cost. In this
formulation, the denominator penalizes more heavily data points in which the analysis is forced
to be close the data and accounts therefore for the self-influence of the data point (which is
absent in the case of pure cross-validation).
Computation of Aii
When the matrix A is not explicitly calculated, Aii can be obtained by performing an analysis
with a vector ei = (0 0 . . . 0 1 0 . . . 0) (zero on all data locations, except at point i, where
its value is one). This demands an analysis for every data point in which the estimator is
constructed.
The associated computational cost can be reduced by replacing Aii by the average value and
assuming:
1
(3.15)
Aii ' trace (A) .
N
To avoid calculating all Aii and summing them up, we can use the following estimate (Girard,
1989):
1
zT Az
trace (A) ' T
(3.16)
N
z z
where z is a vector of random variables of zero mean. For robustness, the trace estimate can be
repeated several times with different random vectors, averaging of the different estimates. The
number of estimates is the parameter provided to the module GCVFAC of Diva.
Even if A is not available, Az can be calculated easily by applying the analysis tool to a random vector and retrieve the analysis of this random vector on the data locations. Then the
scalar product of the analysis of the random vector with the original random data provides the
numerator of (3.16) while the denominator is simply the squared norm of the random vector.
Generalized cross validator
In order to make the error estimator robust, we take the average over all data points and define
the generalized cross validator as
N
1 X ˆ2
2
θ .
Θ =
N i=1 i
Assuming temporarily 2i = 2 , hence having all misfits with the same weight, the generalized
cross validator is obtained:
25
Chapter 3. DETERMINATION OF
ANALYSIS PARAMETERS
Θ2 =
3.3. Quality control
˜ k2
kd − d
N 1−
1
trace (A)
N
2 =
k (I − A)d k2
(1/N ) (trace (I − A))2
(3.17)
The GCV consists in minimizing Θ2 by changing the signal-to-noise ratio λ. Θ2 is a global
estimate of the analysis error variance.
In view of (3.5) and (3.17) the expected variance of the noise can also, by assuming a spatial
average corresponds to a statistical expectation, be calculated as
1
2
2
(3.18)
' Θ 1 − trace (A)
N
When the observational errors are uncorrelated but vary in space, we should replace the residual
˜ T (d − d)
˜ by
measure r = (d − d)
˜ TR
ˆ -1 (d − d)
˜
r = (d − d)
(3.19)
to take into account the relative noise level.
For a diagonal matrix, we can define weights wi such that
2i =
2
σ2 1
=
wi
λ wi
(3.20)
Defining the diagonal matrix W = diag(wi ), the generalized cross validator then reads:
T ˜ W d−d
˜
d−d
Θ2 =
2
N 1 − N1 trace (A)
(3.21)
where the weights should, according to (3.7), satisfy
X 1
= N.
wi
i
(3.22)
The w˜i are the values provided as optional fourth column in data.dat.
divacv uses cross validation with complete calculation of Aii , whereas divagcv uses the
approximation Aii N = trace (A).
3.3
Quality control of data
Having defined the generalized cross validator, we look for a criterion that will allow the user
to reject or accept a given data. Note that this QC is performed based on the analysis itself and
shall be preceded by an a priori QC on the data (e.g., range of values, gradients, etc).
26
Chapter 3. DETERMINATION OF
ANALYSIS PARAMETERS
3.3.1
3.3. Quality control
Quality criteria
The first possibility
is to compare the actual value of the misfit with the expected standard
2 deviation
di − d˜i
, leading to the criterion:
with
(1)
|di − d˜i | > 3∆i
p
(1)
∆i = i 1 − Aii ,
(3.23)
(3.24)
which is the most expensive version if Aii is not explicitly known and must be evaluated by
analysis of vectors such as ei = (0 0 . . . 0 1 0 . . . 0).
If we replace Aii by its average
1
trace (A),
N
(2)
∆i
we have a second criterion based on:
s
1
= i
1 − trace (A) .
N
(3.25)
This version requires only a few analysis of a random vector if trace (A) cannot be evaluated
explicitly.
Finally, in case the noise is not calculated from Θ2 , another estimate is then, according to (3.18)
i
1
(3)
(3.26)
∆i =
1 − trace (A) Θ,
N
which can be calculated directly from the RMS value of the misfit (or residual) and the generalized cross validator Θ. This version can easily be used simultaneously with test (3.25) using
the results of the GCV.
3.3.2
Normalized version
Let us consider the scaled variable s defined as
si =
di − d˜i
.
∆i
(3.27)
Because we will look for outliers, instead of working with mean values and variances, more
robust estimators are the median and median absolute deviation (MAD).
A bias in the analysis is likely to exist if S = median(si ) is not much smaller than one (the
typical values of s should be of the order of one if the misfit estimate is correct on average).
Instead of calculating the standard deviation of s we calculate the median absolute deviation δ
defined as
δ = MAD(si ) = 1.4826 median|si − S|
(3.28)
where the factor 1.4826 is introduced such that for a normal distribution, the MAD is identical
to the standard deviation.
27
Chapter 3. DETERMINATION OF
ANALYSIS PARAMETERS
3.3. Quality control
Hence we can detect points qualified as outliers if they satisfy the inequality
|si − S| ≥ 3δ.
(3.29)
This normalized version of quality control to some extent corrects for inaccurate estimation of
the expected misfits ∆.
3.3.3
Implementation in Diva
The overall signal-to-noise ratio λ is calculated as
σ2
.
2
λ=
(3.30)
The relative weights on the data are then defined as
w˜i =
µi L 2
.
4πλ
(3.31)
To be coherent with the total noise, we should in principle use relative weights (the optional
fourth column for data in Diva) on the data that satisfy (3.22).
Hence, defining w¯ as
1 X 1
1
=
,
w¯
N i w˜i
(3.32)
the weights wi = w˜i /w¯ are relative weights coherent with the noise.
In this case, we can use (3.21) for the estimator.
In practice, in Diva, the relative weights can be retrieved by wi = µi /¯
µ, where the average ¯ is
a harmonic mean. The minimisation and the optimum for λ are the same, even if the weights
provided by the user do not satisfy the condition (3.22). However the interpretation of Θ, and
σ might be different.
Three scripts are available for the QC:
divaqc: the most expensive version of QC, based on criterion (3.24).
divaqcbis: a quicker version, based on criterion (3.25).
divaqcter: based on the RMS value of the misfit and the generalized cross validator Θ,
according to criterion (3.26).
Diva GCV practicals
In Diva, the matrix A is not explicitly constructed, but the product Ax consists simply in the
application of the analysis in data locations.
28
Chapter 3. DETERMINATION OF
ANALYSIS PARAMETERS
3.3. Quality control
The value of trace (A) can be evaluated and stored for subsequent quality control by (3.25)
and (3.26). For quality control (3.24), Aii must be evaluated by an analysis of the pseudo-data
vector ei (zeros everywhere except unit value at point i). The analysis can benefit from the LU
decomposition already performed for previous analysis.
29
4 E RROR
COMPUTATION
This chapter presents the different methods for computing the error field associated to the analysis, as well as the error resulting from the calculation of the integral of a field over a domain.
Contents
4.1
4.1
Introduction . . . . . . . . . . . . . . . . . . . . . . . . . . . . . . . . . .
30
4.1.1
The poor man’s estimate . . . . . . . . . . . . . . . . . . . . . . . .
31
4.1.2
The clever poor man’s estimate . . . . . . . . . . . . . . . . . . . .
31
4.1.3
The hybrid approach . . . . . . . . . . . . . . . . . . . . . . . . . .
31
4.1.4
The real covariance method . . . . . . . . . . . . . . . . . . . . . .
32
4.1.5
The almost exact method . . . . . . . . . . . . . . . . . . . . . . . .
35
4.2
Usage of methods . . . . . . . . . . . . . . . . . . . . . . . . . . . . . . .
35
4.3
Numerical cost . . . . . . . . . . . . . . . . . . . . . . . . . . . . . . . . .
36
4.3.1
Poor man’s estimate . . . . . . . . . . . . . . . . . . . . . . . . . .
36
4.3.2
Hybrid method . . . . . . . . . . . . . . . . . . . . . . . . . . . . .
36
4.3.3
Real covariance function . . . . . . . . . . . . . . . . . . . . . . . .
36
4.4
Comparison between the methods . . . . . . . . . . . . . . . . . . . . . .
37
4.5
Integrals over (sub-)domains . . . . . . . . . . . . . . . . . . . . . . . . .
40
4.5.1
Theory . . . . . . . . . . . . . . . . . . . . . . . . . . . . . . . . .
40
4.5.2
Implementation . . . . . . . . . . . . . . . . . . . . . . . . . . . . .
41
4.5.3
Use . . . . . . . . . . . . . . . . . . . . . . . . . . . . . . . . . . .
43
4.5.4
Interna . . . . . . . . . . . . . . . . . . . . . . . . . . . . . . . . .
43
Introduction
The analysis performed with the optimised parameters should have the lowest global error, as
measured by (3.21). Nevertheless, the spatial distribution of the error is also of interest for any
interpolation or analysis method, since it gives the user an indication of the reliability of the
results. The error field is expected to be affected by:
1. the data coverage: the error field is expected to be higher where the data coverage is
lower;
2. the noise on the data: the more uncertainties we have on the data, the higher will be the
error field.
OI (Sections 2.2) allows the simultaneous derivation of analysis and error fields:
e2 (r) = σ 2 (r) − g(r)T D−1 g(r),
30
(4.1)
Chapter 4. ERROR COMPUTATION
4.1. Introduction
where σ 2 is the local variance of the background field. This equality highlights that the error is
provided by the analysis of a pseudo-data array containing covariances g(r).
However, in principle, a new analysis has to be performed for each point r in which the error is
requested and then is not adapted for large data sets. On the contrary, the error calculation in
Diva is not trivial since the covariance functions are never explicitly specified. We will see in
the next sections how Diva computes this error field.
According to the data sets, the type of analysis (with/without dynamical constraints, constant or
variable correlation length, . . . ), several error calculation methods are available with Diva.
4.1.1
The poor man’s estimate
To circumvent the main problems (unknown covariance function and repeated analysis), Brasseur
(1994) estimated the error by analysing a vector of "covariances" with constant σ 2 . As all covariances are identical, the error can be assessed in all locations with the same analysis. The
advantage is the fast calculation, but the drawback is a systematic underestimation of the actual
errors, since the error reduction by the overestimated covariances (4.1) is also overestimated.
The poor man’s error field is a very efficient way to assess data-coverage and determine the
regions where the analysis cannot be trusted.
4.1.2
The clever poor man’s estimate
Compared to the poor man’s estimate, this approach still analyses a vector of "covariances" with
constant σ 2 but reduces the correlation length so that for isolated observations, the resulting
error field is almost exact. When data points are closer to each other (typically within the range
of the correlation length), then the methods is still to optimistic.
more to come
4.1.3
The hybrid approach
In this approach, Brankart & Brasseur (1998) and Rixen et al. (2000) proposed a heuristic
statistical error expression for the VIM: in Diva, error fields are calculated by analogy with OI:
since analysis in OI is equivalent to analysis with VIM (insofar as the reproducing Kernel of
VIM and the covariance function of OI are identical) and since error field of OI equals analysis
of covariance fields, error field of VIM equals analysis (by VIM) of covariance fields.
Mathematically, according to the developments of Section 2.2, we have:
31
Chapter 4. ERROR COMPUTATION
Solution OI:
4.1. Introduction
g(r)T D−1
| {z }
ϕ(r) =
d
(4.2)
T1 (r)K T2 (r)
{z
}
|
d
(4.3)
σ (r) − g(r)T D−1
| {z }
g(r)
(4.4)
g(r)
(4.5)
(?)
Solution VIM:
−1
ϕ(r) =
(??)
Error OI:
2
2
e (r) =
(?)
→ Error VIM:
2
−1
2
σ (r) − T1 (r)K T2 (r)
|
{z
}
e (r) =
(??)
In practice, the data input of the analysis tool for an error calculation is a vector containing the
covariance of data points (g(r)) with the point in which the error estimate is to be calculated.
The covariance vector to be analysed is calculated using the correlation function (or Kernel) c
of an infinite domain in terms of the Bessel function as shown in (2.24):
e2 (r) = σ 2 (r) − σ 2 (r) T1 (r)K−1 T2 (r) c(r)
{z
}
|
(4.6)
(??)
In an infinite domain, the error calculation is then "exact", while for more complicated domains,
it is nearly exact far away from boundaries, provided no anisotropic constraint (advection constraint, variable length scale, boundaries, . . . ) is activated.
Thus for anisotropic cases, the hybrid error field can provide incoherent results. This is what
motivated the evaluation of the real covariance function in Diva.
4.1.4
The real covariance method
If we look back at the OI interpretation, we can place a data of value 1 at location r and compute
the analysis ϕ1 (r0 ) at a location r0 :
ϕ1 (r0 ) =
ˆ r0 )
λB(r,
,
ˆ r) + R(r)
ˆ
λB(r,
(4.7)
ˆ r0 ) is the non-dimensional covariance function between points r and r0 , whereas R
ˆ
where B(r,
is the normalized observational error variance. Normalization was done respectively by the
background variance σ 2 and noise 2 , yielding the signal-to-noise ratio λ previously defined. At
the data location itself, we get the analysis
ϕ1 (r) =
ˆ r)
λB(r,
.
ˆ r) + R(r)
ˆ
λB(r,
(4.8)
In terms of interpretation of the covariance function as the kernel of the norm ((2.11)), it is the
background covariance that is modified by the anisotropy and not the noise level. Hence, if we
put the unit data value with a unit signal-to-noise ratio in r, we directly have
32
Chapter 4. ERROR COMPUTATION
0
4.1. Introduction
ˆ r0 )
B(r,
ϕ1 (r) =
ˆ r)
B(r,
.
(4.9)
ˆ r) + 1
ˆ r) + 1
B(r,
B(r,
The left-hand sides are provided by the Diva application to the unit data point in location r with
unit signal-to-noise ratio and analysed in any desired location r0 and r. From these two values,
ˆ inherently used in Diva.
it is therefore easy to calculate the covariance function B
ϕ1 (r ) =
and
For the error calculation at a point r, we have the following procedure:
1. Put a unit value at r and perform an analysis with λ = 1.
2. Save the result at the locations of the original data and of the error-calculation, where the
analysis value is
ˆ r)
B(r,
ϕ0 =
,
(4.10)
ˆ r) + 1
B(r,
ˆ r) at the error-field location:
3. Calculate the background variance B(r,
ˆ r) = ϕ0 .
B(r,
1 − ϕ0
(4.11)
ˆ ri ) between the error location and data locations. Since at
4. Calculate the covariance B(r,
the data points i located at ri , Diva application provides
ϕi =
ˆ ri )
B(r,
,
ˆ r) + 1
B(r,
(4.12)
ˆ ri ) is obtained as
the covariance B(r,
ˆ ri ) =
B(r,
ϕi
.
(1 − ϕ0 )
(4.13)
Up to the multiplication constant 1/(1 − ϕ0 ), the non-dimensional covariance of a point in
position r with a list of other points can therefore be obtained by putting a unit data value in r
and taking the value of the analysis at the coordinates of the list of points.
To illustrate the procedure, we take a simple case with one point in the center of the domain,
and another point near the boundary. Near the boundary, data points influence more easily the
analysis because rigidity is reduced (Fig. 4.1). This translates into a larger background variance.
Error fields will therefore be larger near boundaries when there are no nearby data.
From there, applying the correction 1/(1 − ϕ0 ), we can use the covariances as input vector for
a second Diva execution, so as to perform an analysis of the covariance and getting access to
the error of the analysis at the desired location. Indeed, using the equivalence of Diva and OI,
if the analysis step applied to a data vector d is formally written
ϕa = Hd,
(4.14)
ˆ
ˆ r) − σ 2 Hb,
e2 (r) = σ 2 B(r,
(4.15)
then the error is
ˆ is a vector
ˆ r) is the local relative background variance (calculated by (4.11)) and b
where B(r,
filled according to (4.13).
33
Chapter 4. ERROR COMPUTATION
4.1. Introduction
data point at [0,0]
data point at [−4.5,0]
Theoretical kernel
Gaussian function
Field value
0.5
0.25
0
−4
−2
0
2
4
Distance
Figure 4.1: Analysis in a square domain [−5, 5] × [−5, 5] with a point at the centre and another at
(−4.5, 0). The signal-to-noise ratio λ = 1 for both cases. Note the larger analysis value near the
boundary, indicating a larger background variance.
34
Chapter 4. ERROR COMPUTATION
4.2. Usage of methods
The real covariance method: discussion of background variance
a) Absolute error
b) Errors scaled by Bii
When relative errors are demanded, one could divide by σ 2 Bii ;
Discussion The effect of spatially non-uniform Bii is particularly clear at the edge of the finite
elements grid. If the boundary is in the open ocean, there is actually no reason to suppose that
the background error increases when approaching the artificial boundary and dividing by Bii
provides a more natural error estimation so that solution b) should be used.
If near real coasts increased background variance is expected, then the error estimation a) should
be used. In such cases, open boundaries should be pushed further away in the numerical finite
element grid and the analysis on the regular grid only be done in the region of interest.
4.1.5
The almost exact method
The idea here is to calcule the error exactly in some selected location and than interpolate the
error to provide a gridded error field at a reduced cost. The implementation also allows to
avoid the need to run a second diva executable by exploiting an expression of the error at data
locations by adding pseudo data in well selected locations.
more to come
Background variance
As for the case of the real covariance, one can select to provide the error scaled by Bii or not.
4.2
Usage of methods
The (clever) poor man’s error is useful as a first and quick error field during exploration of data.
Once analysis parameters such as correlation length are correctly calibrated, outliers eliminated
and the analysis considered relevant, a better error calculation should be used.
Calculation of the full covariance function or the almost exact error version for error calculation
is recommended when at least one of the following conditions is true:
• Advection constraint is strong.
• Signal-to-noise ratio is high and few data are available near the boundaries.
• ξ (penalizing gradients) is different from 1 and the kernel is not (2.24) any more.
• The correlation length is variable over the domain.
35
Chapter 4. ERROR COMPUTATION
4.3. Numerical cost
In the aforementioned cases, the assumptions for the hybrid approach are not fulfilled and the
use of (4.6) to express the covariance will provide an error field that is not coherent with the
analysis. For instance, lower errors can be obtained in regions void of observations.
4.3
Numerical cost
Let us assume that the error is requested at Nc locations (sparse points or regular grid). The
error computation with OI (in its original formulation) requires the inversion of a matrix of size
Nd × Nd and the projection of onto the Nc locations. We will now see how it can be done with
Diva.
4.3.1
Poor man’s estimate
An analysis is performed on a vector filled with constant covariance σ 2 . As the vector of covariances is filled with identical values σ 2 , the error is assessed for all the Nc locations with the
same analysis. Since the matrix to be inverted for the analysis (the stiffness matrix K, (2.22)) is
already factorized1 , the additional cost is almost zero because a single analysis is needed.
4.3.2
Hybrid method
Again, the cost is kept low by exploiting the already existing factorization. For each of the Nc
locations, matrix-vector operations are needed.
Roughly, if the cost of the first analysis is M ,
√
the error field calculation requests M Nc / Ne operations, where Ne is the number of degrees
of freedom of the finite-element mesh.
4.3.3
Real covariance function
For each of the Nc points in which the error is to be evaluated, an additional analyse providing
the covariance function is needed. If done naively, this would be prohibitive since a new analyse with another data set (the unit data in different locations) normally requests a new matrix
inversion.
To save computing time, a nice mathematical property was discovered and exploited: performing an analysis that differs only by one data point from a previous analysis can be performed
using an already existing matrix factorization. In this case, the generation of all covariances
(always changing only one data point) can be performed with a cost similar to a single error
analysis with prescribed mathematical covariance functions.
To explain the method, let us suppose that we have constructed and inverted the stiffness matrix
K0 for the same problem without any data point (as explained in Section 2.3.2), K0 has a
1
LU decomposition or factorization: the matrix is written as the product of a lower triangular matrix L and an
upper triangular matrix U.
36
4.4. Comparison between the
methods
Chapter 4. ERROR COMPUTATION
component that is related to the smoothness constraint, not to the data). Then, adding a single
data point with unit value at location i would demand the solution of
K0 + µi Si STi q = µi Si .
Here, the Woodbury-Sherman formula yields
1
µi K-01 Si .
q=
T -1
1 + µi Si K 0 Si
(4.16)
(4.17)
Since the term in parenthesis is a scalar multiplicative factor, the solution with the data is obtained by analysing this data point with the stiffness matrix K0 and then multiplying all analyses
by 1/(1 + µi STi K-01 Si ). The value of
ϕ0 = µi STi K-01 Si
(4.18)
is actually nothing else than the analysis at the new data location, again using the stiffness
matrix K0 . Hence the recipe for calculation of the covariances is now clear:
1. Create and invert once the stiffness matrix K0 constructed without any data points.
2. For each point for which the covariance is needed:
(a) Create the elementary charge vector µi Si .
(b) Apply the already inverted stiffness matrix K-01 and the multiplicative factor of (4.17)
to derive the values of ϕ0 and ϕi
(c) Compute the covariances using (4.11) and (4.13).
The efficiency of the method is due to the fact that we remain within the same Diva execution,
where the matrix inversion√K-01 is much less expensive than the initial factorization. Indeed the
cost is reduced by a factor Ne , with Ne typically around 104 -105 , thus gain is again significant.
Each covariance can be stored on disk for later use by the error calculation.
Overall the cost for the full error calculation is now roughly equivalent to twice the hybrid approach, which is a substantial reduction compared to a brute force approach. The only unsolved
problem is the storage of the covariance functions if they are calculated before the actual Diva
run for the error calculations. This storage will take N × Nc words when Nc points for error calculations are requested. The intermediate storage can however be avoided by using Unix-pipes
between concurrent execution of two Diva cores, one providing the covariance for the other on
demand.
4.4
Comparison between the methods
For this application, we employ the same data as in Section 10.1 (salinity measurements in the
Mediterranean Sea at a depth of 30 m in July, for the 1980-1990 period). Here, the error is
ˆ yielding relative errors.
scaled locally by the local variance of the background field B,
37
4.4. Comparison between the
methods
Chapter 4. ERROR COMPUTATION
The OI field (Fig. 4.2a) shows the effect of the data coverage on the error magnitude. The relative error lies between 40 and 60% around the regions with a sufficient amount of observations.
The largest values (> 80%) occur along the south coasts of the Mediterranean Sea, where almost no data are available for the considered period. This means that the analysis obtained in
these areas cannot be taken with much confidence.
The poor man’s estimate (Fig. 4.2b) provides an error field with lower values over the whole
domain. Where data are available, the error is below 20%, whereas the 80-100% error region is
limited to a small zone close to the coast of Libya.
The hybrid method was build by analogy with the OI error estimate (Brankart & Brasseur,
1998). Thus it is expected that the two methods provide comparable results. Indeed, the error
field of Figs. 4.2(a) and (c) exhibit a similar spatial distribution. Some discrepancies appear in
certain regions: along the Italian coasts (on both side of the Peninsula), in the Alboran Sea, and
around Cyprus. These differences are related to the presence of the coasts:
1. As with the analysis, the FE method prevent the information to cross land. Hence the
error reduction due to the analysis is lower with the hybrid method than with OI.
2. Close to the coasts, the variance of the background field in Diva is increased, due to the
specified boundary conditions.
Finally, the error using the real covariance function (Fig. 4.2d) is also close to the hybrid results.
The main differences between the two methods occur in the coastal areas, for instance in the
Adriatic Sea or around Cyprus. In these regions, the error is lower when the real covariance is
employed, because it allows for the consideration of coastline effects.
The choice of one particular method depends on several factors:
• The size of the output grid.
• The number of analyses to be performed.
• The sources of anisotropies (advection, coastlines).
If the objective is limited to having an indication of the area where the analysed field cannot
be trusted, then the poor man’s estimate is sufficient. If a more complex error field is to be
constructed, a bypass is the reduction of the output grid resolution. This solution is particularly welcome when a large number of analyses (O(102 )) is required, as it is the case for a
climatology (repeated analysis on months and depth levels).
38
4.4. Comparison between the
methods
24oE
16oE
8oE
0o
16oE
8oE
(c)
0o
30 N
o
33 N
o
36oN
39 N
o
42oN
45 N
o
30oN
33 N
o
36oN
39 N
o
42oN
45oN
(a)
OI
Hybrid
24oE
32oE
(d)
(b)
Poor man
Real covariance
32oE
0
0.2
0.4
0.6
1
0.8
Chapter 4. ERROR COMPUTATION
Figure 4.2: Error fields computed using four different methods: (a) OI, (b) poor man’s estimate, (c)
hybrid and (d) real covariance methods.
39
Chapter 4. ERROR COMPUTATION
4.5
4.5. Integrals over (sub-)domains
Integrals over (sub-)domains
Very often, we are not only interested in the analysed field itself but also in its integral over
the total domain or a sub-domain. If we have the analysis on a sufficiently fine output grid, the
integral itself is then just a sum of the values at the grid points covering the integration domain,
multiplied by the grid-cell surface.
We do not consider here the additional approximation brought by replacing a continuous integral
by a discrete sum. Indeed, generally the output grid is fine compared to the scales of interest and
the sum can be considered an "exact" integral. Hence, we will focus on the error on a discrete
sum of the analysed field.
An application of this theory is found in Yari et al. (2012), where the authors estimated transports through the Strait of Otranto (Adriatic Sea) using Diva and the calculation of integrals.
4.5.1
Theory
Formally, if xa is a column vector containing the analysed field values at the grid points defining
the integration domain, the weighted sum I over this values is
I = (xa )T h
(4.19)
where T stands for the transposed vector or matrix and h is a column vector of the same size
as xa but whose components are the weight associated with each integration point. The weight
is typically the surface associated with the integration point. For an integration over a uniform
grid, the weights can without loss of generality be unit (the surface dimension can be retrieved
at the end by global multiplication).
Note that the weights here have nothing to do with the weight on data points for an analysis.
Now the analysis is not exact but has an associated random error a with respect to the true field
values xt :
xa = xt + a
On statistical average (noted <
(4.20)
>), we suppose the analysis is unbiased and
< xa >= xt
(4.21)
In order to calculate the error variance on the sum, we calculate the expected square distance
with respect to the true sum:
T
∆2 =< hT (xa − xt )(xa − xt ) h >= hT Pa h
(4.22)
where Pa =< a aT > is the error-covariance matrix of the analysis. We see that the spatial
covariances of the analysis-error field are required to calculate the error variance on I. Since
this covariance matrix is not diagonal, it is not sufficient to sum up the local error values of the
error fields of xa . The latter sum would limit the double sum of (4.22) to the diagonal terms of
Pa .
40
Chapter 4. ERROR COMPUTATION
4.5.2
4.5. Integrals over (sub-)domains
Implementation
Exploiting the equivalence of Diva and OI, we know that
Pa = P − CT (B + R)−1 C
(4.23)
where P is the covariance matrix (size Ng × Ng ) of the background field between the Ng grid
points under consideration, B the covariance matrix (size Nd × Nd ) of the background field
between the Nd data points, C is the covariance matrix (size Nd × Ng ) of the background
field between the data points and grid points and finally R is the error covariance matrix (size
Nd × Nd ) on the data.
We could calculate the covariances matrices involved exactly (as done for the exact error calculation) and then calculate (4.22) but this would be prohibitively expensive if done in a brute
force approach. However when done in a clever way it is feasible.
Direct approach
Using (4.23) and (4.22) we can write
Ch
∆2 = hT P h − hT CT (B + R)−1 |{z}
|
{z
}
(4.24)
The term C h is readily interpreted as a columns vector containing Nd elements. Element j is
the (weighted) sum of the covariances of all integration points with the data point j. The middle
term is the analysis operator that provides the analysis on the grid points when providing on
input a columns vector of size Nd . Hence the recipe to calculate ∆2 without explicitly forming
the error-covariance matrices is the following:
• Perform a double sum on all covariances between grid points to calculate hT P h.
• For the term to subtract, evaluate it starting from the right: form a pseudo-data vector by
summing covariances of all grid points with each data point, analyse it and finally sum up
the analysis at the grid points.
All we have to to is to be calculate covariance functions. This can be done with the module
covar of Diva, which allows one to calculate a series of covariances with a single matrix
inversion. Hence the recipe of calculating (4.24) includes a Diva run to calculate covariances
(cost roughly equal to an analysis with full error field), followed by a second Diva run to analyse
the "data" C h.
Hybrid approach
A simplified version can be used, using to some extend the fact the covariance functions in an infinite domain are known analytically when no advection constraint or variable correlation length
is activated. We can indeed introduce an approximation that makes the calculation manageable
41
Chapter 4. ERROR COMPUTATION
4.5. Integrals over (sub-)domains
without calculating the covariances with Diva itself. Instead of using the exact covariances on
the background field, we use the covariances we would find in an infinite domain with constant
correlation length and without advection constraint. In this case, we know that the correlation
function c between two points is
r
r
(4.25)
c(r) = K1
L
L
where r is the distance between the two points, L the correlation length and K1 a Bessel function. To get the covariance function we simply have to multiply by the variance σ 2 of the
background field.
This way we can estimate ∆2 by calculating these covariance functions between grid and data
points and performing one analysis with Diva.
Inflation approach
A second simplified approach makes even stronger assumptions but shows how we can try to
"extrapolate" the error estimated from the sum of the diagonal terms of Pa to the estimation of
the double sum. To do so, we assume that the analysis error has a spatial correlation scale similar
to the analysis. This is probably too severe and we will therefore overestimate the integral error.
˜ by starting
Here we use a continuous formulation to calculate an approximation of ∆ noted ∆
from the sum expressed as continuous integral
Z Z
1
2
< a (x)a (x0 ) > dx0 dx
(4.26)
∆ =
∆x2 ∆y 2 D D
where x and x0 stand for positions in the domain of integration D. When we suppose the
covariance is isotropic and note r the distance between points x and x0 we have
Z Z
1
2
< a (x)a (x) > c(r)dx0 dx
(4.27)
∆ =
∆x2 ∆y 2 D D
which we can evaluate in polar coordinates the inner integral expanded to infinity to find an
approximate value
Z
Z ∞
2π
a
a
2
˜
∆ =
< (x) (x) >
rc(r)dr dx
(4.28)
∆x2 ∆y 2 D
0
with the Bessel function for the correlation function c this yields
Z
4πL2
2
˜
∆ =
< a (x)a (x) > dx
(4.29)
∆x2 ∆y 2 D
If we had used the naive approach of neglecting the spatial covariances, the double sum would
have been restricted to a simple sum on diagonal and we would calculated the underestimated
error
Z
1
˜
2
˜
∆ =
< a (x)a (x) > dx.
(4.30)
∆x∆y D
q
˜˜ to get a better estimate
4πL2
Hence we see that we should apply an inflation factor of ∆x∆y
on ∆
of the error standard deviation. In practice this inflation factor is probably a little too high (we
assumed the analysis error to have the same correlation length as the analysis while in reality it
is generally smaller and we extended one of the integrals to an infinite domain, adding up more
errors).
42
Chapter 4. ERROR COMPUTATION
4.5.3
4.5. Integrals over (sub-)domains
Use
All approaches were implemented into divaintegral. If there is a file
./input/integrationpoints.dat, it will be used. Otherwise it will be created (and
put in the ./output), based on the analysis on the output grid. This files must contain
x,y,val,1,h. If the file did not exist but was created, it will pass through an execution
of divaintegral. divaintegral can be edited by the user to chose special points for
the integration (for example only those points for which the analysis is positive, or points that
fall in a given square etc).
When ispec is negative, the full covariance calculation will be used. When ispec is positive, the hybrid covariance calculation will be used.
When called with the optional argument -naive, it also calculates the simple sum of the
diagonal term of the analysis error variance. The error field itself is calculated with the methods
specified by ispec.
[charles@gher13 divastripped] divaintegral -naive
The output files generated are:
• ./output/integral.dat contains the integral value, the surface of the integration
domain and the average value (integral divided by surface).
• ./output/erroronintegral.dat contains the error standard deviation on the integral, in the same units as the integral.
• ./output/erroronintegralnaive.dat contains the naive approach summing
only the diagonal terms, the inflation factor and the inflated error. Units are the same as
the integral.
Units are units of the variable multiplied by the units of x and y of the data and contour file,
when no coordinate change is performed or the option icoordchange = -xscale was
used.
When icoordchange is one or two, the surface units of the output are m2 .
Note that the tool is not designed for use with the poor man’s error calculation (ispec>10,
Section 4.1.1).
4.5.4
Interna
• gridpointlist.a creates a list of wet points of the analysis grid.
Input: fort.20 gridded gher file, fort.21 corresponding to GridInfo.dat.
Output: fort.22 list of points with value of analysis on wet points only (x,y,val,1,1).
• erroronintegrals.a calculates the double sum on background covariance and prepares the pseudo-data (sum of covariances of all grid points with a data point).
43
Chapter 4. ERROR COMPUTATION
4.5. Integrals over (sub-)domains
Input: fort.10 list of grid points for the integral (including third column for value of
field), fort.11 data file, fort.5 with scale lc datacol.
Output: fort.14 double sum, fort.12 pseudo-data vector.
For exact covariance functions,
[charles@gher13 divastripped] divacalc -pfsum
is executed, which allows the use of the full suite of Diva parameters (including for example
advection constraint). Internally, as we need the covariance of all integral points with all integral
points and data locations, we provide to divacalc -pfsum in input "data" which are the
integration points and ask in addition values in a list of points (which are the original data
location).
44
5 A DDITIONAL
CONSTRAINTS AND DETRENDING
This chapter shows how additional dynamical constraints (advection, diffusion, source, decay)
can be added to the cost function that provide the analysed field in Diva. It also describes the
detrending tool, which allows the extraction of trends from groups.
Contents
5.1
5.2
5.3
5.1
Adding advection to the cost function . . . . . . . . . . . . . . . . . . . .
45
5.1.1
Advection alone . . . . . . . . . . . . . . . . . . . . . . . . . . . .
46
5.1.2
Advection and diffusion . . . . . . . . . . . . . . . . . . . . . . . .
48
5.1.3
Generalization . . . . . . . . . . . . . . . . . . . . . . . . . . . . .
49
Adding linear sink(s) and local source(s) . . . . . . . . . . . . . . . . . . .
49
5.2.1
Implementation . . . . . . . . . . . . . . . . . . . . . . . . . . . . .
50
5.2.2
Example . . . . . . . . . . . . . . . . . . . . . . . . . . . . . . . .
51
Detrending data by defining groups and classes . . . . . . . . . . . . . . .
51
5.3.1
Theory . . . . . . . . . . . . . . . . . . . . . . . . . . . . . . . . .
51
5.3.2
Implementation . . . . . . . . . . . . . . . . . . . . . . . . . . . . .
52
5.3.3
Generalizations . . . . . . . . . . . . . . . . . . . . . . . . . . . . .
52
5.3.4
Use . . . . . . . . . . . . . . . . . . . . . . . . . . . . . . . . . . .
53
5.3.5
Example . . . . . . . . . . . . . . . . . . . . . . . . . . . . . . . .
54
Adding advection to the cost function
Activating an advection constraint on the tracers is done by adding a term to the norm of the
field ϕ (2.11), leading to
J˜ = J(ϕ) +
θ
2
U L2
2
Z A ˜ ˜
˜
˜
u · ∇ϕ − ∇· ∇ϕ dD
L
˜
D
(5.1)
where U and L are characteristic velocity and length scales, respectively. We recognize a dimensionless version of stationary advection-diffusion equation
u · ∇ϕ = A ∇·∇ϕ
(5.2)
The parameter θ allows one to adapt the weight of the additional second term, in which we
˜
recognize a stationary advection-diffusion equation. The physical meaning of the term u · ∇ϕ
is simple: when the velocity is nearly parallel to the gradient, the product has a large value and
is thus penalized. Then for a strong constraint (θ 1) we enforce the analysis to align with
velocity.
45
Chapter 5. ADDITIONAL CONSTRAINTS
AND DETRENDING
5.1. Adding advection to the cost
function
In general we can assume A ≤ U L, in other words, we work at relatively high Reynolds numbers 1 . Otherwise for dominant diffusion, the term just adds another isotropic filtering effect,
already included in the regularization term (Eq. 2.11). Hence the additional term is really interesting only for situations dominated by advection, with A ≤ U L. In this case, the scaling
is such that for θ ≈ 1, the advection constraint has a similar importance with respect to the
regularization term.
The velocity scale U is calculated from the provided u = (u, v) field.
Note that when using the advection constraint, the correlation length provided by divafit
should be decreased since the advection constraint implicitly increases correlation length along
currents.
The solution is expanded in terms of so-called connector values (typically values at the nodes of
a finite element mesh, and in the present case, also normal derivatives to interfaces) and shape
functions over each element (Section 2.3.2). This allows the computation of the solution at any
desired location, knowing the connector values.
The connector values themselves are found as the solution of the minimization process:
(Ks + Kd ) q = g
(5.3)
The stiffness matrix K = Ks + Kd is composed by the different terms related to the derivatives
(Ks ) and a final term related to the location of data:
Kd =
Nd
X
µi Si STi
(5.4)
i=1
where Si is a column vector containing the shape functions associated with a data point i. This
vector has zeros everywhere, except for all connectors of the element in which the data point
lies.
Similarly, the data value di come into the formulation by a projection of the data onto the charge
vector of the connectors
g i = µi Si di
(5.5)
and the total charge vector is the sum of the individual ones.
When a constraint is added, in the original version, the stiffness matrix is augmented by components for each element Ω which are computed
Z ∂si
∂ 2 si
∂ 2 si
∂sj
∂sj
∂ 2 sj
∂ 2 sj
∂si
+v
−A 2 −A 2
u
+v
− A 2 − A 2 dΩ
(5.6)
u
∂x
∂y
∂x
∂y
∂x
∂y
∂x
∂y
Ω
where si are the shape functions of the element
5.1.1
Advection alone
Figure 5.1 shows an example of a single data point located at (0.7, 60) with unit value in a
solid rotation (centred in (0, 60)). In the absence of diffusion, up and downwind are identical
1
The Reynolds number measures the ratio of the inertial effects over the viscosity effects
46
Chapter 5. ADDITIONAL CONSTRAINTS
AND DETRENDING
5.1. Adding advection to the cost
function
(covariance counts).
Figure 5.1: Single data point with unit
value in a solid rotation.
Without advection (Fig. 5.2), the across velocity scale remains and isotropy is recovered (except
for boundary effect on the right side).
Figure 5.2: Same as Fig. 5.1, but without
advection.
To decrease the cross-frontal scale, we must decrease L but add advection to keep along-current
scale larger (Fig. 5.3).
47
Chapter 5. ADDITIONAL CONSTRAINTS
AND DETRENDING
5.1. Adding advection to the cost
function
Figure 5.3: Same as Fig. 5.1, but with
smaller length scale.
Adding advection without decreasing L increases correlation length along-front and keeps
cross-front correlation length.
5.1.2
Advection and diffusion
Adding diffusion makes possible the distinction between up and downwind direction (Fig. 5.4):
in this case, higher values are found upwind of the data location: this is natural, because the
data is observed and Diva tries to infer the field that explains the sample. This requests higher
values upwind (because downwind values decrease).
Because of the square in the formulation, to change the flow direction you can simply change
the sign of the diffusion coefficient or change the sign of the velocity components (Fig. 5.5).
Figure 5.4: Single data point with anticlockwise rotation and with diffusion.
48
Chapter 5. ADDITIONAL CONSTRAINTS
AND DETRENDING
5.2. Adding linear sink(s) and local
source(s)
Figure 5.5: Single data point with clockwise rotation and with diffusion.
5.1.3
Generalization
Zero diffusion simply leads to correlations that are increased in the direction of the vector u (or
decreased in the perpendicular direction if the global L is increased simultaneously).
The vector u does not need to be a velocity in this case, but can be any vector indicating the direction in which correlation is to be increased. Hence it could be for example, topography gradients rotated by 90 degrees or density gradients rotated by 90 degrees if we respectively assume
across depth-contour movements are more difficult (and hence data correlation decreased) or
across frontal movements more difficult (and hence correlation length across fronts decreased).
This idea is implemented in divaUVtopo which generates a pseudo velocity field along isobaths.
The advection constraint therefore allows any known anisotropy in the correlations to be included into the analysis. We notice that the vector field does not need to be divergence free.
5.2
Adding linear sink(s) and local source(s)
With the more complete equation
u · ∇ϕ =
X
Qj δ(˜r − ˜rj ) − γϕ + A∇·∇ϕ,
(5.7)
j
we augment the cost function as
#2
Z "
X
L
L
1
˜ ∇ϕ
˜ +γ ϕ−
˜
˜ −
∇·
Qj δ(˜r − ˜rj ) dD.
J˜ = J˜1 (ϕ) + θ
u
˜ · ∇ϕ
Re
U
U
˜
D
j
49
(5.8)
Chapter 5. ADDITIONAL CONSTRAINTS
AND DETRENDING
5.2.1
5.2. Adding linear sink(s) and local
source(s)
Implementation
Ks is easily modified by adding the decay term during the calculation of the constraint:
Z ∂si
∂si
∂ 2 si
∂ 2 si
u
+v
− A 2 − A 2 + γsi
∂x
∂y
∂x
∂y
Ω
2
∂sj
∂sj
∂ sj
∂ 2 sj
+v
− A 2 − A 2 + γsj dΩ.
u
∂x
∂y
∂x
∂y
The source is a little bit more complicated : each source has a contribution to the charge vector
g of the type
Z 2
Ω
∂si
∂si
∂ 2 si
∂ 2 si
u
+v
− A 2 − A 2 + γsi
∂x
∂y
∂x
∂y
Q
dΩ
Ω
(5.9)
where Q is taken constant over the sub-element for simplicity (otherwise we need to calculate
the derivatives at the source location instead at the gauss integration points where we know them
already).
• Each source (unit= unit of tracer by unit time), is spread over sub-element in which source
is found.
• Source file sources.dat similar to data file. Read in a similar way and sources sorted
in a similar way also (which needed some adaptations)
• Files modified solver.f constr.f divainc.h datapr.f divacalc
• File added: sourcepr.f
• constraint.dat can now contain a third optional parameter which is γ.
Only two possibilities for coordinates and units:
• user coordinates (icoordchange=0): velocity (L/T), decay rate (1/T), diffusion (L2 /T)
and decay (1/T) and coordinates (L) must have same units. Source has variable unit over
time dimension;
• coordinates are degrees and are transformed to km (icoordchange=1): velocity must
be in m/s, diffusion in m2 /s, decay in 1/s and source in "variable units"/s
Other limitations:
• With decay or source activated, ireg should be zero (but is not checked).
• Poor man error field is really bad for these cases.
50
Chapter 5. ADDITIONAL CONSTRAINTS
AND DETRENDING
5.2.2
5.3
5.3. Detrending data by defining
groups and classes
Example
Detrending data by defining groups and classes
When analysing climatological data, one is very often faced with data sets that have heterogeneous coverage in time and/or in space. This can lead to misinterpretations of the analysis, if for
example there have been much more measurements during a specially warm year than during
other years. It is also not uncommon that there are much less cruise data sets in stormy periods
than in calm periods.
Here we present a method to deal with such problems by defining classes and groups.
A group is simply one way of subdividing the data into different members. For example a
group can be based on years and the classes are 1995, 1996, 1997 if we are looking at this
period. Another group could be based on seasons and classes could be winter, spring, summer
and autumn.
5.3.1
Theory
In the functional to be minimised by Diva, there is a data-analysis misfit term :
Nd
X
= µi [di − ϕ(xi , yi )]2
(5.10)
i=1
where µi is the data weight on data di found in location xi , yi . The solution of the minimisation
is the analysed field ϕ(x, y).
If we define one group, each data point is in one and only one class Cj of this group. Hence
when calculating the misfit in the minimisation part of Diva, we include now an (unknown)
trend value for each class (dC1 , dC2 . . .):
X
µi [di − dC1 − ϕ(xi , yi )]2 +
i∈C1
X
µi [di − dC2 − ϕ(xi , yi )]2 + ...
(5.11)
i∈C2
If we assume we know the function ϕ(x, y), minimisation with respect to each of the unknowns
dCj yields
P
dC1 =
i∈C1
µi [di − ϕ(xi , yi )]
P
i∈C1 µi
(5.12)
and similarly for the other classes. Hence we see that the trend for each class is the weighted
misfit of the class with respect to the overall analysis. The problem is of course that ϕ is not
known since it is also the result of the minimisation process. However, we can iterate and start
with an analysis without detrending. Then, using the field of ϕ, we can calculate a first guess
of the trends in each group and subtract if from the original data. Then a new analysis can be
performed, the trends recalculated and so on until convergence.
51
Chapter 5. ADDITIONAL CONSTRAINTS
AND DETRENDING
5.3.2
5.3. Detrending data by defining
groups and classes
Implementation
Here we generalize by allowing several groups of classes.
The detrending is done hierarchically:
1. Trends for the first group are calculated and removed from the data.
2. The second group is treated and so on.
3. Once the data has been detrended, a new diva analysis is performed.
4. With the new analysis, the data-analysis misfit (or residual) can be reused to calculate
better estimates of the trends.
This loop is repeated a predefined number of times.
5.3.3
Generalizations
We can further add regularization constraints on the calculated trends. For example, if there a
few data available for estimating the trend of class Cj , we should be not be too confident on the
trend and rather perform a standard analysis (i.e. reducing the value of dCj ). We can modify the
cost function associated with data in class Cj as follows
X
2
µi di − dCj − ϕ(xi , yi ) + αj (dCj )2
(5.13)
i∈Cj
where the coefficient αj regularizes the trend amplitude and
P
i∈C1 µi [di − ϕ(xi , yi )]
P
dC1 =
i∈C1 µi + αi
(5.14)
If Nj is the number of points with non-zero weights, we can define
µ
¯j =
1 X
µi
Nj i∈C
(5.15)
j
and a proposed scaling for regularization constants is
p
αj = µ
¯j Nj .
(5.16)
This has been implemented.
If the detrending is included in a 3-D loop, with the same groups and classes defined in each
layer, we can further request that the values of the trends in a given layer are not too far from
those in the surrounding layers and modify the norm as
X
2
2
− −
2
µi di − dCj − ϕ(xi , yi ) + αj (dCj )2 + β + (d+
Cj − dCj ) + β (dCj − dCj )
i∈Cj
52
(5.17)
Chapter 5. ADDITIONAL CONSTRAINTS
AND DETRENDING
5.3. Detrending data by defining
groups and classes
where the coefficient βj∗ regularize the trend differences between layers and where + refers to
the value in the layer above and − to the layer below. Obviously, the solution of this problem
will involve tridiagonal solvers. For the lowest and uppermost layer, we can simply assume a
zero gradient for the trends.
Similarly, the β can be scaled based on the two layers involved
βj+
+
(¯
µ+
¯j Nj )
j Nj + µ
=
+
(Nj + Nj )
(5.18)
This regularisation between layers is not yet implemented. Either done at 3-D level or simply
allow iterative 3-D filtering as now but with weights β as described here !
5.3.4
Use
Simply provide ./input/data.dat with additional fifth, sixth . . . columns. If you do not
want to use variable data weight, column 4 must contain the value of 1. Column 5, 6, . . . contain
the information in which class the data point falls. Classes must be numbered starting with 1.
Example:
• Column 5 contains value 1 for a data point of the year 1975, 2 for 1976, 3 for 1977 and
so on.
• Column 6 contains 1 for a data corresponding to month 01-03, 2 for the month 04-06 and
so on.
• Column 7 contains 1 for day values, 2 for night values.
• Column 8 contains 1 for points that have a density below 1025 kg/m3 , 2 for points that
have a density above it.
Execute divadetrend ngroups [niterations]. The parameter ngroups specifies
that the first ngroups will be used for the detrending. (You might create for example 5 groups
and try with detrending on the first one only using divadetrend 1). The optional parameter
niterations tells how many iterations are to be performed for the detrending. Default value
is 10 iterations.
Outputs
./output/rmsmisfit.dat contains the evolution during the iterations of the misfit (after
detrending). It should decrease if the detrending works well. trends.all.1.dat deals
with group 1 and contains on column 1 the class number and on columns 2 the final trend value
associated with it. Columns 3 and 4 correspond to the next to last iteration and the last columns
to the first iteration.
divagnu produces plots for the trend in each group.
53
Notes:
• Presently you can define at maximum 5 groups with each group having 50 classes (members). You can increase these limits by editing and compiling src/Fortran/detrend.f
• It is assumed that the mesh already exists, otherwise execute divamesh before.
Additional options
If you provide file detrend.order in ./input/, then the columns for detrending will be
taken in the order specified in the file.
Example: if detrend.order contains:
8 5 7 6
and we call divadetrend 3, columns 8 5 7 will be used in this order for detrending. If
there is no file detrend.order, then divadetrend 3 will use 5 6 7 in this order.
(file detrend.order or default order is written in fort.56 in divawork during execution)
5.3.5
Example
The example located in Examples/Trends/ contains data sampled from a spatial pattern
(sin-cosine structure) over which was added:
• a seasonal cycle,
• a daily cycle and
• inter-annual variations.
Groups are years, month and hours. Matlab file pseudodata.m can be used to generated
such a data file. The comparison between analysed field without and with detrending option is
shown in Fig. 5.6: on the left-hand side, the sin-cosine structure is visible, but perturbed by the
various cycles superimposed on it. After the detrending, the structure is perfectly recovered.
Along with the field without trend, the divadetrend tool also provides the trend for each
group (Fig. 5.7).
Chapter 5. ADDITIONAL CONSTRAINTS
AND DETRENDING
5.3. Detrending data by defining
groups and classes
1
1
1
0.8
0.6
0.5
0.5
0.5
0.4
0.2
0
0
0
0
−0.5
−0.4
−1
−0.5
−0.2
−0.5
−0.6
−1.5
−1
−1
−0.5
0
0.5
−0.8
−1
−1
1
−0.5
0
(a)
0.5
1
(b)
Figure 5.6: Example of a reconstruction without (a) and with detrending (b). Note the difference in the
color bars.
1
1.5
1
0.5
0.5
0
0
−0.5
−0.5
−1
−1
5
10
15
20
25
30
−1.5
2
4
(a) Inter-annual
6
8
(b) Seasonal
1.5
1
0.5
0
−0.5
−1
−1.5
5
10
15
20
(c) Daily
Figure 5.7: Trends obtained from the data using the detrending tool.
55
10
12
Part II
2-D implementation
56
6 S CRIPTS ,
INPUT FILES AND DIRECTORIES
This chapter starts with the description of the scripts used by Diva, then input files required for
simple 2-D analysis are presented here. Basically, only three files are needed as input:
1. a file containing the data (data.dat)
2. the specification of the domain of analysis (coast.cont) and
3. the list of the parameters used during the analysis (param.par).
Contents
6.1
6.2
6.3
List of 2-D tools . . . . . . . . . . . . . . . . . . . . . . . . . . . . . . . .
58
6.1.1
Operations on data . . . . . . . . . . . . . . . . . . . . . . . . . . .
58
6.1.2
Parameter estimation . . . . . . . . . . . . . . . . . . . . . . . . . .
58
6.1.3
Contours and mesh . . . . . . . . . . . . . . . . . . . . . . . . . . .
59
6.1.4
Analysis
. . . . . . . . . . . . . . . . . . . . . . . . . . . . . . . .
59
6.1.5
Quality control and error field . . . . . . . . . . . . . . . . . . . . .
60
6.1.6
Misc
. . . . . . . . . . . . . . . . . . . . . . . . . . . . . . . . . .
60
Input files . . . . . . . . . . . . . . . . . . . . . . . . . . . . . . . . . . . .
60
6.2.1
Contour . . . . . . . . . . . . . . . . . . . . . . . . . . . . . . . . .
60
6.2.2
Data . . . . . . . . . . . . . . . . . . . . . . . . . . . . . . . . . . .
61
6.2.3
Parameters . . . . . . . . . . . . . . . . . . . . . . . . . . . . . . .
62
6.2.4
Additional points of analysis . . . . . . . . . . . . . . . . . . . . . .
66
Working directories (2-D analysis) . . . . . . . . . . . . . . . . . . . . . .
66
57
Chapter 6. SCRIPTS, INPUT FILES AND
DIRECTORIES
6.1. List of 2-D tools
Convention: Diva works with decimal numbers
represented with . not ,
Tips 6.1 Use unix command sed to replace , by .:
[charles@gher13 Software] cat file1.dat | sed s/,/./g > file2.
dat
where: file1.dat is the old file and
file2.dat is the file where the replacement has been made.
Tips 6.2 Use editor vi to replace , by .:
Simply type:
[charles@gher13 Software]$ vi file1.dat
:,$s/,/./g
6.1
6.1.1
List of 2-D tools
Operations on data
divabin: bins the data in order to improve the quality of the optimized parameters (CL and
SNR).
divaanom: computes the difference between the data and the provided reference field.
divadataclean: eliminates all data that fall outside the bounding box of the contours.
divadatacoverage: Writes Relative Length (RL) (RL.dat and RLInfo.dat) field based
on data coverage and data density field (DATABINS.dat).
dvncmask2RL: Writes Relative Length (RL) (RL.dat and RLInfo.dat) field based on a
given mask on the domain.
6.1.2
Parameter estimation
divabestguess: provides estimates for the correlation length and the signal-to-noise ratio
with methods chosen according to the number of data.
divacv: performs ordinary cross-validation.
divacvclasses: performs ordinary cross-validation by setting aside all data from a given
class (e.g., specific year) and comparing the analysis to them.
58
Chapter 6. SCRIPTS, INPUT FILES AND
DIRECTORIES
6.1. List of 2-D tools
divacvrand: performs cross-validation by taking out several points at once to calculate error
estimates and repeat the exercise several times to make estimates robust.
divafit: estimates the correlation length by fitting the data correlation function to the theoretical kernel.
divagcv: estimates the signal-to-noise ratio by performing a generalised cross-validation.
divagcvalex:
divaguesssn:
divasnbygrid: creates a grid with noise level and data weights.
6.1.3
Contours and mesh
divacc: check the consistency of the initial contour file.
divacoa2cont: converting ODV-format coastlines to Diva-format coastlines.
divacont: creates the contours from a given bathymetry and a selected depth levels.
divacont2grid: translate contours into gridded format.
divamesh: generates the finite-element mesh.
6.1.4
Analysis
divabigtest: performs a test with a very large number of data points.
divacalc: performs the Diva analysis.
divadetrend: performs an analysis with the detrending option activated.
divadress: performs a complete analysis: cleaning (divaclean), mesh generation (divamesh),
analysis (divacalc), outliers detection (divaqcbis) and outliers removal (dvoutlierclean)
divaintegral: compute the integral of the treated variable of the considered domain.
divamultivar: performs an analysis with the multivariate approach.
divarefe: computes a reference field with a semi-normed analysis with an increased value
for L.
divaseminorm: performs an analysis with a semi-normed reference field: computes the reference field (divarefe), computes the anomalies with respect to the reference field
(divaanom), makes the analysis (divacalc) and add the reference field to the obtained analysis (divasumup).
divasumup: performs the last step of a semi-normed analysis: the sum of background field
and analysed anomaly field.
59
Chapter 6. SCRIPTS, INPUT FILES AND
DIRECTORIES
6.2. Input files
Analysis: using relative length field
divadatacoverage: Writes in input Relative Length (RL) field based on data coverage.
RL fields are used to perform an analysis when they are present in input.
dvncmask2RL: Writes Relative Length (RL) field based on a given netcdf mask file of the domain. It uses the file mask.nc if present in input and writes RL.dat and RLInfo.dat
to input directory.
6.1.5
Quality control and error field
divacpme: computes de the clever poor man’s error.
divaexerr: advanced method to compute the exact error field.
divaqc, divaqcbis, divaqcter: performs quality control on data (see Section 3.3).
6.1.6
Misc
divaclean: cleans up the working directories by removing fort.* files from divawork
and meshgenwork, as well as output files from output.
divagnu: prepares the plot of outputs using Gnuplot.
divaload: load the input files from a given directory.
divasave: saves the output files in a given directory.
6.2
6.2.1
Input files
Contour
The contour file (coast.cont) delimits the region where the analysis has to be performed,
i.e., it specifies the boundary between land and sea. The file is defined this way:
1. The first line indicates the number of contours (M ) in the region of interest.
2. The second line tells the number of points (N1 ) in the first contour.
3. The next N1 lines are the coordinates of the points of the first contour. The convention for
the contour is that the land is on the right when you follow the points successively. The
contour is automatically closed, meaning that the last point of a given contour is be from
the first one.
4. The following line is the number of points (N2 ) of the second contour.
60
Chapter 6. SCRIPTS, INPUT FILES AND
DIRECTORIES
6.2. Input files
5. . . .
6. The last NM lines are the coordinates of the points of the last contour.
2
4
0 0
100 0
100 80
0 80
4
60 40
80 40
80 60
60 60
Example file 6.1: coast.cont
Here, the contour is made up of 2 sub-contours:
• the first one with 4 points (and 4 edges): (0, 0), (100, 0), (100, 80) and (0, 80). It is the
main contour.
• the second one with also 4 points. It is the interior contour (island).
In realistic application, the contours are more complex: they have more sub-contours (islands,
interior seas), and each sub-contour is made up of more points.
80
60
40
20
0
0
20
40
60
80
100
Figure 6.1: Example of a contour file and its graphical representation.
6.2.2
Data
The data file (data.dat) contains at least three columns:
61
Chapter 6. SCRIPTS, INPUT FILES AND
DIRECTORIES
6.2. Input files
1. the x−coordinate (usually the longitude, but can also be an horizontal distance in km, or
any coordinate).
2. the y−coordinate (usually the latitude).
3. the data value.
• The fourth column [optional] indicates the weight of the each data point. If this column
is empty, the fourth column is assumed to take the value 1.
• If there are more than four columns, columns 5 and higher are not used by the software,
except if you want to use the detrending tool (Section 5.3).
20
60
30
40
70
85
90
70
10
20
50
70
70
55
10
35
3
-2
0
-1
-2
4
2
-4
Example file 6.2: data.dat
4
80
3
2
60
1
0
40
−1
−2
20
−3
0
0
20
40
60
80
100
−4
Figure 6.2: Example of a data file and its graphical representation.
6.2.3
Parameters
The file ./input/param.par specifies the main analysis parameters and options of Diva.
A clear understanding of is essential for a proper use of the software. A description of each
parameter is provided below the example file.
62
Chapter 6. SCRIPTS, INPUT FILES AND
DIRECTORIES
6.2. Input files
# Correlation Length lc
0.2
# icoordchange
0
# ispec
11
# ireg
0
# xori
0
# yori
0
# dx
0.02
# dy
0.02
# nx
51
#ny
51
# valex
-99
# snr
1.0
# varbak
1.0
Example file 6.3: param.par
63
Chapter 6. SCRIPTS, INPUT FILES AND
DIRECTORIES
6.2. Input files
Lc
The global correlation length L used for the analysis (see Section 2.3.1 for the physical meaning). It has to be defined as a real positive number. Note that the length of the finite-elements
will be computed according to the value of L.
As a first guess, you can use a value between a tenth of the domain size and the domain size, in
order to avoid getting into memory troubles due to a too fine mesh. Later, you can change this
value if it seems interesting (via optimization).
icoordchange
Specifies the desired type of coordinate system:
icoordchange = 0 if no change is necessary (same coordinates as data);
= 1 if data positions are given in degrees and if you want to use real
distances;
= 2 if data positions are given in degrees, you want to use real
distances, and your domain extends on a wide span of latitude (uses
a cosine projection);
= −xscale to scale x coordinates by a factor xscale before doing
anything (for vertical sections: see Section 10.2)
ispec
Four base-values specify the required error outputs:
ispec = 0
=1
=2
=4
:
:
:
:
no error field requested
gridded error field specified by xori, yori, nx and ny;
errors at data locations;
errors at locations listed in valatxy.coord.
Then you can combine these four values to obtain several error outputs:
Examples:
ispec = 3 (=1+2)
ispec = 7 (=1+2+4)
means you want gridded error field as well as errors at data locations;
means you want the three error files.
From there several variants can be specified:
For computing errors with the real covariance function (Section 4.1.4), simply multiply the
ispec value by −1:
Example:
ispec = -7
means you want the three error files computed with the help of the
real covariance function.
For computing errors with the real covariance function using boundary effects (Section 4.1.4),
64
Chapter 6. SCRIPTS, INPUT FILES AND
DIRECTORIES
6.2. Input files
simply add −10 to a negative ispec:
Example:
ispec = -17
means you want the three error files computed with the help of the
real covariance function and boundary effects.
A poor man’s error estimate (quick and underestimated error field, Section 4.1.1) is available
by adding +10 to the positive base ispec value:
Example:
ispec = 16
means you want errors at data locations and at points listed in
valatxy.coord computed with the poor man’s error estimate.
Adding +100 to the base ispec activates the clever poor man’s error calculation and launches
automatically divacpme
Example:
ispec = 116
means you want errors at data locations and at points listed in
valatxy.coord computed with the clever poor man’s error estimate.
Adding −100 to a negative ispec activates the almost exact error calculation and launches
automatically divaexerr
Example:
ispec = -106
Example:
ispec = -117
means you want errors at data locations and at points listed in
valatxy.coord computed with the almost exact error estimate.
means you want errors everywhere computed with the almost exact error estimate using the background covariance with boundary
effects.
ireg
Specification of the background field which is subtracted from the data field (Section 2.3.1).
ireg = 0
=1
=2
: no background field is subtracted (assuming data are already anomalies);
: the data mean value is subtracted;
: the linear regression of the data (plane) is subtracted.
xori/yori, nx/ny
xori/yori indicate the coordinates of the first grid point while nx/ny indicate the number
of grid points in x/y directions.
valex
Exclusion value: value used to fill the output matrix when a point corresponds with land. Any
value is accepted, but the user has to ensure that the exclusion value cannot be a value obtained
by the interpolation of the measurements.
65
Chapter 6. SCRIPTS, INPUT FILES AND
DIRECTORIES
6.3. Working directories (2-D
analysis)
snr
Signal-to-noise ratio of the whole dataset (Section 2.3.1). It has to be defined as a real positive
number (as the correlation length).
varbak
Variance of the background field.
6.2.4
Locations of additional points where analysis is required (optional)
The file valatxy.coord is a two-column list of locations where you want the analysis to be
performed (in addition to the regular grid defined in param.par).
20 20 0
60 10
40 40
Example file 6.4: valatxy.coord
If they exist, columns 3 and higher are not used.
6.3
Working directories (2-D analysis)
For 2-D analysis, the main working directory is divastripped. Inside it, we have:
[charles@gher13 divastripped] tree -d -L 2
.
|-- divawork
|
‘-- sub
|-- gnuwork
|
|-- gnuplottools
|
‘-- plots
|-- input
|-- meshgenwork
‘-- output
|-- ghertonetcdf
‘-- meshvisu
10 directories
divawork is where the intermediate files are produced.
gnuwork contains the scripts for generating the plots with Gnuplot. These plots will be located in the sub-folder plots.
66
Chapter 6. SCRIPTS, INPUT FILES AND
DIRECTORIES
6.3. Working directories (2-D
analysis)
input contains the input files presented in this section.
divawork is the working directory for the mesh generation.
output contains the analysis results. In ghertonetcdf, one can find the output in NetCDF
format (file results.nc), while meshvisu stores the files that describe the mesh.
67
7 P REPARATION
OF THE INPUT FILES
We describe in this chapter the tools to prepare the various input files presented in Chapter 6. If
you already have the input files at your disposal, you way want to go directly to the next chapter.
Contents
7.1
7.2
7.3
7.4
7.5
7.1
Creation of topography . . . . . . . . . . . . . . . . . . . . . . . . . . . .
68
7.1.1
Method 1: using Diva on web . . . . . . . . . . . . . . . . . . . . .
69
7.1.2
Method 2: conversion from GEBCO topography . . . . . . . . . . .
70
7.1.3
Method 3: interpolation of individual topography measurements . . .
72
7.1.4
Method 4: by hand . . . . . . . . . . . . . . . . . . . . . . . . . . .
73
7.1.5
Deprecated method: conversion of data from Topography Extractor .
74
Creation of contours . . . . . . . . . . . . . . . . . . . . . . . . . . . . . .
75
7.2.1
By hand . . . . . . . . . . . . . . . . . . . . . . . . . . . . . . . . .
75
7.2.2
From topography . . . . . . . . . . . . . . . . . . . . . . . . . . . .
77
7.2.3
Using ODV . . . . . . . . . . . . . . . . . . . . . . . . . . . . . . .
79
7.2.4
From a mask . . . . . . . . . . . . . . . . . . . . . . . . . . . . . .
79
Determination of analysis parameters . . . . . . . . . . . . . . . . . . . .
79
7.3.1
divafit
. . . . . . . . . . . . . . . . . . . . . . . . . . . . . . .
79
7.3.2
divagcv . . . . . . . . . . . . . . . . . . . . . . . . . . . . . . . .
80
7.3.3
divabin . . . . . . . . . . . . . . . . . . . . . . . . . . . . . . . .
81
7.3.4
divacv . . . . . . . . . . . . . . . . . . . . . . . . . . . . . . . .
81
7.3.5
divacvrand . . . . . . . . . . . . . . . . . . . . . . . . . . . . .
81
Format conversion tools . . . . . . . . . . . . . . . . . . . . . . . . . . . .
81
7.4.1
ncdf2gher . . . . . . . . . . . . . . . . . . . . . . . . . . . . . .
81
7.4.2
gher2ncdf . . . . . . . . . . . . . . . . . . . . . . . . . . . . . .
81
Misc . . . . . . . . . . . . . . . . . . . . . . . . . . . . . . . . . . . . . . .
82
7.5.1
divaclean . . . . . . . . . . . . . . . . . . . . . . . . . . . . . .
82
7.5.2
divadataclean . . . . . . . . . . . . . . . . . . . . . . . . . . .
82
7.5.3
divaload . . . . . . . . . . . . . . . . . . . . . . . . . . . . . . .
82
7.5.4
divacck . . . . . . . . . . . . . . . . . . . . . . . . . . . . . . . .
83
Creation of topography
A topography may be the first thing you have to prepare in order to generate a climatology.
They are necessary in two cases:
1. when you need contour files at different depths to perform analysis;
68
Chapter 7. PREPARATION OF THE INPUT
FILES
7.1. Creation of topography
2. when you work in a vertical plane and want to interpolate several profiles from a cruise.
Basically, the procedure consists in creating files with a format readable by Diva. The list of
methods presented in this Section is not exhaustive, but corresponds to different procedures to
create topography files using different data bases freely available on the web.
Convention: Diva works with the convention that depth are positive under the sea
level. This is especially important when creating contours. Matlab tools provided
with the software create topographies which respect this convention, but in case that
you work with topography database that are not described in the following section,
Tips 7.1 A simple way to change the sign of a given column of a data file is to use the following
command:
awk ’{print $1,$2,-$3}’ infile > outfile
where infile is the old file and outfile the new one.
If you need to switch two columns of a file, type:
awk ’{print $2,$1,$3}’ infile > outfile
7.1.1
Method 1: using Diva on web
Go to http://gher-diva.phys.ulg.ac.be/web-vis/diva.html, upload any data (it can be the example provided on the web). It is faster to use a small file, and you can even create a simple file with 2
measurements in the lower left and upper right corners of your region.
lonmin latmin value
lonmax latmax value
Then specify the output grid on the region where you want the topography and provide the resolution which is typical for the resolution you will use later for the analysis. Perform the analysis
with your "data". In the download section, you can download the topography in a NetCDF file
diva_bath.nc. Save this file into your input. Then on the command line, placed in this
input, execute ../../bin/divabath2topogrd.a. This will create topo.grd and
TopoInfo.dat.
If you need to erase some zones from your topography, you have to create a netcdf file masktopo.nc
before executing ../../bin/divabath2topogrd.a. This masktopo.nc has to be a
2D file containing a binary variable called MASKTOPO (0 where you want to erase the topography, 1 elsewhere). The dimensions have to be the same as diva_bath.nc and the axis have
to be named “lon” and “lat” or “LON” and “LAT”.
69
Chapter 7. PREPARATION OF THE INPUT
FILES
7.1.2
7.1. Creation of topography
Method 2: conversion from GEBCO topography
The GEBCO bathymetry is distributed by the British Oceanographic Data Centre (BODC). If
you have already registered, you can log in (https://www.bodc.ac.uk/my_account/login/), otherwise
it is necessary to register to become a new user.
Download the complete, global GEBCO One-Minute Grid file (90n90s180w180e.zip)
from http://www.bodc.ac.uk/data/online_delivery/gebco/ and unzip it to obtain the file GridOne.grd.
Download the software GebcoCE_GridOnly as well and run it (on Linux : open the .exe with
Wine).
Select your area
Select your region of interest (Fig. 7.1), possibly slightly increased to make sure boundaries are
well included in the topography. Then select File->Export Data->Gridded Data.
Chose Ascii longitude-latitude-depth (default). For the longitude range, use -180:180 for
European seas. Note regions you possibly want to mask later by their coordinate ranges. Use
topo.gebco.asc as output file name, into a directory where you have your main climatological working place. Push OK and be patient. (Fig. 7.2).
Figure 7.1: Area selection with software GebcoCE_GridOnly.
Convert the file into gher format
Go into Cygwin (or into Linux mode) and place yourself in the main directory of your climatology production. You should have a big topogebco.asc file on which you can apply
70
Chapter 7. PREPARATION OF THE INPUT
FILES
7.1. Creation of topography
Figure 7.2: Data exportation with software GebcoCE_GridOnly.
[charles@gher13 input] head -20 topogebco.asc
to see if the file was created correctly. You also should have a gebcoprep file. If not, copy
the gebcoprep.example file as gebcoprep.
If you need to mask regions, edit gebcoprep and add lines as those put with #awk followed
by #mv bidon. They should be self explaining and allow excluding regions that are defined
by relationships between longitude and latitude.
Example: (2 > 57.0 + 0.6∗1) x=-10.
57+0.6*longitude will be masked.
means that regions where latitude is larger than
Once you defined the regions to be masked in this way, execute gebcoprep. When working on large domains, the computation time can be very long. However, this step has not
to be repeated a lot of times. The execution of gebcoprep will create an ascii file called
./input/topo.gebco.
Now you are ready to prepare the gridded topography topo.grd from which Diva will extract contours. To prepare it, copy or move ./input/topo.gebco into the diva working
directory to have divastripped/input/topo.gebco.
The best resolution offered by GEBCO is 30-arc seconds, which might be much too fine for
large scale analysis. To avoid that, run gebco2diva with optional arguments nx ny to make
a grid using only every nx point in x−direction and ny in y−direction. For example, if you are
interested in a Diva output resolution that is working at a 100 km scale, gebco2diva15 15
would still provide a very fine topography with respect to the scales of interest.
In the divastripped directory, the execution if gebco2diva will generate two files in
divastripped/output/ for describing the topography:
topo.grd: a binary file containing the gridded topography.
TopoInfo.dat: a ascii file describing the topology of the grid and similar to GridInfo.dat.
You can further check the two files by copying them into the divastripped/input directory and executing divacont and divagnu. If results seem right, you can save the files
71
Chapter 7. PREPARATION OF THE INPUT
FILES
7.1. Creation of topography
TopoInfo.data and topo.grd into your main data directory, to be used with divacont
on all levels defined by contour.depth.
If everything is stable, you can erase topogebco.asc and topo.gebco to save disk space.
Figure 7.3: Topography from GEBCO one-minute topography.
7.1.3
Method 3: interpolation of individual topography measurements
The principle of this method is to apply a Diva analysis to a data file containing depths at various
locations.
Get topography measurements
In the present example data points are extracted from http://topex.ucsd.edu/cgi-bin/get_data.cgi
in the same region as the previous case (9 − 12◦ W × 30 − 33◦ N ). The output file is composed of three column: | longitude | latitude | depth |, i.e., the same format
as data.dat files used by Diva. Once the file is downloaded, edit its name in topo.dat.
Figure 7.4 shows the individual measurements (coloured dots) in the region of interest.
Adapt parameters
As in any Diva analysis, you need to provide parameters concerning the analysis itself and the
output grid (file param.par, described extensively in Section 6.2.3, page 62).
• Correlation length is chosen according to the resolution of the gridded topography you
extracted, i.e., the distance between two measurements.
72
Chapter 7. PREPARATION OF THE INPUT
FILES
7.1. Creation of topography
Figure 7.4: Individual measurements of depths.
• Signal-to-noise ratio is assigned with a large value (typically 100 or more).
• x/yorigin are chosen according to the region where you extracted data.
• dx and dy are the same as the values you use for your analysis.
Execute divatopo
With the two files topo.dat and param.par located in divastripped/input/, type
divatopo to launch the analysis. divatopo automatically creates a contour file according to
grid parameters taken in param.par. The interpolated field is presented on Fig. 7.5. Outputs
topo.grd and TopoInfo.dat may then be used to generate contours (see Section 7.2).
7.1.4
Method 4: by hand
Create a gridded file (in the same format as the analysis fields fieldgher.anl) of topography and call it topo.grd. The information on the grid’s geographical dimensions are to be
placed in TopoInfo.dat.
The grid is simply an array (i = 1, . . . , M ) and (j = 1, . . . , N ), where the coordinates of the
grid nodes are xi = x1 + (i − 1) ∗ dx, yj = y1 + (j − 1) ∗ dy. The file TopoInfo.dat contains
simply
x1
y1
dx
73
Chapter 7. PREPARATION OF THE INPUT
FILES
7.1. Creation of topography
Figure 7.5: Interpolated topography.
dy
M
N
Look into dvdv2diva.f in ./src/Fortran/Util/ how to write such files from within
a Fortran code.
7.1.5
Deprecated method: conversion of data from Topography Extractor
This DBDB-B topography is not available any more, hence the method described below cannot
be used. It is kept in this manual for compatibility purposes.
Select your area
Go to https://idbms.navo.navy.mil/dbdbv/dbvquery.html, select the area and spacing and download
the corresponding file in CHRTR ascii format (Fig. 7.6). In this example we worked in the
region delimited by [9 − 12◦ W × 30 − 33◦ N ] (NW Africa) with a resolution of 0.01◦ in both
directions.
If the web server is not operational, you can also access this database at http://ferret.pmel.noaa.
gov/NVODS/servlets/ Then select your dataset by clicking on "by Dataset Name" and chose
"NAVAL OCEANOGRAPHIC OFFICE Bathymetry/Topography 5min resolution".
Mark the topography box and click on "Next" (Fig. 7.7(a)).
Delimit your region and select "ASCII file" as output (Fig. 7.7(b)).
74
Chapter 7. PREPARATION OF THE INPUT
FILES
7.2. Creation of contours
Figure 7.6: Topography extraction from the Naval Oceanographic Office website.
Put the .asc file into divastripped/input/ with the name topo.asc and execute
dbdb2diva in the shell. You will get topo.grd and TopoInfo.dat in the output
directory. The corresponding topography is drawn on Fig. 7.8.
7.2
Creation of contours
As seen in first chapter, a relevant asset of Diva is the fact that it takes into account real coastlines and topography of the region of interest. We explain hereinafter the techniques to produce
a correct coastline file, of which the description is provided in Section 6.2.1.
7.2.1
By hand
The first possibility is to build your file by hand: having at your disposal the location of different
points of the coast (longitude, latitude), simply create a file containing M contours, with the
i − th contour having being made up of Ni points (i = 1, 2, . . . , N ).
Be aware that some cases (Fig. 7.9) are to be avoided, since problems arise during the mesh
generation when crossings occur in the contour. Also note that, as contours are automatically
closed by Diva, the segment joining the first and the last points may generate errors.
75
Chapter 7. PREPARATION OF THE INPUT
FILES
7.2. Creation of contours
(a)
Figure 7.7: Topography extraction from NVODS.
76
Chapter 7. PREPARATION OF THE INPUT
FILES
7.2. Creation of contours
Figure 7.8: Topography from Naval Oceanographic Office website.
Figure 7.9: Example of improper contours. Left:
crossing of two segments of a same contour; up:
crossing of two different contours; right: first and
last points of the contour generate a segment that
crosses the other parts; down: two contours having
a common segment.
Remember that you can use the tool divacck for checking and thinning of contours.
7.2.2
From topography
Once you have placed files topo.grd and TopoInfo.dat in directory ./input, type
divacont in the command line shell. This will generate several coastline files named coast.cont.100nn
where nn corresponds to the nnth level defined in contour.depth. File coast.cont contains the coastline at the surface level (z = 0).
As an illustration, we want to have contours from surface to a depth of 1000 m every 200 m,
with topo.grd and TopoInfo.dat created in the Section 7.1. To this end we use the
following file:
Contours for the specified depths are showed on Fig. 7.10.
77
Chapter 7. PREPARATION OF THE INPUT
FILES
7.2. Creation of contours
2500
2000
1500
1000
500
0
Example file 7.1: contour.depth
Figure 7.10: Contour generated every 500 m from surface to -2500 m.
78
Chapter 7. PREPARATION OF THE INPUT
FILES
7.2.3
7.3. Determination of analysis
parameters
Using ODV
Tool divacoa2cont allows converting ODV-format coastlines to Diva-format coastlines.
Simply copy coastline file in the input directory with the name coast.coa along with a
param.par file and type divacoa2cont in the shell.
This provides you the new file ./input/coast.cont.
7.2.4
From a mask
Simply look at contourgen.f and create the mask as you wish. Alternatively you can create
a pseudo-topography with adequate pseudo-depth at which you draw the contour.
7.3
Determination of analysis parameters
Two key parameters have to be adjusted before running an analysis: the correlation length scale
(L) and the signal-to-noise ratio (λ). Several tools are provided in order to help the user for the
determination of these parameters.
7.3.1 divafit
The script divafit: uses the data (./input/data.dat) for a direct fitting of the covariance function (see Section 2.3.3). Note that the fit needs a sufficiently large data set.
Command description
divafit
: performs a fit of the data correlation function based on the whole data set.
divafit -r
: puts the new value of L in param.par in function of the fit.
divafit n
: performs the fit on a sample of n*(n-1)/2 couples of data (sub-sampling).
Example:
divafit -r 100: performs a fit on 4950 couples of data and update the file param.par.
Tips 7.2 When dealing with very large datasets, using divafit with sub-sampling may save
you a large amount of time.
Note: when using advection constraint and variable L, divafit will not provide a very meaningful value.
Output files
In output file ./output/paramfit.dat, the best estimates are given and could be used as
parameter values for running Diva. Estimates of the correlation length are rather robust while
those of the signal-to-noise ratio are neither precise nor robust, especially for large values.
79
Chapter 7. PREPARATION OF THE INPUT
FILES
7.3. Determination of analysis
parameters
Output file covariance.dat is the data-based covariance function:
column 1: distance between points,
column 2: covariances,
column 3: number of data couples used to estimate the covariance.
Output file covariancefit.dat allows looking at the fitted covariance function:
column 1: distance between points,
column 2: data-covariance,
column 3: fitted covariance.
Finally, file param.par.fit is the original param.par file except that the correlation
length has been replaced by the fitted value.
Note: always have a look at the fit to judge on its quality.
7.3.2 divagcv
The script divagcv exploits Diva module (gcvfac), analysing random fields to assess the
generalized cross validator (GCV, see Chapter 3 for theoretical developments). The script
divagcv is an example of how to minimize the estimator by changing the signal-to-noise
ratio (λ) value, but could be adapted to optimize other parameters as well, such as correlation
length.
Input to the module is the number of random estimates required (the larger the value, the more
robust the estimator). Default value is 5, unless you change in divacalc. The user has to
provide an input file ./input/gvcsampling.dat containing the list of values for λ on
which to try the estimator (typically around the values provided by divafit).
During the divagcv execution, error-field calculations are disabled to reduce computing time.
Tips 7.3 If a mesh already exists (in meshgenwork directory), divagcv disables the divamesh
procedure. For this reason, ensure you are working with the adequate mesh.
Output files
File ./output/gcv.dat contains the GCV estimator:
column 1: signal-to-noise ratio,
column 2: GCV,
column 3: data anomaly variance.
and ./output/gcvsnvar.dat the best new estimate for the S/N and VARBAK parameters.
In param.par.gcv, you find an adapted version of the original param.par.
80
Chapter 7. PREPARATION OF THE INPUT
FILES
7.4. Format conversion tools
7.3.3 divabin
divabin performs a spatial binning of the data with the spatial resolution defined in
param.par. The script is called by DIVA3D/divastripped/divafit (for CL) and/or
by DIVA3D/divastripped/diva3Dsnop (for SNR, only called when working in 3 or
4D) if the parameter “binning” is set to the value “1” in these scripts (at the beginning). The
purpose of this optional binning is to improve the quality of the parameters (CL and/or SNR)
optimization by averaging a part of the highly correlated observations (taken by a boat in a
restricted area, for instance).
7.3.4 divacv
divacv carries out a cross validation, point by point, without new matrix inversions.
7.3.5 divacvrand
divacv runs a cross validation by sub-samples of points.
Note that in the present version (Diva-4.3), tools divacv and divacvrand do not adapt the
error norm to include the relative weights on data. This will be introduced in the next versions.
7.4
Format conversion tools
7.4.1 ncdf2gher
ncdf2gher performs a format conversion from a 2D NETCDF file to a file in GHER format,
with its info file (ASCII). The netcdf file myfield.nc has to be placed in input. Its axis
have to be “lon” and “lat” or “LON” and “LAT”. Only one variable (myfield, i.e. the name of
your field) is accepted.
To launch the conversion, just type
[sylvain@gher-diva DIVA3D/divastripped] ./ncdf2gher myfield
Your variable “myfield” will then be stored into a gher format file named myfield.grd and
its info file myfieldInfo.dat. These two files are in input and have the same form and
conventions as topo.grd and TopoInfo.dat. By default, the exclusion value will be 106 .
7.4.2 gher2ncdf
gher2ncdf performs a format conversion from a file in GHER format, with its info file
(ASCII) to a 2D NETCDF file. The gher file myfield.grd has to be placed in input, as
well as its info file myfieldInfo.dat. These two files have the same form and conventions
as topo.grd and TopoInfo.dat.
81
Chapter 7. PREPARATION OF THE INPUT
FILES
7.5. Misc
To launch the conversion, just type
[sylvain@gher-diva DIVA3D/divastripped] ./gher2ncdf myfield
Your variable “myfield” will then be stored into a netcdf file named myfield.nc. Its axis
will be “lon” and “lat”. The exclusion value will be the same as in gher file. Only one variable
(myfield, i.e. the name of your field) is accepted.
7.5
Misc
7.5.1 divaclean
divaclean cleans up the working directories by removing fort.* files from divawork
and meshgenwork, as well as output files from output.
7.5.2 divadataclean
Script divadataclean takes the input data ./input/data.dat and eliminates all data
that fall outside the bounding box of the contours (i.e., the rectangle containing the analysis
mesh). This avoids loading unnecessary large input files. If two additional arguments n1 n2 are
added, data values falling outside the range specified by n1 , n2 are also eliminated.
Example:
[charles@gher13 divastripped] divadataclean -3 35
will remove all data points of which the value is not between −3 and 35.
The output overwrites ./input/data.dat but keeps the original one in ./input/ with
the name data.dat.full. The tool should be used just after having loaded the data set
(typically after divaload).
7.5.3 divaload
divaload loads input files from the chosen directory into divastripped/input/. You
just have to specify the directory where your input files are located (relative or absolute paths).
It is assumed that the input files are located in a folder input within the chosen directory.
Example:
[charles@gher13 divastripped] divaload ~/DIVA/test/
will load the files from ~/DIVA/test/input.
Tips 7.4 When you want to know to which correspond the data present in the input directory,
simply read the content of the file input/casename; it indicates the repertory from which
you loaded input files with command divaload.
82
Chapter 7. PREPARATION OF THE INPUT
FILES
7.5. Misc
7.5.4 divacck
divacck checks your initial contour file ./output/coast.cont. In output ./output/coast.cont.checked you will find a thinned contour based on the length scale, where the
possible couples of identical points are eliminated.
Application of divacck is normally not necessary if you created the contours with divacont.
83
8 R UNNING
ANALYSIS
Once all the input files are prepared, you are ready to create analysed gridded fields. The whole
procedure is described in the present chapter.
Contents
8.1
8.2
8.3
8.4
8.5
8.6
8.1
Running a simple analysis . . . . . . . . . . . . . . . . . . . . . . . . . . .
84
8.1.1
divadress . . . . . . . . . . . . . . . . . . . . . . . . . . . . . .
84
8.1.2
divamesh . . . . . . . . . . . . . . . . . . . . . . . . . . . . . . .
85
8.1.3
divacalc . . . . . . . . . . . . . . . . . . . . . . . . . . . . . . .
86
Quality control of data . . . . . . . . . . . . . . . . . . . . . . . . . . . .
88
8.2.1
Tools . . . . . . . . . . . . . . . . . . . . . . . . . . . . . . . . . .
88
8.2.2
Output files . . . . . . . . . . . . . . . . . . . . . . . . . . . . . . .
89
Running a semi-normed analysis . . . . . . . . . . . . . . . . . . . . . . .
89
8.3.1
divarefe . . . . . . . . . . . . . . . . . . . . . . . . . . . . . . .
89
8.3.2
divaanom . . . . . . . . . . . . . . . . . . . . . . . . . . . . . . .
90
8.3.3
divacalc . . . . . . . . . . . . . . . . . . . . . . . . . . . . . . .
90
8.3.4
divasumup . . . . . . . . . . . . . . . . . . . . . . . . . . . . . .
90
Extras . . . . . . . . . . . . . . . . . . . . . . . . . . . . . . . . . . . . . .
90
8.4.1
Saving outputs . . . . . . . . . . . . . . . . . . . . . . . . . . . . .
90
8.4.2
Checking of installation . . . . . . . . . . . . . . . . . . . . . . . .
90
Analysis with advection constraint activated . . . . . . . . . . . . . . . .
91
8.5.1
Interplay with coordinate change on . . . . . . . . . . . . . . . . . .
91
Summary: typical execution chains . . . . . . . . . . . . . . . . . . . . .
96
8.6.1
Simple analysis . . . . . . . . . . . . . . . . . . . . . . . . . . . . .
96
8.6.2
Analysis with evaluation of parameters . . . . . . . . . . . . . . . .
97
8.6.3
Analysis Relative Length (RL) Fields . . . . . . . . . . . . . . . . .
97
Running a simple analysis
8.1.1 divadress
The simplest procedure to carry out an analysis with Diva is using the command divadress,
which performs the four following operations:
1. divaclean
2. divamesh
84
Chapter 8. RUNNING ANALYSIS
8.1. Running a simple analysis
3. divacalc
4. divaqcbis
8.1.2 divamesh
Generates the finite-element mesh based on contour(s) specified in file coast.cont and correlation length provided in param.par; remember that the correlation length shall have an
appropriate value in order to obtain a correct mesh:
• Contour segments should not be much smaller than finite element length; if your contour
is too fine, the tool divacck can be used in order to reduce the contour resolution.
• The typical length of a finite element should be smaller than the correlation length, otherwise the grid would be too coarse compared to the signal to resolve.
Figure 8.1: Mesh on a simple
domain.
Note that since version Diva-4.3, mesh generation takes into account coordinate change (specified by icoord) so that meshes are uniform in the transformed domain.
Mesh with different element sizes
You also have the possibility to create of mesh of which the size of the elements varies over the
domain. To this aim, you have to create a mesh density file that indicates what length scale has
to be applied in a determined region. This file is named coast.cont.dens and has to be
placed in divastripped/input/.
We considered the simple island case, of which the contour file given by
We choose a value of 2.5 for the global mesh (specified in param.par) and define a finer
mesh around the island through the following coast.cont.dens file:
85
Chapter 8. RUNNING ANALYSIS
2
4
0
5
5
0
4
2
2
3
3
8.1. Running a simple analysis
0
0
5
5
2
3
3
2
Example file 8.1: coast.cont
1
0.125 4
1 1
4 1
4 4
1 4
Example file 8.2: coast.cont.dens
which means that we want a length scale of 0.125 in the domain defined by by the four points
(1 1), (4 1), (4 4), (1 4). Be sure that the domain where you want to have a finer mesh is on
the left when following the contour. The mesh generated with these conditions is presented on
Fig. 8.2.
8.1.3 divacalc
divacalc is the script that runs the analysis by solving the variational principle over the
domain of interest. To work properly, it needs a data file, a parameter file, and a finite-element
mesh.
Tips 8.1 As the mesh generation is often the most time-consuming part of a Diva execution,
remember that once you have created the mesh, you do need to run divadress each time you
want a new analysis, but just divacalc.
86
Chapter 8. RUNNING ANALYSIS
8.1. Running a simple analysis
Figure 8.2: Mesh refinement around the island.
87
Chapter 8. RUNNING ANALYSIS
8.2. Quality control of data
Figure 8.3: Example of analysed field.
Output files
• fieldgher.anl and errorfieldgher.anl are respectively the analysis and the
error fields (in gher format) on the regular grid specified in param.par;
• fieldascii.anl and errorfieldascii.anl are the same as fieldgher.anl
and errorfieldgher.anl, but in ascii format;
• valatxyascii.anl and erroratxyascii.anl give respectively the values of
the analysis and the error fields at the points specified in file valatxy.coord;
• fieldatdatapoint.anl and erroratdatapoint.anl are respectively the analysis and error fields computed at the data points (i.e. the points from data.dat);
• results.nc (located in ./output/ghertonetcdf) is a NetCDF file containing
the gridded analysis and error fields (provided error calculation is switched on).
8.2
Quality control of data
According to theoretical developments of Chapter 3, quality control with Diva can be performed
using to one of the three criteria (3.24), (3.25) or (3.26), respectively implemented in Diva with
divaqc, divaqcbis and divaqcter.
8.2.1
Tools
There are three tools to perform QC:
divaqc: it is the most expensive version of QC, since Aii must be evaluated by analysis of
vectors with zeros everywhere, except at the ith position.
88
8.3. Running a semi-normed
analysis
Chapter 8. RUNNING ANALYSIS
divaqcbis: this version of the QC is quicker, as we replace Aii by its average
1
trace (A).
N
divaqcter: the last criterion implemented is based on the RMS value of the misfit and the
generalized cross validator Θ.
8.2.2
Output files
The corresponding outputs are given in outliers.dat, outliersbis.dat and outlierster.dat. The modules divaqc* also generate outliers*.normalized.dat,
which contain, in a sorted way (from the most suspect data to less suspect), the possible outliers
from the normalized misfits test (3.29).
Tips 8.2 By default, the criterion used in divadress is divaqcbis, but you can change
it by editing the file divadress and replacing divaqcbis by one of the other quality test
(divaqc or divaqcter).
8.3
Running a semi-normed analysis
A semi-normed analysis consists of four steps:
1. create a so-called reference field, which will act as background field (Section 2.1.2);
2. subtract the reference field from the data values in order to work with anomalies;
3. perform an analysis on the anomalies;
4. reconstruct the field by adding the analysed anomaly field to the background (reference)
field.
These four steps are executed by running script divaseminorm and the implemented tools
described hereinafter. Note that the parameters written in the original param.par file will be
used during the analysis on the anomalies. Thus it is advised to specify ireg=0, so that no
background field will be subtracted from the anomaly.
8.3.1 divarefe
This script performs an analysis on your original data, but modify the analysis parameters: L is
multiplied by 5 and λ by 0.1.
Output files
They are the same as those created through an execution of divacalc, but assigned with a suffix .ref: fieldgher.anl.ref, fieldascii.anl.ref, valatxyascii.anl.ref
and fieldatdatapoint.anl.ref.
89
Chapter 8. RUNNING ANALYSIS
8.4. Extras
8.3.2 divaanom
The script use file fieldatdatapoint.anl.ref to compute the difference between data
and analysed (reference) field to obtain anomalies.
Output files
File data.dat contains anomalies instead of the original data, while file data.dat.full
is the copy of your original data file.
8.3.3 divacalc
This command was previously described (Section 8.1.3). The only difference is that it is applied
here on anomalies.
8.3.4 divasumup
divasumup performs the last step of a semi-normed analysis: the sum of background field
and analysed anomaly field.
Output files
They are the same as those created through an execution of divacalc. Note that after an
execution of divasumup, data.dat contains the original data, while data.dat.anom
contains the previously computed anomalies.
8.4
8.4.1
Extras
Saving outputs
divasave is designed for saving the outputs in the folder output to the chosen directory.
Example:
[charles@gher13 divastripped] divasave ~/DIVA/test/
will save the files into ~/DIVA/test/
8.4.2
Checking of installation
divacheck makes the comparison of analysis results with reference analysis (for installation
check, compiler option testing or checking of new versions)
90
8.5. Analysis with advection
constraint activated
Chapter 8. RUNNING ANALYSIS
8.5
Analysis with advection constraint activated
The input files needed for such analysis are the same as for a basic analysis, except that you
need to provide a velocity (or pseudo-velocity) field, specified through the following files:
• Uvel.dat and Vvel.dat, which contain the two components of the velocity. They
have the same format (binary) as fieldgher.anl. An example of generation of such
files is in the test case advectiontest.
• UVinfo.dat, which specifies the grid on which the velocity field is defined. It has the
same format as GridInfo.dat or TopoInfo.dat).
• constraint.dat, which activates the advection constraint and contains parameters θ
and A. Refer to Chapter 5 for theoretical details.
-3.
-3.
0.100000001
0.100000001
61
61
Example file 8.3: UVinfo.dat
100 0.0
Example file 8.4: constraint.dat
8.5.1
Interplay with coordinate change on
In this example, we work on a region [−1, 1] × [59, 61] with L = 0.2 and λ = 1.
With no coordinate change (i.e., icoordchange=0 in param.par), coordinates are taken
as such and a single point in the center leads to an analysis that is circular when axes on x and
y are drawn with equal scales (Fig. 8.4).
91
8.5. Analysis with advection
constraint activated
Chapter 8. RUNNING ANALYSIS
Figure 8.4: Analysis without coordinate change.
On the other hand, if coordinate change is on (i.e., icoordchange=1 in param.par), the
analysis is isotropic in the real space.
At 60◦ North, a degree E-W covers half the real distance of a degree S-N. On a graph scaled so
that x and y are distances, the analysis is again isotropic (this is the desired effect). If you plot
the same analysis with x and y axes equally spaced in degrees (as for the previous case), you
will obviously get an ellipse (Fig. 8.5, left).
92
8.5. Analysis with advection
constraint activated
Chapter 8. RUNNING ANALYSIS
Figure 8.5: Analysis with coordinate change: the two figures represent the same field, but are drawn with
different scales for the axes.
If we add an advection constraint characterized by u = v = 1(m/s), the case with no coordinate
change leads to a signal along the bisector (Fig. 8.6).
Figure 8.6: Analysis with advection but
without coordinate change.
93
8.5. Analysis with advection
constraint activated
Chapter 8. RUNNING ANALYSIS
If coordinate change is activated, the advection direction in real space is not any more along the
bisector in degrees, but in km (Fig. 8.7). Note that the advection constraint scales the overall
velocity, so that a coordinate change does not change the intensity of the advection constraint,
but only its direction.
Figure 8.7: Analysis with advection and coordinate change.
94
8.5. Analysis with advection
constraint activated
Chapter 8. RUNNING ANALYSIS
Figure 8.8: .
Note that the diffusion coefficient is not changed. If this coefficient is given in Cartesian coordinates (in this case, it must be specified in m2 /s if velocities are in m/s) but you provide input
in degrees and do not set icoord=1, the diffusion coefficient is basically overestimated by a
factor 105 .
For example, in the grid with icoord=0 we can activate diffusion
95
8.6. Summary: typical execution
chains
Chapter 8. RUNNING ANALYSIS
Figure 8.9: Diffusion coefficient divided by 110000 compared to the icoord=1 case.
With no coordinate change, input values are taken as is. To recover a similar (but tilded and
boundary modified) solution, we have to change manually the coefficient and divide by 110000
(degrees to meter scaling) so that the actual Reynolds number remains the same.
8.6
8.6.1
Summary: typical execution chains
Simple analysis
It is assumed that all the input files are already prepared and the parameters correctly assigned.
1. divaload your_directory
2. divadress
3. divasave your_directory
96
8.6. Summary: typical execution
chains
Chapter 8. RUNNING ANALYSIS
8.6.2
Analysis with evaluation of parameters
You start with correct data and contour file, but with parameters file that needs to be adapted.
1. divaload your_directory
2. divafit -r
to compute the correlation length and replace its value in param.par;
3. divagcv -r
to compute the signal-to-noise ration and variance of the background
field, and replace them in param.par;
4. divadress
5. divasave your_directory
8.6.3
Analysis Relative Length (RL) Fields
To perform analysis using “variable correlation length” on the considered domain, one can
provide the “Relative Length” field in the input.
“Relative Length” field can be produced by Diva on basis of data distribution using divadacoverge,
or on basis of a mask netcdf file mask.nc provided in input using dvncmask2RL. The
mask netcdf file must be written as shown in example 8.5.
An analysis using RL field based on a mask field provided in input, may be performed as
follow:
1. divaload your_directory
2. dvncmask2RL
to write RL.dat and RLInfo.dat in input;
3. divadress
4. divasave your_directory
netcdf mask
dimensions:
lon = 100 ;
lat = 100 ;
variables:
float lon(lon) ;
float lat(lat) ;
float mask(lat, lon) ;
Example file 8.5: Header of mask netcdf file mask.nc.
97
9 P OSTPROCESSING
TOOLS
Various tools are available for visualization and processing of the gridded fields; some of them
are presented in the following sections. It is up to the user to utilize his favourite drawing
tools for representing the numerical results. Nevertheless, we provide several basic tools easily
adaptable to facilitate the task.
Contents
9.1
9.2
9.3
9.4
9.1
Gnuplot . . . . . . . . . . . . . . . . . . . . . . . . . . . . . . . . . . . . .
98
9.1.1
Installation . . . . . . . . . . . . . . . . . . . . . . . . . . . . . . .
99
9.1.2
Utilization . . . . . . . . . . . . . . . . . . . . . . . . . . . . . . . 100
Matlab/ Octave . . . . . . . . . . . . . . . . . . . . . . . . . . . . . . . . . 100
9.2.1
Installation . . . . . . . . . . . . . . . . . . . . . . . . . . . . . . . 100
9.2.2
Tools description . . . . . . . . . . . . . . . . . . . . . . . . . . . . 102
9.2.3
Examples of use . . . . . . . . . . . . . . . . . . . . . . . . . . . . 102
Python . . . . . . . . . . . . . . . . . . . . . . . . . . . . . . . . . . . . . 104
9.3.1
Installation . . . . . . . . . . . . . . . . . . . . . . . . . . . . . . . 104
9.3.2
Usage . . . . . . . . . . . . . . . . . . . . . . . . . . . . . . . . . . 105
NetCDF visualization tools . . . . . . . . . . . . . . . . . . . . . . . . . . 106
9.4.1
Ocean Data View . . . . . . . . . . . . . . . . . . . . . . . . . . . . 106
9.4.2
NcBrowse . . . . . . . . . . . . . . . . . . . . . . . . . . . . . . . . 106
9.4.3
Ncview . . . . . . . . . . . . . . . . . . . . . . . . . . . . . . . . . 106
Gnuplot
Gnuplot is a free portable command-line driven interactive data and function plotting utility,
available for various platforms (http://www.gnuplot.info/). We provide some routines for plotting
Diva inputs and outputs (data, contour, mesh, analysis etc) with the help of this tool. Running
divagnu makes plots in png format.
Tips 9.1 Plots provided by gnuplotare made to help the user to have a quick look at the results,
immediately after the execution. However, these plots are not always suitable for publications
or diffusion. The user is invited to create his own post-processing tools based on the examples
provided in the next sections.
Tips 9.2 If you need larger fonts, on some systems they are available and you can edit the
plotting program gnuwork\divaplotall and replace the driver definition by
echo set terminal png transparent giant font system 14 size 1920,1540 crop \#ffffff >> bidon
98
Chapter 9. POSTPROCESSING TOOLS
9.1. Gnuplot
Tips 9.3 If you do not need all plots but only a few (eg. analysis, error and coastline) of
them you can edit the plotting program gnuwork\divaplotall and replace the script line
for i in ‘ls diva_*‘
by
for i in diva_analysis diva_error diva_coastline
9.1.1
Installation
gnuplotcan be easily downloaded for windows systems on the web page http://www.gnuplot.info.
For Cygwin users, there are two possibilities:
1. you do not have X Windows System installed: in this case, it is advised to only install
wgnuplot, available at
http://downloads.sourceforge.net/gnuplot/gp422win32.zip for version 4.22.
Once you have downloaded it, just unzip the folder in the location of your choice (provided it is located on the path of your system). The gnuplot window is activated either
by typing wgnuplot in the Cygwin shell, or by creating a short-cut on your desktop to
the executable wgnuplot.exe
Figure 9.1: Gnuplot window.
2. X Windows System is already installed: run again the Cygwin setup.exe (for downloading and updating your Cygwin installation); in the "Select Packages" screen, look for
the "Math" entry, select gnuplot and choose "‘install". Once this installation is finished,
gnuplot is launched from a XWin (obtained after typing startx) window by typing
gnuplot.
99
9.2. Matlab/ Octave
Chapter 9. POSTPROCESSING TOOLS
Figure 9.2: Installing gnuplot
with cygwin.
9.1.2
Utilization
Normally Fortran sources (forgnuplot*.f) have been compiled during the Diva installation
and executables placed into DIVA3D/bin/.
In directory divastripped/gnuwork/, edit divaplotall and adapt the header so that
gplot indicates the correct path to your gnuplotexecutable.
Example:
#====================================================
# ADAPT the following to the gnuplot executable
gplot=/cygdrive/c/cygwin/usr/gnuplot/bin/wgnuplot.exe
#====================================================
From divastripped, after running an analysis, type divagnu: this will create the figures
in directory gnuwork/plots/. Note that divagnu will try to create all the possible figures,
even if the corresponding script was not run, e.g., plot of outliers when no outlier detection was
performed. This is why so many error messages are written on the screen, but you do not have
to take them into account.
Here are some examples of plots created with gnuplot:
9.2 Matlab/ Octave
Tools to display contours, data, meshes, analysis and error fields are available at http://modb.oce.
ulg.ac.be/mediawiki/index.php/Diva_matlab.
9.2.1
Installation
Download and extract the archives Diva_matlab.tar.gz and matlab_example.tar.gz
100
9.2. Matlab/ Octave
Chapter 9. POSTPROCESSING TOOLS
(a) Data and coastline
(b) Filled coastline
(c) Mesh
(d) Numbered mesh
(e) Analysis
(f) Error and data locations
Figure 9.3: Visualization with gnuplot.
101
9.2. Matlab/ Octave
Chapter 9. POSTPROCESSING TOOLS
tar -xvf Diva_matlab.tar.gz
tar -xvf Diva_matlab_example.tar.gz
In order to have the routines working properly, you need to install:
NetCDF toolbox, for reading the result files. For recent versions of Matlab, the routines for
reading/writing NetCDF are readily available. For older versions, you can install it from
http://mexcdf.sourceforge.net/downloads/.
m_map toolbox: optional but recommended, it allows one to plot generate various plots (mesh,
data, analysis) using coastlines, projections etc (http://www.eos.ubc.ca/~rich/map.html).
9.2.2
Tools description
Table 9.1: Matlab programs for plotting. Set mmapflag=1 if the m_map toolbox is installed. valex
stands for exclusion value.
Routine
Mandatory input(s)
Optional input(s)
Utility
diva_contour.m
diva_mesh.m
diva_data_positions.m
diva_data.m
diva_analysis.m
contourfile
meshfile, meshtopofile
datafile
datafile
resultfile
mmapflag
mmapflag
dotsize, mmapflag
dotsize, mmapflag
valex, mmapflag
Plot contour
Plot mesh
Plot data locations
Plot data values
Plot the analyzed field
9.2.3
Examples of use
Open a Matlab session and set the path to the directory containing the function:
addpath(’path_to_functions’)
Define the input files:
exampledir
contourfile
datafile
meshfile
meshtopofile
resultfile
=
=
=
=
=
=
path_to_example_directory;
[exampledir,’/coast.cont’];
[exampledir,’/data.dat’];
[exampledir,’/mesh.dat’];
[exampledir,’/meshtopo.dat’];
[exampledir,’/results.nc’];
Execute the different commands:
• Plot the contour:
diva_contour(contourfile);
102
9.2. Matlab/ Octave
Chapter 9. POSTPROCESSING TOOLS
• Plot the finite-element mesh:
diva_mesh(meshtopofile,meshfile);
• Plot the data positions:
diva_data_positions(datafile);
• Plot the data (with values):
diva_data(datafile);
colorbar;
• Plot the analysis:
diva_analysis(resultfile);
colorbar;
The resulting figures (without the m_map option) are shown below.
103
Chapter 9. POSTPROCESSING TOOLS
9.3. Python
(a) Data
(b) Mesh
(c) Analysis
(d) Outliers
Figure 9.4: Examples of figures created with Diva-Matlab toolbox.
9.3
Python
Python (http://www.python.org/) is a object-oriented, free to use, programming language. It is
directly available through the package manager of recent Linux distributions.
9.3.1
Installation
Download and extract the archive Diva_Python_tools_v1.0.tar.gz
tar -xvf Diva_Python_tools_v1.0.tar.gz
To have example files to test, extract the files from matlab_example.tar.gz (the same
files used in the previous section) inside the python directory:
104
Chapter 9. POSTPROCESSING TOOLS
9.3. Python
ctroupin@gher13 cd Diva_Python_tools_v1.0
ctroupin@gher13 tar -xvf Diva_matlab_example.tar.gz
Along with Python, it is necessary to install:
NumPy www.numpy.org, a package for scientific computing;
SciPy (http://www.scipy.org/), another package for science and engineering;
matplotlib (http://matplotlib.org/), a 2D plotting library, where one can find the basemap toolkit
(https://pypi.python.org/pypi/basemap) particularly useful for plot data on map projection
(somewhat equivalent to m_map in Matlab).
netcdf4-python (http://code.google.com/p/netcdf4-python/), the Python/numpy interface to netCDF.
Under Linux, the first three items are available with the package manager. The NetCDF interface requires a manual installation.
• Download the archive from http://code.google.com/p/netcdf4-python/downloads/list
• Check the sha1 sum and extract the archive:
ctroupin@gher13 ~/Software $ sha1sum netCDF4-1.0.4.tar.gz
cd1735a69446e558ba55034f184ee5f3d44d1a44 netCDF4-1.0.4.tar
.gz
ctroupin@gher13 ~/Software $ tar -xvf netCDF4-1.0.4.tar.gz
ctroupin@gher13 ~/Software $ cd netCDF4-1.0.4/
• Follow the instruction written in file README:
ctroupin@gher13 ~/Software python setup.py build
ctroupin@gher13 ~/Software python setup.py install
9.3.2
Usage
Edit the files if necessary and run Python (either in a shell, or using a Python editor). An
example of plots is shown in Fig. 9.5.
ctroupin@gher13 ~/ Diva_Python_tools_v1.0 python diva_plot_mesh
.py
105
Chapter 9. POSTPROCESSING TOOLS
7°W
2°W
3°E
8°E
13°E
18°E
23°E
28°E
9.4. NetCDF visualization tools
7°W 2°W 3°E 8°E 13°E 18°E 23°E 28°E 33°E
33°E
42°N
39°N
36°N
33°N
30°N
7°W 2°W 3°E 8°E 13°E 18°E 23°E 28°E 33°E
42°N
39°N
36°N
33°N
30°N
7°W 2°W 3°E 8°E 13°E 18°E 23°E 28°E 33°E
42°N
39°N
36°N
33°N
30°N
42°N
39°N
36°N
33°N
30°N
38.4
38.5
38.6
38.7
38.8
38.9
39.0
39.1
38.42
38.51
38.61
38.70
38.80
38.89
38.99
39.08
Figure 9.5: Examples of figures obtained with the Diva-Python toolbox.
9.4
General NetCDF visualization tools
NetCDF (network Common Data Form) format. It is an machine-independent format to represent scientific data. For more details, consult http://www.unidata.ucar.edu/software/netcdf/.
There are several tools that aim to provide a quick view of the content of a NetCDF files, such
as the analyse and error fields provided by Diva. It is possible to export the results as a figure,
but generally these software do not offer the possibility to customize the plots as could be done
with the previous tools.
9.4.1
Ocean Data View
Among the numerous possibilities offered by ODV, there is a tool for accessing and visualizing
local or remote NetCDF files (Schlitzer, 2012, Chapter 13).
9.4.2
NcBrowse
NcBrowse is available at http://www.epic.noaa.gov/java/ncBrowse/ and works with both Linux and
Windows O.S.
9.4.3
Ncview
Ncview (Linux and Windows + Cygwin) is available at
http://meteora.ucsd.edu/~pierce/ncview_home_page.html
but requires the NetCDF library to be compiled with your own system configuration.
106
Chapter 9. POSTPROCESSING TOOLS
9.4. NetCDF visualization tools
Figure 9.6: Plots of results with NcBrowse.
107
Chapter 9. POSTPROCESSING TOOLS
9.4. NetCDF visualization tools
Installation under Linux
Recent Linux distribution already permits the installation of Ncview through their package manager. Should it not be the case, the last version of Ncview is available here: ftp://cirrus.ucsd.edu/
pub/ncview/ncview-2.1.2.tar.gz
Installation under Windows-Cygwin
Install and build the last NetCDF version for Unix: download the latest release and build as
with Unix. The latest release is tested under Cygwin and passes all tests cleanly. To build under
Cygwin, follow the Unix build instructions in a Cygwin shell. The -enable-shared option
to configure will generate the netcdf.dll.
• Copy http://www.unidata.ucar.edu/downloads/netcdf/netcdf-3_6_2/index.jsp into directory of
your choice
• Unzip the folder and type:
[charles@gher13 Software]
./configure
...
make check..
...
make install
• download Ncview and unzip the folder
• type
[charles@gher13 Software]
./configure
...
make
...
make install
• type startx (check if you have installed Xfree) and in the newly opened window, type
ncview name_of_the_file.nc
• if the procedure is correctly followed, you should obtain windows similar to Fig. 9.7.
108
Chapter 9. POSTPROCESSING TOOLS
9.4. NetCDF visualization tools
Figure 9.7: Plots of results with Ncview.
109
10 R EALISTIC
EXAMPLES
A few examples with real data are described in this chapter. They can act as model for users
who need to perform such kind of analysis.
Contents
10.1 Complete example . . . . . . . . . . . . . . . . . . . . . . . . . . . . . . . 111
10.1.1 Preparation of the input files . . . . . . . . . . . . . . . . . . . . . . 111
10.1.2 Parameters determination . . . . . . . . . . . . . . . . . . . . . . . . 113
10.1.3 Contour checking . . . . . . . . . . . . . . . . . . . . . . . . . . . . 114
10.1.4 Mesh creation . . . . . . . . . . . . . . . . . . . . . . . . . . . . . . 114
10.1.5 Generalised Cross Validation . . . . . . . . . . . . . . . . . . . . . . 115
10.1.6 Analysis
. . . . . . . . . . . . . . . . . . . . . . . . . . . . . . . . 115
10.2 Analysis of profiles from a cruise . . . . . . . . . . . . . . . . . . . . . . . 118
10.2.1 Creation of the contour . . . . . . . . . . . . . . . . . . . . . . . . . 118
10.2.2 Mesh generation . . . . . . . . . . . . . . . . . . . . . . . . . . . . 118
10.2.3 Analysis
. . . . . . . . . . . . . . . . . . . . . . . . . . . . . . . . 120
10.3 Analysis of data from a transect . . . . . . . . . . . . . . . . . . . . . . . 120
10.3.1 Data . . . . . . . . . . . . . . . . . . . . . . . . . . . . . . . . . . . 120
10.3.2 Contour creation . . . . . . . . . . . . . . . . . . . . . . . . . . . . 121
10.3.3 Mesh . . . . . . . . . . . . . . . . . . . . . . . . . . . . . . . . . . 122
10.3.4 Analysis
. . . . . . . . . . . . . . . . . . . . . . . . . . . . . . . . 124
10.4 Advection constraint . . . . . . . . . . . . . . . . . . . . . . . . . . . . . . 125
110
Chapter 10. REALISTIC EXAMPLES
10.1
10.1. Complete example
Complete example
We present here a complete 2-D case treated in command-line. This example is taken from
Troupin et al. (2012).
10.1.1
Preparation of the input files
To perform an analysis, you will need:
• a contour file (coast.cont),
• a data file (data.dat),
• a list of run parameters (param.par) and
• the locations of the points where you want to know the value of the analysed field
(valatxy.coord).
Examples of these files are given in Chapter 6.
We recommend to create a new directory (let us call it case1) for each case you will treat and
within this directory, two sub-directories name input and output. The four input files are then
placed in case1/input/.
Let us assume that you created case1 in ~/Examples/. To copy them into the divastripped/input/ directory, use the command:
bash-3.2$ divaload ../case1
Data
In this example we work with salinity measurements in the Mediterranean Sea at a depth of
30 m in September, for the 1980-1990 period (Fig. 10.1). The data set is built up by exploiting
the SeaDataNet portal (http://www.seadatanet.org) and the World Ocean Database 2009 (WOD09,
Boyer et al., 2009) and contains 1061 data points.
Parameters
We start with the parameter file 10.1: the regular grid for the analysis extends from 7◦ W
to 36◦ E and from 30◦ 15’N to 45◦ 45’N, with a horizontal resolution of about 10 km. The
icoordchange parameter is set to 2, meaning that a cosine projection will be used for the
coordinates.
111
Chapter 10. REALISTIC EXAMPLES
10.1. Complete example
# Correlation Length lc in km or degree??? according to param icoordchange
2
# icoordchange
2
# ispec (output files required, comments to come)
0
# ireg
2
# xori (origin of output regular grid, min values of X)
-7
# yori (origin of output regular grid, min values of Y)
30.25
# dx (step of output grid)
0.09
# dy (step of output grid)
0.0625
# nx max x of output grid
500
# ny max y of output grid
250
# valex (exclusion value)
-99
# snr signal to noise ratio
1
# varbak variance of the background field 2.5
1
Example file 10.1: First version of param.par
112
Chapter 10. REALISTIC EXAMPLES
10.1. Complete example
Contours
The land-sea contours are created from the GEBCO bathymetry. The Black Sea and the Atlantic
Ocean were masked in order to concentrate only on the Mediterranean Sea properties.
0o
9oE
18oE
27oE
36oE
o
45 N
42oN
39oN
36oN
33oN
36
36.5
37
37.5
38
38.5
39
39.5
Figure 10.1: Finite-element mesh and salinity measurements used for the application.
10.1.2
Parameters determination
Correlation length
The toold divafit will provide a first guess of the parameters λ and L. It will generates the
output files:
covariance.dat: contains distances between points, the covariance and the number of data
couples used to estimate the covariance.
covariancefit.dat: contains the distance between points, the data-covariance and the
fitted covariance.
paramfit.dat: contains estimates for the correlation length L and for the signal-to-noise
ratio λ. You can manually replace the old values of λ and L in param.par by the new
ones from paramfit.dat.
If you want the new L value to be automatically replaced, type
bash-3.2$ divafit -r
113
Chapter 10. REALISTIC EXAMPLES
10.1. Complete example
Correlation length
1.3565110
Signal to noise ratio
0.72524220
VARBAK
4.59391139E-02
Quality of the fit (0: bad 1: good)
0.85546345970344528
For information: correlation length in km is
151.44691
Example file 10.2: paramfit.dat
The fit yields the value L = 1.36◦ (' 151 km).
data covariance
data used for fitting
fitted curve
0.075
Covariance
0.05
0.025
0
0
100
200
Distance (km)
300
Figure 10.2: Fit of the data correlation to the theoretical kernel (dashed line).
10.1.3
Contour checking (optional)
If you want to check the contour file you want to use to generate the mesh, type divacck. The
output coast.cont.checked is a thinned contour based on the length scale. Then simply
copy the new contour into the input directory:
bash-3.2$ cp ./output/coast.cont.checked ./input/contour.cont
10.1.4
Mesh creation
Simply type divamesh to perform the mesh generation. All the parameters needed by Diva
are contained in coast.cont, param.par and coast.cont.dens if you work with a
non-uniform mesh. The mesh corresponding to this example is shown in Fig. 10.1. For the
sake of visibility, the mesh was generated with a rather long characteristic scale: the correlation
length was set to 3◦ , meaning the typical length of triangle edge is about 1◦
114
Chapter 10. REALISTIC EXAMPLES
10.1.5
10.1. Complete example
Generalised Cross Validation
As described in Section 7.3, there are three tools to get an estimate of the signal-to-noise ratio:
divagcv, divacv and divacvrand. For these tools to work, one has to provide an input
file gvcsampling.dat (see example file 10.3) containing a list of values for the signal-tonoise ratio on which the estimator is tried.
0.1
0.3
0.6
1
3
6
10
30
Example file 10.3: gvcsampling.dat.
Estimated values for the parameters are given in gcvsnvar.dat (example file 10.4). You can
then modify param.par (example file 10.5) according to these values before performing an
analysis.
S/N S/N S/N
30.00000
2.625988 3.359623
VARBAK VARBAK VARBAK
0.1011484
7.5680271E-02 8.1069477E-02
Example file 10.4: gcvsnvar.dat files obtained with divagcv, divacv and divacvrand.
10.1.6
Analysis
Diva analysis is executed by typing divacalc. It not only provides the analysed field, but
also the error field if varbak is not equal to zero. Results are presented in Fig. 10.3.
115
Chapter 10. REALISTIC EXAMPLES
10.1. Complete example
# Lc: correlation length (in units coherent with your data)
1.3565110
# icoordchange
1
# ispec
3
# ireg
1
# xori: x-coordinate of the first grid point of the output
-10.0
# yori: y-coordinate of the first grid point of the output
30
# dx: step of output grid
0.2
# dy: step of output grid
0.2
# nx: number of grid points in the x-direction
236
# ny: number of grid points in the y-direction
81
# valex: exclusion value
-9999.0
# snr: signal to noise ratio of the whole data set
2.625988
# varbak variance of the background field
7.5680271E-02
Example file 10.5: Adapted version of param.par
116
Chapter 10. REALISTIC EXAMPLES
10.1. Complete example
(a) Analysis
(b) Error
Figure 10.3: Analysed and error fields with L = 1.36◦ and λ = 2.63.
117
10.2. Analysis of profiles from a
cruise
Chapter 10. REALISTIC EXAMPLES
10.2
Analysis of profiles from a cruise
Usually Diva is used in horizontal planes and the coordinate system deals with longitude and
latitude. One may also want to use Diva for interpolating data obtained during a campaign, i.e.,
several profiles along a determinate trajectory. In this case, the user will work in vertical planes:
x−coordinate will be a (curvilinear) distance and y-coordinate will be the depth.
In horizontal planes, domains are physically limited by coastlines, while in vertical planes,
the boundaries will be the sea surface and the bottom. The domain will be closed by artificial vertical lines, for example lines that originate from the first and last stations of the cruise
(Fig. 10.4(b)).
We present hereinafter a complete example for this type of interpolation.
10.2.1
Creation of the contour
Generally the contour generation is easier in this case, since the transect cannot cross islands.
Let us consider a transect that follows the track presented on Fig.10.4. The first step is to
extract topography, which acts as a boundary of our domain. Methods for getting a topography
are detailed in Section 7.1. For the horizontal axes, we worked with the distance computed
with respect to the starting position of the cruise. Other choices are possible, i.e., degrees of
longitude or latitude, distance from a reference point. . .
(a) Localization of the data (triangles) and topography
of the region
(b) Data with limits of the domain
Figure 10.4: Contour generation.
10.2.2
Mesh generation
Since in physical oceanography, vertical length scales (100-1000 m) are much smaller than
horizontal length scales (100-1000 km), an improvement is made if we take into account this
anisotropy. To this end we need estimates of Lx and Ly , the horizontal and vertical length
scales, respectively.
118
10.2. Analysis of profiles from a
cruise
Chapter 10. REALISTIC EXAMPLES
1
24
0.000000
0.000000
0.213350
0.259753
0.303870
0.350149
...
1.108852
1.162687
1.162687
0.000000
-2.766513
-2.058027
-1.956031
-1.960115
-2.044557
-1.895979
-1.804136
0.000000
Example file 10.6: Contour file of Fig. 10.4(b).
The most direct solution is to compute, for Lx , the mean distance between two stations, and
for Ly , the mean distance between two measurements on a same profile. Then we compute the
ratio
r=
Ly
Lx
and multiply the horizontal coordinates by r. This allows one to work with the same length
scale both on vertical and horizontal directions. With the data set from Fig. 10.4(b), we obtain:
Lx = 4.4 km,
Ly = 55 m,
r = 0.0125.
We then compute the length scale with the help of divafit and generate a new mesh, showed
on Fig. 10.5.
Figure 10.5: Mesh generated in the scaled domain.
119
10.3. Analysis of data from a
transect
Chapter 10. REALISTIC EXAMPLES
Use of negative icoordchange
A more direct way to do the previous operation consists in changing the value of icoordchange in file param.par: by assigning a negative value to this parameter, we apply a
scaling on the x coordinate (Sec. 6.2.3). In the present case we would put icoordchange =
-0.0125. Then the classical Diva operations can be done.
10.2.3
Analysis
Once the mesh is created, the analysis is straightforward. The only thing to be aware of is the
specification of the domain in file param.par: as we worked with scaled coordinates when
generating the mesh, we have to do the same when specifying x/yorigin and dx/y. After
the analysis, we may simply multiply the x coordinate by r to recover the original values. The
results are presented on Fig. 10.6.
(a) Reconstructed temperature field
(b) Zoom between 0 and 500 m
Figure 10.6: Results of analysis.
10.3
Analysis of data from a transect
This case is very similar to the previous one. the difference is that here, data are collected along
a trajectory of constant latitude.
10.3.1
Data
The track of the cruise (Fig. 10.7) follows a trajectory of constant latitude (24◦ N) across the
Atlantic Ocean. Salinity for the year 1958 is represented on Fig. 10.8 along with the topography.
120
10.3. Analysis of data from a
transect
Chapter 10. REALISTIC EXAMPLES
Figure 10.7: Transect stations (•) and bottom topography.
10.3.2
Contour creation
We have to convert degrees of longitude into kilometres to be coherent with the units, since the
depth cannot be expressed in degrees. To this end, we used Matlab function distance.m,
which calculates the great circle distances between two points on the surface of a sphere.
Extraction of topography
We extract topography with the help of Matlab function m_tbase.m, which uses 5−minute
TerrainBase database. But any other source of topography suits.
121
10.3. Analysis of data from a
transect
Chapter 10. REALISTIC EXAMPLES
Figure 10.8: Domain and data.
10.3.3
Mesh
Computation of length scales
Similarly to the previous case, we compute horizontal and vertical length scales in order to take
into account the domain anisotropy. Fig. 10.9 illustrates the difference between horizontal and
vertical scales, as we represented the data within the domain with axes graduated in kilometres.
For Lx and Ly , the same definitions as in Section 10.2.2 are used. We find
and the ratio
Lx = 156.76 km,
Ly = 204.40 m,
r = 0.0013.
Computation of correlation length
Correlation length is estimated with the help of divafit, which gives us:
L = 0.433 km.
We generate the mesh (Fig. 10.10) with this value.
122
10.3. Analysis of data from a
transect
Chapter 10. REALISTIC EXAMPLES
Figure 10.9: Data with axes in kilometres.
Figure 10.10: Mesh in the rescaled domain.
123
10.3. Analysis of data from a
transect
Chapter 10. REALISTIC EXAMPLES
10.3.4
Analysis
Specification of the output grid
To be coherent with the scaling we made with the contour, we also have to consider scaled
coordinates when specifying the output locations. Working in this coordinate system, we carry
out an analysis with the following values (in kilometres):
xori
yori
dx
dy
=
=
=
=
0
−6.0
0.01
0.002,
which gives us a 809 × 299 point grid. Results are presented on Figs. 10.11 and 10.12
Figure 10.11: Analysed field.
124
Chapter 10. REALISTIC EXAMPLES
10.4. Advection constraint
Figure 10.12: Analysed field between 500 m and sea surface.
10.4
Advection constraint: Mediterranean Sea
In this example, data points are located on a regular grid with alternate values of −1 and +1. An
analysis with isotropic OI yields the field shown in Fig. 10.13: we obtain a pattern of alternating
circular isolines on the whole domain (land is treated as it was sea). The analysis with Diva
shows the influence of coastlines, as differences between the two cases are more obvious near
coasts (Fig. 10.14).
Figure 10.13: Isotropic OI.
125
Chapter 10. REALISTIC EXAMPLES
10.4. Advection constraint
Figure 10.14: Diva (with coastal effect).
An illustration of the advection constraint is also presented: the velocity field is shown in
Fig. 10.15 and the analysis produces the field of Fig. 10.16.
Figure 10.15: Velocity field used for
the advection constraint in the Mediterranean Sea.
Figure 10.16: Diva with advection (on
full grid, no direct topography, but indirect via advection).
126
Chapter 10. REALISTIC EXAMPLES
10.4. Advection constraint
Figure 10.17: Diva with topography and
advection.
127
11 OTHER
IMPLEMENTATIONS
In addition to the usual way of working with Diva (i.e., command line), there are other possibilities to use it without the installation of the whole code.
Contents
11.1 Diva-on-web . . . . . . . . . . . . . . . . . . . . . . . . . . . . . . . . . . 129
11.1.1 Implementation . . . . . . . . . . . . . . . . . . . . . . . . . . . . . 129
11.1.2 A complete example . . . . . . . . . . . . . . . . . . . . . . . . . . 129
11.1.3 Conditions of use . . . . . . . . . . . . . . . . . . . . . . . . . . . . 131
11.2 Ocean Data View . . . . . . . . . . . . . . . . . . . . . . . . . . . . . . . . 132
11.3 Matlab toolbox . . . . . . . . . . . . . . . . . . . . . . . . . . . . . . . . . 132
11.3.1 Installation . . . . . . . . . . . . . . . . . . . . . . . . . . . . . . . 132
11.3.2 Usage . . . . . . . . . . . . . . . . . . . . . . . . . . . . . . . . . . 133
128
11.1. Diva-on-web
Chapter 11. OTHER IMPLEMENTATIONS
11.1 Diva-on-web
The idea behind Diva-on-web is to provide the possibility for the users to perform interpolations
with Diva without having to install it on their machine. The web interface suits to a single
analysis with a relatively low number of data. For climatologies, which requires the repetition
of numerous analysis, the use of Diva is necessary.
The server is accessible at: http://gher-diva.phys.ulg.ac.be/web-vis/diva.html and a complete description of the interface is found in Barth et al. (2010).
11.1.1
Implementation
The web interface of Diva is based on OpenLayer (http://openlayers.org/) and is OGC-compliant
(Open Geospatial Consortium, http://www.opengeospatial.org/). The server is a 2 quad-core Xeon
E5420 running under Linux. The server and client software are available under GPL. The
Web Map Server use Python language along with the plotting packages matplotlib (http:
//matplotlib.org/) and basemap (http://matplotlib.org/basemap/).
Figure 11.1: Communications between the
server and the client for analysis with Divaon-web.
11.1.2
A complete example
The steps to follow to obtain an analysed field is the following
1. Upload your data file (see Section 6.2.2 for the correct file format).
(Fig. 11.2)
2. Define the analysis grid.
(Fig. 11.3)
3. Select the analysis parameters.
The script divafit provides an estimate for the correlation length
(Fig. 11.4)
(Fig. 11.5)
4. Perform the analysis.
(Fig. 11.6)
129
11.1. Diva-on-web
Chapter 11. OTHER IMPLEMENTATIONS
Figure 11.2: Upload of data.
Figure 11.3: Grid coordinates.
Figure 11.4: Parameters selection.
130
11.1. Diva-on-web
Chapter 11. OTHER IMPLEMENTATIONS
Figure 11.5: Visual results of divafit.
Figure 11.6: Analysis and mask based on relative error.
The outputs are available in various formats (Fig. 11.7): NetCDF, Matlab (or Octave) file,
Keyhole Markup Language (KML) and other image formats.
Figure 11.7: Exportation of the result field in different formats.
11.1.3
Conditions of use
• Open to all users without registration.
131
Chapter 11. OTHER IMPLEMENTATIONS
11.2. Ocean Data View
• CPU time and the number of observations is limited per user, in order to guarantee availability to all. The current maximum CPU time is 10 minutes and the maximum number
of observations is 100000.
11.2
Ocean Data View
Ocean Data View (ODV, Schlitzer, 2002) is a tool for the analysis and visualization of oceanographic data. Among the numerous possibilities ODV, we find the production of gridded fields
based on the original data. Three methods are offered (Schlitzer, 2012):
1. Quick gridding, a weighted averaging algorithm optimized for speed, adapted for situations with millions data points.
2. VG gridding, a more sophisticated weighted averaging algorithm.
3. Diva gridding.
Figure 11.8: Example of VG gridding and Diva gridding with ODV (from Schlitzer (2012)).
Diva gridding is a simplified version of Diva implemented inside ODV, where the user can only
modify a limited number of parameters.
11.3
Matlab toolbox
The Diva Matlab toolbox is an interface to perform 2-D analysis without having to compile the
whole code and to type commands in a terminal.
11.3.1
Installation
Download the package from: http://modb.oce.ulg.ac.be/mediawiki/upload/divaformatlab.zip and unzip the archive:
132
[charles@gher13 Software]$ wget http://modb.oce.ulg.ac.be/
mediawiki/upload/divaformatlab.zip
...
[charles@gher13 Software]$ unzip divaformatlab.zip
The structure is the following:
[charles@gher13 Software]$ tree
.
|-- README
|-- divagrid.m
|-- linux_binaries
|
|-- contourgen.exe
|
|-- diva.exe
|
‘-- generopt.exe
|-- testdivagrid.m
‘-- windows_binaries
|-- contourgen.exe
|-- diva.exe
‘-- generopt.exe
2 directories, 9 files
The main file is divagrid.m, while testdivagrid.m provides a few example of how the
function can be used. Directories linux_binaries and windows_binaries
11.3.2
Usage
The syntax divagrid.m is close to matlab griddata.m function, but has additional parameters.
To run Diva with matlab, divagrid.m has to be in the matlab path as well as the three
executables:
• contourgen.exe
• generopt.exe
• diva.exe
figures (presented in diva workshop and SDN annual meeting
Part III
3-D analysis & climatology production
(GODIVA)
134
12 D IVA 3D
Diva can be used to perform 3D-analysis for a given variable in an oceanic basin. In this case
Diva tools are generally applied to successive horizontal layers at different depths of the basin.
The resulting 2D-field analyses are gathered in 3D binary and NetCDF files.
The working directory to perform 3D-analyses is the same as for 2D-analyses:
diva-4.6.1/DIVA3D/divastripped.
Contents
12.1 Input subdirectories . . . . . . . . . . . . . . . . . . . . . . . . . . . . . . 135
12.1.1 divadata subdirectory . . . . . . . . . . . . . . . . . . . . . . . . . . 135
12.1.2 divaparam subdirectory . . . . . . . . . . . . . . . . . . . . . . . . . 136
12.1.3 More input subdirectories . . . . . . . . . . . . . . . . . . . . . . . 137
12.2 Input info files: contour.depth & 3Dinfo . . . . . . . . . . . . . . . 138
12.2.1 contour.depth . . . . . . . . . . . . . . . . . . . . . . . . . . . 139
12.2.2 The 3Dinfo file . . . . . . . . . . . . . . . . . . . . . . . . . . . . 139
12.3 3D analyses: inputs preparation . . . . . . . . . . . . . . . . . . . . . . . 142
12.3.1 Coast contour files generation . . . . . . . . . . . . . . . . . . . . . 142
12.3.2 Data sets cleaning . . . . . . . . . . . . . . . . . . . . . . . . . . . 143
12.3.3 Parameters optimisation . . . . . . . . . . . . . . . . . . . . . . . . 143
12.4 Performing 3D analyses: diva3Ddress . . . . . . . . . . . . . . . . . . 144
12.4.1 A simple analysis: input files . . . . . . . . . . . . . . . . . . . . . . 144
12.4.2 Diva 3D analysis outputs . . . . . . . . . . . . . . . . . . . . . . . . 147
12.1
Input subdirectories
As described in Section 6.2, to perform a 2D-analysis, one needs to provide a set of input
files in the DIVA3D/divastripped/input/ directory. For 3D-analysis, the input files are
provided in subdirectories of the input directory and in the input directory.
12.1.1
divadata subdirectory
In DIVA3D/divastripped/input/divadata/ all the horizontal 2D data sets to be
analysed are provided and named with regard to the variable name and the depth level number.
135
Chapter 12. DIVA 3D
12.1. Input subdirectories
Convention: The files should be named as var.1xxxx where:
• var is for variable name.
• xxxx is the level number and must be within the range [0001, 9999].
Levels must be numbered from the bottom (lowest xxxx) to the top level (highest
xxxx).
In this subdirectory, data density files related to data set files are stored:
var.1xxxx.DATABINS and var.1xxxx.DATABINSinfo.
Tips 12.1 Density files are automatically generated when performing an analysis.
12.1.2
divaparam subdirectory
In DIVA3D/divastripped/input/divaparam/ are placed the param.par and coast.cont
files, as well as all other input files related to Diva parametrisation. The coast.cont files
are named following the corresponding level depth number. param.par files can be named
following the corresponding variable name and the level depth number or only the level depth
number:
Convention: The files should be named as:
• coast.cont.1xxxx
• param.par or param.par.1xxxx or param.par.var.1xxxx
xxxx is the level number and must be within the range [0001, 9999]. Levels must be
numbered from the bottom (lowest xxxx) to the top level (highest xxxx).
input/divaparam/ content description
It may contain the following files:
coast.cont.1xxxx
param.par.var.1xxxx
RLinfo.dat
CLminmax
valatxy.coord
param.par
RL.var.1xxxx
RL.dat
SNminmax
3Dconstraint
coast.cont.1xxxx: files corresponding to the horizontal levels (as described in 6.2.1) can
be automatically generated by Diva (see Section 12.3).
136
Chapter 12. DIVA 3D
12.1. Input subdirectories
param.par.var.1xxxx files corresponding to the considered variable and horizontal levels
(as described in 6.2.3) with optimised correlation length (L), signal-to-noise ratio (λ), and
variance of the background (V ARBAK) parameters can be automatically generated by
Diva from a generic param.par file placed in DIVA3D/divastripped/input/
(see Section 12.3).
RL.var.1xxxx: files (and the related info file RLinfo.dat) can be placed in the
input/divaparam/ if one wants to use relative correlation length. They can be also
automatically generated by Diva (based of data distribution). It is also possible to place
only a unique file named RL.dat to be used for all the levels.
3Dconstraint is a two-column file, where each line corresponds to the level of the same
number, and contains the two constraint parameters to be used (see Section 8.5) when
performing analysis with advection constraint.
The advection constraint files are placed in the input/divaUVcons subdirectory. One
can provide files named with regard to the variable and the level to which they correspond: Uvel.var.1xxxx, Vvel.var.1xxxx, or only to the level: Uvel.1xxxx,
Vvel.1xxxx. Default files Uvel.dat, Vvel.dat and UVinfo.dat may be placed
to be used for levels for which related (advection) files are missing.
CLminmax, and/or SNminmax can be placed in the divaparam subdirectory. These files
are used (if present) for L and/or λ optimisation, in the case where the maximum and
the minimum acceptable values for correlation length, and/or signal-to-noise parameter
values for each level is to be specified (see Section 12.3).
valatxy.coord.var.1xxxx files: two-column (at least) lists of locations where one wants
to have the performed analysis values in ascii files as an output for the related variable
and level. It is possible to provide files valatxy.coord.1xxxx for the corresponding
levels only, independently of the variable and only valatxy.coord independent from
variables and levels. The output will be always related to variables and levels.
12.1.3
More input subdirectories
The directory DIVA3D/divastripped/input/ may also contents other subdirectories, as
described below.
divaUVcons
This subdirectory is located in the divastripped/input directory, and contains input files
of advection constraint.
It may contain the following files:
UVinfo.var.1xxxx
Uvel.var.1xxxx
Vvel.var.1xxxx
UVinfo.1xxxx
Uvel.1xxxx
Vvel.1xxxx
137
UVinfo.dat
Uvel.dat
Vvel.dat
12.2. Input info files:
contour.depth & 3Dinfo
Chapter 12. DIVA 3D
Uvel.var.1xxxx, Vvel.var.1xxxx and UVinfo.var.1xxxx named with regard to the
variable name and the corresponding level depth number, and/or
Uvel.1xxxx, Vvel.1xxxx and UVinfo.1xxxx numbered following the level to which they
correspond and/or
Uvel.dat and Vvel.dat and UVinfo.dat .
divarefe
This subdirectory is located in the divastripped/input/ directory, and contains reference
field files which can be used by Diva as background for the analyses. This files can be semi
normed reference field files produced previously by Diva.
It may contain the following files:
GridInfo.dat
var.1xxxx.ascii.ref
var.1xxxx.ref
var.1xxxx.datapoint.ref
var.1xxxx.ascii.ref: 2D gridded reference field files in ascii format named with regard
to the corresponding variable name and depth level number, and/or
var.1xxxx.ref: 2D gridded reference field files in GHER format (binary) named with regard to the corresponding variable name and depth level number, and if available
var.1xxxx.datapoint.ref: data file (three columns files) which contains the variable
reference field value at data points.
divamesh
This subdirectory is located in the divastripped/input directory, and contains mesh files
which can be used by Diva instead of generating a new ones. This files can be produced previously by Diva in a preprocessing step .
It may contain the following files:
meshtopo.1xxxx
mesh.dat.1xxxx
meshtopo.1xxxx and related mesh.dat.1xxxx , named following the depth level number to which they correspond.
12.2
Input info files: contour.depth & 3Dinfo
In order to use the three dimensional features of Diva, one has to provide two info-files in the
DIVA3D/divastripped/input/ input directory:
138
12.2. Input info files:
contour.depth & 3Dinfo
Chapter 12. DIVA 3D
contour.depth
3Dinfo
12.2.1 contour.depth
contour.depth contains a list of depth values (one value per line) of the considered levels.
The first line corresponds to the deepest level and the last one to the top level.
3Dinfo is the file where shell script reads the parameter values for the 3D execution: variable
name, levels to be treated, flags values controlling the execution of tasks to be performed
and, maximum and minimum acceptable values for correlation length (L) and signal-tonoise (λ) parameters. If one desires to specify the maximum and the minimum values
for L and/or (λ) parameter for each level, a file CLminmax and/or SNminmax must be
placed in the divaparam subdirectory. In this case the corresponding maximum and
minimum values in the 3Dinfo file are ignored.
2000
1500
1000
800
600
500
400
300
250
200
150
125
100
75
50
30
20
10
5
0
Example file 12.1: contour.depth
12.2.2
The 3Dinfo file
The information file 3Dinfo must be placed in the input directory and must contain all the
following information and option flag values:
• var : variable short name which names data files (var.1xxxx)
• L1 : Number of the first level to be treated.
• L2 : Number of the last level to be treated.
139
12.2. Input info files:
contour.depth & 3Dinfo
Chapter 12. DIVA 3D
• contour generation :
* = 1 if contour files are to be generated,
* = 2 if advection constraint (anisotropic correlation along topography) files are to be
generated from topo.grd,
* = 3 if contour files and advection constraint are to be generated.
• Cleaning data and Relative Length:
* = 1 if data files are to be cleaned,
* = 2 if relative length files are to be generated,
* = 3 if data files are to be cleaned and relative length files are to be generated.
* = 4 if outliers are to be cleaned from data files.
* = 5 if outliers are to be cleaned from data files and, relative length files to be generated.
• Parameter optimization: Possible flag values are 0, 1, 2, 3, −1, −2, −3, 10, −10, 30
and −30:
* = 1 if correlation length parameters are to be estimated,
* = 2 if signal-to-noise ratio (λ) parameters are to be estimated,
* = −1 if correlation length parameters are to be estimated and vertically filtered,
* = −2 if signal-to-noise ratio (λ) parameters are to be estimated and vertically filtered,
* = 3 if both correlation length and signal-to-noise ratio parameters are to be estimated,
* = −3 if both correlation length and signal-to-noise ratio parameters are to be estimated and vertically filtered,
* = 10 if correlation length parameters are to be estimated using data mean distance
as a minimum,
* = −10 if correlation length parameters are to be estimated using data mean distance
as a minimum and vertically filtered,
* = 30 if both correlation length and signal-to-noise ratio parameters are to be estimated using data mean distance as a minimum (for L),
* = −30 if both correlation length and signal-to-noise ratio parameters are to be estimated using data mean distance as a minimum (for L), and both parameters vertically filtered.
• Perform analysis: Possible flag values are 0, 1 and 2:
* = 2 if semi normed reference fields of the considered variable are to be performed
for all the levels between L1 and L2 .
* = 1 if analysis fields of the considered variable are to be performed for all the levels
between L1 and L2 .
140
12.2. Input info files:
contour.depth & 3Dinfo
Chapter 12. DIVA 3D
• M axCL : maximum value for correlation length (ignored if a CLminmax file is provided
in divaparam).
• M inCL : minimum value for correlation length (ignored if a CLminmax file is provided
in divaparam).
• M axSN : maximum value for signal-to-noise ratio (ignored if a SNminmax file is provided in divaparam).
• M inSN : minimum value for signal-to-noise ratio (ignored if a SNminmax file is provided in divaparam).
• Gnplt : = 1 if Gnuplot plot files are to be generated.
• M inGP : minimum value of the variable for Gnuplot plots.
• M axGP : maximum value of the variable for Gnuplot plots.
• ’Title String’ : Title string for 3D-NetCDF file.
• ’Variable name string’ : Variable long name string.
• ’Units string’ : Variable units string
141
12.3. 3D analyses: inputs
preparation
Chapter 12. DIVA 3D
# Variable (var) to be analysed (located in data/var.1xxxx):
psal
# Number of the first level to be processed (bottom?):
1
# Number of the last level to be processed (surface?):
25
# Contours generation (0, 1, 2, 3):
3
# Data cleaning (0: if no, 1: data cleaning only, 2: RL files, 3: 1 and 2):
3
# Parameters optimisation (0, 1, 2, -1, -2, 3, -3, and +or- 10,20 and 30):
-30
# Perform analyses (0 if no, 1: analyses, 2: references):
1
# Minimum value for correlation length:
0.5
# Maximum value for correlation length:
4.
# Minimum value for S/N:
0.1
# Maximum value for S/N:
50.
# Gnuplot plots generation (1 if yes, 0 if no):
0
# Variable minimum value for gnuplot plots:
6
# Variable maximum value for gnuplot plots:
40
# Title string for salinity 3D NetCDF file:
’Diva 3D analysis of the variable’
# Variable long name string:
’Potential salinity’
# Variable units string:
’psu’
Example file 12.2: 3Dinfo file
12.3
3D analyses: inputs preparation
The working directory for running a 3D Diva analysis is DIVA3D/divastripped/ directory. All Diva 3D runs can be done by simply running the shell script diva3Ddress. The
diva3Ddress performs the actions prescribed in the info file 3Dinfo.
12.3.1
Coast contour files generation
To generate coast contour files for all the levels of which depth is present in the contour.depth
file in the divastripped/input, one has to choose the flag number 1 or 3 in the 3Dinfo
file and provide as input in divastripped/input a bathymetry file of the area of interest.
the input bathymetry file may be an ascii topo.dat or a GHER format binary file topo.grd
and the related TopoInfo.dat as described in Section 7.2.2. A param.par file is also
142
12.3. 3D analyses: inputs
preparation
Chapter 12. DIVA 3D
needed, and can be placed in the divastripped/input input directory.
The resulting coast contour files (coast.cont.1xxxx) are placed in the subdirectory
input/divaparam/. If the chosen flag number for contour generation in the 3Dinfo file is
3, advection constraint files (anisotropic correlations along topography) are generated as well,
and placed in input/divaUVcons subdirectory.
Input
param.par, contour.depth
topo.dat or
topo.grd and TopoInfo.dat
12.3.2
Output
coast.cont.1xxxx in divaparam
Uvel.1xxxx and Vvel.1xxxx in divaUVcons
Data sets cleaning
All data sets provided in DIVA3D/divastripped/input/divadata/ can be cleaned
from data points located outside the mesh and from suspected outliers. Choose a flag number
corresponding to the desired action for data sets cleaning in the 3Dinfo file. A param.par
file is also needed, and can be placed in the divastripped/input/ input directory.
At this stage, field of scaling factors to the correlation length can be generated on the basis of
data distribution, and for the levels corresponding to each data set (see Section 12.2.2).
Input
param.par
&
var.1xxxx
12.3.3
Output in input/divadata/
var.1xxxx.notcln: original data set files
var.1xxxx.clean: data set files cleaned from data out of the mesh
var.1xxxx.withoutliers: data set files cleaned with outliers
var.1xxxx: The cleaned data set files
Parameters optimisation
The estimation of analysis parameters (see Chapter 3) can be done for all levels using diva3Ddress.
It is possible to optimise one or more parameter for a range of levels with different options (see
Section 12.2.2). The parameters which can be optimised are correlation length L, signal-tonoise ratio λ and the error variance background V ARBAK. The parameters optimisation can
be done within a range of bounds (a maximum and a minimum). The bounds can be prescribed
for all levels in the 3Dfile (see Section 12.2.2) or varying with levels by giving the list of
bound in files CLminmax and/or SNminmax.
To perform parameters optimisation, one can place a default param.par with an approximated values for correlation length (L), signal-to-noise ratio (snr) and variance (V ARBAK)
parameter values, in input/divaparam/ (or input) directory). If parameter bounds are
desired for each considered level, one can place a bound file corresponding to the parameter(s)
to be optimised (CLminmax and/or SNminmax) in input/divaparam/, or prescribe a
general one in 3Dinfo file. Choose the appropriate flag value in the 3Dinfo file (see Section 12.2.2). The 3D analysis parameter optimisation output is a set of param.par indexed
following the variable name and the corresponding level, and summary files of estimated parameters before and/or after vertical filtering.
143
12.4. Performing 3D analyses:
diva3Ddress
Chapter 12. DIVA 3D
Input
param.par
in divaparam
or
in input/divaparam/
Output in input/divaparam/
param.par.var.1xxxx
with optimised L, snr, and V ARBAK
var.CL.dat.filtered, var.CL.dat.notfiltered
var.SN.dat.filtered, var.SN.dat.notfiltered
var.VAR.dat.filtered, var.VAR.dat.notfiltered
12.4
Performing 3D analyses: diva3Ddress
12.4.1
A simple analysis: input files
Input files in divastripped/input/
The minimum input files for performing a Diva 3D analysis consists of:
• 3Dinfo file (see 12.2),
• contour.depth file (see 12.1),
• coast.cont.1xxxx files for all considered levels in divaparam subdirectory (see
12.3.1),
• param.par files:
* param.par.var.1xxxx for all considered levels and prepared for the considered
variable put in divaparam subdirectory, or
* param.par.1xxxx for all considered levels divaparam subdirectory, or
* one param.par file put in divastripped/input/ directory or in
divastripped/input/divaparam/ subdirectory.
• data sets for all considered levels var.1xxxx files in divadata subdirectory.
Tips 12.2 If for a level (or all levels) param.par.var.1xxxx is not present, one default
param.par file must be placed in the divaparam subdirectory or in the input directory.
Using relative length files:
If more than one relative length files are available, they must be named and numbered following the variable and level to which they correspond as RL.var.1xxxx, and must be provided in the input/divaparam/ subdirectory. One default file RL.dat may be placed in
input/divaparam subdirectory to be used for the levels for which relative length files are
missing. One RLinfo.dat ascii file (grid info file) must be placed with the relative length
files (binary GHER format).
If only one RL.dat file of relative length is used, it must be placed in the divaparam subdirectory or in the input directory.
144
12.4. Performing 3D analyses:
diva3Ddress
Chapter 12. DIVA 3D
How to create these relative length files ?
If you do not have these binary relative length files, you can either create them by yourself
or use the tool divaasctobin located in JRA4/Climatology which use simple ascii
files as input to create your binary ones, via a run of diva. You will need to edit this script
and set the parameter "RL" to 1 (at the beginning). Please note that this is not only a format
transformation, the output is the analyse of the input files (with low SNR, high CL and reference
field equal to one. By default, the domain (lon, lat, x and y step) is the one defined in the original
./input/param.par file.
Your ascii input files have to be located in JRA4/Climatology/input/divaparam.
Your input files have to be named like this : ./input/divaparam/RL.var.1xxxx.ascii.
They contain 3 columns : longitude, latitude and the value of the relative length.
Then, just launch ./divaasctobin in the directory JRA4/Climatology. The ouput
binary files as well as the RLinfo.dat_erasethispart (of course, rename it by erasing the last part when activation is needed) will be located in input/divaparam, ready to
be used. Do not forget to check if the output corresponds to what you want by looking at
RL.10001000.4Danl.nc in output/3Danalysis.
Convention: When a RLinfo.dat file is present in the divaparam subdirectory
or in the input directory, Diva will perform 3D analysis using relative length files.
Using advection constraint
To perform 3D analysis with avection constraint, the files UVinfo.var.1xxxx,
Uvel.var.1xxxx, Vvel.var.1xxxx, must be then placed in input/divaUVcons/
subdirectory. The advection constraint is activated when a constraint.dat file is present in
the input directory (see Section 8.4). If one wants to use different advection parameters θ and
A (see Section 8.5) a two column 3Dconstraint file must be placed in input/divaparam
subdirectory where each line contains the advection parameters for the corresponding level
number.
If UVinfo files are identical for all the levels, only one file UVinfo.dat may be placed in
the input directory or in the input/divaUVcons subdirectory.
If for some levels, the pair of files Uvel.var.1xxxx, Vvel.var.1xxxx (or Uvel.1xxxx,
Vvel.1xxxx) is not available, A default Uvel.dat and Vvel.dat files must be placed
in the input/divaUVcons/ subdirectory as well as a UVinfo.dat if using different
UVinfo files.
If for all levels, the same advection files are used, only Uvel.dat, Vvel.dat and UVinfo.dat
may be placed in the input/divaUVcons/ subdirectory or simply in the input directory.
How to create these advection files ?
If you do not have these binary advection files, you can either create them by yourself or use
the tool divaasctobin located in JRA4/Climatology which use simple ascii files as
145
12.4. Performing 3D analyses:
diva3Ddress
Chapter 12. DIVA 3D
input to create your binary ones, via a run of diva. You will need to edit this script and set the
parameter "UV" to 1 (at the beginning). Please note that this is not only a format transformation, the output is the analyse of the input files (with low SNR, high CL and reference field
equal to zero. By default, the domain (lon, lat, x and y step) is the one defined in the original
./input/param.par file.
Your ascii input files have to be located in JRA4/Climatology/input/divaUVcons.
Your input files have to be named like this : ./input/divaUVcons/Uvel.1xxxx.ascii
and ./input/divaUVcons/Vvel.1xxxx.ascii. They contain 3 columns : longitude,
latitude and the value of the speed component.
Then, just launch ./divaasctobin in the directory JRA4/Climatology. The ouput binary files as well as the UVinfo.dat will be located in input/divaUVcons, ready to
be used. Do not forget to check if the output corresponds to what you want by looking at
Uvel.10001000.4Danl.nc and Vvel.10001000.4Danl.nc in output/3Danalysis.
Convention: The advection constraint is activated when a 3Dconstraint file is
present in the divaparam subdirectory or a constraint.dat is present in the
input directory.
Using reference fields
If reference fields are present in the input/divarefe subdirectory, they will be used automatically by Diva to perform 3D analysis using the reference field files as a background.
To use a variable reference field as background for given level number, the GridInfo.dat
and at least one of the three types of reference files var.1xxxx.ascii.ref (2D ascii
file),var.1xxxx.datapoint.ref reference at data points or var.1xxxx.ref binary 2D
GHER format must be present in the divarefe subdirectory.
Convention: The use of reference fields for a given level is activated when the corresponding reference field files are present in the divarefe subdirectory.
Using detrending
To perform Diva 3D analysis with detrending of data, a detrendinfo file must be provided
in the directory input. The detrendinfo has two columns and one line: where the group
number of detrending is prescribed in the first column, and the iterations number in the second
(see Section 5.3). In this case all data set files should have the right number of columns starting
from the fifth and where classes are numbered.
Convention:
Diva 3D analysis with data detrending is activated when
detrendinfo file is present in the input directory.
146
12.4. Performing 3D analyses:
diva3Ddress
Chapter 12. DIVA 3D
Running diva3Ddress
To run Diva to perform a 3D analysis, one has simply to run the shell script file diva3Ddress
in divastripped. Diva 3D analysis outputs are normal analysis of a variable or reference
fields, depending on the chosen flag number for analysis in the 3Dinfo (see Section 12.2.2).
12.4.2 Diva 3D analysis outputs
The outputs are placed in output/3Danalysis/ and consist of:
The 3D analysis files: in NetCDF and GHER binary format.
var.1xxxx.1yyyy.fieldgher.anl
var.1xxxx.1yyyy.anl.nc
var.1xxxx.1yyyy.fieldgher.ref
var.1xxxx.1yyyy.errorfieldgher.anl var.1xxxx.1yyyy.ref.nc
Figure 12.1: Content of output/3Danalysis/
The 3D variable analysis NetCDF file contains the diva analysis of the variable and a set
of variable related information fields: relative error and error standard deviation fields,
variable masked (using two relative error thresholds) fields, deepest values of the variable field and the related masked fields. It contains also fields of information about data
distribution and outliers as well as fields of correlation length and signal-to-noise ratio
parameters.
A subdirectory Fields containing all the Diva 2D output files for all levels:
GridInfo.dat
var.1xxxx.anl
var.1xxxx.anl.nc
var.1xxxx.ascii.anl
var.1xxxx.outliersbis
var.1xxxx.ref
var.1xxxx.ascii.ref
var.1xxxx.datapoint.ref
var.1xxxx.ref.nc
var.1xxxx.outliersbis.norm
var.1xxxx.error
var.1xxxx.errorascii
var.1xxxx.valatxyasc.ref
valatxy.var.1xxxx
Figure 12.2: Content of output/3Danalysis/Fields/
A subdirectory datadetrend: it contains trend data
trends.i.dat.var.1xxxx (i is the group number).
set
files
for
all
levels
A subdirectory Meshes: it contains the mesh files, so that they can be re-used for other applications.
Log files Two log files are generated:
• diva.log: Log file of Fortran binaries run in ./output/
• var.diva3D.log: Log file of shell scripts execution in output/3Danalysis/.
147
13 C LIMATOLOGY
PRODUCTION :
D IVA 4D
Diva can be used to produce climatologies for a given variable in an oceanic basin. In this case
Diva 3D tools are used to produce for successive climatological time periods, 3D climatological
analyses on the basin. The resulting climatologies are gathered in 4D binary files GHER format
and NetCDF.
The working directory to performs 4D-analyses is:
diva-x.x.x/JRA4/Climatology.
Contents
13.1 Climatology definition . . . . . . . . . . . . . . . . . . . . . . . . . . . . . 148
13.2 Diva 4D climatology performance . . . . . . . . . . . . . . . . . . . . . . 149
13.3 Input data preparation . . . . . . . . . . . . . . . . . . . . . . . . . . . . 151
13.3.1 Data files . . . . . . . . . . . . . . . . . . . . . . . . . . . . . . . . 151
13.3.2 Inputs for input data preparation actions . . . . . . . . . . . . . . . . 151
13.3.3 Outputs of input data preparation actions . . . . . . . . . . . . . . . 152
13.4 Production of climatologies . . . . . . . . . . . . . . . . . . . . . . . . . . 154
13.4.1 Inputs for production of climatologies . . . . . . . . . . . . . . . . . 155
13.4.2 Advection constraint and reference field files . . . . . . . . . . . . . 156
13.4.3 Diva 4D climatology production output . . . . . . . . . . . . . . . . 158
13.4.4 driver file: actions and flag values . . . . . . . . . . . . . . . . . 159
13.1
Climatology definition
The climatologies to be produced are first defined by the mean of three files:
varlist:
yearlist:
monthlist:
one column file, where each line defines the short name of a variable
(see example 13.1).
one column file, where the lines define the time period of years over
which the climatologies (of the variables) are performed
(see example 13.2).
one column file, where the lines define the time period in the year
for which the climatologies (of the variables) are performed
(see example 13.3).
Temperature
Salinity
Example file 13.1: varlist
148
13.2. Diva 4D climatology
performance
Chapter 13. CLIMATOLOGY
PRODUCTION: DIVA 4D
19001950
19501980
19802012
Example file 13.2: yearlist
0103
0406
0709
1012
Example file 13.3: monthlist
Convention:
• In yearlist, each time period must be in an eight digits number such as
yyyyzzzz where yyyy is the start year and zzzz the end year time period.
• In monthlist, each time period must be in a four digits number such as
mmnn where mm is the start month and nn the last month numbers.
• In monthlist, if the first month is greater than the second (ex. 1202), the next
year is considered for months after december (ex. 01 and 02).
13.2 Diva 4D climatology performance
All Diva shell scripts files for climatologies (or 4D-analyses) production are located in
diva-4.6.1/JRAx/Climatology. This directory has its proper subdirectories:
input where input data and files are placed and
output where Diva outputs are stored.
The main shell script file for generating climatologies is divadoall. The actions that performed when running divadoall are:
• Preparation of data files (ODV files without any depth axis and/or containing current speed and direction- variables). Divadoall calls divanodepthODV4, generating
new files with the extension “_bis.txt” containing the x and y components of the speed
(u_star and v_star), as well as a depth axis.
• Data extraction at selected depth levels.
• Cleaning of duplicates in the extracted data (divadoall calls divaduplicatesODV4
if the analysis flag is not zero).
• Boundary lines/coastline generation (contour files).
149
13.2. Diva 4D climatology
performance
Chapter 13. CLIMATOLOGY
PRODUCTION: DIVA 4D
• Advection field generation based on coastlines.
• Cleaning of the data outside the mesh.
• Outliers elimination from data sets.
• Generation of relative length fields.
• Optimization of the correlation length (for each data set).
• Optimization of the signal-to-noise ratio (for each data set).
• Calculation of variable (semi-normed) reference fields.
• Performance of variable analysis fields using the following options:
– analysis without option (normal variational analysis),
– analysis using a reference fields,
– analysis using advection constraint,
– analysis with data transformation,
– analysis using reference fields for each level calculated on bases of mixed data from
three neighbouring levels,
– analysis using a filtered mean background field: all levels mean are first calculated
an vertically filtered before being used 3D analyses.
• Gnuplot plot production.
• Analysis with detrending method.
Note:
All actions performed by divadoall are prescribed in the file driver
through flag values (see section 13.4.4 and example 13.4).
Note:
* When data extraction is activated in the driver, the execution is made for all levels
found in contour.depth file provided in the subdirectory input. It is also taking
into account a minimum number of data in a layer with regard to the corresponding flag
value given in driver.
* When boundary line and coastline generation is activated in the driver, the execution is
made for all levels found in contour.depth file provided in the subdirectory input.
* When parameter optimisation and/or analysis is activated, the execution is made for the
levels between the values chosen for the lower and upper level numbers and takes into
account the bound values (maximum and minimum) prescribed in driver.
150
Chapter 13. CLIMATOLOGY
PRODUCTION: DIVA 4D
13.3. Input data preparation
All actions performed by divadoall use the input files:
varlist
yearlist
monthlist
contour.depth
param.par
in climatology directory
in climatology/input directory
in climatology/input or in
climatology/input/divaparam directory
13.3
Input data preparation
13.3.1
Data files
They must be ODV SeaDataNet compliant: https://www.bodc.ac.uk/data/codes_and_formats/odv_
format/.
IMPORTANT : Time series are now allowed, but have to be placed in a different ODV file
than profiles. The time axis used for time series is "time_ISO8601". For profiles, the time axis
is labelled "yyyy-mm(-ddThh:mm:ss.sss)".
13.3.2
Inputs for input data preparation actions
In Diva 4D (or Climatology production) we can use all the tools provided in Diva 3D for input
data preparation. Input data preparation consists in the following actions:
• Data set for extraction.
• Boundary lines and coastlines generation and advection field generation.
• Data cleaning on mesh, outliers elimination from data sets and generation of Relative
Length fields.
• Parameters optimisation and reference fields generation.
To perform an action, one has to configure the driver file and give in the corresponding
flag values and run the godiva file script (this will launch the divadoall script and check
for possible severe errors). The standard output (stdout) and error (sdterr) will be stored in
divadoall.log while the error and warning lines will be found in divadoall.severeerrors,
divadoall.errors and divadoall.warnings. For each action, specific inputs are
needed:
151
Chapter 13. CLIMATOLOGY
PRODUCTION: DIVA 4D
Action
13.3. Input data preparation
Inputs
Data extraction
Coastline generation
and “Advection”
fields generation
datasource in Climatology
qflist in Climatology
topogebco.asc, topo.gebco or topo.dat ascii
file or topo.grd GHER binary format file and its
related TopoInfo.dat ascii info-file
Data cleaning on mesh,
outliers elimination and
generation of relative
length fields
divadata a directory which contains data set files of the considered
layers, divaparam a directory which contains coastlines
coast.cont.100xx files for all considered layers and a param.par
file in input or input/divaparam directory
Parameters optimisation
(L and S/N )
divadata directory which contains the data set
files of the considered depths divaparam directory
which contains coastlines coast.cont.100xx files of
the considered basin, and a(template) param.par file
in input or input/divaparam directory.
Reference fields
generation
13.3.3
divadata directory which contains the data set files
of the considered depths and time periods
divaparam directory
which contains coastlines coast.cont.100xx files of the
considered basin, and a(template) param.par file in input or
a param.par.var.100xx files in input/divaparam directory.
In these param.par and/or param.100xx files, ireg is automatically forced to 0.
Outputs of input data preparation actions
Outputs resulting from a divadoall run for input data preparation actions are placed in the
input for data sets extraction and in a newinput subdirectory for the other actions as shown
in the following table:
152
Chapter 13. CLIMATOLOGY
PRODUCTION: DIVA 4D
Action
Data extraction
Coastlines generation
and “Advection”
field generation
Data cleaning on
mesh, outliers
elimination and
generation of relative
length fields
13.3. Input data preparation
Outputs
A subdirectory divadata is created in
input directory, and contains all the data sets.
A newinput subdirectory which contains:
a subdirectory divaparam with the coast.cont.100xx
and a subdirectory divaUVcons_all containing the
velocity field files.
All these files are also copied to subdirectories of input.
A newinput/divadata subdirectory
which contains cleaned data sets and
relative length files if generated.
Parameters optimisation
(L and S/N )
A newinput/divaparam subdirectory which contains
param.par.var.100xx files and summary files of the
optimisation and filtering procedure.
Reference fields
generation
A newinput/divarefe subdirectory which contains
all generated reference fields
The shell script file divadocommit: in order to be able to use the outputs of input data
preparation actions, they must be copied to the input directory. This can be done by running
the sell script file divadocommit.
Note:
divadocommit replaces input files in input directory by the ones
found in newinput directory assuming that the driver, varlist,
yearlist and monthlist files are the ones used by divadoall
to create the newinput subdirectory on which divadocommit is run.
* When reference fields are generated, they are copied by the script file divadocommit
in a subdirectory input/divarefe_all.
153
Chapter 13. CLIMATOLOGY
PRODUCTION: DIVA 4D
13.4. Production of climatologies
extract flag: 1 do it, 0 do nothing, -1 press coord, -10 pressure+Saunders
1
boundary lines and coastlines generation: 0 nothing, 1: contours, 2: UV, 3: 1+2
1
cleaning data on mesh: 1, 2: RL, 3: both, 4: 1 + outliers elimination, 5: =4+2
4
minimal number of data in a layer. If less, uses data from any month
10
isoptimise 0 nothing, 1 L, 2 SN, 3 both, negative values filter vertically
0
Minimal L
0.1
Maximal L
1
Minimal SN
0.05
Maximal SN
0.5
2 do reference, 1 do analysis and 0 do nothing
1
lowerlevel number
7
upperlevel number
11
4D netcdf climatology file
0
isplot 0 or 1
1
number of groups for data detrending, 0 if no detrending.
0
Example file 13.4: The driver file.
13.4
Production of climatologies
Diva 4D allows the production of climatologies based on simple Diva data analysis or based on
Diva analysis using various options as in Diva 3D:
• relative length (RL) files,
• advection constraint,
• reference fields and detrending.
Note: These options are automatically activated when the appropriate input data are provided.
Diva 4D for climatology production offers more options to improve the analysis coherence:
• analysis using vertically filtered mean background
• analysis with data transformation: log(data)-exp(analysis), Logit and anamorphosis transformations or a “user defined” transformation.
154
Chapter 13. CLIMATOLOGY
PRODUCTION: DIVA 4D
13.4. Production of climatologies
• analysis using a reference field for each layer generated on the basis of all data from the
two neighbouring layers in addition to the layer data set.
Note: These options are activated with a specific flag values in the driver.
Note: The Logit transformation is made to insure analysis values to be in a given range [a, b].
The range [a, b] must be prescribed in a file var.logitrange (see example 13.5) and provided in input/divadata. If var.logitrange is note provided and the Logit transformation is acctivated, Diva will take the data minimum and maximum values as rage values.
0
10
Example file 13.5: Example of file var.logitrange.
13.4.1
Inputs for production of climatologies
in climatology directory
varlist
yearlist
monthlist
constandrefe
input files defining the climatology
input file to activate advection
constraint and/or reference fields
in climatology/input directory
contour.depth
param.par
NCDFinfo
divaparam
divadata
divarefe_all
divaUVcons_all
file of depth values (see example 12.1)
file defining the analysis parameters, provided here
if not present in divaparam
Info file containing metadata for NetCDF files (see example 13.6)
subdirectory containing coastline files coast.cont.100xx
and parameters files param.par.var.100xx
subdirectory containing data set files
var.yyyyzzzz.mmnn.100xx
subdirectory containing reference field files (see Section 12.4.1)
subdirectory containing advection constraint fields (see Section 12.4.1 )
155
Chapter 13. CLIMATOLOGY
PRODUCTION: DIVA 4D
13.4. Production of climatologies
Title string for 3D NetCDF file:
’Diva 3D analysis ’
Reference time for data (if not climatological data)
’months since since xxxx-01-01’
Time value (if not climatological data)
1200
Cell_method string:
’time: mean (this month data from all years)’
Institution name: where the dataset was produced.
’University of Liege, AGO, GHER’
Production group and e-mail
’Diva group. E-mails : [email protected]’
Source (observation, radiosonde, database, model-generated data,...)
’ data_from various sources’
Comment
’This is only for DIVA development and testing work’
Author e-mail address (or contact person to report problems)
’[email protected]’
Example file 13.6: NCDFinfo
13.4.2
Advection constraint and reference field files
To perform Diva 4D analyses with advection constraint and/or using reference fields, the advection constraint and reference field files must be provided in the corresponding subdirectory
divarefe_all and divaUVcon_all in input directory (see Sections 12.4.1 and 12.4.1).
Note:
The naming conventions for advection field and advection constraint field
files is the same as for Diva 3D: advection condtraint files are named as:
UVinfo.var.yyyy.zzzz.mmnn.1xxxx,
Uvel.var.yyyy.zzzz.mmnn.1xxxx,
Vvel.var.yyyy.zzzz.mmnn.1xxxx, and a constraint.dat file,
and for reference fild files:
var.yyyy.zzzz.mmnn.1xxxx.ascii.ref,
var.yyyy.zzzz.mmnn.1xxxx.datapoint.ref and
var.yyyyzzzz.mmnn.1xxxx.ref
Using advection constraint and/or reference field
The advection constraint and/or reference fields usage actions are activated by the corresponding flag values in constandrefe file.The advection constraint option is activated when the
corresponding flag value is equal to 1. The use of reference fields option is activated when the
corresponding flag value is equal to 1, in this case a year period and month period codes must
be provided in the corresponding lines.
156
Chapter 13. CLIMATOLOGY
PRODUCTION: DIVA 4D
13.4. Production of climatologies
# advection flag
0
# reference field flag
1
# variable year code
19002010
# variable month code
0103
Example file 13.7: constandrefe
How to use a different reference field for each month period ?
Just change the parameter “refsameasmonthlist” to “yes” in the script divadoall (around
line 330). The month code for your reference field will then be the same as the current month
period. Do not forget to set “refsameasmonthlist” back to “no” after your analyses.
157
Chapter 13. CLIMATOLOGY
PRODUCTION: DIVA 4D
13.4. Production of climatologies
13.4.3 Diva 4D climatology production output
The outputs are placed in output/3Danalysis/ and are the same as of the Diva 3D, in
addition to the climatologies 4D-NetCDF files:
The 4D analysis files: in NetCDF and GHER binary format.
var.yyyyzzzz.4Danl.nc or
var.4Danl.nc ( of all year periods)
The 4D variable analysis NetCDF file contains the diva analysis of the variable and a
set of variable related information fields: relative error and error standard deviation
fields, variable masked (using two relative error thresholds) fields, deepest values of
the variable field and the related masked fields. It contains also fields of information
about data distribution and outliers as well as fields of correlation length and signalto-noise ratio parameters.
The 3D analysis files: in NetCDF and GHER binary format.
var.yyyyzzzz.mmnn.1xxxx.1yyyy.anl.nc
var.yyyyzzzz.mmnn.1xxxx.1yyyy.errorfieldgher.anl
var.yyyyzzzz.mmnn.1xxxx.1yyyy.fieldgher.anl
var.yyyyzzzz.mmnn.1xxxx.1yyyy.fieldgher.ref
var.yyyyzzzz.mmnn.1xxxx.1yyyy.ref.nc
A subdirectory Fields containing all the Diva 2D output files for all levels:
GridInfo.dat
var.yyyyzzzz.mmnn.1xxxx.anl
var.yyyyzzzz.mmnn.1xxxx.anl.nc
var.yyyyzzzz.mmnn.1xxxx.ascii.anl
var.yyyyzzzz.mmnn.1xxxx.outliersbis
var.yyyyzzzz.mmnn.1xxxx.error
var.yyyyzzzz.mmnn.1xxxx.errorascii
var.yyyyzzzz.mmnn.1xxxx.valatxyasc.ref
valatxy.var.yyyyzzzz.mmnn.1xxxx
var.yyyyzzzz.mmnn.1xxxx.ref
var.yyyyzzzz.mmnn.1xxxx.ascii.ref
var.yyyyzzzz.mmnn.1xxxx.datapoint.ref
var.yyyyzzzz.mmnn.1xxxx.ref.nc
var.yyyyzzzz.mmnn.1xxxx.outliersbis.norm
A subdirectory datadetrend: it contains trend data set files for all
trends.i.dat.var.yyyyzzzz.mmnn.1xxxx (i is the group number).
levels
A subdirectory Meshes: it contains the mesh files, so that they can be re-used for other applications.
Log and metadata files: Two log files and a text metadata file are generated:
• var.Metainfo.txt: All the information about domain, grid, variable, and run
parameters.
• var.yyyyzzzz.mmnn.Fortran.log: Log file of fortran binaries run.
• var.yyyyzzzz.mmnn.diva3D.log: Log file of shell scripts execution.
158
Chapter 13. CLIMATOLOGY
PRODUCTION: DIVA 4D
13.4. Production of climatologies
13.4.4 driver file: actions and flag values
All actions performed by divadoall are prescribed in the file driver through flag values.
In this section all possible actions and corresponding flag values are listed:
• Data extraction: Possible flag values: 0,1,−1 and −10. If you activate the data extraction (flag value 6= 0) in the driver file, the execution of divadoall will run the
divaselectorODV4 automatically, including interpolation to the levels specified in
contour.depth. Data will be extracted from the ODV spreadsheat file(s) specified in
datasource. Command divaselectorODV4 will recognises if the data export to
ODV file was done with depths (in meters) or it was done with pressure (in dbar) vertical
coordinate, you can either choose to map it as if they were meters or apply the Saunders
(1981) correction. Choose flag = −1 to use pressure coordinate and assume they are meters, and flag value = −10 to use pressure coordinates and transform to meters by using
the Saunders approach.
If there is a qflist file, the selection with divaselectorODV4 will only use those
measurements for which the quality flag is one of those found in the file qflist. In the
absence of qflist (or if qflist is empty), no quality flag analysis is done and all data
taken.
Note: you can specify several ODV4 spreadsheet files as input files, one file name (or full
path) per line in datasource file, they must have the same variables naming convention. You can also specify different quality flags for each file by adding these values after
the file name (separated by a space). At the moment, a maximum of two quality flags per
file is admitted. In the absence of quality flag after the file name, Diva simply uses the
values provided in qflist.
Note: the files without any depth axis are treated separately by divanodepthODV4.
The minimum and maximum instrument depth (metadata) are used to recreate an artificial
depth axis which can be used by diva. Please note that, in this case, each file without depth
axis (in datasource) should contain only one location (otherwise, the other ones are not
used). This script also handles the current direction (CurrDir [deg T]) and speed (CurrSpd
[cm/s]) and transforms them into x-y components (North, East). In this second case, depth
axis has to be present. In any case, divanodepthODV4 can only deal with a maximum
of 2 scalar variables (+ current direction and speed). If you need to analyse more than 2
scalar variables, you can proceed by steps (just changing the varlist).
• Boundary lines and coastlines generation: Possible flag values are 0, 1, 2 and 3. When
this action is activated (flag ≥ 1), you must provide in the input directory the files
TopoInfo.dat and topo.grd in addition to contour.depth file.
* = 1 if contour files are to be generated,
* = 2 if advection constraint (Anisotropic correlation along topography) files are to
be generated from topo.grd,
* = 3 if contour files and advection constraint are to be generated.
• Cleaning data and Relative Length: Possible flag values are 0, 1, 2, 3, 4 and 5:
* = 1 if data files are to be cleaned,
159
Chapter 13. CLIMATOLOGY
PRODUCTION: DIVA 4D
13.4. Production of climatologies
* = 2 if relative length files depending on data coverage are to be generated,
* = 3 if data files are to be cleaned and relative length files depending on data coverage
are to be generated.
* = 4 if outliers are to be cleaned from data files.
* = 5 if outliers are to be cleaned from data files and, relative length files depending
on data coverage to be generated.
* = 6 if data files are to be cleaned and relative length files depending on depth to be
generated.
• Minimum number of data in a layer: Any value from -1 to infinity. If less, uses data
from any month.
* = −1 if you never want to use other data from other months.
• Parameter optimization: Possible flag values are 0, 1, 2, 3, −1, −2, −3, 10, −10, 30
and −30:
* = 1 if correlation length parameters are to be estimated,
* = 2 if signal-to-noise ratio (S/N ) parameters are to be estimated,
* = −1 if correlation length parameters are to be estimated and vertically filtered,
* = −2 if signal-to-noise ratio (S/N ) parameters are to be estimated and vertically
filtered,
* = 3 if both correlation length and signal-to-noise ratio parameters are to be estimated,
* = −3 if both correlation length and signal-to-noise ratio parameters are to be estimated and vertically filtered,
* = 10 if correlation length parameters are to be estimated using data mean distance
as a minimum,
* = −10 if correlation length parameters are to be estimated using data mean distance
as a minimum and vertically filtered,
* = 30 if both correlation length and signal-to-noise ratio parameters are to be estimated using data mean distance as a minimum (for L),
* = −30 if both correlation length and signal-to-noise ratio parameters are to be estimated using data mean distance as a minimum (for L), and both parameters vertically filtered.
• Analysis: analysis and reference fields can be performed in different ways:
– Perform analysis: Possible flag values are 1, 11, 12, 13 and 14:
* = 1 if analysis fields of the given variable are to be performed for all the layers
between L1 and L2 which are the flag values for lower level number and upper
level number in the driver.
* = 11 if analysis fields of the given variable are to be performed with log(data)exp(analysis) transformation
160
Chapter 13. CLIMATOLOGY
PRODUCTION: DIVA 4D
13.4. Production of climatologies
* = 12 if analysis fields of the given variable are to be performed with Logit
transformation
* = 13 if analysis fields of the given variable are to be performed with anamorphosis transformation
* = 14 if analysis fields of the given variable are to be performed with user
chosen transformation function.
– Perform reference fields: Possible flag values are 2, 21, 22, 23 and 24:
* = 2 if semi normed reference fields of the given variables (prescribed in varlist
and for time periods described in yearlist and monthlist) are to be performed for all the layers between L1 and L2 , which are the flag values for lower
level number and upper level number in the driver.
* = 21 if analysis fields of the given variable are to be performed with log(data)exp(analysis) transformation
* = 22 if analysis fields of the given variable are to be performed with Logit
transformation
* = 23 if reference fields of the given variable are to be performed with anamorphosis transformation
* = 24 if reference fields of the given variable are to be performed with user
chosen transformation function.
– Adding 100 to the flag value:
* = 101 or = 11x allows performing analysis using reference fields for each layer
using all data from the two neighbouring layers in addition to the layer data set.
Only reference fields are performed
* = 102 or = 12x allows performing reference fields for each layer using all data
from the two neighbouring layers in addition to the layer data set.
• 4D netcdf files generation: Possible flag values are 0, 1 and 11:
* = 0 or 1 If you only want 3D netcdf output files and a 4D netcdf for each year
period,
* = 11 If you also want a big 4D netcdf containing all the year period.
• Gnuplot plots: Possible flag values are 0 and 1. Activate this action for a quick visualization (and assessment) of the climatology production, gnuplot executions can be
included in the production process.
There are a few controls you can apply for these gnuplot plots:
* VAR.bounds: contains the lower and upper bounds during the plotting for the
variable VAR (which is one of the variable names found in varlist)
* VAR.pal: contains the color palette for the same variable.
* plotboundingbox.dat: contains the box for plotting. This is typically used to
plot only the region of interest, without overlapping regions with other climatologies
(the numerical fields include the overlapping regions, only the plotting is limited
with the plotboundingbox.dat file).
161
Note: the gnuplot colorbars use a scale that is actually remapped to the bounds found
in VAR.bound. Example: if your colorbar definition goes from 0 to 10 and the VAR
bounds are from 0 and 100, a value of 50 in the variable analysed will use the color found
in the colorbar definition at value 5. To help you designing a specially adapted color bar
lets say for salinity, it is therefore a good idea to define the colorbar with the same bounds
as those in VAR.bounds.
Note: for adapting the color palette, file gnuplotcolornames contains a list of preexisting colors and their hexadecimal codes you can use instead of names.
• Detrending Possible flag values are 0 and n: the action is activated when choosing flag
value an integer n > 0. The chosen value n must be equal or smaller to groups number in
data files.
Note: If you use divadoall (or divaselectorODV4) to extract data and create
data input files, columns 5, 6 ,7 and 8 contain respectively groups years, months, days
and hours (1 for the first year in the selection etc).
Part IV
Appendix
163
A P ROBLEMS . . . AND
SOLUTIONS !
This chapter contains a list of Frequently Asked Questions concerning many aspects of Diva as
well as a list of solved issues or bugs.
Contents
A.1 FAQ . . . . . . . . . . . . . . . . . . . . . . . . . . . . . . . . . . . . . . . 165
A.1.1 Where can I find the latest version? . . . . . . . . . . . . . . . . . . 165
A.1.2 What do I need to install DIVA? . . . . . . . . . . . . . . . . . . . . 165
A.1.3 Is there a graphical user interface? . . . . . . . . . . . . . . . . . . . 165
A.1.4 Can I use Diva to interpolate measurements from satellite? . . . . . . 165
A.1.5 How to report a bug or a problem? . . . . . . . . . . . . . . . . . . . 165
A.1.6 How to register to the user group? . . . . . . . . . . . . . . . . . . . 166
A.1.7 How can I use Diva in R, Matlab, IDL, Ferret or any other software . 166
A.1.8 What value for parameter ireg should I choose for a semi-normed
analysis . . . . . . . . . . . . . . . . . . . . . . . . . . . . . . . . . 167
A.1.9 How can one create monthly analysis where the reference field is the
annual analysis? . . . . . . . . . . . . . . . . . . . . . . . . . . . . 168
A.1.10 How to contribute to the development? . . . . . . . . . . . . . . . . 168
A.1.11 How can I run Diva on a multi-processor machine? . . . . . . . . . . 169
A.1.12 What is the resolution of the output field? . . . . . . . . . . . . . . . 169
A.1.13 Why is there an iterative solver? . . . . . . . . . . . . . . . . . . . . 170
A.1.14 Can Diva deal with several measurements at the same location? . . . 170
A.1.15 How to run Diva in operational or real-time mode? . . . . . . . . . . 170
A.1.16 How to run Diva on the Lemaitre2 cluster ? . . . . . . . . . . . . . . 171
A.2 Error messages . . . . . . . . . . . . . . . . . . . . . . . . . . . . . . . . . 172
A.2.1 "Command not found" message . . . . . . . . . . . . . . . . . . . . 172
A.2.2 Analysed field with white boxes near boundaries . . . . . . . . . . . 173
A.2.3 Command-line scripts not working . . . . . . . . . . . . . . . . . . . 173
A.2.4 Compilation problems . . . . . . . . . . . . . . . . . . . . . . . . . 175
A.2.5 Why do I get this error? . . . . . . . . . . . . . . . . . . . . . . . . 175
A.2.6 Undefined references to NetCDF routines . . . . . . . . . . . . . . . 177
A.2.7 Resource temporarily unavailable . . . . . . . . . . . . . . . . . . . 177
A.2.8 Error of allocation . . . . . . . . . . . . . . . . . . . . . . . . . . . 178
A.2.9 Permission denied for execution of diva.a . . . . . . . . . . . . . 179
A.2.10 Problem with contour generation . . . . . . . . . . . . . . . . . . . . 179
A.2.11 Analysis yields empty field . . . . . . . . . . . . . . . . . . . . . . . 180
A.2.12 Windows runs out of virtual memory during diva execution . . . . . . 182
164
Chapter A. PROBLEMS. . . AND
SOLUTIONS!
A.1. FAQ
A.2.13 "Cannot move directory" . . . "permission denied" messages . . . . . . 182
A.3 Solved problems . . . . . . . . . . . . . . . . . . . . . . . . . . . . . . . . 183
A.3.1 Jacobian matrix with null determinant . . . . . . . . . . . . . . . . . 183
A.3.2 Analysed field with white stripes . . . . . . . . . . . . . . . . . . . . 184
A.3.3 "Corrupted data file" message . . . . . . . . . . . . . . . . . . . . . 184
A.1
FAQ
A.1.1
Where can I find the latest version?
The latest stable version if available at http://modb.oce.ulg.ac.be/mediawiki/index.php/DIVA#How_
to_get_the_code.3F.
A.1.2
What do I need to install DIVA?
Check Chapter 1 where the requirements and the procedure are described.
A.1.3
Is there a graphical user interface?
Previously, an interface for the 2-D version was available, but is was not up-to-date with respect
to the developments of the code.
Usually, one wants to perform a large number (more than 100) analysis in order to produce a
complete climatology. To this end, it is easier to use command line than to click and wait 100
times.
For the users not familiar with shells and scripts, the web interface (Barth et al., 2010) can be
tried at http://gher-diva.phys.ulg.ac.be/web-vis/diva.html
A.1.4
Can I use Diva to interpolate measurements from satellite?
Yes, it is always possible to perform an interpolation with Diva on this kind of data. However, a
better solution is to take into account not only a single satellite images, but also the information
contained in the images of the previous days. This is done with the software DINEOF (e.g.,
Alvera-Azcárate et al., 2005; Beckers et al., 2006, or http://modb.oce.ulg.ac.be/mediawiki/index.
php/DINEOF).
A.1.5
How to report a bug or a problem?
The preferred option is to send a message to the Diva user group on google:
http://groups.google.com/group/diva_users.
165
Chapter A. PROBLEMS. . . AND
SOLUTIONS!
A.1. FAQ
This has two advantages over emails:
1. The questions is directly sent to all the Diva developers.
2. The issues previously solved are archived and available for other users.
Along with a small description of the problem, add relevant informations that would help us
solving your issue:
• the version of Diva you are using,
• your operating system (O. S.),
• your options for compiling the code
(check file compilation.log in directory DIVA3D/src/Fortran/.
If the problem can be reproduced at the 2-D level (i.e., working in the directory divastripped),
add the input files that generated the problem as well, so that we can check if the issue is
machine-dependent.
To know your O. S. you can type in the shell:
gherulg$ uname -voi
28-Ubuntu SMP Tue Oct 9 19:31:23 UTC 2012 x86_64 GNU/Linux
If you received advice which helped you to solve the problem, please post a comment so that
others know the solution worked.
A.1.6
How to register to the user group?
• Go to http://groups.google.com/group/diva_users and login with a google account (not necessarily a gmail address).
• Follow the "Apply for membership" link. You will be asked to explain why you want to
use Diva.
• Finally click on the "Apply to join this group" button.
You will get an email confirmation once the the application has been reviewed and accepted.
A.1.7
How can I use Diva in R, Matlab, IDL, Ferret or any other software
There are basically two ways:
166
Chapter A. PROBLEMS. . . AND
SOLUTIONS!
A.1. FAQ
a) Using special binaries and preparing fort.* files for Diva
This approach has been taken in the incorporation of Diva into ODV and in the Matlab function
in http://modb.oce.ulg.ac.be/mediawiki/upload/divaformatlab.zip
It requires some time (you can try to understand the matlab function to see how to prepare
the files and recover the results), but has the advantage that you do not need to install Diva,
compilers, NetCDF or Cygwin. It also avoids creation of large subdirectory trees for Diva.
b) Using a full Diva installation and preparation of normal Diva input files
In this case you must have installed the Diva package and have access to either directly unix or
Cygwin shells.
You also need to prepare a shell script that we will call mydivacall in this example, and
which contains the instructions to be to executed with Diva. So typically what you would type
in the command-line session when trying to make the analysis.
#!/bin/bash
export LC_ALL=C
PATH=$PATH:.
cd /home
pwd
echo This is a test
echo Hello Diva world
...
# Then go into the divastripped directory and run the scripts you want
Example file A.1: mydivacall
Then your program has to prepare all input files exactly as for a normal Diva execution. Once
this is done, your program needs to make a system call (look at the documentation of your
program on how to do it). On a Unix machine you would then simply include a command like
call system("/home/<path>/mydivacall")
For a Cygwin system it is more complicated:
call system("c:\cygwin\bin\bash.exe -login -i -c c:/<path>/mydivacall")
Once the script execution is finished, you can read the diva output files with your program and
continue the processing.
A.1.8
What value for parameter ireg should I choose for a semi-normed
analysis
The best option is to choose ireg = 0.
The command divaseminorm performs four operations:
167
Chapter A. PROBLEMS. . . AND
SOLUTIONS!
A.1. FAQ
1. divarefe = computing a reference fields with large value for L (your value multiplied
by 5) and low signal-to-noise ratio (your value divided by 10)
2. divaanom: difference between your data values and the reference field at these data
points
3. divacalc: performs a Diva analysis with the parameters you put in param.par, on
the data anomaly. This is why you should choose ireg=0: you are working with anomalies,
thus no need to subtract any background field.
4. divasumup: reconstruction of the analysed field by summing the reference and anomaly
fields.
A.1.9
How can one create monthly analysis where the reference field is
the annual analysis?
The latest version of divaanom is able to use an existing reference field. This field should be
present as a binary file in the output directory with the name fieldgher.anl.ref, and the
GridInfo.dat file should be present in output/ghertonetcdf/ directory.
An execution of divaanom will provide you with data.dat which contains anomalies
with respect to your reference field (annual analysis in this case). Then you can work with
data.dat as usual.
The last step is to apply divasumup to reconstruct the field by summing the anomaly analysis
and the reference field.
In summary the steps to follow are:
1. apply divadress to the annual data (after the optimisation of the parameters),
2. copy the output fieldgher.anl with the name fieldgher.anl.ref,
3. for each month:
(a) copy the corresponding data file into the input directory,
(b) apply divaanom,
(c) perform an analysis on the anomalies,
(d) apply divasumup.
A.1.10
How to contribute to the development?
Any suggestion concerning the development of the software is welcome. Simply send to the
developers or to the google group, a description of what improvements/tools you would like to
see and we will check if this could be easily added to the general distribution.
168
Chapter A. PROBLEMS. . . AND
SOLUTIONS!
A.1.11
A.1. FAQ
How can I run Diva on a multi-processor machine?
Coarse grain parallelisation
The best option is to copy the whole directory divastripped in the directory in which it is
located, but with a different name (e.g., divastripped2, or divastripped_username1).
The you can run Diva analysis separately in these directories.
Figure A.1: Simultaneous run of Diva.
Fine grain parallelisation
If you compiled Diva for parallel use, you can activate the parallel solver by editing divacalc
and use solver=1
A.1.12
What is the resolution of the output field?
One has to distinguish between 2 resolutions:
1. the resolution brought by the finite-element mesh, of which the characteristic length
should be in agreement with the typical scale of the studied region (based on the data
correlation in Diva);
2. the grid resolution, which can be anything (larger, smaller or similar to the mesh resolution). It means that you can always work with a finer grid, but that does not mean that the
actual resolution will be improved.
So the best resolution you can obtain is the one allowed you by the data you are working with.
169
Chapter A. PROBLEMS. . . AND
SOLUTIONS!
A.1.13
A.1. FAQ
Why is there an iterative solver?
You can activate an iterative solver by editing divacalc and use solver=2. This can be useful if you do not calculate error fields and do not use cross validation techniques but work with
very fine grids. In this case execution time can be reduced. There are some tuning parameters
which can enhance convergence but to exploit them, please contact us.
A.1.14
Can Diva deal with several measurements at the same location?
Yes. In that case (for example: time series, mooring, . . . ) Diva provides an average value.
However, when data locations are very close and values are very different and a huge signalto-noise ratio is used, then you will see artefacts simply showing that you have created a huge
gradient because you said to Diva your data are perfect and yet are very different at very close
stations. Figure A.2 provides an example of a situation with two different measurements at the
same point.
Figure A.2: Results with two data points with values 1 and 3, located in the domain center (0,0), with a
large signal-to-noise ratio. The analyzed field at (0,0) is ≈ 2.
A.1.15
How to run Diva in operational or real-time mode?
The idea is to work on a data set that evolved regularly, let’s say every day. It is assumed that
the files are formatted so that they can be ingested by Diva (either ODV format for 4D runs,
or simple 3-column files for 2D runs), and that a script mydivarun prepares the input files,
execute Diva and copy the results into another directory.
170
Chapter A. PROBLEMS. . . AND
SOLUTIONS!
A.1. FAQ
On Unix-like computers, the software utility cron can be used to schedule a task, such as a
Diva execution. Please consult the documentation relative to cron and crontab, for example:
http://ss64.com/bash/crontab.html or http://cronjob.com/.
To have mydivarun executed every day at 9.15 AM, the crontab has to be edited:
gherulg$ crontab -e
and a line such as
gherulg$ 9 15 * * *
path_to_scripts/mydivarun
is added. If everything goes well, you can skip the rest of this section.
Otherwise, if the script runs properly when called directly from the shell, but not from the
cronjob, it is probably due to the environment variables (PATH, LD_LIBRARY_PATH . . . )
passed by cron are minimal. For example your path used by cron is not the same path that you
have when typing commands. To avoid this problem:
• Use absolute path for your commands. Note that Diva commands (divacalc, divamesh,
. . . ) have to be run from the DIVA3D/divastripped/ directory. Hence in the script
mydivarun, you may write something like
here=$pwd
divadir=path_to_divadir
cd $divadir
./divadress
cd $here
• Manually add the path at the beginning of the script you want to run.
A good idea for debugging is to redirect the standard output and error in text files:
gherulg$ 9 15 * * *
path_to_scripts/mydivarun >
path_to_directory/crontab.out 2>/home/ctroupin/DataOceano/
AVISO/Operational/crontab.err
A list of possible reasons for cron job failure is found at
http://askubuntu.com/questions/23009/reasons-why-crontab-does-not-work.
A.1.16
How to run Diva on the Lemaitre2 cluster ?
1. Copy the whole DIVA directory to your scratch directory on the cluster (don’t forget to
regularly save the important files to your home directory).
2. Recompile the sources with divacompileall.
3. Install dos2unix and (if mandatory) gnuplot in a new directory /bin and add this directory to the $PATH.
171
Chapter A. PROBLEMS. . . AND
SOLUTIONS!
A.2. Error messages
4. Write a submission script to launch a new job (see this example : www.ceci-hpc.be/assets/
doc/submission.sh).
More information can be found at http://www.ceci-hpc.be/
A.2
Error messages
A.2.1
"Command not found" message
MacBook-Pro-de-GHER:divastripped gherulg$ divatest
-bash: divatest: command not found
Why do I get this error?
Although you are in the correct directory, the command is not found. This is because the current
directory (represented by ./) is not in the path of your system.
How to solve it?
You can type
./name_of_the_command
so that the system knows the command is the current directory.
A better solution is to adapt your path by typing:
PATH=$PATH:path_to_diva_directory, where path\_to\_diva\_directory
has to be adapted to your installation.
For example:
ctroupin@predator ~/Software/Diva/DIVA3D/divastripped $ pwd
/home/ctroupin/Software/Diva/DIVA3D/divastripped
ctroupin@predator ~/Software/Diva/DIVA3D/divastripped $export
PATH=$PATH:home/ctroupin/Software/Diva/DIVA3D/divastripped
ctroupin@predator ~/Software/Diva/DIVA3D/divastripped $ echo $
PATH
/usr/local/sbin:/usr/local/bin:/usr/sbin:/usr/bin:/home/
ctroupin/Software/Diva/DIVA3D/divastripped/
For example in cygwin:
• go in the /ect/
• edit file bash.bashrc file and add the following line:
export PATH=$PATH:.
172
Chapter A. PROBLEMS. . . AND
SOLUTIONS!
A.2. Error messages
• type source bash.bashrc in order to take into account the modification made.
A.2.2
Analysed field with white boxes near boundaries
The analysed fields has points of not-a-number (N aN ) values.
Figure A.3: Examples of Diva outputs with zones of N aN at boundaries. For the right the solution to
the problem was applied
Why do I get this error?
This problem arises from the fact that you request the analysis almost exactly on the boundary.
How to solve it?
Internally Diva makes some coordinates changes and therefore roundings on boundary positions. The decision of a point falls in the domain or not can therefore be very sensitive to
rounding if you place a request for analysis "exactly" on the boundary. In real situations, this
very rarely happens, but when you use synthetic test cases, use contours and analysis points
which do not coincide (look at divatest how the contour is made to avoid falling on the grid
points of the analysis).
A.2.3
Command-line scripts not working
Why do I get this error?
End of lines in Unix, Windows and Mac files are different, and this causes problems when
switching from a system to the other. Typically if you visualize a Windows-end-of-line file
under Unix, you will see ends of line with symbols such as ^M or \r. When reading such files,
scripts get in trouble because they expect to read numbers, but instead they find characters.
173
Chapter A. PROBLEMS. . . AND
SOLUTIONS!
A.2. Error messages
Figure A.4: Error messages due to bad ends of lines.
Note: strange behaviours of Diva are often related to this topic, therefore always be aware of
this possible problem before undertaking more complex actions.
Figure A.5: Example of bad ends of lines.
How to solve it?
Working on a individual file, the command
[charles@gher13 divastripped]$ dos2unix
file2convert
does the conversion between Windows and Unix end of lines. According to the Linux distribution, dos2unix may requires options to perform the conversion. For example with Mandriva 2010, it is necessary to add the option -U:
[charles@gher13 divastripped]$ dos2unix
174
-U file2convert
Chapter A. PROBLEMS. . . AND
SOLUTIONS!
A.2. Error messages
As a general rule, use the man command to see how a command is used on your particular
computer. When working with GODIVA, the transformation is automatically done on all the
files.
dos2unix is available using the package manager of most of Linux distributions, but sometimes with the name fromdos.
A.2.4
Compilation problems
Figure A.6: Error message obtained during compilation.
A.2.5
Why do I get this error?
The array S defined in the various programs located in ./src/Fortran/Calc/ is too large
to be handled by your compiler.
How to solve it?
You need to recompile the sources after reducing the values of parameter nrea in file
./src/Fortran/Calc/divainc.h:
PARAMETER(nrea=150000000)
Then use script divacompile to get the new executables (see Section 1.3.1). If you get the
same error message, reduce again the value of nrea.
175
Chapter A. PROBLEMS. . . AND
SOLUTIONS!
A.2. Error messages
Figure A.7: Solution to the resource problem.
Figure A.8: Error message during execution of divacomp with gfortran.
176
Chapter A. PROBLEMS. . . AND
SOLUTIONS!
A.2.6
A.2. Error messages
Undefined references to NetCDF routines
Why do I get this error?
The NetCDF library, required for compiling of netcdfoutput.f and netcdfoutputfield.f, is not compatible with your compiler, or not found by the linker.
How to solve it?
Make sure that divacompileall includes the appropriate link path.
If this is not sufficient, you will have to rebuild the NetCDF library corresponding to your
operating system. Installation and compilation procedures can be at http://www.unidata.ucar.edu/
software/netcdf/docs/netcdf-install/.
A.2.7
Resource temporarily unavailable
Figure A.9: Error message during the run of divacalc.
Why do I get this error?
The diva.a executable requires to much memory to work. This error comes from the operating system limitations.
How to solve it?
First try to cancel all unnecessary tasks running on your machine, possibly rebooting. This will
clean up the system and free up resources. If this is not sufficient, the solution is the same as
case A.2.4: recompile the sources after reducing the values of parameters nrea and nent in
file ./src/Fortran/Calc/divainc.h:
177
Chapter A. PROBLEMS. . . AND
SOLUTIONS!
A.2. Error messages
PARAMETER(nrea=25000000)
PARAMETER(nent=25000000)
If you get the same error message, reduce again the values of nrea and nent.
Note that maximal allowable values for these parameters depends on your compiler and system,
so it is not possible to assign them with universal values.
A.2.8
Error of allocation
Figure A.10: Error message due to allocation problem.
Why do I get this error?
The memory allocation is not sufficient for the Diva to be executed in the case you consider.
This message may appear either during the mesh generation (the required mesh is too fine
considering the size of the domain) or during the resolution itself (i.e., divacalc).
How to solve it?
The solution is nearly the same as the previous case: you need to compile the source again, this
time after increasing the values of nrea and nent.
Additional information ? ? ?
In some uncommon cases, you may not be able to find values of nrea and nent that will allow
you to avoid both problems A.2.7 and A.2.8. In these cases, the recommended solution consists
of:
1. Find the highest values of nrea and nent that allow you not to have message error
A.2.8;
178
Chapter A. PROBLEMS. . . AND
SOLUTIONS!
A.2. Error messages
2. Generate a mesh with a value 3-5 times larger than the correlation length you want to
use for the resolution; this can be done be simply editing file ./input/param.par,
changing the value of correlation length, and run divamesh;
3. Once the mesh is generated, edit again param.par and assign the correct value to the
correlation length, and run an analysis with divacalc.
This procedure should help you to save memory otherwise used for the finite-element mesh.
Working with a coarser mesh will not affect excessively your results.
A.2.9
Permission denied for execution of diva.a
Figure A.11: Error message during execution of divacalc with gfortran.
Why do I get this error?
Although the compilation worked without any message error, diva.a cannot be executed.
This problem seems to occur only with gfortran compiler under Cygwin. Actually the problem
is not related to permission (command chmod will not solve the problem) but with compilation.
As described in problem A.2.7, values of parameters nrea and nent shall be decreased and
the sources recompiled.
How to solve it?
Same as problem A.2.7.
A.2.10
Problem with contour generation
See Fig. A.12.
179
Chapter A. PROBLEMS. . . AND
SOLUTIONS!
A.2. Error messages
Figure A.12: Error message with contour generation.
Why do I get this error?
The number of contours created from a given topography (Section 7.2.2) is too high.
How to solve it?
Modify the first line of contourgen.f (located in ./src/Fortran/Mesh/) and increase
the value of nm:
parameter(nm=5000000)
Additional information
As the default value of nm is already large, you may also consider working with a topography
with lower resolution. This should avoid the creation of of a great number of very small contours
(e.g. Fig. A.13), which will not necessarily add quality to your analysis.
A.2.11
Analysis yields empty field
After the execution of divacalc, you get very small input files, with only one grid point.
Why do I get this error?
The most frequent reason is that the param.par file has been modified during the execution
of (Generalised) Cross Validation and the process was interrupted before it ends, leaving a
parameter file similar to A.14. Note that in order to save computational time, nx and ny are set
to 1, since the analysis at every grid points is not necessary.
180
Chapter A. PROBLEMS. . . AND
SOLUTIONS!
A.2. Error messages
Figure A.13: Small contours created from DBDBV topography in the
North Atlantic at 4500 m depth.
Figure A.14: File param.par resulting from an interruption of divagcv.
181
Chapter A. PROBLEMS. . . AND
SOLUTIONS!
A.2. Error messages
How to solve it?
Simply edit param.par to write the correct values of nx and ny, then run again divacalc
(or divadress) to have an analysis on the desired grid.
A.2.12
Windows runs out of virtual memory during diva execution
Why do I get this error?
The problem arises probably because you have a computer with little RAM.
Diva uses a memory allocation for the largest problem encountered. This translates in Windows
to a request of virtual memory of around 1.3 Gb. During execution, the real memory used can
be much smaller than that and the problem actually fit in real memory, even if you have less
than 1 Gb RAM.
The only problem is that if your Windows virtual memory (the swap file) is not big enough,
Diva will not execute.
How to solve it?
The best solution would be to add real memory (your computer would benefit from it anyway),
but to make Diva work you can simply increase the virtual memory of Windows by changing
the windows settings. As administrator:
my computer
right click
-> properties -> advanced -> performance
-> settings -> advanced -> change
Put there a virtual memory (swap file) of 2 Gb (initial and maximum) and Diva should run.
Other solution consists of recompiling with lower nrea value (see problem A.2.4).
A.2.13
"Cannot move directory" . . . "permission denied" messages
Why do I get this error?
An application has opened one or several files located in the directory you want to (re)move, so
that it is impossible to perform the operation.
How to solve it?
Simply close the application(s) that open the files of the concerned directory.
182
Chapter A. PROBLEMS. . . AND
SOLUTIONS!
A.3
A.3. Solved problems
Solved problems
The following problems should not appear any more in the latest version of Diva. Should you
encounter them, please contact us.
A.3.1
Jacobian matrix with null determinant
The value of the Jacobian determinant is zero (Fig. A.15).
Figure A.15: Examples of Diva execution with problem with the Jacobian matrix.
Why do I get this error?
This messages comes from a problem in the mesh generation: some of the triangular elements
are too deformed and generate a null value for the determinant. Then the solver cannot work,
since it needs to inverse the Jacobian matrix.
183
Chapter A. PROBLEMS. . . AND
SOLUTIONS!
A.3. Solved problems
How to solve it?
This problem was fixed in latest versions of Diva.
A.3.2
Analysed field with white stripes
The analysed fields has stripes of N aN values.
Figure A.16: Examples of Diva outputs with random zones of N aN .
Why do I get this error?
This problem comes from a too aggressive optimisation to create executable diva.a, although
during the compilation, no warning or error was issued.
How to solve it?
This problem has been fixed in latest version of Diva. However, if you are still using older
versions and get this kind of outputs, you can avoid them by changing the compilation flags and
compile the source again. The recommended change is to use ’-O0’ flags instead of ’-O3’
(optimization flags) when compiling the sources located in the Fortran/Calc/ directory.
A.3.3
"Corrupted data file" message
Why do I get this error?
This problem was observed when decimal numbers were written with commas instead of points.
How to solve it?
Simply convert the decimal separator (e.g. using the commands described in the beginning of
Chapter 6).
184
Chapter A. PROBLEMS. . . AND
SOLUTIONS!
A.3. Solved problems
Figure A.17: Error message during the reading of the data file.
185
Chapter A. PROBLEMS. . . AND
SOLUTIONS!
A.3. Solved problems
Additional information
The behaviour of awk is susceptible to change the points into commas when used in awkfilter
or other routines. To fix the problem, simply replace
gawk
by
LC_ALL=C gawk.
Remark: in latest versions of the code, this bug was fixed by adding
export LC_ALL=C
in the scripts employing awk.
186
B D IVA
CODE
The engine of Diva is a set of Fortran subroutines driven by local input and output files (fort.*).
This chapter is dedicated to the description of these programs, in order to allow the advanced
user to adapt the code according to his needs.
Contents
B.1 Fortran code . . . . . . . . . . . . . . . . . . . . . . . . . . . . . . . . . . 187
B.1.1
Calculation programs . . . . . . . . . . . . . . . . . . . . . . . . . . 188
B.1.2
Mesh programs . . . . . . . . . . . . . . . . . . . . . . . . . . . . . 189
B.1.3
Pipetest . . . . . . . . . . . . . . . . . . . . . . . . . . . . . . . . . 190
B.1.4
Utilities . . . . . . . . . . . . . . . . . . . . . . . . . . . . . . . . . 190
B.1.5
NetCDF output . . . . . . . . . . . . . . . . . . . . . . . . . . . . . 191
B.1.6
GUI programs . . . . . . . . . . . . . . . . . . . . . . . . . . . . . 192
B.2 Input and output files for the executables . . . . . . . . . . . . . . . . . . 192
B.1
B.2.1
Mesh generation: generopt.a . . . . . . . . . . . . . . . . . . . 193
B.2.2
Diva interpolation: diva.a . . . . . . . . . . . . . . . . . . . . . . 194
B.2.3
Detrending calculation: detrend.a . . . . . . . . . . . . . . . . . 196
Fortran code ? ? ?
The Fortran programs are sorted according to their purpose:
[charles@gher13 Fortran] tree -d -L 1
.
|-- Calc
|-- Extensions
|-- Mesh
|-- NC
|-- NoPlplot
|-- Pipetest
|-- Plplot
|-- Stabil
‘-- Util
9 directories
187
Chapter B. DIVA CODE
B.1.1
B.1. Fortran code
Calculation programs [src/Fortran/Calc]
The main file of the Fortran code is diva.f: this routine calls the subroutines enumerated
below, in order to perform a Diva analysis:
mathpr.f : describes the mathematical problem.
topolo.f : describes the topology of the finite element grid.
meshgn.f : generates a square finite element mesh on a regular grid.
datapr.f : input of data to be fitted by spline smoothing.
bcondi.f : Dirichlet boundary conditions to be fixed.
constr.f : input of information for constraint implementation.
solver.f : builds and solves the global linear finite element system.
stores.f : storage of the solution.
esterr.f : estimates the analysis error (same grid as the analysis).
coord.f : coordinate change (longitude, latitude) to (x, y) and (x, y) to (longitude, latitude)
if requested.
gcvfac.f : estimates the analysis error by generalized cross-validation.
dataqc.f : data quality check: estimates of expected data-analysis differences.
covar.f : calculation of Diva kernel for subsequent error fields.
Other routines related to Diva calculation:
allody.f : dynamical allocation of storage area in S or L vector.
bilinin.f : interpolates from a regular field into xt, yt; called in constr.f.
finca.f : finds in which region is one point.
optimi.f : subroutines used for the optimisation:
divesp.f: subdivides the space for optimisation;
sizes2.f: computes the size of the space for elements of type 2;
sizes3.f: computes the size of the space for elements of type 3;
repel2.f: distributes the elements of type 2 in kntc table;
repel3.f: distributes the elements of type 2 in kntc table;
locpt2opti.f: locates the (x, y) point in the structure (for ityp=2);
locpt3opti.f: locates the (x, y) point in the structure (for ityp=3);
188
Chapter B. DIVA CODE
B.1. Fortran code
sortdopti.f: sorts the data according to the sequence of elements;
qs2i1r.f: quick Sort algorithm for sortdopti (from www.netlib.org);
calpsoopti: computes pseudo data sets for error estimates;
fcorropti.f: part of calpsoopti;
tabess.f: tabulates the Bessel function for the calculation of error.
repeltest.f : called in datapr.f
shapef.f : evaluation of the shape functions at Gauss points.
utilit.f : utility routines.
uur.f : for the advection constraint.
uwrit2.f : writes the field C(I, J, K).
varl.f : for variable correlation length.
vtools.f : various subroutines:
intsec: calculate center coordinates of quadrangular element;
istria: check if one point lies inside a triangle;
prskyh: print a vector to check.
B.1.2
Mesh programs [src/Fortran/Mesh]
Files related to the generation of coastlines:
contourcheck.f : check the format of an existing contour file (no repeated points, no
crossing, contour not too fine).
contourgen.f : create contours based on topography;
coa2cont.f : go from ODV .coa files (see documentation of ODV) to Diva coast.cont
files, using a resolution comparable to the specified gridded output of divacalc.
Files related to mesh generation:
generopt.f : generate a multi-connex 2D mesh with the Delaunay triangulation;
generopt4.f : same as generopt but in real*4 precision;
generopt8.f : same as generopt but in real*8 precision.
189
Chapter B. DIVA CODE
B.1.3
B.1. Fortran code
Pipetest [src/Fortran/Pipetest]
File piperw.f checks if pipes are supported by your Diva installation. Pipes support is automatically tested when you run divatest (Section 1.4). Issues with pipes were observed with
some versions of the gfortran compiler.
B.1.4
Utilities [src/Fortran/Util]
alpha.f computes the values of α0 and α1 .
calcest.f : from relative weight on data points (data file fort.44) and generalized cross
validator value (available in ./output/gcvval.dat), produces the file containing
the expected misfit value at data locations (fort.76), to be used by lookforoutliers.a
for outliers detection. Used in divaqcter.
calcestbis.f : from relative weight on data points (data file fort.44) and the trace of
the analysis matrix (available in ./output/gcvval.dat) produces the file containing the expected misfit value at data locations (fort.76), to be used by lookforoutliers.a for outliers detection. Used in divaqcbis.
calcmu.f computes the coefficient µ knowing the characteristic length L and the signal-tonoise ratio λ.
cverror.f : rms error by cross validation (called in divacvrand).
cverroraii.f : same as cverror.f but using the missing-data lemma (called in divacv).
cvtotalerror.f : sum of the different error contributions, in the resampling case (called
in divacvrand).
datacheck.f : take the input data ./input/data.dat and eliminates all data that fall
outside the bounding box of the contours (called in divadataclean).
datadiff.f : compute data anomaly (called in divaanom)
dbdb2diva.f : converts topography extracted from Navy website into Diva compatible format (Section 7.1.5).
gebco2diva.f : converts topography extracted from GEBCO website into Diva compatible
format (Section 7.1.2).
findmin.f : from a list of values (SNR, GCV, data-variance) found in fort.11, tries to
find by local parabolic interpolation the minimum of GCV and the place SNR where it is
found.
Points do not need to be ordered. Output (fort.12) contains the expected value of λ in
which GCV is minimal as well as the VARBAK value. Used in divagcv.
Called in divacv,divacvrand anddivagcv.
190
Chapter B. DIVA CODE
B.1. Fortran code
fitlsn.f : from the data file (fort.10) and information on coordinate change and reference field (fort.11), tries to fit the Bessel covariance function to the data covariance
(called in divafit).
Outputs:
fort.66 contains the correlation length and an rough estimate of the signal-to-noise
ratio;
fort.99 contains the data-covariance over all distances;
fort.98 contains the data covariance as a function of data-distance as well as the corresponding fit over distances up to the correlation length.
forgnuplot*.f consists in nine files for preparing the outputs to be viewed with the help
of gnuplot(see Section 9.1).
griddef.f creates the file GridInfo.dat, of which the content is used for writing the
NetCDF output.
lceleme.f computes the mesh characteristic length (called in divacck and divamesh).
lookforoutliers.f checks if there is outliers in the data provided for the analysis (called
in divacalc, divaqcbis and divaqcter).
multiply.f does what its name says (called in divarefe).
subsampling.f creates a subsampling of the data (called in dvsample).
sumgrid.f performs the sum of two gridded fields in GHER format (called in divasumup).
sumup.f performs the sum element by element of two ascii files (called in divasumup).
topoprep.f makes easier the generation of the topography using a collection of local measurements (called in divatopo).
Remark: grid definition for users is based on an origin which is the first grid point. In the
code, xori and yori are defined by xi = xori +i∆x (and is thus shifted one grid space to
the left compared to the user origin). Input file fort.13 is modified from the param.par
grid information by griddef.a accordingly, while GridInfo.dat contains the user grid
as defined in param.par.
B.1.5
NetCDF output [src/Fortran/NC]
Three files allow getting an output in NetCDF format:
netcdfoutputfield.f, netcdfoutputerror.f, netcdfoutput.f.
The two first routines write the analysed and the error fields in two different NetCDF files:
anlysed_field.nc and error_field.nc. The last programs generates results.nc
which contains both the analysis and the error fields. The information required for the coordinates (xorigin, yorigin, dx, dy, nx, ny) are read from GridInfo.dat.
191
B.2. Input and output files for the
executables
Chapter B. DIVA CODE
1
1
.5
.5
100
100
Example file B.1: GridInfo.dat
B.1.6
GUI programs [src/Fortran/Extensions]
The graphical interface requires some particular routines:
extract.f : interface to select or extract Data from MODB and MED formatted databases.
fem3d.f is based upon a mesh file and a bathymetry file (regular grid in GHER format); it
creates a result file containing information to determinate if a mesh is in land or is sea,
for a given depth.
concat.f is used to create the 3D file from the 2D files.
stiff.f generates the rigidity file (fort.60) in the 3D case.
mask.f masked the solution according to the bathymetry and the depth.
sum.f writes the sum of two fields (with same dimensions) in GHER format.
substref.f subtracts the reference field to the computed solution (only available when using the semi-normed reference field).
header2.f and visu.f are subroutines to visualize the data, the mesh and the solution
(requires the PlPlot library). Two versions of visu.f are provided: one is located in
diva-4.3/src/Fortran/PlPlot and the other in src/Fortran/NoPlPlot.
The first can be compiled only if you have installed the PlPlotlibrary on your computer
(for now, only under Linux).
B.2
Input and output files for the executables
This section describes the input and output files fort.* related to the executables or binaries,
which are the files ending by .a and located in GODIVA_mm_yyyy/DIVA3D/bin/.
192
B.2. Input and output files for the
executables
Chapter B. DIVA CODE
B.2.1
Mesh generation: generopt.a
Files readed as input
fort.10: coast file (identical to coast.cont), see example file with description, case of a
square island in a square sea.
fort.11: the parameters required for the mesh generation.
Files produced as output
fort.22: contains the finite-element mesh, as described here:
1. the first part of the file has three columns: the first column gives the numbers of
the nodes; the second and third ones give the x− and y−coordinates of the nodes,
respectively.
Example: first line indicates that node no. 1 is located in (−1, −1).
2. the second part is composed of only one column, which indicates the numbers of
the interfaces;
3. the last part has six columns: columns 1, 3 and 5 specify the line numbers where
the coordinates of the triangle points can be found; columns 2, 4 and 6 specify the
interfaces numbers of the considered element.
Example: the last line says that the last elements has its coordinates in lines 2, 3 and
5, i.e., at has points (1, −1), (1, 1) and (−0.3333333430.333333343); it also says
that this element is composed of interfaces no. 13, 8 and 12.
1 -1. -1.
9 1. -1.
4 1. 1.
10 -1. 1.
7 -0.333333343 0.333333343
5
11
6
12
8
2
13
3
3 -6 4 -7 5 -8
4 -9 1 -10 5 -7
1 -11 2 -12 5 -10
2 -13 3 -8 5 -12
Example file B.2: fort.22
193
B.2. Input and output files for the
executables
Chapter B. DIVA CODE
Figure B.1: Example of simple mesh corresponding to file fort.22.
fort.23: contains the topological parameters:
1. total number of vertex nodes (red dots);
2. total number of interfaces (black lines);
3. total number of elements (green triangles).
5
8
4
Example file B.3: fort.23
B.2.2 Diva interpolation: diva.a
Files read as input
fort.10: divawork organizer, defining which modules to use and how, including several
parameters.
fort.11: finite-element mesh, copy of the fort.22 produced by generopt.a.
fort.12: α0 and α1 , calculated as:
α0 =
1
L4
and
194
α1 =
2
.
L2
B.2. Input and output files for the
executables
Chapter B. DIVA CODE
fort.13: characteristics of the regular output grid.
fort.20: data file; 4 columns: |X|Y |data(X, Y )|µ|, where
µ = 4π
λ
,
L2
with λ, the signal-to-noise ratio.
fort.79: coordinates where analysed field values are requested; 2 columns separated by
space: |X|Y |.
fort.15: parameter varbak, variance of the background field, set as = 0 will avoid calculating error field.
coord 1
0
mathpr 1
2 -> ITYP
0 -> ISYM
2 -> IPB
topolo 1
158 -> Number of Vertex Nodes
426 -> Number of Interface Nodes
268 -> Number of Elements
datapr 1
1
solver 1
0
stores 1
1 -> 1 if normal or semi-normed final, otherwise 3
esterr 1
stopex
Example file B.4: fort.10
0.0001 -> alpha0
0.02 -> alpha1
Example file B.5: fort.12
0 0 -> xorigin, yorigin
1 1 -> dx, dy
100 100 -> nx, ny
-99999 -> Exclusion Value
Example file B.6: fort.13
195
90 90 1 12.5663706
90 80 1 12.5663706
90 70 1 12.5663706
···
16 30 2 12.5663706
16 20 2 12.5663706
16 10 2 12.5663706
Example file B.7: fort.20
Files produced as output
fort.71: field value at data points given in fort.20, ascii format.
fort.72: error value at data points given in fort.20, ascii format.
fort.73: error at points given in fort.79, ascii format.
fort.82: field value at points given in fort.79, ascii format.
fort.83: field on regular grid, ascii format.
fort.84: field on regular grid, gher format.
fort.86: error field on regular grid, ascii format.
fort.87: error field on regular grid, gher format.
B.2.3
Detrending calculation: detrend.a
The execution of detrend.a will create a new ./input/data.dat.
Files read as input
fort.88: original data file.
fort.89: analysis at data points.
Files produced as output
fort.90: modified data file with data detrended by groups and classes.
trends.1.dat: trends for classes of group 1.
trends.2.dat: trends for classes of group 2.
...
196
C VADEMECUM
The DIVADEMECUM is a four-page summary of the commands and the input/output files you
have to deal with when using Diva.
Contents
C.1 Scripts and actions . . . . . . . . . . . . . . . . . . . . . . . . . . . . . . . 198
C.2 Workflow . . . . . . . . . . . . . . . . . . . . . . . . . . . . . . . . . . . . 199
C.3 Input files . . . . . . . . . . . . . . . . . . . . . . . . . . . . . . . . . . . . 200
C.4 Output files . . . . . . . . . . . . . . . . . . . . . . . . . . . . . . . . . . . 201
197
C.1
Scripts and actions
Table C.1: DIVADEMECUM: Diva in- and outputs. When not specified differently, input files are from
directory ./input and output files are placed in directory ./output. Script divarefe takes the
same inputs as divacalc while divaanom and divasumup use no other user-provided files than
the other scripts. Brackets [ ] enclose optional files or parameters. Ex. [-r] will replace an input file
by the outputs from the scripts.
Input
mycase/input/*
topo.dat
param.par
topo.asc
topo.gebco
TopoInfo.dat
topo.grd
[contour.depth]
param.par
coast.coa
param.par
coast.cont
../*/fort.*
data.dat
coast.cont
[./output/fieldatdatapoint.anl]
data.dat
coast.cont
[./output/fieldgher.anl]
param.par
data.dat
param.par
coast.cont
[coast.cont.dens]
gcvsampling.dat
param.par
data.dat
divamesh outputs
[Uvel.dat,Vvel.dat
UVinfo.dat, constraint.dat]
[RL.dat, RLinfo.dat]
param.par
data.dat
divamesh outputs
[Uvel.dat,Vvel.dat
UVinfo.dat, constraint.dat]
[RL.dat, RLinfo.dat]
[valatxy.coord]
param.par
data.dat
./output/meshvisu/*
[Uvel.dat,Vvel.dat
UVinfo.dat, constraint.dat]
[RL.dat, RLinfo.dat]
Action
Execution
load new case
divaload mycase
make gridded topography
divatopo [-r]
use dbdb or gebco topography
dbdb2diva [-r]
gebco2diva [-r]
TopoInfo.dat [./input/TopoInfo.dat]
topo.grd [./input/topo.grd ]
TopoInfo.dat [./input/TopoInfo.dat]
topo.grd [./input/topo.grd ]
coast.cont.* [./input/coast.cont.*]
use ODV contours
divacoa2cont [-r]
coast.cont [./input/coast.cont]
check hand-made contours
divacck [-r] [-v]
coast.cont.checked [./input/coast.cont]
clean up directories
divaclean
eliminate useless data
divadataclean [fmin fmax ]
./input/data.dat
bins of data coverage
divadatacoverage [-n] [-r]
estimate L and S/N
divafit [n] [-r]
DATABINS*.dat
RL*.dat
covariance.dat
covariancefit.dat
paramfit.dat
param.par.fit [./input/param.par]
make FE mesh
divamesh
divamesh outputs
optimise S/N by cross-validation
divacv [-r]
divacvrand ns nt [-r]
divagcv [-r]
gcv.dat
gcvsnvar.dat
gcvval.dat
param.par.gcv [./input/param.par]
make analysis
divacalc
perform full quality control
divaqc
perform simple quality control
divaqcbis
param.par
data.dat
divacalc outputs
perform simple quality control
divaqcter
./output/*
./input/*
make contours
divacont [-r]
param.par
data.dat
divacalc outputs
./output/*
Output
make some plots
divagnu [fmin fmax ]
save results
divasave mycase
198
GridInfo.dat
field*.anl
error*.anl
*.nc
[valatxyascii.anl]
outliers.dat
outliers.normalized.dat
outliersbis.dat
outliersbis.normalized.dat
outlierster.dat
outlierster.normalized.dat
./gnuwork/plots/*
mycase/outut/*
C.2
Workflow
Figure C.1: Scripts used in the command-line version of Diva; optional arguments are between [].
199
C.3
Input files
# Correlation length (in units of data, if degrees: S-N)
1
# icoordchange (-xscale, 0=none, 1=degtokm, 2=sin projection)
0
# ispec (error output files required)
7
# ireg (subtraction of reference field 0: no, 1:mean, 2:plane)
0
# xori (origin of output regular grid, min values of x)
-4.999
# yori (origin of output regular grid, min values of y)
-4.999
# dx (x-step of output grid)
0.1999
# dy (y-step of output grid)
0.1999
# nx number of x points of output grid
51
# ny number of y points of output grid
51
# valex (exclusion value)
-9999.0
# snr signal to noise ratio
10
# varbak variance of the background field
1
100 10
constraint.dat file content.
First value = weight on advection constraint,
second value=diffusion coefficient in advection/diffusion equation.
0.01
0.03
0.1
0.3
1
3
10
30
100
param.par file content. Parameters are selfexplaining, except for error output specifica- gcvsampling.dat file content. A list of
tion. ispec=0 means no error field requested; trial values for the signal-to-noise ratio used in
add +1 for a gridded error field, +2 for error at cross validation tools.
data location and +4 for error at coordinates defined in valatxy.coord. From there if you
1000
want
750
• error based on real covariance:
ispec ← -ispec
• error based on real covariance with boundary effect: ispec ← -ispec-10
• poor man’s error estimate (quick and underestimated error field): ispec ← ispec+10
500
400
300
200
100
0
contour.depth file content with depths for
contours and subsequent analysis.
(ex: ispec=12 makes a poor man’s error estimate at
0
data locations)
10
0.1
0.2
101
51
-5 22 34.8
-2 19 36.1
...
data.dat file content. Simple ascii file with
x,y,val and optional fourth column containing the relative weight on the data (large value
= high confidence).
topo.dat is just a special case where the third
column represents depth (positive for sea values).
*info.dat file describing the gridding
parameters
of
binary
gridded
files
such
as
Uvel.dat,
topo.grd, RL.dat, fieldgher.anl,
errorfieldgher.anl.
Here first grid
point in (0, 10), with steps (0.1, 0.2) and
101 × 51 grid points. Look at examples how to
read/write binary files with Fortran or Matlab
200
C.4
Output files
0.50E+01 1131 0.16E+02 0.43E+02 0.38E+02 0.37E+02 0.13E+00
...
flag
ident
x
y
dataval
Correlation length (in degrees latitude)
3.69890785
Signal to noise ratio
0.902823746
VARBAK
16.7839489
For information: correlation length in km is
analysis expected-misfit
outliers*.dat Sorted outliers, from most
suspect to least suspect. Column 1: outlier indicator (larger than 3 suspect), following columns: data identifier, x and y coordinates, original data value, analysed data value,
expected misfit.
412.962524
paramfit.dat Self explaining output from
divafit. When option [-r] is used with
divafit, an adapted param.par will be
placed in ./input.
S/N
1.99764168
VARBAK
1.14215052
gcvsnvar.dat Self explaining output from
divacv, divagc, divacvrand. When
option [-r] is used with cross validation,
an adapted param.par will be placed in
./input.
201
U SEFUL
SeaDataNet Home Page
http://www.seadatanet.org/
Diva Home Page
http://modb.oce.ulg.ac.be/mediawiki/index.php/DIVA
GHER Home Page
http://modb.oce.ulg.ac.be/
Ocean Data View
http://odv.awi.de/
NetCDF
http://www.unidata.ucar.edu/software/netcdf/
Msys
http://www.mingw.org/msys.shtml
Cygwin
http://www.cygwin.com/
Python
http://www.python.org/
Matlab
http://www.mathworks.com/
Gnuplot
www.gnuplot.info/
University of Liège
http://www.ulg.ac.be/
202
LINKS
B IBLIOGRAPHY
Abramowitz, M. & Stegun, I. A. (1964). Handbook of Mathematical Functions with Formulas,
Graphs, and Mathematical Tables. Dover, New York.
Alvera-Azcárate, A., Barth, A., Beckers, J.-M. & Weisberg, R. (2007a). Multivariate reconstruction of missing data in sea surface temperature, chlorophyll and wind satellite fields.
Journal of Geophysical Research, 112: C03008. doi:10.1029/2006JC003660.
Alvera-Azcárate, A., Barth, A., Beckers, J.-M. & Weisberg, R. H. (2007b). Correction to Multivariate reconstruction of missing data in sea surface temperature, chlorophyll, and wind
satellite fields. Journal of Geophysical Research, 112: C05099. doi:10.1029/2007JC004243.
Alvera-Azcárate, A., Barth, A., Rixen, M. & Beckers, J.-M. (2005). Reconstruction of incomplete oceanographic data sets using Empirical Orthogonal Functions. Application to the
Adriatic Sea. Ocean Modelling, 9: 325–346. doi:10.1016/j.ocemod.2004.08.001.
Alvera-Azcárate, A., Barth, A., Sirjacobs, D., & Beckers, J.-M. (2009). Enhancing temporal
correlations in EOF expansions for the reconstruction of missing data using DINEOF. Ocean
Science, 5(4): 475–485. doi:10.5194/os-5-475-2009.
URL www.ocean-sci.net/5/475/2009/
Barth, A., Alvera-Azcárate, A., Troupin, C., Ouberdous, M. & Beckers, J.-M. (2010). A web
interface for griding arbitrarily distributed in situ data based on Data-Interpolating Variational
Analysis (DIVA). Advances in Geosciences, 28: 29–37. doi:10.5194/adgeo-28-29-2010.
URL www.adv-geosci.net/28/29/2010/
Barth, A., J.-M-Beckers, Troupin, C., Alvera-Azcárate, A. & Vandenbulcke, L. (????).
divand-1.0: n-dimensional variational data analysis for ocean. Submitted to.
Beckers, J.-M., Barth, A. & Alvera-Azcárate, A. (2006). DINEOF reconstruction of clouded
images including error maps. Application to the sea-surface temperature around Corsican
island. Ocean Science, 2: 183–199. doi:10.5194/os-2-183-2006.
URL http://www.ocean-sci.net/2/183/2006/
Beckers, J.-M., Barth, A., Troupin, C. & Alvera-Azcárate, A. (2013). Some approximate and
efficient methods to assess error fields in spatial gridding with DIVA (Data Interpolating Variational Analysis). doi:10.1175/JTECH-D-13-00130.1. Journal of Atmospheric and Oceanic
Technology.
Beckers, J.-M. & Rixen, M. (2003). EOF calculation and data filling from incomplete oceanographic datasets. Journal of Atmospheric and Oceanic Technology, 20(10): 1839–1856.
doi:10.1175/1520-0426(2003)020<1839:ECADFF>2.0.CO;2.
Bhaskar, T. V. S. U., Jayaram, C. & Rao, E. P. R. (2012). Comparison between Argo-derived sea
surface temperature and microwave sea surface temperature in tropical Indian Ocean. Remote
Sensing Letters, 4(2): 141–150. doi:10.1080/2150704X.2012.711955.
203
Boyer, T. P., Antonov, J. I., Baranova, O. K., Garcia, H. E., Johnson, D. R., Locarnini, R. A.,
Mishonov, A. V., O’Brien, T. D., Seidov, D., Smolyar, I. V. & Zweng, M. M. (2009). World
Ocean Database 2009, Chapter 1: Introduction. Tech. rep., U.S. Government Printing Office,
Washington, D.C. 216 pp.
Brankart, J.-M. & Brasseur., P. (1996). Optimal analysis of in situ data in the Western
Mediterranean using statistics and cross-validation. Journal of Atmospheric and Oceanic
Technology, 13: 477–491. doi:10.1175/1520-0426(1996)013<0477:OAOISD>2.0.CO;2.
URL
http://journals.ametsoc.org/doi/abs/10.1175/1520-0426%281996%29013%3C0477%
3AOAOISD%3E2.0.CO%3B2
Brankart, J.-M. & Brasseur, P. (1998). The general circulation in the Mediterranean Sea: a
climatological approach. Journal of Marine Systems, 18(1-3): 41–70. doi:10.1016/S09247963(98)00005-0.
URL http://www.sciencedirect.com/science/article/pii/S0924796398000050
Brasseur, P. (1994). Reconstruction de champs d’observations océanographiques par le Modèle
Variationnel Inverse: Méthodologie et Applications. Ph.D. thesis, University of Liège.
Brasseur, P., Beckers, J.-M., Brankart, J.-M. & Schoenauen, R. (1996). Seasonal temperature
and salinity fields in the Mediterranean Sea: Climatological analyses of a historical data set.
Deep-Sea Research I, 43(2): 159–192. doi:10.1016/0967-0637(96)00012-X.
URL http://www.sciencedirect.com/science/article/pii/096706379600012X
Brasseur, P. & Haus, J. (1991). Application of a 3-D variational inverse model to the analysis
of ecohydrodynamic data in the Northern Bering and Southern Chukchi Seas. Journal of
Marine Systems, 1: 383–401. doi:10.1016/0924-7963(91)90006-G.
Brasseur, P. P. (1991). A variational inverse method for the reconstruction of general circulation
fields in the northern Bering Sea. Journal of Geophysical Research, 96(C3): 4891–4907.
doi:10.1029/90JC02387.
URL http://www.agu.org/pubs/crossref/1991/90JC02387.shtml
Bretherton, F. P., Davis, R. E. & Fandry, C. (1976). A technique for objective analysis and
design of oceanographic instruments applied to MODE-73. Deep-Sea Research, 23: 559–
582. doi:10.1016/0011-7471(76)90001-2.
Capet, A., Troupin, C., Carstensen, J., Grégoire, M. & Beckers, J.-M. (2013). Recognizing
temporal trends in spatial interpolation: an application to the Black Sea Cold Intermediate
Layer. Submitted to Ocean Dynamics.
Chilès, J.-P. & Delfiner, P. (1999). Geostatistics: Modeling spatial uncertainty.
Interscience, 1st edn., 720 pp. ISBN 0-471-08315-1.
Wiley-
Craven, P. & Wahba, G. (1978). Smoothing noisy data with spline functions. Numerische
Mathematik, 31(4): 377–403. doi:10.1007/BF01404567.
Cressman, G. P. (1959). An operational objective analysis system. Monthly Weather Review,
87(10): 367–374. doi:10.1175/1520-0493(1959)087<0367:AOOAS>2.0.CO;2.
204
Delhomme, J. (1978). Kriging in the hydrosciences. Advances in Water Resources, 1(5): 251–
266. doi:10.1016/0309-1708(78)90039-8.
Denis-Karafistan, A., Martin, J.-M., Minas, H., Brasseur, P., Nihoul, J. & Denis, C. (1998).
Space and seasonal distributions of nitrates in the mediterranean sea derived from a variational inverse model. Deep-Sea Research I, 45(2-3): 387–408. doi:10.1016/S09670637(97)00089-7.
URL http://www.sciencedirect.com/science/article/pii/S0967063797000897
Franke, R. (1985). Thin plate splines with tension. Computer Aided Geometric Design, 2(1-3):
87–95. doi:10.1016/0167-8396(85)90011-1.
Gandin, L. S. (1965). Objective analysis of meteorological fields. Tech. rep., Israel Program
for Scientific Translations, Jerusalem.
Girard, D. (1989). A fast Monte-Carlo cross-validation procedure for large least squares problems with noisy data. Numerische Mathematik, 56(1): 1–23. doi:10.1007/BF01395775.
Gomis, D., Ruiz, S. & Pedder, M. (2001). Diagnostic analysis of the 3D ageostrophic circulation
from a multivariate spatial interpolation of CTD and ADCP data. Deep-Sea Research, 48(1):
269–295. doi:10.1016/S0967-0637(00)00060-1.
Hartman, L. & Hössjer, O. (2008).
Fast kriging of large data sets with Gaussian
Markov random fields. Computational Statistics & Data Analysis, 52(5): 2331–2349.
doi:10.1016/j.csda.2007.09.018.
Kaplan, A., Kushnir, Y. & Cane, M. A. (2000). Reduced space optimal interpolation of
historical marine sea level pressure: 1854-1992*. Journal of Climate, 13(16): 2987–3002.
doi:10.1175/1520-0442(2000)013<2987:RSOIOH>2.0.CO;2.
URL
http://journals.ametsoc.org/doi/abs/10.1175/1520-0442%282000%29013%3C2987%
3ARSOIOH%3E2.0.CO%3B2
Karafistan, A., Martin, J.-M., Rixen, M. & Beckers, J.-M. (2002). Space and time distributions of phosphates in the Mediterranean Sea. Deep-Sea Research I, 49(1): 67–82.
doi:10.1016/S0967-0637(01)00042-5.
URL http://www.sciencedirect.com/science/article/pii/S0967063701000425
Krige, D. G. (1951). A statistical approach to some basic mine valuation problems on the
Witwatersrand. Journal of Geophysical Research, 95: 13529–13541.
Matheron, G. (1963). Principles of geostatistics. J. Chem. Metall and Min. Soc. South Africa,
52: 119–139.
McIntosh, P. C. (1990). Oceanographic data interpolation: objective analysis and splines. Journal of Geophysical Research, 95: 13529–13541.
Nielsen, C., Zhang, W., Alves, L., Bay, N. & Martins, P. (2012). Modeling of Thermo-ElectroMechanical Manufacturing Processes with Applications in Metal Forming and Resistance
Welding. Springer Briefs in Applied Sciences and Technology: Manufacturing and Surface
Engineering. Springer.
205
Ooyama, K. V. (1987). Scale-controlled objective analysis. Monthly Weather Review, 115(10):
2479–2506. doi:10.1175/1520-0493(1987)115<2479:SCOA>2.0.CO;2.
Ouberdous, M., Troupin, C., Lenartz, F., Barth, A. & Beckers, J.-M. (2011). Diva hydrographic
data sets stabilisation: an optimal method. In prep.
Rixen, M., Beckers, J.-M. & Allen, J. (2001). Diagnosis of vertical velocities with the QG
Omega equation: a relocation method to obtain pseudo-synoptic data sets. Deep-Sea Research I, 48(6): 1347–1373. doi:10.1016/S0967-0637(00)00085-6.
URL http://www.sciencedirect.com/science/article/pii/S0967063700000856
Rixen, M., Beckers, J.-M., Brankart, J.-M. & Brasseur, P. (2000). A numerically efficient data analysis method with error map generation. Ocean Modelling, 2(1-2): 45–60.
doi:10.1016/S1463-5003(00)00009-3.
URL http://www.sciencedirect.com/science/article/pii/S1463500300000093
Rixen, M., Beckers, J.-M., Levitus, S., Antonov, J., Boyer, T., Maillard, C., Fichaut, M.,
Balopoulos, E., Iona, S., Dooley, H., Garcia, M.-J., Manca, B., Giorgetti, A., Manzella,
G., Mikhailov, N., Pinardi, N., Zavatarelli, M. & the Medar Consortium (2005a). The Western Mediterranean Deep Water: a proxy for global climate change. Geophysical Research
Letters, 32: L12608. doi:10.1029/2005GL022702.
URL http://www.agu.org/pubs/crossref/2005/2005GL022702.shtml
Rixen, M., Beckers, J.-M., Maillard, C. & the MEDAR Group (2005b). A hydrographic and
bio-chemical climatology of the Mediterranean and the Black Sea: a technical note on the
use of coastal data. Bollettino di Geofisica Teorica e Applicata, 46: 319–327.
Saunders, P. M. (1981). Practical conversion of pressure to depth. Journal of Physical Oceanography, 11(4): 573–574. doi:10.1175/1520-0485(1981)011<0573:PCOPTD>2.0.CO;2.
URL
http://journals.ametsoc.org/doi/abs/10.1175/1520-0485%281981%29011%3C0573%
3APCOPTD%3E2.0.CO%3B2
Schlitzer, R. (2002). Interactive analysis and visualization of geoscience data with Ocean Data
View. Computers & Geosciences, 28(10): 1211–1218. doi:10.1016/S0098-3004(02)000407.
URL
http://www.sciencedirect.com/science/article/B6V7D-46TB0P2-C/2/
49937e4939d29fab010dc7f0af310bc8
Schlitzer, R. (2012). Ocean data view user’s guide (version 4.5.0). Tech. rep., Alfred Wegener
Institute.
URL http://odv.awi.de/fileadmin/user_upload/odv/misc/odv4Guide.pdf
Schweikert, D. G. (1966). An interpolation curve using a spline in tension. Journal of Mathematics and Physics, 45: 312–317.
Shen, S., Smith, T., Ropelewski, C. & Livezey, R. (1998). An optimal regional averaging
method with error estimates and a test using tropical pacific SST data. Journal of Climate,
11(9): 2340–2350. doi:10.1175/1520-0442(1998)011<2340:AORAMW>2.0.CO;2.
206
Steele, M., Morley, R. & Ermold, W. (2001). PHC: A global ocean hydrography with a
high-quality Arctic Ocean. Journal of Climate, 14(9): 2079–2087. doi:10.1175/15200442(2001)014<2079:PAGOHW>2.0.CO;2.
Tandeo, P., Ailliot, P. & Autret, E. (2011). Linear Gaussian state-space model with irregular
sampling: application to sea surface temperature. Stochastic Environmental Research and
Risk Assessment, 25: 793–804. doi:10.1007/s00477-010-0442-8.
Teague, W. J., Carron, M. J. & Hogan, P. J. (1990). A comparison between the Generalized
Digital Environmental Model and Levitus climatologies. Journal of Geophysical Research,
95(C5): 7167–7183. doi::10.1029/JC095iC05p07167.
The MEDAR group (2005). A Mediterranean and Black Sea oceanographic database and network. Bollettino di Geofisica Teorica ed Applicata, 46: 329–343.
Troupin, C. (2011). Study of the Cape Ghir upwelling filament using variational data analysis
and regional numerical model. Ph.D. thesis, University of Liège. 224 pp.
URL http://hdl.handle.net/2268/105400
Troupin, C., Machín, F., Ouberdous, M., Sirjacobs, D., Barth, A. & Beckers, J.-M.
(2010). High-resolution climatology of the north-east atlantic using data-interpolating
variational analysis (Diva).
Journal of Geophysical Research, 115: C08005.
doi:10.1029/2009JC005512.
URL http://www.agu.org/pubs/crossref/2010/2009JC005512.shtml
Troupin, C., Sirjacobs, D., Rixen, M., Brasseur, P., Brankart, J.-M., Barth, A., Alvera-Azcárate,
A., Capet, A., Ouberdous, M., Lenartz, F., Toussaint, M.-E. & Beckers, J.-M. (2012). Generation of analysis and consistent error fields using the Data Interpolating Variational Analysis
(Diva). Ocean Modelling, 52-53: 90–101. doi:10.1016/j.ocemod.2012.05.002.
URL http://www.sciencedirect.com/science/article/pii/S1463500312000790
Tyberghein, L., Verbruggen, H., Klaas, P., Troupin, C., Mineur, F. & De Clerck, O. (2012).
ORACLE: a global environmental dataset for marine species distribution modeling. Global
Ecology and Biogeography, 21(2): 272–281. doi:10.1111/j.1466-8238.2011.00656.x.
URL http://onlinelibrary.wiley.com/doi/10.1111/j.1466-8238.2011.00656.x/pdf
von Storch, H. & Zwiers, F. (1999). Statistical analysis in climate research. Cambridge University Press, Cambridge, 484 pp. ISBN 0-521-45071-3.
Wahba, G. (1975). Smoothing noisy data with spline functions. Numerische Mathematik, 24:
383–393.
Wahba, G. & Wendelberger, J. (1980). Some new mathematical methods for variational objective analysis using splines and cross validation. Monthly Weather Review, 108: 1122–1143.
Yari, S., Kova˘cevi´c, V., Cardin, V., Ga˘ci´c, M. & Bryden, H. L. (2012). Direct estimate of water,
heat, and salt transport through the Strait of Otranto. Journal of Geophysical Research, 117:
C09009. doi:10.1029/2012JC007936.
URL http://www.agu.org/journals/jc/jc1209/2012JC007936/
207
Zender, C. S., Vicente, P. & Wang, W. (2012). Nco: Simpler and faster model evaluation by
nasa satellite data via unified file-level netcdf and hdf-eos data post-processing tools. In Fall
Meeting of the American Geophysical Union, vol. Eos Trans. AGU, 93, pp. Abstract IN34A–
07. San Francisco, CA.
URL http://nco.sourceforge.net/
Zhang, H. & Wang, Y. (2010). Kriging and cross-validation for massive spatial data. Environmetrics, 21(3-4): 290–304. doi:10.1002/env.1023.
208
L IST
OF
F IGURES
1.1
Results obtained with divatest. . . . . . . . . . . . . . . . . . . . . . . . .
6
1.2
Results obtained with divabigtest. . . . . . . . . . . . . . . . . . . . . .
6
2.1
Schema of the data gridding. . . . . . . . . . . . . . . . . . . . . . . . . . . .
9
2.2
Interpolation vs. approximation. . . . . . . . . . . . . . . . . . . . . . . . . .
9
2.3
Triangular elements used for the mesh. . . . . . . . . . . . . . . . . . . . . . .
16
2.4
Analysis of a single data point with high signal-to-noise ration and no background field. . . . . . . . . . . . . . . . . . . . . . . . . . . . . . . . . . . . .
18
2.5
Theoretical Kernel function and analysis of a single point with a unit value. . .
18
4.1
Analysis in a square domain with a point at the centre and another at (−4.5, 0).
34
4.2
Error fields computed using four different methods. . . . . . . . . . . . . . . .
39
5.1
Single data point with unit value in a solid rotation. . . . . . . . . . . . . . . .
47
5.2
Same as Fig. 5.1, but without advection. . . . . . . . . . . . . . . . . . . . . .
47
5.3
Same as Fig. 5.1, but with smaller length scale. . . . . . . . . . . . . . . . . .
48
5.4
Single data point with anti-clockwise rotation and with diffusion.
. . . . . . .
48
5.5
Single data point with clockwise rotation and with diffusion. . . . . . . . . . .
49
5.6
Example of a reconstruction without and with detrending. . . . . . . . . . . . .
55
5.7
Trends obtained from the data using the detrending tool. . . . . . . . . . . . .
55
6.1
Example of a contour file and its graphical representation. . . . . . . . . . . . .
61
6.2
Example of a data file and its graphical representation. . . . . . . . . . . . . .
62
7.1
Area selection with software GebcoCE_GridOnly. . . . . . . . . . . . . . .
70
7.2
Data exportation with software GebcoCE_GridOnly. . . . . . . . . . . . .
71
7.3
Topography from GEBCO one-minute topography. . . . . . . . . . . . . . . .
72
7.4
Individual measurements of depths. . . . . . . . . . . . . . . . . . . . . . . .
73
7.5
Interpolated topography. . . . . . . . . . . . . . . . . . . . . . . . . . . . . .
74
7.6
Topography extraction from the Naval Oceanographic Office website. . . . . .
75
7.7
Topography extraction from NVODS. . . . . . . . . . . . . . . . . . . . . . .
76
7.8
Topography from Naval Oceanographic Office website. . . . . . . . . . . . . .
77
209
7.9
Example of improper contours. . . . . . . . . . . . . . . . . . . . . . . . . . .
77
7.10 Contour generated every 500 m from surface to -2500 m. . . . . . . . . . . . .
78
8.1
Mesh on a simple domain. . . . . . . . . . . . . . . . . . . . . . . . . . . . .
85
8.2
Mesh refinement around the island. . . . . . . . . . . . . . . . . . . . . . . . .
87
8.3
Example of analysed field. . . . . . . . . . . . . . . . . . . . . . . . . . . . .
88
8.4
Analysis without coordinate change. . . . . . . . . . . . . . . . . . . . . . . .
92
8.5
Analysis with coordinate change. . . . . . . . . . . . . . . . . . . . . . . . . .
93
8.6
Analysis with advection but without coordinate change. . . . . . . . . . . . . .
93
8.7
Analysis with advection and coordinate change. . . . . . . . . . . . . . . . . .
94
8.8
. . . . . . . . . . . . . . . . . . . . . . . . . . . . . . . . . . . . . . . . . . .
95
8.9
Diffusion coefficient divided by 110000 compared to the icoord=1 case. . . .
96
9.1
Gnuplot window. . . . . . . . . . . . . . . . . . . . . . . . . . . . . . . . . .
99
9.2
Installing gnuplot with cygwin. . . . . . . . . . . . . . . . . . . . . . . . . . 100
9.3
Visualization with gnuplot. . . . . . . . . . . . . . . . . . . . . . . . . . . . . 101
9.4
Examples of figures created with Diva-Matlab toolbox. . . . . . . . . . . . . . 104
9.5
Examples of figures obtained with the Diva-Python toolbox. . . . . . . . . . . 106
9.6
Plots of results with NcBrowse. . . . . . . . . . . . . . . . . . . . . . . . . . . 107
9.7
Plots of results with Ncview. . . . . . . . . . . . . . . . . . . . . . . . . . . . 109
10.1 Finite-element mesh and salinity measurements used for the application. . . . . 113
10.2 Fit of the data correlation to the theoretical kernel. . . . . . . . . . . . . . . . . 114
10.3 Analysed and error fields with L = 1.36◦ and λ = 2.63. . . . . . . . . . . . . . 117
10.4 Contour generation. . . . . . . . . . . . . . . . . . . . . . . . . . . . . . . . . 118
10.5 Mesh generated in the scaled domain. . . . . . . . . . . . . . . . . . . . . . . 119
10.6 Results of analysis. . . . . . . . . . . . . . . . . . . . . . . . . . . . . . . . . 120
10.7 Transect stations (•) and bottom topography. . . . . . . . . . . . . . . . . . . . 121
10.8 Domain and data. . . . . . . . . . . . . . . . . . . . . . . . . . . . . . . . . . 122
10.9 Data with axes in kilometres. . . . . . . . . . . . . . . . . . . . . . . . . . . . 123
10.10Mesh in the rescaled domain. . . . . . . . . . . . . . . . . . . . . . . . . . . . 123
10.11Analysed field. . . . . . . . . . . . . . . . . . . . . . . . . . . . . . . . . . . 124
10.12Analysed field between 500 m and sea surface. . . . . . . . . . . . . . . . . . 125
210
10.13Isotropic OI. . . . . . . . . . . . . . . . . . . . . . . . . . . . . . . . . . . . . 125
10.14Diva (with coastal effect).
. . . . . . . . . . . . . . . . . . . . . . . . . . . . 126
10.15Velocity field used for the advection constraint in the Mediterranean Sea. . . . . 126
10.16Diva with advection (on full grid, no direct topography, but indirect via advection).126
10.17Diva with topography and advection. . . . . . . . . . . . . . . . . . . . . . . . 127
11.1 Communications between the server and the client for analysis with Diva-on-web.129
11.2 Upload of data. . . . . . . . . . . . . . . . . . . . . . . . . . . . . . . . . . . 130
11.3 Grid coordinates. . . . . . . . . . . . . . . . . . . . . . . . . . . . . . . . . . 130
11.4 Parameters selection. . . . . . . . . . . . . . . . . . . . . . . . . . . . . . . . 130
11.5 Visual results of divafit. . . . . . . . . . . . . . . . . . . . . . . . . . . . . 131
11.6 Analysis and mask based on relative error. . . . . . . . . . . . . . . . . . . . . 131
11.7 Exportation of the result field in different formats. . . . . . . . . . . . . . . . . 131
11.8 Example of VG gridding and Diva gridding with ODV. . . . . . . . . . . . . . 132
12.1 Content of output/3Danalysis/ . . . . . . . . . . . . . . . . . . . . . . 147
12.2 Content of output/3Danalysis/Fields/ . . . . . . . . . . . . . . . . 147
A.1 Simultaneous run of Diva. . . . . . . . . . . . . . . . . . . . . . . . . . . . . 169
A.2 Results with two data points with values 1 and 3, located in the domain center
(0,0), with a large signal-to-noise ratio. . . . . . . . . . . . . . . . . . . . . . . 170
A.3 Examples of Diva outputs with zones of N aN at boundaries. . . . . . . . . . . 173
A.4 Error messages due to bad ends of lines. . . . . . . . . . . . . . . . . . . . . . 174
A.5 Example of bad ends of lines. . . . . . . . . . . . . . . . . . . . . . . . . . . . 174
A.6 Error message obtained during compilation. . . . . . . . . . . . . . . . . . . . 175
A.7 Solution to the resource problem. . . . . . . . . . . . . . . . . . . . . . . . . . 176
A.8 Error message during execution of divacomp with gfortran. . . . . . . . . . . 176
A.9 Error message during the run of divacalc. . . . . . . . . . . . . . . . . . . 177
A.10 Error message due to allocation problem. . . . . . . . . . . . . . . . . . . . . 178
A.11 Error message during execution of divacalc with gfortran. . . . . . . . . . . 179
A.12 Error message with contour generation. . . . . . . . . . . . . . . . . . . . . . 180
A.13 Small contours . . . . . . . . . . . . . . . . . . . . . . . . . . . . . . . . . . 181
A.14 File param.par resulting from an interruption of divagcv. . . . . . . . . . 181
211
A.15 Examples of Diva execution with problem with the Jacobian matrix. . . . . . . 183
A.16 Examples of Diva outputs with random zones of N aN . . . . . . . . . . . . . . 184
A.17 Error message during the reading of the data file. . . . . . . . . . . . . . . . . 185
B.1 Example of simple mesh . . . . . . . . . . . . . . . . . . . . . . . . . . . . . 194
C.1 Scripts used in the command-line version of Diva. . . . . . . . . . . . . . . . . 199
212
L IST
OF
TABLES
2.1
Statistical equivalence between OI and VIM . . . . . . . . . . . . . . . . . . .
19
2.2
Characteristics of different methods of data analysis. . . . . . . . . . . . . . .
20
9.1
Matlab programs for plotting. . . . . . . . . . . . . . . . . . . . . . . . . . . 102
C.1 DIVADEMECUM: Diva input and output files . . . . . . . . . . . . . . . . . 198
213


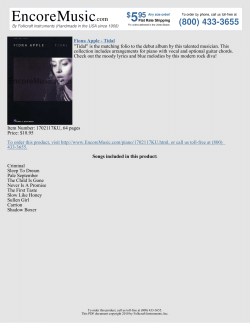


© Copyright 2026