
Investment Strategy â Second Quarter 2015 - Morgans
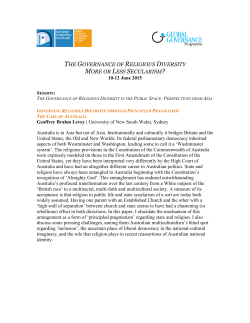
Investment Strategy
Second Quarter 2015
Economic Outlook
US – solid growth but Europe – near its
inflation is lagging
low but slow going
We expect the US economy
to further strengthen in 2015,
supporting a pickup in GDP growth
to 3.0%, up from 2.4% in 2014.
Increasing investment is the
primary driver, with segments
like communications equipment
and information processing
looking particularly strong,
growing at around 10%.
Residential investment continues
to recover adding 8% in 2015
while the strongest segment in
non-residential construction is
commercial and healthcare which
is growing by 16%.
The worst part of the economy
relates to oil. We’ve already
witnessed a 27% fall in the
number of US drilling rigs deployed
in 2015 which we think will
contribute to a fall in mining and
petroleum investment of 30%.
Despite solid growth, inflation
remains stubbornly low. There
is still excess capacity available
in the US economy. With
unemployment at 5.5%, wages
growth is low and this is putting
little upward pressure on inflation.
The GDP deflator in 2015 should
be only 1.2%. Core inflation
(excluding food and energy)
should be only 1.7%. The headline
CPI inflation rate should actually be
negative and may be as low
as -0.4%.
2 | Investment Strategy – Second Quarter 2015
The European Central Bank (ECB)
began its program of Quantitative
Easing during the quarter. This
meant that the ECB began
purchasing Euro denominated
public sector securities in the
secondary market. They also
continued purchasing asset
backed securities and covered
bank bonds.
The combined monthly purchases
of public and private sector
securities will amount to 60
billion euros, with the program to
continue into late 2016. Thereafter,
the program will be maintained
until the ECB sees a sustained
adjustment in the path of inflation
which is consistent with their aim
of achieving inflation rates below
but close to 2.0%.
The European Union statistician
Eurostat estimates that real GDP
grew by 0.3% in the final quarter
of 2014 which was slightly higher
than previously anticipated. The
ECB staff estimate that the Euro
area will see annual GDP grow by
1.5% in 2015, 1.9% in 2016 and
2.1% in 2017. These estimates
have been revised upwards from
those published in December
2014.
Eurostat says that European
area inflation was -0.3% in 2015.
They think this will rise to an
average of 0.0% in 2015, then
recover to 1.5% in 2016 and 1.8%
in 2017. These estimates are
slightly lower than the estimates
in December 2014.
China – growth
in services and
consumption
We think that the Chinese
economy will grow at around 7%
in calendar 2015 supported by
strong fixed asset investment
growing at 14.5%. The Chinese
economy is becoming less
industrial based. We think that
retail sales growth at about 12%
will outpace growth in industrial
production at about 7%.
China’s oversized industrial sector
is giving a little away to make
space for growth in Chinese
service production. Nevertheless,
2015 should be another good year
for Chinese merchandise exports
which are estimated at US$2.48
trillion, against imports of US$2.02
trillion, generating a trade balance
of US$0.466 trillion. China is still
adding significantly to its foreign
exchange reserves year on year.
In the long term, China will need
to move from a current account
surplus to a balance. A higher
real exchange rate than this will
lead to a higher level of Chinese
imports relative to exports. This
strong RMB policy will continue to
support both imports and domestic
demand.
Australia – more
rate cuts required
The December quarter national
accounts showed that the
Australian economy is still soft.
Year-on-year GDP growth was a
seasonally adjusted 2.5% in 2014.
The Australian economy needs to
be growing by at least 3.0% for
growth in employment to equal
growth in the labour force. Until
the economy reaches that level
of growth, unemployment will
continue to drift up.
The weakness in the Australian
economy is caused by a decline
in gross fixed capital formation.
This is because mining investment
is falling after the end of the
mining boom. The void in mining
investment needs to be replaced
by investment in residential
construction. As we go through
calendar 2015, we expect higher
levels of residential construction
will generate higher levels of
employment growth, lifting the
economy out of the current growth
recession.
We think that Australian GDP
growth will rise from 2.5% in 2014
to 3.2% in 2015 before settling
to 3.0% in 2016. The relatively
high level of employment above
6.3% means that wages growth
is continuing to slow. This lower
wages growth should lead to lower
core inflation in the Australian
economy. This lower core inflation
should allow the RBA to make
further rate cuts.
We think there will be between
one and three more rate cuts in
calendar 2015. Low interest rates
are necessary to generate enough
domestic investment to absorb the
current level of unemployed.
Stockmarkets –
trading ahead of
fundamentals
The fall in oil prices has led
to a fall in the earnings of ‘big
oil’ companies listed on the US
equities market. This led to a fall
in quarterly operating earnings
per share for the S&P500 for the
fourth quarter of 2014. Prior to the
earnings season, these earnings
were estimated at $US30.89 per
share.
When the earnings season finally
arrived, these operating earnings
came in at a surprisingly low
US$26.80 per share. This meant
that 12 month operating earnings
per share for the S&P500 finished
at US$112.82 in Q4 2014. We
think this moves to US$112.30 in
Q1 2015. This gives us a moderate
fair value of the S&P500 based on
operating earnings and 10 year
bond yield of only 1820 points.
We do believe that operating
earnings per share for the S&P500
will move up again in 2015. Still,
even with this rise in fair value, our
current fair value for the S&P500
in December 2015 is only 1902
points. With the S&P500 trading
at 2100 points, it is moderately
overvalued. This is nowhere near
high enough to suggest a major
selloff, but it does suggest that
most of the movement in US
equities this year will be sideways,
rather than up.
The situation is similar in the
Australian market for equities.
Australia saw a relatively flat
earnings season in March 2015.
The result of this earnings season
suggests that operating earnings
per share for Australian companies
will be basically stable with little
upside throughout calendar 2015.
Our current fair value for the
Australian market stands at 5,690.
With the market currently trading
close to 6,000 points, there
remains limited further upside in
Australian shares in the short term.
Watch Chief Economist Michael Knox outline his thoughts on
current investment conditions with Senior Analyst Tom Sartor.
http://www.morgans.com.au/videos/economic-outlook-2015
have fallen from 3.8% a year ago
to only 2.5% now. A further fall in
bond yields would increase the fair
value of our model of Australian
equities, however we caution that
such upside is a function of ultralow rates and not a strengthening
economy.
The good news is that 10
year bond yields have fallen
dramatically since last year.
Australian 10 year bond yields
The Chicago Fed National Activity Index confirms that US economic growth is steadily trending
upwards.
1.0
above
trend
0.0
trend
Our modelling
suggests that
most of the
movement
in equities
this year will
be sideways,
rather than up.
-1.0
-2.0
below
trend
-3.0
-4.0
-5.0
2000
2002
2004
2006
2008
2010
2012
2014
Source: Chicagofed.org, Morgans
Investment Strategy – Second Quarter 2015 | 3
Asset Allocation
Asset allocation
explained
Morgans approach
explained
Strategic Asset Allocation (SAA)
is the process of allocating funds
between asset classes to optimise
investors’ return objectives and
risk tolerance with long-run capital
market expectations. It is perhaps
the most important, but one of the
most overlooked aspects of wealth
management.
Morgans takes a systematic
approach to SAA. We first
determine where investing
conditions sit within the economic
cycle with respect to the relative
attractiveness of each asset class.
We then apply recommended
longer term Benchmark allocations
per asset class. Within portfolios,
actual allocations have scope to
vary by up to 10-15% around
Benchmark allocations. These
‘Tactical Tilts’ represent an
investing bias generated by shorter
term drivers. Here we take into
account:
The essence of SAA is
diversification. Spreading
investments across different types
of assets can smooth out higher
and lower return variations that
occur through the economic cycle.
This balances long-term return
and risk objectives.
The asset classes
The four main asset classes are
Equities (shares), Income Assets,
Property and Cash. Within Income
Assets we include Listed Income
Securities (hybrids), Government
Bonds, Corporate Bonds and Term
Deposits. SAA simply provides a
framework for how they should be
integrated within portfolios.
§§ the economic cycle
§§ key forecasts for growth, interest
rates and inflation, and
§§ risks to these forecasts.
Morgans reviews its SAA settings
quarterly in conjunction with
Investment Strategy, thus ensuring
a stable risk profile.
Inflation rises
OVERHEAT
wth
COMMODITIES
Cyclical
Value
BONDS
Defensive
Growth
CASH
Defensive
Value
REFLATION
Yield curve
steepens
moves belo w trend
STOCKS
Cyclical
Growth
wth
Gro
Yield curve flattens
Gro
mo ves abov e tr end
RECOVERY
STAGFLATION
I n fl a tio n f a ll s
Source: Fidelity, Morgans
4 | Investment Strategy – Second Quarter 2015
The economic cycle
We find it useful to reference the
economic cycle when explaining
our approach. Fidelity’s well known
‘Investment Clock’ separates
the economic cycle into four
phases based on the strength of
economic growth and inflation.
This illustrates the relative
attractiveness of various asset
classes, which tend to outperform
others at various stages of the
economic cycle. We use this as
a guide only and note that not all
phases of each economic cycle are
the same.
Recovery stage, but
not without risk
We continue to believe that
global markets are in the early
stages of the Recovery phase as
governments continue to adjust
interest rate settings to promote
economic growth. In 2015, the US
economy is set to record its best
sustained growth since before
the global financial crisis. This
is a strong driver for US trading
partners including Australia.
However, while Equity and Income
Asset markets have been very
strong in early 2015, there are
several areas of concern for us:
§§ global inflation is stagnant,
despite the best attempts of
central governments
§§ subsequently the growth
recovery has been slower than
expected
§§ excess liquidity is driving asset
prices well above fundamentals
§§ prices for Income assets and
high yield Equities look stretched
and hence unsustainable, and
§§ this suggests that risk in some
asset classes is being mispriced.
With interest rates at ultra-low
levels, the point we’re making
here is that investors are facing
unprecedented market conditions.
It’s clear the era of low rates is
driving abnormal premiums on
particular assets. We’re concerned
that this dynamic cannot continue
indefinitely, and, that when interest
rates do eventually normalise,
then capital values will face
significant risk.
Speculation on the timing of US
interest rate rises has created
market volatility on several
occasions. The dilemma facing
investors is that we just don’t know
when the adjustment may happen.
Income investors in particular
cannot afford to sit out of markets
earning negative returns after
inflation waiting for genuine growth
to reassert itself. We aren’t making
wholesale changes to our investing
strategy but we do highlight
the need for investors to tread
cautiously though 2015.
Recommended
asset allocations
and active tilts
The Recovery stage of the
economic cycle is supportive of
reducing allocations to defensive
assets in favour of increasing
exposure to assets which capture
the early stages of economic
growth. This includes a higher
allocation to Equities incorporating
small positions in early stage
cyclical stocks in retail, technology
and industrials.
However what we are witnessing
is currently the slowest recovery
from a major recession on record
in the US, coupled with a ‘multispeed’ global economy. We see
little reason why inflation won’t
continue to stay at low levels and
think that upward movement on
interest rate settings in the US will
occur more slowly than expected.
This will continue to support
defensive and high yield assets,
until a global recovery gains more
momentum.
We are reluctant to allocate higher
weightings to growth assets
(equities) versus income assets
until the recovery is broader based,
but are conscious of the premiums
at which Income Assets are trading
versus fundamentals. Given the
upward re-pricing in Income
assets and Equities through the
first quarter of 2015, and coupled
with the systemic issues above,
we have made several changes to
our Tactical Tilts to reflect a more
defensive stance on asset markets.
We have lifted our cash tilt to
-3% (from -6%) and lowering our
equities tilt from +11% to +8%.
Benchmark long term Asset Allocations and Tactical Tilts
Conservative
Moderate
Balanced
Assertive
Aggressive
Tactical Tilts
Equities
11%
22%
40%
59%
74%
10%
Property
4%
8%
10%
11%
11%
Income Assets
49%
40%
30%
18%
9%
-6%
Cash
36%
30%
20%
12%
6%
-4%
100%
100%
100%
100%
100%
Source: Morningstar, Morgans
Morgans recommended Asset Allocations inclusive of Tactical Tilts
100%
80%
32%
24%
60%
40%
20%
34%
43%
4%
Conservative
Equities
8%
12%
11%
2%
3%
11%
10%
8%
21%
0%
26%
16%
69%
84%
50%
32%
Moderate
Property
Balanced
Income Assets
Assertive
Cash
Aggressive
Source: Morningstar, Morgans
Quick views per Asset class
Equities
Economic conditions in the US and Australia remain in equity friendly
recovery mode, however we are cautious that some segments are
mispricing risk at current levels.
Listed Property
REITs should retain their premiums while interest rates fall however we’re
very cautious about capital values should interest rates normalise earlier
than expected.
Listed Fixed Interest
Some bank issued securities do offer genuine value. However, an increase
in volatility, combined with a resumption in new product issuance in 2015 is
likely to cap near term upside.
Government Bonds
Prices have continued to rally as expectations around the pace of global
interest rate normalisation have tempered. We retain an underweight call
given retail investors can access term deposits at comparable returns (or
better) with government guarantees up to $250k.
Term Deposits
Deposit rates continue to decline as the market prices in the expectation
of lower cash rates for longer. The premium being paid to investors on one
year term deposits above the one year swap continues to erode.
Cash
Market expectations are for a downward rates trajectory through 2015.
Investment Strategy – Second Quarter 2015 | 5
Investment Themes
We continue to structure our
investing strategies around core
and tactical themes:
Leverage superior
growth in the US
Further weakening of
the Australian dollar
§§ Lower for longer interest rates
sustaining premiums for reliable
dividend payers
§§ A preference for leverage to
superior growth dynamics in
the US
§§ Further downward pressure on
the Australian dollar, and
§§ Premiums for stocks offering
capital management and/or
M&A optionality.
The US is currently the locomotive
of global growth providing
opportunities linked to improved
consumer spending, stronger
housing and export growth. It’s
difficult to find such compelling
economic drivers elsewhere.
Australia sets to benefit from
stronger US growth, however it will
take time to navigate the transition
from mining, back to housing and
services led growth. China looks
stable, however its own transition
toward consumer led growth makes
stock selection here more difficult.
Meanwhile Europe looks anaemic.
Updated macro-economic
fundamentals support further AUD
weakness towards Michael Knox’s
revised target of 72 cents, namely:
Lower Australian
interest rates
for longer
Given the risks of rising
unemployment in the Australian
economy, we expect a further 1 to
3 cuts in the cash rate by the RBA
through 2015. Coupled with our
view that rate rises in the US will
occur more slowly than expected,
this should prolong the dynamics
supporting the premiums in high
yield equities. The equity premiums
in utilities, property trusts, banks
and high yield industrials look set
to be sustained well into 2015.
However we are cognisant that
interest rates will eventually
normalise and that a rapid unwind
could hit some stocks being priced
more like bonds than equities (e.g.
utilities). That said, our Income
Strategy as reflected in our Income
Equity Model Portfolio focusses on
companies capable of sustainably
growing their dividends, rather
than those just attracting the yield
arbitrage. Select financial stocks fit
into this category.
Morgans’ International Strategy
publication details offshore
investing opportunities ranging
across direct share ownership
(including global franchises like
Amcor, Brambles and Macquarie
Group), ETFs, LICs and managed
funds. Exchange Traded Funds
(ETF’s) offer low cost exposure
to offshore market indices. The
Vanguard US Total Market ETF
(VTS) offers the simplest proxy to
a US market index. Betashares’
FTSE US 1000 ETF (QUS) is
similar, but offers higher returns
at equivalent risk. Magellan’s
Global Equities Fund (MGE)
targets much higher returns from
an actively managed strategy,
reflected in higher fees.
§§ the US is growing faster than
Australia
§§ US unemployment is trending
lower
§§ US equity earnings are growing
faster
§§ Australian bond yield premiums
are narrowing, and
§§ the US Fed will raise rates ahead
of the RBA.
Add to this Australia’s deteriorating
terms of trade due to lower
commodity prices and it’s clear
that downward pressure on the
AUD will remain.
A lower AUD provides a boost
for Australian exporters (mining,
agriculture, manufacturing),
service industries and industrials
with strong offshore franchises
translating profits (and dividends)
back into AUD. We expect key
offshore industrials to continue
to enjoy EPS and share price
momentum. Betashares’ US
Dollar ETF (USD) offers the
simplest direct exposure to the
US dollar, which we recommend
investors consider as an alternative
hedge to holding cash in Australian
dollar terms.
Capital management
and M&A optionality
Prudent cost management and
a focus on cash flow generation
were again dominant themes
throughout the February reporting
season. This continued the recent
trend where companies capable
of generating strong cashflows,
and returning the surplus to
shareholders in the form of higher
dividends command market
premiums. Notable examples
include Telstra, Wesfarmers and
Suncorp.
Key equity market themes and how to play them
Macro themes
Australian rates lower for longer
Superior growth offshore
International exposure via ETFs
Weakening in the AUD
Capital management or M&A potential
TLS, TCL, SYD, Banks, REITs
MQG, AMC, BXB
VTS, QUS, MGE
USD (ETF), MQG, QBE
TLS, SUN, WES, Major miners
Tactical themes
Brace for higher volatility
Adjust to the lower oil price environment
Rise of the emerging market middle class
The E-commerce and online boom
Australia’s ageing population
Source: Morgans
6 | Investment Strategy – Second Quarter 2015
Key exposures
Retain spare cash
OSH, WPL
SEK, SYD, CWN
SEK, DMP, IPP
CGF, REG
Weak nominal GDP growth and
a low cost of capital mean firms
are increasingly considering
M&A and asset divestments.
In a market with range-bound
global interest rates, we advocate
tactical positioning into potential
targets or stocks unshackling
underperforming assets including
Oil Search, M2 Group and
Challenger Group. The correction
in the Aussie dollar also adds
spice to the potential targeting of
Australian companies by offshore
predators.
ASX Performance versus global volatility
We also continue to
position around several
tactical themes
Source: IRESS, Morgans
Bracing for higher volatility
The inevitable normalisation of
global interest rates could easily
trigger market volatility given the
abnormal drivers of recent market
strength. Volatility surged several
times in 2014 at the merest
suggestion of an uptick in bond
yields. Higher volatility threatens
the re-pricing of market risk
leading to lower returns. Crucial for
investors in this environment we
believe is:
§§ to hold higher than usual levels
of cash
§§ to constantly monitor portfolio
risk and
§§ to moderate expectations of
future returns.
Markets may feel great, but we
caution investors not to become
complacent about capital value.
The impacts of lower oil pricing
The potential impacts of the
lower oil price can be spun in
both positive and negative ways.
What is certain is that the shock
will have huge reverberations,
take many months to unfold and
elevate investor uncertainty in the
6100
40
5900
35
5700
30
5500
5300
25
5100
20
4900
15
4700
10
4500
4300
Jun-13
Sep-13
Dec-13
Mar-14
ASX200 Index
meantime. We remind investors
that the best time to accumulate
exposure to energy stocks is when
they are making slim profits rather
than super-profits. We believe that
Oil Search and Woodside offer
compelling direct exposure to our
anticipated normalisation of oil
markets, but that investors need to
hold a 1-2 year timeframe.
The rise of the emerging market
middle class
In Asia alone, 525 million people
already rank in the middle class,
more than the European Union’s
total population. Over the next
two decades, the middle class is
expected to expand by another
three billion people, coming almost
exclusively from the emerging
world including Asia and India. This
offers up enormous opportunities
within sectors where Australia
has natural advantages including
gas exports (energy demand),
agribusiness (food demand),
tourism (travel) and education
(up-skilling).
The e-commerce/technology
revolution
We hear many successful
company CEO’s talking about
Jun-14
Sep-14
Dec-14
Mar-15
5
CBOE Market Volatility
how benign economic drivers are
being outpaced by the evolution of
technology in areas including:
§§ mobility
§§ the ‘internet of things’
(connected devices)
§§ big data, and
§§ cloud computing.
Huge opportunities are being
won by first movers into
disruptive technologies, online
and ‘e-commerce’ penetrating
into traditional retail, advertising,
education and employment markets.
The best exponents include SEEK
and Domino’s Pizza.
Servicing Australia’s
ageing population
It is predicted that over the
next 40 years the proportion of
the Australian population over
65 years will almost double
to around 25%, increasing
demand for services within the
healthcare (Ramsay Health
Care), retirement accommodation
(Regis Healthcare) and wealth
management industry (Challenger
Group).
Investment Strategy – Second Quarter 2015 | 7
Shares
Treading cautiously
through 2015
Australian shares have enjoyed
a stunning start to 2015. While
this strength may feel great at
face value, the underlying market
drivers actually give us cause to
feel very cautious. It’s clear that
recent market strength is linked
to downward pressure on risk
free (interest) rates, supporting
high yield equities. Remember
that interest rates have not been
this low in anyone’s lifetime – a
situation we think is unsustainable.
Several other elements also add to
our caution:
§§ global inflation (and growth)
remains low despite years of
economic stimulus and ultra-low
interest rates
§§ excess liquidity is helping to
fuel the pricing of many asset
classes rather than productive
returns on those assets, and
§§ economic imbalances in
Australia after the mining
boom risk the current era of
uninterrupted growth.
It’s clear that the current dynamic
cannot continue indefinitely and
that when global interest rates
do eventually rise then capital
values will face significant risk.
The dilemma facing investors is
that we just don’t know when
the adjustment may happen and
income investors cannot afford to
sit out of markets earning negative
returns (after inflation) waiting for
genuine growth to reassert itself.
of cost cutting initiatives should
position businesses well for when
economic growth returns, allowing
for margin expansion as well as
top line growth.
Further devaluation of the AUD and
the low interest rate environment
should help drive a broader
domestic recovery. However, we
are still waiting for the wave of
infrastructure construction projects
to emerge, driven by government
spending and PPP’s, which would
kick East coast economic growth
into gear.
Our point here is that we are living
through unprecedented times.
We aren’t changing our investing
strategy but we are highlighting
the need for investors to tread
cautiously though 2015.
We believe companies leveraged
to residential building activity
(both new build and renovations)
should remain strong with housing
starts at a ten year high. Other
companies leveraged to tourism,
education services, logistics and
manufacturing should also be
impacted positively, helping to
drive some earnings growth.
Industrials
While we have previously
discussed the patchy outlook for
industrial companies given the
flat economy and weak consumer
spending, we believe recent
economic stimulus (RBA rate cut
and falling oil price) will begin to
positively impact (non-mining)
industrial stocks in the coming
12 months. In the meantime we
still stand by our view that years
However, we think the clear
outperformers will be those
stocks generating strong offshore
earnings which enjoy the
translation benefits of a weakening
AUD (Slater & Gordon), and those
March quarter relative sector performance
Banks
Financials-x-A-REIT
Consumer Discretionary
Utilities
Healthcare
ASX200 Index
A-REIT
Industrials
Telecoms
Small Ordinaries
Consumer Staples
Resources
Energy
-10%
Source: IRESS, Morgans
8 | Investment Strategy – Second Quarter 2015
-5%
0%
5%
10%
15%
stocks leveraged to the entrenched
economic recovery underway in
the US (Brambles).
Healthcare
Early 2015 has seen the
Healthcare sector move broadly
in line with the ASX200 after
significant outperformance in
2014. The strong sector thematics
(ageing population, medical
innovation and public sector
outsourcing), focus on ‘defensive
growth’ and likelihood for
continued AUD weakness should
continue to attract investors into
the sector through 2015.
Anticipation of the May Budget
may see some weakness creep
into domestic Healthcare names
(like Primary Healthcare and Sonic
Healthcare) until clarity around any
changes are known. The strong
share price performance in Ansell
may be an opportunity for investors
to re-balance positions and Sirtex
remains overvalued post the
failure of its clinical trial. Ramsay
Healthcare and Resmed remain
our High Conviction calls.
Telco
Further falls in Australian interest
rates should support defensive
telecommunications stocks like
Telstra. That said, we did moderate
our Telstra recommendation back
to a Hold for valuation reasons
when the stock hit a 13 year high
in February. We believe that single
digit dividend and earnings growth
across the sector are comfortably
achievable and that the key telco
stocks remain a crucial part of any
portfolio. However we do feel that
short term valuations are slightly
stretched. We are comfortable
owning the sector and recommend
selectively adding to exposures on
any weakness.
The National Broadband Network
rollout is now gaining scale.
This combined with competitive
conditions have resulted in
ongoing consolidation. Telstra’s
recent bid for Asian based Pacnet
was followed by the fourth largest
household Internet Service
Provider, TPG Telecom, bidding for
the second largest player, iiNet.
TPG’s bid for iiNet has met some
resistance but we still think the
deal is likely to proceed. The
combined group would have
~26% market share which would
knock Optus from its #2 perch but
remains well below Telstra’s ~51%
market share. The combined group
would be a sizable competitor
generating annualised EBITDA in
excess of A$800m. Our preferred
telecommunications picks are
NextDC and BigAir.
Banks
Multiple interest rate cuts are
looking increasingly likely in
Australia through 2015 which
should see the major banks well
supported. Key banking dynamics
are unlikely to change in the
coming year. We expect reasonably
subdued growth in property
lending and accelerated mortgage
repayments to result in subdued
net property credit growth and
modest business lending. We also
expect relatively subdued business
lending, although the M&A cycle
is picking up which is a positive
lead indicator. We expect tight
management of interest margins
(with some improvement due to
lower funding costs) and finally
tight cost control delivering low
single digit profit growth.
Our preferred picks reflect where
we expect credit growth to
come from. The performance of
Australian credit growth remains
mixed with business lending
being subdued and property
lending varying greatly across
different geographies. Sydney and
Melbourne are performing strongly
with property prices up 12% and
8% respectively during 2014.
Queensland and Adelaide reported
4-5% growth in property prices
while Perth eked out 2% growth
for the year. With this in mind we
prefer Commonwealth Bank
which is both Australia’s largest
property lender and has the most
relative exposure to Sydney and
Melbourne property prices. We also
favour ANZ Banking Group for its
exposure to Asian lending and its
undemanding valuation.
We expect
that tight
management of
interest rates
and costs will
deliver low,
single digit
profit growth
for the banks.
Morgans large cap High Conviction stock performance (last 12 months)
Sold positions avg. TSR = 8% (abs)
Held positions TSR = 15%
35%
25%
15%
5%
-5%
-15%
SUN
AZJ
BHP
STO
SHL
HVN
SEK
OSH
SUN
FLT
SYD
CWN
TPI
TLS
CGF
CSL
BXB
ORG
OSH
SGP
TCL
SEK
RHC
ANZ
MQG
RMD
FDC
-25%
Source: Morgans
Investment Strategy – Second Quarter 2015 | 9
Shares
Diversified financials
Financials stocks surged in the first
quarter of 2015. Gains were led
by our sector high conviction stock
Macquarie Group (up around
35%), which we remain positive on
in the medium-term. Macquarie is
enjoying solid earnings momentum
which will be aided by further
devaluation in the Australian Dollar
given 65% of MQG’s earnings are
derived offshore.
Several themes are in play in the
sector:
§§ the emergence of a more
competitive environment for
the domestic general insurers
(Suncorp and Insurance
Australia)
§§ solid earnings momentum for
stocks with offshore earnings;
§§ the ongoing shift of
superannuation funds to
retirement phase (positive for
Challenger Group), and
§§ improving markets and fund
flows for offshore managers.
With improving US growth and
a falling AUD, we expect fund
managers with an offshore focus
to continue to perform well,
including Magellan Financial
Group and BT Investment
Management.
We maintain a neutral view
on General Insurers given
the increasingly competitive
environment in domestic general
and commercial insurance. Whilst
we regard Suncorp Group as a
solid portfolio holding, our stock
view is neutral given the growth
headwinds from here. For those
with a higher risk appetite, QBE
Insurance has commenced its
turnaround and there is scope for
the group to return to a higher
dividend payout ratio over the
coming 12-18 months.
Resources
Resources stocks trended flat
in the first quarter due to some
commodity price relief, although
this has proved only temporary.
A weakening Australian dollar
is a natural buffer for domestic
producers and a far more
competitive services market is
helping the miners to lower costs.
We continue to remain neutral
on the sector. Our core strategy
remains the accumulation of
BHP Billiton on weakness whilst
collecting c5-6% fully franked
yields. Dividends are paid in US
dollars so investors will enjoy a
currency kicker in 2015 coupled
with shares in the planned
South32 demerger, scheduled for
completion by mid-2015.
The energy sector has been hit
hard since late 2014 on sharply
lower oil prices. The market is now
discounting companies with poor
cash costs and balance sheets and
removing any premiums applied
to companies with potential for
upside surprise on cashflow or
dividends, let alone growth.
Oil companies are now cutting
planned capital expenditure
including deferring projects and
exploration. We believe that oil
pricing will improve once the US
dollar stabilises into mid 2015,
assisted by the normal seasonal
10 | Investment Strategy – Second Quarter 2015
demand increase. Only the lowest
cost produces will garner investor
support in the interim. We think
that Oil Search offers the best
risk-adjusted return should we see
an oil price recovery. Woodside
and Origin Energy both offer
some protection in a declining oil
price environment, but offer lower
leverage to an oil price recovery.
Consumer staples
and discretionary
The state of the consumer is
always very topical and is often
used as a barometer for the state
of the broader economy. Whilst
the March monthly consumer
sentiment reading dropped
slightly, this is still 9.2% above the
December lows and back to levels
seen before the Federal budget
in May last year. While broader
sentiment indicators are sitting
only slightly below average, the
consumer is still fragile and we
have witnessed this in the recent
earnings results of Myer and
Kathmandu. Both apparel retailers
delivered significantly lower profit
numbers versus last year, having
to discount further to drive sales.
The sharp fall in the AUD is also
a headwind for retailers. Most are
hedged through 2015 after which
they will have to lift prices (or lower
product quality) or suffer margin
pressure. Lifting prices amid
fragile consumer confidence will
be difficult, hence we believe that
margins will be squeezed across
the sector.
Lower fuel prices, further interest
rate cuts, and a buoyant housing
market do offer potential stimulus
to consumer spending, although
these are balanced against
poor wage inflation, possible
Government spending cuts and
a questionable unemployment
outlook. On this front, we continue
to maintain a market weight
exposure to consumer staples
and a clear preference for
Wesfarmers. We also favour those
retailers exposed to the strong
housing segment such as Harvey
Norman and Beacon Lighting.
We also maintain a preference
for speciality retailers with strong
structural growth and offshore
exposure being Domino’s Pizza
and Lovisa.
Online media
The online media sector has
performed well in the wake of the
March reporting season, with most
stocks in the sector rising 5-10%
in the weeks after the results,
which were in line with or slightly
above expectations. The underlying
trends supporting further earnings
growth for the sector remain sound
but some stocks should do better
over the next 6-12 months than
others.
Among the large capitalisation
stocks we still prefer SEEK due to
the consistent trends for rising job
ad volumes in all of the countries
in which it operates. Among
smaller capitalisation stocks we
favour iProperty Group which
we expect to report a year of
progressive double-digit increases
in quarterly revenue growth.
The prices of iron ore and oil both look likely to take a long time to recover. We maintain our
underweight positioning in Resources in the Morgans Equity Model portfolios.
200
180
160
140
120
100
80
60
40
20
0
Jan-06
Jan-07
Jan-08
Jan-09
Jan-10
Spot iron ore (USD)
Jan-11
Jan-12
Jan-13
Jan-14
Jan-15
Brent Oil (USD)
Source: IRESS, Morgans
Infrastructure
We are approaching a period of
heightened risk for regulated
infrastructure, as key regulatory
decisions are imminent.
In electricity distribution, the
Australian Energy Regulator
is expected to publish its
Draft Decisions for the South
Australian and Victorian
electricity distribution networks
by 30 April and 31 October
2015 respectively. Spark
Infrastructure, DUET Group and
AusNet Services are exposed
to these decisions. We estimate
that reductions in interest
rates may see rate of return (or
WACC) allowances shrink by
350-400bps per annum from
those driving current revenues.
The AER is also expected to be
tough on operating and capital
cost allowances, which may
drive further revenue reductions.
For networks, interest costs
are likely to drop as out-of-
the-money interest rate swaps
expire, but not enough to offset
revenue declines. This may put
pressure on credit metrics and
sustainability of distributions.
Aurizon’s Network business is
due to receive its Final Decision
from the Queensland Competition
Authority in July 2015. A number
of the WACC parameters have
been determined, reducing
the risk related to the WACC
allowance. Operating and
maintenance cost allowances
look likely to be the key swing
factors.
Our preference remains for
stocks with solid yields and
underlying growth. APA Group,
Sydney Airport and Transurban
remain the highest quality plays
in the sector, albeit share price
increases have been strong.
Agriculture/Food
The agricultural sector
outperformed the broader market
during the first quarter of 2015
due to solid rainfall in January,
the fall in the AUD and the rally
in the cattle price. Investors
also continued to focus on the
benefits of new Free Trade
Agreements signed with our key
trading partners and we think
that there may be some rotation
from mining into agriculture
given a more positive outlook.
Our key pick in the sector is
Capilano Honey which is the
largest packer and marketer of
honey in Australia. It is benefiting
from increased consumer
awareness (both domestically
and overseas) about the health
benefits of consuming honey
which has placed the company
on a strong profit growth
trajectory. We believe that
Capilano is attractively priced for
its growth profile.
The potential for further
corporate activity also
continued to support the sector.
Consequently, we believe that
a few of the ag stocks have
overshot based on their current
fundamentals. Everyone forgets
that the summer crop sales were
terrible given how dry it was
leading up to Christmas. The
cattle price is also now coming
off and the rainfall across key
agricultural regions has slowed.
Investment Strategy – Second Quarter 2015 | 11
Property
After a stellar run in 2014, the
property sector continues to
perform solidly delivering a
total return of around 9.4% over
the past quarter. Key drivers
of the performance remains
the ongoing low interest rate
environment and search for yield
as well as merger and acquisition
activity which many groups may
seek as a growth strategy.
Our preferred REIT exposures
include: 360 Capital Industrial
Fund (industrial exposure: the
lease expiry profile is strong at
5.8 years and the distribution
yield is around 8% paid quarterly
FY15 and FY16 DPS guidance
provided). Cromwell Property
Group (office exposure) has
a five year weighted average
lease expiry and a track record
of managing cycles (net seller of
assets over the past 12 months)
which we believe will help buffer
against near term challenging
office markets (the yield remains
attractive at around 7% paid
quarterly). We continue to also
prefer REITs with exposure to
niche sectors/high barriers to
entry such as APDC Group (data
centres), Generation Healthcare
REIT (healthcare) and National
Storage REIT (self-storage).
Our preferred retail exposure
remains Federation Centres and
we have recently added it to our
High Conviction list following the
announcement that it proposes
to merge with Novion Property
Group. The new merged entity
will be a top 30 stock with a
market cap of around $11 billion
and the third largest REIT with
$22 billion of assets under
management. We expect given
the increased size and scale
the merged group will become
meaningful for both offshore
and domestic investors. The
deal is expected to be highly
accretive and we expect it will
deliver a yield of around 6%. For
diversified exposure we continue
to prefer Stockland Group
which has good leverage to the
residential markets. For global
exposure we highlight Westfield
Corporation although we note it’s
not for pure yield investors.
AREITs: FY15 forecast distribution yields
10%
9%
8%
7%
6%
5%
4%
3%
2%
WFD GMG MGR IOF GPT LEP DXS CHC SGP ABP GHC BWP SCP NSR NVN FDC SCG ARF HPI FET CQR CMW GOZ GMF AJD TIX TOF ANI IDR GDI
Source: Factset, Morgans
12 | Investment Strategy – Second Quarter 2015
Income
Cash
Government Bonds
The RBA cut the Official Cash
Rate by 25bp during the quarter
to 2.25%. Expectations are for
further interest rate cuts over the
remainder of 2015 and some
commentators are forecasting a
cash rate below 2.00%. The best
at call money account remains
the ANZ V2 PLUS which offers
investors a rate of 2.5%.
Australian Government bond prices
continued to be well supported
by investors and yields fell across
the board over the quarter. Yields
on 3 year government bonds have
fallen to be trading below 1.80%,
while 10 year yields are now below
2.40%, having declined from levels
at the end of the last quarter of
2.13% and 2.73% respectively.
The chart below illustrates how
government bond yields have
shifted over the past 12 months
as economic growth and interest
rate expectations have been pared
back by investors.
Term Deposits
The steady decline of term deposit
rates continued over the quarter
and resulted in the lowering of
income returns for investors,
forcing many to look to higher risk
investments to generate higher
returns. This strategy is clearly not
without risk. While low returning,
we continue to recommend clients
retain deposits as part of a well
diversified portfolio and the best
180 day term deposit rate is 3.1%
while the highest rate on offer for
365 days is 3.15%.
II which came in at the bottom
end of the bookbuild range while
the offer size was increased. Our
preferred corporate issued security
is ORGHA (Add, 5.96% YTC) given
the security’s term to call of under
2 years. We expect that ORG
will look to redeem ORGHA and
refinance it on the Call Date of
20 December 2016.
For those clients seeking exposure
to financial issued securities we
continue to highlight ANZPA (Add,
4.62%) as our favourite major
bank issued CPS/Capital Note.
Further cuts
to Australian
interest rates
are likely
to sustain
the current
demand for
high yield
instruments.
Listed Fixed Interest
Investors continue to look for
exposure to attractively priced
corporate issuance to create
diversification away from the heavy
financial issuance seen over recent
times on the ASX. This demand
was reflected in the pricing of
the Crown Subordinated Notes
3-year government bond yield versus the RBA cash rate
% 6
5
4
3
2
1
0
Jan-10
Jan-11
Jan-12
Cash rate
Jan-13
Jan-14
Jan-15
3-year Government Bonds
Source: IRESS, Morgans
Investment Strategy – Second Quarter 2015 | 13
Model Portfolios
We publish monthly updates of our
Equity Model Portfolios – Income,
Balanced and Growth. These
provide detailed performance
tracking, sector positioning,
rationale for all portfolio changes
and positioning. Below is a quick
overview of the current portfolios
but we encourage readers to visit
the Morgans website to access
their full details via our monthly
Model Portfolio reports.
Income Portfolio
The Income Portfolio continues to
significantly outperform the market
over the medium-long term.
Given the steady deterioration
in the outlook for Australian
interest rates, we think that high
yield investments will continue
to command market premiums
through 2015. That said, we are
mindful that the current ultra-low
interest rate environment is
unsustainable in the long term,
and that investors should not
become complacent about risks to
capital value when that adjustment
inevitably does occur.
Adjustments to the portfolio this
quarter centred around reducing
our weightings to income stocks
which are struggling against
structural headwinds like Woodside
and Bank of Queensland. We
lifted our financials weighting via
Perpetual and Challenger, and also
added Coca-cola in belief that new
management will successfully turn
the company around.
Balanced Portfolio
The portfolio has slightly
underperformed the surging market
in early 2015 due to its limited
exposure to the major banks,
major miners and large cap retail
sectors which have largely driven
monthly moves. We’re comfortable
with a diverse portfolio balance,
particularly with several names
generating offshore earnings.
We do expect the eventual
rotation from overweight market
positioning in Income stocks
into Growth, in line with a steady
economic recovery to the benefit
of Balanced and Growth portfolios.
However we believe the timing
of this trajectory has pushed out
compared with last quarter. We
continue to gradually re-balance
sector weightings to address
our underweight Financials and
overweight Industrials position.
Growth Portfolio
The portfolio continued its stellar
run into 2015, significantly
outperforming the surging market.
High conviction house stocks
Domino’s Pizza, IPH, Shine,
Corporate Travel and Beacon
all performed strongly through
their February results and more
impressively have largely held their
ground since.
The portfolio has now
outperformed the market over
the medium term despite benign
growth in Australia. We continue to
seek leverage to relatively stronger
growth potential offshore, with half
the Portfolio’s revenues derived
either in US dollars or from outside
Australia.
Equity model portfolio performance
25%
22.2%
20.9%
20%
15%
18.0%
14.1%
11.4% 11.0%
14.1%
11.0%
10%
5%
0%
3 Months
1 Year
Income Portfolio
Growth Portfolio
Balanced Portfolio
S&P/ASX 200 Accumulation Index
Source: Morgans, Iress
Cumulative Equity Model Portfolio Performance Since Inception (November 2011)
$550k
$500k
Income
$450k
$400k
Growth
$350k
Balanced
$300k
ASX200
Accumulation
$250k
$200k
Oct 2011
Apr 2012
Oct 2012
Source: Morgans, Iress
14 | Investment Strategy – Second Quarter 2015
Apr 2013
Oct 2013
Apr 2014
Oct 2014
Morgans Equity Model Portfolio constituents
Income
Balanced
CASH CASH
10% 10%
WOW WOW
3%
3%
CGF CGF
3%
3%
CCL
4%
CCL
4%
SUN
4%
SUN
4%
APA
5%
APA
5%
NAB
5%
TLS
12%
TLS
12%
ANZ
10%
ANZ
10%
WES
8%
NAB
5%
PPT
PPT
6%
6%
HVN
6%
BOQ
8%
HVN
6%TCL
8%
SYD
TCL 8%
8%
CASH CASH TLS
OSH OSH
5%
5% 10%
4%
4%
BOQ BOQ
4%
4%
SHL SHL
4%
4%
MPL
4%
ANZ
7%
ANZ
7%
MPL
4%
CGF CGF
WES5%
5%
8%
SEK
SEK
5%
5%
BOQ
8%
MQG
5%
MQG
5%
NAB
5%
SYD
8%
CSL
7%
CSL
7%
BHP
6%
BHP
6%
BXB
6%
NAB
5%
WBC
5%
Growth
WBC
TCL
5%
6%
WES
TCL
6%6%
AMC
WES6%
BXB
6%
AMC
6%
6%
Property
CASH CASH
13% 13%
NAB
5%
LOV
5%
TLS
10%
CSL
9%
DMP
8%
NAB
5%
CTD
5%
IPH
5%
IPH
5%
SEK
5%
SEK
5%
OSH
5%
DMP
8%
GMF
5%
LOV
5%
CTD
5%
CASH CASH
8%
AAD AAD8%
4%
4%
TOF TOF
5%
5%
CSL
9%
OSH
5%
RHC
6%
RHC
WBC
6%6%
CGF
WBC 6%
6%
SHJ
6%
CGF
6%
GMF
5%
BLX
8%
BLX
NSR
8%
5%
NSR
5%
MQG
8%
TIX
MQG 6%
8%
TIX
6%
SHJ
6%
CMW CMW
13% 13%
LLC
6%
SGP
13%
AJD
10%
LLC
6%
BWP
6%
BWP
6%
WFD
9%
WFD
9%
FDC
10%
SGP
13%
AJD
10%
FDC
10%
Source: Morgans
Investment Strategy – First Quarter 2015 | 15
Queensland
New South Wales
Brisbane – Head Office +61 7 3334 4888
Armidale
Brisbane – Edward St +61 7 3121 5677
Ballina
Brisbane – Tynan
+61 7 3152 0600
Balmain
Partners
Bowral
Bundaberg
+61 7 4153 1050
Chatswood
Cairns
+61 7 4222 0555
Coffs Harbour
Caloundra
+61 7 5491 5422
Gosford
Emerald
+61 7 4988 2777
Hurstville
Gladstone
+61 7 4972 8000
Merimbula
Gold Coast
+61 7 5581 5777
Neutral Bay
Ipswich/Springfield
+61 7 3202 3995
Newcastle
Kedron
+61 7 3350 9000
Newport
Morgans Financial Limited
Mackay
+61 7 4957 3033
Orange
ABN
Milton49 010 669 726
+61AFSL
7 3114235410
8600
Port Macquarie
AMtParticipant
of ASX+61
Group
| 5466
A Professional Partner
Gravatt/Capalaba
7 3245
Scone
of
the Financial Planning
Association
of Australia
Noosa
+61 7 5449
9511
Sydney – Level 9
Redcliffe
7 3897
3999
Level 29 123 Eagle+61
Street
Brisbane
Sydney – Level 7
Rockhampton
QLD 4000 Australia+61 7 4922 5855 Currency House
Spring
Hill 202 Brisbane
+61 7 QLD
3833 4001
9333 Australia
Sydney Hunter St
GPO Box
Sunshine Coast
+61 7 5479 2757
Toowoomba
+61 7 4639 1277
Sydney Reynolds
Equities
Townsville
+61 7 4725 5787
Yeppoon
+61 7 4939 3021
Wollongong
Victoria
+61 2 6770 3300
+61 2 6686 4144
+61 2 8755 3333
+61 2 4851 5515
+61 2 8116 1700
+61 2 6651 5700
+61 2 4325 0884
+61 2 9570 5755
+61 2 6495 2869
+61 2 8969 7500
+61 2 4926 4044
+61 2 9998 4200
+61 2 6361 9166
+61 2 6583 1735
+61 2 6544 3144
+61 2 8215 5000
+61 2 8216 5111
Brighton
Camberwell
Carlton
Farrer House
Geelong
Melbourne
Richmond
South Yarra
Traralgon
Warrnambool
Western Australia
+61 3 9519 3555
+61 3 9813 2945
+61 3 9066 3200
+61 3 8644 5488
+61 3 5222 5128
+61 3 9947 4111
+61 3 9916 4000
+61 3 8762 1400
+61 3 5176 6055
+61 3 5559 1500
ACT
Canberra
Perth
+61 8 6462 1999
West Perth
+61 8 6160 8700
South Australia
Adelaide
Norwood
+61 8 8464 5000
+61 8 8461 2800
Corporate Advice
Brisbane
Sydney
Melbourne
Perth
+61 7 3334 4888
+61 2 8215 5055
+61 3 9947 4111
+61 8 6160 8700
+61 2 6232 4999
Northern Territory
Darwin
+61 8 8981 9555
Tasmania
Hobart
+61 3 6236 9000
+61 2 9125 1788
+61 2 9615 4500
+61 2 9373 4452
Make investing easy. Talk to your Morgans adviser
+61 2 4227 3022
or call 1800 777 946 to find your nearest
office.
Queensland
New South Wales
Victoria
Western Australia
Disclaimer
The
information
contained
in this7 report
provided Armidale
to you by Morgans Financial
Limited
as general
only, and is made without
of an individual’s
relevant personal+61
circumstances.
Brighton
+61consideration
3 9519 3555
Brisbane
– Head
Office +61
3334 is4888
+61
2 6770
3300 advice
Perth
8 6462 1999
Morgans
Limited
ABN 49
010 669
726, itsBallina
related bodies corporate, directors
and officers,
authorised representatives
and2945
agents (“Morgans”) do not accept any liability for any
Camberwell
+61 3 9813
BrisbaneFinancial
– Edward
St +61
7 3121
5677
+61 2 6686
4144 employees,
West Perth
8 6160 8700
loss or damage arising from or in connection with any action taken or not taken on the basis of information contained in this report, or for any errors or omissions
contained within. It+61
is recommended
+61 3 9066 3200
Brisbane – Tynan
+61 7 3152 0600
Balmain
+61 2 8755
3333beforeCarlton
that any persons who wish to act upon this report consult
with their Morgans investment
adviser
doing so. Those acting upon such information without advice do so entirely at their own risk.
Partners
South Australia
Farrer House
+61 3 8644 5488
Bowral
+61 2 4851 5515
This report was prepared as private communication to clients of Morgans and is not intended for public circulation, publication or for use by any third party. The contents of this report may not be
Bundaberg
+61 7 4153 1050
Adelaide
+61 8 8464 5000
Geelong
+61
3
5222
5128
Chatswood
+61 this
2 8116
reproduced in whole or in part without the prior written
consent of Morgans. While
report1700
is based on information from sources which Morgans believes are reliable, its accuracy and completeness
Cairns
+61
7
4222
0555
Norwood
+61event
8 8461
Melbourne
+61
3
9947
4111
cannot
be and
guaranteed.
opinions
reflect
Morgans
this
date
and are
subject
to change.
Morgans
is under no obligation to provide revised assessments in the
of 2800
Coffs
Harbour
+61products
2 6651
5700
Morgans
CIMB – Any
Please
visit expressed
www.morgans.com.au
to judgement
understandat the
and
services
within our
alliance.
Caloundra
+61report
7 5491
changed
circumstances. This
does5422
not constitute
an
offer
or
invitation
to
purchase
any
securities
and
should
not
be
relied
upon
in
connection
with
any
contract
or
commitment
whatsoever.
Richmond
+61
3
9916
4000
Gosford
2 4325
Morgans Financial Limited ABN 49 010 669 726 AFSL
235410 A Participant+61
of ASX
Group0884
A Professional Partner of the Financial Planning Association of Australia
Corporate
Advice
Emerald CIMB Securities (Australia)
+61 7 4988
277784 002 768 701), its related bodies
Although
Ltd (ABN
corporate,
directors and
officers,
authorised
representatives
and agents (“CIMB
Securities Australia”)
South
Yarraemployees,
8762
1400 information
2 9570
Personal Information held by Morgans Financial LtdHurstville
may have been used to +61
enable
you to5755
receive this
publication.
If you do not+61
wish3 your
personal
to be used for +61 7 3334 4888
Brisbane
may
have
been
involved
in
the
preparation
of
certain
content
for
this
Research
Report,
this
Research
Report
constitutes
general
advice
provided
by
Morgans
to
the
recipient
of this report under its
Gladstone
7 contact
4972 8000
+61is 3available
5176 6055
this
purpose in the future +61
please
us, eitherMerimbula
at your local Branch or to+61
GPO2Box
2022869
Brisbane Traralgon
Qld 4001. Our privacy policy
online at www.morgans.com.au
6495
Australian
licence
and 5777
Morgans is solely responsible for the content of this report. CIMB Securities Australia do not accept any liability forSydney
any loss or damage arising
from
or in 5055
+61
2 8215
Gold Coastfinancial services+61
7 5581
+61 3 5559 1500
+61 2in8969
7500 or forWarrnambool
connection with any action taken or not taken on theNeutral
basis ofBay
information contained
this report,
any errors or omissions contained within.
Melbourne
+61 3 9947 4111
Ipswich/Springfield
+61 7 3202 3995
Newcastle
+61 2 4926 4044
Disclosure of interest
Perth
+61 8 6160 8700
ACT
Kedron
+61 7 3350 9000
Newport
+61
2 security
9998 4200
Morgans and CIMB Securities Australia may from time to time hold an interest in any
referred to in this report and may, as principal or agent, sell such interests. Morgans or CIMB Securities
Canberra
+61 2 6232 4999
Mackay
+61
7
4957
3033
Australia may previously have acted as manager or Orange
co-manager of a public offering
any such
+61 2of6361
9166securities. Morgans’ affiliates or CIMB Securities Australia affiliates may provide or have provided
Milton services or corporate
+61finance
7 3114to 8600
banking
the companies
to in the report.
The2 knowledge
concerning such services may not be reflected in this report. Each of Morgans and CIMB
Port referred
Macquarie
+61
6583 1735of affiliates
Northern
Territory
Securities
Australia advises+61
that 7it 3245
may earn
brokerage, commissions, fees or other benefits and advantages,
direct or
indirect, in connection with the making of a recommendation or a dealing by a
Mt Gravatt/Capalaba
5466
Scone
+61 2 6544 3144
Darwin
+61 8 8981 9555
client
in
these
securities.
Some
or
all
of
Morgans’
Authorised
Representatives
may
be
remunerated
wholly
or
partly
by
way of commission.
Noosa
+61 7 5449 9511
Sydney – Level 9
+61 2 8215 5000
Regulatory
disclosures
Redcliffe
+61 7 3897 3999
Tasmania
Sydney
+61of2Lovisa
8216 and
5111
LOV: Morgans Corporate Limited is a Joint Lead Manager
to –theLevel
initial7public offer
may receive
fees in this regard. GHC: Morgans Corporate Limited was a Joint Lead Manager to the
Rockhampton
+61 7 4922 5855
Currency
Hobart
+61 Lead
3 6236
9000 to the initial public offer of IPH Limited and may
placement and rights issue for Generation Healthcare
REIT andHouse
received fees in this regard. IPH: Morgans
Corporate Limited is a Joint
Manager
Spring fees
Hill in this regard.+61
3833 9333
St Manager
+61to2the
9125
1788
receive
SHJ:7Morgans
CorporateSydney
Limited Hunter
is the Lead
Shine
Lawyers Limited rights issue and may receive fees in this regard. TIX: Morgans Corporate Limited was a
Sunshine
+61 7 5479
2757
Joint
Lead Coast
Manager and Underwriter
to the
placement and rights issue for 360+61
Industrial
Fund
and received fees in this regard. REG: Analyst owns shares.
2 9615
4500
Toowoomba
+61 7 4639 1277
Sydney Reynolds
+61 2 9373 4452
Recommendation
structure
For
a full explanation of the+61
recommendation
refer to our website at https://www.morgans.com.au/research_disclaimer.
Equities
Townsville
7 4725 5787structure,
Yeppoon
+61
7
4939
3021
Wollongong
+61Morgans
2 4227 3022
If you no longer wish to receive Morgans’ publications please advise your local
office or write to Morgans, Reply Paid 202, Brisbane QLD 4001 and include your account details.
www.morgans.com.au
www.morgans.com.au
Morgans and CIMB – Please visit www.morgans.com.au to understand the products and services within our alliance.
Morgans Financial Limited ABN 49 010 669 726 AFSL 235410 A Participant of ASX Group A Professional Partner of the Financial Planning Association of Australia
Personal Information held by Morgans Financial Ltd may have been used to enable you to receive this publication. If you do not wish your personal information to be used for
this purpose in the future please contact us, either at your local Branch or to GPO Box 202 Brisbane Qld 4001. Our privacy policy is available online at www.morgans.com.au


© Copyright 2026