
The riparian flora and plant communities of the Pilbara region of
Records of the Western Australian Museum, Supplement 78: 485–513 (2015).
The riparian flora and plant communities of the Pilbara region
of Western Australia
M.N. Lyons
Department of Parks and Wildlife, Science and Conservation Division,
Kieran McNamara Conservation Science Centre, Locked Bag 104, Bentley Delivery Centre,
Western Australia 6983, Australia. Email: [email protected]
Abstract – A survey of riparian flora and plant communities was undertaken at
98 wetlands and rivers in the Pilbara region of Western Australia. Sampling was
quadrat-based, with floristics, surface soils and wetland attributes recorded. Selected
sites captured the full range of Pilbara wetland types including springs, river pools,
claypans, salt marshes and rock pools. A total of 455 taxa was recorded from the survey
sites, representing ca. 25% of the known flora of the Pilbara bioregion. The flora is
dominated by taxa with Eremaean and tropical affinities, with only six taxa endemic
in the region. Of recorded taxa known from four or fewer bioregions, most are shared
with the adjacent Carnarvon and Gascoyne bioregions rather than the adjoining
internally draining deserts. Sixteen taxa of conservation significance were documented,
with claypans, the Fortescue Marsh, and Millstream and Karijini National Park sites
dominating occurrences of rare species. Eight major groups were defined by classifying
wetlands in terms of species presence/absence data. Floristic patterning was strongly
aligned with the major wetland types (geomorphic/hydrological) used in the primary
sampling stratification. A combination of wetland morphology/hydrological setting,
site edaphic attributes and distance to the coast were dominant variables related
to riparian floristic composition. Primary compositional separation was observed
between riverine and non-riverine sites, with lowland turbid riverine sites with finetextured soils compositionally related to claypans and clay flats. Limited biogeographic
patterning was evident except where individual IBRA subregions and drainage basins
were dominated by few wetland types.
Keywords – Pilbara, wetland, riparian, floristic composition, botanical survey,
vegetation, rivers
INTRODUCTION
The Pilbara IBRA region of Western Australia
is a region of approximately 179,000 km 2 that
corresponds broadly with the Pilbara Craton,
a major geological block of Archaean origin
(Geological Survey of Western Australia 1990). The
region is recognised as biogeographically distinct
under the scheme developed by Thackway and
Creswell (1994), based on the original Fortescue
Botanical District defined by Beard (1990). A
detailed description of the soils, climate and
landforms of the region is provided by McKenzie et
al. (2011).
The region’s climate is broadly arid, with highly
seasonal, typically intense, summer rainfall that
may include cyclonic systems (Leighton 2004). This,
coupled with a rocky middle and upper landscape,
produces river flows of high energy and volume
and relatively short duration. Extensive aquifer
systems discharge at the surface to form springs
and contribute perennial flows to rivers and creeks.
In lowlands, major rivers have broad channels
with flood flows forming numerous side channels.
Clay flats, claypans and lowland creeks with fine
sediments are typically highly turbid.
Land use in the region is overwhelmingly
dominated by mining and extensive pastoral use.
These uses place pressures on Pilbara wetlands
through hydrological changes associated with
mine dewatering and discharges, and the impact
of grazing cattle. In the Pilbara, stock watering at
natural water points is uncontrolled, concentrating
trampling and grazing in riparian zones, leading to
486
Plate 1
M.N. Lyons
A highly turbid ephemeral claypan at Yarraloola (site PSW074A) in lowlands dominated by Eriachne
benthamii. Trampling by cattle is evident (M.N. Lyons).
bank erosion and waterbody siltation. Aggregation
of stock, particularly late in the dry season,
leads to the eutrophication of waterbodies from
accumulated faeces.
Protection of wetland biological values across the
Pilbara is contingent on a greater understanding
of their biogeographic patterning, for a number
of their biotic components. The existing reserve
network in the Pilbara consists of four reserves
that, while capturing some major wetlands
(e.g. Karijini National Park—gorges, Millstream
National Park—springs), do not include the full
diversity of Pilbara wetlands. The inclusion of
wetland floristic data to inform formal conservation
planning is a relatively recent feature of broadscale biodiversity survey in Western Australia
(Keighery et al. 2000; Lyons et al. 2004; Walshe et al.
2004). This paper aims to document the riparian
flora of the wetlands and rivers of the Pilbara
and examine how the major geographic and site
environments correlate with floristic composition.
The data sets and understanding developed in
the current study, coupled with studies of aquatic
invertebrates by Pinder et al. (2011), will provide the
basis for spatially explicit modelling of the biotic
composition of Pilbara wetlands and rivers.
STUDY AREA AND METHODS
The Pilbara region as defined in this study is
bounded to the south by the Ashburton River and
the east by the De Grey–Oakover River system.
A small number of wetlands were also sampled
in the Rudall River area to the east of the main
study area (Figure 1). The study area includes
the entire Pilbara IBRA region (Thackway and
Cresswell 1994) and additional small areas of
the adjoining Gascoyne and Little Sandy Desert
regions, representing a total area of approximately
225,000 km2.
Precipitation across the region is dominated
by summer rainfall associated with tropical lowpressure systems producing thunderstorms and
cyclones. Annual average rainfall is 290 mm.
Pilbara riparian flora and plant communities
Figure 1
487
Maps of the Pilbara study area showing the 98 wetland sites sampled (note A and B sites at the same
wetland are shown as a single point). Figure 1A shows IBRA6.1 subregions as shaded areas with full
names; the Pilbara Bioregion comprises four subregions: Roebourne Plains (Eastern & Western), Chichester,
Fortescue and Hamersley. Drainage basin boundaries are outlined in black and labelled with abbreviated
names as follows: ASH, Ashburton; OC, Onslow Coast; FOR, Fortescue; PHC, Port Hedland Coast; DGO,
De Grey-Oakover; GSD, Great Sandy Desert. Figure 1B shows the main rivers in blue and two major
wetlands (shaded grey). The sampled wetland sites are numbered as per Table 1.
488
M.N. Lyons
Inter-annually and spatially, rainfall variability
is high, driven largely by the occurrence and
path of cyclones. Winter rainfall from cold fronts
originating in the south contributes significantly
in the western coastal and central uplands of the
region, and attenuates markedly towards the east.
Two resulting bioclimatic zones were identified
by Beard (1990), with the western coastal area
characterised as semi-desert tropical, and the
remainder as desert.
Site selection and sampling
Ninety-eight wetlands were selected to capture
the diversity of wetland types present in each of
the five major drainage basins within the Pilbara
(Figure 1A, Table 1). The selected wetlands formed
the basis of an integrated wetland survey of the
Pilbara that covered a variety of biotic groups of
the water column, including the riparian flora and
vegetation reported here (see McKenzie et al. 2009,
Pinder et al. 2010). Here, riparian is used to describe
environments at the edge of waterbodies; i.e. under
the hydrological influence of the wetland but not
inundated at the time of sampling. This includes
river banks, the waterlogged shallow soil aprons
of rock pools, and the margins of claypans. Some
riverine communities, such as Melaleuca glomerata
on sandy islands, were rarely sampled since they
were often not adjacent to waterbodies.
The primary stratification employed in the survey
was the a priori designation of a number of wetland
types based on hydrological and morphological
attributes. These closely follow the scheme adopted
for the region by Masini (1998): rock pools; springs
and their outflow creeks; river pools; turbid linear
pools; claypans and flooded clay flats; ephemeral
creeks; salt marshes; and gorges. Wetlands were
selected by examining topographic maps and
consulting local experts, followed by aerial and
ground-based reconnaissance. Within major river
systems, sampling sites were distributed along the
length of the main channel, and included the full
range of stream orders from ephemeral headwater
creeks to near-coastal river pools (Figure 1B).
Sampling was undertaken within a representative
section within each selected wetland. At most
wetlands (93), a single linear quadrat (200 m2) was
established parallel to the waterbody margin and
positioned to capture the typical riparian setting
of the wetland. Typically, quadrat configurations
at each wetland were a single 4 m x 50 m or 5 m x
40 m rectangle, depending on riparian zone width.
Within each quadrat, all vascular plants were
scored within eight contiguous 25 m2 subquadrats
to evaluate the adequacy of quadrat size. Two
200 m2 quadrats (designated A and B, see Table
Plate 2
Munreemya Billabong, a seasonal/episodic
wetland on Yarrie Station (wetland site
PSW036A). The riparian zone dominated
by Eucalyptus camaldulensis and E. victrix
over Eriachne benthamii and Dichanthium
fecundum sampled using a linear quadrat
(M.N. Lyons).
1) were sampled at each of five large wetlands
(PSW002, PSW003, PSW004, PSW035, and PSW080),
to capture the major wetland zonation. At some
small wetlands (typically small claypans and
ephemeral streams), discontiguous subquadrats
were surveyed in order to cumulatively sample 200
m2 and to avoid upland vegetation. Quadrats were
marked with steel pegs and their locations recorded
using handheld GPS. For wetlands where the
entire riparian zone was less than 200 m2, such as
very small claypans and rock pools with fringing
shallow soil aprons, the whole wetland fringe
was sampled (Table 1). These different quadrat
configurations are herein referred to as sites. Sites
were scored twice, in autumn and spring, between
2004 and 2006.
Pilbara riparian flora and plant communities
Plate 3
489
Ephemeral claypan on Roy Hill Station (site PSW039A). Sampling the grass- and herb-rich margin
downslope of upland vegetation dominated by Triodia (D. Mickle).
Species accumulation curves were produced in
EstimateS (using Mao Tau) for eight sites to examine
the adequacy of the quadrat design (Colwell 2009).
Input data were compiled as a presence/absence
matrix of species at the eight subquadrats (25 m2)
within each 200 m2 quadrat.
Within sites, surface soil samples (at 5–15 cm
depth) were collected from 30 spaced points
and bulked in the field to yield approximately
2.5 kg samples. Particle size and soil chemistry
were analysed by the Chemistry Centre of
Western Australia. Parameters analysed included
pH, electrical conductivity, organic carbon,
phosphorous, nitrogen, potassium, calcium,
magnesium, sodium, and percent silt, clay and
sand, and three gravel fractions (Table 2). A number
of additional variables were derived for the sites by
Pinder et al. (2011) and are used here. They include
Strahler stream order (Strahler 1952), four inferred
permanence/hydroperiod classes (1 = ephemeral,
2 = seasonal episodic, 3 = near permanent, 4 =
permanent), straight line distance to coast, riverine
versus non-riverine sites, and altitude (Table 3). A
suite of climatic variables (Table 3) was derived
from the BIOCLIM module of ANUCLIM (Houlder
et al. 2000).
To provide a broader perspective on the riparian
flora, the proportion it represents of the known
Pilbara flora, based on records held at the Western
Australian Herbarium (S. Dillon, unpublished
data), was determined. Additionally, the broader
biogeographic relationships of the riparian flora
were explored by examining the IBRA regional
occurrences of the taxa across Western Australia
based on voucher specimen geocodes. Due to
differences in taxonomic resolution across the data
sets, some taxa were amalgamated at the specific
level to yield a final dataset of 430 taxa across the
State’s IBRA regions. Data on the occurrence of
Pilbara riparian taxa were also compiled for the
botanical provinces (Northern, Eremaean and
South-West) of Beard (1990), treating the Coolgardie
IBRA region as Eremaean.
Site name
Coondiner Pool
Fortescue Marsh East
Fortescue Marsh East
Fort Marsh West (Moojari)
Fort Marsh West (Moojari)
Gnalka Gnoona Claypan
Gnalka Gnoona Claypan
Koondepindawarrina Pool
Fortescue Falls
Hamersley Gorge
Bobswim Pool
Palm Spring on Caves Creek
Palm Pool at Millstream
Millstream Delta
Gregory Gorge Pool
Site code
PSW001A
PSW002A
PSW002B
PSW003A
PSW003B
PSW004A
PSW004B
PSW005A
PSW006A
PSW007A
PSW008A
PSW009A
PSW010A
PSW011A
PSW012A
22.1203
29.1546
29.1530
22.3132
22.3162
22.5085
22.5091
22.7256
river pool
spring
river pool
spring
river pool
21.5519
21.5839
21.5698
22.2674
23.0585
Gorge creek (spring fed) 22.2587
116.9686
117.0677
117.0553
117.0383
118.0903
117.9859
118.5513
118.3952
118.4751
118.4920
119.1530
119.1499
119.7796
119.7769
119.6566
Latitude Longitude
(°S)
(°E)
Gorge creek (spring fed) 22.4774
turbid creek pool
claypan
claypan
salt marsh
salt marsh
salt marsh
salt marsh
turbid creek pool
Wetland type
Site group
6.1
6.1
6.1
6.1
7
6.1
6.1
2
2
2
5.2
5.2
5.1
5.1
1
Perm class
4
4
4
4
4
4
4
2
2
2
2
2
2
2
3
Stream order
5
1
5
1
5
4
3
2
0
0
0
0
0
0
4
Riverine
1
1
1
1
1
1
1
1
0
0
0
0
0
0
1
TempAnRa
MaxTeCoP
MedDiuRa
AnMeTemp
DisCoast
31
31
31
MeTemWeQ
28 31.1
92 25.7 14.2 38.8 27.9 31.1
97 25.6 14.1 38.8
95 25.6 14.1 38.7 27.9 31.1
169 24.8 14.3 39.3 29.7 30.8
31
29 30.7
365 24.9 14.2 39.8 31.1
177 24.6 13.5 38.7
216 23.4 13.4 37.9 29.4 29.6
174 25.7 13.8 39.6 29.1 31.4
180 25.7 13.9 39.7 29.2 31.4
180 25.7 13.9 39.7 29.2 31.4
228 25.2 14.9 40.1 30.6 31.2
228 25.2 14.9 40.1 30.6 31.2
267 24.8 15.6 40.2 32.3
267 24.8 15.6 40.2 32.3
286 24.7 15.3 40.1 32.1
AnnPreci
345
354
352
350
299
357
371
349
345
345
303
303
279
279
275
PrecSeas
99
100
100
88
84
96
88
97
96
96
93
93
88
88
87
48
48
48
59
51
48
53
44
44
44
40
40
42
42
44
PrecColQ
Codes: Site code – unique sample site identifier (see Quadrat dimensions for sampling configuration) ; Site group – group derived from UPGMA classification;
Perm class – Inferred permanence class (1 – ephemeral, 2 – seasonal/episodic, 3 – near permanent, 4 – permanent); Stream order – Strahler stream order
(Strahler, 1952); Riverine/non-riverine ( 0 – non-riverine, 1 – riverine); DisCoast – straight line distance to coast (km); AnMeTemp – annual mean temperature
(°C); MedDiuRa- mean temperature diurnal range (°C); MaxTeCoP – maximum temperature coldest period (°C); TempAnRa – temperature annual range (°C);
MeTemWeQ – mean temperature wettest quarter (°C); AnnPrec – annual precipitation (mm); PrecSeas – precipitation seasonality; PrecColQ – precipitation
coldest quarter (mm); Quadrat dimensions in metres (A – 5 x 40; B - 4 x 50 ; C – discontiguous 5 x 30 + 5 x 10; D – discontiguous 4 x 37.5 + 4 x 12.5; E – 10 x 20; F –
discontiguous 5 x15 + 5 x 25; G – discontiguous 5 x 20 +5 x 20; H – sampled out.
Sites sampled for riparian flora.
A
A
A
A
A
A
A
A
A
A
A
A
A
A
A
Quadrat dimensions
Table 1
490
M.N. Lyons
Site name
Palm Spring at Millstream
Myanore Creek Pool
Chalyarn Pool
Nyeetbury Spring
Wodgina Pool
Munda Homestead Pool
De Grey at Yarrie Station
Coppin Gap Pool
Pelican Pool
Glen Herring Pool
Tarquin Rockhole
Carawine Gorge
Bamboo Spring
Weeli Wolli Spring
Queen Desert Spring
Watrara Creek Pool
Poonamerrala Creek Pool
Moreton Pool
Cane River Claypan
Creek Pool near Mt. Amy Well
Cooliarin Pool
Paradise Pool
Site code
PSW013A
PSW014A
PSW015A
PSW016A
PSW017A
PSW018A
PSW019A
PSW020A
PSW021A
PSW022A
PSW023A
PSW024A
PSW025A
PSW026A
PSW027A
PSW028A
PSW029A
PSW030A
PSW031A
PSW032A
PSW033A
PSW034A
claypan
turbid creek pool
river pool
claypan
claypan
river pool
river pool
river pool
spring
spring
river pool
river pool
river pool
river pool
river pool
river pool
river pool
river pool
spring
river pool
turbid creek pool
spring
Wetland type
20.3777
20.5051
22.1945
21.8057
22.6765
22.6186
22.5038
22.4674
22.9156
22.1489
21.4774
21.1906
21.3424
21.3321
20.8840
20.6800
20.5220
21.4255
21.8593
21.7551
21.4435
21.5721
119.4204
118.6219
115.9556
115.1048
115.7161
122.3586
122.0768
122.2583
119.2050
119.6793
121.0279
121.0838
119.6136
120.3744
120.1180
120.2020
118.0618
118.4725
116.5147
116.0365
115.8625
116.9615
Latitude Longitude
(°S)
(°E)
Site group
3
3
6.2
2
3
7
3
3
6.1
6.1
8
7
6.1
7
6.1
8
6.1
7
6.1
6.1
3
6.1
Perm class
3
2
3
2
1
2
3
3
4
4
4
3
4
4
4
3
4
3
4
4
2
4
Stream order
0
2
2
0
2
2
3
2
2
3
6
2
3
5
2
6
5
5
3
4
2
1
Riverine
0
1
1
0
1
1
1
1
1
1
1
1
1
1
1
1
1
1
1
1
1
1
MeTemWeQ
TempAnRa
MaxTeCoP
MedDiuRa
AnMeTemp
DisCoast
26 15.1 39.8 29.3 31.5
29 31.6
30 31.5
32 31.1
15 40.1 29.3 31.5
38 26.6 13.8
38 25.9 31.2
18 25.7 13.2 36.2 24.8 30.3
90 25.9
14 25.3 13.1 37.3 24.9 30.3
128 25.7 15.4 40.8 30.6 31.8
362 25.1 15.2 40.1 32.1 31.3
337 24.9 15.1 39.9 31.9 31.1
40 31.9 31.2
24 14.5 39.1 31.2 30.6
342 25.1 15.1
291
226 24.8 15.7 40.2
192 26.1 15.6 40.4 30.9 31.7
164 26.3 15.3 40.1
141 25.9 15.5 40.4 30.6 31.4
161 26.3 15.6 40.7 30.7 31.8
104 26.9 14.6 40.5 28.8 31.8
85 27.4 14.2 40.5 27.8 32.1
8 25.9 13.1 36.4 24.5 30.6
114
99 25.9 14.8 39.8
62 26.2 14.8 39.5 28.1 31.5
21 25.9 14.2 37.9 26.3 30.9
95 25.6 14.2 38.8 27.9 31.1
AnnPreci
309
308
321
304
277
224
231
230
297
301
272
286
330
302
329
319
304
314
351
307
291
346
PrecSeas
103
104
94
92
87
88
87
88
88
91
93
94
99
99
104
107
101
102
92
91
91
98
PrecColQ
35
39
61
69
65
33
35
34
44
39
36
38
42
37
37
34
41
37
58
57
54
48
Quadrat dimensions
A
A
A
A
A
B
A
A
A
A
A
A
C
A
A
A
A
A
A
A
A
B
Pilbara riparian flora and plant communities
491
Site name
DeGrey Claypan
DeGrey Claypan
Munreemya Billabong
Coppin Pool
Sweet Well Claypan
Roy Hill Claypan
Mulga Downs Outcamp Claypan
Ethel Creek Claypan
Jackson Bore Claypan
Weelarrana Salt Lake
Weelarrana Salt Lake
Yandibiddy Pool
Fork Spring
Red Hill Creek Pool
House Pool on Cane River
Henry River Pool
Whiskey Pool on Ashburton R.
Wallarook Pool on Duck Creek
Cheela Spring
Berringarra Claypan
Catfish Pool on Ashburton R.
Wackilina Creek Pool
Site code
PSW035A
PSW035B
PSW036A
PSW037A
PSW038A
PSW039A
PSW040A
PSW041A
PSW042A
PSW043A
PSW043B
PSW044A
PSW045A
PSW046A
PSW047A
PSW048A
PSW049A
PSW050A
PSW051A
PSW052A
PSW053A
PSW054A
turbid creek pool
river pool
claypan
spring
river pool
river pool
river pool
river pool
river pool
spring
river pool
salt marsh
salt marsh
claypan
claypan
claypan
claypan
claypan
claypan
claypan
claypan
claypan
Wetland type
22.3828
23.3667
23.4922
22.9573
22.4791
22.5296
22.7273
22.0960
21.9623
23.2836
23.9022
24.0706
24.0661
22.8502
22.8234
22.3619
22.6750
20.6521
20.5729
20.6696
20.2886
20.2894
117.6140
116.9596
117.1981
116.8403
116.4684
115.2832
115.6993
115.6209
116.0477
118.1020
118.7123
119.8734
119.8781
120.2356
120.2587
118.9763
119.8111
120.6327
120.2604
120.2269
119.4334
119.4310
Latitude Longitude
(°S)
(°E)
Site group
3
8
2
6.2
7
8
8
8
7
6.2
7
5.2
5.2
4
1
3
4
4
3
3
1
1
Perm class
2
3
2
4
4
4
4
3
3
3
4
2
2
1
1
2
1
1
2
2
2
2
Stream order
2
7
0
1
5
7
5
5
4
1
5
0
0
0
0
0
0
0
0
4
0
0
Riverine
1
1
0
1
1
1
1
1
1
1
1
0
0
0
0
0
0
0
0
1
0
0
MeTemWeQ
TempAnRa
MaxTeCoP
MedDiuRa
AnMeTemp
DisCoast
40 30.3 31.3
31
26 14.9 39.8 28.7 31.5
185 24.5 13.8 38.8 29.5 30.5
257 25.8 15.2 41.5 32.4 32.2
288 25.7 15.1 41.4 32.5 32.2
32
15 40.6 30.5 31.8
15 40.1 29.4 31.4
215 25.8 15.1 41.2 31.6
148 25.7
95 25.5
132 25.7 15.4 40.9 30.8 31.8
65 25.8 14.6 39.4 28.2 31.3
74
289 24.8 14.4 40.1 31.6 31.2
369 23.8 14.8 39.6 32.8 30.6
436 22.8 14.9 38.6 33.2 29.6
436 22.8 14.9 38.6 33.2 29.6
317 24.4 15.5 39.7 32.6 30.8
312 24.4 15.6 39.7 32.6 30.8
225 25.4 14.5
285 24.7 15.5 40.1 32.3
92 26.8 14.6 39.9 28.1 31.5
73 26.9 13.9 39.9 27.3 31.5
84 27.2 14.2 40.4 27.8 31.9
24 26.5 13.6 37.7 25.5 31.1
24 26.5 13.6 37.7 25.5 31.1
AnnPreci
341
234
224
275
332
288
274
318
330
269
236
223
223
257
257
309
272
321
333
323
305
305
PrecSeas
88
81
78
82
85
88
87
98
92
78
70
73
73
85
86
94
86
103
105
106
103
103
PrecColQ
51
47
47
52
61
70
64
63
61
49
45
37
37
37
36
40
43
35
38
35
35
35
Quadrat dimensions
A
A
A
A
A
A
A
A
A
A
A
E
E
A
A
A
D
B
B
A
A
A
492
M.N. Lyons
Site name
Errawallana Spring
Pool Spring on Sherlock River
Carleecarleethong Pool
Kumina Creek
The Springs on Jones River
Chinaman Spring
Miningarra Creek
Gregory Range Creek
Skull Springs
Bonnie Pool
Cookes Creek Pool
Kalgan Pool on Kalgan Creek
Wannagunna Spring
Flatrocks Spring
Horrigans Pool
Running Waters
Karratha Granite Rock
Curara Claypan
Mindaroo Claypan
Yarraloola Claypan
Burrup Peninsula Creek
Pool on Lower Fortescue River
Site code
PSW055A
PSW056A
PSW057A
PSW058A
PSW059A
PSW060A
PSW061A
PSW062A
PSW063A
PSW064A
PSW065A
PSW066A
PSW067A
PSW068A
PSW069A
PSW070A
PSW071A
PSW072A
PSW073A
PSW074A
PSW075A
PSW076A
river pool
ephemeral creek
claypan
claypan
claypan
rock pools
spring
river pool
spring
river pool
river pool
river pool
river pool
spring
ephemeral creek
ephemeral creek
spring
spring
river pool
river pool
river pool
spring
Wetland type
21.3324
20.5656
21.4285
21.9146
22.6647
20.9100
21.6858
23.5552
23.2533
24.3006
23.1871
21.6806
21.9778
21.8635
21.2538
20.7492
20.6105
21.1039
21.8626
20.4655
20.8124
21.6265
116.1547
116.8247
115.6847
114.9090
116.0702
116.7353
121.1253
118.2586
118.1514
118.8731
119.6976
120.4813
119.9912
121.0078
121.0783
120.3067
120.3448
117.2483
116.9090
119.5295
117.5969
117.7752
Latitude Longitude
(°S)
(°E)
Site group
6.1
7
3
4
8
4
6.1
6.2
7
8
7
3
7
6.1
6.1
7
6.1
6.1
3
8
7
7
Perm class
4
2
1
1
2
1
4
4
4
4
3
3
4
4
1
2
3
4
3
4
4
4
Stream order
5
1
0
0
1
0
1
5
1
4
4
3
3
1
2
4
1
2
3
6
5
2
Riverine
1
1
0
0
1
0
1
1
1
1
1
1
1
1
1
1
1
1
1
1
1
1
MeTemWeQ
TempAnRa
MaxTeCoP
MedDiuRa
AnMeTemp
DisCoast
31
31
26 15.3
40 30.3 31.3
32
30
40 31.5 31.1
26 15.4 41.1 30.9
32
26 13.3 37.2 25.1 30.9
35 26.1 14.6 38.3 26.9 31.1
0.9 25.9 12.5 36.3 23.7 30.6
11 25.8 13.6 37.3 25.2 30.7
20 25.1 13.1 37.2 24.9 30.1
142
22
218 25.9 15.6 40.3 31.3 31.5
320 24.7 14.7 40.2 32.2 31.3
288 24.8 14.4
418 23.3 15.1 39.6 33.6 30.4
336 23.4 14.6 38.4 31.7
193 25.2 15.9 40.2 31.9 31.1
217 24.3 16.1 39.8 32.6 30.6
230 25.4 15.7 40.2 31.7 31.3
178
94 27.3 14.4 40.5 28.2
77 27.1 14.2 40.2 27.6 31.8
53 25.9 13.7 37.8 26.3
125 25.1 14.2 38.9 28.7 30.8
43 26.7 13.9 38.6 26.4 31.5
12 26.2 13.4 37.4 25.4
105 25.1 13.9 38.3 28.1 30.6
AnnPreci
303
274
292
300
280
269
263
245
275
226
291
301
319
265
285
318
324
323
366
319
304
372
PrecSeas
90
94
92
90
87
93
91
74
79
68
79
91
89
89
91
106
105
111
95
103
103
105
PrecColQ
61
43
57
72
60
49
36
47
49
43
45
41
42
37
39
34
35
40
57
37
41
48
Quadrat dimensions
A
F
B
B
A
H
A
A
A
A
A
A
A
A
A
A
A
A
A
A
A
A
Pilbara riparian flora and plant communities
493
Site name
Burrup Peninsula Rockhole
Croyden Claypan
West Peawah Creek Pool
Redrock on Indee Station
Redrock on Indee Station
Billan Ballan Creek Pool
Tongololo Creek Pool
Turee Creek Claypan
Gorge Junction Pool
Glen Ross Creek
Carrowina Pool
Innawally Pool
Rocky Island Pool
Panorama Spring
Kangan Pool on Sherlock River
Harding River Pool
Cangan Pool on Cockerega Ck.
Homestead Creek
Joffre Creek
Un-named Creek in Millstream N.P.
Benmore Well Claypan
Croydon Crabhole Flat
Karratha Crabhole Flat
Site code
PSW077A
PSW078A
PSW079A
PSW080A
PSW080B
PSW081A
PSW082A
PSW083A
PSW084A
PSW085A
PSW086A
PSW087A
PSW088A
PSW089A
PSW090A
PSW091A
PSW092A
PSW093A
PSW094A
PSW095A
PSW096A
PSW097A
PSW098A
clay flat
clay flat
claypan
ephemeral creek
ephemeral creek
ephemeral creek
river pool
river pool
river pool
spring
river pool
river pool
river pool
ephemeral creek
river pool
claypan
river pool
river pool
rock pool
rock pool
turbid creek pool
claypan
ephemeral creek
Wetland type
20.8759
21.0638
21.0444
21.5799
22.3918
23.2485
21.6953
21.3377
21.0977
21.2018
21.5481
23.3621
22.5784
24.1790
25.0842
23.6525
22.1653
21.9690
20.8746
20.8755
20.7641
21.0383
20.5736
116.7298
117.7091
117.6636
117.1029
118.2583
119.5992
118.6296
117.0697
117.6271
119.3205
119.3435
120.1904
121.0343
118.0298
118.0548
118.0988
121.0803
120.8556
118.5895
118.5885
118.0150
117.6534
116.8075
Latitude Longitude
(°S)
(°E)
Site group
3
3
1
3
3
7
6.1
7
7
6.1
7
3
3
3
6.1
3
3
7
4
4
3
4
7
Perm class
1
1
2
2
2
2
3
4
4
4
3
3
4
2
2
1
3
3
1
2
2
1
3
Stream order
0
1
1
2
4
2
4
2
5
1
5
4
3
3
6
0
5
2
0
0
4
1
1
Riverine
0
1
1
1
1
1
1
1
1
1
1
1
1
1
1
1
0
1
0
0
1
1
1
MeTemWeQ
TempAnRa
MaxTeCoP
MedDiuRa
AnMeTemp
DisCoast
31
40 32.1 31.1
32 31.2
15 40.7 33.1 31.5
16 40.8 31.2 31.5
15 38.8 32.5 30.3
30 31.5
27 30.6
31
31
24
26 13.2 37.1 24.9 30.8
43 26.2 13.9 38.1 26.5 31.2
40 26.1 13.7 37.9 26.4
98 25.5 14.1 38.7 27.9
201 24.2 13.3 38.4 29.1 30.3
335 23.1 14.5 38.1 31.6 29.7
147 25.9 15.2 40.3
70 25.3 13.8 37.8
41 25.7 13.6 37.7 26.4 30.9
115 26.1 15.7 40.3 30.2 31.5
150 25.8
370 23.6
308 24.6 15.6 39.7 32.4 30.9
386 24.4 14.9 40.5 33.2 30.9
378 24.6
337 25.1 14.8 40.7 32.5 31.6
266 25.1 15.6
238 25.2 15.8 40.2
62 25.8 14.3 37.9 27.1 30.7
62 25.8 14.3 37.9 27.1 30.7
24 26.1 13.5 37.2 25.6 30.9
38 26.1 13.7 37.9 26.4
1 25.9 12.5 36.4 23.7 30.6
AnnPreci
269
316
319
356
375
296
313
344
329
336
319
255
230
223
221
230
247
265
309
309
307
319
272
PrecSeas
93
107
107
102
91
79
100
105
108
103
99
81
87
67
68
72
88
89
102
102
102
107
94
PrecColQ
49
41
41
48
51
46
37
47
43
42
38
39
32
52
50
47
34
37
39
39
41
41
43
Quadrat dimensions
A
A
A
A
B
A
A
A
A
A
A
B
A
B
A
D
A
A
H
H
A
G
H
494
M.N. Lyons
EC (1:5)
mS/m
8
140
150
290
770
8
8
11
70
19
12
200
83
410
85
420
Site code
PSW001A
PSW002A
PSW002B
PSW003A
PSW003B
PSW004A
PSW004B
PSW005A
PSW006A
PSW007A
PSW008A
PSW009A
PSW010A
PSW011A
PSW012A
PSW013A
pH (H2O)
8.3
8.3
8.3
8.8
8.4
8.6
8.4
8.3
6.3
6.5
6.5
8.2
7.9
7.9
7.4
6.4
OrgC (W/B) %
1.02
1.28
3.7
0.41
0.86
0.66
0.76
2.02
1
0.9
0.9
0.78
0.49
0.52
0.37
1.55
P (total) mg/kg
110
270
290
170
220
190
270
480
520
480
480
240
350
370
450
640
Sand %
75
74.5
55.5
77
74.5
90.5
83.5
83.5
36
44
44
49.5
49
63
34
56.5
Silt %
17
11.5
29.5
8
11.5
5.5
8
10.5
22
19.5
19.5
31
32.5
15.5
32
12
Clay %
8
14
15
15
14
4
8.5
6
42
36.5
36.5
19.5
18.5
21.5
34
31.5
Gravel >16mm %
0
9
0
24.1
11.1
4.3
19.6
15.7
0
3.9
3.9
0
0
0
0
0
Gravel 8–16mm %
0
24
0
19.5
15.9
8.3
10.2
15.4
0
9.8
9.8
0
0
0
0
0
Gravel 4.8–8mm %
0
40.5
0
15.5
30.1
5.3
12.9
17.1
0
13.3
13.3
0
0
0
0
0
Gravel 2–4.8mm %
0
14.4
0
16.4
16.5
33
28.9
19.2
0
18.1
18.1
0
0
0
0
0
P (HCO3) mg/kg
3
4
9
2
3
5
3
6
54
23
23
8
19
24
34
50
Ca (exch) me%
11.57
7.24
12.1
4.83
5.46
4.47
5.59
4.12
10.18
10.76
10.76
9.32
15.02
5.48
7.11
6.3
Mg (exch) me%
9.7
5.14
15.58
7.16
14.23
1.32
4.14
6.9
4.42
4.64
4.64
6.54
3.02
2.12
3.13
2.75
7.62
1.78
11.89
2.07
2.99
0.22
0.41
1.5
0.63
0.46
0.46
3.32
1.64
2.27
3.41
0.33
Na (exch) me%
Codes: EC (1:5) mS/m – electrical conductivity; pH (H20) – pH in distilled water; OrgC (W/B) % – percent organic carbon (Walkely Black); P (total) mg/kg –
total Phosphorus; P (HCO3) mg/kg – extractable Phosphorus; Ca (exch) me% – exchangeable Calcium milliequivalent percent; Mg (exch) me% – exchangeable
Magnesium milliequivalent percent; Na (exch) me% – exchangeable Sodium milliequivalent percent; K (exch) me% – exchangeable Potassium milliequivalent
percent.
Soil variables for each riparian site sampled. For detail on soils analyses see Meissner et al. (2009).
1.6
0.9
5
0.89
1.2
0.17
0.55
0.69
2.03
2.02
2.02
5
4.12
2.34
3.56
1.18
K (exch) me%
Table 2
Pilbara riparian flora and plant communities
495
EC (1:5)
mS/m
5
67
50
30
38
23
48
33
110
39
100
48
40
53
84
230
17
10
350
4
5
7
Site code
PSW014A
PSW015A
PSW016A
PSW017A
PSW018A
PSW019A
PSW020A
PSW021A
PSW022A
PSW023A
PSW024A
PSW025A
PSW026A
PSW027A
PSW028A
PSW029A
PSW030A
PSW031A
PSW032A
PSW033A
PSW034A
PSW035A
pH (H2O)
7.3
6.9
7.4
8.9
7.4
6.6
7.9
8
7.1
8.5
8.4
8
9
9.6
9.4
9.7
8
8.4
9
8.4
9
6.3
OrgC (W/B) %
0.14
0.81
0.17
1.17
0.28
1.68
0.38
0.67
1.02
0.89
1.22
2.41
1.56
0.74
0.4
0.38
0.54
0.56
0.5
1
0.92
1.24
P (total) mg/kg
130
240
93
250
190
380
110
200
87
300
380
310
260
200
150
100
190
150
190
280
330
380
Sand %
52
86
94
57.5
73.5
27
93.5
90
93.5
88
81.5
74.5
81.5
89
93
91.5
88
81
87.5
88
77.5
24
Silt %
9
7
2
29.5
10
34
2.5
5.5
3.5
7
8.5
14
12
6
4.5
5
5
7
5.5
8
14
29
Clay %
39
7
4
13
16.5
39
4
4.5
3
5
10
11.5
6.5
5
2.5
3.5
7
12
7
4
8.5
47
Gravel >16mm %
0
0
0
0
0
0
0.9
0
0
6
6.4
0
0
8.1
0
12
0
9
26.1
15.7
0
0
Gravel 8–16mm %
0
0
0
0
0
0
3.6
0
0
6.4
12.3
0
0
14.3
0
10.7
0
11.7
13.6
16.6
0
0
Gravel 4.8–8mm %
0
0
0
0
0
0
5.3
0
0
12.1
19.1
0
0
25.1
0
7.9
0
16.9
6.8
7.8
0
0
Gravel 2–4.8mm %
0
0
0
0
0
0
12.2
0
0
27.4
30.5
0
0
19
0
25
0
11.2
16.5
16.7
0
0
P (HCO3) mg/kg
5
28
5
13
15
38
5
9
4
3
9
17
16
4
5
2
10
12
4
3
9
9
Ca (exch) me%
4.24
4.56
0.98
1.73
2.21
9.22
2.31
2.22
1.19
4.58
10.06
12.19
6.25
2.96
1.88
1.72
6.1
8.37
6.34
6.52
4.35
15.54
Mg (exch) me%
5.5
1.87
0.27
16.03
1.27
5.09
2.11
2.48
1.93
4.63
6.33
5.63
4.91
4.54
1.48
3.52
1.86
2.02
1.91
6.8
6.86
5.73
Na (exch) me%
1.67
0.25
0.14
4.2
0.85
0.64
1.18
1.38
1.01
0.83
1.06
1.74
2.72
4.75
1.66
3.18
0.36
0.84
1.67
1
3.11
0.18
K (exch) me%
0.86
0.42
0.18
1.49
0.5
2.61
0.18
0.22
0.35
0.53
0.28
0.45
0.41
0.19
0.13
0.26
0.38
0.48
0.26
0.44
1.8
1.16
496
M.N. Lyons
EC (1:5)
mS/m
4
6
2
9
5
39
8
17
300
530
32
130
48
50
21
20
54
280
25
71
8
49
Site code
PSW035B
PSW036A
PSW037A
PSW038A
PSW039A
PSW040A
PSW041A
PSW042A
PSW043A
PSW043B
PSW044A
PSW045A
PSW046A
PSW047A
PSW048A
PSW049A
PSW050A
PSW051A
PSW052A
PSW053A
PSW054A
PSW055A
pH (H2O)
8.6
6
8
7.5
9.1
8.4
8.3
8.5
7.7
8.4
8.5
8.7
8.2
8
7.7
7.4
7.3
7.8
7.7
6.5
6.6
6.1
OrgC (W/B) %
1.72
0.96
0.44
0.36
0.45
0.46
0.42
0.44
0.57
0.59
2.93
0.71
0.14
0.18
0.11
0.27
0.21
0.16
0.08
0.16
0.86
0.18
P (total) mg/kg
240
360
210
260
92
280
230
160
200
390
240
180
200
280
220
840
460
93
78
83
280
140
Sand %
82.5
43
82
83
52
81
80.5
91
79
88.5
88
84.5
94
86
55
53.5
58.5
95
93
97.5
56.5
73
Silt %
8
16
9
8
30
7.5
9
4.5
11
5.5
7.5
6
2
6
9
15.5
13
1
1
0.5
17
8
Clay %
9.5
41
9
9
18
11.5
10.5
4.5
10
6
4.5
9.5
4
8
36
31
28.5
4
6
2
26.5
19
Gravel >16mm %
0
0
0
3.1
0
0
0
2.9
0
26.5
4.5
0
0
0
0
0
0
0
0
0
0
0
Gravel 8–16mm %
0
0
0
11.1
0
0
0
3.8
0
19.5
10.3
0
0
0
0
0
0
0
0
0
0
0
Gravel 4.8–8mm %
0
0
0
14
0
0
0
3.1
0
11.1
9.9
0
0
0
0
0
0
0
0
0
0
0
Gravel 2–4.8mm %
0
0
0
22.4
0
0
0
4.8
0
10
26.4
0
0
0
0
0
0
0
0
0
0
0
P (HCO3) mg/kg
10
15
12
14
4
5
11
9
4
9
12
3
12
7
13
19
12
4
5
6
14
7
Ca (exch) me%
6.4
9.61
5.72
3.02
2.94
5.74
6.58
2.7
4.98
4.02
6.63
4.78
8.01
9.84
6.66
5.52
5.43
0.73
0.76
0.66
9.61
1.32
Mg (exch) me%
6.48
5.21
2.2
1.36
3.45
3.84
1.77
1.5
2.5
2.13
9.5
2.16
1.25
1.06
3.79
1.74
2.41
0.45
0.41
0.25
5.22
2.34
Na (exch) me%
1.82
0.37
1.02
0.38
7.28
1
0.23
0.25
0.33
0.97
3.22
0.9
1.42
0.66
1.69
0.81
1.42
0.49
0.55
0.08
0.27
0.35
K (exch) me%
0.33
1.2
0.43
0.49
0.87
0.5
0.36
0.22
0.34
0.36
2.54
0.31
1.2
1.11
0.77
2.57
2.7
0.46
0.29
0.1
0.64
0.39
Pilbara riparian flora and plant communities
497
EC (1:5)
mS/m
56
6
20
38
100
31
32
150
190
11
24
36
140
24
37
15
9
6
12
190
290
7
Site code
PSW056A
PSW057A
PSW058A
PSW059A
PSW060A
PSW061A
PSW062A
PSW063A
PSW064A
PSW065A
PSW066A
PSW067A
PSW068A
PSW069A
PSW070A
PSW071A
PSW072A
PSW073A
PSW074A
PSW075A
PSW076A
PSW077A
pH (H2O)
5.9
8.2
8.2
7.4
9.2
5.2
6.2
8.3
8.4
8.5
8.6
8.4
7
8.9
8.4
8.8
9.2
6.8
8.5
7.4
8.3
8.9
OrgC (W/B) %
0.76
0.84
1.68
0.28
0.06
1.15
0.78
0.21
0.3
1.1
0.45
0.62
0.38
1.37
0.45
1.44
0.37
4.22
1.27
0.38
0.07
0.29
P (total) mg/kg
270
280
240
290
78
410
300
270
78
200
180
330
110
480
350
210
190
320
140
440
110
120
Sand %
63
85
82.5
57.5
93
31.5
71.5
95
95.5
91.5
88.5
92.5
90.5
69
95
84
96
86.5
84
93.5
97
93
Silt %
8
6
10.5
12
0.5
23.5
14
1
2
5
5.5
3.5
5.5
13.5
2
9.5
1.5
8
8
3
0.5
2
Clay %
29
9
7
30.5
6.5
45
14.5
4
2.5
3.5
6
4
4
17.5
3
6.5
2.5
5.5
8
3.5
2.5
5
Gravel >16mm %
0
23.4
0
0
0
0
0
3.1
0
0
5.4
20.6
0
0
0
0
8.1
0
0
16.4
0
0
Gravel 8–16mm %
0
18.4
0
0
0
0
0
7.9
0
0
9.9
22.1
0
0
0
0
5.4
0
0
22.9
0
0
Gravel 4.8–8mm %
0
12.8
0
0
0
0
0
9.9
0
0
12.7
12.5
0
0
0
0
6
0
0
18.8
0
0
Gravel 2–4.8mm %
0
10.6
0
0
0
0
0
24.2
0
0
21
19.1
0
0
0
0
35
0
0
19.1
0
0
P (HCO3) mg/kg
22
11
8
10
2
25
22
2
1
7
3
4
2
32
6
6
4
15
2
5
5
4
Ca (exch) me%
4.19
7.34
7.81
5.12
1.05
6.5
4.17
2.01
1.51
4.43
5.26
3.37
1.5
7.77
2.14
5.63
3.06
9.21
8.01
2.47
2.85
3.6
Mg (exch) me%
2.39
6.35
3.62
2.59
0.66
5.5
3.03
1.07
0.7
4.02
3.32
2.75
1.11
3.82
2.4
5.56
1.32
7.64
12.76
1.58
0.91
2.29
Na (exch) me%
0.25
1.78
2.42
0.71
1.2
0.31
0.5
0.42
0.3
2.72
0.94
0.73
0.37
10.03
1.39
1.38
1.34
1.27
0.89
0.52
0.32
1.39
K (exch) me%
0.81
0.55
0.41
1.18
0.22
0.89
0.39
0.25
0.15
1.02
0.49
0.33
0.12
0.46
0.15
0.7
0.11
0.85
0.17
1.17
0.11
0.29
498
M.N. Lyons
EC (1:5)
mS/m
23
6
4
20
110
14
17
64
160
35
14
53
190
19
94
41
8
5
11
2
9
12
Site code
PSW078A
PSW079A
PSW080A
PSW080B
PSW081A
PSW082A
PSW083A
PSW084A
PSW085A
PSW086A
PSW087A
PSW088A
PSW089A
PSW090A
PSW091A
PSW092A
PSW093A
PSW094A
PSW095A
PSW096A
PSW097A
PSW098A
pH (H2O)
8.6
8
6.6
8
6.4
8.5
9.6
8.8
8.6
8.2
9.4
7.6
7.7
7.5
7.6
6.7
7.3
9.3
5.3
6
6.4
7.6
OrgC (W/B) %
0.42
0.38
0.21
1.01
1.6
0.37
0.71
1.72
0.64
1.94
0.54
0.45
1.13
0.5
1.09
0.24
1.06
1.95
0.42
0.48
1.02
0.16
P (total) mg/kg
120
180
190
270
400
240
250
390
140
220
180
120
290
390
260
190
280
390
480
120
130
110
Sand %
53.5
46
79.5
60
80.5
92.5
92.5
77.5
92
87
91.5
89.5
80
84
71
78.5
77.5
77
86
81.5
85.5
82.5
Silt %
14
16.5
6.5
19.5
10.5
3.5
3
12
3.5
8
4
4
7.5
7
13
5
9.5
13
7
10.5
6
4
Clay %
32.5
37.5
14
20.5
9
4
4.5
10.5
4.5
5
4.5
6.5
12.5
9
16
16.5
13
10
7
8
8.5
13.5
Gravel >16mm %
0
0
0
0
3.6
11.8
7.4
15.8
7.6
0
24.8
0
0
6.2
26.5
0
5.8
0
22.1
2.4
0
0
Gravel 8–16mm %
0
0
0
0
17.1
26.5
14.6
10.5
3.2
0
20.2
0
0
9.6
8.1
0
10.1
0
14
3.2
0
0
Gravel 4.8–8mm %
0
0
0
0
11.8
16.5
12.3
5.9
4
0
20.1
0
0
0
7.7
0
6.9
0
10.4
7.1
0
0
Gravel 2–4.8mm %
0
0
0
0
23.9
21.6
30.2
15
14.7
0
19.8
0
0
24.7
16.6
0
8.6
0
17.3
19.4
0
0
P (HCO3) mg/kg
5
8
8
4
4
6
5
6
6
8
7
3
10
11
7
13
11
29
96
3
18
4
Ca (exch) me%
16.12
19.53
1.59
11.48
4.51
5.53
3.81
5.53
5.05
4.42
2.69
3.19
6.71
4.93
9.46
2.58
8.11
4.62
1.17
1.44
4.34
1.12
Mg (exch) me%
4.99
2.82
0.93
3.23
2.12
1.98
1.95
10.52
2.16
8.37
0.9
1.22
1.22
4.18
3.04
2.75
2.14
2.32
0.73
0.94
1.34
0.2
Na (exch) me%
0.89
0.39
0.09
0.27
0.14
0.2
3.29
4.58
0.66
3.17
2.77
0.66
0.38
2.46
0.57
0.77
0.39
7.91
0.52
0.17
0.15
0.85
K (exch) me%
0.65
0.7
0.28
0.79
0.33
0.27
0.28
0.31
0.24
0.24
0.26
0.19
1.06
0.36
0.81
0.58
0.57
1.02
0.28
0.18
0.41
0.31
Pilbara riparian flora and plant communities
499
2.0
1.0
0.4
137.2
Perm class
Stream order
Riverine/lacustrine
DisCoast
14.4
38.6
28.4
31.0
292.2
97.2
38.2
MedDiuRa
MaxTeCoP
TempAnRa
MeTemWeQ
AnnPreci
PrecSeas
PrecColQ
0.0
0.0
Gravel >16mm (%)
Gravel 8–16mm (%)
Soil variables
25.6
AnMeTemp
Climatic variables
13.8
Species richness
0.0
0.0
1.6
4.0
10.2
0.0
1.4
0.5
0.4
0.4
66.2
0.2
0.8
0.2
2.2
6.1
2.2
49.6
91.8
313.4
31.3
29.0
39.5
14.0
25.6
167.2
0.2
0.4
2.0
22.0
Mean
Mean
SE
2
1
2.4
0.8
4.7
3.4
22.5
0.3
1.2
0.7
0.3
0.1
43.9
0.2
0.4
0.0
4.6
SE
2.6
1.4
44.1
92.2
292.1
31.0
29.1
39.0
14.4
25.4
166.8
0.7
2.1
2.2
41.8
Mean
3
1.3
0.8
1.8
2.1
9.7
0.1
0.6
0.3
0.2
0.2
27.3
0.1
0.3
0.2
3.0
SE
0.5
0.3
45.1
95.1
292.4
30.9
28.1
38.6
14.3
25.6
119.4
0.1
0.1
1.1
39.4
Mean
4
0.5
0.3
4.5
3.1
8.7
0.1
1.2
0.4
0.4
0.2
47.9
0.1
0.1
0.1
3.6
SE
0.0
0.0
42.0
88.0
279.0
31.0
32.3
40.2
15.6
24.8
267.0
0.0
0.0
2.0
23.5
Mean
5.1
0.0
0.0
0.0
0.0
0.0
0.0
0.0
0.0
0.0
0.0
0.0
0.0
0.0
0.0
7.5
SE
0.0
0.0
38.5
83.0
263.0
30.4
31.9
39.4
14.9
24.0
332.0
0.0
0.0
2.0
10.0
Mean
5.2
0.0
0.0
0.8
5.0
20.0
0.4
0.7
0.4
0.0
0.6
60.0
0.0
0.0
0.0
0.9
SE
9.0
8.6
45.5
94.9
318.6
31.2
29.2
39.3
14.6
25.6
143.6
1.0
2.8
3.7
18.4
Mean
6.1
1.6
1.8
1.6
1.8
7.1
0.1
0.4
0.2
0.2
0.1
18.2
0.0
0.3
0.2
1.0
SE
2.6
1.1
52.3
82.0
277.5
31.5
31.2
40.4
14.8
25.3
228.5
1.0
2.3
3.5
9.8
Mean
6.2
2.4
1.1
1.3
1.9
7.4
0.2
0.2
0.3
0.1
0.3
51.1
0.0
0.9
0.3
2.6
SE
6.3
7.0
43.8
92.5
300.0
31.0
29.4
39.2
14.6
25.3
173.6
1.0
3.3
3.2
26.9
Mean
7
2.0
2.3
1.7
2.4
8.0
0.1
0.6
0.3
0.2
0.2
27.7
0.0
0.3
0.2
1.6
SE
1.5
0.9
50.4
90.2
281.1
31.6
30.0
40.2
14.9
25.8
158.8
1.0
5.2
3.4
19.9
Mean
8
1.1
0.6
4.2
3.3
10.6
0.2
0.7
0.3
0.2
0.3
39.2
0.0
0.6
0.2
2.7
SE
Codes: Species richness – number of taxa per site; Perm class – Inferred permanence class (1 – ephemeral, 2 – seasonal/episodic, 3 – near permanent, 4 – permanent);
Stream order – Strahler stream order (Strahler, 1952); Riverine/non-riverine ( 0 – non-riverine, 1 – riverine); DisCoast – straight line distance to coast (km); AnMeTemp
– annual mean temperature (°C); MedDiuRa – mean temperature diurnal range (°C); MaxTeCoP – maximum temperature coldest period (°C); TempAnRa –
temperature annual range (°C); MeTemWeQ – mean temperature wettest quarter (°C); AnnPrec – annual precipitation (mm); PrecSeas – precipitation seasonality;
PrecColQ – precipitation coldest quarter (mm); EC (1:5) mS/m – electrical conductivity; pH (H20) – pH in distilled water; OrgC (W/B) % – percent organic carbon
(Walkely Black); P (total) mg/kg – total Phosphorus; P (HCO3) mg/kg – extractable Phosphorus; Ca (exch) me% – exchangeable Calcium milliequivalent percent;
Mg (exch) me% – exchangeable Magnesium milliequivalent percent; Na (exch) me% – exchangeable Sodium milliequivalent percent; K (exch) me% – exchangeable
Potassium milliequivalent percent.
Mean values ± standard error (SE) for species richness and environmental variables for the site groups defined from sampling Pilbara riparian vegetation.
Site Group
Table 3
500
M.N. Lyons
0.0
0.0
62.9
10.2
26.9
5.8
6.8
0.5
388.0
17.8
3.8
2.7
0.7
1.1
Gravel 2–4.8mm (%)
Sand %
Silt %
Clay %
EC (1:5) mS/m
pH (H2O)
OrgC (W/B) %
P (total) mg/kg
P (HCO3) mg/kg
Ca (exch) me%
Mg (exch) me%
Na (exch) me%
K (exch) me%
0.7
6.8
12.4
28.1
15.8
56.1
11.7
8.1
0.4
0.3
0.7
0.9
7.5
1.4
0.6
3.3
7.4
25.8
131.9 386.0
0.2
0.2
1.1
4.1
1.4
5.0
0.0
0.0
Mean
Mean
SE
2
1
Gravel 4.8–8mm (%)
Site Group
0.3
0.1
0.7
1.8
7.3
63.0
0.1
0.2
3.0
6.1
2.7
8.8
4.6
3.1
SE
0.8
0.6
2.7
6.5
10.6
251.0
0.7
7.2
23.9
17.7
10.8
71.6
3.3
1.6
Mean
3
0.1
0.1
0.3
1.0
1.7
24.9
0.1
0.1
7.3
2.7
1.5
4.1
1.6
1.0
SE
0.4
0.8
1.4
2.3
7.6
142.7
0.3
7.5
11.3
12.6
5.7
81.6
2.8
1.0
Mean
4
0.1
0.2
0.5
0.8
2.7
30.2
0.1
0.4
2.7
4.0
1.9
5.1
2.7
1.0
SE
3.0
2.8
2.6
6.3
29.0
410.0
0.4
7.7
145.0
27.8
23.8
48.5
0.0
0.0
Mean
5.1
0.3
0.3
0.3
0.4
2.5
20.0
0.0
0.1
2.5
3.1
4.1
7.3
0.0
0.0
SE
2.9
1.8
3.0
10.5
11.5
267.5
0.4
8.1
472.5
12.5
17.9
69.6
0.0
0.0
Mean
5.2
0.9
0.5
1.1
1.3
2.4
27.7
0.1
0.1
98.4
3.3
7.0
10.3
0.0
0.0
SE
0.8
2.5
6.4
6.2
5.8
254.3
1.2
8.5
114.3
8.3
9.1
82.6
13.3
10.8
Mean
6.1
0.2
0.5
0.8
0.6
0.8
15.5
0.2
0.1
23.9
0.9
1.2
1.9
2.3
2.2
SE
1.3
3.8
7.4
3.2
7.5
165.0
1.2
8.7
196.0
9.5
17.3
73.3
6.6
2.5
Mean
6.2
0.5
1.4
2.0
1.1
2.4
37.3
0.6
0.2
54.1
3.5
6.1
9.6
6.2
2.3
SE
0.4
2.2
3.1
4.8
9.4
245.7
0.9
8.6
69.0
7.7
6.5
85.7
9.4
4.5
Mean
7
0.1
0.6
0.5
0.4
1.9
22.8
0.1
0.2
14.7
1.4
0.9
2.0
2.3
1.4
SE
0.4
0.6
2.8
5.9
10.7
222.2
0.7
7.8
37.3
11.8
9.1
79.1
2.9
1.8
Mean
8
0.1
0.2
0.6
0.9
2.3
29.3
0.2
0.3
10.2
4.2
2.2
6.3
2.3
1.4
SE
Pilbara riparian flora and plant communities
501
502
Data analysis
Species presence/absence data were compiled
for sites by combining seasonal samples. Site
resemblance matrices were generated using
the Bray-Curtis similarity measure in Primer
(Primer-E Ltd 2008). The influence of singleton
species (species with a single site occurrence) was
assessed by comparing resemblance matrices,
including and excluding singletons, using Primer’s
RELATE routine (999 permutations). Analysis of
similarity (anosim) routines (Clarke and Green,
1998) were used to examine the significance of
relationships between the floristic composition
of sites with a priori wetland types, IBRA subregion, permanence, riverine versus lacustrine
waterbodies, and catchment basin occurrence.
For interpretation, categorical variables were
overlain on non-metric multidimensional scaling
ordinations of sites (nMDS, 50 starts; Primer-E Ltd.
2008). Two-dimensional ordinations were used as
they showed similar stress to 3D outputs.
The BEST/BIOENV procedure in PRIMER
was used to explore the relationship between
site compositional similarity and environmental
attributes. This module uses Spearman’s rank–
order correlation to match distances in a site
association matrix to Euclidean distances among
each of its environmental attributes. Continuous
variables used in the analysis included chemical
and textural attributes of the soil, BIOCLIM climatic
variables, distance to coast and altitude. Categorical
variables included ordinal permanence class,
Strahler stream order and the two-state categorical
variable riverine/non riverine. For pairs of variables
that were highly intercorrelated (P > 0.9), a single
variable was retained. In the final data set, distance
to coast was retained in preference to annual range
of temperature, and percentage clay was retained
in preference to percentage sand. Highly skewed
variables were log-transformed and the resulting
variable matrix normalised.
Some sites were excluded from the analysis
of environmental correlates. Soil data were not
available for PSW004B, and PSW003A was an
extreme compositional outlier. Six saline sites
sampling the Fortescue Marsh and Weelarana Salt
Lake were also excluded from the BEST/BIOENV
procedure since they were compositionally and
environmentally very distinct from the remainder
of the data set.
Site and species classification
The data matrix of species presence/absence
at sites (excluding singletons) was re-ordered
to produce a two-way table for interpretation
(Appendix 1) (Belbin 1995) by using the program
M.N. Lyons
PATN (v3.12) to classify sites according to
similarities in their species composition (BrayCurtis measure of dissimilarity), and species
according to their co-occurrence at sites (the twostep algorithm, Belbin 1980). Both classifications
used the flexible UPGMA (unweighted pair-group
mean average) sorting strategy with the beta
value set to -0.1 (Belbin 1995; Sneath and Sokal
1973). Indicator species showing high fidelity and/
or specificity to site groups were identified using
the ‘Indicspecies package’ in the R statistical
computing language (De Caceres and Legendre
2009, R development core team 2009). Monte Carlo
randomisation was used to test the significance
of taxa indicative of both individual and multiple
groups of sites (P <0.05).
RESULTS
Sampling adequacy
Sites included a range of species richness scores
(12–52 taxa) and wetland types. Comparison of
the observed richness for each site and estimators
of total richness (Figure 2 – four examples shown)
revealed that the quadrat design employed had
captured, on average, 89% (79%–100%) of the total
richness in the sites (ICE estimator, see Colwell,
2009).
Riparian plant diversity
A total of 455 taxa was identified from the 98
wetlands and rivers sampled during the survey
(Table 1, Appendix 2). These taxa were distributed
among 62 families and 202 genera. Dominant plant
families were Poaceae (18.5% of taxa), Fabaceae
(11.4%), Asteraceae (10.8%), and Cyperaceae (8.1%).
Dominant genera included Acacia (4.4%), Eragrostis
(2.9%), Cyperus (2.9%), Ptilotus (2.0%), Eriachne (2.0%)
and Fimbristylis (2.0%).
The taxa represent approximately 25% of the
known flora of the Pilbara bioregion (S. Dillon
unpublished data), and are dominated by species
that occur elsewhere in the Eremaean (398 taxa)
and Northern (295 taxa) Botanical Provinces (after
Beard 1990). Pilbara populations of twenty taxa (e.g.
Atalaya hemiglauca, Lobelia arnhemiaca and Terminalia
canescens) occur in the Pilbara as populations
disjunct from the Kimberley. A group of 143 taxa
extend into the South-West Botanical Province.
Of these, the majority occur at the periphery of
this province, i.e. within the Avon-Wheatbelt (105
taxa) and Geraldton Sandplains (also 105 taxa)
bioregions.
Of those taxa with more restricted distributions
(known from six or fewer IBRA regions—88 taxa),
only the cosmopolitan Pteris vittata occurs in the
Pilbara riparian flora and plant communities
Figure 2
503
Expected species richness accumulation curves based on the Mao Tau function for four sites with a range of
total observed richness. Error bars equal one standard deviation.
temperate south-west of Western Australia. Taxa
known from four or fewer bioregions (64 taxa)
largely extend into adjacent bioregions. Of these,
the Carnarvon (29 taxa) and Gascoyne (29 taxa)
share a greater number of taxa with the Pilbara
than Dampierland (10 taxa) and the Murchison
(nine taxa), with a small component occurring in
the adjacent Great Sandy Desert (seven taxa) and
Little Sandy Desert (nine taxa) bioregions.
Naturalised taxa represented 6.6 % of the flora,
noting that the weed status of some species (e.g.
Flaveria trimera) remains contentious (see Keighery
2010). The most frequently recorded weeds included
Cenchrus ciliaris (46% of sites), Cynodon dactylon
(22%), and Cenchrus setiger (17%). Notable weed
records included Conyza parva collected from
Chinaman Spring (PSW060), on the northern edge
of the study area, a major range extension from
near-coastal areas of south-west Western Australia.
Previously known anecdotally (Keighery 2010),
Gnaphalium polycaulon is confirmed as occurring
in the Pilbara, with a record from Coondiner Pool
(PSW001).
Sixteen taxa on the Department of Parks
and Wildlife’s Priority Flora List (Smith 2013)
were recorded (see Appendix 2). A number are
associated with wetlands within and bordering the
Fortescue Marsh Land System as defined by Van
Vreeswyk et al. (2004). Both Helichrysum oligochaetum
and Rhodanthe ascendens were recorded from
Koondepindawarrina Pool (PSW005). Tecticornia
medusa and T. globulifera, formerly known only
from the Fortescue Marsh, were also recorded from
Weelaranna Salt Lake (PSW043). Eleocharis papillosa,
previously known from scattered localities across
central Australia and near Onslow at the edge of
the Pilbara, was recorded from two sites on the
Fortescue Marsh (PSW002, PSW003). The new
record of Myriocephalus scalpellus from near Onslow
(PSW073) represents the only known population
other than the type locality at Coondiner Pool
(PSW001). Eremophila spongiocarpa, endemic in the
Pilbara and restricted to the Fortescue Marsh, was
recorded within its known range (PSW003). Other
notable priority taxa include Cladium procerum
which occurs in the Pilbara as a major outlier from
populations in eastern Australia. Known from
both Millstream and Karijini National Park, it was
recorded at a known locality (at PSW006). Also
recorded from a known population at Fortescue
Falls, Adiantum capillus-veneris has a scattering of
localised populations across much of Australia.
Eragrostis surreyana is endemic in the Pilbara IBRA
region, and was recorded from a known population
on the Burrup Peninsula. Although not listed as
priority taxa, the Pilbara endemics Bergia perennis
subsp. perennis, Eriachne tenuiculmis, Sida arsiniata
and Stemodia kingii were also recorded during the
survey.
504
Major range extensions
The grasses Imperata cylindrica and Pseudoraphis
spinescens have distributions that extend from
the Kimberley region across northern Australia
and down the eastern Australian coast to South
Australia, with numerous inland occurrences.
Not previously known from the Pilbara, Imperata
cylindrica occurred at three sites: Fortescue Falls
(PSW006), Palm Spring on Cave Creek (PSW009)
and Millstream Delta (PSW011). Prior to the current
survey, the only Pilbara record of Pseudoraphis
spinescens was a collection by A. Forrest on the
Fortescue River in 1878 (Mueller 1881a, 1881b).
During the survey it was collected at four sites:
Moreton Pool (PSW030), Munreemya Billabong
(PSW036), Curara Claypan (PSW072), and West
Peawah Creek Pool (PSW079). Nymphoides indica,
recorded at De Grey claypan (PSW035), is the first
collection for the Pilbara bioregion. Its known
distribution includes much of the world’s tropics
and extends from the Kimberley across the north
and down the east coast of Australia.
Species frequency and richness
Of the 450 taxa analysed, two-thirds (66.4%)
occurred at fewer than five sites (see Appendix
1), and one-third (33.2%) occurred at a single
site (Appendix 3). Three taxa, Cyperus vaginatus
(perennial sedge), Eragrostis tenellula (annual grass)
and Centipeda minima (annual herb), occurred
at more than half the sites. Species richness
ranged from three (PSW032) to 87 taxa per site
(PSW085) and averaged 26.3 ± 1.4. Richness showed
significant differences between wetland types
(Kruskal-Wallace 1-way ANOVA, P < 0.005), with
gorge creeks (20.0 ± 2), springs (18.3 ± 1.4) and salt
marshes (14.5 ± 3.5), showing the lowest richness.
Gorge creeks were characterised by massive rock
and provided limited habitats for annual taxa,
instead being dominated by dense perennial sedges
and shrubs in soil pockets that are perennially
moist. Springs were commonly dominated by dense
patches of perennial sedges (typically Cyperus
vaginatus), often interspersed with bare areas of
calcrete. Salt marsh sites had a limited suite of
halophytic taxa.
Rock pools (42.5 ± 2.5), clay flats (41.0 ± 6),
clay pans (29.7 ± 3.2) and ephemeral creeks (28.7
± 4.4) had the highest mean richness with rich
assemblages of herbs and annual and perennial
grasses.
Richness also showed significant differences
between inferred permanence classes (KruskalWallace 1-way ANOVA, P < 0.005). Ephemeral sites
had the highest mean species richness (39.2 ± 3.6)
M.N. Lyons
and permanent sites the lowest (20.8 ± 2.4). This is
related largely to the relative proportion of different
wetland types within each class. Ephemeral sites
included a number of rock pools (PSW071A,
PSW080A) with herb-rich aprons, and claypans
and clay flats with rich assemblages of annual taxa.
Permanent sites included river pools (15 sites), gorge
creeks and the majority of species-poor springs (13
of 15). Seasonal and near-permanent sites showed
little difference in richness and were dominated by
river pools. Little difference in richness was evident
for riverine sites in relation to Strahler stream order;
with only order-one versus order-three showing
significant pairwise differences (P < 0.05).
Richness of rare taxa, including singletons and
species occurring at fewer than six sites, was
examined for geographic patterns (Figure 3).
Concentration of rare taxa was evident within
the Fortescue Marsh and on the periphery of
the study area at a small number of sites which
included Weelarrana Salt Marsh (PSW043B),
claypans, granite rocks and a single seasonal creek
(PSW085) at the southern edge of the region. Some
concentration of rare taxa along the northern edge
of the Hamersley IBRA subregion is associated
with rarely recorded taxa from the gorges and
upland ephemeral creeks of the Hamersley Range.
Notably, few singleton and rare taxa were observed
in the Chichester IBRA subregion (Figure 3). High
numbers of rare taxa were associated with both
wetland-type and water permanence. Overall,
ephemeral and seasonal wetland types such as salt
marshes, rock pools and claypans showed highest
numbers of rare taxa, and their non-uniform
distribution across the study area explains much of
the observed geographical patterning.
Site classification
Comparison of the full and reduced (singletons
excluded) species presence/absence matrices
revealed that the two were highly correlated (Rho
= 0.99, p < 0.001). In preference, the reduced matrix
was used.
The primary division in the classification
largely separated non-turbid riverine sites from
predominantly non-riverine wetlands and turbid
riverine sites with fine-textured soils. Within the
last major group, the small number of saline sites
formed a distinct group at the next division in the
classification. The site classification was ultimately
examined at the 8-group level (Figure 4). The tengroup classification and a priori wetland types
overlain on 2D nMDS ordinations (Figure 5 A
and B), revealed a strong correspondence between
floristic groupings and wetland type.
Pilbara riparian flora and plant communities
Figure 3
505
Number of rare taxa (single site record) or uncommon taxa (≤ 5 site records) recorded per site, with
symbol-size proportional to richness. (A) Richness within sites containing rare taxa (maximum 15 taxa).
(B) Richness within sites containing rare taxa as a proportion of total site richness (maximum 0.27).
(C) Richness within sites containing uncommon taxa (maximum 31). (D) Richness within sites containing
uncommon taxa as a proportion of total site richness (0.87). Sites with no rare taxa are solid dots.
Dissimilarity
Large claypans
& turbid creek
pools with
broad margins
Claypans, clay
flats, rock pools
and riverine
sites with fine
textured soils
1
2
3
4
5.1
Salt marshes
5.2
Springs &
river pools 6.1
with high
water
6.2
permanence
River
pools &
creeks
7
8
0.86
Figure 4
1.13
1.40
Classification of 103 survey sites (UPGMA) based on species presence/absence. Classification is shown at
the eight group level with descriptions summarising divisions in the classification.
506
Plate 4
M.N. Lyons
Large seasonal/episodic claypan on Mulga Downs Station (site PSW040A). Stands of Acacia stenophylla
occur across the inundated bed and within the riparian zone.
Large claypans and turbid linear pools with broad margins
Group 1. A group of five claypan sites at four
wetlands including large claypans and a single
linear turbid claypan (Coondiner Pool), all typified
by very broad, low-gradient margins. Structural
dominants within the group included scattered
Eucalyptus victrix over Eriachne benthamii with
Marsilea spp. forming dense swards. Significant
i nd icator spe c ie s i nc lude d Sch o e no plectus
laevis, Elytrophorus spicatus, Eriocaulon cinereum,
Nymphoides indica, Glossostigma diandrum and Rotala
diandra. Sites sampled showed a high percentage of
clay content (26.9 ± 4.1) and the lowest EC (5.8 ± 1.1)
and pH (6.8 ± 1.1) of all site groups. These sites, with
fine-textured soils, also had high total phosphorus
(388.0 ± 131.9 mg/kg). The few wetlands in the
group were scattered from the north-west coastal
margin to the inland eastern edge of the study area
and had the lowest species richness of groups 1–4
(13.8 taxa per site).
Group 2. A group of five sites at four wetlands
including three claypans and the margin of a linear,
turbid pool. This group also featured Eucalyptus
victrix as a structural dominant over a relatively
species-rich herb layer. Significant indicator species
included Sporobolus mitchellii, Bergia trimera, B.
perennis, Myriocephalus oldfieldii, M. rudallii and
Muehlenbeckia florulenta. The sites showed similar
soil chemistry attributes to group 1 (Table 2).
Claypans, clay flats, rock pools, and riverine sites with
fine-textured soils
Group 3. A large group of 23 sites with the
highest species richness of all site groups (41.8
taxa per site). Sites sampled the riparian zones
of linear turbid creeks, river pools, ephemeral
creeks, claypans and clay flats (Table 1). Although
including a number of wetland morphologies,
sites within the group shared fine-textured soils in
both riverine and non-riverine settings (mean silt
10.8 ± 1.5 % and clay 17.7± 2.7%). Seventeen sites
Pilbara riparian flora and plant communities
included Eucalyptus victrix or E. camaldulensis subsp.
refulgens as overstorey trees within the riparian
zone. Analysis revealed a single taxon, Fimbristylis
littoralis, as the significant indicator species for the
group. The group shared a number of taxa with
group 4 (see below) with Fimbristylis microcarya,
Wahlenbergia tumidifructa, Lipocarpha microcephala,
Oldenlandia galioides and Drosera indica being
significant indicator species for both site groups
taken together.
Group 4. A group of seven sites on the margins
of claypans and the aprons of rock pools. As a
group, the sites were close to the coast relative
to all other groups (119.4 ± 47.7 km). Claypans
in the group were small, highly ephemeral, and
occurred within Triodia-dominated flats and dune
systems. The edges of pans were low sandy rises
with a narrow band of annual taxa recruiting after
rainfall and wetland-filling. The group showed
similarly high species richness to group 3 (39.4 taxa
per site). Sixteen herbs and annual grasses were
significant indicator species for the group with
Synaptantha tillaeacea var. tillaeacea, Eriachne aristidea,
Bulbostylis barbata, Calandrinia ptychosperma, Cyperus
pulchellus and Gomphrena leptoclada subsp. leptoclada
significant at P < 0.05.
507
Springs and river pools with high water permanence
Group 6.1. A subgroup of 23 sites from river
pools and 11 of the 15 springs sampled. Sites
had a mean species richness of 18.4 taxa, the
significant indicator species being Schoenoplectus
subulatus and Fimbristylis sieberiana. Structural
dominants included Melaleuca argentea, Eucalyptus
camaldulensis subsp. refulgens, Acacia ampliceps,
Typha domingensis and Cyperus vaginatus. The group
also included all the sampled springs and gorges
within Karijini and Millstream National Parks.
The group had the highest mean permanence score
(3.7) of all site groups. This was coupled with the
highest mean annual rainfall (318.6 mm/yr). The
soils of the sites contained the highest percentage
gravel (all fractions) and were otherwise typically
sandy. Exchangeable calcium was the highest of
all groups (6.2 me%) and is likely to reflect the
contribution of calcium-rich groundwater to the
riparian zone substrate.
Salt marshes
Group 5.1. A subgroup of two sites within
t he upper f ri nge of t he Fortescue Marsh,
characterised by a group of salt-tolerant indicator
species including Cressa australis, Muellerolimon
salicorniaceum, Cyperus bulbosus and Eleocharis
papillosa. The sites showed high EC (145 ± 2.5) and
phosphorus (total P, 410 ± 20) and high clay content
(27.8 ± 3.1). The current survey, however, did not
attempt to capture the full floristic variation evident
within and bordering the Fortescue Marsh. These
two sites sample an extensive zone within the
Fortescue Marsh that is dominated structurally by
Muellerolimon salicorniaceum.
Group 5.2. A subgroup comprising four sites
at two wetlands, sampling the edges of the main
basins of the Fortescue Marsh and Weelarrana Salt
Lake. They were characterised by low shrublands
dominated by Tecticornia spp. Significant indicator
species for the subgroup included Tecticornia
halocnemoides sens. lat., T. indica, T. medusa, T.
globulifera and Triglochin hexagona. The sites showed
the highest soil EC (472.5 ± 98.4) of all groups, and
high total P (267.5 ±27.7 mg/kg). Species richness
was low with 10 taxa per site. The sites are likely to
experience significant periods of inundation during
major flooding events.
Plate 5
Areas of bedrock and calcrete dominate the
margins of Palm Spring (site PSW013A).
Melaleuca glomerata, juvenile Livistona alfredii
(Millstream fan-palm) and sedges occur in
the shallow soil pockets along the spring-fed
creek (M.N. Lyons).
508
M.N. Lyons
Group 6.2. A subgroup of four species-poor sites
(9.8 taxa per site) comprising two river pools and
two small springs. Structural dominants included
Acacia ampliceps and Cyperus vaginatus. Sites showed
significant cattle disturbance or flood damage,
which probably accounted for their low species
richness scores. Stylobasium spathulatum and the
naturalised taxon Bidens bipinnata were significant
indicator species for the group.
River pools and creeks
Group 7. A group of 21 riverine sites including
15 clear river pools, four ephemeral creeks and
two springs. The group shows compositional
similarities to subgroup 6.1 yet showed higher
mean species richness (26.9 cf. 18.4 taxa per site).
The group had a mean permanence score of 3.1 (cf.
3.7 for group 6.1), reflecting the small number of
springs and inclusion of ephemeral creeks within
the group. Indicator species analysis did not reveal
any taxon to be individually significant for the
Plate 6
group. Eucalyptus camaldulensis subsp. refulgens and
Cyperus vaginatus are structural dominants. The
separation of groups 6.1 and 7 is due largely to the
very low frequency of taxa dependent on high/
permanent moisture, such as Melaleuca argentea,
Schoenoplectus subulatus and Typha domingensis
within group 7, and the presence of a group of
widespread annual taxa including Eragrostis
tenellula, Wahlenbergia tumidifructa, and Centipeda
minima that are largely absent from group 6.1. Soil
texture attributes of groups 6.1 and 7 were very
similar (Table 2).
Group 8. A group of nine sites on permanent and
near-permanent higher-order river pools structurally
dominated by Melaleuca argentea, Eucalyptus
camaldulensis subsp. refulgens, Cyperus vaginatus and
Cynodon dactylon. Average species richness was
lower than the other group dominated by river pools
(19.9 taxa per site, cf. 26.9 in group 7). Soils within the
group were more finely textured than groups 6.1 and
7, with lower gravel fractions (Table 2).
Pool in ephemeral creek (site PSW062A) at the base of the Gregory Range. The riparian zone is dominated
by Eucalyptus victrix and Cyperus vaginatus, with Schoenoplectus subulatus in the waterbody (N. Gibson).
Pilbara riparian flora and plant communities
Figure 5
509
Two dimensional. non-metric multi-dimensional scaling ordination (2D nMDS) of 103 sites based on
presence / absence of plant species overlain with (A) floristic groups and (B) a priori wetland types. Also,
2D nMDS ordination excluding salt marshes (floristic subgroups 5.1 and 5.2) with sites coded (C) as
riverine/non-riverine and (D) according to permanence class (1, ephemeral; 2, seasonal episodic; 3, near
permanent; 4, permanent).
Environmental variables and floristic
composition
Significant compositional differences were
observed for riverine versus non-riverine sites
(Figure 5C) (Rho = 0.525), and permanence class
(Figure 5D) (Rho = 0.383). Within riverine sites,
excluding the very small number of ephemeral
sites, permanent sites were compositionally
different from seasonal and near-permanent sites
(Rho = 0.25), although there was no significant
difference between stream orders (Rho = 0.022).
Geographic patterns were examined by testing
compositional differences against IBRA subregions
and major drainage basins. IBRA sub-regions
showed only moderate compositional differences
(Rho = 0.241), with pairwise differences between
both the Fortescue and Roebourne Plain against
all other sub-regions accounting for the bulk of
the patterning. Little support for compositional
differences between drainage basins was observed
(Rho = 0.073).
The BEST procedure revealed that a combination
of five variables [riverine/non-riverine, DisCoast,
clay%, EC (1:5), pH] provided the highest rank
correlation with the site dissimilarity matrix
(Spearman’s rho = 0.53, P < 0.01). The inclusion
of the categorical variable riverine/non-riverine
confirms the major compositional separation of
these two major wetland classes. The soil variables
relate to a number of compositional gradients. High
clay content corresponds to the separation of clear
riverine sites with relatively coarse sediments, from
claypans and turbid riverine sites typified by finely
textured soils. The latter were compositionally
distinct with relatively rich assemblages of annual
taxa. The inclusion of soil electrical conductivity and
pH also correlates with the compositional separation
of riverine and non-riverine sites. The inclusion of
DisCoast reflects the greater occurrence of a number
of compositionally distinct groups along the subdued
landscapes of the coastal plains of the study area,
including claypans and turbid creek pools.
510
M.N. Lyons
DISCUSSION
Flora and diversity
Prior to the current study, the only regional
survey of the Pilbara riparian flora was undertaken
by Masini (1998) and Masini and Walker (1989) as
two separate studies sampling subsections of the
region. Although interrupted by cyclonic activity
and subsequent sampling late in the dry season,
the authors recorded ca. 300 taxa. Many localised
surveys assessing impacts of proposed mining
developments have also been completed (e.g. Biota
Environmental Sciences, 2012). Other studies have
been undertaken to assess the impacts on Pilbara
wetlands of water abstraction and mine dewatering
and its disposal (e.g. Johnson and Wright, 2001;
Braimbridge et al. 2010). The only other regionalscale wetland floristic survey undertaken in
Western Australia’s arid zone was completed by
Gibson et al. (2000), in the southern half of the
Carnarvon Basin bioregion to the south of the
Pilbara. They recorded 263 taxa from 57 wetlands
(albeit with smaller quadrat size) representing
ca.12% of the region’s flora (Keighery et al. 2000).
Gibson et al. (2000) observed that the wetland flora
of the southern Carnarvon Basin, while dominated
by taxa of the arid zone (Eremaean), had affinities
with both temperate and tropical floras. In part,
this is true of the Pilbara, although the temperate
component of the flora is smaller and largely
composed of very widespread taxa rather than those
with temperate distributions for which the Pilbara
is their northern range limit. The Pilbara riparian
flora also includes a larger component of the
tropical flora, from both the rocky landscapes of the
northern Kimberley and the more topographically
subdued central Kimberley, Ord–Victoria Plain and
Victoria–Bonaparte bioregions. A subset of these
does not occur elsewhere in the Eremaean areas of
Western Australia (e.g. Atalaya hemiglauca). Notable
elements of the tropical riparian flora are also near
their southern limit in the Pilbara (e.g. Melaleuca
argentea and Sesbania formosa).
While sharing broadly similar climates (Leighton,
2004; Wyrwoll et al. 2000), the strong affinities of
the Pilbara flora with the adjoining Carnarvon and
Gascoyne bioregions are also attributable to the
regions possessing a similar suite of wetland types.
All share a combination of riverine and non-riverine
water bodies that represent similar hydrological
settings. Indeed some of the major structural
dominants in riverine riparian zones are common
to the three regions (e.g. Eucalyptus camaldulensis
subsp. refulgens and Acacia coriacea subsp. pendens).
In contrast, the sandy deserts to the east and northeast of the Pilbara are characterised by internal
drainage with few major riverine habitats. Where
these occur they are commonly broad, sometimes
saline, drainage lines flowing into basins, or
highly ephemeral creek systems arising in isolated
ranges. The saline coastal areas of the Pilbara and
the Fortescue Marsh share taxa with these desert
systems (e.g. Tecticornia auriculata). The deserts, like
the Pilbara, contain a suite of claypans and clay flats
that are episodically inundated and elements of
their flora are shared.
The proportion of uncommon taxa recorded
for the Pilbara—singletons (33.2%) and those
from fewer than five sites (66.4%)—is of similar
magnitude to other similar studies. Gibson et al.
(2000) recorded that 55% of taxa occurred at a single
site (singletons) in the southern Carnarvon Basin.
A more comprehensive survey of temperate zone
wetlands in Western Australia showed very similar
proportions (31% and 59.3% respectively) to the
current study (Lyons et al. 2004). The occurrence of
this uncommon component of the flora (at similar
levels) is also a consistent feature of quadrat-based
floristic surveys carried out across the wider
Western Australian landscape (Gibson et al. 2004;
Keighery et al. 2000; Lyons et al. 2014), and poses
problems for designing reserve systems that aim to
capture major floristic communities.
Species richness of sites was related to both
the a priori wetland types and the site groups
derived from the classification based on floristic
composition. Maximum richness occurred in less
permanent wetlands, with concomitant higher
richness in non-riverine sites. A similar pattern
was observed for the proportion of uncommon taxa
across the range of wetland types. Coarsely textured
soils that limit moisture retention, as well as major
disturbance associated with the high energy/
volume flows following flood events, are likely to
limit the suite of taxa that can persist along many
riverine riparian zones in the Pilbara. The plant
communities of these larger riverine sites are often
simple, with groundwater-dependent overstorey
trees (Melaleuca argentea, Eucalyptus camaldulensis
subsp. refulgens) (O’Grady 2006) and simple
understoreys of shrubs, rhizomatous grasses and
sedges that are more resistant to flood waters (e.g.
Melaleuca linophylla, Cyperus vaginatus). In contrast,
more ephemeral sites, those with lower flow-energy
(e.g. turbid linear creeks), as well as claypans, clay
flats and rock pools, experience much-reduced
flood disturbance and their soils are more finely
textured. In many of these shallow wetlands, the
wet/dry ecotone is broad, providing habitats for
a larger range of taxa with differing responses to
wetting and drying (Brock and Casanova 1997). The
development of species-rich seed banks that persist
Pilbara riparian flora and plant communities
for long periods between fill events has also been
shown to contribute to the richness of these sites
(Brock et al. 2006).
The extensive aquifer systems of the Pilbara
(Waters and Rivers Commission 1996) discharge
groundwater to form permanently flowing creeks,
typically in rocky sites, or contribute flows to
permanent pools within river channels. Springs
form a group that is relatively poor in species (18.3
taxa per site) in the Pilbara, and are characterised by
taxa requiring permanently damp or wet soil that
physically dominated sites, e.g. Cyperus vaginatus,
Melaleuca argentea, Typha domingensis. Studies of
springs elsewhere in Australia confirm that springs
of the Pilbara are floristically distinct from the
remainder of the continent. In the Kimberley and
tropical Northern Territory, rainforest floristic
elements are a major component of spring floras
(Kenneally et al. 1991; Russell-Smith 1991). Detailed
studies of the springs of the Great Artesian Basin
(Fensham and Fairfax 2003; Fensham and Price
2004), while very different floristically from the
Pilbara, highlight the importance of springs in the
conservation of endemic and relictual taxa. In the
Pilbara, springs and spring-fed river pools and
associated gorge habitats provide important mesic
refugia for taxa such as Livistona alfredii, Stylidium
weeliwolli and Fimbristylis sieberiana, including major
distributional outliers such as Cladium procerum,
Phragmites karka, Imperata cylindrica and Adiantum
capillus-veneris. In arid Central Australia, permanent
water bodies, including springs and seepages, have
also been shown to be important refugia for relict
and endemic species (White et al. 2000; Brim Box et
al. 2008).
Floristic composition
Patterns in the floristic composition of Pilbara
wetla nds a nd r ivers cor respond to major
hydrological and substrate attributes of the sites.
These environmental differences are largely
embodied by the initial a priori site groups that
influenced the sampling design and are reflected in
the site groups I derived.
The vegetation of the Fortescue Marsh is
compositionally distinct from the remainder of the
site groups, even though sampling of the Marsh
was limited relative to its complexity and size.
While I did not sample tidal environments along
the Pilbara coast that are likely to share some taxa
with the Marsh (e.g. Tecticornia indica) it contains a
floristically unique element of the Pilbara wetland
flora.
Among the remaining rivers and wetlands a
major compositional separation is seen between
riverine and non-riverine (wetland) sites. Turbid
creek pools, while riverine, show clear floristic
511
similarities to claypans. Turbid sites are a feature
of creeks and smaller rivers in Pilbara lowlands.
Like claypans, they have fine soils, have generally
short hydroperiods and are not subject to major
flood flows. This is reflected in the analysis with
soil texture emerging as a significant term in the
BEST analysis. Masini (1988) also highlighted
the importance of sediment texture and water
permanence in structuring Pilbara wetland plant
communities, finding strong correspondence
between morphological/hydrological (subjective)
and floristic (objective) classification of sites.
Importantly, both the current study and that of
Masini (1988) are very site-specific. Dryland rivers
show considerable heterogeneity in terms of
channel morphology and sediment attributes along
their length, particularly where over-bank flows
fill secondary channels (Thoms et al. 2006). As a
consequence, even a small stretch of river (< 5 km)
may capture a number of floristic elements.
Biogeographic patterns in the riparian flora across
the Pilbara are explained by gross differences in
the distribution of major wetland types across its
four IBRA subregions. This is not surprising, given
that, relative to the broader landscape, riparian
zones are somewhat buffered from the dominant
climatic gradient that occurs from west to east
in the region, particularly in terms of moisture
availability (Leighton, 2004). In particular, at the
regional scale, spring sites are largely decoupled
from the prevailing climate. The topographically
subdued, largely depositional landscapes of the
Fortescue and Roebourne Plains IBRA sub-regions
show significant differences from the remaining
sub-regions.
Conclusions
The Pilbara riparian flora represents 25% of the
Pilbara flora, and is dominated by Eremaean and
tropical taxa, with strongest affinities to adjoining
externally draining bioregions.
Biogeographic patterning is limited, with
sub-regional differences being related to the
relative proportion of wetland types within each
subregion. Riverine sites, in particular, show
limited compositional difference across the region.
The Fortescue valley, coastal plains and other
lowland areas make important contributions to the
diversity of non-riverine wetlands. Claypans and
clay flats capture a large component of the Pilbara
wetland flora, and their scattered occurrence across
the lowlands of the region poses difficulties in
capturing their diversity in the reserve system.
Within the region, the Fortescue Marsh, along with
spring sites in Karijini and Millstream National
Parks, support unique elements of the Pilbara
riparian flora.
512
M.N. Lyons
ACKNOWLEDGEMENTS
I thank David Mickle for his unwavering
assistance and companionship in the field and
office. Field work was assisted by Neil Gibson,
Natalia Huang and Simon Lyons. Adrian Pinder led
the site selection with valuable initial input from
Peter Kendrick and Stephen van Leeuwen. Pilbara
DEC staff provided welcome accommodation and
delivered much-needed parts for broken field
equipment. Numerous pastoralists and indigenous
communities provided local knowledge, hospitality
and access to their lands. Adrian Pinder drafted
Figure 1. Steve Dillon provided his Pilbara species
list and Ben Richardson provided data on the
species IBRA occurrences. Lesley Gibson assisted
with indicator species analysis. Norm McKenzie
along with two anonymous referees provided
valuable comments on the draft manuscript.
REFERENCES
Anderson, M.J., Gorley, R.N. and Clarke, K.R. (2008).
Plymouth: Primer-E; 2008. PERMANOVA+ for
PRIMER: Guide to software and statistical methods.
Beard, J.S. (1990). Plant life of Western Australia. Kangaroo
Press: Kenthurst, Australia.
Belbin, L. (1980). TWOSTEP: A program incorporating
asymmetric comparisons that uses two steps to produce
a dissimilarity matrix. Technical Memorandum 80/9,
CSIRO Division of Land Use Research: Canberra,
Australia.
Belbin, L. (1995). PATN technical reference. CSIRO Division
of Wildlife and Ecology: Canberra, Australia.
Biota Environmental Sciences (2012). A vegetation and flora
survey of the Koodaideri study area. Unpublished report
prepared for Rio Tinto: Perth, Australia. (online:
http://www.epa.wa.gov.au/EIA/referralofProps c h e m e s / L i s t s / P ro p o s a l / A t t a c h m e n t s / 1 7 8 /
A p p e n d i x % 2 0 4 _ A % 2 0 Ve g e t a t i o n % 2 0 a n d % 2 0
Flora%20Survey.pdf)
Braimbridge, M., Antao, M. and Loomes, R. (2010).
Groundwater dependent ecosystems for Millstream:
ecological values and issues, Environmental water
report series, Report no. 13, Department of Water,
Government of Western Australia.
Brim Box, J., Duguid, A., Read, R.E., Kimber, R.G.,
Knapton, A., Davis, J. and Bowland, A.E. (2008).
Central Australian waterbodies: The importance of
permanence in a desert landscape. Journal of Arid
Environments 72: 1395–1413.
Brock, M., Capon S.J. and Porter, J.L. (2006). Disturbance
of plant communities of desert rivers (pp 100–132). In:
Kingsford, R. (ed.), Ecology of desert rivers. Cambridge
University Press: Cambridge, UK.
Brock, M. and Casanova, M.T. (1997). Plant life at the
edge of wetlands: ecological responses to wetting and
drying (pp. 181–192). In: Klomp, N. and Lunt, I. (eds),
Frontiers in ecology: Building the links. Elsevier Science:
Oxford, UK.
Clarke, K.R. and Green, R.H. (1988). Statistical design and
analysis for a ‘biological effects’ study. Marine Ecology
Progress Series 92: 205–219.
Colwell, R.K. (2009). EstimateS: Statistical estimation of
species richness and shared species from samples. Version
8.2. User's Guide and application, published at
http://purl.oclc.org/estimates
De Caceres, M. and Legendre, P. (2009). Associations
between species and groups of sites: indices and
statistical inference. Ecology 90: 3566–3574.
Fensham, R.J. and Fairfax, R.J. (2003). Spring wetlands
of the Great Artesian Basin, Queensland, Australia.
Wetlands Ecology and Management 11: 343–362.
Fensham, R.J., Fairfax, R.J. and Sharpe, P.R. (2004).
Spring wetlands in seasonally arid Queensland,
environmental relations, classification and
conservation values. Australian Journal of Botany 52:
583–595.
Geological Survey of Western Australia (1990). Geology
and mineral resources of Western Australia. Memoir
3. Western Australian Geological Survey: Perth,
Australia.
Gibson, N.G., Keighery, G.J. and Lyons, M.N. (2000). The
flora and vegetation of the seasonal and perennial
wetlands of the southern Carnarvon Basin, Western
Australia. Records of the Western Australian Museum,
Supplement 61: 175–216.
Gibson, N., Keighery, G.J., Lyons, M.N. and Webb, A.
(2004). Terrestrial flora and vegetation of the Western
Australian wheatbelt. Records of the Western Australian
Museum, Supplement 67: 139–189.
Houlder, D.J., Hutchinson, M.F., Nix, H.A. and McMahon,
J.P. (2000). ANUCLIM User Guide, Version 5.1. Centre
for Resource and Environmental Studies, Australian
National University: Canberra, Australia.
Johnson, S.L. and Wright, A.H. (2001). Central Pilbara
groundwater study. Hydrological Record Series, Report
HG 8. Waters and Rivers Commission: Perth,
Australia.
Keighery, G.J. (2010). The naturalised vascular plants of
the Pilbara region, Western Australia. Records of the
Western Australian Museum, Supplement 78: 299–311.
Keighery, G.J., Gibson, N., Lyons M.N. and Burbidge,
A.H. (2000). Flora and vegetation of the southern
Carnarvon Basin. Records of the Western Australian
Museum, Supplement 61: 77–154.
Kenneally, K.F., Keighery, G.J. and Hyland, B.P.M.
(1991). Floristics and phytogeography of Kimberley
rainforests (pp 91–131). In: McKenzie, N.L., Johnston,
R.B. and Kendrick, P.G. (eds), Kimberley rainforests of
Australia. Surrey Beatty and Sons: Chipping-Norton,
Australia.
Leighton, K.A. (2004). Climate (pp 19–38). In: van
Vreeswyk, A.M.E., Payne, A.L., Leighton, K.A. and
Hennig, P. (eds) (2004). An inventory and condition
survey of the Pilbara region, Western Australia. Technical
Bulletin No. 92. Western Australian Department of
Agriculture: Perth, Australia.
Lyons, M.N., Gibson, N., Keighery, G.J. and Lyons, S.D.
(2004). Wetland flora and vegetation of the Western
Australian wheatbelt. Records of the Western Australian
Museum, Supplement 67: 39–89.
Lyons, M.N., Keighery, G.J., Gibson, L.A. and Handasyde,
T. (2014). Flora and vegetation communities of
selected islands off the Kimberley coast of Western
Australia. Records of the Western Australian Museum,
Supplement 81: 205–243.
McKenzie, N.L., van Leeuwen, S. and Pinder, A.M. (2009).
Introduction to the Pilbara Biodiversity Survey,
Pilbara riparian flora and plant communities
2002–2007. Records of the Western Australian Museum,
Supplement 78: 3–89.
Masini, R.J. (1988). Inland waters of the Pilbara Western
Australia (Part 1), A report of a field study carried out in
March–April 1983. Technical Series 10, Environmental
Protection Authority Perth, Western Australia.
Masini, R.J. and Walker, B.A. (1989). Inland waters of the
Pilbara Western Australia (Part 2), A report of a field
study carried out in October–November 1984. Technical
Series 24, Environmental Protection Authority: Perth,
Western Australia.
Meissner, R., Owen, G. and Bayliss, B. (2009). Flora
and vegetation of the banded iron formation of the
Yilgarn Craton: Robinson Range and Mount Gould.
Conservation Science Western Australia 7: 363–376.
Mueller, F. (1881a). Plants of north-western Australia. Votes
and Proceedings of the Legislative Council during the
first session of 1881, no. 1. Government Printer: Perth,
Australia.
Mueller, F. (1881b). A catalogue of plants collected during
Mr. Alexander Forrest's geographical exploration of
North-west Australia in 1879. Journal and Proceedings
of the Royal Society of New South Wales 14: 81–95.
Pinder, A.M., Halse, S.A., Shiel, R.J. and McRae, J.M.
(2010). An arid zone awash with diversity: patterns in
the distribution of aquatic invertebrates in the Pilbara
region of Western Australia. Records of the Western
Australian Museum, Supplement 78: 205–246.
R Development Core Team (2009). R: A language and
environment for statistical computing. R Foundation for
Statistical Computing: Vienna, Austria.
Russell-Smith, J. (1991). Classification, species richness,
and environmental relations of monsoon rainforest
in northern Australia. Journal of Vegetation Science 2:
259–278.
Smith, M.G. (2013). Threatened and priority flora list for
Western Australia. Department of Parks and Wildlife:
Kensington, Western Australia.
Sneath, P.H.A. and Sokal, R.R. (1973). Numerical taxonomy:
the principles and practice of numerical classification.
513
Freeman: San Francisco, USA.
Strahler, A.N. (1952). Hypsometric (area-altitude) analysis
of erosional topography. Bulletin of the Geological
Society of America 63: 1117–1142.
Thackway, R. and Cresswell, I.D. (1995). An interim
biogeographic regionalisation of Australia. Australian
Nature Conservation Agency: Canberra, Australia.
Thoms, M.C., Beyer, P.J. and Rogers, K.H. (2006).
Variability, complexity, and diversity: the
geomorphology of river ecosystems in dryland regions
(pp 47–75). In: Kingsford, R.T. (ed), Ecology of desert
rivers. Cambridge University Press: Cambridge, UK.
van Vreeswyk, A.M.E., Payne, A.L., Leighton, K.A. and
Hennig, P. (eds) (2004). An inventory and condition
survey of the Pilbara region, Western Australia. Technical
Bulletin No. 92. Western Australian Department of
Agriculture: Perth, Australia.
Walshe, T.V., Halse, S.A., McKenzie N.L. and Gibson, N.
(2004). Towards identification of an efficient set of
natural diversity recovery catchments in the Western
Australian Wheatbelt. Records of the Western Australian
Museum, Supplement 67: 365–384.
Waters and Rivers Commission (1996). Pilbara region water
resources: review and development plan, summary report 4.
Western Australian Waters and Rivers Commission:
Perth, Australia.
White, M., Albrecht, A., Duguid, A., Latz, A., Hamilton,
M., Latz, P. and White, M. (2000). Plant species and sites
of botanical significance in the southern bioregions of the
Northern Territory; vol. 1: Significant vascular plants.
Report to the Australian Heritage Commission from
the Arid Lands Environment Centre, and the Parks
and Wildlife Commission of the Northern Territory:
Alice Springs, Australia.
Wyrwoll, K.-H., Courtney, J. and Sandercock, P. (2000).
The climatic environment of the Carnarvon Basin,
Western Australia. Records of the Western Australian
Museum, Supplement 61: 13–27.
APPENDIX 1 [ELECTRONIC]
Site by species data matrix, reordered according to their site and species classifications. The floristic
groups are indicated. Taxa recorded from one site are excluded (see Electronic Appendix 3).
APPENDIX 2 [ELECTRONIC]
List of taxa recorded from 103 sites sampled during the survey (superscript 1 denotes pairs of
infraspecific taxa analysed at specific rank, superscript 2 denotes closely related taxa that could
not be reliably discriminated and were amalgamated for analysis). Numbers following taxa are
Department of Parks and Wildlife priority flora codes (see Smith 2013).
APPENDIX 3 [ELECTRONIC]
Site by singletons species data matrix.
See CD inside the back cover or visit
http//www.museum.wa.gov.au/research/records-supplement/attachments


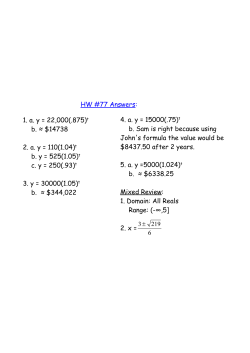
© Copyright 2026