
The food and feeding relationships of the fishes of Singapore straits
COLO
IAL OFFJCE
FISHERY PUBLICATIONS:
Vol. I, No.1, 1950
THE FOOD
AN D
FEED ING
RELATIONSHIPS
OF
•
•
•
•
By
•
•
THAM AH KOW B.Sc. (London)
Research Officer, Department of Fisheries,
Federation of Malaya and Singapore
•
•
•
•
PERPUSTAKAAN
NEGARAMALAYSI
A
•
•
•
J'B 1276
81704 5 /
LONDON:
HIS MAJESTY'S STATIONERY OFFICE
1950
•
•
•
-1 SEP 1995
•
•
•
•
.C ONTENTS
Page
SECTION I. INTROD UC TIO
II.
MATERIALS A
•
•
•
D METHODS
•
•
•
•
•
1
.
•
•
•
•
I
•
ITT.
PHYSICAL , CHEMICAL AND BIOLOGICAL
CHARACT E RISTICS OF THE HABrTAT
•
•
•
•
•
•
•
A.
Meteorology
•
•
•
•
•
•
•
3
B.
Water Temperature
•
•
••
•
•
•
..
3
C.
Salinjty
•
•
•
•
•
•
•
4
•
•
•
•
•
•
•
6
•
•
•
•
•
•
•
8
•
•
•
•
•
•
•
•
•
•
•
•
•
•
•
•
•
•
•
•
•
D. Phytoplankton
E. Zooplankton
•
F.
•
Nekton
•
.(a) Acetes spp .
(b) Kelong Catches
•
•
. 1 V.
•
DETAILS OF OBSERVA nONS OF FOOD AND
FEEDING OF FISHES.
.
•
•
•
•
FEEDING RELATIONSH[PS
•
V.
VI.
VII.
,
•
•
SEASONAL VARIATION IN FOOD .-
9
9
9
10
•
•
•
•
22
•
•
•
22
AVAILABILITY OF FOOD ORGANISMS TN
RELATION TO THE LEVEL OF UTILISA nON
•
26
•
PERPUSTAKAAN
NEGARAMALAYSI
A
v III.
FEEDING I
lX.
SUMMARY
,
TENSITY .
•
•
•
•
•
•
31
•
•
•
•
•
•
32
ACKNOWLEDGEMENTS
•
•
•
•
•
•
32
REFERENCES.
•
•
•
•
•
•
•
•
33
APPENDIX
•
•
•
•
•
•
•
•
33
•
•
•
•
•
•
•
•
•
•
•
,
•
•
•
•
•
•
•
•
SECTION I
INTRODUCTION
Malaya, are included with his kind permission.
Whilst the food of many fishes found in
temperate countries has been very thoroughly
investigated, that of the species found in
Malayan Seas has not, to the knowledge of the
writer, been investigated by anyone with the
exception of Malpas (1926) who recorded the
food fOi-lOd in the stomachs of fishes trawled
around Ceylon. The fishes studied by Malpas
were all large specimens or adult specimens of
small species, probably because few small
specimens could be taken by trawl nets. The
present study, however, concerns mainly small
specimens, but not necessarily the young, . of
similar or related species. The bulk of the
catches in the inshore zone consists of small
fishes, many of which are never large even when
full grown. Nevertheless, .they all playa very
important role j n the ecology of the inshore zone.
THE PRESENT PAPER is the result of a
general study of the food of the inshore fish
fauna of Singapore, collected at fortnightly
intervals throughout the year 1948, and is designed to contribute to the general picture of
their food and feeding relationships in the
habitat under consideration. In any study of
the food and feeding relationships of fishes it is
necessary to have a general knowledge of the
physical, chemical and biological characteristics
of the habitat and their variations throughout
the duration of the investigation in order to
facilitate the interpretation of the results.
Accordingly a simultaneous study of the phyical, chemical and biological characteristics of
the habitat has been carried out and the results
are included in this paper. 'Certain meteorological data supplied by Commander H. B.
Moorhead, Director of Meteorological Services,
MATERIALS & METHODS
-
-
THE MA TERrA L for this investigation was obtained from the catches of the two most common
types of fishing gear employed in the inshore
zone of Singapore. One is the common haul
eine which consists of a bag net with two long
wings of netting to each of which is attached a
long rattan lead. The net is operated from the
shore from half ebb to half flood tide. The
other is a fixed trap constructed by pushing
poles into the sea bed in such a way as to form
two eqclosures with a long lead. Rattan screens
are fixed to the submarine portions of the poles
to deter the fish from swimming out. A light
is used to attract the fish into the last enclosure
where they are hauled up at intervals during the
night by means of a lift net. A fun de cription
of this fishing gear, which is known as the
, kelong' in Malay, is given by LeMare and
Tham (1947).
Specimens were taken at fortnightly intervals
immediately after the catches were hauled up
and the body cavity was opened up at once and
the whole fish preserved in 10 per cent. formaldehyde solution. They were measured in the
laboratory, the recorded length being the distance between the tip of the snout and the least
height of the caudal peduncle, unless otherwise
stated. The stomachs were then cut open and
the stomach contents of all fish of the same
species were put into one petri dish and examined. Whilst it would have been more desirable to make a quantitative examination of the
-stomach contents in the same way as a plankton
sample, it was considered that since the number
of species invOlved was large the process would
have taken too much time. As this was only a
general investigation it was considered that the
time available would be more profitably spent in
procuring and examining samples at shorter
intervals throughout the year to find out if there
was any seasonal variation in their feeding
-habits. At the same time where certain organisms predominated in the food it was thought
necessary to have it so indicated in the data and
PERPUSTAKAAN
NEGARAMALAYSI
A
•
,
•
1
•
•
•
•
•
-
2
THE FOOD AND FEED!
so the food was classified as ' main' and' subsidiary'. As an example, if in the contents of
one group of stomachs, 10 Leptochela, 20 Calanids, 3 Ostracods, 2 Amphipods and one
Lamellibranch larva were found, Calanids and
Leptochela would be classified as the' main' food
and the rest as ' subsidiary' food. The intensity of feeding was reported in the following
way;E
' empty' when the stomach and pylorus were empty,
S - ' slight' when the stomach was not
d)stended and there was little food
in it,
M = 'medium' when the stomach was
•
slightly distended with food,
H
' heavy' when the stomach was fully
distended with food.
In the tables which follow, a ' plus' sign (+ )
entered against any group of organisms signifies
that it is the 'main' food. A zero sign (0)
signifies that it is the' subsidiary' food, whilst
a dash ( - ) signifies absence. When dashes are
entered against' ninge in length', 'number of
specimens examined' and' degree of feeding', it
signifies the absence of the fish under consideration in the samples taken.
In anyone month the number of samples
taken varied from one to three and the figures
entered under anyone month represented the
aggregate of all samples taken during that month,
whilst the degree of feeding entered is the highest
degree found during that month. A total of
2,346 specimens were examined.
This method of recording is undoubtedly
arbitrary, but considering the object of this investigation it is deemed sufficient. There is,
however, one drawback in using the catches of
the shore seine and indigen'ous fish trap (kelong)
for food studies. When the net is hauled in or
lifted, large species like Chirocentrus spp. and
Scomberomorus spp. and small species like
Stolephorus spp. get mixed together and in the
pandemonium that inevitably ensues just before
the net is lifted out of the water, it is probable
that the small Stolephorus are swallowed by the
•
G RELATIONSHI PS O F
larger species and are eventually recorded as
the food of the larger species. Where any
species had been found to feed on S tolephorus
and other small fishes, care was taken first to
examine the food to see if it showed signs of
digestion and, secondly, to procure the same
species by other methods of fishing, e.g., handlines, troll lines, drift nets, modified Danish
seine (known as Pukat Payang in Malay), etc.,
and to find out if Stolephorus and other small
fishes were still found in the food. In all cases,
however, it was found that fishes caught by other
methods in the same area feed on the same types
of food and in many cases the food of the
specimens examined during the course of this
investigation showed signs of digestion. It
should be stated here that ' Stolephorus larvre '
in this paper includes post larval stages and
small specimens up to 25 mm. in length.
When fish specimens were collected for food
studies water samples were also taken at a fixed
position in the same area, i.e., to the south of
Singapore, at a ' depth of three fathoms below
the surface at high water, full spring tide.
Temperature readings were taken and the salinity
of the water was determined by Knudsen's
method. Plankton samples were also collected
at the same time and position by pumping water
at different levels from the surface to one fathom
above the sea bed the interval between sampling levels being one fathom and passing the
water through a fine silk net (mesh equivalent to
o. 20 silk). Approximately the same amount
of water was pumped from each level. It was
thought that the more active organisms in the
plankton, e.g., Salps and Chaetognaths, etc.,
would evade being sucked up the hose of the
pump. In order to get a picture of the distribution of the larger members of the zooplankton a
surface tow was made between two fixed points
in the same area during slack tide. A net of
lndian muslin was used with the engine of the
launch at dead slow speed (about one to two
knots). Both these plankton samples were
pr~served in 10 per cent. formalin and a
rough quantitative study made in the laboratory
later.
PERPUSTAKAAN
NEGARAMALAYSI
A
I
•
•
,
•
•
•
•
•
3
THE FISHES OF SINGAPORE STRAITS
,
•
•
•
•
SECTION III
I
I
•
•
PHYSICAL, CHE ICAL AND BIOLOGICAL
CHARACTERISTICS OF THE HABITAT
TH E PHYSI CAL, chemical and biological characteristics of the habitat studied include (1) the
temperature of the water, (2) salinity, (3) the
phytoplankton, (4) the zooplankton and (5) the
nekton, and data for the year 1948 are presented
in this paper to show what relationships there
may be between these characteristics and the
food and feeding of the fish fauna.
As Singapore is situated in a region the
cllmate of which is characterised by monsoons,
it is considered essential to have a general knowledge of certain meteorological elements of the
region in which the habitat is situated to understand more fully the physical and chemical
changes in the water of Singapore Straits.
Notes on the meteorology of Singapore have
therefore been included in this section, together
with some data. on rainfall and wind force.
,
I
•
A.
METEOROLOGY
the south-west monsoon. For the year 1948
rainfall was abnormally high, especially in
January, causing widespread flooding in the
Malay Peninsula. It is probable that this abnormally high rainfall has influenced the marine
environment to a greater or lesser extent so that
the data under this section may not be typical.
The rainfall data for Singapore are given in
Table 2.
TABLE 1. Total monthly ~ind speed at Kallang,
Singapore
(Extracted from records of the Meteorological Dept.,
Malaya)
.
,
YEAR
1948
"
"
"
"
"
MONTH
TOTAL MONTHLY SPEED
January • •
February • •
March
• •
April
• •
May
• •
June
• •
July
• •
August
• •
September
October • •
November
December ..
1554,5 meters per second .
657·5
"
"
"
760·0
"
"
"
626·0
"
"
"
659·0
"
"
1174· 5 "
"
"
"
1065'0
"
"
"
1226·5
"
"
"
1029,0
"
"
"•
854,0
"
"
"
973·0
"
"
1346, 5 "
"
"
"
The climate of Singapore as well as othel; areas
"
in South East Asia is characterised by two
"
monsoons. In Singapore the two monsoons
"
"
are (1) south-west monsoon from May to
"
September, and (2) north-east monsoon from
November to March the following year, with
TABLE 2. Rainfall of Singapore in inches per month
eight weeks between the two monsoons during
(Ex tracted from the records of the Meteorological Dept.,
which weather conditions are changeable. DurMalaya)
ing the north-east monsoon the prevailing wind
is no rth and north-east and according to Brooke
AVERAGE FOR
AVERAGE
MONTH
1948
52 YEARS
1931-40
Smith (1936) water from the South China Sea
. flows through Singapore Straits from east to January
'9,88
9·25
24·03
•
6·62
4·82
west, whilst during the south-west monsoon February • •
8'38
7·36
14·26
7'40
March
with prevailing wind south, south-east and
7,64
6·57
10·08
April
south-west, the water in Singapore Straits is May ..
9,92
6·65
8·40
·,
6·85
7·52
6'71
replaced by water from the Java Sea. Details June ..
5·89
10·92
July
.
6'77
of the monthly totals of wind speed are given in August
7·95
6·52
3·29
•
Table 1.
7·23
5· J8
September ,
6'77
8,07
7·03
4'11
October
·
,
Like in all tropical countries the s~lllshine i November , ,
9·92
13·52
9'08
intense and . records do not show any variation December • •
10· 55
8·88
12·83
throughout the year. According to Stewart
(1930) the rainfall for Singapore Island is more
B.
WATER
TEMPERATURE
or less evenly spread over the different months
The variation in the temperature of the sea
of the year. From the average figures for the
period 1931-40 the range is from 4·82 inches per water throughout the year is not great, the range
month to 9·25 inches per month. On the whole for 1948 being from 27 '2° C. to 30·6° C., i.e.,
the north-east monsoon brings more rain than 3'4° C. From the temperature curve for the
..
PERPUSTAKAAN
NEGARAMALAYSI
A
•
J
,
• •
!
•
• •
•
• •
•
,
•
,
,
•
•
•
4
THE FOOD A
•
•
•
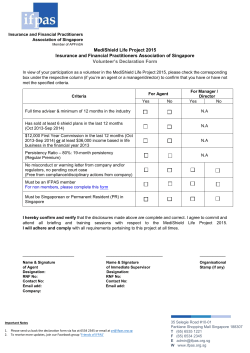
year 1948 (see Fig. 1) it is seen that there is a
minimum (27'5° C.) in January rising to a maximum of nearly 30'5° C. in May and June. From
then onwards the temperature begins to drop to
another minimum of about 29·2° C. in August,
after which it rises slightly till October, when it
begins to fall once again to the minimum in
January. It is generally lower during the northeast monsoon because during this period (1)
there is more rain and slightly less sunshine and
(2) the water flowing through Singapore Straits
comes from the China Sea.
It is interesting to note that the temperature
readings of the surface water of the Bay of
Nhatrang along the Indo-china coast as given by
Chevey and Serene (1948) give the same. sort of
curve as that for Singapore Straits. The water
flowing past the Bay of Nhatrang flows through
Singapore Straits during the north-east monsoon. This explains the minimum in January.
Looking at another factor which influences sea
• water temperature in an enclosed sea area like
Singapore Straits, viz., wind force, it i noticed
that when total monthly wind speeds are high
the corresponding monthly temperatures are
low. According to Weel (1923), during the
months when the East monsoon (equivalent to
the south-west monsoon in Singapore) prevails
in full force and regularity in the Java Sea, the
water there has a considerably lower temperature than in the transition months. This explains
the minimum temperatures in January and
August in Singapore Straits, since (I) the total
monthly wind force in Singapore during the
south-we t monsoon is highest in August and
during the north-east monsoon highest in
January and (2) water from the Java Sea flows
through Singapore Straits during the south-west
monsoon.
C. SALINITY
The salinity of the water of Singapore Straits
varies from 28-47% 0 to 31·87% 0 during the
year 1948 with two maxima, one round about
March-April and the other in November, and
two minima, one round about August and the
other around December- January. It is generaUy
higher during the north-east monsoon and lower
during the south-west monsoon.
Looking more closely at the salinity data for
Singapore Straits, it is noted that the salinity
drops from over 31 % 0 with the onset of the
south-west monsoon to a minimum of 28'5% 0 in
August and then rises again before the northeast monsoon sets in to a maximum of over
31'80% 0 in ovember. After this it drops
again to a higher minimum in January the
following year and then T1ses again to over
D F EE DI
G RELATIONSH IPS O F
31 % 0 in February and remains somewhere near
this figure until April. This appears to be the
annual salinity pattern for Singapore Straits as
the
sort of curve was obtained in 1935 by
the writer 'in a previous study of the salinity of
Singapore Straits (cf. Birtwistle, 1936). Unfortunately the data obtained in 1935 were 10 t
during the Japanese occupation of Malaya.
If it is remembered that from May to September each year the water in the Java Sea flow
through Singapore Straits and from ovember
to April the water in the South China Sea flow
through it, almost all the feature of this salinity
pattern can qe easily explained.
On examination of the surface salinity charts
of Weel (Ioc. cit.) for the Java Sea during the
transition period (May) just before the southwest monsoon sets in, it is noticed that the
salinity is lower in the eastern half of the Java
Sea. When the south-west monsoon (or east
monsoon in the Java Sea) sets in the whole body
of water in the Java Sea Iiifts toward Singapore
so that the more saline water in the western part
of the Java Sea will reach Singapore first and
then the Jess saline water of the eastern part of
the Java Sea will follow. This will explain the
form of the salinity curve in Singapore Straits
during the south-west monsoon . . Weel's surface
salinity charts for the Java Sea for August show
that the less aline water in the eastern pal tin
May ha been swept clean off the Java Sea by
August and the alinity at the western extremity
%
is given as 32· 5 0 and that at the eastern extremity as 34'5% 0 at that time. Berlage (1927),
after a study of Weel's figures, has come to the
same conclusion, viz.: that the Java Sea is
wept clean twice a year. This then explains
why the salinity in Singapore Straits rises after
Augu t.
During the rise in salinity from a minimum in
August to a maximum in ovember there is a
period of about two week during which the
salinity i more or less stationary. This correspon in date to the transition period from the
south-west to the north-east mon oon. During
the north-east monsoon water from the South
China Sea flows through Singapore Straits. The
rise in salinity from the tra{lsition period to a
maximum ;n ovember is due to this more saline
water of the South China Sea. After ovember,
however, there is a udden drop in the salinity
reaching a minimum in January. The whole of
the east coast of Malaya, including Singapore,
gets very heavy rainfall during the north-east
mon oon, the maximum rainfaU being in
December. The salinity minimum in Singapore
Straits in December- January is then the obvious
PERPUSTAKAAN
NEGARAMALAYSI
A
•
•
•
•
J
THE F IS H ES OF SINGAPORE STRAITS
31•
•
•
30 -
•
•
•
u
o
•
•
Cl.
29-
~
•
w
,
f-
-
•
•
28 •
•
•· •
•
I
27..J
J
I
I
A
M
I
I
M
F
I
I
J
J
194 S
•
I
I
I
,
I
A
S
0
N
0
Fig. 1. TempelOture of the water of Singapore Straits .
•
•
•
•
o
. 0
o .
•
31 -
>-
PERPUSTAKAAN
NEGARAMALAYSI
A
f-
•
-Z
-...J
c(
(/)
-
•
29 •
28 ..J
J
I
I
I
I
F
M
A
M
I
J
I
J
1948
•
I
)
A
S
Fig. II. Salinity of the water of Singapore Straits .
•
•
•
I
o
I
I
N
D
THE FOOD AND FEEDING RELATIO
6
,
effect of this heavy rainfall. Looking at the
state of affairs further north in the China Sea it
is noticed that in the salinity graphs of the Bay
of Nhatrang in French Indo-China given by
Chevey and Serene (Joc. cit.) there is a sharp
drop in salinity round about September-October
from above 33%0 to as low as 26%0 and does
not rise to 33%0 until February-March the
following year the minimum occurring during
October-November. This suggests that since the
water in Singapore Straits comes from the South
China Sea during the north-east monsoon
(November-March), the minimum salinity during
December-January in Singapore Straits may
also be due to the reduced salinity Of the coastal
waters of the South China Sea during that period.
In the Bay of Nhatrang the drop in salinity
starts about early September. This is so probably because the monsoon rains begin there
about that time. Even in Malaya it is noted from
Stewart's (loc. cit.) figures tJ:~at the north-east
mo.nsoon rains set in progressively earlier as one
proceeds north along the east coast.
As the rainfall gets back to its average monthly
value in Singapore the salinity in Singapore
Straits rises and reaches a maximum around
March and this maximum is maintained until
April, when with the onset of the south-west
.
monsoon it drops again.
D.
•
PHYTOPLANKTON
The phytoplankton has be~n collected by
pumping sea water from different depths and
filtering through a silk net (mesh equivalent to
o. 20 bolting silk) so that, knowing the volume
of water filtered, the results can be expressed as
number of cells per cubic meter of sea water.
SHIPS OF
The plankton samples have not yet been studied
in detail and the results presented in Table 3,
however, give an approximate picture of the
variation in numbers of the main genera present
in the plankton throughout the year 1948 as the
indications used in the table are based on rough
counts of the number of cells.
It will be seen from Table 3 that the genera
most conspicuous in the plankton are Coscinodiscus, Biddulphia, Ditylum, Cha!toceras, Bacteriastrum, Thalassiothrix and Rhizosolenia. The
term
'other
genera'
includes
the
genera
Guinardia, Leptocylindricus, Planktoniella, Hemiaufus, Streptotheca, Stephanopyxis, Corethrol1
and Bellerochea. The variation in the total
estimated number of Phytoplankton cells from
month to month is shown in Fig. III, which
shows three maxima, viz.: in February, April
and November. Work on the plankton in
Singapore Straits is still in progress and whilst it
is as yet premature to discuss the possible causes
of the variation in numbers throughout the year,
it would appear from the results obtained so far
and from qualitative ·surface tows made in 1935
that certain features of the phytoplankton variation observed in 1948 are more or less typical for
Cha!toceras
maximum
Singapore Straits, e.g., the
•
during April or May, the Biddufphia cum Dityfum maximum in June or July and the Rhizosolenia maximum in November have also been
observed in 1935.
In January the standing crop is low. It rises
sharply in February, drops in March and rises
again in April. After this it drops sharply till
June and continues to drop gradually to a
minimum in August. Then it rises gradually to
a maximum in November after which it drops
•
agam .
•
PERPUSTAKAAN
NEGARAMALAYSI
A
•
TABLE 3.
TYPE
Coscinodiscus
Biddu/phiq
Ditylum • •
Ch(f!toceras
Bacteriastrum
Thalassiothrix
Rhizosolenia
Other types
JAN.
FEB.
• •
• •
ccc
ccc
•
• •
f
r
p
r
•
•
• •
•
• •
• •
• •
• •
• •
• •
p
• •
• •
rr
• •
• •
p
c
c
p
Phytoplankton in Singapore Straits. 1948
,
MAR.
APRfL
MAY
JUNE
JULY
AUG.
SEP.
OCT.
NOV.
DEC.
ccc
rr
cc
r
cc
c
c
c
r
c
c
c
rr
rr
p
p
p
c
rf
ccc
cc
c
c
c
c
c
c
ccc
c
c
c
r
cc
ccc
c
cc
c
p
c
c
rf
cc
cc
c
r
r
p
cc
p
ccc
r
ccc
c
c
ccc
c
rr
p
p
r
p
r
•
r
rr
rr
rr
rr
rr
IT
rr
I
r
r
f
I
I
•
Significance of Symbols
•
below JOOO cells per cubic meter
= rare
= JOOO- 5000 cells per cubic meter
= present
= 5000- 10000 cells per cubic meter
= common
= 10000- 50000 cells per cubic meter
= very common = 50Q00-IOOOOO cells per cubic meter
.C«c = abundant
= over 100000 cells per cubic meter
A dash ( ) indicates that it is not observed in the sample.
rr
r
p
c
cc
= very rare
=
•
of sea
of sea
of sea
of sea
of sea
of sea
water.
water .
water.
water.
water.
water.
•
•
•
•
•
•
PERPUSTAKAAN
NEGARAMALAYSI
A
THE FOOD AND FEEDING RELATIONSHIPS OF
8
From the p~int of view of numerical composition of the phytoplankton Coscinodiscus
represents between 80 per cent. to almost 100
per cent. of the total Ollmbers of phytoplankton
cells. In April its place is taken suddenly by
Chatoceras. For May, June and July Coscinodiscus represents about one-third of the total,
whilst the other two-thirds are made up of
m a inly . Biddulphia, Ditylurn and Chatoceras.
Whilst Biddulphia and Dilylurn increase in numbers from May to July, Chatoceras decreases.
In August the total number of phytoplankton
cells is very low, about tbree-quarters of it is
Coscinodiscus and one-fifth of Biddulphia and
Dity/urn combined. During the months of
October, November and December, Coscinodiscus forms a good proportion (about 30-50 per
cent.) of the phytoplankton, while appreciable
numbers of Biddulphia, Rhizosolenia and Chatoceras are present in October,
ovember and
December respectively.
•
E. ZOOPLANKTON
The zooplankton has been collected in two
ways, the smaller organisms like Tintinnids,
Copepods, Lamellibranch larva:, etc., in the
same manner as phytc plankton, and the larger
organisms like Siphonophores, Brachyuran
larva:, other Decapod larvre, Cha:tognaths, etc.,
by surface tow with a muslin net. The results
are showrrin Tables 4 and 5. The same symbols
are used bu t the symbols indicate different
ranges in the numbers of individuals.
From Table 4 it will be noticed that Copepods
dominated the zooplankton with Tintinnids and
Lamellibranch larva: next in prominence. From
•
Zooplankton (pump haul) in Singapore Straits.
FEB.
JAN.
•
Tintinnids
• •
Noctilllca
•
Heliozoa
• •
Peridinians
•
Cerafium
• •
Copepods
• •
Lamellibranch larvre
Gastropods (small)
Polychretes (small)
Cirripede larvre ..
•
•
•
•
•
•
•
APRIL
rr
rr
ccc
• •
• •
MAR.
p
tr
r
]948
MAY
JUNE
JULY
AUG.
SEP.
OCT.
rr
cc
r
p
p
rr
p
p
rr
cc
rr
rr
rr
rl'
,
rr
• •
rr
c
p
•
•
rr
•
•
•
•
•
• •
• •
p
cc
p
p
rr
•
IT
rr
IT
ccc
cc
p
cc
c
rr
P
rr
rr
r
cce
c
r
rr
p
cc
rr
rr
rr
r
c
p
cc
rr
rr
rr
rr
p
ccc
c
r
rr
rr
rr
rr
rr
.rr
ir
rr
NOV. • DEC.
r
p
cee
c
• •
•
•
•
PERPUSTAKAAN
NEGARAMALAYSI
A
TABLE 4.
TYPE
Fig. III there are three maxima in copepod
numbers, one in April, one in June and one in
October. It is not yet known if this is a typical
annual copepod curve for Singapore Straits.
Tintinnids are common during June and
ovember, whilst Lamellibranch larva: are
common from March to June with a maximum
in April and appear again towards the end of the
year. Both Ceratiurn and Noctiluca are present
in the plankton in February in appreciable
numbers, but are not common during other
months. Small gastropods, small Polycha:tes
and Cirri pede larva: are present in the plankton
during most months of the year. Heliozoans
and Peridinians are only noticeable in the
plankton occasionally.
From Table 5 it will be seen that Siphonophores, other Crelenterates, Brachyuran larva:,
other Decapod larva: and Cha:tognaths are
present in the plankton throughout tbe year.
For Siphonophores there are two maxima, one
in March and the other during October-November. For Bracbyuran larva:, Decapod larva: and
Cha:tognaths there are three maxima, one in .
March, one during June-July and one during
October-November. The maximum for Brachyuran larva: in March and that for Decapod larva:
during October-November are not pronounced.
The other organisms in Table 5 are present in
the plankton otT and on in comparatively smaller
numbers. Oikopleura is present in the plankton
off and on, i.e., in January, April-May and
August-November. Salps are present in April,
June-JUly and October-November. Ptero'pods
are present in the plankton in OctoberNovember.
IT
,
Significance of Symbols
A dash ( ) signifies that it is not observed in the sample.
IT
= very rare
= less than 500 organisms per cu bic meter of sea water.
r
= rare
=
500- 1000 organisms per cubic meter of sea water.
p
= present
=
1000- 5000 organisms per cubic meter of sea water.
e
= common
= 5000-10000 organisms per cubic meter of sea water.
cc = very common = 10000-20000 organisms per cubic meter of sea water.
=
over 20000 organisms per cubic metre of sea water.
eec = abundant
,
p
cc
r


© Copyright 2026