
School Fees and Access to Primary Education: Assessing Four
School Fees and Access to Primary Education: Assessing Four Decades of
Policy in sub-Saharan Africa∗
˙ scan†
Talan B. I¸
Daniel Rosenblum
Katie Tinker
Dalhousie University
March 20, 2015
Abstract
In this paper, we examine the relationship between primary school fees and education quality and
access over the past 40 years in seven sub-Saharan African countries. School fees were introduced as
a means for revenue-constrained governments to fund the improvement and expansion of primary
education. Recently there has been a move toward their abolition. We find that the introduction
of fees decreased primary school enrollment, without achieving significant quality improvements.
We also discuss the impact on quality of the major increases in enrollment following the abolition
of school fees, and identify the government funding shortfall amplified by this policy change.
JEL classification: I22, I28, O55
Keywords: school fees; primary schooling; sub-Saharan Africa; education policy
∗
We thank two anonymous referees, the Editor, Ian McAllister and Mutlu Yuksel for encouragement and comments
˙ scan thanks Universidad Carlos III de Madrid for its hospitality. This
that substantially improved our paper. I¸
research was not externally funded. All authors have contributed equally to this research. The authors declare no
competing financial interests. All authors have equally contributed to this work. All errors are our own.
†
Corresponding author : Department of Economics, Dalhousie University, 6214 University Avenue, Halifax, P.O.
Box 15000, NS, B3H 4R2, Canada. E-mail : [email protected]. Tel.: +1.902.494.6994.
1
Introduction
There is almost universal agreement that primary education not only has significant positive private returns, but also entails positive social returns, including higher labour market earnings,
higher economic growth, lower infant mortality rates, improved health and sanitation, and greater
civic participation (Deininger, 2003; Kadzamira and Rose, 2003; Plank, 2007). Over the last few
decades, while many poor countries in Asia and Latin America have made substantial progress
toward universal primary education, the record of sub-Saharan Africa has been one of disappointment (UNESCO, 2010).1 In this region, a major issue concerning access to primary school has
been the direct monetary costs incurred by parents and caregivers as a result of primary school
“user” fees (a funding system sometimes referred to by governments as “cost-sharing”). Yet despite a recent trend toward fee abolition, there does not appear to be a consensus among policy
makers and economists regarding the relative merits of such fees (Bray, 1988; Kattan and Burnett,
2004). In this paper, we assess the impact of school fees on access to and quality of primary school
education in sub-Saharan Africa, using data from seven countries over a 40 year period.
Fees at the primary level in public schools became commonplace in sub-Saharan African countries during the post-colonial period. They were introduced as a means for revenue-constrained
governments to fund their educational systems in an efficient and effective manner, which may
not otherwise have been possible (Kattan and Burnett, 2004; Reddy and Vandemoortele, 1996).2
Although governments usually continued to provide funding for teachers’ salaries, public schools
grew dependent on fees over time to purchase textbooks, uniforms, or fund construction and repairs
(World Bank, 2009).
School fees were collected in a number of ways. Sometimes they were paid directly to the
schools as tuition charges or payments for materials, while in other cases they took the form
of mandatory contributions to parent-teacher associations and other local management bodies
(Kattan and Burnett, 2004). Similarly, the level of fees varied widely between countries and
sometimes between provinces or communities. In Kenya, for example, tuition for primary school
attendance ranged from $20 to $350 (USD) per year per pupil (Kattan and Burnett, 2004). During
the time school fees were prevalent, primary education costs represented a significant share of
household income—particularly for those in the lowest income brackets. According to a 1986
study of 63 less-developed countries, the annual cost of sending two children to primary school for
the poorest 40 percent of households was above five percent of their household income in all but
1
According to this report, while primary school enrollment in sub-Saharan Africa has increased dramatically since
the early 2000s from an average of 56% in 2000 to 73% by 2010, 45% of the global out-of-school population is in
Africa, and some 28 million pupils in sub-Saharan Africa drop out each year (UNESCO, 2010).
2
As we document later in the paper, the reintroduction of school fees in the 1980s coincided with the so-called
“structural adjustment programs.” See Kattan and Burnett (2004), Bray (1988), Reddy and Vandemoortele (1996),
and World Bank (2009).
1
12 of the countries, and above 10 percent for 33 of these countries. Of the 22 sub-Saharan African
countries in the study, only one fell into the “less than five percent” category; 15 were above
10 percent, and five were above 20 percent (Reddy and Vandemoortele, 1996). Although these
estimates include all direct costs, not only school fees, other sources suggest that fees represented
a significant proportion of household expenditures on primary education in sub-Saharan Africa,
anywhere from one third in Ghana to one half in Ethiopia (Kattan and Burnett, 2004).
In recent years, many policy makers, educators, and development economists have raised concerns about such financial barriers to primary education, and have advocated in favour of “free”
primary education, with UNICEF spearheading a School Fee Abolition Initiative since 2005 (World
Bank, 2009). In addition, political parties in several developing countries have used school fee abolition as a popular campaign pledge—as in Malawi, Uganda, and Kenya (Al-Samarrai, 2003; Vos
et al., 2004; World Bank, 2009). Given the substantial share of household income that is spent on
school fees, it is not difficult to appreciate the popularity of such pledges.
While opinions and practice on school fees have fluctuated over the years, there is surprisingly
little systematic empirical evidence regarding their relative merits. This paper attempts to fill this
gap by examining the long-term relationship between school fees and education quality and access
over the past 40 years, focusing on seven countries in sub-Saharan Africa with relatively similar
education policies and socio-economic circumstances: Ethiopia, Ghana, Kenya, Malawi, Tanzania,
Uganda, and Zambia. Although a large number of other countries in the region had some form of
primary school fees in place during the period in question (Kattan and Burnett, 2004), these seven
countries were selected primarily based on the availability of data. These countries are also fairly
well-studied in the literature on primary school fees, which offers our analysis ample historical
context.
Overall, we find that, in the historical period we study, primary school fees were associated
with a 17 percentage point reduction in enrolment rates in primary schools, and a five percentage
point drop in primary completion rates. At the same time, we note a decline in the pupil-teacher
ratios (a reduction of about seven pupils per teacher) when school fees are present in our sample
countries. Ultimately, these findings, viewed in the context of the existing literature, lead us to
question whether the improvements in the quality of primary education systems in our sample
countries when fees are present are sufficient to justify the negative impact they represent as a
barrier to access. However, our findings also reveal a decrease in quality resulting from rapid fee
abolition, reinforcing concerns voiced by others in view of the recent movement toward abolition
(e.g., Plank, 2007).
Our main contribution to this literature lies in the broadness of the time period our study
covers. Earlier studies have looked at the impact of introducing a fee-based system at the primary
level (Bedi et al., 2004; Bray and Lillis, 1988; Reddy and Vandemoortele, 1996), while later studies
2
have looked at the quality and access implications of fee abolition, either in a single country or in a
group of countries (Bold, M. Kimenyi, Mwabu, and Sandefur, 2010; Deininger 2003; World Bank,
2009). Many of these later studies note that school fees have acted as a significant financial barrier
to enrollment based on the observed increases in enrollment rates following the abolition of fees
in several countries (Kattan and Burnett, 2004).3 We not only examine several educational access
and quality indicators (primary enrolment rates, pupil teacher ratios, and primary completion
rates) as consistently defined in a set of countries, but also do so over a time period that, for the
majority of the case-study countries, extends from before fee introduction to after fee abolition.
This broader window enables us to be more comprehensive in our assessment of school fees and
their merits for access to and quality of primary eduction in sub-Saharan Africa.
The remainder of the paper is structured as follows: Section 2 outlines the basic conceptual
issues surrounding our analysis. Section 3 provides an overview of each of the seven case-study
countries. Section 4 examines the relation between school fees and educational access and quality
outcomes in the case-study countries. Section 5 conducts an extensive robustness analysis. Section 6 discusses the complementarity between public funding for primary education and school fees
in practice. Section 7 concludes.
2
Conceptual issues
2.1
Arguments for and against school fees
There are a number of arguments for and against school user fees at the primary level.4 One of
the principal arguments voiced by advocates of school fees is that in countries where tax-bases are
small, or where government expenditures on education are highly constrained due to competing
priorities, it is difficult to adequately finance high-quality primary education. In those cases, user
fees can be a necessary supplement to government funding, and have the potential to improve
the quality of education. In the absence of such fees, a decline in the quality of publicly funded
education may also become a self-reinforcing problem, as middle and upper class families opt out of
the system in favour of private schools (Fiske and Ladd, 2003). In addition, some have argued that
small, low-cost private schools may be better able to meet the demand by low-income households
for good-quality primary education than are cash-strapped governments (Birdsall and Orivel, 1996;
3
Kremer and Holla (2009) review a number of randomized evaluations in different contexts and find that reductions
in education costs to families can improve enrollment rates dramatically. Our study complements these localized
studies, and our overall findings are consistent with this literature. Boone et al. (2013) advocate interventions that
raise education quality in rural Guinea-Bissau, rather than those which target enrollment. Caucatt and Kumar
(2007) discuss the merits of universal access to education in sub-Saharan Africa, but they do not directly address the
issue of school fees. Our focus here is the impact of school fees on access to education, and we think of universality
as a separate goal.
4
Here we provide a brief summary of the issues in general and refer the reader to the online appendix which
contains a more detailed discussion that is relevant for the specific context of sub-Saharan Africa.
3
Tooley, 2005; Tooley et al., 2010). Finally, parents and guardians who pay fees directly to their
local schools may feel a greater sense of ownership of and engagement in their children’s education
(Bray 1988).
The principal argument against primary school fees is that they amount to regressive taxation,
and that they have a disproportionately larger negative impact on the educational attainment of
children from poor families (World Bank, 2009). Moreover, since the social benefits of primary
education may exceed private benefits, due to human capital externalities, an over-reliance on private demand for and provision of education could result in under-investment in primary education
from a socially optimal standpoint (Bray, 1988; Deininger, 2003; Owens, 2004).
2.2
Measuring the impact of primary school fees
The existing literature on primary school fees recognizes their impact on educational outcomes in
a variety of dimensions. Specifically, we note that those in favour of school fees tend to emphasize
quality, whereas those against fees emphasize access. Bearing this in mind, in this study we
use a common set of indicators, in order to assess both quality and access outcomes associated
with school fees. One methodological challenge we face is the limited and sporadic recording of
primary education outcomes in sub-Saharan Africa over time. Working within these constraints,
our analysis focuses on primary school (gross) enrollment rates, primary school completion rates,
and primary-level pupil–teacher ratios.5 Enrolment rates provide a direct and clear indication of
access to primary education, with higher enrolment corresponding to a higher degree of access
across a population. Conversely, the pupil–teacher ratio has been shown in several studies to
be related to education quality, in that smaller class sizes are generally associated with higher
scholastic achievement (Angrist and Lavy, 1999; Case and Deaton, 1999; Krueger, 1999).6 We
also use the primary completion rate as a supplementary quality indicator, based on the premise
that low school quality (translating to a lack of perceived net private return) is one of the primary
reasons why students drop out of school (Al-Samarrai, 2003).
Although these are imperfect indicators of primary schooling quality, we are not aware of any
alternative measures available for our case study countries during the time period of our study.7
These measures are standard in the literature on the economics of education, and their availability
on a consistent basis for long periods of time is critical for our time-series, macro perspective in
5
Other measures that are relevant but not available on a consistent basis in our sample of sub-Saharan African
countries include: student performance on standardized tests, incidence of teacher absenteeism, and teacher salaries
as a percent of education spending. Kremer et al. (2013) review the challenges involved in measuring and improving
education quality in developing countries.
6
However, Dobbelsteen et al. (2002) contest the relationship between class size and student performance.
7
Al-Samarrai (2003, p. 10) notes that country-level data on education quality is scarce, particularly among African
countries, and that, in the absence of direct measures of learning outcomes such as test scores, previous studies on
trends in education quality have relied on indicators such as pupil-teacher ratios and school completion rates, as we
do here.
4
this paper.8 These indicators allow us to draw direct conclusions about the impact of school fees
on primary education quality and access, provided that we observe sufficiently long episodes with
and without school fees. We note, however, that these indicators do not allow us to address all
arguments for and against fees. For example, our findings are less informative about the questions
of whether or not the removal of fees may lead to the weakening of public school systems, and
about which specific demographics are most affected by the introduction or removal of school fees.
3
Sample countries and an overview
Our research design to assess the impact of primary school fees on access to and quality of primary
education looks at seven sub-Saharan African countries over a period from 1970 to 2010. Our
sample consists of Ethiopia, Ghana, Kenya, Malawi, Tanzania, Uganda, and Gambia. We focus
our study on these countries because there has been reasonable continuity in their educational
histories (which, for instance, was absent in South Africa), they have the most consistently available
data over time for the most indicators, and because they have been studied rather extensively in
previous research (though usually as separate cases). All the countries in our sample have some
colonial history, and the post-colonial history of education in each of these countries is the focus
here. While a larger sample would have allowed our results to be more representative, we would
inevitably encounter much more significant country heterogeneity. At the same time, we would
have had to forego our country-specific analysis, which we think is a valuable complement to the
quantitative investigation. Moreover, whatever their possible shortcomings might be, given that
our variables are consistently defined across time and countries and given our decision to work with
a reasonably homogeneous sample, the education indicators we employ are likely to have similar
interpretations across the countries included in this study.
3.1
Historical overview
In this section, we provide a detailed discussion of the relevant aspects of the recent histories of our
seven case study countries (complemented with the charts included in the appendix). We focus
most closely on the evolution of primary education policy over the past forty years in each country.
Ethiopia.
Although government-funded basic education was introduced in Ethiopia in the early
1900s, private schools began to emerge in the 1950s (World Bank, 2009). During the final years of
the Selassie era, the government attempted to fund schooling through a tax on arable land, but
8
Thus, we have not included an extensive discussion of those factors that influence educational outcomes at the
micro level, or attempted to chronicle changing attitudes toward education. We also do not address gender, regional,
and ethnic inequality in education within a country, in part, because data that can address such issues are not
available for the entire period we study here; see UNESCO (2013).
5
this led to resentment in rural communities, as education was perceived as primarily benefiting
those in urban areas (Roschanski, 2007). Following the coup of 1974, the military council “Derg”
placed education largely in the hands of the communities, and fees became universal—although
there was still a nominal distinction between “government” and “private” schools, and fees for the
former tended to be lower (World Bank, 2009). These fees did not appear to deter enrollment,
which began to climb gradually during the late 1970s and early 1980s (Figure A.1). During this
period, average class sizes also grew significantly—perhaps related to falling government spending
on education. The growth in school attendance was soon reversed, however, interrupted first by
the severe famine in 1984, and then falling in tandem with declining per capita income throughout
the late 1980s.
Fee abolition came with the election of a new government in 1994, although its implementation
took place somewhat gradually (as did the process of establishing replacement funding for the
lost fee revenues). The majority of students stopped paying fees only by 1996; this delay was
largely because of Ethiopia’s new constitution, which had decentralized power, making it difficult
to introduce and enforce country-wide policies (World Bank, 2009). A lack of government funding
may help to explain why, even as both enrollment rates and primary completion rates began to
climb steadily following abolition, pupil–teacher ratios nearly doubled during the same period. The
latter trend has begun to reverse in the last five years. coinciding with (and potentially related
to) a gradual increase in government funding of education.
While fee abolition apparently benefited children from all strata in Ethiopia, a Word Bank
(2009) report finds that rural students benefited more than urban students, girls more than boys,
and traditionally disadvantaged areas more than wealthier ones. The report concludes that fee
abolition is “definitely a policy favouring the disadvantaged” (World Bank, 2009, p. 56).
Ghana.
Ghana had initially introduced Free Primary Education in the 1960s, but the system
did not succeed in boosting enrollment. Akyeampong et al. (2007, p. 33) suggest that this
was partly a supply side problem: the country suffered from general economic decline in the late
1970s and early 1980s, accompanied by high inflation and rising debt, and many teachers left for
neighbouring oil-rich Nigeria, where they could earn higher salaries. Ghana introduced austerity
and decentralization measures in 1983, which included the formal introduction of school fees. By
1987, awareness of quality and equity issues prompted a first round of educational reforms, reflected
in a small increase in government funding observable in the mid- to late-1980s (Figure A.2).
Enrollment continued to stagnate, however, and this prompted the country’s leaders to renew
their focus on achieving Universal Primary Education with the launch of the Free, Compulsory
and Universal Basic Education (fCUBE) initiative in 1996. Its stated aim was to implement
Free Primary Education by 2005 (World Bank, 2009). The lengthy period of planning for fee
6
abolition, combined with an effective system of capitation grants to replace funding formerly
provided by fees, may have helped ensure that pupil–teacher ratios remained relatively low and
primary completion rates began to increase during the late 1990s and early 2000s (Figure A.2),
even after gross enrollment rates increased significantly following full abolition (Akyeampong et
al., 2007).
Kenya.
Primary school fees were a legacy of the colonial period in independent Kenya until the
early 1970s. Free education for grades 1 to 4 was introduced in 1974, and this likely helped bring
about a spike in enrollment—although fluctuations in enrollment also tended to follow rises and
falls in GDP per capita quite closely during this period (Figure A.3). School fees were reintroduced
in the mid-1980s when changes in the national curriculum placed more of the cost burden for school
infrastructure and learning materials on households (Vos et al., 2004). Enrollment rates began to
fall steadily around this time, despite rising GDP per capita.
Funds were typically collected through the traditional Kenyan practice known as Harambee
(literally “pulling together”)—a community fundraising drive. In principle, household contributions were meant to be voluntary, but in practice, children whose parents didn’t pay were often
suspended (Bold et al., 2010). Cost sharing was formalized in 1988, which meant that schools were
now responsible for everything other than teachers’ salaries, and collected fees directly, rather
than rely solely on contributions from Harambees (Vos et al., 2004). Falling enrollment in the
ensuing years (likely exacerbated by the spread of HIV/AIDS, the impact of which is discussed in
section 4.1) made fee abolition a popular issue in the 2002 election, and the Kibaki government
followed through on its promise to introduce Free Primary Education in 2003. This resulted in an
immediate increase in enrollment. However, Bold et al. (2010) write that fee abolition, and the
resulting overcrowding of the system, also prompted significant flight of middle and upper class
families from the public to the private school system. They note that this has led to inequalities,
as test scores have gone up in private schools and down in public schools.
Malawi.
In the early period of independence, the education system in Malawi tended to prioritize
funding higher levels of education, and primary school fees were in place at the beginning of
our study period. These fees were increased even further in 1982. By the end of the 1980s,
however, there was an increasing shift among policy makers in favour of pursuing Universal Primary
Education (Al-Samarrai, 2003). Primary fee abolition was a central goal in a new education plan
published mid-decade, and the process began in 1991. The intention was initially to remove fees
one grade at a time, starting with the lowest levels and working upwards. However, the new
government elected in 1994 abolished all remaining fees upon coming to power, following through
on a campaign pledge (Kadzamira and Rose, 2003). This led to a dramatic spike in enrollment
7
(Figure A.4). The response was so unexpected that the government immediately hired 18,000 new
teachers to cope with the new demand. As Kadzamira and Rose (2003) point out, however, these
teachers were largely unqualified, and only made a small dent in pupil-teacher ratios. Meanwhile,
after initial spikes following fee abolition, primary enrollment and primary completion rates have
fallen off dramatically (Figure A.4).
Tanzania.
Primary education was a high priority for Tanzania in the early years of the Republic,
and very high rates of enrollment were achieved by the early 1980s. These rates did not last long,
however, a fact which Wedgwood (2005) attributes to the significant deterioration in quality that
accompanied this initial campaign for universal education. In fact, she writes, Universal Primary
Education, or “ ‘UPE’, (pronounced “oopay”), has become a colloquial term associated with low
quality education rather than with universalisation” (Wedgwood, 2005, p. 4). Funding, rather
than access, became the focus of the government in the mid-1980s, and with that shift, school fees
were introduced in 1985.
Tanzania abolished primary school fees in 2001, and there was a subsequent jump in the pupil–
teacher ratio (Figure A.5). Wedgwood (2005, p. 6) notes that the government was committed to
providing in-service training for teachers, eventually reducing the pupil-teacher ratio, and replacing
the funding formerly provided through fees. However, Vavrus and Moshi (2009) caution that
although fees were officially eliminated, in practice, household contributions were often expected
from parents to pay for materials and infrastructure in the absence of sufficient government funding.
This may help explain an initial decline in the primary completion rate following abolition, although
this trend has reversed in more recent years.
Uganda.
Primary schools in Uganda have been dependent on fees for much of their funding
since independence. However, the government announced its intention to make Universal Primary
Education a priority along with other economic reforms in the mid-1980s. Some education reforms
aimed at achieving this goal were put in place in the early 1990s, but fees were fully abolished only
in 1996 (effective from 1997 onwards). Al-Samarrai (2003) notes that the push for fee abolition
was not universally popular; parent-teacher associations, who had borne most of the responsibility
for education in previous years, saw it as a threat to their control, and teachers were also resistant
when they perceived that their salaries would decline as a result. Additionally, many parents
were worried about the potential decline in quality, and there were concerns expressed, as in
Kenya, about movement by middle and upper class families to the private system in the post-fee
abolition period (Al-Samarrai, 2003; Deininger, 2003). The government took steps to reduce the
impact of its policy change on educational quality, refusing to hire untrained teachers and using
double-shifting to keep pupil-teacher ratios down. Nevertheless, enrollment rates rose dramatically
8
following fee abolition, increasing by 150 percent in standard one alone from 1996 to 1997 (AlSamarrai, 2003). There were also higher pupil-teacher ratios and falling completion rates over the
first decade following the policy change—though these trends appear to be reversing (Figure A.6).
From an equity perspective, Deininger (2003, p. 297) reports that the “urban bias” of education
in Uganda has been greatly reduced through fee abolition, adding that “the percentage of children
who failed to attend primary school for cost reasons dropped from 71 to 37%” after abolition.
Zambia.
Partly because of the socialist ideology that shaped its politics, Zambia was one of
the last to introduce school fees in 1996. Unofficially, however, fees had been gradually seeping
into the education system for years—as early as the 1970s (Kaluba, 1986)—due to the rise of an
informal, community-run private school sector. In fact, Kaonga (2001) estimates that household
contributions represented 44 percent of total education spending by 1993—higher than Kattan
and Burnett’s (2004) estimated African average of 30 percent. The fees charged by Zambia’s
“community schools” were low, but the quality of education they provided was also low due to a
lack of materials and trained teachers; they became popularly known as “second chance schools”
(Kaluba, 1986). Nevertheless, their presence appears to have achieved the goal of helping to meet
much of the demand for primary schooling at an affordable price, judging by the high enrollment
levels the country was able to maintain until the 1990s (Figure A.7).
With the formal introduction of fees in 1996, community schools became a cheap alternative to
government schools for those who had access to both, and consequently there was a significant shift
in attendance from government to community schools during the brief period in which fees were
officially legislated (Kaonga, 2001). As before, the community schools represented an affordable
option even for the lower-income brackets, and this may explain the fact that the introduction of
fees did not result in a significant decline in gross enrollment rates, with the majority of low-income
families simply switching over to more affordable alternatives.
At the same time, there was a significant jump in pupil–teacher ratios following the introduction
of school fees—a response not seen in any of the other case study countries. This may be in part
explained by the fact that, following the introduction of fees, government spending on education
in Zambia had the most dramatic decline relative to all other cases we study, possibly leading to
declining number of teachers overall.
With the abolition of fees in 2001 (and policy implementation starting in 2002), enrollment rates
and primary completion rates have risen quickly to equal or exceed their pre-fee levels. A further
increase in pupil–teacher ratios during this period suggest that those who shifted to community
schools in the late 1990s may have returned to public schools, along with those who had left the
system altogether. Funding a quality education remains Zambia’s biggest challenge.
9
3.2
Overall trends
Our review of the educational policies in our sample countries suggests several common elements
and basic trends. To begin with, there is a similar policy sequence among the seven countries
concerning fees at the primary level, and this sequence allows us to describe three distinct phases
during our study period. Several of the countries in our sample had school fees during their colonial
history, and during the early post-colonial period—which we consider as our first phase—several
of these countries made attempts to introduce free primary education. The second phase, covering
the period from the early 1980s up to the early 1990s, is marked by the introduction of or increase
in primary school fees. The third phase begins in each case with the abolition of fees.9
Fees.
As our overview in Section 3.1 indicates, there is significant variation in the timing of
introduction and abolition of primary school fees in our sample. (Table 1 summarizes the dates
corresponding to changes in school fee policies during our study period across the seven countries.)
Whereas several countries such as Ethiopia, Malawi, and Uganda inherited non-negligible school
fees from their former colonial rulers, they did not become universal in Ethiopia until 1974, and
were raised substantially in Malawi in the 1980s. Conversely, Ghana, Kenya, Tanzania, and Zambia
did not have fees at the beginning of our sample period but introduced them later. Also, there
is a staggering of abolition dates from as early as 1994 (Malawi) to 2005 (Ghana). These suggest
that some countries had ample time to observe others on the potential consequences of changes in
school fee policies. However, there is no apparent clustering of policy decisions: Zambia introduced
school fees in 1996 when political support for them was weakening, and several countries (Malawi
and Ethiopia) had already abolished them.
Indicators.
In all of the sample countries, distinct trends in our indicators for access to and
quality of primary education can be observed during each of the three phases described above.
The first, post-colonial phase is generally characterized by climbing enrollment rates and higher
government spending. During the second phase, where school fees are present and high, we generally observe falling enrollment rates and falling government spending, as well as stagnant or falling
levels of GDP per capita. The third, fee-abolition phase corresponds with rising enrollment rates,
which climb more abruptly than in the first phase—although these growth rates tend to level off
or even become negative within a few years This last phase is also characterized by increasing
government spending on education and rising GDP per capita. Pupil–teacher ratios and primary
completion rates follow more varied patterns across countries: In some cases these indicators im9
Unfortunately, we do not have reliable and consistent cross-country data on the share of primary school fees
in total costs of schooling. We can give a sense of the magnitudes involved based on figures in Ablo and Reinikka
(1998). They report expense data by parents and government on publicly-funded primary schools in Uganda from
1991 to 1995. In 1991, parental contributions were 72.5% of total spending, and in 1995, they were 60%.
10
Table 1: Chronology of primary school fee policies
Year in which school fees
Country
Introduced
Raised
Limited
abolition
Ethiopia
Ghana
Kenya
Malawi
Tanzania
Uganda
Zambia
1974
1983
1970/1984
1970
1985
1970
1996
–
–
1988
1982
–
–
–
–
1996–2004
–
1990–1993
–
–
–
Abolished
1996
2005
1974/2003
1994
2001
1997
2002
Sources: See the text.
Notes: “–” indicates no such policy change was recorded. Under the column labelled “Introduced,” 1970 indicates
fees existed at the beginning of our study period.
prove during the first and third phases, and deteriorate during the second, following the pattern
of enrolment rates, while in other cases the opposite is true, or there is little or no marked reversal
in trend coinciding with the policy changes.
4
Evidence on the impact of fees
In this section, we present our econometric analysis of the relationship between school fees and our
three indicators of access to and quality of primary school education in our sample of countries.
We see our analysis as isolating conditional associations at the macro level, rather than identifying
strictly causal relations, as our sample size and availability of data constrain the conclusions we
can draw from our results.
4.1
Access to and quality of education
We measure the impact of school fees on education in the seven sub-Saharan countries, both at
the individual country level and together, in a pooled regression. For the pooled estimates, we use
a linear regression model of the following form:
Eit = Fit β1 + Xit β2 +
7
X
δic Countryi +
X
δty Yeart + εit ,
(1)
t
i=1
where the dependent variable E represents the value of one of three education indicators in country i
in year t. The three education indicators discussed in Section 2.2 serve as the dependent variables in
our analysis. Gross primary enrollment as a percentage of the total population of primary schoolaged children is an indicator of access to education. The pupil–teacher ratio and the primary
11
completion rate serve here as measures quality rather than access-though the completion rate may
also be seen as an indicator of access, since it increases with the number who enrol.10
In the regression model (1), Fit is a matrix of dummy variables associated with school fees
(the matrix of independent variables of interest). We use four mutually exclusive categories of
school fees; school fees, higher school fees, limited abolition, and no fees. The omitted fee category
in our regression models is no school fees. The “school fees” variable indicates the years that
primary school fees were initially in place. For those countries where fees were increased after
their initial introduction, “higher fees” indicates the years fees were raised conditional on having
school fees earlier. Where fees were phased out over multiple years we include a dummy variable
for “limited abolition,” indicating any years in which, after fees were introduced or raised, they
were subsequently reduced but not eliminated.
In our specifications, Xit is a matrix of control variables. These capture factors independent
of the direct costs represented by school fees, which may also have an impact on the dependent
variables of interest. In our baseline specification, we include five major controls, grouped in
three categories: (1) income per capita; (2) health indicators; and (3) demographic factors. We
control for market income per capita (GDP per capita in constant 2000 international dollars). We
group these control variables in three categories: (1) income per capita; (2) health indicators; and
(3) demographic factors. (Section 5 presents a more extensive robustness analysis.) We control
for market income per capita (GDP per capita in constant 2000 international dollars). We also
include a dummy variable for whether or not the country was in the midst of or recovering from a
famine (“famine or post famine year”), as famines may have a disproportionately larger impact on
our education indicators than would be dictated by a transitory fall in market income per person.
In our sample this variable is only relevant for a few years in Ethiopia, and it does not always
overlap with the observations we have on education indicators or the other control variables.
We control for two indicators related to health: death rate per 1000 persons and life expectancy
at birth in years. These variables control for the impact of the HIV/AIDS epidemic, which we
are otherwise unable to do given the lack of availability of HIV/AIDS infection rates for the
seven countries included in this study. This disease affects school attendance either because the
children themselves may be sick or because of the sickness or death of their parents or caregivers.
When the illness affects adult members of the household (as HIV/AIDS does in the majority of
instances), children often have to forgo schooling in order to take care of household duties, or
simply because household income has been reduced to the point where they can no longer afford
10
Both the gross enrollment rate and completion rate can be greater than 100 when children from other age
groups enrol in primary school in addition to those of primary school age—a common phenomenon following fee
abolition, when many older children began to attend school for the first time due to lowered costs. We prefer to
use gross enrollment and completion rates, which capture all individuals enrolled in primary school, rather than the
corresponding net rates, which only include primary school age children.
12
to pay for education. The expected effect on pupil-teacher ratios is unclear, since teachers as well
as children are affected by the disease. Our death rate and life expectancy variables also capture
other health-related factors influencing school attendance and school provision, including malaria
and other widespread diseases, as well as the availability of health care.11
To control for demographic factors, we use the dependency ratio, measured as the percentage
of youths (classified as those aged 0-14) in the total population. A higher dependency ratio may
escalate the financial burden of schooling. In the absence of compensating factors, this would lower
the enrollment rate and possibly increase pupil–teacher ratios.12
Finally, in the pooled regression model (1), Countryi is a dummy variable that takes the value
of one for country i and zero otherwise; Yeart is a dummy variable that takes the value of one in
year t and zero otherwise; and εit are random error terms. The country dummy variables control
for differences in initial education levels as well as all factors that are fixed over time within a
country, but possibly vary across countries (e.g., colonizer country), and year dummy variables
control for year-specific effects on education that are common to the entire sample of countries.
For inference, we use robust standard errors. In the case of pooled regression model (1), the low
number of clusters (seven countries) does not permit us to reliably cluster our standard errors
(Cameron et al., 2008). We note that country and year fixed effects reduce the within-cluster
correlation even without clustering the standard errors. Nevertheless, later we also discuss our
results using clustered standard errors at the country level with boostrapping, as well as clustered
standard errors at the year and country level, both of which help correct for the low number of
clusters. Below, we also use a similar model specification for each country separately.
Without doubt, there are other factors which matter for our education indicators but for which
we are unable to control in this study. For example, the opportunity cost of a child’s labour (an
indirect cost of education) is an important consideration, but indicator data on opportunity cost
(such as wage rates for unskilled labour) is not available for much of the period covered here.
Psacharopoulos and Patrinos (2004) have estimated both social and private rates of return to
education for various countries, but their estimates are only available for individual years, and
for only three of the seven countries in this study.13 Persistently high unemployment rates might
be an indication of low expected returns, but even unemployment data are available only very
11
Both of these indicators have undergone reversals in some of the case study countries (Uganda, Ghana, Kenya,
and Zambia) during the period in which HIV/AIDS has become prevalent.
12
The HIV/AIDS epidemic of the past two decades contributed to rising death rates in sub-Saharan Africa, and
possibly to the rise in the percentage of young people in the population given that the disease’s primary victims
have been adults (Ashford, 2006). Consequently, the indicators for health and dependency ratio may be correlated.
13
Their estimates of the returns to investment in education for the three of the seven countries we study here are:
Ghana (18% for 1967), Malawi (14% for 1982), and Uganda (an astonishing 66% for 1965). However, notwithstanding
the dearth of data on opportunity cost and return on investment, we do control for various income measures, such
as GDP per capita, and note that an economic crisis may lead to rising school fees due to fiscal retrenchment, and
lower enrolment rates due to the rising opportunity cost of child labor.
13
sporadically and with uncertain quality. Finally, we lack data on the supply of schools (such as
average distance to school).14
We do not include government spending on education in our regression model for several reasons.
First, the data we have relates to government spending on education at all levels; we do not have
separate data showing public spending on primary education alone. Second, even the education
spending data available is limited to a few years. Thirdly, while we think of public spending on
education primarily as an input to education, as we discuss in more detail below (Section 6),
government spending on education is unlikely to be independent of fee introduction and abolition.
4.2
Data
All data, unless otherwise indicated, are obtained from World Bank (2014).15 In a number of
instances, we needed to either use alternative sources or combine data sources. These instances
were as follows: For Ethiopia, pupil–teacher ratios for 1994–2004 are from World Bank (2009).
For Kenya, pupil–teacher ratios for 1985 and 1990 are obtained from the Education Policy and
Data Centre (2011).16 For Ghana, Kenya, Malawi and Zambia, data for GDP per capita from
1970 to 1979 was only available in constant 2000 U.S. dollars. However, for all four countries the
ratio of GDP per capita in constant 2000 U.S. dollars to GDP per capita (PPP) in constant 2000
international dollars remained very stable over time from 1980 to 2009. Therefore, for each country
we calculated the average ratio for this period, and then divided the U.S. dollar GDP per capita
figure by the result for each of the missing years between 1970 and 1979 in order to estimate for
GDP per capita in PPP terms for those years.17
Table 2 reports the sample means and standard deviations of our three educational outcome
and access indicators for each of our seven countries. There is considerable variation across the
seven countries in all three indicators over the sample countries. There is also substantial variation
within individual countries over time in these indicators. The correlations between each of our
indicator variables are not particularly high, and in the case of pupil teach ratio and primary
completion rate, the correlation is negative (Appendix Table A.1).
4.3
Estimation results
Our analysis uses a parsimonious model to examine the relation between school fees and our
education indicators. We estimate the coefficients of the pooled regression model (1) by OLS
14
However, anecdotal evidence suggests that distance is not a major issue of concern at the primary level in all
the case study countries (Kaonga, 2001; Lavy, 1996).
15
In our source, UNESCO Institute for Statistics is listed as the primary source for the primary completion rate.
16
For those years in which we have data on pupil–teacher ratios from both sources, the ratios are effectively
identical.
17
The average ratios were as follows: 0.24 for Ghana, 0.32 for Kenya, 0.21 for Malawi, and 0.31 for Zambia.
14
Table 2: Sample means and standard deviations of education indicators
Primary
Pupil–teacher
Primary
enrollment rate, %
ratio
completion rate, %
Country
N
Mean
Standard
deviation
N
Mean
Standard
deviation
N
Mean
Standard
deviation
Ethiopia
Ghana
Kenya
Malawi
Tanzania
Uganda
Zambia
28
36
36
37
21
21
34
43.79
77.19
100.70
88.92
75.93
81.15
96.91
24.12
10.14
14.37
35.05
20.87
35.39
9.85
15
16
16
18
14
15
16
51.79
31.06
37.71
64.45
46.53
45.53
54.25
10.64
2.38
6.08
7.61
8.35
10.11
8.52
18
22
13
33
13
9
23
30.21
66.13
69.69
41.29
61.04
51.46
80.13
13.27
7.38
15.82
15.41
24.27
10.47
9.90
Notes: Primary enrollment is a gross rate defined as the total enrollment divided by the number of children at the
age of primary school. Total enrollment includes children and adults outside the official primary age, and hence this
rate can exceed 100. Primary completion is the total number of new entrants in the last grade of primary education,
regardless of age, expressed as percentage of the total population of the theoretical entrance age to the last grade of
primary. “N” is the number of observations.
Sources: See Section 4.2 in the text.
using each of the three indicators as dependent variables.18 We also use OLS to estimate the
coefficients of the regression model (1) separately for each country, but only for the primary
enrollment rate indicator. There are too few country-year observations on pupil-teacher ratios
and primary completion rates in our dataset to reliably estimate equation (1) separately for each
country with these as dependent variables. (These results are reported for reference in the online
appendix, and we only refer to them here when the number of observations is greater than 20.)
Table 3 reports the coefficient estimates from the pooled regression model (1). Focusing first on
primary enrollment rates, the estimation results show that school fees have a large and statistically
significant negative association with enrollment rates, even after controlling for income, health, and
dependency indicators. According to our estimates, there is a 17 percentage point difference in
enrollment rates between having no school fees and school fees, and the coefficient on the school
fee variable in our regression model is statistically significant at the one percent level of confidence.
Having higher fees reduces primary enrollment even further, with a coefficient more than double
that for school fees. However, reducing school fees through limited abolition does not raise primary
enrollment and relative to having no school fees periods of limited abolition are also associated
with lower enrollment rates.19 These estimates indicate that having school fees of any kind can
18
We used a Hausman specification test and verified that a fixed effects model rather than a random effects model
is appropriate for our data and regression analysis. Furthermore, the null hypothesis that the constant terms are
equal across units in our fixed effects estimates is rejected by an F-test, indicating that fixed effects are an appropriate
model compared to a pooled OLS regression without fixed effects.
19
In the regression model for enrollment rates, while the coefficient estimate on limited abolition dummy variable
15
Table 3: Pooled regression results
Dependent variable
Independent
variable
Primary
enrollment
Pupil–teacher
ratio
Primary
completion
School fees
−17.11∗∗∗
(3.00)
−37.94∗∗∗
(4.08)
−21.49∗∗∗
(4.93)
45.61∗∗∗
(7.09)
−0.86
(1.42)
0.54
(0.98)
2.60∗∗∗
(0.79)
17.33∗∗∗
(4.78)
−6.73∗∗∗
(2.47)
−4.15
(4.34)
−1.30
(3.29)
-0.26
(6.91)
1.62
(1.17)
0.59
(0.87)
1.55∗∗∗
(0.43)
5.78
(3.93)
−4.93∗∗
(2.39)
−22.45∗∗∗
(3.92)
−12.55∗∗∗
(3.08)
30.99∗∗∗
(7.43)
−1.94
(1.44)
-0.47
(0.93)
0.45
(0.83)
–
yes
yes
yes
yes
yes
yes
0.88
213
0.88
110
0.94
131
Higher school fees
Limited abolition
Ln GDP per capita
Death rate
Life expectancy
Youth population
Famine/post famine
year
Country dummy
Year dummy
2
R
No. observations
Notes: Robust standard errors in parentheses. “Dummy” stands for dummy variables for each country and each
year. ∗ Statistically significant at 10-percent level; ∗∗ statistically significant at 5-percent level; and ∗∗∗ statistically
significant at the 1-percent level. The omitted fee category is no school fees.
“–” means famine variable is omitted as it does not overlap with the observations we have on primary completion.
have a substantial negative impact on primary enrollment on average (a 17 to 38 percentage point
reduction). This result from the pooled regression model (1) is consistent with the individual
country coefficient estimates reported in Table 4 based also on the regression model (1). In all
cases, there is a negative association between enrollment and school fees. The largest estimated
coefficients on school fees (in absolute values) are those of Malawi and Uganda, which to a large
degree capture the magnitude of the increases in enrollment observed after fees were abolished in
these two countries (see also figures A.4 and A.6). All coefficients on school fee dummy variables
in Table 4 are statistically significant at the 1 or 5 percent level, with the exception of the school
fee variable for Tanzania.
is lower than that of the school fee dummy, these two coefficients are not statistically different from each other.
16
Table 4: Primary enrollment rate: regression results by country
Independent
variable
Ethiopia
Ghana
Kenya
Malawi
−10.91∗∗ −11.28∗∗∗ −19.85∗∗∗ −64.27∗∗∗
(4.27)
(2.00)
(3.00)
(12.51)
∗∗∗
Higher school fees
–
–
−23.29
−51.29∗∗∗
(2.80)
(11.10)
Limited abolition
–
−13.11∗∗∗
–
−43.70∗∗∗
(2.87)
(10.88)
Ln GDP per capita 62.42∗∗∗ −20.81∗∗ 41.11∗∗
52.46
(5.93)
(8.16)
(15.18)
(44.35)
Death rate
−3.58∗
−1.22
−7.15∗∗∗
0.65
(2.08)
(1.32)
(2.07)
(4.78)
Life expectancy
−0.32
0.32
−1.65
0.83
(1.37)
(1.02)
(1.29)
(4.52)
Youth population
−8.52∗∗∗ −3.53∗∗∗
1.22
−9.96∗∗
(1.82)
(0.68)
(0.81)
(3.95)
Famine/Post-famine 4.98∗
–
–
–
year
(2.60)
School fees
2
R
No. observations
0.97
28
0.88
36
0.87
36
0.94
37
Tanzania
−8.57
(7.38)
–
Uganda
Zambia
−59.65∗∗∗ −20.42∗∗∗
(5.33)
(5.78)
–
–
–
–
–
69.35
(42.95)
−1.11
(3.36)
1.75
(2.43)
0.42
(2.22)
–
−7.38
(23.81)
1.32
(4.39)
0.29
(2.16)
3.27
(6.38)
–
3.97
(13.44)
−7.60∗∗
(3.10)
−5.19∗∗∗
(1.59)
0.32
(3.77)
–
0.95
21
0.97
21
0.57
34
Notes: Robust standard errors in parentheses. ∗ Statistically significant at 10-percent level; ∗∗ statistically significant
at 5-percent level; and ∗∗∗ statistically significant at 1-percent level.
“–” means independent variable not applicable.
Turning to the estimation results for the association between school fees and pupil–teacher
ratios in Table 3, we also find a negative and statistically significant relationship—on average,
amounting to about seven fewer pupils per teacher. Higher school fees and limited abolition are
also negatively related to the pupil–teacher ratio, but the coefficient estimates on these variables
are not statistically significant at conventional levels. It is worth emphasizing that there are
fewer observations of pupil-teacher ratios than of primary enrollment rates, which may in part
explain the relatively low statistical power for inference in the case of limited fee abolition and
higher fees. The negative overall association between fees and pupil-teacher ratios may at first
glance be taken to support the view that fees, by making additional financial resources available
to schools, increase the number of teachers, and may thus contribute to improved school quality.
However, these decreasing pupil–teacher ratios need to be seen in light of the falling enrollment
rates associated with higher school fees, and the enrolment spikes after fee abolition. In fact, in
considering these facts together, our estimation results are more likely to be driven by changes in
the number of students rather than the number of teachers. Unfortunately, it is difficult to shed
17
additional light on these results with country-level regressions, since we have too few observations
for all seven countries.20
The results for our last outcome of interest, the primary completion rate, are somewhat mixed,
in that all of the fee categories have a negative and statistically significant relationship with
completion rates. The presence of school fees is associated with a 5 percentage point fall in
primary completion rates on average, while increased school fees have a much larger negative
relationship with this outcome, with higher fees indicating a 22 percentage point fall in primary
completion. On the other hand, limited abolition also shows a negative (and large, about 12
percentage points) correlation with primary completion. At the individual country level, only
three of the countries (Ghana, Malawi and Zambia) have a large enough number of observations
to allow for reliable inference (see Table A.2). In those cases, there is a statistically significant
negative association between limited abolition and primary completion in Ghana, while Malawi
shows a large and significant negative association between school fees and completion rates, as
well as with higher fees and limited abolition. In Zambia, the raising (or formal introduction) of
school fees is also associated with lower completion rates. Notwithstanding the negative correlation
between completion rates and limited abolition in Ghana and Malawi, and in the sample as a whole,
these findings do not on the whole yield compelling evidence that the presence of fees results in
higher completion rates.
What overall observations might one make regarding the impact of fees on primary school quality
and access based on the results discussed above? Foremost, the econometric analysis suggests that
fees have a strong negative and statistically significant association with enrollment rates. With
regard to school quality, although the results are indicative of a negative association between school
fees and class sizes, there is reason to think that this result is mostly driven by changes in student
enrollment rates and not by changes in the number of teachers, especially around the dates when
fees were abolished. We also find that fees (especially an increase in fees) are negatively associated
with primary completion rates; this is particularly the case for Kenya and Malawi.
5
Robustness
In this section, we discuss the robustness of our results with respect to a number of considerations.
We first discuss whether the policy changes we document were anticipated. Next, we examine
whether deterministic time trends might be responsible for our findings. Then, we ask whether
our conclusions from pooled regression models are sensitive to using standard errors clustered by
country with bootstrapping. Finally, we examine the sensitivity of our results to additional control
20
Nevertheless, the visual evidence we present in the country charts in the appendix suggests that the negative
coefficient on school fees is likely to be identified in the pooled regressions by the jump in pupil–teacher ratios
observed after fee abolition in all seven countries, as opposed to a decrease brought about by fee introduction.
18
variables.
5.1
Anticipated policy changes
One potential issue that may confound the interpretation of our results is the difference between
the timing of policy decisions and actions: if, for instance, families anticipate that school fees will
be abolished, they can postpone sending their children to school, leading initially to a decline in
attendance. Subsequently, when the fees are actually abolished, one would see a dramatic increase
in school attendance. Thus, to prevent such anticipatory behaviour from contaminating the results,
our school fees dummy variables should reflect unanticipated events.
However, the literature we surveyed (Section 3.1) suggests to us that the policy changes we focus
on in this study should be treated as “shocks”, as the vast majority of these policy changes were
implemented rather suddenly without any extensive public consultation. To test this possibility
more formally in the case of primary enrollment rates, we included a dummy variable for each
year before a policy change, and found its estimated coefficient statistically insignificant. Thus,
we conclude that, in our data, primary enrollment rates do not change significantly in anticipation
of changes in school fees.21
There is also a possibility of anticipatory behaviour by the policy makers, whose anticipations
and actions based on these anticipations may influence our results. However, we think that such
issues, if present, would likely strengthen, and not weaken, our findings. First, consider the possibility that policy makers always correctly anticipate increases in enrollment rates. For our findings
to be confounded by other factors, policy makers must consistently abolish fees in anticipation of
higher enrollment and completion rates and these expectations must be systematically driven by a
set of factors that we have not already accounted for. And if these factors are responsible for the
negative association between fees and completion rates, we would be incorrectly attributing our
findings to policy changes, even though fee policies are not the main determinant of the enrollment
rates.
However, it is not only difficult to think of a rationale for abolishing fees when enrollment
and completion rates are expected to rise, it is also difficult to think of a set of common factors
excluded from our analysis and which might be driving the associations that we report here. In
any case, in Section 5 below, we provide a comprehensive robustness analysis to rule out, as much
21
To further strengthen our conclusions, we re-estimated our models without the school fee variable, and looked
at how this affected the predicted and actual changes in our schooling quality and access indicator variables around
the timing of policy changes. We found that school fee controls are not simply picking up prior trends, and that
without the school fee controls the estimates either systematically over-predict the enrollment rates when there are
school fees, or under-predict enrollment rates when there are no school fees (results not reported). We also note that
our reading of the historical literature presented no suggestion that enrolments or completion rates were responsible
for the imposition of primary school fees. These fees were either the legacy of colonial practices (Kenya, Malawi,
and Uganda) or introduced in response to a financial crisis which was unrelated to enrollment and completion rates
in primary schools.
19
as available data permit, the possibility that some omitted factors might be driving our results
and the anticipations of the policy makers.
Second, consider the possibility that policy makers always correctly anticipate decreases in
enrollment rates. If the completion rates are low and the policy makers expect them to decline
even further, then policy makers may actually abolish fees, in order to deflect subsequent public
outcry and political embarrassment. Thus, if our model fails to systematically capture the source
of these expectations, then our estimates would represent an underestimation of school fee policies
on our outcome indicators. This is so because we find a negative association between school fees
and enrollment rates, and, in the absence of a policy intervention, enrollment rates would have
decreased not increased. But, if this is indeed the case, then it would only strengthen our broader
conclusions.22
5.2
Deterministic trends
To rule out the possibility that our estimation results are driven by deterministic trends, we included country-specific linear and linear and quadratic time trends in our baseline model (Table 5).
The estimation results with linear time trends are essentially identical to those with linear and
quadratic time trends. The pooled estimates are generally robust to including country-specific
linear time trends. The exception is the coefficient on school fees for primary completion rates.
Also, with the time trends, when the dependent variable is the pupil–teacher ratio, the estimated
coefficients on school fees and higher school fees are both negative, statistically significant at the
5 percent level, and the two coefficients are not statistically different.23
5.3
Clustered standard errors
Despite having too few clusters for reliable inference, for purposes of completeness, we nevertheless
calculated both the standard errors clustered by country with bootstrapping (Table A.3) and twoway clustering of the standard errors by year and country (Table S.5) using the multi-way clustering
regression method used in Cameron et al. (2011). For clustering by country with bootstrapping,
our inference is identical to those using robust standard errors. For two-way clustering, we find
that for primary enrollment the coefficients that were statistically significant remain so, at least
at the 10% level. For primary completion rates, the statistical significance for the coefficient on
higher fees remains the same, but the other fee coefficients lose their statistical significance, as
does the coefficient on school fees when the pupil–teacher ratio is the dependent variable.
22
So, whatever the precise motivation behind these policy changes, our interest is in estimating their effects on
our educational indicators.
23
For the pupil–teacher ratio regression model with time trends, the coefficient on limited abolition becomes
insignificant (see Table S.1 in the online appendix). We also report the regression results by country with linear and
linear and quadratic time trends in the online appendix.
20
Table 5: Pooled regression results with linear and quadratic time trends
Dependent variable
Independent
variable
Primary Pupil–teacher Primary
Primary Pupil–teacher Primary
enrollment
ratio
completion enrollment
ratio
completion
School fees
Famine/post famine
year
−14.34∗∗∗
(2.83)
−31.96∗∗∗
(3.33)
−23.90∗∗∗
(4.47)
71.16∗∗∗
(13.08)
−1.14
(1.81)
1.47
(1.26)
−1.63
(1.51)
6.33
(4.89)
−6.02∗∗
(2.55)
−7.75∗∗
(3.65)
−0.66
(2.55)
0.75
(13.35)
−0.52
(1.58)
-1.03
(1.09)
2.13∗∗
(0.91)
24.12∗∗∗
(5.86)
Country dummy
Year dummy
Linear time trend
Quadratic time trend
yes
yes
yes
no
yes
yes
yes
no
yes
yes
yes
no
0.91
213
0.92
110
0.96
131
Higher school fees
Limited abolition
Ln GDP per person
Death rate
Life expectancy
Youth population
2
R
No. observations
−0.38
−14.34∗∗∗
(2.39)
(2.82)
∗∗∗
−15.49
−31.97∗∗∗
(5.03)
(3.33)
∗∗∗
−11.80
−23.91∗∗∗
(2.58)
(4.47)
63.33∗∗∗
71.44∗∗∗
(11.39)
(13.04)
−0.32
−1.17
(2.24)
(1.81)
1.62
1.46
(1.24)
(1.25)
0.28
−1.70
(1.29)
(1.51)
–
6.32
(4.88)
−6.01∗∗
(2.54)
−7.76∗∗
(3.64)
−0.69
(2.54)
0.75
(13.30)
−0.54
(1.58)
-1.03
(1.09)
2.14∗∗∗
(0.91)
24.05∗∗∗
(5.85)
−0.38
(2.39)
−15.51∗∗∗
(5.02)
−11.82∗∗∗
(2.58)
63.47∗∗∗
(11.36)
−0.32
(2.24)
1.63
(1.23)
0.26
(1.30)
–
yes
yes
yes
yes
yes
yes
yes
yes
yes
yes
yes
yes
0.91
213
0.92
110
0.96
131
Notes: Robust standard errors in parentheses. “Dummy” stands for dummy variables for each country and each
year. ∗ Statistically significant at 10-percent level; ∗∗ statistically significant at 5-percent level; and ∗∗∗ statistically
significant at the 1-percent level. The omitted fee category is no school fees.
“–” means famine variable is omitted as it does not overlap with the observations we have on primary completion.
21
5.4
Additional controls
We now turn to an extensive robustness analysis to rule out the possibility that our results are
driven by a third factor that is common to the school fee dummy variables and education indicators
we use. To examine the sensitivity of our results to a number of variables that are not directly
included in our analysis, we estimated a battery of models with a number of variables that could
influence our inference. These variables can be grouped as: (1) external shocks; (2) additional
demographic factors; (3) labour force participation; and (4) structural factors.
Given data availability, we considered the following variables for each of these categories: the
terms of trade, external debt to GDP ratio, and foreign aid to GDP ratio (external factors); fertility
rate, birth rate, and age dependency ratio (demographic factors); labour force participation rate;
and rural population as a percent of total population (structural factor). For the terms of trade
and labour force participation rate, the number of observations is substantially smaller than in our
baseline model. Since in those cases we have less statistical power for inference, we relegate the
estimation results with these controls to our online appendix.
Table 6 presents the coefficients estimated using all the controls in our regression model and for
all three indicators (our “extended model”). In addition to the variables included in the baseline
model, this model controls for debt service as a percent of GDP, rural population as a percent
of total population, fertility rate, and age dependency ratio.24 A comparison of the coefficient
estimates on the school fee variables in estimation results reported in Table 3 and the model
with additional controls suggests that our earlier findings are robust: the coefficient estimates on
school fee variables are statistically the same across specifications, and our inference for statistical
significance are essentially the same across these two sets of estimates—though we note that the
point estimates become marginally larger in absolute value with the additional controls, actually
strengthening our earlier conclusions. Moreover, our broader conclusions do not depend on using
clustered standard errors by country with bootstrapping (Table A.4), with the exception that the
coefficient on school fees in the regression model for pupil–teach ratio with additional controls is
not statistically significant when clustered errors are used for inference, whereas it is significant
when we use the estimating equation (1) with clustered errors by country with bootstrapping.
We also introduced each of these additional control variables into our baseline model individually, and estimated the resulting regression model.25 We find that, when introduced individually,
the coefficient estimates on these additional control variables are rarely statistically significant.
24
We excluded labour force participation and the terms of trade from this extended model due to data considerations, and also because the terms of trade was not associated with our education indicators in any of the specifications
we estimated.
25
These results, which are reported in our online appendix, also show that our coefficient estimates on our school fee
indicators are virtually the same across specifications (see Tables S.8–S.10 for robust standard errors and Table S.11
for standard errors clustered by country with bootstrapping).
22
Table 6: Pooled regression results with additional controls
Dependent variable
Independent
variable
Primary
enrollment
Pupil–teacher
ratio
Primary
completion
School fees
−20.48 ∗ ∗∗
(2.73)
−37.55 ∗ ∗∗
(3.34)
−20.46 ∗ ∗∗
(4.25)
50.93 ∗ ∗∗
(7.31)
−1.83
(1.44)
0.63
(1.04)
−10.04 ∗ ∗∗
(2.22)
15.43 ∗ ∗∗
(4.25)
−24.95 ∗ ∗
(11.13)
2.84 ∗ ∗∗
(0.59)
−5.10
(3.21)
2.94 ∗ ∗∗
(0.48)
−7.40 ∗ ∗∗
(2.70)
−3.81
(5.21)
−0.61
(2.94)
−0.52
(7.32)
1.95
(1.23)
1.19
(0.93)
1.37
(1.70)
6.91
(4.21)
−14.15 ∗ ∗
(5.81)
0.69
(0.45)
1.97
(5.12)
−0.27
(0.51)
−7.94 ∗ ∗∗
(2.32)
−19.08 ∗ ∗∗
(4.05)
−11.21 ∗ ∗∗
(2.84)
40.03 ∗ ∗∗
(7.90)
−1.34
(1.57)
−0.50
(1.19)
−1.39
(2.29)
–
−79.63 ∗ ∗
(34.32)
0.32
(0.44)
−16.53 ∗ ∗∗
(5.95)
1.29∗
(0.70)
0.91
213
0.89
110
0.95
131
Higher school fees
Limited abolition
Ln GDP per capita
Death rate
Life expectancy
Youth population
Famine/post famine
Debt service
Rural population
Fertility rate
Age dependency ratio
2
R
No. observations
Notes: Robust standard errors are in parentheses. All regression models also include dummy variables for each
country and each year. ∗ Statistically significant at 10-percent level; ∗∗ statistically significant at 5-percent level;
and ∗∗∗ statistically significant at the 1-percent level. In all regressions, the omitted fee category is no school fees.
“–” means famine variable is omitted as it does not overlap with the observations we have on primary completion.
23
What is more, our inferences concerning the statistical significance of the coefficient estimates on
our school fee variables are not sensitive to individually adding additional control variables.
Next, we estimated the regression models for individual countries with additional control variables, and we report these results in our online appendix (Tables S.12–S.14). Unfortunately, most
of these estimates are based on small numbers of observations relative to the number of controls
in the model, and, as a result, are less reliable for inference.
Finally, we examined the Polity IV (2014) database, which records political regime transitions
at the country level, to see if the timing of these primary school fee policy changes overlapped with
any major shift in political trends. We found that, with the exception of Ethiopia in 1974, when
the introduction of school fees coincided with a coup d’etat, there were no major political shocks
overlapping with changes in school fee policies that we consider in our analysis.
Therefore, we conclude that our findings concerning the effects of school fees on indicators of
access to and quality of primary education are not due to the set of variables that were excluded
from our baseline model, and the coefficient estimates are virtually identical when we introduce
additional controls.
6
Complementing public funding
While access to and quality of education are relevant to the debate on school fees in sub-Saharan
Africa, as our discussion in Section 2.1 underscored, they are not the only issues considered in this
debate. We thus turn our attention to two other important issues raised in Section 2.1.
Strengthening public education. One of the arguments in favour of schools fees was that
fees would inject additional resources into the public education systems and thus eventually create
a strong system that everyone, including the wealthy, would want to be a part of and support.
However, there is little indication that school fees were used to supplement existing government
funding in our sample countries. Table 7 offers a comparison of the share of each government’s total
budget spent on education before and after the introduction of fees. (In Ethiopia and Uganda,
where fees were in place from the beginning of the study period, we look at the initial trend
during the early period of fee implementation, choosing years based on available data.) In most
cases, we see that the share of government budgets spent on education went down after fees were
introduced, suggesting that most governments saw public funding and fees as substitutes rather
than complements. For instance, in our sample, the correlation between education spending as a
percent of total government spending and pupil-teacher ratio is negative and high (−.69, Appendix
Table A.1), which is consistent with the view that primary school fees largely replaced shortfall
in government funding for teachers’ salaries. Ghana is the only country in which government
24
spending on education increased after fees were introduced, and it is perhaps not a coincidence
that the impact on enrollment levels was relatively small in that country.26
This may also suggest another interpretation of the association between the introduction of fees
and declining enrollment rates: fees are simply a proxy for economic crises (an omitted variable
bias), which would have decreased both enrollment in education and government spending. We
note that in several cases fee introduction did in fact coincide with regional economic crises and
rising world interest rates, when most indebted governments were forced to reallocate larger shares
of their revenues to refinancing costs. We have addressed this concern by adding year dummies
and controlling for GDP per capita, as well as by controlling for foreign debt service to GDP
ratio in our extended model. We think that these variables would largely capture the effects of
economic crises on school enrollment. In any case, declining government spending combined with
the decline in enrollment and lack of improvement in primary school quality during the fee era
suggest that fees had small, if any, impact on strengthening support for public education in our
sample countries.27
That said, there is also some anecdotal evidence of accelerated flight by wealthier families to the
private system in the wake of fee abolition. This pattern has been noted in both Kenya (Bold et
al., 2010) and Uganda (Deininger, 2003), where increasing class sizes resulting from fee abolition
have prompted those who can afford to do so to pay for private schooling with qualified teachers
and smaller classes. This raises the possibility that without sufficient funding from other sources
after fee abolition, a system may become entrenched in which only the rich benefit from a high
quality education outside of the public system, and where the elite will have less of a stake in
creating and maintaining a strong public education infrastructure.28
Sense of ownership.
While our research design cannot directly speak to ownership and en-
gagement by parents and the resulting governance issues, it is worth reviewing several studies that
provide relevant evidence from our sample countries. Plank (2007) points to anecdotal evidence
from Malawi which suggests that the introduction of Free Primary Education resulted in a decreased willingness on the part of parents to volunteer their time and resources to the school. In
Uganda, parent-teacher associations, which were primarily in charge of collecting the fees, and
which attained a great deal of influence within the education system, resisted fee abolition—a
move that they saw as part of the government’s broader effort to reassert its own control over how
26
Government spending on education only includes spending from general revenues and thus does not include
school fees.
27
We recognize that the data presented in Table 7 encompasses education at all levels, and not only primary
education. Unfortunately, we were unable to find data on the specific composition of public and private spending
on primary education.
28
In the case of South Africa, Fiske and Ladd (2003) conclude that middle and upper class flight may have been
averted when fees were introduced in the 1990s, had the government increased resources spent on education.
25
Table 7: Government spending on education
Education as a percent of total government spending
Country
Before fees
Ethiopiaa
Ghana
Kenya
Malawi
Tanzania
Uganda
Zambia
18%
17%
18%
13%
18%
17%
13%
After fees
(1975)
(1981)
(1980)
(1975)
(1976)
(1976)
(1985)
11%
19%
15%
8%
13%
12%
7%
(1980)
(1985)
(1985)
(1985)
(1985)
(1983)
(1999)
Notes:
a
Fees were introduced universally in 1974.
Years of observation are in parentheses.
Sources: World Bank (2014). For Ethiopia, government spending on education as a percentage of total government
expenditure from 1994 to 2004 are from World Bank (2009). For Ghana, government spending on education as a
percentage of total government spending was not available after 1995, but we were able to calculate it for 1999 and
2005 using information on government spending as a percentage of GDP, education spending as a percentage of
GDP, and actual GDP values (expressed in constant 2000 U.S. dollars), all from World Bank (2014). We used the
same method for Malawi 2003 and Tanzania 1999.
schools were run (Al-Samarrai, 2003). At the same time, Deininger (2003) finds that the quality of
physical school structures, traditionally determined by community inputs, increased considerably
when fees were abolished in Uganda. In Zambia, 80 percent of respondents to a survey felt that
fees had been successful in instilling a sense of responsibility in both parents and children, and that
the involvement of parents in the management of school resources had improved accountability and
transparency (Kaonga, 2001). However, the same survey also found that eroding public funding
for education had the reverse affect and undermined the sense of ownership.
We view this mixed evidence as indicative of the complex relation between school governance
and parents’ involvement in their children’s education. Overall, if a greater sense of ownership on
the part of parents is a desirable objective, the evidence does not allow us to conclude with any
confidence that school fees are essential or even desirable.
7
Conclusion
Using a range of regression models, we have assessed the impact of school fees on primary enrollment, pupil-teacher ratios, and primary completion rates in seven sub-Saharan African countries
between 1970 and 2008. Our typical point estimates indicate that primary school fees were associated with a 17 percentage point reduction in enrollment rates in primary schools, a decline in
pupil–teacher ratios (a reduction of about 7 pupils per teacher), and a five percentage point drop
26
in primary completion rates.
Thus, the evidence from our seven case-study countries shows that, although primary school fees
were seen as a means to improve basic education in sub-Saharan Africa by creating a new source
of funding, their introduction ultimately decreased enrollment, without achieving significant improvements in the quality of education delivered. As governments reduced their own contributions
following fee introduction, the share of the financial burden for a poor-quality primary education
borne by parents increased. This toxic combination of additional financial barriers and low quality no doubt prevented or discouraged many poor children (regardless of ability) from attending
primary school.
In more recent years, as countries have reversed their fee policies and moved toward abolishment,
major increases in enrollment have taken place. While these developments indicate that primary
schooling has become much more accessible, the recent increases in enrollment represent an abrupt
and, in many cases, unexpectedly large increase in demand for existing resources. Consequently,
this policy change has had a negative impact on the quality of primary education to varying degrees.
We argue that addressing this quality impact, while maintaining the positive advances achieved
in terms of universalising access to education, should be a primary focus for governments. Most
likely, this would involve some degree of commitment to increasing government funding of primary
education following the elimination of user fees—a conclusion echoed in several other studies on
education in sub-Saharan Africa (e.g., Caucatt and Kumar, 2007).
Would poor parents be better off if the governments of these revenue-constrained countries used
their scarce resources to improve the agricultural sector, increase access to credit, and improve offfarm employment opportunities instead, leaving families to pay for their children’s education with
the resulting higher incomes? Do governments have a comparative advantage in these domains
rather than in education? While these are important questions about efficiency worth exploring
further, from an equity perspective, the evidence so far suggests that school fees have functioned
as a regressive tax on poor parents in sub-Saharan Africa.
We recognize that one could make a case for using school fees in combination with targeted
cash transfers to poor parents, like the reportedly successful conditional cash-transfer programs
Oportunidades in Mexico and Bolsa Escola in Brazil (Kattan and Burnett, 2004). However, the
administrative cost of such programs is a serious concern in sub-Saharan Africa. Moreover, in areas
where the vast majority of the families are poor, targeting may not be cost effective. Given our
observation that, in the past, fee-based systems have been accompanied by a drop in government
funding, we also find serious commitment problems inherent in such systems. In any case, if
universal access to primary education is a goal to be upheld, in this study we find little economic
justification for school fees.
27
A
Country charts
28
29
Percentage/# of pupilss per teacher
1975
1985
'84-'85:
famine
1990
year
'91: collapse of
socialist-military "
1995
'95: first mulitparty
elections/school
fees abolished
2000
Figure A.1: Education and income indicators, Ethiopia
1980
Sources: World Bank (2009, 2011).
0
1970
20
40
60
80
100
120
140
school enrolment, primary (%gross)
pupil‐teacher ratio, primary
primary completion rate
public spending on education (% of total government expenditure)
GDP per captia, PPP (right axis)
'94: new
constitution/
beginning of
'73-'74: famine/
decentralization
overthrow of
monarchy; fees
become universal
Ethiopia
2005
0
2010
100
200
300
400
500
600
700
800
constant 2000 international $
30
percentage/# of pupils per teacher
1975
1985
year
1990
1995
'96: fCUBE initiative
launched
2000
Figure A.2: Education and income indicators, Ghana
1980
'87: Beginning of
educational reforms
'83: school fees
introduced
school enrolment, primary (%gross)
pupil‐teacher ratio, primary
primary completion rate
public spending on education (% of total government expenditure)
GDP per capita, PPP (right axis)
Sources: World Bank (2014).
0
1970
30
60
90
120
150
Ghana
2005
'05: full abolition
of school fees
0
2010
300
600
900
1200
1500
constant 2000 international $
31
percentage/# of pupils per teacher
1975
'74: free education
introduced for
grades 1-4
1985
year
1990
1995
2000
2005
'02-'03: Kibaki comes to power;
Figure A.3: Education and income indicators, Kenya
1980
'88: formal
introduction of
cost-sharing
'84: curriculum
changes give rise
to limited fees
school enrolment, primary (%gross)
pupil‐teacher ratio, primary
primary completion rate
public spending on education (% of total government expenditure)
GDP per capita, PPP (right axis)
Sources: Education Policy and Data Centre (2011); World Bank (2014).
0
1970
30
60
90
120
150
180
210
Kenya
0
2010
300
600
900
1200
1500
1800
constant 2000 international $
32
percentage/# of pupils per teacher
1975
1985
year
1990
1995
'94: new government
elected; all primary school
fees eliminated
2000
Figure A.4: Education and income indicators, Malawi
1980
'82: school
school enrolment, primary (%gross)
pupil‐teacher ratio, primary
primary completion rate
public spending on education (% of total government expenditure)
GDP per captia, PPP (right axis)
'91: school fee
abolition begins
(first standard only)
Sources: Education Policy and Data Centre (2011); World Bank (2009, 2014).
0
1970
30
60
90
120
150
180
210
Malawi
2005
0
2010
100
200
300
400
500
600
700
800
constant 2000 international $
33
percentage/# of pupils per teacher
1975
year
1990
1995
'96: imposition of
harsher liberalization
policies
2000
'01: school fees
eliminated
Figure A.5: Education and income indicators, Tanzania
1985
mid '80s: Nyerere steps down,
beginning of economic liberalization;
school fees introduced
1980
'77: merging of Tanganyika
and Zanzibar ruling parties
GDP per capita, PPP (right axis)
public spending on education (% of total government expenditure)
primary completion rate
pupil‐teacher ratio, primary
school enrolment, primary (%gross)
Source: World Bank (2014).
0
1970
30
60
90
120
150
Tanzania
2005
0
2010
300
600
900
1200
constant 2000 international $
34
percentage/# of pupils per teacher
1980
1985
1990
1995
2000
year
Figure A.6: Education and income indicators, Uganda
Source: World Bank (2014).
0
1970
2005
0
2010
200
600
800
30
'85: Museveni
comes to power
'96: school fees
eliminated
1000
400
1975
'79: government of
Idi Amin overthrown
'92: publication
of White Paper
on education
school enrolment, primary (%gross)
pupil‐teacher ratio, primary
primary completion rate
public spending on education (% of total government expenditure)
GDP per capita, PPP (right axis)
1200
60
90
120
150
180
Uganda
constant 2000 international $
35
percentage/# of pupils per teacher
1975
mid 1970s: fall in
copper prices; severe
economic decline and
rising debt
year
1990
1995
2000
'02: school fees
eliminated
Figure A.7: Education and income indicators, Zambia
1985
'91: new government,
end of single party rule,
beginning of economic
liberalization
'96: school fees
introduced
school enrolment, primary (%gross)
pupil‐teacher ratio, primary
primary completion rate
public spending on education (% of total government expenditure)
GDP per capita, PPP (right axis)
1980
Source: World Bank (2014).
0
1970
20
40
60
80
100
120
140
160
Zambia
2005
0
2010
200
400
600
800
1000
1200
1400
1600
1800
2000
constant 2000 international $
Table A.1: Correlations: primary education indicators and government spending on education
Primary enrollment
Pupil-teacher ratio
Primary completion
Education as a % of
government spending
Primary
enrollment
Pupil–teacher
ratio
0.10
−0.69
0.28
0.09
0.52
−0.46
36
Table A.2: Primary completion rate: regression results by country
Independent
variable
Ethiopia
Ghana
Kenya
Malawi
Tanzania
Uganda
Zambia
Higher school fees
1.58
(3.95)
–
-4.31
(4.28)
–
-1.90
(4.50)
–
8.11
(6.00)
–
4.60
(7.33)
–
-21.21**
(7.63)
–
Limited abolition
–
–
–
–
–
33.31**
(11.96)
-2.70
(1.91)
-0.17
(1.41)
-5.51*
(2.70)
-5.50*
(2.85)
12.93
(29.99)
-2.54*
(1.42)
-0.13
(1.93)
-0.62
(1.83)
-2.18
(22.37)
-0.65
(3.09)
7.17**
(2.11)
-6.88***
(1.25)
-39.20***
(9.34)
-27.87***
(5.46)
-21.25***
(4.63)
40.27**
(19.33)
-1.82
(2.00)
-2.81
(2.47)
-1.88
(2.10)
192.82
(171.72)
2.76
(7.70)
-4.39
(8.58)
3.84
(6.52)
48.74***
(9.91)
2.99
(2.57)
-1.80
(1.78)
–
-11.76
(15.12)
-6.93**
(2.57)
-1.52
(1.56)
-8.44
(7.59)
0.94
18
0.80
22
0.91
13
0.90
33
0.58
13
0.96
9
0.78
23
School fees
Ln GDP per person
Death rate
Life expectancy
Youth population
R-Squared
Observations
Notes: Robust standard errors in parentheses. ∗ Statistically significant at 10-percent level; ∗∗ statistically significant
at 5-percent level; and ∗∗∗ statistically significant at the 1-percent level. The omitted fee category is no school fees.
“–” means independent variable not applicable.
37
Table A.3: Pooled regression results (SE clustered by country with bootstrapping)
Dependent variable
Independent
variable
Primary
enrollment
Pupil–teacher
ratio
Primary
completion
School fees
−17.11 ∗ ∗∗
(5.29)
−37.94 ∗ ∗∗
(11.51)
−21.49∗
(11.04)
45.61 ∗ ∗
(22.77)
−0.86
(3.74)
0.54
(1.43)
2.60
(4.02)
17.33 ∗ ∗
(6.86)
−6.73∗
(4.05)
−4.15
(3.52)
−1.30
(7.27)
−0.26
(15.11)
1.62
(1.46)
0.59
(1.55)
1.55
(1.07)
5.78∗
(3.51)
−4.93
(8.28)
−22.45 ∗ ∗∗
(7.18)
−12.55∗
(7.11)
30.99∗
(16.47)
−1.94
(3.48)
−0.47
(2.57)
0.45
(1.74)
–
0.88
213
0.89
110
0.94
131
Higher school fees
Limited abolition
Ln GDP per capita
Death rate
Life expectancy
Youth population
Famine/post famine
year
2
R
No. observations
Notes: Standard errors clustered by country with bootstrapping (1000 repetitions) are in parentheses. All regression
models also include dummy variables for each country and each year. ∗ Statistically significant at 10-percent level;
∗∗
statistically significant at 5-percent level; and ∗∗∗ statistically significant at the 1-percent level. In all regressions,
the omitted fee category is no school fees.
“–” means famine variable is omitted as it does not overlap with the observations we have on primary completion.
38
Table A.4: Pooled regression results with additional controls (SE clustered by country with bootstrapping)
Dependent variable
Independent
variable
Primary
enrollment
Pupil–teacher
ratio
Primary
completion
School fees
−20.48 ∗ ∗∗
(5.96)
−37.55 ∗ ∗∗
(7.90)
−20.46∗
10.63)
50.93 ∗ ∗∗
18.14)
−1.83
(2.65)
0.63
(1.39)
−10.04 ∗ ∗∗
(3.73)
15.43 ∗ ∗∗
(5.07)
−24.95
74.47)
2.84
(2.06)
−5.10
(5.26)
2.94 ∗ ∗∗
(1.13)
−7.40
(5.17)
−3.81
(5.88)
−0.61
(6.67)
−0.52
(14.75)
1.95
(2.00)
1.19
(2.56)
1.37
(1.90)
6.91**
(3.48)
−14.15
(98.80)
0.69
(1.39)
1.97
(5.51)
−0.27
(1.04)
−7.94
(6.32)
−19.08 ∗ ∗∗
(6.84)
−11.21
(6.87)
40.03 ∗ ∗
(17.93)
−1.34
(2.82)
−0.50
(1.27)
−1.39
(4.32)
–
Higher school fees
Limited abolition
Ln GDP per capita
Death rate
Life expectancy
Youth population
Famine/post famine
Debt service
Rural population
Fertility rate
Age dependency ratio
−79.63
(54.51)
0.32
(4.05)
−16.53 ∗ ∗∗
(6.31)
1.29
(1.11)
Notes: Standard errors clustered by country with bootstrapping (1000 repetitions) are in parentheses. All regression
models also include dummy variables for each country and each year. ∗ Statistically significant at 10-percent level;
∗∗
statistically significant at 5-percent level; and ∗∗∗ statistically significant at the 1-percent level. In all regressions,
the omitted fee category is no school fees.
“–” means famine variable is omitted as it does not overlap with the observations we have on primary completion.
39
References
Ablo, E., and Reinikka, R. (1998). Do budgets really matter? Evidence from public spending
on education and health in Uganda. Washington, D.C.: The World Bank Policy Research,
Working Paper No. 1926.
Akyeampong, K., Djangmah, J., Oduro, A., Seidu, A., and Hunt, F. (2007). Access to basic education in Ghana: The evidence and the issues. Sussex, England: CREATE.
Al-Samarrai, S. (2003). Financing primary education for all: Public expenditure and education outcomes in Africa. Brighton, UK: Institute of Development Studies. Retrieved from
www.dfid.gov.uk
Angrist, J. D., and Lavy, V. (1999). Using Maimonides’ rule to estimate the effect of class size on
scholastic achievement. Quarterly Journal of Economics, 114(2), 533–575.
Ashford, L. S. (2006). How HIV and AIDS affect populations. Washington, DC: Population
Reference Bureau. Retrieved from www.prb.org
Atkinson, A. B. (1974). The Economics of Inequality. Oxford: Clarendon Press.
Barro, R. J. (2000). Education and economic growth. Harvard University Department of Economics Working Paper. Retrieved from www.oecd.org/
Bedi, A. S., Kimalu, P. K., Mandab, D. K., and Nafula, N. (2004). The decline in primary school
enrollment in Kenya. Journal of African Economies, 13(1), 1–43.
Birdsall, N., and Orivel, F. (1996). Demand for primary schooling in rural Mali: Should fees be
increased? Education Economics, 4(3), 279–296.
Bold, T., Kimenyi, M., Mwabu, G., and Sandefur, J. (2010). Does abolishing fees reduce school
quality? Evidence from Kenya. CSAE Working Paper Series 2011–04.
Boone, P., Fazzio, I., Jandhyala K., Jayanty, C., Jayanty, G., Johnson, S., Ramachandrin, V.,
Silva, F., and Zhan, Z. (2013) The surprisingly dire situation of children’s education in rural
West Africa: Results from the CREO Study in Guinea-Bissau (Comprehensive Review of
Education Outcomes), NBER Working Paper No. 18971.
Bray, M. (1988). School fees–philosophical and operational issues. In M. Bray and K. Lillis (Eds.),
Community financing of education: Issues and policy implications in less developed countries.
Oxford: Pergamon Press, 55–74.
Bray, M., and Lillis, K. (Eds.). (1988). Community financing of education: Issues and policy
implications in less developed countries. Oxford: Pergamon Press.
Cameron, A. C., Gelbach, J. B., and Miller, D. L. (2008). Bootstrap-based improvements for inference with clustered errors. The Review of Economics and Statistics, 90(3), 414–427.
Cameron, A. C., Gelbach, J. B., and Miller, D. L. (2011). Robust inference with multiway clustering. Journal of Business and Economic Statistics, 29 (2), 238–249.
Case, A., and Deaton, A. (1999). School inputs and educational outcomes in South Africa. Quarterly Journal of Economics, 114(3), 1047–1084.
Caucutt, E. M., and Kumar, K. B. (2007). Education for all. A welfare-improving course for
Africa? Review of Economic Dynamic, 10, 294?-326.
Daniel, J., Kanwar, A., and Uvali´c-Trumbi´c, S. (2006). A tectonic shift in global higher education. Change, 38(4), 16–23.
40
Deininger, K. (2003). Does cost of schooling affect enrollment by the poor? Universal primary
education in Uganda. Economics of Education Review, 22(3), 291–305.
Dobbelsteen, S., Levin, J., and Oosterbeek, H. (2002). The causal effect of class size on scholastic
achievement: Distinguishing the pure class size effect from the effect of changes in class
composition. Oxford Bulletin of Economics and Statistics, 64(1), 17–38.
Education Policy and Data Centre. (2011). www.epdc.org
Fiske, E. B., and Ladd, H. F. (2003). Balancing public and private resources for basic education:
School fees in post-apartheid South Africa. Terry Sanford Institute of Public Policy Working
Paper SAN03-03.
Galor, O., and Zeira, J. (1993). Income distribution and macroeconomics. Review of Economic
Studies, 60, 35?-52.
Kadzamira, E., and Rose, P. (2003). Can free primary education meet the needs of the poor?:
Evidence from Malawi. International Journal of Educational Development, 23(5), 501–516.
Kaluba, L. H. (1986). Education in Zambia: The problem of access to schooling and the paradox
of the private school solution. Comparative Education, 22(2), 159–169.
Kaonga, M. (2001). Cost sharing in basic education in Zambia: A community analysis. Will
the poor go to school? Cost sharing in education in Zambia. Lusaka, Zambia: OXFAMZambia/Jesuit Centre for Theological Reflection. Retrieved from www.jctr.org.zm
Kattan, R. B., and Burnett, N. (2004). User Fees in Primary Education. Education Sector, Human Development Network. Washington, DC: The World Bank.
Klees, S. J. (1984). The need for a political economy of educational finance: A response to
Thobani. Comparative Education Review, 28(3), 424–440.
Kremer, M., and Holla, A. (2009). Improving education in the developing world: What have we
learned from randomized evaluations? Annual Review of Economics, 1, 513–542.
Kremer, M., Brannen, C., and Glennerster, R. (2013). The challenge of education and learning in
the developing world. Science, 340, 297–300.
Krueger, A. B. (1999). Experimental estimates of education production functions. Quarterly
Journal of Economics, 114(2), 497–532.
Krueger, A. B., and Lindahl, M. (2001). Education for growth: Why and for whom? Journal of
Economic Literature, 39, 1101–1136.
Lavy, V. (1996). School supply constraints and children’s educational outcomes in rural Ghana.
Journal of Development Economics, 51(2), 291–314.
Owens, J. (2004). A review of the social and non-market returns to education. Education and
Learning Network, Wales. Retrieved from www.arsyllfadysgu.com
Plank, D. (2007). School fees and Education for All: Is abolition the answer? USAID Working
Paper. Retrieved from www.equip123.net/
Polity IV. (2014). Polity IV Project: Political Regime Characteristics and Transitions, 1800–2013.
systemicpeace.org/polity/polity4.htm
Psacharopoulos, G. (1995). The profitability of investment in education: Concepts and methods.
World Bank Human Capital Development and Operations Policy Working Paper. Retrieved
from http://commdev.org
Psacharopoulos, G., and Patrinos, H. A. (2004). Returns to investment in education: A further
update. Education Economics, 12(2), 111–134.
41
Reddy, S., and Vandemoortele, J. (1996). User financing of basic social services: A review of
theoretical arguments and empirical evidence. UNICEF staff working paper series. New
York: Office of Evaluation, Policy and Planning, UNICEF.
Roschanski, H. (2007). Deprived children and education: Ethiopia. Amsterdam: International
Research on Working Children. Retrieved from www.childlabour.net
The Millennium Development Goals Report 2010. (2010). New York: The United Nations. Retrieved from www.un.org/milleniumgoals/
Thobani, M. (1984). Charging user fees for social services: Education in Malawi. Comparative
Education Review, 28(3), 402–423.
Tiongson, E. R. (2005). Education policy reforms. In A. Coudouel and S. Paternostro (Eds.),
Analyzing the distributional impact of reforms: A practitioner’s guide to trade, monetary
and exchange rate policy, utility provision, agricultural markets, land policy, and education
(Vol. 1). Washington, DC: The World Bank.
Tooley, J. (2005). Is private education good for the poor? University of Newcastle Working Paper.
Retrieved from http://ccs.in
Tooley, J., Dixon, P., Shamsan, Y., and Schagen, I. (2010). The relative quality and cost-effectiveness
of private and public schools for low-income families: A case study in a developing country.
School Effectiveness and School Improvement, 21(2), 117–144.
UNESCO. (2010). Education for All Global Monitoring Report: Sub-Saharan Africa’s Education
Challenge. www.unesco.org
UNESCO. (2013). World Inequality Database on Education (WIDE). www.education-inequalities.org
Vavrus, F., and Moshi, G. (2009). The cost of a “free” primary education in Tanzania. International Critical Childhood Policy Studies Journal, 2(1), 31–42.
Vos, R., Bedi, A., Kimalu, P. K., Manda, D. K., Nafula, N., and Kimenyi, M. S. (2004). Achieving Universal Primary Education: Can Kenya afford it? University of Connecticut Working
Paper 2004-47.
Wedgwood, R. (2005). Education and poverty reduction in Tanzania. Presented at the international Conference on Education and Development, Oxford. Retrieved from www.hakielimu.org
World Bank. (2009). Abolishing school fees in Africa: Lessons from Ethiopia, Ghana, Kenya,
Malawi, and Mozambique. Washington DC: World Bank/Unicef.
World Bank. (2014). World Development Indicators. The World Bank.
42
Online Appendix
S
Supplementary Material
for
School Fees and Access to Primary Education: Assessing Four
Decades of Policy in sub-Saharan Africa
March 20, 2015
S.1
Supplementary tables
Table S.1: Pupil–teacher ratio: Regression results by country
Independent
variable
Ethiopia
Ghana
Kenya
Malawi
Tanzania
Uganda
Zambia
Higher school fees
-10.14
(6.36)
–
-3.38
(2.77)
–
-23.49***
(1.70)
–
1.01
(5.19)
–
–
-0.91
(1.48)
-1.50
(13.04)
-0.46
(1.48)
0.06
(0.90)
-0.40
(0.64)
–
–
–
–
67.31*
(32.93)
4.78***
(1.33)
0.75
(1.05)
-0.89
(0.86)
–
48.79***
(8.35)
23.83***
(5.27)
13.36***
(3.61)
-0.10
(15.32)
-3.49**
(1.47)
4.04***
(1.26)
4.24**
(1.76)
–
-12.12**
(4.77)
–
Limited abolition
10.40*
(5.27)
-3.85
(2.84)
–
-8.25
(41.25)
-2.98
(2.79)
-0.65
(2.84)
-1.27
(2.36)
–
-21.20
(14.75)
-1.00
(2.13)
-0.78
(1.04)
5.69
(4.51)
–
4.18
(10.14)
-0.47
(3.34)
-2.84
(1.69)
8.92**
(2.94)
0.76
16
0.94
16
0.86
18
0.90
14
0.96
15
0.69
16
School fees
Ln GDP per person
Death rate
Life expectancy
Youth population
Famine/post famine
year
R-Squared
Observations
-8.06
(18.94)
-7.50*
(3.47)
-2.97
(2.95)
-2.98
(3.40)
20.57**
(7.95)
0.87
15
Notes: Robust standard errors in parentheses. ∗ Statistically significant at 10-percent level; ∗∗ statistically significant
at 5-percent level; and ∗∗∗ statistically significant at the 1-percent level. The omitted fee category is no school fees.
“–” means independent variable not applicable.
S.1
Table S.2: Primary enrollment rate: Regression results by country (with time trends)
Ethiopia
Ghana
Kenya
Malawi
School fees
-11.14** -9.20** -9.63*** -8.77*** -19.85*** -18.05*** -66.04*** -69.89***
(4.30) (3.64)
(2.24)
(2.12)
(3.00)
(2.44) (13.50) (12.27)
Higher school fees
–
–
–
–
-23.29*** -23.14*** -54.82*** -69.12***
(2.80)
(2.40) (14.42) (12.32)
Limited abolition
–
–
-11.84*** -10.67***
–
–
-45.88*** -51.82***
(2.51)
(2.16)
(13.29) (12.15)
Ln GDP per person 66.05*** 38.46*** -7.59 -32.11** 41.11** 19.93*
53.72
60.43
(6.13) (9.40) (10.27) (11.96) (15.18) (11.38) (45.18) (39.14)
Death rate
-2.28
0.91
-0.25
-1.93 -7.15*** -0.51
-1.27
-5.90
(2.03) (1.29)
(1.62)
(1.54)
(2.07)
(2.30)
(5.58)
(5.06)
Life expectancy
-2.43 -6.32*** 0.08
1.01
-1.65
-1.89
1.04
-4.49
(2.20) (1.95)
(0.95)
(0.99)
(1.29)
(1.23)
(4.83)
(4.93)
Youth population
-8.27*** -4.29**
0.02
2.55
1.22
6.86*** -8.41*
-6.75*
(1.81) (1.76)
(1.95)
(2.06)
(0.81)
(1.84)
(4.63)
(3.72)
Famine/post famine
3.94
-1.08
–
–
–
–
–
–
year
(2.49) (1.36)
Linear time trend
Quadratic time trend
yes
no
yes
yes
yes
no
yes
yes
yes
no
yes
yes
yes
no
yes
yes
R-Squared
Observations
0.97
28
0.98
28
0.89
36
0.92
36
0.87
36
0.92
36
0.94
37
0.96
37
Tanzania
School fees
Ln GDP per person
Death rate
Life expectancy
Youth population
Uganda
Zambia
-8.58
-8.31 -59.95*** -60.24*** -9.34**
-4.06
(7.56) (7.84)
(5.29)
(5.65)
(4.38)
(5.34)
83.88
99.34 -39.38* -22.83 61.99*** 3.53
(87.99) (105.31) (20.50) (56.00) (16.70) (16.03)
-1.60
-2.04
2.66
2.13
-2.17
-1.37
(4.12) (4.45)
(4.59)
(4.50)
(1.52)
(1.42)
1.02
1.82
1.47
2.27
-0.13
2.50*
(4.27) (4.64)
(2.37)
(3.85)
(0.96)
(1.40)
-0.86
-1.48
4.14
4.74
-1.48
1.22
(6.86) (7.70)
(6.73)
(7.77)
(2.50)
(1.75)
Linear time trend
Quadratic time trend
yes
no
yes
yes
yes
no
yes
yes
yes
no
yes
yes
R-Squared
Observations
0.95
21
0.95
21
0.97
21
0.97
21
0.84
34
0.88
34
Notes: Robust standard errors in parentheses. ∗ Statistically significant at 10-percent level; ∗∗ statistically significant
at 5-percent level; and ∗∗∗ statistically significant at the 1-percent level. The omitted fee category is no school fees.
“–” means independent variable not applicable.
S.2
Table S.3: Pupil–teacher ratio: Regression results by country (with time trends)
Ethiopia
School fees
Higher school fees
Limited abolition
Ghana
-10.10 -23.08*** -5.35**
(6.93)
(6.05)
(2.07)
–
–
–
–
–
Ln GDP per person
-8.58
-90.02*
(24.90) (36.95)
Death rate
-7.21
-9.39*
(5.67)
(4.79)
Life expectancy
-3.27
-0.57
(6.42)
(6.26)
Youth population
-3.00
15.31
(3.61)
(8.75)
Famine/post famine 20.45** -56.49
year
(7.78) (33.15)
Kenya
-5.05*
(2.40)
–
-2.24
(1.75)
-7.19
(8.95)
-0.10
(0.84)
1.41
(0.86)
-3.64*
(1.84)
–
-2.18
(1.88)
-1.59
(15.15)
0.11
(1.13)
1.33
(0.89)
-3.83
(2.21)
–
Malawi
11.07*
(5.80)
-3.93
(2.94)
–
8.67** 50.16*** 48.41***
(3.60) (8.63) (10.57)
-2.97 27.21*** 25.12**
(1.70) (7.82)
(9.14)
–
14.91*** 13.88***
(3.91) (3.78)
75.54* 58.96** -5.23
-8.31
(38.05) (21.72) (16.89) (20.38)
4.21**
3.44*
-1.78
-1.94
(1.56)
(1.54) (3.52)
(3.60)
1.14
0.71
3.69**
2.62
(1.22)
(0.99) (1.50)
(2.59)
-2.83
-0.64
2.46
2.17
(2.57)
(2.90) (3.93)
(4.32)
–
–
–
–
Linear time trend
Quadratic time trend
yes
no
yes
yes
yes
no
yes
yes
yes
no
yes
yes
yes
no
yes
yes
R-Squared
Observations
0.87
15
0.92
15
0.87
16
0.87
16
0.94
16
0.96
16
0.87
18
0.87
18
Tanzania
Uganda
Zambia
School fees
-11.67** -4.16 -22.31*** -22.40*** 6.79** 10.81**
(4.88)
(4.69)
(1.27)
(1.26)
(2.96)
(3.53)
Ln GDP per person -48.96 297.27 86.76*** 82.92*** 39.22*** -26.10
(60.90) (173.54) (18.82) (21.55) (9.72) (32.08)
Death rate
-2.03
-1.29
-1.70
-1.40
6.97** 7.40**
(3.77)
(3.08)
(1.12)
(1.20)
(2.62)
(2.56)
Life expectancy
0.60
0.55
-2.86*** -3.17*
3.31
5.13**
(3.54)
(3.87)
(0.72)
(1.51)
(1.85)
(2.21)
Youth population
6.23
-11.47
-3.46
-4.17
5.88** 10.19***
(5.60)
(9.36)
(2.85)
(4.01)
(2.11)
(2.82)
Linear time trend
Quadratic time trend
yes
no
yes
yes
yes
no
yes
yes
yes
no
yes
yes
R-Squared
Observations
0.90
14
0.95
14
0.99
15
0.99
15
0.90
16
0.92
16
Notes: Robust standard errors in parentheses. ∗ Statistically significant at 10-percent level; ∗∗ statistically significant
at 5-percent level; and ∗∗∗ statistically significant at the 1-percent level. The omitted fee category is no school fees.
“–” means independent variable not applicable.
S.3
Table S.4: Primary completion rate: Regression results by country (with time trends)
School fees
Higher school fees
Limited abolition
Ln GDP per person
Death rate
Life expectancy
Youth population
Ethiopia
1.05
1.54
(3.83)
(3.63)
–
–
–
31.36*
(15.13)
-0.14
(3.09)
-2.11
(2.03)
-5.80*
(2.97)
Ghana
-1.62
-2.22
(5.21) (5.39)
–
–
Kenya
Malawi
30.63
31.03 -34.43*** -30.58***
(17.64) (19.74) (8.99)
(5.73)
–
–
-20.54*** -26.86***
(6.26)
(4.54)
–
-3.82
-2.51
–
–
-17.01*** -19.30***
(3.21) (3.05)
(4.92)
(4.23)
17.65
16.70 -15.74 -18.01 -24.09
40.24* 53.41***
(17.29) (29.24) (29.22) (12.32) (21.29) (19.60)
(14.03)
1.04
-1.88
-3.49
3.65
4.01
2.26
1.22
(3.17) (1.80) (1.99) (4.16) (5.17)
(2.53)
(2.05)
-3.67
-1.05
-0.15
-0.05
-0.68
-2.48
-4.81**
(2.43) (2.03) (1.65) (4.67) (5.89)
(2.13)
(1.79)
-4.76
1.72
5.54
22.60
21.21
-4.42
-2.71
(2.97) (2.96) (3.63) (15.37) (14.56) (2.73)
(2.06)
Linear time trend
Quadratic time trend
yes
no
yes
yes
yes
no
yes
yes
yes
no
yes
yes
yes
no
yes
yes
R-Squared
Observations
0.95
18
0.95
18
0.81
22
0.86
22
0.94
13
0.94
13
0.91
33
0.96
33
School fees
Ln GDP per person
Death rate
Life expectancy
Youth population
Tanzania
7.22
3.97
(7.46)
(8.87)
255.09 -129.33
(247.68) (182.72)
1.91
2.44
(8.16)
(8.36)
-7.34
-9.56
(11.68) (8.61)
-0.27
17.23
(16.05) (16.67)
Uganda
31.26
25.00
(77.20) (86.70)
71.91
33.26
(72.57) (131.32)
3.68
4.81
(3.48) (7.08)
-3.42
-3.90
(5.17) (7.27)
–
–
Zambia
-2.42
-1.25
(5.38) (5.61)
25.17 -12.39
(14.68) (28.09)
-1.63
-1.98
(1.19) (1.22)
3.30*** 4.00***
(0.97) (1.08)
-1.72
-0.46
(2.83) (2.72)
Linear time trend
Quadratic time trend
yes
no
yes
yes
yes
no
yes
yes
yes
no
yes
yes
R-Squared
Observations
0.59
13
0.71
13
0.96
9
0.97
9
0.93
23
0.94
23
Notes: Robust standard errors in parentheses. ∗ Statistically significant at 10-percent level; ∗∗ statistically significant
at 5-percent level; and ∗∗∗ statistically significant at the 1-percent level. The omitted fee category is no school fees.
“–” means independent variable not applicable.
S.4
Table S.5: Pooled regression results (SE clustered by country and year)
Dependent variable
Independent
variable
Primary
enrollment
Pupil–teacher
ratio
Primary
completion
School fees
-17.11**
(7.80)
-37.94***
(12.41)
-21.49*
(11.96)
45.61***
(17.40)
-0.86
(2.01)
0.54
(1.74)
2.60
(1.75)
17.33*
(10.15)
-6.73
(5.49)
-4.15
(7.43)
-1.30
(5.69)
-0.26
(9.54)
1.62
(1.35)
0.59
(1.53)
1.55**
(0.73)
5.78
(7.05)
-4.93
(3.94)
-22.45***
(5.55)
-12.55
(7.78)
30.99***
(11.84)
-1.94
(1.94)
-0.47
(1.34)
0.45
(1.13)
–
yes
yes
yes
yes
yes
yes
0.883
213
0.885
110
0.940
131
Higher school fees
Limited abolition
Ln GDP per person
Death rate
Life expectancy
Youth population
Famine/post famine
year
Country dummy
Year dummy
2
R
Observations
Notes: Robust standard errors clustered by country and year are reported in parentheses. “Dummy” stands for
dummy variables for each country and each year. ∗ Statistically significant at 10-percent level; ∗∗ statistically
significant at 5-percent level; and ∗∗∗ statistically significant at the 1-percent level. The omitted fee category is no
school fees.
“–” means famine variable is omitted as it does not overlap with the observations we have on primary completion.
S.5
Table S.6: Pooled regression results with additional controls (SE clustered by country and year)
Dependent variable
Independent
variable
Primary
enrollment
Pupil–teacher
ratio
Primary
completion
School fees
-20.48***
(6.65)
-37.55***
(7.81)
-20.46*
(10.87)
50.93***
(17.29)
-1.83
(2.01)
0.63
(1.93)
-10.04***
(3.84)
15.43*
(8.36)
-24.95
(16.92)
2.84***
(0.71)
-5.10
(4.63)
2.94***
(0.95)
-7.40
(7.52)
-3.81
(11.49)
-0.61
(7.36)
-0.52
(11.97)
1.95
(2.08)
1.19
(2.42)
1.37
(2.82)
6.91
(10.03)
-14.15*
(8.21)
0.69
(1.03)
1.97
(13.49)
-0.27
(1.11)
-7.94**
(3.65)
-19.08***
(4.53)
-11.21*
(6.68)
40.03***
(14.11)
-1.34
(2.31)
-0.50
(1.69)
-1.39
(4.31)
–
yes
yes
yes
yes
yes
yes
0.91
213
0.89
110
0.95
131
Higher school fees
Limited abolition
Ln GDP per person
Death rate
Life expectancy
Youth population
Famine/post famine
year
Debt service
Rural population
Fertility rate
Age dependency ratio
Country dummy
Year dummy
2
R
Observations
-79.63*
(47.43)
0.32
(0.53)
-16.53**
(6.75)
1.29
(1.15)
Notes: Robust standard errors clustered by country and year are reported in parentheses. “Dummy” stands for
dummy variables for each country and each year. ∗ Statistically significant at 10-percent level; ∗∗ statistically
significant at 5-percent level; and ∗∗∗ statistically significant at the 1-percent level. The omitted fee category is no
school fees.
“–” means famine variable is omitted as it does not overlap with the observations we have on primary completion.
S.6
Table S.7: Pooled regression results with additional controls, including labour force participation
Dependent variable
Independent
variable
Primary
enrollment
Pupil–teacher
ratio
Primary
completion
School fees
−24.36 ∗ ∗
(11.38)
−32.41 ∗ ∗∗
(9.95)
−29.08 ∗ ∗∗
(10.53)
98.54 ∗ ∗
(45.02)
−0.26
(2.37)
1.13
(1.84)
−11.50 ∗ ∗∗
(4.02)
2.50
(2.40)
−26.58
(65.42)
4.65
(3.94)
8.13
(34.40)
1.74
(2.27)
−15.29
(9.53)
−0.14
(9.02)
−6.54
(6.55)
13.81
(21.20)
1.98
(1.47)
1.06
(1.94)
0.63
(2.94)
1.76
(2.03)
−21.41
(95.80)
3.49
(4.35)
9.23
(14.39)
−1.74
(1.71)
−4.35
(3.87)
77.28
(51.89)
−10.52
(11.44)
62.69∗
(32.90)
0.04
(1.23)
2.32
(2.86)
−4.84 ∗ ∗
(2.25)
1.00
(1.55)
−109.77
(177.69)
−6.48 ∗ ∗
(3.17)
−27.74
(28.11)
6.13 ∗ ∗∗
(1.72)
122
92
72
Higher school fees
Limited abolition
Ln GDP per capita
Death rate
Life expectancy
Youth population
Labour force participation
Debt service
Rural population
Fertility rate
Age dependency ratio
No. observations
Notes: Standard errors clustered by country with bootstrapping (1000 repetitions) are in parentheses. All regression
models also include dummy variables for each country and each year. ∗ Statistically significant at 10-percent level;
∗∗
statistically significant at 5-percent level; and ∗∗∗ statistically significant at the 1-percent level. In all regressions,
the omitted fee category is no school fees. Famine variable is not omitted because it does not overlap with the control
variables.
S.7
S.8
0.88
213
-17.11***
(3.00)
-37.94***
(4.08)
-21.49***
(4.93)
45.61***
(7.09)
-0.86
(1.42)
0.54
(0.98)
2.60***
(0.79)
0.87
164
-17.74***
(3.55)
-35.29***
(3.70)
-25.39***
(4.68)
32.32***
(11.07)
0.84
(1.70)
2.32**
(1.17)
3.07***
(0.93)
-0.00
(0.04)
(2)
0.88
213
-18.51
(14.30)
-17.53***
(3.13)
-37.77***
(3.98)
-21.51***
(4.91)
44.81***
(7.05)
-0.64
(1.45)
0.70
(1.00)
2.58***
(0.78)
(3)
0.88
213
24.28
(20.48)
-16.08***
(3.16)
-37.03***
(4.14)
-21.66***
(4.90)
48.90***
(8.19)
-1.15
(1.47)
0.31
(1.00)
2.46***
(0.82)
(4)
0.88
213
-0.08
(0.77)
-17.19***
(2.77)
-38.08***
(3.73)
-21.49***
(4.98)
45.65***
(7.12)
-0.77
(1.61)
0.56
(0.98)
2.66**
(1.13)
(5)
0.88
213
0.15
(3.42)
-17.08***
(2.88)
-37.89***
(3.89)
-21.50***
(4.96)
45.64***
(7.20)
-0.87
(1.43)
0.54
(0.98)
2.58**
(1.04)
(6)
0.90
122
2.09***
(0.69)
-15.00***
(4.08)
-30.99***
(5.03)
-28.81***
(5.18)
110.77***
(17.76)
2.67
(2.49)
1.62
(1.45)
-0.11
(1.43)
(7)
0.89
213
2.13***
(0.60)
-17.59***
(2.89)
-39.35***
(4.07)
-19.87***
(4.65)
52.59***
(7.85)
-0.14
(1.39)
1.73*
(1.05)
0.49
(1.14)
(8)
1.97***
(0.48)
0.89
213
-17.82***
(2.91)
-35.34***
(3.74)
-22.30***
(4.90)
44.31***
(7.25)
-2.60*
(1.48)
-0.65
(0.99)
-4.53**
(2.07)
(9)
Notes: Robust standard errors are in parentheses. All regression models also include dummy variables for each country and each year. ∗ Statistically significant at 10-percent level; ∗∗ statistically
significant at 5-percent level; and ∗∗∗ statistically significant at the 1-percent level. In all regressions, the omitted fee category is no school fees. Controls for famine omitted in some estimates due to the
lack of overlapping available years of data.
Labour force
participation
Rural
population
Age
dependency
2
R
N
Fertility rate
Birth rate
Life
expectancy
Youth
population
Terms of
trade
Debt service
(% of GDP)
Official aid
Limited
abolition
Ln GDP
per capita
Death rate
Higher fees
School fees
(1)
Table S.8: Primary enrollment rate: Pooled regression results with additional controls
S.9
0.88
110
-6.73***
(2.47)
-4.15
(4.34)
-1.30
(3.29)
-0.26
(6.91)
1.62
(1.17)
0.59
(0.87)
1.55***
(0.43)
0.89
100
-8.20***
(2.81)
-3.58
(4.27)
-0.04
(3.11)
-2.46
(11.14)
1.35
(1.25)
0.18
(0.98)
0.88
(0.68)
-0.05
(0.03)
(2)
0.89
110
-14.20**
(5.81)
-7.61***
(2.40)
-4.04
(4.39)
-1.34
(3.22)
-2.23
(7.07)
1.89
(1.17)
0.81
(0.88)
1.46***
(0.44)
(3)
0.88
110
-3.37
(15.81)
-6.90***
(2.37)
-4.26
(4.52)
-1.35
(3.30)
-0.84
(6.57)
1.72
(1.28)
0.67
(0.96)
1.56***
(0.45)
(4)
0.89
110
0.51
(0.74)
-6.34**
(2.49)
-3.50
(4.80)
-1.27
(3.31)
-0.27
(6.92)
1.00
(1.58)
0.40
(0.95)
1.18
(0.73)
(5)
0.88
110
-1.19
(4.10)
-6.91***
(2.54)
-4.49
(5.11)
-1.30
(3.30)
-0.36
(6.94)
1.73
(1.30)
0.61
(0.90)
1.75**
(0.87)
(6)
0.87
92
-0.02
(0.61)
-9.60***
(3.28)
-2.85
(5.96)
-2.31
(3.79)
-6.96
(14.97)
2.44
(1.60)
0.74
(1.12)
1.96**
(0.94)
(7)
0.89
110
0.68*
(0.40)
-6.98***
(2.48)
-4.29
(4.44)
-0.51
(3.02)
0.98
(7.16)
1.61
(1.14)
0.84
(0.92)
0.84
(0.60)
(8)
-0.44
(0.38)
0.89
110
-6.48**
(2.54)
-4.44
(4.14)
-1.42
(3.15)
0.20
(7.07)
2.03*
(1.21)
0.86
(0.90)
3.10**
(1.48)
(9)
Notes: Robust standard errors are in parentheses. All regression models also include dummy variables for each country and each year. ∗ Statistically significant at 10-percent level; ∗∗ statistically
significant at 5-percent level; and ∗∗∗ statistically significant at the 1-percent level. In all regressions, the omitted fee category is no school fees. Controls for famine omitted in some estimates due to the
lack of overlapping available years of data.
Labour force
participation
Rural
population
Age
dependency
2
R
N
Fertility rate
Birth rate
Life
expectancy
Youth
population
Terms of
trade
Debt service
(% of GDP)
Official aid
Limited
abolition
Ln GDP
per capita
Death rate
Higher fees
School fees
(1)
Table S.9: Pupil–teacher ratio: Pooled regression results with additional controls
S.10
0.94
131
-4.93**
(2.39)
-22.45***
(3.92)
-12.55***
(3.08)
30.99***
(7.43)
-1.94
(1.44)
-0.47
(0.93)
0.45
(0.83)
0.94
96
1.55
(3.32)
-20.28***
(5.12)
-12.98***
(2.97)
40.24***
(12.43)
-1.76
(1.64)
0.34
(1.20)
1.80**
(0.86)
0.12***
(0.04)
(2)
0.94
131
-47.56
(35.85)
-5.21**
(2.44)
-21.83***
(3.84)
-12.37***
(3.10)
33.82***
(8.38)
-1.60
(1.47)
-0.20
(0.97)
0.48
(0.85)
(3)
0.94
131
-2.01
(20.65)
-4.99*
(2.56)
-22.53***
(4.06)
-12.57***
(3.10)
30.87***
(7.74)
-1.90
(1.47)
-0.44
(0.97)
0.47
(0.85)
(4)
0.95
131
-2.17**
(0.83)
-7.50***
(2.30)
-21.99***
(3.75)
-12.22***
(2.83)
34.52***
(7.50)
0.67
(1.59)
0.13
(0.88)
2.04**
(0.99)
(5)
0.94
131
-10.92**
(4.20)
-6.09***
(2.26)
-22.29***
(3.86)
-12.07***
(2.87)
33.69***
(6.91)
-1.16
(1.41)
-0.34
(0.87)
2.39**
(1.10)
(6)
0.92
72
1.90**
(0.79)
-2.98
(4.41)
-30.25***
(5.32)
-15.38***
(3.43)
83.68***
(25.17)
0.40
(3.33)
0.47
(2.01)
0.93
(1.64)
(7)
0.94
131
0.89*
(0.47)
-4.14
(2.50)
-22.54***
(3.85)
-12.25***
(2.98)
36.58***
(7.88)
-1.59
(1.44)
0.13
(0.99)
-0.31
(0.81)
(8)
0.38
(0.60)
0.94
131
-5.26**
(2.43)
-21.82***
(4.03)
-12.49***
(3.15)
30.46***
(7.66)
-2.31
(1.66)
-0.74
(1.09)
-0.91
(2.48)
(9)
Notes: Robust standard errors are in parentheses. All regression models also include dummy variables for each country and each year. ∗ Statistically significant at 10-percent level; ∗∗ statistically
significant at 5-percent level; and ∗∗∗ statistically significant at the 1-percent level. In all regressions, the omitted fee category is no school fees. Controls for famine omitted in some estimates due to the
lack of overlapping available years of data.
Labour force
participation
Rural
population
Age
dependency
2
R
N
Fertility rate
Birth rate
Life
expectancy
Youth
population
Terms of
trade
Debt service
(% of GDP)
Official aid
Limited
abolition
Ln GDP
per capita
Death rate
Higher fees
School fees
(1)
Table S.10: Primary completion rate: Pooled regression results with additional controls
Table S.11: Pooled regression results with additional controls (SE clustered by country with bootstrapping)
Dependent variable
Independent
variable
Primary
enrollment
Pupil–teacher
ratio
Primary
completion
Terms of trade
−0.00
(0.05)
−17.74 ∗ ∗
(7.67)
−35.29 ∗ ∗
(14.18)
−25.39 ∗ ∗
(10.24)
164
−0.05∗
(0.03)
−8.20 ∗ ∗
(3.86)
−3.58
(4.09)
−0.04
(5.84)
100
0.12
(0.08)
1.55
(7.46)
−20.28 ∗ ∗∗
(7.52)
−12.98∗
(7.35)
96
−18.51
(78.99)
−17.53 ∗ ∗∗
(5.85)
−37.77 ∗ ∗∗
(10.93)
−21.51∗
(11.67)
−14.20
(114.22)
−7.61 ∗ ∗
(3.42)
−4.04
(3.99)
−1.34
(7.91)
−47.56 ∗ ∗
(23.28)
−5.21
(7.93)
−21.83 ∗ ∗∗
(7.12)
−12.37
(8.76)
24.28
(22.78)
−16.08 ∗ ∗∗
(5.68)
−37.03 ∗ ∗∗
(11.43)
−21.66∗
(11.09)
−3.37
(26.28)
−6.90∗
(3.60)
−4.26
(3.14)
−1.35
(7.84)
−2.01
(48.06)
−4.99
(8.13)
−22.53 ∗ ∗∗
(6.92)
−12.57
(9.31)
1.97∗
(1.15)
−17.82 ∗ ∗∗
(5.02)
−35.34 ∗ ∗∗
(10.58)
−22.30 ∗ ∗
(9.74)
−0.44
(0.90)
−6.48
(4.55)
−4.44
(3.90)
−1.42
(7.21)
0.38
(1.11)
−5.26
(8.14)
−21.82 ∗ ∗∗
(7.73)
−12.49
(8.17)
School fees
Higher school fees
Limited abolition
N
Debt service (% GDP)
School fees
Higher school fees
Limited abolition
Official aid
School fees
Higher school fees
Limited abolition
Age dependency ratio
(% of working-age population)
School fees
Higher school fees
Limited abolition
Continued on next page
S.11
Table S.11: continued
Dependent variable
Independent
variable
Primary
enrollment
Pupil–teacher
ratio
Primary
completion
Fertility rate
0.15
(5.31)
−17.08 ∗ ∗∗
(5.01)
−37.89 ∗ ∗∗
(10.21)
−21.50∗
(11.06)
−1.19
(4.51)
−6.91
(4.83)
−4.49
(4.58)
−1.30
(7.36)
−10.92
(6.75)
−6.09
(8.55)
−22.29 ∗ ∗∗
(6.49)
−12.07
(7.39)
−0.08
(1.08)
−17.19 ∗ ∗∗
(5.47)
−38.08 ∗ ∗∗
(10.49)
−21.49 ∗ ∗
(10.91)
0.51
(0.82)
−6.34
(4.60)
−3.50
(4.61)
−1.27
(7.31)
−2.17∗
(1.27)
−7.50
(8.17)
−21.99 ∗ ∗∗
(7.18)
−12.22∗
(6.39)
2.13
(2.14)
−17.59 ∗ ∗∗
(5.27)
−39.35 ∗ ∗∗
(10.81)
−19.87∗
(12.04)
0.68
(0.88)
−6.98∗
(3.96)
−4.29
(3.66)
−0.51
(6.11)
0.89
(2.75)
−4.14
(8.94)
−22.54 ∗ ∗∗
(8.37)
−12.25∗
(6.91)
2.09
(1.92)
−15.00
(10.91)
−30.99 ∗ ∗∗
(11.86)
−28.81 ∗ ∗∗
(10.47)
122
−0.02
(1.38)
−9.60
(8.64)
−2.85
(10.17)
−2.31
(7.85)
92
1.90
(2.83)
−2.98
(11.98)
−10.17
(20.90)
−15.38
(17.22)
72
School fees
Higher school fees
Limited abolition
Birth rate
School fees
Higher school fees
Limited abolition
Rural population
School fees
Higher school fees
Limited abolition
Labor force participation
(% of total population ages 15-64)
School fees
Higher school fees
Limited abolition
N
Continued on next page
S.12
Notes to Table S.11: Standard errors clustered by country with bootstrapping (1000 repetitions) are in parentheses.
All regression models also include the following variables: LN GDP per capita, death rate, life expectancy, youth
population, a dummy variable for famine/post famine year, and dummy variables for each country and each year,
except when we use labor force participation in which case controls for famine years are omitted as the available data
for labor do not overlap in time with famine years. Unless otherwise stated, N = 213 for the primary enrollment
rate models, N = 110 for the pupil-teacher ratio models, and N = 131 for the primary completion rates models. ∗
Statistically significant at 10-percent level; ∗∗ statistically significant at 5-percent level; and ∗∗∗ statistically significant
at the 1-percent level. In all regressions, the omitted fee category is no school fees.
S.13
Table S.12: Primary enrollment rate: Regression results by country with additional controls
Independent
variable
Ethiopia
Ghana
Kenya
School fees
-11.78*** -10.00*** -14.63***
(4.01)
(3.03)
(3.06)
Higher school fees
–
–
-15.98***
(3.56)
Limited abolition
–
-11.79***
–
(3.28)
Ln GDP per capita
44.04*** -21.11**
8.94
(13.49)
(8.20)
(16.14)
Death rate
0.42
-0.85
-0.20
(1.27)
(1.47)
(2.46)
Life expectancy
-5.58**
0.33
-3.12**
(2.23)
(1.44)
(1.27)
Youth population
-3.70*
0.38
4.52
(1.83)
(2.06)
(3.08)
Famine/post famine
0.09
–
–
(1.63)
Debt service
42.71 -104.36*** 29.60
(225.80)
(26.03)
(72.46)
Rural population
-2.17
0.31
-7.11***
(3.90)
(2.34)
(1.58)
Fertility rate
-39.72***
-5.38
-8.85
(12.13)
(27.63)
(9.71)
Age dependency ratio
2.30
-1.16
2.03
(2.12)
(2.00)
(1.27)
2
R
No. observations
0.98
28
0.92
36
0.94
36
Malawi
-71.77***
(17.76)
-64.52***
(20.66)
-47.33***
(16.38)
56.54
(51.58)
-1.88
(3.86)
-5.23
(5.17)
-5.44
(4.48)
–
Tanzania Uganda
Zambia
-5.53
(8.50)
–
-48.97***
(5.77)
–
-1.81
(6.19)
–
–
–
–
34.84
(61.99)
-0.44
(3.27)
-0.06
(3.15)
-4.48
(4.74)
–
-29.39
(46.86)
0.98
(2.75)
5.95*
(3.17)
-1.97
(12.16)
–
24.66
(22.24)
-1.51
(1.42)
4.04*
(2.26)
0.67
(2.39)
–
-29.01
314.83* -251.59
1.20
(122.21) (155.17) (210.56)
(5.03)
-10.30* -11.90**
-0.87
4.59**
(5.99)
(4.47)
(4.30)
(2.02)
37.58* 144.19**
60.75 -52.49***
(18.40)
(47.61)
(78.94)
(11.41)
-3.35
-9.73*
7.34**
4.43**
(2.25)
(5.06)
(2.81)
(1.64)
0.96
37
0.98
21
0.99
21
0.89
34
Notes: Robust standard errors are in parentheses. ∗ Statistically significant at 10-percent level; ∗∗ statistically
significant at 5-percent level; and ∗∗∗ statistically significant at the 1-percent level. Debt service is measured as a
fraction of GDP. In all regressions, the omitted fee category is no school fees.
“–” means independent variable not applicable.
S.14
Table S.13: Pupil–teacher ratio: Regression results by country with additional controls
Independent
variable
School fees
Ethiopia
Ghana
Kenya
-15.14**
(4.88)
–
-5.71
(5.73)
–
9.73
(14.69)
-2.85
(3.52)
–
Malawi
47.75***
(11.39)
Higher school fees
23.06*
(11.81)
Limited abolition
–
-0.74
13.30*
(2.08)
(5.45)
Ln GDP per capita
-2.12
-12.15
62.70
-5.27
(33.89)
(34.83) (133.27) (30.82)
Death rate
-10.21*** -1.57
3.43
0.10
(1.88)
(2.95)
(3.86)
(4.71)
Life expectancy
4.98
1.48
1.65
3.80
(4.14)
(1.81)
(3.31)
(3.16)
Youth population
13.08**
-3.30
-0.85
7.30
(4.08)
(3.27)
(3.74)
(7.64)
Famine/post famine
-7.21
–
–
–
(9.64)
Debt service
-327.77** -33.35
-22.09
-35.96
(115.30) (77.40) (58.10) (119.51)
Rural population
49.96***
-1.96
0.75
-5.81
(9.95)
(5.81)
(4.20)
(6.32)
Fertility rate
-50.48*** 15.55
5.02
7.76
(10.11)
(33.41) (18.10)
(15.65)
Age dependency ratio
-1.15
1.44
-0.79
-1.76
(4.53)
(3.13)
(1.97)
(2.53)
2
R
No. observations
0.98
15
0.81
16
0.96
16
0.88
18
Tanzania
Uganda
Zambia
-2.19
(6.61)
–
-21.96***
(3.29)
–
12.94
(15.41)
–
–
–
–
218.51
(230.25)
0.16
(3.21)
0.61
(3.71)
-5.68
(14.27)
–
123.19**
(43.27)
-1.84
(1.63)
-3.02
(1.90)
-3.48
(8.04)
–
-12.60
(100.56)
6.51
(5.41)
6.78*
(3.07)
9.41
(14.02)
–
459.48
(730.07)
10.65
(13.86)
5.70
(94.97)
-13.41
(7.72)
102.77
(95.61)
4.59
(3.31)
54.64
(52.01)
-3.60**
(1.12)
1.24
(29.87)
4.77
(3.18)
-40.28
(23.78)
4.04
(4.55)
0.96
14
0.99
15
0.94
16
Notes: Robust standard errors are in parentheses. ∗ Statistically significant at 10-percent level; ∗∗ statistically
significant at 5-percent level; and ∗∗∗ statistically significant at the 1-percent level. Debt service is measured as a
fraction of GDP. In all regressions, the omitted fee category is no school fees.
“–” means independent variable not applicable.
S.15
Table S.14: Pupil–teacher ratio: Regression results by country with additional controls
Independent
variable
Ethiopia
Ghana
Kenya
Malawi
Tanzania
Zambia
Higher school fees
1.54
(1.96)
–
-11.25*
(5.36)
–
37.93
(22.82)
–
24.72**
(7.56)
–
1.51
(10.10)
–
Limited abolition
–
–
–
–
50.95*
(26.43)
1.28
(1.51)
-1.95
(2.58)
-3.58
(2.29)
-91.18
(165.95)
2.17
(3.46)
-28.34*
(14.57)
6.06***
(1.13)
-9.15**
(3.38)
-22.05
(25.91)
-4.60*
(2.40)
1.48
(2.78)
2.97
(5.61)
7.26
(117.97)
-2.06
(6.34)
66.33
(63.87)
-7.92*
(4.28)
15.07
(40.30)
3.77
(5.38)
-5.38
(8.71)
35.79
(26.00)
-155.14
(171.52)
-7.49
(11.98)
-71.21
(75.06)
0.32
(7.01)
-25.50***
(6.60)
-20.43***
(6.91)
-13.55**
(4.95)
30.07*
(16.72)
0.97
(1.67)
-3.30*
(1.62)
-4.46**
(2.00)
-23.50
(47.36)
-11.01***
(1.82)
20.24**
(9.59)
0.46
(0.88)
248.48
(179.10)
1.27
(3.81)
-12.02*
(4.86)
100.07**
(18.21)
-2546.42***
(406.16)
9.96
(9.34)
-257.75**
(57.45)
14.62
(6.21)
-5.26
(31.87)
-2.44
(1.60)
4.88**
(1.84)
-2.03
(6.16)
1.45
(24.79)
3.24
(2.10)
-38.07**
(13.03)
3.79*
(1.91)
0.99
18
0.88
22
0.97
13
0.97
33
0.98
13
0.94
23
School fees
Ln GDP per capita
Death rate
Life expectancy
Youth population
Debt service
Rural population
Fertility rate
Age dependency ratio
2
R
No. observations
Notes: Robust standard errors are in parentheses. ∗ Statistically significant at 10-percent level; ∗∗ statistically
significant at 5-percent level; and ∗∗∗ statistically significant at the 1-percent level. In all regressions, the omitted
fee category is no school fees. Famine variable is omitted as it does not overlap with the observations we have on
primary completion. Debt service is measured as a fraction of GDP. The model for Uganda is not estimated because
of too few observations.
“–” means independent variable not applicable.
S.16
S.2
School fees
Both the opponents and proponents of school fees have advanced numerous arguments to make
their case. Here we review these arguments in some depth.
S.2.1
Arguments for primary school fees
A source of funding. There is no disagreement that many governments in sub-Saharan Africa
face severe revenue constraints and many competing spending priorities. Tax-bases tend to be
relatively small given low income levels. Also, many countries lack sufficient administrative infrastructure to effectively assess incomes and collect taxes. In such circumstances, direct financing of
schools by users may be seen as a cost efficient way to supplement government funding for schools.
In fact, raising tax revenues equivalent to school fees may be prohibitively expensive. Bray (1988),
for instance, notes that Nigeria, Ghana, and Kenya made attempts to abolish fees in the 1960s
and 1970s, but found these policy changes to be financially unsustainable.
Excess demand for education.
It is also possible that the objectives of politicians and parents
may diverge, resulting in underfunding of primary education by governments, whether they have
the means or not. This divergence of objectives then leads to a latent excess demand for higher
quality primary education even among the poor. For instance, Thobani (1984) makes a case
for school fees by arguing that government funding alone can lead to massive under-provision
of education in developing countries, both in terms of access and quality. He suggests that a
fee-based system could lead to improvements in education quality which may well outweigh the
negative consequences of limited access.29 Along similar lines, Birdsall and Orivel (1996) argue
that, because of the existing inefficiencies in the delivery of public education in sub-Saharan Africa,
fees could be used to improve both quality and access, resulting in an increase in demand which
may actually outweigh the decrease due to higher direct costs.30
One manifestation of this excess demand for schooling may be the existence of private schools in
developing countries. Tooley (2005) and Tooley et al. (2010), for instance, argue that small-scale,
low-cost private schools, even without any government funding, provide access to decent schooling
for poor areas and communities in India and parts of sub-Saharan Africa. If this is indeed the case,
initiatives such as Free Primary Education may “crowd out” the more efficient private schools in
poor areas, and may inadvertently compromise the quality of education.
29
According to Bray (1988), Thobani’s views were highly influential at the time, and the government of Malawi
followed his recommendations and increased primary school fees by 25% in 1982. We should note that Thobani
(1984) also advocated for conditional cash transfers targeted to children from poor families.
30
Birdsall and Orivel (1996) argue that, in Mali, education is severely under-provided and that direct and indirect
costs to households may in fact fall with the introduction of fees, building of more schools, and the subsequent
decline in travel times to attend a school.
S.17
Strengthening public education. If fees can relax some of the financial constraints faced by
schools, they may also end up strengthening the popular support for a publicly-provided primary
education system and prevent privatization of schools. For instance, in South Africa, at the end of
apartheid, there was an unprecedented increase in demand for public education. Fiske and Ladd
(2003) note that one important motivation for South Africa’s decision to implement fees in the
1990s was the desire to prevent the flight of the middle and upper classes to the private system in
the wake of increased class sizes. There was a widely held belief that such a flight would result in
declining political interest and investment in the public system: elites would be less motivated to
protect or advocate for the integrity of the public provision of education.31
A sense of ownership.
Another argument advanced in favour of school fees is that parents and
guardians who pay fees directly to their local schools may also feel a greater sense of ownership of
and engagement in their children’s education. Civic engagement may in turn improve the overall
efficiency of the way the schools operate and deliver educational services.32 In addition, Bray
(1988) argues that parents may be more willing to pay school fees than they would be to pay the
equivalent taxes, since they may doubt the effectiveness or reliability of education financing from
general tax revenues.
Arguments against primary school fees
Regressive taxation.
In the absence of equivalent transfers from the rich to the poor, primary
school fees amount to regressive taxation, and may be in conflict with basic tenets of equity. In
principle, the regressive nature of school fees can be addressed through direct income transfers to
the poor. However, critics point out that this has rarely been the case.33 Also, if individual schools
set their fees autonomously, sorting among the rich and the poor can lead to a polarization of
school quality.34 After reviewing the existing evidence, World Bank (2009, p. 15) concludes that
school fees in Africa have been highly regressive. Moreover, shifting to a school fee-based system
could lead to a reduction in school funding from general taxation revenues, a system which is at
least nominally progressive. This is a point we turn to after we discuss our empirical analysis
directly related to access to and quality of education.
31
In Kenya, following the abolition of school fees, enrollment in public schools increased significantly and, according
to Bold et al. (2010), this led to a significant increase in the demand for private schooling by wealthier households.
32
However, Bold et al. (2010) point to evidence which suggest that providing public services free of charge does
not result in a reduced sense of ownership, or in less efficient delivery of that service. Later in the paper, we discuss
the available (and scarce) evidence on the relation between primary education fees and sense of ownership in our
sample countries.
33
Klees (1984) and Reddy and Vandemoortele (1996) discuss the existing evidence and the causes of why targeted
transfers have not been implemented effectively.
34
For instance, in the case of South Africa, Fiske and Ladd (2003) find that, schools in poorer (disadvantaged,
majority black) districts charged the lowest fees and had the most trouble collecting them, resulting in generally
poorer quality of schooling.
S.18
Suboptimal investment in education. From a “human capital” perspective, education is an
investment in skills and future earnings. If returns to education do not justify the cost, some
students will opt not to enrol. In principle, from an efficiency standpoint, school fees may be
preferable to a system of freely provided primary education, where both low and high ability
students end up competing for scarce resources. Yet, this requires a perfectly functioning financial
market in place, whereby poor families with high ability children would be able to borrow against
their expected future income to finance their schooling, and would not be at a disadvantage. In
sub-Saharan Africa, such markets do not exist, and thus, in practice, borrowing against future
labour income is not within the reach of most poor families. Consequently, school fees could
lead to binding borrowing constraints for those children from poor families, and, by extension,
under-investment in education (Atkison, 1974; Galor and Zeira, 1993).
Evidence for such borrowing constraints and their impact on access to primary education can be
partly inferred from the relationship between schooling costs and enrollment rates across income
levels. Klees (1984) discusses the earlier evidence which shows that it is primarily the children
from poor families who drop out of school due to higher costs. Reddy and Vandemoortele (1996)
argue that the poor have a higher price elasticity than the rich for basic social services, including
education, even though they may have excess demand for quality education.35 A 2005 study finds
that in 27 sub-Saharan African countries more than 50 percent of those out of school came from
the poorest income quintile (World Bank, 2009).
Moreover, primary schooling is a decision made by parents (and guardians). Even when borrowing against future income is possible, parents and children may implicitly disagree about the costs
and benefits of primary education. Parents bear the costs (both direct and indirect) of education,
but the direct benefits accrue to their children. With even slight differences in discount rates of
future earnings and uncertainty about transfers between parents and their children, there may be
underinvestment in education (Reddy and Vandemoortele, 1996).
Finally, there may be social returns to primary education above and beyond private returns,
which suggests that over-reliance on private demand for and provision of education will result in
under-investment in primary education from a socially optimal standpoint (Bray, 1988; Deininger,
2003; Owens, 2004). While there is considerable uncertainty about the exact social rates of return
to education (Owens, 2004), there is a reasonable consensus that social returns to education are the
highest at the primary level (Psacharopoulos, 1995; Psacharopoulos and Patrinos, 2004; Tiongson,
2005). Moreover, primary education is a prerequisite for secondary and tertiary education, which
in turn are strongly correlated with future GDP growth rates.36
35
Tooley (2005) discusses a case in which, the majority of poor households moved their children from fee-based to
free schools, even though this also suggested moving to a lower quality education.
36
Barro (2000) and Krueger and Lindahl (2001), among others, estimate the link between educational attainment
and economic growth. Psacharopoulos and Patrinos (2004) review the estimates of both private and social returns to
S.19
Documentation for Coding Fee Dummy Variables
Ethiopia:
• fees did exist in various limited forms from beginning of study period, but become universal
in 1974; so we chose not to make fee dummy = 1 until 1974 (fees = 0 from 1970 to 1973)
• policy to abolish introduced on in 1994, instructions passed on to regions and schools in 1995,
but implementation said to be somewhat slow, so we counted 1996 as the first year with fee
dummy = 0. (World Bank 2009: “although some localities took their time in implementing
the school fee abolition policy, the majority of schools stopped the registration fees by 1996”
(p. 53))
Ghana:
• fees introduced 1983 (fee dummy = 1 from 1983)
• fCUBE implemented in 1996 begins gradual process of eliminating fees working toward full
abolition by 2005
• limited abolition dummy = 1 from 1996 to 2004, and school fees dummy = 0 from 2005 to
2009.
Kenya:
• fees exist at beginning of study period
• abolition of fees in 1974 (fees = 0 from 1974)
• fees re-introduced in 1984 (fees = 1)
• formal introduction of cost-sharing (higher fees = 1) in 1988
• abolition from 2003 onward (fees dummies = 0 from 2003 onward)
Malawi:
• fees were in place from beginning of study period
• higher school fees from 1982 to 1990
investment in education by attainment and by country, and report on average higher returns to primary education.
Lavy (1996) and Roschanski (2007) argue that returns to education may be highly nonlinear, whereby primary
education may be valuable only to the extent that it results in higher levels of education.
S.20
• process of limited abolition begins in 1991 (first standard only)
• then all fees abolished in 1994
• limited abolition dummy = 1 from 1991 to 1993
• school fees dummy = 0 from 1994 onward
Tanzania:
• fees introduced mid-1980s (fees = 1 from 1985)
• fees abolished 2001 (fees = 0 from 2001-2009)
Uganda:
• fees in place from beginning of study period
• full abolition announced in 1996; comes into effect Jan 1, 1997 (fees = 0 from 1997 onward)
Zambia:
• school fees = 1 from 1996 to 2001
• school fees abolished in 2002 (fees = 0 from 2002 onward)
S.21
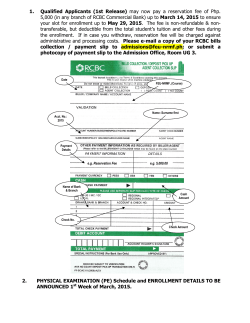


© Copyright 2026