
Effects of uranium mining discharges on water quality in the Puerco
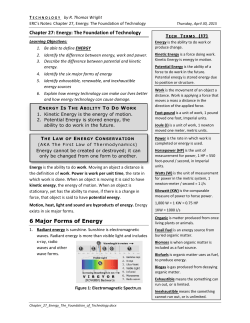
Hydrohgical Sciences -Journal- des Sciences Hyàroïogiques, 37,5,10/1992
463
Effects of uranium mining discharges on
water quality in the Puerco River basin,
Arizona and New Mexico
PETER C. VAN METRE* & JOHN R. GRAY
US Geological Survey, WRD, 375 S. Euclid Avenue, Tucson, Arizona 857011393, USA
Abstract From 1967 until 1986, uranium mine dewatering increased
dissolved gross alpha, gross beta, uranium and radium activities and
dissolved selenium and molybdenum concentrations in the Puerco River as
indicated by time trends, areal patterns involving distance from the mines
and stream discharge. Additionally, increased dissolved uranium concentrations were identified in groundwater under the Puerco River from where
mine discharges entered the river to approximately the Arizona-New
Mexico State line about 65 km downstream. Total mass of uranium and
gross alpha activity released to the Puerco River by mine dewatering were
estimated as 560 M g (560 X 106 g) and 260 Ci, respectively. In comparison, a uranium mill tailings pond spill on 16 July 1979, released an estimated 1.5 Mg of uranium and 46 Ci of gross alpha activity. Mass balance
calculations for alluvial ground water indicate that most of the uranium
released did not remain in solution. Sorption of uranium on sediments and
uptake of uranium by plants probably removed the uranium from solution.
Effets des rejets provenant de l'exploitation des mines
d'uranium sur la qualité des eaux du bassin du fleuve Puereo,
en Arizona et au Nouveau-Mexique
Résumé De 1967 a 1986, les opérations d'essorage des mines d'uranium
ont eu pour effet d'augmenter les radioactivités alpha (valeur approchée),
beta (valeur approchée), uranium et radium en solution, ainsi que les
concentrations en sélénium et molybdène dissous, dans le fleuve Puereo,
comme l'ont mis en évidence les relations liant ces valeurs aux facteurs de
temps, distance aux mine et débit. En outre, des concentrations accrues
d'uranium dissous ont été identifiées dans le réseau de nappes aquifères
sous le fleuve Puereo, dans un secteur s'étendant du point où les effluents
miniers débouchent dans le fleuve jusqu'au voisinage approximatif de la
ligne de démarcation entre l'Arizona et le Nouveau-Mexique, â une
distance d'environ 65 km en aval. Au total, la masse d'uranium et l'activité
alpha (valeur approchée) déversées dans le fleuve Puerco par le procédé
d'essorage minier ont été estimées, respectivement, a 560 Mg (560
X 106 g) et 260 Ci. Par comparaison, le débordement du bassin à résidus
de l'usine d'uranium, survenu le 16 juillet 1979, a rejeté dans le fleuve des
quantités évaluées â 1.5 Mg d'uranium et 46 Ci d'activité alpha (valeur
approchée). Les calculs d'équilibre des masses pour les eaux souterraines
alluviales indiquent que la plus grande partie de l'uranium rejeté n'est pas
restée en solution. L'absorption de l'uranium par les dépôts sédimentaire
et par les végétaux ont probablement éliminé l'uranium de la solution.
*Nowat: USGS-WRD, 8011 Cameron Road, Austin, Texas 78753-6700, USA.
Open for discussion until I April 199S
464
Peter C. Van Metre & John R. Gray
INTRODUCTION
The Puerco River, in the southeastern part of the Colorado Plateau (Fig. 1), is
an ephemeral stream that drains about 7800 km2 along its 230 km length. The
headwaters are in the uranium-rich Grants Mineral Belt of northwestern New
Mexico. Uranium mine dewatering from 1967 until 1986 and a tailings pond
dike failure in July 1979 resulted in releases of radionuclides and other trace
constituents to the Puerco River (Weimer etal., 1981; Gallaher & Cary, 1986).
110°30'
110°
30'
109°/-.
20
0
20
30'
108°
40 MILES
40 KILOMETERS
Fig. 1 Puerco River basin in Arizona and New Mexico.
Previous studies of the effects of uranium mining discharges on water
quality in the Puerco River basin have documented greater selenium,
molybdenum and uranium concentrations and gross alpha activities in minerelated discharges than in runoff. Greater concentrations of those constituents
also were found in some shallow wells near the Puerco River between the
mines and Gallup, New Mexico (Gallaher & Cary, 1986), and increased
concentrations of selected radionuclides were found in downstream stream bed
sediments after the 1979 tailings pond failure (Weimer et al., 1981).
In this report, results of a study that expanded on an earlier evaluation
by Gallaher & Cary (1986) are presented. The study included analyses of additional chemical constituents, incorporated data collected after mine dewatering
Effects of uranium mining discharges on water quality
465
ceased in February 1986, and evaluated the relationships of chemical constituents to stream discharge and to distance downstream from the mines. Total
releases of uranium and gross alpha activity by dewatering and by the tailings
pond spill were estimated. The likely fate of uranium released by the mines in
alluvial ground water was evaluated using mass balance calculations.
Data used for these analyses were primarily from four sources: the US
Geological Survey (USGS), the New Mexico Environmental Improvement
Division (NMEID), the US Environmental Protection Agency (EPA, data
reported to EPA by United Nuclear Corporation and Kerr-McGee Corporation), and the Arizona Department of Health Services. Data collected prior to
October 1988 were compiled by Wirt et al. (1991). Mine dewatering discharge
data were from Perkins & Goad (1980), Gallaher & Cary (1986) and in written
summaries of discharges provided to the EPA by United Nuclear Corporation
and Kerr-McGee Corporation.
The amount of radionuclide in a give volume of water can be measured
and reported either as mass concentration or as activity. The relationship
between the concentration of the radionuclide, in fig Yl, and the activity, in
pCi T1, is calculated from:
C = 10 1905 . W.T.D
(!)
1
where: C = concentration (fig l" ); W = atomic weight; T — half life (s); and
D = activity (pCi l"1).
Equation (1) indicates that the activity of an element is inversely
proportional to the half life, and therefore radionuclides with short half lives
produce larger amounts of activity for the same concentration than radionuclides with long half lives.
History of mining
Beginning in 1960, uranium was mined near Pipeline Arroyo (Fig. 1), a small
tributary to the Puerco River about 35 km northeast of Gallup, New Mexico.
From 1960 to 1961 and from 1967 to 1986, dewatering of as many as three
uranium mines near Pipeline Arroyo maintained continuous stream flow in the
Puerco River from the mouth of pipeline Arroyo to as far as a few kilometres
downstream from Chambers, Arizona (Shuey, 1986). Effluent from the sewage
treatment plant in Gallup, about 37 km downstream from the mines, also
contributed to this continuous flow.
Uranium mine shafts near Pipeline Arroyo averaged 500 m in depth.
Because the ore bodies being mined are below the regional water table, water
seeping into shafts was pumped to prevent mine shaft flooding (Gallaher &
Cary, 1986). From 1967 until 1986, daily discharge rates from mine
dewatering averaged about 0.23 m3 s"1 (Perkins & Goad, 1980; US EPA
records on mine dewatering, 1979-1985).
466
Peter C. Van Metre & John R. Gray
Before the mid-1970s, untreated mine discharges from dewatering operations discharged directly into pipeline Arroyo (Gallaher & Cary, 1986).
Beginning in the mid-1970s, measures were taken to improve the quality of mine
waters discharged to watercourses to comply with limitations specified by
permits of the Federal National Pollution Discharge Elimination System
(NPDES). The mine discharges were treated in ponds using a flocculant and
barium chloride to reduce suspended solids concentrations and to coprecipitate
radium. Dissolved uranium concentrations were reduced by a separate ion
exchange treatment (Perkins & Goad, 1980) which reduced average concentration and activity of these constituents by about 85% from 1975 to 1982 (Table 1).
Implementation of mine discharge treatment for each of the three mines
near Pipeline Arroyo occurred over several years during the mid-1970s.
Uranium mining ceased in February 1985, and mine dewatering ceased in
February 1986.
On 16 June 1979, a tailings pond dike failed at the United Nuclear
Corporation uranium mill near Pipeline Arroyo. An estimated 360 000 m3 of
uranium mine tailings liquid and 1000 Mg of tailings were discharged to the
Puerco River through Pipeline Arroyo (Weimer et al. 1981). The pH of the
tailings liquid was about 1.6, and the total gross alpha activity was estimated
as 130 000 pCi T1 (US EPA, 1982).
Table 1 Comparison of uranium concentrations and radium-226
activities from unfiltered samples of mine effluent in 1975 and
1981-1982
Constituent
Total radium 226 (pCi I'1)
Total uranium natural (m« 1.-•)
Flow- wei ghted means
1975
Number of
samples
1981-1982
Number of
samples
71.2
7.25
23
23
10.5
1.0
15
14
from Gallaher & Gary (1986, p. 82).
EFFECT OF MINE DEWATERING ON WATER QUALITY OF
STREAM FLOW
An assessment of mine-dewatering effects on water quality in the Puerco River
was made by comparing the occurrence of selected water quality constituents
with three factors: time, distance downstream from the mines and discharge.
Constituent concentrations in stream flow at a given location were expected to
decrease with time from the early 1970s until after 1986 as mine discharge
treatment systems were implemented and as mine discharges finally ceased.
Constituent concentrations were also expected to decrease with distance downstream from the mines because of chemical reactions such as sorption on
Effects of uranium mining discharges on water quality
467
stream channel sediments and precipitation and because of dilution by runoff
and treated waste water effluent discharge from the city of Gallup. Additionally, constituent concentrations were expected to vary inversely with
discharge at a given location because of dilution.
Selected water quality constituents analysed for this assessment included
uranium, radium, molybdenum and selenium, which commonly occur in
uranium deposits (Hem, 1985; Gallaher & Cary, 1986; Brandvold et al.,
1981). Additionally, dissolved and suspended gross alpha and gross beta
activities were analysed to assess the overall radiological effect of mine
dewatering on stream water quality and the relative effect of dewatering on
dissolved and suspended activities. Because this analysis focused on evaluation
of effects of mine dewatering on water quality, samples collected on the day
of the tailings pond spill and for 1 month thereafter were excluded. The
1 month period was based on a review of gross alpha activities in the Puerco
River at Gallup (Fig. 1), which returned to pre-spill levels within about
3 weeks after the spill at that location (Wirt et al., 1991).
Almost no sediment was discharged to the Puerco River in mine
dewatering discharges because these discharges were impounded in settling
ponds before being released to the stream. The predominant effect of mine discharges on water quality, therefore, was expected to be on the dissolved phase
and not on the suspended phase of the chemical constituent of concern. If that
hypothesis were correct, the dissolved activities would show distinct inverse
relationships to time, distance downstream and discharge, whereas the suspended
activities would not necessarily exhibit these time trends or areal patterns.
Relationship of constituent concentrations with time
The time series for samples collected near Gallup for each of the eight water
quality constituents included in this analysis are shown on Fig. 2. Only samples
collected in the 6 km reach upstream from the Gallup waste water treatment
plant outfall were used in this analysis to minimize the variance caused by
distance from the mines and dilution by mixing. Correlations (r) and
Spearman's rank correlations (rs; Iman & Conover, 1983) were computed
between time and each constituent as a measure of the linear relationships
between the variables and the ranks of variables (Fig. 2). In this case, the
hypothesis tested was that the population correlation coefficient was equal to 0
(H:r = 0) at a confidence level of 95%. If the magnitude of the test statistic
(r) was greater than t at the 95% confidence level (t95), the hypothesis was
rejected (Haan, 1977; p. 223). Rejection of the hypothesis implies that the
correlation coefficient is not zero, and a statistically significant relationship
exists between that constituent and time for the period of available data.
A statistically significant decrease in activities of dissolved uranium,
radium, gross alpha and gross beta occurred over time, but no significant
changes in suspended gross alpha and gross beta activities or in dissolved
468
Peter C. Van Metre & John R. Gray
3,000
i
Dissolved
alpha
•
•
400
2,000
/r
i
Dissolved
beta
-
•
_#
200
15 1,000
-h [ V
J
i
t-mm
m
•
i
4,000
2,000 -
-
800
400 -
1975
1980
Explanation:
1985
1990
1975
1980
1985
1990
— moving average for samples
Fig. 2 Time series of selected water quality constituents for a
5 km. reach near Gallup, New Mexico; three to six sampling sites
depending on constituent.
molybdenum and dissolved selenium concentrations occurred with time
(Table 2 and Fig. 2). A 2-year moving average of each constituent (shown as
a bold line on Fig. 2) was calculated by taking the mean of all samples within
2-year ranges centred on 1-year intervals; the moving average suggests a
decrease in dissolved concentrations of molybdenum and selenium since the
time that mine dewatering ceased. Suspended gross alpha and gross beta
activities do not show a statistically significant change from the mining phase
Effects of uranium mining discharges on water quality
469
to post-mining phase. This conclusion supports the hypothesis that mine
discharges increased dissolved activities in stream flow but did not increase
suspended activities. The moving averages of dissolved gross alpha activities
and uranium concentrations in the late 1970s were approximately 200 times and
100 times the moving averages in the late 1980s, respectively (Fig. 2).
Table 2 Correlation coefficients and test statistics for water
quality constituents in relation to time in a 5 km. reach near
Gallup, New Mexico
Constituent
t
Dissolved gross
alpha
Dissolved gross
beta
Suspended gross
alpha
Suspended
gross
betaF
Dissolved uranium
Dissolved radium
Dissolved
molybdenum
Dissolved selenium
Conclusion Significant
time trend
(h:r=0)
Test statistic
Correlation
-0.86
-0.86
-0.78
-0.83
-0.18
-0.14
0.25
0.24
-0.55
-0.48
-0.16
-0.57
-0.60
0.22
-0.19
0.14
K
13.0 13.1
2.00
Reject
Yes
8.04 9.61
2.02
Reject
Yes
1.21 0.88
2.04
No
1.57
1.49
2.04
3.99 4.20
2.51 3.41
1.15 1.64
2.04
2.08
2.01
1.54
2.00
Do not
reject
Do not
reject
Reject
Reject
Do not
reject
Dp not
reject
1.10
No
Yes
Yes
No
No
r: correlation coefficient; rs: Spearman's rank correlation coefficient; t: lest statistic
based on r; ts: test statistic based on rs\ t9S: test statistic at the 95% confidence level;
and H:r=0: a statement of the hypothesis that correlation coefficients are equal to zero
being tested by the comparison of t values to t9i.
Relationship of constituent concentrations with distance downstream from
the mines
Relationships between the concentrations of the eight water quality constituents
and distance downstream from the mines for samples collected from 1975 until
1984 are shown on Fig. 3. The bold line on Fig. 3 represents a moving
average of the data calculated as the mean of all samples falling within 20 km
reaches centred on 5 km intervals. Much of the variance about the mean
probably can be attributed to effects of changes in mine discharge treatment
practices over time and to dilution caused by variations in stream discharge.
Concentrations and activities of dissolved constituents decreased with distance
downstream. The reduction in concentration downstream from the Gallup waste
water treatment plant, about 40 km downstream from the mines, was caused
by mixing with waste water containing smaller concentrations of those constituents. A significant trend was not observed between suspended radionuclide
activities and distance, even in the reach downstream from the waste water
treatment plant in Gallup.
Correlation coefficients, r and rs, and test statistics, t and ts and t95, were
determined for each constituent (Table 3). Correlation coefficients that were
470
Peter C. Van Metre & John R. Gray
significantly different from zero were observed for all dissolved constituents
and activities. Decreases in constituent concentrations and activities with
distance downstream from the mines can be attributed to dilution by a combination of runoff and treated waste water and possibly to chemical reactions and
sorption on stream channel sediments. Such inverse relations prove that mine
effluents contained larger concentrations or activities of those constituents
compared with runoff and sewage effluent. Mine dewatering increased
600
3,000
Dissolved
beta
Dissolved
alpha
400
/ in**i 1,000
200
i
. rr
0
5,000
0
4,000
Suspended
beta
Suspended
alpha
-2,500
2,000
41
1
1
Uranium
Radium
•
""•
!=; 1,000
?
\
[
i
0
150
Selenium
3
100
140
Distance downstream from the mines (kmI
Explanation:
—
moving average for samples collected from 1 9 7 5 until 1 9 8 4
Fig. 3 Relationships between distance downstream from the mines
and selected water quality constituents, Puerco River, Arizona and
New Mexico.
Effects of uranium mining discharges on water quality
471
dissolved concentrations of all constituents except radium in the Puerco River
for a distance of 100 km or more downstream from the mines (Fig. 3).
Increased dissolved gross alpha activities, when compared with activities
in runoff, persisted for more than 200 km downstream, possibly to the mouth
of the Puerco River at the Little Colorado River (Fig. 4). The mean dissolved
gross alpha activity of the Puerco River at Chambers, 135 km downstream
from the mines, during dewatering years until early 1986 was 74 pCi l"1
compared with 5.9 pCi l"1 after dewatering ceased.
Table 3 Correlation coefficients and test statistics for water
quality constituents in relation to distance from the mines, 19751984
Constituent
Correlation
Test statistic
*95
Conclusion Significant
trend
(Ir.r = 0)
-0.71
-0.82
7.42
10.5
2.00
Reject
Yes
-0.71
-0.84
7.29
10.9
2.00
Reject
Yes
0.10
-0.19
0.52
1.06
2.04
No
0.22
-0.13
1.21
0.73
2.04
-0.70
-0.76
-0.44
-0.70
-0.66
-0.47
5.99
5.31
4.53
6.06
4.07
4.92
2.04
2.07
1.99
Dp not
reject
Do not
reject
Reject
Reject
Reject
-0.38
-0.49
4.21
5.78
1.98
Reject
Yes
t
Dissolved gross
alpha
Dissolved gross
beta
Suspended gross
alpha
Suspended gross
beta
Dissolved uranium
Dissolved radium
Dissolved
molybdenum
Dissolved selenium
ts
No
Yes
Yes
Yes
/': correlation coefficient; /•,: Spearman's rank correlation coefficient; t: test statistic
based on /•; ; s : test statistic based on rs; t9i: test statistic at the 95% confidence level;
and H:r = 0: a statement of the hypothesis that correlation coefficients are equal to
zero being tested by the comparison of t values to %.
Relationships of constituent concentrations with stream discharge
A few samples of constituent concentrations were analysed concurrent with
measured discharge. Fourteen of those samples were collected for analyses of
five of the six dissolved constituents. The samples were collected at three sites
in the Puerco River between the mines and Gallup from 1975 until 1984
(Fig. 5). Molybdenum was excluded from this analysis because discharge was
known for only four samples from 1975 until 1984. Twenty-three measurements of suspended gross alpha and gross beta activity of the Puerco River at
four sites were made prior to 1986 concurrent with discharge between the
mines and Chambers (Fig. 5). Suspended-phase samples collected between
Gallup and Chambers were included here because, unlike the dissolved-phase
constituents, suspended activities did not appear to be significantly affected by
the addition of waste water treatment plant effluent downstream from Gallup
(Fig. 3).
Peter C. Van Metre & John R. Gray
_
~•
Q.
Z3
j
1
.^___
~cô
O
•
1975 to 1984 sample
•
•• •
•
zr
1988 and 1989 sample
i
•
t•
•
•
•
•
•
•t
•
o
O
Eo
_
O
a3
E
m
si
O
1
:
~
-
•
• •
in
:
-
p -~~~~-~~-~~-^ I
z
Moving averag e for samp es
collected from 1975 until 1984
olora do Ri
City
472
8
U
•
•
1
40
1
80
1.
120
™
_
_
§
l
160
o
in 1988 and 1989 (3
8
O
0
°A
S 01
—.es
s/lean of samples
@ collected
o
:
•
:
_
-
!
200
l r>
240
Z
_
280
Distance downstream from Pipeline Arroyo (km)
Fig, 4 Relationship between distance downstream from the mines
and dissolved gross alpha activity during and after mining, Puerco
River, Arizona and New Mexico,
Correlation coefficients, r, and test statistics, t and t95, relating concentration to the logarithm (base 10) of discharge (Table 4) were computed. The
correlation was significant for dissolved gross alpha and uranium activities and
for suspended gross alpha and gross beta activities. In the case of the suspended
activities, a positive correlation is expected because suspended sediment
concentrations tend to increase with discharge (Fig. 5). The remaining
dissolved constituents showed weak inverse correlations to discharge, and the
hypothesis that the population correlations were significantly different from
zero was not rejected.
ESTIMATION OF TOTAL MASS OF URANIUM AND GROSS
ALPHA ACTIVITY RELEASED BY MINE DEWATERING AND
THE TAILINGS POND SPILL
The total mass of uranium and total gross alpha activity released by mine
dewatering were estimated as 560 Mg and 260 Ci, respectively. Estimates were
made using historical water quality and mine discharge data (Table 5). Because
those data were from a variety of sources and, in some cases, were collected
by undetermined methods (for example, mine discharge flow rates), the
accuracy of the estimates is difficult to assess.
The mass of uranium and gross alpha activity released by the tailings
Effects of uranium mining discharges on water quality
473
pond spill on 16 July 1979 were also estimated. The volume of tailings solution
released was estimated as 360 000 m3 (Weimer et al., 1981). The concentration
of uranium in the tailings solution was measured on 5 February 1979 as
4.1 mg T1 (Weimer et al., 1981; sample collected by R.W. Miller, United
Nuclear Corporation). A representative sample of the tailings solution contained
130 000 pCi l"1 (US EPA, 1982). Multiplying those concentrations by the
volume of tailings solution released in the spill yields 1.5 Mg of uranium and
500
2,000
Dissolved beta
(Gallup to mines)
Dissolved alpha
(Gallup to mines)
o
u
o. 1,000
— 250
0
4,000
4,000
i 2,000
(J
o.' 2,000, r
o
Suspended beta
(Chambers to mines)
Suspended alpha
(Chambers to mines)
_i
_
0
30
60
I
i
30
60
2,000
U
Dissolved uranium
(Gallup to mines)
Dissolved radium
(Gallup to mines)
* 1,000
1_
Dissolved selenium
(Gallup to mines)
3.
E
3
C
<v
05
Discharge (m3 s"1
50
CO
25
Discharge (m =i s"'!
Dissolved-phase samples from
between the mines and Gallup;
suspended phase samples from
between the mines and
Chambers, Arizona
Fig. 5 Relationships between discharge and selected water quality
constituents, Puerco River, Arizona and New Mexico, 1975-1984.
474
Peter C, Van Metre & John R. Gray
Table 4 Corrélation coefficients and test statistics for water
quality constituents in the Puerco River in relation to the logarithm
of discharge, 1975-1984
Constituent
Dissolved gross alpha
Dissolved gross beta
Suspended gross alpha
Suspended gross beta
Dissolved uranium
Dissolved radium
Dissolved selenium
Correlation
r
Test statistic
t
t9i
Conclusion
(Iv.r = 0)
Significant
trend
-0.61
-0.48
0.60
0.81
-0.63
-0.20
-0.46
2.43
1.72
3.53
6.43
2.80
0.73
1.70
2.23
2.23
2.07
2.07
2.18
2.18
2.20
Reject
Do not reject
Reject
Reject
Reject
Do not reject
Do not reject
Yes
No
Yes
Yes
Yes
No
No
r: correlation coefficient; t: test statistic based on /•; t^: test statistic at the 95%
confidence level; and H:r = 0: a statement of the hypothesis that correlation coefficients
are equal to zero being tested by the comparison of ; values to /95.
46 Ci of gross alpha radioactivity. Comparing those amounts with the 560 Mg
of uranium and 260 Ci of gross alpha activity released by dewatering indicates
that an estimated 380 times more uranium and an estimated 6 times more gross
alpha activity were released by dewatering than by the spill. The ratios of
uranium and of gross alpha released by dewatering and by the spill were
2.1 Mg Ci"1 and 0.032 Mg CÏ 1 , respectively.
Dewatering released much larger amounts of uranium and gross alpha
Table 5 Estimated releases of water, uranium, and gross alpha
radioactivity by mine dewatering, 1960-1986
Year
Discharc
Ml ye
Concentration
Gross1 alpha
Uranium
1112 I"'
pCi r
Total release
Gross alpha
Uranium
Ci
Mg
2
796
7.25
3200
5.77
2.55
?3200
796
5.77
2.55
;7.25
3200
4770
34.6
15.3
;7.25
3200
4580
33.1
14.6
2
3200
7.25
4000
28.9
12.7
2
3200
6960
50.4
22.3
7.25
'3200
"i-i 9
2
7160
51.9
7.25
3200
7960
57.7
25.5
2
3200
7.25
7960
57.7
25.5
'3200
7970
57.7
25.5
;7.25
3200
8450
61.3
27.1
"7.25
3
2
0
0
8450
33.8
16.9
;7.25
8950
"2000
17.9
8.95
10700
10.7
6.45
;7.25
Uooo
10000
10.0
6.03
~7.25
'600
10000
10.0
6.03
4
=600
4.0
7700
7.70
4.62
-600
4
0 ">">
7040
7.04
4 ii
2.0
-600
'0.Ï7
5370
5.37
3.22
J600
:1.0
50.19
5970
5.97
3.58
-600
6
:4.0
5
0.19
5970
5.97
3.58
600
2
1.0
559.3
260.1
2
141500
Summary
1.0
1: Perkins & Goad, 1980, Table;1.0
III, p. 22; 2: Gallaher & Cary, 1986, Table 7.2, p. 82;
3: Gallaher & Cary, 1986, Table
;i.o7.1, p. 81; 4: Estimated on assumption of gradual
implementation of treatment; 5:21.0
Gallaher & Cary, 1986, Table 7.3, p. 83; and 6:
summarized from US Environmental Protection Agency records on mine dewatering,
19794985.
1960
1961
1967
1968
1969
1970
1971
1972
1973
1974
1975
1976
1977
1978
1979
1980
1981
1982
1983
1984
1985
'0.0^5
'0.0^5
'0.15
0.15
"0.13
'0.22
'0.23
'0.25
'0.25
'0.25
'0.27
'0.27
'0.28
'0.34
f0.32
6
0.32
6
0.24
6
Effects of uranium mining discharges on water quality
475
activity than did the spill; however, concentrations of alpha emitters other than
uranium, including radium and thorium, were smaller in dewatering discharges.
Concentration of thorium-230 in the tailings solution was 12 000 pCi l"1,
compared with 0 to 210 pCi l"1 in untreated dewatering effluent (Gallaher &
Gary, 1986). Landa (1980; p. 5) noted that, although 90-95% of uranium in
ore is extracted in the milling process, most of the uranium decay products,
which composed about 85% of the total radioactivity in the ore, remain with
the tailings. The smaller concentration of uranium in the tailings compared to
gross alpha activity results in a smaller ratio of uranium to gross alpha activity
in the tailings solution than in dewatering effluent. Most of the gross alpha
activity in the dewatering effluent was caused by uranium, and most of the
gross alpha activity in the tailings solution was caused by alpha emitters other
than uranium.
At near neutral pH in oxidized water, uranium is more mobile than
radium and thorium (Landa, 1980, pp. 11, 16, 17). Thorium is subject to
extensive sorption by clay minerals and humic acid at near neutral pH (Ames
& Rai, 1978). The median percents by weight of suspended sediments finer
than 0.062 mm (silt sized) and 0.002 mm (clay sized) were 93% and 58%
respectively for 21 samples collected from the Puerco River during 1988 and
1989. The median suspended sediment concentration for those 21 samples was
80 000 mg l'1 indicating that large amounts of silt- and clay-sized sediments are
available for sorption in the Puerco River. The maximum gross alpha activity
measured by the US Geological Survey at Gallup on the day of the tailings
pond spill was 38 000 pCi l"1, and of the amount only 5200 pCi l"1 was
dissolved. For those reasons, it was expected that the radionuclides released by
the tailings pond spill would be more likely than radionuclides released by
dewatering to sorb onto sediments and be transported out of the basin or
deposited in aggrading zones of the channel. The much larger amount of
uranium released by dewatering discharges would be more likely to remain in
solution, and, therefore, be more likely to infiltrate the alluvial aquifer underlying the Puerco River.
AN EVALUATION OF THE FATE OF MINE-RELEASED
URANIUM IN ALLUVIAL GROUNDWATER
Mass balance calculations were used to investigate the possible effect of minereleased uranium on alluvial groundwater quality and to evaluate the possible
fate of the uranium. The calculations did not account for spatial variations in
parameters and assumed a homogenous, well-mixed system. Although such an
approach has many limitations and requires many assumptions, it can provide
information on the potential magnitude of the contaminant problem and, in
some cases, can indicate processes affecting the contaminant of interest.
The mass balance calculations assessed whether uranium released by
476
Peter C. Van Metre & John R. Gray
mining is accounted for by the uranium in alluvial groundwater underlying the
reach of the Puerco River that was subject to mine dewatering and flow from
the tailings pond spill. This part of the aquifer, referred to as the modelled
system, consists of groundwater in the alluvial aquifer under the Puerco River
from the mouth of Pipeline Arroyo to Chambers. If observed uranium in
groundwater does not account for mine-released uranium, then the conclusion
is that some uranium is no longer in solution or has migrated away from the
modelled system. The following assumptions were made:
(a) the initial or background concentration of uranium in alluvial
groundwater was zero;
(b) mine dewatering and the tailings pond spill were the only sources of
uranium to the modelled system;
(c)
removal of uranium by entrapment of mine effluent in runoff out of the
modelled system could be estimated by the percentage of time that
discharge exceeded the average mine dewatering discharge of 0.23 m3 s"1
at Gallup, or 23%;
(d) removal of uranium by transport in groundwater to underlying aquifers
was negligible;
(e) uptake of uranium by plants was negligible;
(f)
removal of uranium by groundwater pumping was negligible;
(g) removal of uranium by chemical reactions and sorption was negligible;
and
(h) the alluvial aquifer is a well-mixed system.
Assumptions (a) and (b) are conservative because if they are not met and
some uranium in alluvial groundwater occurs naturally, then it is more likely
that observed concentrations will approximate or even exceed modelled concentrations and no conclusion regarding processes or pathways removing uranium
is possible. Assumptions (c) to (g) represent possible processes or pathways for
the removal of uranium from the system. If modelled uranium concentration
significantly exceeds observed concentrations, then uranium is leaving the
modelled system by one or more of those pathways. Assumption (h) is
necessary to the mass balance calculations and leads to a predicted average
concentration instead of spatially varying concentrations.
Gallaher & Cary (1986) reported that continuous flow from mine
dewatering, mixed with sewage effluent downstream from Gallup, extended
more than 80 km downstream from the mines beyond the Arizona-New Mexico
State line before all the water from these sources had either infiltrated or
evaporated. Shuey (1986) reported that continuous flow from these sources
extended 135 km downstream from the mines. Weimer et al. (1981) reported
that flow from the spill extended 30 to 40 km downstream from the ArizonaNew Mexico State line. During February 1990, perennial flow caused only by
sewage effluent discharge was observed to extend from Gallup to downstream
from Chambers. During warmer, drier conditions in May 1990, perennial flow
evaporated or infiltrated the aquifer within about 20 km downstream from
Gallup and did not reach the Arizona-New Mexico State line. On the basis of
Effects of uranium mining discharges on water quality
411
these observations, the assumption was made that most of the uranium in mine
effluents and the spill infiltrated the alluvial aquifer within the 135 km reach
between the mines and Chambers.
Estimating the volume of water in storage in the alluvial aquifer between
the mines and Chambers required estimates of the areal extent, saturated thickness, and porosity of the alluvial aquifer. The areal extent of the aquifer between
the mines and Chambers was estimated as 210 km2 from aerial photographs and
US Geological Survey quadrangle maps at 1:24 000 scale. Thickness of the
aquifer was estimated using the average saturated thickness of 10 monitor wells
that reached bedrock, drilled in the reach from Manuelito, New Mexico, to
Chambers, Arizona. The average saturated thickness was thus estimated as
21 m. Porosity of the predominantly medium-fine sand aquifer was estimated as
30% (Freeze & Cherry, 1979, p. 37). Using those values, the volume of water
in storage in the alluvial aquifer was estimated as 1.3 x 10¹² 1.
Stream flow was monitored at Gallup from 1940 until 1946 and from
1977 until 1982. Before mine dewatering began, stream flow in the Puerco
River at Gallup exceeded 0.028 m3 s"1 only 20% of the time. During the period
stream flow was monitored coincident with mine dewatering (1977 until 1982),
stream flow at Gallup exceeded the average mine dewatering discharge rate of
0.23 m3 s"1 for 23% of the time. Assuming that all the mine-released uranium
was transported out of the modelled system whenever stream flow at Gallup
exceeded the average mine dewatering discharge rate (assumption (c)) reduces
the estimated mass of uranium used in the mass balance calculations by 23%.
The estimated mass of uranium released by dewatering and the spill, 560 Mg,
was thus reduced to 430 Mg. That mass of uranium was then divided by
1.3 x 10!2 1 to yield a concentration of 330 ^g l"1, equivalent to about
230 pCi I'1.
Calculated uranium concentration was then compared with measured
concentrations. Monitoring wells were sampled in 1988 and 1989 upstream
from the confluence of the Puerco River and Pipeline Arroyo to downstream
from Chambers. Dissolved uranium concentrations in groundwater are shown
for a cross section of the alluvial aquifer under the Puerco River for the
monitored reach on the basis of the 1988 and 1989 samples (Fig. 6; A to A'
on Fig. 1). A zone of increased uranium concentrations in the alluvial aquifer,
in relation to concentrations upstream from Pipeline Arroyo, is approximately
delineated by the 100 jxg T1 contour; however, uranium concentrations greater
than about 10 /u.g I"1 may indicate mine effects. The zone delineated by the
100 fig l"1 contour extends from where mine effluent entered the Puerco River
to approximately the Arizona-New Mexico State line. The zone generally is
shallow, especially downstream from Gallup, where it extends less than a few
metres below the stream bed, and generally does not extend laterally more than
a few tens of metres from the stream bed. Dissolved uranium concentrations
exceeded 330 ^g l"1 in only two samples that were collected 0.7 m and 2-4 m
below the stream bed and 2 km downstream from the mines. Actual uranium
concentrations approximated the calculated concentration of 330 jig l"1 in only
478
Peter C. Van Metre & John R. Gray
ri! i
Z I
o;
H I
*a! '
i
LU
O
LU Jt LU
Land
surface 22
Alluvium
130
198
Ç. 8 7 0 660 A '
160 S• I.Z6.3 "
• 0.30
J
~- - LU
Consolidated rock
LU Z —
O <
0
0
10
10
20 MILES
20 KILOMETERS
VERTICAL SCALE GREATLY EXAGGERATED (x 320)
Explanation
Line of equal concentration of uranium, in fjg I"1
100-
Line of 3 5 /yg I'1 of uranium
r e c o m m e n d e d limit in drinking water set by
US Environmental Protection Agency
"31
Predicted uranium f r o m dissolved gross alpha, inj/Q I"1
6,2
Measured dissolved uranium in fjg I"1
Fig. 6 Occurrence of dissolved uranium in the alluvial aquifer
that underlies the Puerco River, Arizona and New Mexico; samples
collected between December 1988 and November 1989.
a small fraction of the alluvial aquifer from the mines to Chambers as represented by the area encompassed by the 100 fig Ï1 contour line (Fig. 6).
The comparison between measured dissolved uranium concentrations and
calculated concentrations indicates that some of the mine-released uranium left
the system represented by the mass balance calculations. Assumptions (d) to (g)
listed above represent possible processes or pathways for the removal of
uranium from the system that were not accounted for by the calculations. The
only part of the alluvial aquifer where increased uranium (greater than
100 ng l"1) was observed in 1988 and 1989 was near the channel (Fig. 6). The
occurrence of uranium suggests that assumptions (d) and (f) are relatively more
valid and that significant amounts of uranium have not migrated to deeper
aquifers or wells. Uptake of uranium by plants (assumption (e)) was investigated by Webb et al. (1987) who sampled grasses for uranium on the flood
plain of the Puerco River and on higher terraces in five locations in December
Effects of uranium mining discharges on water quality
479
1986 and found concentrations of uranium in samples from the flood plain that
averaged twice the concentrations of samples from the terrace. The relative
significance of uptake of uranium by plants is not known.
Another reasonable explanation for the difference between calculated
uranium concentrations and measured concentrations is the removal of uranium
from solution by chemical reactions and sorption (assumption (g)). One
chemical reaction that could remove uranium from solution is the precipitation
of a mineral containing uranium as a result of supersaturation (Stumm &
Morgan, 1981). Sorption involves many processes, including ion exchange of
charged uranium complexes with cations on clays (Beard et al., 1980),
adsorption on the surfaces of particles, and reactions with organic compounds
that cause adsorption, ion exchange or uptake by plants (Landa, 1980).
Uranium is strongly sorbed into organic compounds or clays (Ames & Rai,
1978). Uranium also can be adsorbed onto particles with amorphous iron
oxyhydroxide coatings, and the amount of adsorption is greatest between pH
levels of 5.5 and 8.5 (Langmuir, 1978; Hsi & Langmuir, 1985). ThepH levels
in samples shown on Fig. 6 were from 7.5 to 8.0.
Removal of uranium from solution by chemical reactions or sorption, and
possibly by plant uptake, is strongly suggested by the mass balance calculations
presented herein. Some of that uranium attached to stream sediments probably
has been transported to the Little Colorado River that discharges to the
Colorado River (Fig. 1). Some may still be on deeper sediments below the
steam bed, on sediments in the alluvial aquifer and on sediments in channel
deposits. Investigations of uranium concentrations in stream bed and nearchannel alluvial sediments could provide evidence to support or refute this
hypothesis.
REFERENCES
Ames, L. L., & Rai, D. (1978) Radionuclide interactions with soil and rock media. Vol. 1, Processes
influencing radionuclide mobility and retention, element chemistry and geochemistry, and
conclusionsand evaluation. US Environmental Protection Agency Report EPA 520/6-78-007-A,
Las Vegas, Nevada, USA.
Beard, H. R., Salisbury, H. B. & Shirts, M. B. (1980) Absorption of radium and thorium from New
Mexico uranium mill-tailings solutions. US Bureau of Reclamation Report 8463.
Brandvold, D. K., Popp, C. J. & Brand void, L. (1981) Transport mechanisms in sediment-rich streams;
heavy metal and nutrient load of the Rio San Jose-Rio Puerco systems. New Mexico Water
Resources Research Institute Report 132.
Freeze, R. A. & Cherry, J. A. (1979) Groundwater. Prentice-Hall, Inc., Englewood Cliffs, New Jersey,
USA.
Gallaher, B. M. & Cary, S.J. (1986) Impacts of uranium mining on surface and shallow groundwaters,
Grants Mineral Bell, New Mexico. New Mexico Environmental Improvement Division Report
EID/GWH-86/2, Santa Fe, New Mexico, USA.
Haan, C. T. (1977) Statistical Methods in Hydrology. Iowa State University Press, Ames, Iowa, USA.
Hem, J. D. (1985) Study and interpretation of the chemical characteristics of natural water. USGS Wat.
Supply Pap. 2254.
Hsi, C. D. <fe Langmuir, D. (1985) Adsorption of uranyl onto ferric oxy hydroxides- Application of the
surface complexation site-binding model. Geochimica 49, 1931-1941.
Iman, R. L. & Conover, W. J. (1983)/! Modem Approach to Statistics. John Wiley, New York, USA.
Landa, E. (1980) Isolation of uranium mill tailings and their component radionuclides from the
biosphere. Some earth science perspectives. USGS Circular 814.
Langmuir, D. (1978) Uranium solution-mineral equilibria at low temperatures with applications to
sedimentary ore deposits. Geochimica 42, 547-569.
480
Peter C. Van Metre & John R. Gray
Perkins, B. L. &Goad M, S. (1980) Water quality data for discharge from New Mexico uranium mines
and mills. New Mexico Environmental Improvement Division report, New Mexico Health and
Environment Department, Santa Fe, New Mexico, USA.
Shuey, C. (1986) The Puerco River: Where did the water go?. In: The Workbook 11(1), 1-10.
Southwest Research and Information Center, Albuquerque, New Mexico.
Stumm, W, & Morgan, J. J. (1981) Aquatic Chemistry. John Wiley, New York, USA.
US EPA (1982) Rio Puerco monitoring program. US Environmental Protection Agency report, San
Francisco, California, USA.
Webb, R. H., Rink, G. R. & Favor, B. O. (1987) Distribution of radionuclide and trace elements in
ground water, grasses and surficial sediments associated with the alluvial aquifer along the
Puerco River, northeastern Arizona: A reconnaissance sampling program. USGS Open-File
Report 87-206.
Weimer, W. C , Kinnison.R. R. & Reeves, J. H. (1981) Survey of radionuclide distributions from the
Church Rock, New Mexico, uranium mill tailings pond dam failure. US Nuclear Regulatory
Commission Report NURGEG/CR-2449, Washington, DC, US.
Wirt, Laurie, Van Metre, P. C. & Favor, B. O. (1991) Historical water-quality data, Puerco River
basin, Arizona and New Mexico. USGS Open-File Report 91-196.
Received 16 September 199J ; accepted 28 March 1992


© Copyright 2026