
GOVERNMENT OF INDIA MINISTRY OF STATISTICS AND PROGRAMME IMPLEMENTATION
GOVERNMENT OF INDIA MINISTRY OF STATISTICS AND PROGRAMME IMPLEMENTATION SARDAR PATEL BHAWAAN, SANSAD MARG, NEW DELHI-110001 http://www.mospi.nic.in 2010 – 2011 Government of India ǦͳͳͲͲͲͳ ǣȀȀǤǤǤ CONTENTS Chapters I II III IV V VI VII VIII IX X XI XII XIII XIV Vision Mission Introduction Development and Highlights National Statistical Commission Central Statistical Office National Sample Survey Office Coordination of Statistical Activities Computer Centre Statistical Services Indian Statistical Institute Twenty Point Programme Infrastructure and Projects Monitoring Member of Parliament Local Area Development Scheme Hindi Promotion Other Activities Page (i) (ii) ϭͲϰ ϱͲϭϭ ϭϮ ϭϯͲϰϲ ϰϳͲϱϱ ϱϲͲϱϴ ϱϵͲϲϰ ϲϱͲϲϳ ϲϴͲϳϳ ϳϴͲϴϵ ϵϬͲϭϭϮ ϭϭϯͲϭϮϬ ϭϮϭͲϭϮϰ ϭϮϱͲϭϮϴ Annexes I 1A IB IC ID IE IF IG 1H II III IV V VI VII VIIIA VIIIB IX X Organisation Charts Ministry of Statistics & Programme Implementation Administration National Statistical Commission Central Statistical Office National Sample Survey Office Computer Center Programme Implementation Wing Abbreviations used Allocation of Business to the Ministry Statement of Budget Estimate 2010-11 Performance of Monthly Monitored Items under TTP - 2006 All India Performance of 20-Point Programme - 1986 Infrastructure Sector Performance ( April - November 2010 ) List of completed Projects during 2010 - 11 (As on 30.11.2010) Total Plan Gross Budgetary Support (GBS) for 2009-10 Total Plan Gross Budgetary Support (GBS) for 2010-11 List of Publications during 2010-11 Category-wise break-up of staff as on 1.1.2011 ϭϮϵ ϭϯϬ ϭϯϭ ϭϯϮ ϭϯϯ ϭϯϰ ϭϯϱ ϭϯϲ ϭϯϳͲϭϯϴϯ ϭϯϵ ϭϰϬͲϭϰϮ ϭϰϯͲϭϰϱ ϭϰϲͲϭϰϳ ϭϰϴͲϭϱϮ ϭϱϯ ϭϱϰ ϭϱϱͲϭϱϲ ϭϱϳ Tables 4.1 4.2 4.3 Principal Characteristics of ASI - 2008-2009 Sector-wise Index of Industrial Production and Growth Rates Trends in per capita energy consumption (PEC)and Energy intensity in India 8.1 8.2 Number of ISS Posts in 1961 and 2011 Position of Grade wise posts in Subordinate Statistical Service (As on 01.12.2010) Summary of projects during 2009 – 10 Summary of Projects during 2010-11(end of November, 2010) Sector-wise summary of Mega and Major Projects (As on 1.12.2010) Summary of Projects completed during 11th Plan (April, 2007 – November 2010) Extent of the time overrun in projects with respect to original schedule (status of projects as on 30.11.2010) Major Factors for Delay (As on 1.12.2010) Year wise funds released of MPLADS (as on 31.12.2010) No. of Requests & Appeal received in year -2010 under RTI 11.1 11.2 11.3 11.4 11.5 11.6 12.1 14.9 Ϯϯ Ϯϰ ϯϭ ϲϱ ϲϲ ϵϵ ϭϬϬ ϭϬϭ ϭϬϯ ϭϬϰ ϭϬϲ ϭϭϲ 127 Charts 4.1 4.2 4.3 Index of Industrial Production (Base 1993 - 94) Monthly Index of Industrial Production (Base 1993 - 94) Industrial Growth (Base 1993 - 94) Ϯϳ Ϯϳ Ϯϳ Photos MoU on ISSP signing ceremony between Governments of India & Government of Karnataka held at Bangalore on December 10, 2010 11th meeting of the Delhi Group on informal Sector held at ILO Hqrs. Geneva during January 27-29, 2010. First meeting of the steering committee on Consultancy Services Wing(CSW) is in progress. A view of meeting of the Official Language Implementation Rajbhasha Chal Vaijayanti is being presented to the Section Officer of Admn.IV Section by the Chairman of Official Language Implementation Committee of the Ministry. A view meeting of Hindi Salahkar Samiti of the ministry being chaired by MOS(I/C) 39 40 41 121 122 123 VISION To be the best and most innovative National Statistical System in the world; and to effectively monitor the programmes and projects for ensuring efficient use of national resources. (i) MISSION (i) To make available reliable and timely statistics and to undertake regular assessment of data needs for informed decision making; (ii) To cater to the emerging data needs in a dynamic socio-economic context, to reduce respondent burden and to avoid unnecessary duplication in data collection and publication; (iii) To adopt and evolve standards and methodologies for statistics generated by various elements of the National Statistical System and to steer its development for further improvement and bridging data gaps; (iv) To ensure and strengthen trust and confidence of all stake holders in the National Statistical System by maintaining confidentiality of data providers and promoting integrity and impartiality of all elements of official statistics ; (v) To provide leadership and coordination to ensure harmonious, efficient and integrated functioning of all the elements of the National Statistical System; (vi) To continue to assess skill requirement, and develop human resource capacity at all levels of the statistical system; (vii) To participate and contribute actively in all international initiatives and to support development of Statistical Systems around the world ; (viii) To facilitate and monitor infrastructure and large central projects to achieve high performance levels through systems improvement and adoption of best practices; and (ix) To facilitate and monitor the implementation of Member of Parliament Local Area Development Scheme (MPLADS), Twenty Point Programme and other programmes and schemes for socio-economic development of the country. (ii) CHAPTER I INTRODUCTION 1.1 The Ministry of Statistics and Programme Implementation came into existence as an independent Ministry on 15.10.1999 after the merger of the Department of Statistics and the Department of Programme Implementation. The Ministry has two wings, one relating to Statistics and the other Programme Implementation. The Statistics Wing re-designated as National Statistical organisation (NSO) consists of the Central Statistical Office (CSO), the Computer Centre and the National Sample Survey office (NSSO) The Programme Implementation Wing has three Divisions, namely, (i) Twenty Point Programme (ii) Infrastructure Monitoring and Project Monitoring and iii) Member of Parliament Local Area Development Scheme. Besides these two wings, there is one National Statistical Commission created through a Resolution of Government of India (MOSPI) and one autonomous Institute viz. Indian Statistical Institute declared as an institute of National importance by an Act of Parliament. The organisational chart of the Ministry is at Annex – IA to IH. 1.2 The Government of India through a Resolution dated 1stJune, 2005 decided to set up the National Statistical Commission (NSC). The setting up of the NSC followed the decision of the Cabinet to accept the recommendation of the Rangarajan Commission, which reviewed the Indian Statistical System in 2001. The Commission consists of a part time Chairman, four part time Members and the Secretary, Planning Commission as ex-officio Member. The Chief Statistician of India is the Secretary to the Commission. The Ministry of Statistics and Programme Implementation attaches considerable importance to coverage and quality aspects of statistics released in the country. The statistics released are based on administrative sources, surveys and censuses conducted by the Centre and State Governments and nonofficial sources and studies. The surveys conducted by the Ministry are based on scientific sampling methods and are supervised by a steering Committee. Data is collected through dedicated field staff, who are regularly trained in the concepts and definitions of the items and the scope of the survey. In line with the emphasis on the quality of statistics released by the Ministry, the methodological issues concerning the compilation of national accounts are overseen by an Advisory Committee on National Accounts, industrial statistics by a Standing Committee on Industrial Statistics and price and Cost of Living indices by a Technical Advisory Committee on price indices. The Ministry compiles datasets based on current data, after applying standard statistical techniques and extensive scrutiny and supervision. 1.3 India is a subscriber to the International Monetary Fund’s (IMF) Special Data Dissemination Standards (SDDS) and is currently fulfilling the Standards. The Ministry maintains an ‘Advance Release Calendar’ for its data categories covered under the SDDS, which is disseminated on the Ministry’s website as well as on the Dissemination Standards Bulletin Board (DSBB) of the IMF. The Ministry releases the datasets covered under the Real Sector of SDDS through press notes and its web-site simultaneously. The Ministry has been designated as the nodal Ministry to facilitate the implementation of the SAARC Social Charter in India. The Ministry organizes technical meetings on a regular basis on various topics to assess the data-gaps in the system and the quality of statistics currently released. The CSO staff participates in meetings and seminars organized by international and regional organizations such as the United Nations Economic and Social Commission for Asia and the Pacific, on statistical compilations and international practices. The Indian statistical system is one of the best systems in the world. The Ministry’s officials have been associated with international agencies on the development of methodologies, particularly in the areas of 1 national accounts, informal sector statistics, large-scale sample surveys, conduct of censuses, service sector statistics, non-observed economy, social sector statistics, environmental statistics and classifications. The contribution of the Ministry’s officials in international meetings on these subjects is highly appreciated. 1.4 Statistics Day: The fourth Statistics Day 2010 was celebrated all over India on 29th June, 2010 by the State Governments, Offices of National Sample Survey Organizations spread throughout the country, Universities, Departments, etc. by organizing Seminars, Conferences, Debates, Quiz Programmes, Lecture Series, Essay Competitions, etc. The Main Function was held at Vigyan Bhavan, New Delhi which was inaugurated by Shri M. Hamid Ansari, Hon’ble Vice-President of India. The function was presided over by Shri Sriprakash Jaiswal, Hon’ble Minister of State (Independent Charge) for Ministry of Statistics and Programme Implementation and Ministry of Coal. Prof R. Radhakrishna, Chairman, National Statistical Commission also graced the occasion and addressed the gathering. National Award in Statistics, constituted in the Honour of Prof. P. V. Sukhatme was also conferred to Dr. Aloke De on the occasion. 1.5 The highlight of Statistics Day 2010 was taking up the theme “Child Statistics” and making concerted efforts throughout the year to bring improvements in the quality of data in this particular field, for objective planning and policy making. On the occasion, a commemorating Brochure, and a poster were also brought out. The Statistical Publications “Mid-Term Statistical Review of MDG Report, 2009”, a CD on “Compendium of selected Indicators of Indian Economy-Special Issue of Time Series data for last 50-60 years on Social Sector” and statistical Publication “Energy Statistics-2010” were also released on the Statistics Day. 1.6 During the year, the Ministry also celebrated the World Statistics Day on 20th October, as per the resolution passed by the United Nation General Assembly to acknowledge the services provided by the Global Statistical System at National and International level, and to help strengthen the awareness and trust of public in official statistics. While the Ministry brought out a poster on the theme ”Celebrating the Many Achievements of Statistics” and publicized the event the day was also celebrated in the field organizations, State Govts., Universities/Institutions by organizing lectures, debates, seminars etc. on the theme. 1.7 (i) (ii) (iii) The Statistics Wing of the Ministry is mandated with the following responsibilities:acts as the nodal agency for planned development of the statistical system in the country, lays down and maintains norms and standards in the field of statistics, involving concepts and definitions, methodology of data collection, processing of data and dissemination of results; coordinates the statistical work in respect of the Ministries/Departments of the Government of India and State Statistical Bureaus (SSBs), advises the Ministries/Departments of the Government of India on statistical methodology and on statistical analysis of data; prepares national accounts as well as publishes annual estimates of national product, government and private consumption expenditure, capital formation, savings, estimates of capital stock and consumption of fixed capital, as also the 2 state level gross capital formation of supra-regional sectors and prepares comparable estimates of State Domestic Product (SDP) at current prices; (iv) maintains liaison with international statistical organisations, such as, the United Nations Statistical Division (UNSD), the Economic and Social Commission for Asia and the Pacific (ESCAP), the Statistical Institute for Asia and the Pacific (SIAP), the International Monetary Fund (IMF), the Asian Development Bank (ADB), the Food and Agriculture Organisation (FAO), the International Labour Organisation (ILO), etc. (v) compiles and releases the Index of Industrial Production (IIP) every month in the form of ‘quick estimates’; conducts the Annual Survey of Industries (ASI); and provides statistical information to assess and evaluate the changes in the growth, composition and structure of the organised manufacturing sector; (vi) organises and conducts periodic all-India Economic Censuses and follow-up enterprise surveys, provides an in-house facility to process the data collected through various socio-economic surveys and follow-up enterprise surveys of Economic Censuses; (vii) conducts large scale all-India sample surveys for creating the database needed for studying the impact of specific problems for the benefit of different population groups in diverse socio-economic areas, such as employment, consumer expenditure, housing conditions and environment, literacy levels, health, nutrition, family welfare, etc; (viii) examines the survey reports from the technical angle and evaluates the sampling design including survey feasibility studies in respect of surveys conducted by the National Sample Survey Organisation and other Central Ministries and Departments; (ix) dissemination statistical information on various aspects through a number of publications distributed to Government, semi-Government, or private data users/ agencies; and disseminates data, on request, to the United Nations agencies like the UNSD, the ESCAP, the ILO and other international agencies; (x) releases grants-in-aid to registered Non-Governmental Organizations and research institutions of repute for undertaking special studies or surveys, printing of statistical reports, and financing seminars, workshops and conferences relating to different subject areas of official statistics. 1.8 The Programme Implementation Wing of the Ministryhas the following responsibilities:(i) (ii) (iii) (iv) monitoring of the Twenty Point Programme (TPP); monitoring the performance of the country’s eleven key infrastructure sectors, viz., Power, Coal, Steel, Railways, Telecommunications, Ports, Fertilizers, Cement, Petroleum & Natural Gas, Roads and Civil Aviation; monitoring of all Central Sector Projects costing `150 crore and above; and Implementation and monitoring of Member of Parliament Local Area Development Scheme (MPLADS). 3 1.9 The Administration Division of the Ministry, inter alia: (i) (ii) functions as the Cadre Controlling Authority to manage the Indian Statistical Service and Subordinate Statistical Service including matters like training, career and manpower planning; and acts as the nodal Ministry for the Indian Statistical Institute and ensures its functioning in accordance with the provisions of the Indian Statistical Institute Act, 1959 (57 of 1959). 2. The Allocation of Business to the Ministry of Statistics and Programme Implementation is placed at Annex - II.A website (http://www.mospi.gov.in) of the Ministry has been designed, created and is being maintained. A large number of Reports of the Ministry have been uploaded for downloading by the users. System of on-line registration has also been introduced for downloading/viewing the reports. 4 CHAPTER II DEVELOPMENTS AND HIGHLIGHTS Some of the important developments and performance highlights in the Ministry, more specifically in the National Statistical Commission, National Accounts, Price Statistics, Economic and Social Statistics, Sample Survey, Member of Parliament Local Area Development Scheme, Project Monitoring and Human Resource Development during 201011 are listed below. 1. National Statistical Commission • National Statistical Commission was reconstituted during 2009-10 as follows: (i) Prof. R. Radhakrishana, Chairman, w.e.f. 30th July 2009 (ii) Shri Suman K. Bery, Member w.e.f. 24th December 2009 (iii) Prof. Anil P. Gore, Member w.e.f. 30th December 2009 (iv) Prof. Shibdas Bandyopadhyay, Member w.e.f. 30th December 2009 (v) Dr. Sudipto Mundle, Member w.e.f. 24th December 2009 ` 2. National Accounts • The Central Statistical Office (CSO) released a press note on Quick Estimates of National income, Consumption Expenditure, Savings and Capital Formation for 200910 on 31.01.2011 and Advance Estimates of National Income for 2010-11 on 07.02.2011. • The GDP at factor cost at constant (2004-05) prices in 2010-11 registered 8.6 % growth, against 8.0 % growth in 2009-10. The growth rate of 8.6 % has been achieved due to the growth rates of over 8% in the sectors of ‘manufacturing (8.8%), construction (8.0%), trade, hotels, transport & communication (11.0 %), and financing, insurance, real estate & business services (10.6 %). Agriculture, forestry and fishing sector is likely to show a growth rate of 5.4 % during 2010-11. • The GDP at current prices for the year 2010-11 is estimated at ` 72,56,571 crore, while the National Income is estimated at ` 64,66,860 crore. The per capita income during 2010-11 at current prices is estimated at ` 54,527. • The Gross Saving Rate at current prices is estimated at 33.7 % of GDP at market prices in 2009-10, as against the saving rate of 32.2 % in 2008-09. • The rate of Gross Capital Formation at current prices is 36.5 per cent in 2009-10 as against 34.5 per cent in 2008-09. 3. Price Statistics • CSO is in the process of compilation of new series of Consumer Price Index (CPI) numbers separately for rural and urban areas covering all segments of the population. These indices would reflect the true picture of price behaviour of various goods and 5 services consumed by the urban and rural population. New series of CPI numbers on Base 2010 = 100 for January 2011 are likely to be released in February 2011.India has decided to participate in the eighth round of International Comparison Programme 2011 being implemented by the World Bank and preliminary work of this programme has been taken up. 4. Economic Statistics: • The results of the Annual Survey of Industries (ASI) 2008-09 have been released. • The publication “National Product Classification for Services Sector(NPCS)-2010” has been released in June,2010. • The monthly All-India Index of Industrial Production (IIP) with Base 1993-94 has been released for the months from February, 2010 to November, 2010. • Energy Statistics-2010 has been released. • The Directories of Establishments employing 10 or more workers for 25 States/UTs have been prepared and uploaded on the ministry’s website. Similar directories for the remaining States/UTs are under compilation. • Publication “Infrastructure Statistics,2010” for the first time has been brought out, which covers the sectors of Transport, Energy, Drinking Water Supply and Sanitation, Irrigation, Communication and Storage. The publication covers time series data from 2002-03 to 2008-09. • Preparatory work for undertaking the Sixth Economic Census(EC) is in progress. The Working Group has finalized the Scope and Coverage and Schedules of Enquiry of the Sixth EC for consideration by the Steering Committee. • Draft Index of Service Production(ISP) for the Sectors of Railways, Airports and Ports have been compiled and uploaded on the ministry’s website. A Similar exercise for Sectors of Post and Telecommunications and Financial Intermediations is in progress. 5. Social Statistics • ‘India Forum on Child Statistics’ (INFOCS) was launched on 29th June, 2010, on the occasion of the Statistics Day 2010 following registration of the forum as a Society under the Societies Registration Act XXI of 1860 with effect from 23rd June, 2010 to foster coordination and collaboration and to improve the scope, content, quality, consistency and reporting of data on children keeping the National Plan of Action for Children 2005 as the basis. • ‘Millennium Development Goals -India Country Report 2009-Mid Term Statistical Appraisal’ has been brought out with a view to show India’s prospect towards achieving the MDG-targets. The report has been published in English and Hindi versions and released by Hon’ble Vice President of India on the occasion of Statistics Day 2010 observed on 29th June 2010. • The Statistical profile of Gender situation in India based on the latest statistics from different sources has been released in the Twelfth issue of ‘Women and Men in India for 2010’. 6 • SAARC Inter-Governmental Mechanism for mid-term review of the achievements of the SAARC Development Goals (SDGs) and Plan of Action on poverty alleviation adopted the draft framework for SDGs report prepared by India in its meeting held in Kathmandu, Nepal during 28-29 September, 2010. A Country Report on SDGs in India has been drafted for release during the year. • On the Occasion of Statistics Day, 2010, celebrated on 29th June 2009, Prof.P.V.Sukhatme National Award in Statistics for the year 2009-10 was conferred on Prof.Alok Dey of Indian Statistical Institute (ISI), Delhi for his outstanding contributions in the field of Statistics. • With the approval of the Full Planning Commission and the Cabinet Committee on Economic Affairs (CCEA) and signing of the loan agreement between Government of India and the World Bank on July 9, 2010, the India Statistical Strengthening Project (ISSP) has taken off as a new Centrally Sponsored Scheme during the year. As on 31st December 2010, 32 States/UTs have joined the scheme. A seed money has been released to 29 States/UTs out of these for preparation of their State Strategic Statistical Plans and related activities. A Memorandum of Understanding has also been signed with the Govt. of Karnataka in December, 2010 and an amount of st `1193.61 lakhs released as the 1 instalment. The estimated cost of ISSP is ` 650.43 crore of which 80% is funded through the World Bank loan (US$ 107 million) and 20% is to be borne by the Government of India. The entire loan amount has since been received by the Government of India in a single tranche. • The manuals on Vital Statistics, Agricultural Prices and Marketing, and Consumer Price Index have been finalized and released through MoSPI website. 6. Training • Training Programmes conducted/to be conducted by NASA/Training Division, CSO during 2010-11 & other initiatives taken during the year are summarised as under . • Probationers of 30th Batch (7) underwent training on various modules of semester III &IV . Eight probationers of 31st batch who joined the service during 2010-11 completed their foundation course and underwent trainings on various modules designed for the first year of their probation. • Twenty refresher training programmes for ISS officers and senior officers of state governments/UT’s were conducted during the year. The new features included (a)Two Advanced Management Programme with overseas learning omponent started from this year, in collaboration with IIM, Lucknow. (b)Development of a module on Gender Statistics and organization of a aining programme on the basis of same by drawing experts from UNDP, IIPA, VV Giri institute of labor, D/o WCD, SSD(CSO) etc. 7 • Eight training programmes were organised exclusively for officers of States /UTs Govt. besides nominating the officers of state Govt./UT’s in various eligible ISS refresher training programmes. • A twelve week duration training for Officers inducted into JTS of ISS from SSS was conducted. • A three-week course on “Official Statistics” was conducted for 56 students of M. Stat. from Indian Statistical Institute, Kolkata. • Sixteen integrated training programmes of 2-week (11 days) duration each on “Official Statistics” conducted during the year for in-service Subordinate Statistical Service Officers at various identified training hubs. • Eleven Training Programmes (eight week duration each) for newly recruited officials of Subordinate Statistical Service were organised along with 19 two weeks refresher training programmes for in service SSS officials. • A six-week training programme in “Official Statistics and Related Methodology” for the participants of International Statistical Education Center (ISEC), Kolkata was conducted. Official Statistics Awareness Programmes were initiated during the year. Achievements for the present year included organising 2 trainings each for University faculty and students and one workshop at Punjab University. • The internship programme for the Post graduate students of recognized universities was revised to provide the internship to 130 students. Upto last year only 20 students were provided the internship. 15th conference of the commonwealth statisticians was successfully organised. 7. Computer Centre o All the publications of the ministry have been uploaded on the Ministry's website http://mospi.gov.in. These reports are freely downloadable by users after a simple on-line registration. o The New Web Site has been launched after web-audit. o Data sets from the surveys on Employment & Unemployment and Consumer Expenditure, Annual Survey of Industries have been uploaded and updated on the National Data Warehouse (NDW). All the Servekshana tables of NSS round have been uploaded on the NDW portal with search facility. National Account Data has been uploaded on the NDW portal. o Data entry and processing of price data continued for the new series of Price Index. o Software for field level price data entry, data scrutiny and compilation of index were developed. 8 8. National Sample Survey Office During the year NSSO brought out the following seven reports: 530 “Household Consumer Expenditure in India, 2007-08” 531 “Employment and Unemployment Situation in India, 2007-08” 532 “Education in India, 2007-08: Participation and Expenditure”, 533 “Migration in India, 2007-08” 534 "Some Characteristics of Urban Slums, 2008-09" 535 “Housing Condition and Amenities in India, 2008-09” 536 Domestic Tourism in India, 2008-09 • 95th issue of Sarvekshana is under print Programme Implementation Wing 9. Infrastructure Performance • The overall performance in the infrastructure sector during 2010-2011 (AprilNovember) has shown continuous growth. • Power generation, production of coal, finished steel, cement, crude oil, refinery, natural gas, railway revenue earning freight traffic, cargo handled at major ports, cargo and passenger traffic handled at international airports, addition in switching capacity of telephone exchanges and provision of cell telephone connections have recorded positive growth. • Production of finished steel, crude oil & refinery, export & import cargo handled at international airports, passenger traffic handled at international & domestic terminals and addition in switching capacity recorded higher growth over the growth achieved during the corresponding period of the last year. • As compared to the targets set for the period, all sectors lagged behind except production of refinery and highway up-gradation by NH(O) & BRDB. • In road sector, the up-gradation of highway by NHAI and NH(O) & BRDB recorded negative growth. 10. Project Implementation • During year 2009-10 up to the end of March, 2010, a total number of 97 projects involving a cost of `42758 crores were completed in 11 different sectors. These include Atomic Energy (1) Civil Aviation (12), Coal (12), Petroleum (4), Steel (5), Power (11), Railways (6), Road Transport & Highways (31), Shipping and Ports (4) and Telecommunications (11). • In this financial year, a total number of 329 projects are due for commissioning in 2010-11 (as on 30.11.2010). During 2010-11, total 70 projects have been 9 commissioned (as on 30.11.2010) involving an investment of `46177.12 crores. The completed project spread over 9 sectors namely, Coal (1), Steel (2), Petroleum (15), Power (5), Health & Welfare (1), Railways (7), Road Transport & Highways (22), Shipping and Ports (3) and Telecommunications (14) 11. Twenty Point Programme • During the year 2009-10 the performance in respect of 12 parameters of the total 19 monthly monitored parameters of Twenty Point Programme (TPP-2006) has been very Good (i.e. over 90% achievement). The parameter of “Individual Swarozgaries Assisted – SGSY” under the Point “Garibi Hatao” has achieved the highest performance rate of 232% followed by the parameters “Pumpsets Energised” under the Point “Grameen Oorja” at 167%. • During the year 2010-11 (for the period April - September,2010), the performanmce of 14 parameters of Twenty Point Programme (TPP-2006) has been very Good (over 90% achievement) with the highest performance achievement recorded for the parameter “Road Constructed- PMGSY” under the Point “Grameen Sadak” with the performance achievement of 246%. 12. Member of Parliament Local Area Development Scheme (MPLADS) • `22098.25 crore has been released since the inception of the scheme up to 31.12.2010. • As reported from the districts, an expenditure of` 20058.21 crore has been incurred under the scheme upto 31.12.2010. The percentage over release is 90.77 • ` 1141.00 crore has been released in the current financial year upto 31.12.2010 and an expenditure of ` 657.22 crore has been made. • The Guidelines of the Scheme have been comprehensively revised in November, 2005. • Remarkable improvement in scheme performance has been made , since April, 2004, as shown below. o Improved utilisation of funds :- Percentage of utilisation over release has increased from 82.18 as on 31.03.2004 to 90.77 as on 31.12.2010. o Faster completion of works :- Percentage of works completed to sanctioned has increased from 80.14 as on 31.03.2004 to 91.49 as on 31.12.2010. • 57 works to the tune of ` 2189.30 lakh consented by Lok Sabha MPs and 130 works to the tune of ` 3134.30 lakh consented by MPs of the Rajya Sabha have been authorised in the Tsunami affected areas of Andhra Pradesh, Kerala, Tamil Nadu, Pondicherry and A&N Islands. As per the latest report received, 52 Lok Sabha works and 124 Rajya Sabha works have been completed. • 22.05 crore has been contributed by 155 Lok Sabha MPs and `22.81 crore has been contributed by 173 Rajya Sabha MPs towards Bihar Flood Relief Works. The Ministry, in consultation with the MPLADS Committees of Parliament authorized ` 10 construction of 44 Disaster-cum-Community Shelters costing ` 4628500/- per unit and 38 Cattle Shelter costing `12 lakh per unit out of the MPLADS funds. The work has still to start. • • 165 lakhs has been contributed by 8 Lok Sabha MPs and ` 350 lakhs has been contributed by 12 Rajya Sabha MPs towards rehabilitation of areas in the State of West Bengal affected by Cyclone ‘AILA’ . The Ministry has distributed the consented amount for rehabilitation works as recommended by the Government of West Bengal. ` 17 Lok Sabha and 25 Rajya Sabha MPs have respectively consented ` 285 lakh and 380 lakh for rehabilitation works in Cloudburst affected areas of Leh of Jammu & Kashmir. The State Government has requested to sanction reconstruction of Block C of SNM hospital Leh and other works to accommodate the funds consented by the MPs. ` • Eleven State Secretary level meetings, (twice each in 2005-06, 2006-07, 2007-08, 2008-09 ,2009-10 and once in 2010-11) with all State/UTs to monitor the progress and sort out problems have been held. • Financial and technical assistance is being provided to State/UTs to conduct training programmes for districts officials for better implementation of the scheme. The statelevel reviews/ trainings on Guidelines for district authorities were undertaken in the States/UTs of Himachal Pradhesh, Uttar Pradhesh, Manipur, Maharashtra ,Delhi, Karnataka, Goa, West Bengal, Andhra Pradhesh, Puducherry and Nagaland during the year 2010. 11 CHAPTER III NATIONAL STATISTICAL COMMISSION 3.1 The Government of India through a resolution dated 1stJune, 2005 decided to set up the National Statistical Commission (NSC). The setting up of the NSC followed the decision of the Cabinet to accept the recommendation of the Rangarajan Commission, which reviewed the Indian Statistical System in 2001.The National Statistical Commission (NSC) was initially constituted w.e.f. 12th July 2006 to serve as a nodal and empowered body for all core statistical activities of the country, to evolve, monitor and enforce statistical priorities and standards and to ensure statistical coordination. The NSC has one part-time Chairman and four part-time Members, each having specialization and experience in specified statistical fields. Besides, Secretary, Planning Commission is an ex-officio Member of the Commission. The chief Statistician of India is the Secretary to the Commission. 3.2 The part-time Chairman/Members of the Commission assigned/completed their tenure by July 2009. The vacancies have been filled up during 2009-10 with the following persons: (i) Prof. R. Radhakrishana, Chairman, w.e.f. 30th July 2009 (ii) Shri Suman K. Bery, Member w.e.f. 24th December 2009 (iii) Prof. Anil P. Gore, Member w.e.f. 30th December 2009 (iv) Prof. Shibdas Bandyopadhyay, Member w.e.f. 30th December 2009 (v) Dr. Sudipto Mundle, Member w.e.f. 24th December 2009 3.3 The functions of the NSC are laid down in the Government of India Resolution No.85 st dated 1 June 2005 published in the Gazette of India Extra Ordinary Part-III Section 4. The Resolution provides for submission of Annual Report on its activities by the Commission for each financial year and its laying before the parliament or concerned State Legislatures, as the case may be, along with memorandum of action taken on the recommendations therein. A separate report on the working of the Commission would accordingly be laid before the Parliament. 12 CHAPTER IV CENTRAL STATISTICS OFFICE 4.1 The Central Statistics Office (CSO),an attached office of the Ministry, coordinates the statistical activities in the country and evolves statistical standards. Its activities inter-alia include compilation of National Accounts, Index of Industrial Production, Consumer Price Indices for Urban Non-Manual Employees, Human Development Statistics including Gender Statistics, conduct of Annual Survey of Industries and Economic Census and imparting of training in Official Statistics. The CSO also assists in the development of statistics in the states and Union Territories, and disseminates Energy Statistics, Social and Environment Statistics and prepares the National Industrial Classification. National Accounts 4.2 The National Accounts Division (NAD) of the CSO is responsible for the preparation of national accounts, which include besides the consolidated accounts of the nation and detailed accounts of public sector transactions, estimates of national income, government/private final consumption expenditure, capital formation and savings. The Division brings out an annual publication, entitled “National Accounts Statistics”, containing these statistics. Other important activities of the Division are: (i) preparation of quarterly estimates of gross domestic product (GDP) at current and constant prices, (ii) estimation of capital stock and consumption of fixed capital; (iii) estimation of state level domestic product and gross capital formation of supra-regional sectors of railways, communication, banking & insurance, and central government administration, and (iv) preparation of comparable estimates of state domestic product (SDP) at current prices for the use of the Finance Commission and Planning Commission. 4.3 During the current year, the Division released the publication, “National Accounts Statistics, 2010”, giving estimates of the national /domestic product, private final consumption expenditure, savings, capital formation, capital stock, public sector transactions and consolidated accounts of the nation for the period 2004-05 to 2008-09. This publication also included the estimates of factor incomes for the years 2004-05 to 2008-09. An analytical write-up giving an overview of the economy as observed in the National Accounts Statistics, and advance estimates of national income for the year 2009-10 were also included in the publication. Special statements giving domestic product from livestock sector separately for the period 2004-05 to 2008-09 and Quarterly Estimates of GDP for the period 2004-05 to 2009-10, were also included to meet the demand of policy makers and researchers. 4.4 As per the current release policy of the Ministry, the Division releases the Quick Estimates of national income and related aggregates of the previous financial year on 31st January, and the Advance Estimates of national income for the current financial year on 7th February. In addition to these, the Division also releases the quarterly estimates of GDP, both at current and constant prices with a time-lag of 2 months. In accordance with this release calendar, the NAD released the Quick Estimates of National Income and related aggregates, 2009-10 on 31.01.2011, the Advance Estimates of national income, 2010-11 on 07.02.2011, the estimates of GDP for the first quarter (April-June) of 2010-11 on 31.08.2010, and the second quarter (July-September) of 2010-11 on 30.11.2010. The Advance Estimates released on 07.02.2011, place the real GDP growth rate at 8.6 per cent in 2010-11, as against the growth rate of 8.0 per cent in 2009-10. 13 4.5 The Division compiles the comparable estimates of gross and net state domestic product (GSDP/NSDP) by economic activities and per capita income estimates, in consultation with the representatives of State/UT Directorates of Economics and Statistics (DESs). These estimates are sent to the Finance Commission and Planning Commission for their use. 4.6 The Division also compiles State-wise estimates of domestic product (SDP) and gross fixed capital formation (GFCF), in respect of four supra-regional sectors, viz. Railways, Communication, Banking and Insurance and Central Governments, and supplies the same to the State/UT Governments for incorporation in their state income compilations. 4.7 According to the Advance Estimates of National Income, 2010-11, released on 7.2.2011, the GDP at factor cost at constant (2004-05) prices in the year 2010-11 is likely to attain a level of ` 48,79,232 crore, as against the Quick Estimates of GDP for the year 200910 of ` 44,93,743 crore, released on 31st January 2011. The growth in GDP during 2010-11 is estimated at 8.6 per cent as compared to the growth rate of 8.0 per cent in 2009-10. The growth rate of 8.6 % has been achieved due to the growth rates of over 8% in the sectors of ‘manufacturing (8.8%), construction (8.0%), trade, hotels, transport & communication (11.0 %), and financing, insurance, real estate & business services (10.6 %). Agriculture, forestry and fishing sector is likely to show a growth rate of 5.4 % during 2010-11. At current prices, the GDP growth rate during 2010-11 is 18.3 percent, as against the growth rate of 16.1 per cent, in 2009-10. In absolute terms, the GDP at current prices is estimated at ` 72,56,571 crore. 4.8 In terms of broad sectoral groups, the GDP in respect of ‘agriculture, forestry and fishing’; ‘mining, manufacturing, electricity and construction’, and ‘services’, at constant (2004-05) prices is estimated to register growth rates of 5.4 per cent, 8.1 per cent, and 9.6 per cent, respectively in 2010-11, as against the growth rates of 0.4 per cent, 8.0 per cent, and 10.1 per cent, respectively in 2009-10. 4.9 The National Income of the country (which is the net national income at factor cost) during 2010-11 at current prices is estimated at ` 64,66,860 crore, and at constant (2004-05) prices, at `42,69,994 crore. Accordingly, the per capita income of the country in 2010-11, stands at `54,527 at current prices, and at `36,003, at constant (2004-05) prices. The National Income and per capita income at constant (2004-05) prices, has shown growth rates of 8.2 % per cent, and 6.7 % per cent respectively. 4.10 During the first two quarters of the current financial year 2010-11, namely Q1 (AprilJune) and Q2 (July-September), the real GDP registered growth rate of 8.9 per cent in both the quarters over the corresponding quarters of the previous year. 4.11 The share of Private Final Consumption Expenditure (PFCE) in the domestic market in GDP at current market prices is estimated at 58.0 per cent in 2009-10 as against 58.5 per cent during the year 2008-09. Within the PFCE, the major items of expenditure are ‘food, beverages and tobacco’ with a share of 20.9 per cent, ‘transport and communication’ with a share of 9.9 per cent, ‘gross rent, fuel and power’, with a share of 8.6 per cent, ‘miscellaneous good & services’, with a share of 8.4 per cent and ‘clothing and footwear’ with a share of 3.7 per cent. 14 4.12 The rates of Gross Domestic Saving (GDS) and Gross Domestic Capital Formation at current in 2009-10 are estimated at 33.7 per cent and 36.5 per cent, respectively as compared to 32.2 per cent and 34.5 per cent in 2008-09. The household sector has a major share in the total gross domestic saving. Its share in 2009-10 is estimated at 69.6 per cent as compared to 72.7 per cent in 2004-05. The share of the private corporate sector is estimated at 24.1 per cent in 2009-10 as against 20.2 per cent in 2004-05, whereas the share of the public sector is estimated at 6.3 per cent in 2009-10 as compared to 7.1 per cent in 2004-05. 4.13 Gross Domestic Capital Formation at current prices has increased from ` 19,27,107 crore in 2008-09 to `23,89,213 crore in 2009-10 and at constant (2004-05) prices, it increased from ` 15,65,007 crore in 2008-09 to ` 18,58,659 crore in 2009-10. The rate of gross capital formation at current prices is 36.5 per cent in 2009-10 as against 34.5 per cent in 2008-09. The rate of gross capital formation at constant (2004-05) prices is 38.2 per cent in 2009-10 as against 35.1 per cent in 2008-09. 4.14 In the year 2009-10, the public sector, comprising administrative departments, departmental enterprises and non-departmental enterprises, contributed 21.2 per cent in the GDP and 27.0 per cent in gross domestic capital formation. In domestic savings, on the other hand, the public sector had a contribution of 6.3 per cent. 4.15 During the year, the Division prepared comparable estimates of state domestic product for the years 2004-05 to 2007-08, on the revised base 2004-05, after in-depth discussions with the State Directorates of Economics & Statistics. The estimates of gross fixed capital formation were prepared for the years 2004-05 to 2006-07 for use of State/UT Governments. 4.16 The NAD conducts regional training-cum-workshops on the topics of state income and related aggregates, every year in accordance with the recommendations of the NSC, for the benefit of State/UT DES officials. A National level workshop was conducted in Puducherry, during 26th to 30th April, 2010, for revising the series of State Income Statistics with base year 1999-2000 to a new series with base year 2004-05. State level workshops have been conducted at Bihar and Jammu & Kashmir for estimation of District Domestic Product and at Puducherry for economic and purpose classification of the State Government budgets. 4.17 As regards survey on Non-Profit Institutions in India, State level trainings and workshops were conducted by NAD officers in some states for district/field level officials on the collection and tabulation of 2nd phase data. 15 states have completed the 2nd phase survey and in the remaining states, the survey work is in progress. 4.18 During the year, first meeting of the Reconstituted Advisory Committee on National Accounts was held on 22nd December 2010 under the Chairmanship of Prof. K. Sundaram to discuss estimation of quarterly GDP. 4.19 Advance Estimate of National Income, 2010-11 was released on 07.02.2011. Statements 1 to 6 of the estimates are given below. 15 STATEMENT 1: Advance Estimates of National Income and Expenditures on GDP, 2010-11 (At 2004-05 prices) Item 2008-09 2009-10 (QE) 2010-11 (AE) 1. NATIONAL PRODUCT (` Crore) 1.1 Gross National Income (GNI) at factor cost 41,37,125 1.2 Net National Income (NNI) at factor cost 36,69,890 44,64,854 (7.9) 39,46,540 (7.5) 48,44,971 (8.5) 42,69,994 (8.2) 2. DOMESTIC PRODUCT (` Crore) 2.1 Gross domestic product (GDP) at factor cost 41,62,509 44,93,743 (8.0) 48,69,317 (9.1) 39,75,429 (7.6 ) 48,79,232 (8.6) 53,42,571 (9.7) 43,04,255 (8.3) 1,170 33,731 (6.1) 38,408 1,186 36,003 (6.7) 41,140 ESTIMATES AT AGGREGATE LEVEL 2.2 Gross domestic product (GDP) at market 44,62,967 prices 2.3 Net domestic product (NDP) at factor cost 36,95,274 B. ESTIMATES AT PER CAPITA LEVEL Population (million) Per capita NNI at factor cost (`) 1,154 31,801 36,070 Per capita GDP at factor cost (`) Note: The figures in parenthesis show the percentage change over previous year QE: Quick Estimate; AE: Advance Estimate STATEMENT 2: Advance Estimates of National Income for the year 2010-11 (At current prices) Item 2008-09 2009-10 (QE) 2010-11 (AE) 1. NATIONAL PRODUCT (` Crore) 1.1 Gross National Income (GNI) at factor cost 52,49,163 1.2 Net National Income (NNI) at factor cost 46,85,873 60,95,230 (16.1) 54,39,557 (16.1) 72,04,492 (18.2) 64,66,860 (18.9) 2. DOMESTIC PRODUCT (` Crore) 2.1 Gross domestic product (GDP) at factor cost 52,82,086 61,33,230 (16.1) 65,50,271 (17.3) 54,77,557 (16.1) 67,59,384 72,56,571 (18.3) 78,77,947 (20.3) 65,18,939 (19.0) 80,54,010 ESTIMATES AT AGGREGATE LEVEL 2.2 Gross domestic product (GDP) at market prices 55,82,623 2.3 Net domestic product (NDP) at factor cost 47,18,796 2.4 Gross National Disposable Income B. ESTIMATES AT PER CAPITA LEVEL 57,52,909 16 Population (million) Per capita NNI at factor cost (`) 1,154 40,605 Per capita GDP at factor cost (`) 45,772 1,170 46,492 (14.5) 52,421 1,186 54,527 (17.3) 61,185 Note: The figures in parenthesis show the percentage change over previous year QE: Quick Estimate; AE: Advance Estimate STATEMENT 3: Advance Estimates of GDP at Factor Cost by Economic Activity (at constant 2004-05 prices) ` Crore Industry 1. agriculture, forestry & fishing 2. mining& quarrying 3. manufacturing 4. electricity, gas & water supply 5. construction 6. trade, hotels, transport and communication 7. financing, insurance, real estate & business services 8. community, social & personal services 9. GDP at factor cost 2008-09 2009-10 (QE) 2010-11 (AE) Percentage change over previous year 2009-10 2010-11 654,118 97,244 655,775 656,975 103,999 713,428 692,499 110,482 776,337 0.4 6.9 8.8 5.4 6.2 8.8 83,344 332,557 88,654 355,918 93,133 384,282 6.4 7.0 5.1 8.0 1,087,575 1,193,282 1,324,049 9.7 11.0 706,712 771,763 853,795 9.2 10.6 545,184 4,162,509 609,724 4,493,743 644,656 4,879,232 11.8 8.0 5.7 8.6 QE: Quick Estimate; AE: Advance Estimate STATEMENT 4: Advance Estimates of GDP at Factor Cost by Economic Activity (at current prices) `Crore Percentage change over 2009-10 2010-11 previous year 2008-09 Industry (QE) (AE) 2009-10 2010-11 1. agriculture, forestry & fishing 928,943 1,089,297 1,341,503 17.3 23.2 2. mining& quarrying 138,649 154,269 182,278 11.3 18.2 3. manufacturing 816,217 905,224 1,036,155 10.9 14.5 4. electricity, gas & water supply 84,164 92,671 100,635 10.1 8.6 17 5. construction 6. trade, hotels, transport and communication 7. financing, insurance, real estate & business services 8. community, social & personal services 9. GDP at factor cost 451,414 501,706 587,048 11.1 17.0 1,308,640 1,477,456 1,724,915 12.9 16.7 849,193 1,027,158 1,298,963 21.0 26.5 704,866 5,282,086 885,449 6,133,230 985,074 25.6 7,256,571 16.1 11.3 18.3 QE: Quick Estimate; AE: Advance Estimate STATEMENT 5: Expenditure of GDP at market prices in2010-11(at 2004-05 prices) (`in crore) Expenditures of Gross Domestic Product 2009-10 2010-11 2008-09 (QE) (AE) Industry 1. Private Final Consumption Expenditure (PFCE) 2,652,273 2. Government Final Consumption Expenditure 485,212 3. Gross Fixed Capital Formation (GFCF) 1,452,474 4. Change in Stocks 90,168 5. Valuables 60,062 6. Exports 1,040,765 7. Less Imports 1,359,886 8. Discrepancies 41,899 GDP at market prices 4,462,967 QE: Quick Estimate; AE: Advance Estimate RATES OF GDP AT MARKET PRICES (%) 200910 2010-11 2,846,410 3,079,898 58.5 57.6 564,835 579,479 11.6 10.8 1,559,126 1,689,460 32.0 31.6 172,083 92,626 983,508 1,335,211 -14,060 184,328 110,727 1,101,148 1,419,365 16,896 3.5 1.9 20.2 27.4 -0.3 3.5 2.1 20.6 26.6 0.3 4,869,317 5,342,571 100.0 100.0 STATEMENT 6: EXPENDITURES OF GDP AT MARKET PRICES IN 2010-11 (at current prices) (`in crore) Industry Expenditures of Gross Domestic Product 2009-10 2010-11 2008-09 (QE) (AE) 18 RATES OF GDP AT MARKET PRICES (%) 200910 2010-11 1. Private Final Consumption Expenditure (PFCE) 2. Government Final Consumption Expenditure 3. Gross Fixed Capital Formation (GFCF) 4. Change in Stocks 5. Valuables 6. Exports 7. Less Imports 8. Discrepancies GDP at market prices 3,257,800 3,782,013 4,493,487 57.7 57.0 616,430 785,443 890,978 12.0 11.3 1,788,803 112,519 72,213 1,328,765 1,614,040 20,133 5,582,623 2,016,186 214,619 113,374 1,298,371 1,639,872 -19,863 6,550,271 2,307,376 255,684 147,685 1,610,571 1,900,118 72,285 7,877,947 30.8 3.3 1.7 19.8 25.0 -0.3 100.0 29.3 3.2 1.9 20.4 24.1 0.9 100.0 QE: Quick Estimate; AE: Advance Estimate Price Statistics Consumer Price Index for Urban areas: 4.20 New series of CPI (Urban) would be compiled for each States/UT as well as at all India level. The weighting diagrams of CPI (Urban) are based on the results of the NSS 61st round Consumer Expenditure Survey (2004-05). For compilation of CPI (Urban), 1114 quotations (price schedules) from the selected 310 towns covering all States/UTs are canvassed every month by the NSSO (FOD). 4.21 The Technical Advisory Committee on Statistics of Prices and Cost of Living (TAC on SPCL) in its 49th meeting held on 10th November, 2010 has decided to have 2010 as the base year for these new series of CPI numbers. Indices for January 2011 are likely to be released in February 2011. Consumer Price Index for Rural areas: 4.22 CPI (Rural) would also be compiled for all states/UTs and all India. Weighting diagrams of the CPI (Rural) have also been derived from the results of the NSS 61st round of Consumer Expenditure Survey (2004-05). 4.23 As the field investigators of NSSO (FOD) were not available for price collection in the rural areas, this work is done by the Department of Posts. Monthly price data are being collected from the selected 1183 villages covering all states/UTs. Indices for January 2011 are expected to be available in February 2011. National CPI 4.24 CSO is also compiling national CPI by merging CPI (Urban) and CPI (Rural) with appropriate weights derived from the results of the NSS 61st round of Consumer Expenditure Survey (2004-05). It is expected that the State/UT wise CPI (Rural+Urban) for the month of January 2011 would be available in February 2011. 19 International Comparison Programme-2011 4.25 The International Comparison Programme (ICP) facilitates comparison of macro economic aggregates like GDP, GNP etc. between different countries in a more meaningful way (by using Purchasing Power Parity [PPP] numbers) than the comparison based on the Official Exchange Rates. So far seven rounds of ICP (starting from 1970 to 2005) have been conducted and India has participated in all the rounds except the sixth round. The role of the participating countries is limited to collection of prices as per the specifications prescribed and furnishing price data along with basic heading weights from GDP expenditure estimates. Actual compilation of PPP numbers is done by the coordinating agencies in the respective regions. Asian Development Bank is the Coordinating agency for the Asia-Pacific region. 4.26 The preliminary work for implementation on ICP 2011 has started. A committee having representation from the concerned ministries, Reserve Bank of India and academicians is being constituted under the Chairmanship of DG, CSO to finalise all aspects and also monitor the implementation of the programme. INDUSTRIAL STATISTICS Annual Survey of Industries: ͺǤͽ ȋȌ Ǥ ǡ ǡ ǡ , repair services, generation, transmission etc. of electricity, gas and water supply and cold storage. The survey is conducted annually under the statutory provisions of the collection of Statistics Act, 1953. The ASI extends to the entire country except the States of Arunachal Pradesh, Mizoram, Sikkim and Union Territory of Lakshadweep. Sikkim is participating in the survey from ASI 2009-10. The ASI covers all factories registered under Sections 2m (i) and 2m (ii) of the Factories Act, 1948. The survey also covers Bidi and Cigar manufacturing establishments registered under the Bidi and Cigar Workers (Conditions of Employment) Act, 1966. All the electricity undertakings engaged in the generation, transmission and distribution of electricity registered with the Central Electricity Authorities (CEA) were covered under ASI up to 1997-98 irrespective of their employment size. The electricity undertakings registered with the CEA are not being covered under ASI w.e.f 1998-99 however captive units not registered with CEA are continued to be covered under ASI. Certain services and activities like cold storage, water supply, repair of motor vehicles and of other consumer durables like watches, etc. are covered under the survey. Defence establishments, oil storage and distribution depots, restaurants, hotels, café and computer services and also the technical training institutes are excluded from the purview of the survey. 4.28 The data collected through ASI relates to capital, employment and emoluments, consumption of fuel and lubricants, raw materials and other input/output, value added, labour turnover and other characteristics of factories/industrial establishments. Fieldwork is carried out by the Field Operations Division of NSSO. The CSO process the data and publish the results. 20 Release of Results: 4.29 The summary results of ASI 2008-2009 have been released. The field survey for ASI 2009-2010 has been started. State Participation in ASI: 4.30 The State DESs have been given necessary technical assistance for the purposes of participation in ASI. The participating States along with other desiring States have been provided residual frame to take part in ASI survey work. The CSO (IS Wing) provides the entire database as well as tables needed by State Governments and State Governments may generate district/micro level estimates, if necessary, by augmenting samples. 4.31 Introduction of a new plan scheme entitled “Streamlining of ASI Data Processing and Strengthening of Analytical Capabilities of ASI Unit” started during the Eighth Plan renamed as “Strengthening ASI Data Processing Under Institutional Development & Capacity Building” in the Eleventh Plan followed by restructuring the system of working at CSO (I.S. Wing) has boosted the process of working. 4.32 The detailed ASI reports are being prepared in CSO (I.S.Wing) every year from ASI 1993-94 and onwards. The work of CSO (I.S.Wing) has been geared up in order to: • • • Develop in-house computer software for data processing for generation of all tables and their publications with effect from ASI 1993-94; Reduce the time lag in processing of ASI (detailed) data annually instead of quinquennial basis; and Prepare web-portal for online data processing and data dissemination. 4.33 In recent past, many changes have been made for improvements in the collection, processing and dissemination of ASI data. These are summarized in the following paragraphs. 4.34 Over the last few decades, there has been a spurt in the growth of the number of registered factories and consequently in the number of units from which data are to be collected and analyzed annually. Manpower resources could not be increased much due to financial constraints. Thus, collection and compilation of data from a large number of units (approximately 60,000 in number) in a very lengthy schedule have not only led to undue delay in the availability of results but also involved non-sampling errors. The process of changing the then scenario started from 1997-98, which involved modification of sampling design as well as the schedule. The present sampling design is for the Sample sector of ASI, which ensures reliable estimates of various parameters of industrial sector at the all India as well as State level. However, the present sampling design is not suited for district level estimates, which suggests that the sample size needs to be increased for the sample sector of the ASI. According to the new sampling design about 44,611 units have been surveyed in ASI 2001-2002, 44,595 units in ASI 2002-2003 and 59,655 units in ASI 2003-2004. The sampling design has further been modified and it was decided by the Standing Committee on Industrial Statistics (SCIS) that in next five years entire frame would be surveyed. Accordingly, in ASI 2004-05, ASI 2005-06 and ASI 2006-07, 52960, 60971 and 70652 units have been surveyed respectively. The sampling design has further been modified looking into 21 operational constraint of FOD for ASI 2007-08 and ASI 2008-09 in which 60794 and 58300 units have been covered respectively. 4.35 The entire processing of data of ASI 1995-96 onwards is being done at CSO (I.S.Wing), Kolkata. To handle this work properly CSO (I.S. Wing) has acquired necessary hardware and software to introduce modern Client-Server architecture and networking. Under the current plan scheme in CSO (IS Wing), the client server architecture on RISC servers with redundancy & RDBMS as oracle engine has been introduced to streamline the largescale data processing so as to release the reliable data within a very short time span. A proposal for web-portal implementation is included in the Plan scheme to reduce the data entry time & errors. 4.36 An action plan has been drawn to reduce the time lag in releasing the ASI results. From ASI 1998-99, release of provisional results is discontinued and detailed results (in two volumes) are being released satisfactorily. The ASI results are available to users on electronic media on payment basis. Final results are released in two volumes (Vol-I in Hard Print and Vol-II in CD). In addition, from ASI 2007-08 onwards, “Summary Results for factory sector” are being released. 4.37 As regards information technology, CSO (IS Wing) is responsible to provide necessary technical support to state governments as well as FOD, specially in preparing comprehensive instructions manual for data collection and manual for constructing State Level Index of Industrial Production (IIP) with revised base year, and also in respect of computerization of ASI frame, fully computerized sample selection, fully computerized data processing as well as analytical works on ASI data. The liaison work with state governments and other organizations/agencies in India and abroad are also being directly done by IS Wing. Glimpse of the ASI Results: 4.38 The latest ASI 2008-09 summary results for factory sector have been released. Detailed results will be released by 31st March,2011. ASI 2008-09 covered the entire country except three States of Arunchal Pradesh, Mizoram & Sikkim and U.T. of Lakshadweep. The field work for ASI 2008-09 was carried during October 2009-April 2010. Altogether 52,864 factories were approached for data collection. Some of the highlights based on ASI 2008-09 are given below: i) During 2008-09, an estimated 1,55,321 factories were found to be in operation. ii) About 94% of these factories were engaged in manufacturing activities, and the remaining in electricity, gas & water supply or other activities. iii) Nearly 1.13 crore persons were engaged by these factories. iv) Total net value added by the factories during the year was about ` 527766crore. v) Average number of employees per factory was 73. vi) Average wage per worker was about ` 68,000. vii) Total number of factories during 2008-09 grew by 6.1% over the previous year. viii) The corresponding growth in number of persons was 8.4%. ix) Total NVA grew by 9.6%. 22 Table4.1 shows the principal characteristics for the last four ASI years including 2008-09. Table-4.1: Principal Characteristics Characteristics Unit Factories Number Fixed capital 2006-2007 2007-2008 2008-2009 140160 144710 146385 155321 ` Lakh 60694028 71513139 84513209 105596614 Productive capital ` Lakh 79140288 99732019 116208515 136719912 Invested Capital ` Lakh 90157861 107150382 128012553 153517773 Workers Number 7136097 7880536 8198110 8776745 Employees Number 9111680 10328434 10452535 11327485 to ` Lakh 3766366 4429135 5103023 5977184 ` Lakh 7400820 8875099 10544284 12944123 Total input ` Lakh 154365843 194836758 222295282 266148638 Output ` Lakh 190835548 240854764 277570904 327279786 Depreciation ` Lakhs 5283286 6445480 7116354 8354590 Net value added ` Lakh 31186419 39572526 48159268 52776558 NFCF ` Lakh 7324388 7987020 10662743 14240111 Net Income ` Lakh 27316670 34800999 42260031 44932732 Rent paid ` Lakh 529948 640399 750549 975778 Interest paid ` Lakh 3339801 4131128 5148688 6868048 Profit ` Lakh 18446298 24142496 29757600 29699112 Wages Workers Emoluments 4.39 2005-20006 Physical achievements up to March 2011: • Printing of hard copy for Vol-I of ASI 2008-09 is completed. Vol-II of ASI 2008-09 in CD is released. • ASI 2009-2010 data entry and validation work is going on and the results are likely to be finalized by December 2011. • Revision of ASICC-2009 in line with ITC-HS is going on. 23 • Five Zonal workshops on preparation of comparable series of state level Index on Industrial Production (IIP) with base year 2004-05 have been completed. • Comprehensive instructions manual for data collection in ASI has been prepared. Organisation of Training-cum-Scrutiny Zonal Workshops jointly with FOD in five places for ASI 08-09/ASI 09-10 have been completed. • A National Seminar on Industrial Statistics organised. • Preparation of Web-Portal is going on. Index of Industrial Production (IIP): 4.40 The Index of Industrial Production is released every month in the form of Quick Estimates with a time-lag of 6 weeks as per the SDDS norms of IMF. The estimates are also simultaneously being released as per use-based classification viz., Basic goods, Capital Goods, Intermediate Goods, Consumer durables and non-durables. These estimates get revised subsequently on receipt of updated production data from the 15 different source agencies in various Ministries/Departments/Attached/Subordinate Offices. However, the major source of data is the Ministry of Commerce and Industry, which supplies data for 209 item groups contributing 52.0% weight in the overall IIP. 4.41 In order to capture the structural changes in the Industrial Sector, the Ministry has undertaken an exercise to revise the base year of all-India IIP from 1993-94 to 2004-2005 under the overall guidance of Standing Committee on Industrial Statistics (SCIS). 4.42 The industrial production registered an average annual growth rate of 5% during the ninth plan (1997-2002) and the same was 8.2% during the tenth plan (2002-2007). During the first three years (2007-08, 2008-09 & 2009-10) of the eleventh plan (2007-2012) industrial sector has registered an average growth of 7.5%. 4.43 The sector-wise annual indices of industrial production from 1995-96 to 2009-2010, monthly indices from December, 2009 to October, 2010 and the annual growth rates from 1995-96 to 2009-10 are given in Table 4.2. These figuresare depicted in Charts 4.1, 4.2 and 4.3 respectively. Table - 4.2 Sector-wise Index of Industrial Production & Growth Rates (Base: 1993-94) Period Mining Manufacturing Electricity General Annual Indices (April -March) 1995-96 120.5 124.5 117.3 123.3 1996-97 118.2 133.6 122.0 130.8 1997-98 126.4 142.5 130.0 139.5 1998-99 125.4 148.8 138.4 145.2 1999-00 126.7 159.4 148.5 154.9 2000-01 130.3 167.9 154.4 162.6 2001-02 131.9 172.7 159.2 167.0 2002-03 139.6 183.1 164.3 176.6 2003-04 146.9 196.6 172.6 189.0 24 2004-05 153.4 222.5 2005-06 154.9 242.3 2006-07 163.2 273.5 2007-08 171.6 298.6 2008-09 176.0 308.6 2009-10 193.4 342.5 Monthly Indices Dec'2009 209.0 381.1 Jan'2010 216.9 378.0 Feb'2010 203.3 361.1 Mar'2010 235.6 406.4 Apr'2010 198.1 350.1 May'2010 201.6 349.2 June'2010 197.4 353.5 July'2010 192.2 379.7 Aug'2010 189.9 350.2 Sep'2010 183.5 355.5 Oct'2010 203.5 357.4 Annual Growth (April-March) 1995-96 9.7 14.1 1996-97 -1.9 7.3 1997-98 6.9 6.7 1998-99 -0.8 4.4 1999-00 1.0 7.1 2000-01 2.8 5.3 2001-02 1.2 2.9 2002-03 5.8 6.0 2003-04 5.2 7.4 2004-05 4.4 9.2 2005-06 1.0 8.9 2006-07 5.4 12.9 2007-08 5.1 9.2 2008-09 2.6 3.3 2009-10 9.9 11.0 Average Indices (April-October) 1995-96 114.7 116.6 1996-97 113.4 129.3 1997-98 120.0 137.3 1998-99 121.0 142.5 1999-00 121.6 152.6 2000-01 125.9 162.0 2001-02 126.1 166.4 2002-03 133.9 176.0 2003-04 139.1 188.0 2004-05 146.5 212.3 2005-06 147.8 232.8 2006-07 153.1 258.1 2007-08 160.6 286.4 2008-09 166.7 300.6 2009-10 180.2 321.1 25 181.5 190.9 204.7 217.7 223.7 237.2 211.1 227.9 255.0 277.1 286.1 316.2 235.2 240.6 228.3 261.4 248.9 252.2 242.6 244.1 247.6 239.9 261.5 348.2 347.2 331.1 373.8 323.9 323.9 325.9 346.3 323.0 325.7 331.5 8.1 4.0 6.6 6.5 7.3 4.0 3.1 3.2 5.1 5.2 5.2 7.2 6.4 2.8 6.0 13.0 6.1 6.7 4.1 6.7 5.0 2.7 5.7 7.0 8.4 8.0 11.9 8.7 3.2 10.5 115.1 119.0 127.2 135.2 146.1 152.8 156.8 163.1 167.9 179.8 189.2 202.6 217.2 223.3 237.3 116.2 126.6 134.5 139.5 148.7 157.3 161.2 170.3 180.8 202.1 219.5 241.5 266.2 278.7 297.8 2010-11 195.2 356.5 Growth (April-October) 1995-96 12.8 13.6 1996-97 -1.1 10.9 1997-98 5.8 6.2 1998-99 0.8 3.8 1999-00 0.5 7.1 2000-01 3.5 6.2 2001-02 0.2 2.7 2002-03 6.2 5.8 2003-04 3.9 6.8 2004-05 5.3 12.9 2005-06 0.9 9.7 2006-07 3.6 10.9 2007-08 4.9 11.0 2008-09 3.8 5.0 2009-10 8.1 6.8 2010-11 8.3 11.0 26 248.1 328.6 10.1 3.4 6.9 6.3 8.1 4.6 2.6 4.0 2.9 7.1 5.2 7.1 7.2 2.8 6.3 4.6 13.1 9.0 6.2 3.7 6.6 5.8 2.5 5.6 6.2 11.8 8.6 10.0 10.2 4.7 6.9 10.3 Energy Statistics: 4.44 Energy sector is one of the basic infrastructure sector, for any country. Proper energy planning is essential for achieving energy security. Every country has to formulate its policy to optimize the use of different energy sources for meeting the demands of its households, agricultural, industrial and commercial sectors. This necessitates an integrated and updated database of the production and consumption of different energy sources viz., coal, crude, petroleum, natural gas and electricity (hydro and nuclear). 4.45 Economic Statistics Division of CSO brings out an annual publication on Energy Statistics. So far seventeen issues have been brought out. The latest issue brought out is “Energy Statistics 2010”. This is available on the website of the ministry. The publication contains time series data relating to production, availability, consumption and price indices of major sources of energy in India. 4.46 The objective of this publication is to meet the information needs of policy makers, administrators and researchers concerned with the energy sector. The publication has been brought out in a format to suit the needs of the user community in a better way. For example production pertaining to all energy sources has been tabulated under one section to give a holistic picture. Similar is the case for reserves, installed capacity, foreign trade & consumption etc. Main Highlights Reserves and Generation Potential for dƌĞŶĚƐŝŶ/ŶƐƚĂůůĞĚůĞĐƚƌŝĐŝƚLJ'ĞŶĞƌĂƚŝŶŐĂƉĂĐŝƚLJ ŝŶ/ŶĚŝĂĂƐŽŶϯϭ͘Ϭϯ͘Ϭϵ 4.47 As on 31.03.09 the estimated reserves of coal was ϮϬϬ͘ϬϬ around 267 billion tonnes, for ϭϴϬ͘ϬϬ lignite 39 billion tonnes. The ϭϲϬ͘ϬϬ estimated reserves of crude oil ϭϰϬ͘ϬϬ and natural gas in India as on ƚ ƚ 31.03.2009 stood at 773 million Ă ϭϮϬ͘ϬϬ t Ă ϭϬϬ͘ϬϬ metric tonnes (MMT) and 1115 ŐĞ billion cubic meters (BCM), D ϴϬ͘ϬϬ respectively. Estimated potential ϲϬ͘ϬϬ for renewable power generation ϰϬ͘ϬϬ was 86,188 MW. This includes ϮϬ͘ϬϬ an estimated wind power Ϭ͘ϬϬ potential of 48,561 MW (56%), ϭϵϳϬͲϳϭϭϵϴϬͲϴϭϭϵϵϬͲϵϭϮϬϬϬͲϬϭϮϬϬϱͲϬϲϮϬϬϲͲϬϳϮϬϬϳͲϬϴϮϬϬϴͲϬϵ SHP (small-hydro power) potential of 14,291 MW (17%) dŚĞƌŵĂů ,LJĚƌŽ EƵĐůĞĂƌ EŽŶͲƵƚŝůŝƚŝĞƐ and 19,500 MW (23%) from bagasse-based cogeneration in sugar mills. In the estimated potential of Renewable Power Karnataka has the highest potential with a share of 14.73% (12,693 MW ) followed by Gujarat with 13% (11,213 MW) and Andhra Pradesh 9,907 MW (11.5%), mainly on account of wind power potential. 28 Installed Capacity: g capacity was 142 million tonnes (MT) per annnum, for both 4.48 The total installed washing Coking (30.23 MTY) and Non n-Coking Coal (112.17 MTY). Neither the nuumber of coal washeries nor the installed wash hing capacity of the existing washeries has chaanged over the year. Total crude oil refining capacityy in the country at the end of March 2009 was 148.9 million tonnes per annum. There was no addition to the installed refining capacity duringg 2008-09. f The total installed capacity for electricity generation in th he country has increased from 16,2771 MW as on 31.03.1971 to 1,74,9446 MW as on 31.03.2009, registerinng a compound annual growth raate (CAGR) of 6.2%. The higheest rate of annual growth (3.82%) in installed capacity was for therm mal power followed by Hyddro power(2.70%). dƌĞŶĚƐŝŶWƌŽĚƵĐƚŝŽŶŽĨŶĞƌŐLJŝŶ/ŶĚŝĂďLJWƌŝŵ ŵĂƌLJ^ŽƵƌĐĞƐ ĨƌŽŵϭϵϳϬͲϳϭƚŽϮϬϬϴͲϬϵ ϴ͕ϬϬϬ ϲ͕ϬϬϬ ƐĞ ůƵ Ž ũĂ ƚĞ W The total Installed capacity of power utilities in the counttry increased from 14,709 MW in 1970-71 to 1,47,966 MW as on o 31.3.2009, with a CAGR of 6.1% over the period. The higheest CAGR (6.91%) was in case of b thermal utilities followed by ϮϬϬϳͲϬϴ ϮϬϬϴͲϬϵ;WͿ nuclear (6.03%) and hyddro ŽĂůΘ>ŝŐŶŝƚĞ ƌƵĚĞWĞƚƌŽůĞƵŵ EĂƚƵƌĂů'ĂƐ ůĞĐƚƌŝĐŝƚLJ;,LJĚƌŽΘEƵĐůĞĂƌͿ (4.06%). The total installeed capacity of grid interactiv ve renewable power, was 14,486 MW M as on 31.03.2009 of wind power accounnted for about 71%, followed by small hydro poower(17%) and Biomass power (12%). ϰ͕ϬϬϬ Ϯ͕ϬϬϬ Ͳ ϭϵϳϬͲϳϭ ϭϵϴϬͲϴϭ ϭϵϵϬͲϵϭ ϮϬϬϬͲϬϭ ϮϬϬϲͲϬϳ Tamil Nadu had the highest in nstalled capacity of grid connected renewable power (4733 MW) followed by Maharashtra (2337 ( MW) and Karnataka (2186 MW), mainlly on account of wind power. Production: ntry during the year 2008-2009 was 492.8 MTss registering a 4.49 Coal production in the coun growth of 7.8%. The Lignitee production during the same period decreassed by 4.6%. Production of crude petroleum in ncreased from 6.82 MTs during 1970-71 to 35.51 MTs during 2008-09, the production of Petrooleum Products in the country was 150.5 MTss where high speed diesel oil accounted for thee maximum share (42%), followed by Fuel Oil ((12%), Motor Gasoline (11%), Naphtha (10%).. Kerosene and Aviation Turbine Fuel (5%). The production energy in peta joules shows that Coal and Lignite were the major sources of energy, accounting for about 72% of the total production during 2008-09. Crude petroleum was second (12%), while Natural Gas (11%) was third. The total production of energy from conventional sources increased from 10,984 peta joules during 2007-08 to 11,537 peta joules during 2008-09, showing an increase of 5%. The all India gross electricity generation from utilities, excluding that from the captive generating plants, was 746626(GWh) during 2008-09. Total Electricity generation in the country, from utilities and non-utilities, during 2008-09 was 8,42,531 GWh. Out of this 6,17,832 GWh was generated from thermal and 1,14,081 GWh was from hydro and 14,713 GWh was generated from nuclear sources. Total output from non-utilities was 95,905 GWh. Foreign Trade: 4.50 There has been an increasing trend in the import of coal it increased to 59.00 MTs during 2008-09. Similarly Oil import has been steadily rising over the years. it increased from 11.68 MTs during 1970-71 to 132.78 MTs during 2008-09. Although more than 70% of its crude oil requirements and part of the petroleum products is met from imports, India has developed sufficient capacity to become a net exporter of petroleum products. The export of petroleum product has increased from a mere 0.33 MT during 1970-71 to 38.57 MTs, during 2008-09. The import of petroleum products was 22.46 MTs during 2008-09. Availability: 4.51 The total availability of raw coal in India during 2008-09 stood at 518.26 MTs, of lignite at 31.85 MTs, of crude oil at 166.28 MTs. The availability of natural gas was 31.75 BCMs during 2008-09 and that of electricity was 1,42,576 GWh. Loss of electricity due to transmission has increased from 17.55% during 1970-71 to 32.86% during 2000-01, which declined to 26.96% during 2008-09. 30 dƌĞŶĚŝŶWĞƌĂƉŝƚĂŶĞƌŐLJ ŽŶƐƵŵƉƚŝŽŶ ƌƵ ϱϬϬϬ Ž ϰϬϬϬ , ƚƚ ϯϬϬϬ Ă ϮϬϬϬ t Ž ůŝ ϭϬϬϬ < Ϭ ϭϳ ͲϬ ϳϵ ϭ ϲϳ Ͳϱ ϳϵ ϭ ϭϴ ͲϬ ϴϵ ϭ ϲϴ Ͳϱ ϴϵ ϭ ϭϵ ͲϬ ϵϵ ϭ ϲϵ Ͳϱ ϵϵ ϭ ϭϬ ͲϬ ϬϬ Ϯ ϲϬ Ͳϱ ϬϬ Ϯ ϳϬ Ͳϲ ϬϬ Ϯ ϴϬ Ͳϳ ϬϬ Ϯ ϵϬ Ͳϴ ϬϬ Ϯ Per- capita Energy Consumption & Energy Intensity (Table 4.3) dƌĞŶĚƐŝŶEĞƚ/ŵƉŽƌƚŽĨŽĂů͕ƌƵĚĞKŝůĂŶĚ WĞƚƌŽůĞƵŵWƌŽĚƵĐƚƐŝŶ/ŶĚŝĂĨƌŽŵϭϵϳϬͲϳϭƚŽϮϬϬϴͲϬϵ 4.52. Per-capita Energy Consumption (PEC) during a year is ϭϲϬ computed as the ratio of the estimate ϭϰϬ of total energy consumption during ϭϮϬ the year to the estimated mid-year ƐĞ ϭϬϬ ŶŶ ϴϬ population of that year. Energy Žƚ ϲϬ Intensity is defined as the amount of ŶŝŽ ůŝ ϰϬ energy consumed for generating one D ϮϬ unit of Gross Domestic Product (At Ϭ constant prices). The estimated PEC ͲϮϬ has increased from 1204 KWh in ͲϰϬ 1970-71 to 4140 KWh in 2008-09, ϭϵϳϬͲϳϭ ϭϵϴϬͲϴϭ ϭϵϵϬͲϵϭ ϮϬϬϬͲϬϭ ϮϬϬϲͲϬϳ ϮϬϬϳͲϬϴ ϮϬϬϴͲϬϵ The annual increase in PEC from 2007-08 to 2008-09 was 5%. The ŽĂů ƌƵĚĞŽŝů WĞƚƌŽůĞƵŵWƌŽĚƵĐƚƐ Energy Intensity (at 1999-2000 prices) increased from 0.128 KWh in 1970-71 to 0.165 KWh in 1985-86, but it has again come down to 0.129 KWh in 2008-09. 4.53 Table 4.3: Trends in Per-Capita Energy Consumption (PEC) and Energy intensity in India Year 1970-71 1975-76 1980-81 1985-86 1990-91 1995-96 2000-01 2005-06 2006-07 2007-08 2008-09(p) Energy Capita Energy Midyear GDP ( ` Per Consumption population in crore) Intensity Energy in billion ‘000 numbers (1999-2000 Consumption (KWH)* per rupee (KWH) KWH prices) 663.99 5,51,311 517148 1204.39 0.1284 840.53 6,17,248 596428 1361.74 0.1409 1012.58 688320 695361 1471.09 0.1456 1477.50 7,66,135 894041 1928.51 0.1653 1902.75 852297 1193650 2232.50 0.1594 2436.77 939540 1529453 2593.58 0.1593 3154.28 1034931 2030710 3047.81 0.1553 3909.37 1117734 2844942 3497.59 0.1374 4226.78 1134023 3120029 3727.24 0.1355 4508.26 11,47,677 3402716 3928.16 0.1325 4808.48 11,61,495 3711016 4139.91 0.1296 Sixth Economic Census: 4.54 The CSO is planning to conduct Sixth Economic Census soon in association with States/ UTs. A Standing Committee under the chairmanship of Secretary and Chief Statistician of India, MOS&PI has been constituted. This Standing Committee constituted a working group under the chairmanship of Prof. S P Mukherjee to recommend scope and coverage of the Sixth Economic Census, develop concepts, definitions, schedules of enquiry and instruction manuals for enumerators and supervisors. 31 Index of Service Production: 4.55 The Service sector in the country constitutes a major part of Indian economy in terms of its contribution to national income. In the year 2008-09, share of service sector in GDP was about 54% as against 27% in the year 1950-51. Owing to large and rapidly growing share of service producing activities, periodic information on the quantum and direction of the movement of services produced in the economy has now become imperative for the planners and policy makers. To meet the short-term requirement for the Quick estimates of quarterly GDP etc., it was felt as partial to compile Index of Service Production(ISP) covering important services. 4.56 In order to develop methodology for compilation of ISP the Ministry has constituted a Technical Advisory Committee (TAC) under the Chairmanship of Professor C. P. Chandrasekher in July, 2004. The committee has recommended that ISP shall be first compiled for registered sectors like Railways, Air Transport and Banking. Methodologies for construction of ISP for Railway, Port and Airport services have been finalized. Indices for these sectors have been uploaded on the MOSPI web-site for comments. Infrastructure Statistics: 4.57 The National Statistical Commission headed by Dr. C. Rangarajan, in its Report in 2001, observed that Statistics related to infrastructure are important in determining the availability of inputs that are crucial to a wide variety of productive activities. As noted by the Commission, the infrastructure statistics presently available in the country are of piecemeal nature, which are generated by various line ministries/departments, mostly for their internal use. The Commission have suggested for the compilation of a publication “Annual Infrastructure Statistics” to be brought out by the Ministry of Statistics & P.I. in collaboration with the line ministries/departments. In June,2008 CSO constituted a “ Standing Committee on Infrastructure Statistics (SCINS)” to guide scope, coverage and methodology for compilation of the publication. Since then three meetings of SCINS were held to finalize the publication. First issue of the publication “Infrastructure Statistics, 2010” is released. Further, a Task Force for compilation of a Manual on Infrastructure Statistics has also been constituted by the Ministry. Project on Statistical compilation of the ICT sector and Policy Analysis: 4.58 In January, 2009, Ministry of Statistics & Programme Implementation had signed an MOU with Orbicom, the network of UNESCO Chairs in Communication to work on a project “Statistical Compilation of the ICT Sector and Policy Analysis”. The main objective of the project is to measure the ICT sector and produce both aggregate and detailed, crossindustry and time-series data as per the internationally agreed upon OECD definition, as well as identify the data sources and/or gaps and limitations that exist. As per the MOU, Ministry of Statistics & Programme Implementation has to compile the statistical aggregates (GDP and Employment ) relating to ICT sector from the existing data holdings of MOS&PI and make them available freely in the public domain (on web-site). The MOU was valid until 31st Dec., 2010. 32 A report on “Value Addition & Employment Generation in the ICT Sector in India” has been released and a copy is available on the official web-site of MOS&PI. Social Statistics 4.59 The Social Statistics Division is entrusted with the responsibility of coordinating development of social statistics which inter-alia covers population, human development, employment, health, education, social justice, women empowerment, gender statistics, disability, environment, statistical monitoring of Millennium Development Goals and SAARC Social Charter Goals. In addition, the Division has the responsibility of carrying out the activities related to awards and fellowships for outstanding and meritorious research work in statistics under the scheme for Capacity Development of CSO. The Division also deals with the new Centrally Sponsored Scheme “India Statistical Strengthening Project” formulated under the National Strategic Statistical Plan and is implementing the pilot scheme for collection of Basic Statistics for Local level Development. Gender Statistics 4.60 The Statistical profile of Gender situation in India based on the latest statistics from different sources has been released in the Twelfth issue of “Women and Men in India for 2010”. At the instance of CSO, collection of data on new dimensions of gender related issues, particularly through linking of “House Listing Schedule” and Household Schedule” of 2011 Population Census of India has been configured appropriately by the Office of Registrar General and Census Commissioner of India in the schedules to be canvassed for the Census. Training in Gender Statistics has been mainstreamed in the Ministry of Statistics and Programme Implementation, for which the National Academy of Statistical Administration (NASA) has designated the subject as a core subject in the curricula for various levels of statistical personnel of Central and State governments including the probationary officers of the Indian Statistical Service. A committee of experts is currently engaged in developing the course curriculum, content etc. for training on gender statistics to be conducted by NASA. The academy is also building up a repository of training materials to facilitate training on Gender Statistics and related topics. Child Statistics 4.61 As a matter of current practice the year 2010 has been dedicated to various activities related to Child Statistics. According the importance that the subject deserved rightfully, the ‘Theme’ of the 4th Statistics Day of India 2010 was ‘Child Statistics’. An institutional mechanism for public-private partnership to address issues related to child statistics under the nodal responsibility of the Ministry of Statistics and Programme Implementation called ‘India Forum on Child Statistics’ (INFOCS) was launched on 29th June, 2010, on the occasion of the Statistics Day 2010 following registration of the forum as a Society under the Societies Registration Act XXI of 1860 with effect from 23rd June, 2010. This forum has been set up as an outcome of the resolution adopted in the 15th Conference of Central and State Statistical Organisation (COCSSO) held in Gandhinagar during 7-8 February, 2008, where it was decided to establish such an institutional mechanism represented by various concerned stakeholders including international agencies and NGOs to foster coordination and collaboration and to improve the scope, content, quality, consistency and reporting of data on children keeping the National Plan of Action for Children 2005 as the basis. The forum at present comprises MOS&PI, MoHRD and MoH&FW, other Government of India 33 Organisations, research institutions and NGOs In the functions organised by NSSO Offices in different parts of the country on the Statistics Day, the issues related to national and subnational level statistics on children have been discussed in special meets of experts and statisticians of the regions. A panel discussion was organised on the subject during the Central event held in New Delhi on the 4th Statistics Day2010. The Central Statistics Office (Social Statistics Division), O/o the Registrar General of India & Census Commissioner and the UNICEF-India made presentations highlighting various statistical concerns about childrelated official data and the actions required at various levels for addressing the data gaps and methodological problems. During the year, the Planning Commission has also approved a proposal of the MoS&PI to start a project for ‘Survey on Measuring Outcome for Children and Women’ aimed at producing statistics to measure well being of children and women through a few key outcome indicators. MDG Tracking 4.62 CSO is the nodal agency for statistical tracking of the Millennium Development Goals (MDGs) in India. The third India country report on the MDGs for the year 2009 has been brought out in the form of Mid Term Statistical Appraisal Report towards achieving the targets for India under the MDG-framework. The report has been published in English and Hindi versions and released by Hon’ble Vice President of India on the occasion of Statistics Day 2010 observed on 29th June 2010. A roundtable on Achieving the MDGs by 2015: Policy Action for Human Freedoms was organized by the Ministry of Statistics and Programme Implementation and the United Nations Development Programme (UNDP) during 7-8 September 2010 in New Delhi. Policy-makers, implementers, social scientists, statisticians and representatives of civil-society gathered to deliberate on India’s Millennium Development Goals (MDGs) report card-with particular focus on the problems of malnutrition, child survival, maternal survival and access to sanitation. The strengths, weaknesses, opportunities and threats to India’s march towards the MDGs were critically examined within a human rights-based framework. SAARC Social Charter 4.63 The Ministry of Statistics and Programme Implementation as the designated nodal Ministry for coordination and monitoring of implementation of the SAARC Social Charter objectives, facilitated successful completion of all the short-term capacity development projects indentified under the thematically listed areas of regional cooperation taken up by various institutions under the Government of India with the participation of the member countries of SAARC. The India Country Report on SAARC Social Charter for the Year 2008-09 released in March 2010 highlighted these features along with the country situation with respect to the charter-objectives and attainments. A draft framework on SAARC Regional Poverty Profile 2009 on the theme ‘Food Security Challenges for the Poor and Social Inclusion’ was prepared and sent to the SAARC Secretariat. In the meeting of the country teams for preparation of the Regional Poverty Profile 2009 report, held during 6-7 October, 2010 in Kathmandu, the framework was considered and changing the title of the report was recommended. The first meeting of the Inter-Governmental Mechanism for midterm review of the achievements of the SAARC Development Goals (SDGs) and Plan of Action on poverty alleviation was held in Kathmandu, Nepal during 28-29 September, 2010, wherein the draft framework for SDGs report prepared by India was discussed and adopted with minor modification. A Country Report on SDGs in India has been drafted for release during the year. 34 Basic Statistics for Local Level Development 4.64 The Planning Commission has given in-principle approval for the scheme: Basic Statistics for Local Level Development (BSLLD). Under the Scheme, village level statistics are being compiled from the existing village level registers through a village schedule canvassed by the PRIs with the help of village level functionaries such as Anganwadi workers, ANM, Chowkidar, village Pradhan, revenue officials, Patwari, etc. Prior to drafting of a new scheme proposal as a centrally sponsored scheme in all the States/UTs, the Planning Commission suggested to roll out a pilot scheme to identify data sources for compilation of information on basic statistics for local level development. To capture required data on various socio-economic indicators and their sources, in respect of reference year 2008/09, the scheme is in operation in 32 States/UTs except Delhi, Chandigarh and Goa. A special-purpose software developed for the purpose of creation of village level database and generation of reports has been used by the participating States/UTs for preparation of pilot data tabulations. As on 31st December 2010, 18 States/UTs have completed the first phase of the scheme and submitted reports to the MoSPI. Based on the findings of these reports, a cross-sectional synthesis report has been drafted and submitted for consideration in connection with formulation of a full-fledged centrally sponsored scheme for BSLLD. The second phase of work under the pilot scheme for collection of 2009-10 data has also been started in the current year and will be continued during 2011-12. 4.65 During a workshop held in New Delhi during 22-23 July, 2010, in which the officials of DES of States/UTs participated, the progress of the first phase pilot work, problems faced and possible solutions, framework for report writing etc. were discussed. Disaster Statistics 4.66 A Framework for Disaster Statistics was developed with a view to devise a comprehensive database at national and sub-national level and the same was circulated among the Directorates of Economics and Statistics (DES) of all States/UTs. The disaster management comes under the purview of the revenue/home departments States/UTs. There were some issues related to the flow of data from the respective departments to the DESs. Keeping this in view, a two-day seminar was organised on Disaster Statistics in New Delhi during 22-23 July 2010. During the seminar the officials from DESs of States/UTs discussed the issues connected with the collection, compilation and the reporting of the disaster statistics. Environment Statistics 4.67 The tenth issue of the annual publication ‘Compendium of Environment Statistics’ was a combined one covering the years 2008 and 2009 was brought out in March, 2010. The contents of the publication is broadly based on the ‘Framework Database on Environment Statistics (FDES)’ proposed by United Nations Statistical Division (UNSD) covering Biodiversity, Atmosphere, Land and Soil, Water and Human Settlements. This publication has been useful in understanding various aspects of environment and its impact on the sustainable development. In addition to this the publication gives a conceptual view of the environment, environmental degradation, impact of development and developmental activities on environment, emissions, discharges, its sources and health hazards. 35 4.68 A two-day workshop had been organised on Environment Statistics in collaboration with Ministry of Environment and Forest for officers of selected Directorates of Economics & Statistics, ENVIS centres and Central Ministries related to environmental issues during 2223 September, 2010 at WWF Centre, Lodhi Road, New Delhi. The Seminar was aimed at improving coordination among the participating organizations and explored the possibilities of data flow from the ENVIS centre to strengthen the Environment Statistics with more disaggregated information available with ENVIS Centres. Climate Change Statistics 4.69 The ‘Expert Committee on Climate Change Statistics’ constituted by CSO on the recommendations of 16th Conference of Central and State Statistical Organizations (COCSSO) held at Shimla during 4-5 December, 2009, has since submitted its draft report. The Ministry of Environment and Forest has been consulted and the report is being uploaded on the website of Ministry of Statistics & Programme Implementation. Measuring Green GDP of India’ 4.70 In the past, CSO had undertaken eight studies on Natural Resource Accounting covering the sectors like Air, Water, Land and Soil, Mining and Forest. It was decided that a synthesis report may be prepared by amalgamating the suggestions and methodologies evolved out of the eight studies and a methodology to be devised for Natural Resource Accounting in India. A project has been awarded to Centre for Economic and Social Studies (CESS), Hyderabad to undertake the same. A Technical Advisory Committee has been constituted under the chairmanship of Dr. Kirit Parekh, to oversee the work of CESS and provide technical guidance to CESS in this regard. So far two meetings have been conducted and the synthesis report is expected to be prepared during this financial year. Awards, Fellowships and Research Studies in Statistics 4.71 The Social Statistics Division implements a scheme ‘Awards and Fellowships for Outstanding and meritorious Research work in Statistics’ to encourage independent and high quality research work in the field of Applied Statistics particularly on the issues and problems relating to Official Statistical System in the Country. Besides, financial assistance is provided to research institutions/ organizations/ NGOs for surveys / studies in Official Statistics. An Empowered Committee under the Chairmanship of Chief Statistician of India and Secretary of Ministry of Statistics and Programme Implementation assisted by a Screening Committee under the Chairmanship of DG (CSO), approves the proposals for research studies/ travel grants and nominations of awards. During the year Travel Grant was provided to one statistician to enable him to present his paper in an International Conference. Two research projects have been completed and six new research proposals have been sanctioned during the year. Draft reports of ten projects are under examination. During the year, financial assistance was provided for organizing 18 national / international conferences/ Seminar/ Workshops. On the Occasion of Statistics Day, 2010, celebrated on 29th June 2009, Prof.P.V.Sukhatme National Award in Statistics for the year 2009-10 was conferred on Prof.Alok Dey of Indian Statistical Institute (ISI), Delhi. Eleven winners of the on-the-spot essay writing competition organized by MOSPI were also given prizes on the occasion. 36 India Statistical Strengthening Project (ISSP) 4.72 The Ministry of Statistics and Programme Implementation (MOSPI) is implementing a World Bank aided Centrally Sponsored Scheme “India Statistical Strengthening Project” (ISSP) for strengthening of the Indian Statistical System, with a focus on the strengthening of the State/UT level Statistical Systems as envisaged in the National Strategic Statistical Plan 2008. The project has gone through rigorous approval process. 4.73 The Expenditure Finance Committee (EFC) for the ISSP recommended the proposal for implementation of the project as a Centrally Sponsored Scheme at an estimated cost of `.650.43 crore ; 80% of the cost will be funded through a World Bank loan, and 20% will be borne by the Government of India. However, in so far as the 20% component is concerned, the cost on account of the Civil Infrastructure (except for those on regional training centers) would be shared by the participating States/UTs and Government of India at 25:75% basis respectively. In case of the North-Eastern States and Jammu & Kashmir, the sharing pattern of expenditure on civil infrastructure activities would be 10:90% respectively. 4.74 The Full Planning Commission’s approval for the proposal was received by MOS&PI on 2.3.2010. The Cabinet Committee on Economic Affair (CCEA) approved the project on 19th March 2010. The loan agreement between Government of India and the World Bank was signed on July 9, 2010. The entire loan amount has since been received by the Government of India in single tranche. 4.75 Potentially, all the States/UTs are eligible to participate in the project. The Ministry has, as of now, received formal Letters of Participation (LOPs) from 32 States/Union Territories viz. Arunachal Pradesh, Assam, Andhra Pradesh, Andaman and Nicobar, Bihar, Chhattisgarh, Daman & Diu, Delhi, Gujarat, Haryana, Himachal Pradesh, Jammu & Kashmir, JharKhand, Kerala, Karnataka, Lakshadweep, Madhya Pradesh, Manipur, Maharashtra, Meghalaya, Mizoram, Nagaland, Orissa, Puduchery, Punjab, Rajasthan, Sikkim, Tamil Nadu, Tripura, Uttar Pradesh, Uttrakhand, and West Bengal. 4.76 The States/UTs which have sent their LOPs would then be required to prepare their comprehensive State Strategic Statistical Plans [SSSPs]. Guidelines for the preparation of State Strategic Statistical Plan (SSSPs) have since been sent to all States/UTs. 4.77 During the year CSO organized regional workshops in order to assist States/UTs to develop their SSSPs. The principal objective of these regional workshops was to provide hand holding type trainings and guidance, for the preparation of the State Strategic Statistical Plans (SSSPs). In addition, the States/UTs were briefed about ISSP and SSSP during the Conference of Central and State Statistical Organizations (COCSSO) held during 8-9 February 2010 at Thiruvananthapuram, Kerala. A workshop on the ISSP and SSSP guidelines for the benefit of the state level/state coordinators Deputy Director Generals (DDGs) of the, National Sample Survey Organisation, Field Operations Division [NSSO (FOD)] posted in the States was conducted at Thiruvananthapuram on February 10, 2010 in order to enable their supportive and coordinating role to play in terms of assisting the respective States/UTs on all matters concerning the preparation and implementation of their SSSPs. The schedule of workshops was as follows: 37 Regional Workshops / Period Southern States February 4-5, 2010 DDGs Workshop February 10, 2010 Northern States March 25-26, 2010 Eastern States May 24-25, 2010 States Venue Karnataka, Tamil Nadu, Kerala, Andhra Pradesh, Maharashtra, Gujarat and Puducherry Workshop for Deputy Director Generals (DDGs) of NSSO posted in the States. Himachal Pradesh, Haryana, Punjab, Uttar Pradesh, Rajasthan, Uttarakhand and Jammu & Kashmir Orissa, West Bengal, Bihar, Madhya Pradesh, Chhattisgarh, Jharkhand, Assam, Nagaland and Andaman & Nicobar Islands Arunachal Pradesh, Meghalaya, Mizoram, Manipur, North Eastern States and the remaining states Tripura, Sikkim, Goa, Daman and Diu, Lakshadweep, Chandigarh, Dadra Nagar Haveli June 21, 2010 Chennai Thiruvananthapuram Faridabad, Haryana Patna Shillong 4.78 For the preparation of SSSP and its related activities, an amount of `.10.00 lakhs is being released to the participating states/UTs except the States of Haryana and Chhattisgarh. These two states have been released an amount of `. 7 lakh as seed money in view of the earlier assistance received by them for this purpose from Trust Fund for Statistical Capacity Building [TFSCB] of the World Bank.As on 31stDecember, 2010, the seed money has been released to 29 States/UTs. 4.79 The task of preparation of the required SSSPs has been initiated by few of the States participating in the project, and this work is at various stages. o SSSP of Karnataka has been approved by the State Cabinet. Memorandum of Understanding [MoU] has been signed between Government of India and Government of Karnataka for implementation of their SSSP. Release of first installment of funds to Government of Karnataka has been done. 38 (MoU on ISSP signing ceremony between Governments of India & Government of Karnataka held at Bangalore on December 10, 2010.) o Seven States, namely, Andhra Pradesh, Bihar, Chhattisgarh, Gujarat, Haryana, Rajasthan and Tamil Nadu have prepared their first draft SSSPs. o In two States, namely, Orissa and Uttrakhand, it is understood that substantial progress has been made in terms of the preparation of the respective SSSPs. o In three States, namely, Andaman and Nicobar, Himachal Pradesh and Punjab the Chief Secretaries concerned have since taken meetings at their level to issue necessary directions and review the course/status of progress concerning the project, in preparation of SSSP in their respective States. o Punjab and West Bengal have finalized the selection of the consultants. The States/UTs namely, Assam and Himachal Pradesh, have initiated the process for finalization of their consultants for preparation of SSSPs. o In remaining participating States/UTs, the task of preparation of the required SSSPs is at its early /initial stages. o National Statistical Commission (NSC) reviewed the progress of ISSP at its zonal meetings held in Chennai, Patna and Shillong during 2010. City Group (DELHI GROUP) on Informal Sector Statistics 4.80 The “Expert Group on Informal Sector Statistics” (Delhi Group) was set up in 1997 as one of the city groups of United Nations Statistical Commission (UNSC) to address various 39 methodological issues involved in the treatment of the informal sector. The Secretary, Ministry of Statistics and Programme Implementation, Government of India is the Chairman of the Delhi Group. The Group, since its inception in 1997, has been providing an international forum for exchange of country experiences in the estimation of employment in the informal sector, its contribution to Gross Domestic Product (GDP) and statistical standards being used in different countries. (11th meeting of the Delhi Group on Informal Sector held at ILO Hqrs. Geneva during January 27-29, 2010 ) 4.81 Eleven meetings of the Group have taken place so far. The reports of the meetings of the Group are available on the web-site of the ministry. The Draft Manual on Informal Employment and Informal sector, which is being prepared by a team of experts with ILO as lead agency, was deliberated upon for finalization at the 11th meeting of the Group at Geneva during January 27-29, 2010. The manual is expected to be finalised in the 12th meeting of the Group. Statistical Standards (Manuals) 4.82 The Ministry has been preparing Manuals on various Statistical Indicators/Statistics. The objective is to document the processes, procedures and standard practices in vogue with regard to the compilation of Statistical Indicators in the country and to bring uniformity in the standards and concepts to be followed. A Steering Committee under the Chairmanship of the Director General, Central Statistics Office (CSO) has been constituted in this regards. The Committee has planned for 28 Manuals. The following Manuals have since been finalized and put on the Web-site of the Ministry. 40 1. 2. 3. 4. 5. 6. 7. 8. 9. 10. 11 Manual on Index of Industrial Production (IIP ) Manual on Annual Survey of Industries(ASI) Manual on Compilation of Wholesale Price Index (WPI) Manual on Financial and Banking Statistics National Accounts Statistics: Estimation of State and District Income2008 Manual on Cost of Cultivation Surveys. Manual on Crop Area and Production Statistics, Manual on Agricultural Prices and Marketing, Manual on Population Census and Manual on Vital Statistics Manual on Consumer Price Index Establishment of Consultancy Services Wing (CSW) 4.83 A Steering Committee has been constituted to formulate strategic action plan and to study modalities to establish Consultancy Services Wing (CSW) in the Ministry of Statistics and Programme Implementation. The committee, in its first meeting held on October 13, 2010, decided that a Sub-Group may be constituted to examine the details of the report of the feasibility study undertaken by Indian Agricultural Statistical Research Institute [IASRI] and to formulate strategic action plan along with the identification of actionable points including the budget lines. The sub-group may study the working of similar organization for preparation of its report. The report of the Sub-Group may be placed before the Steering Committee for its examination and taking appropriate decision. (First meeting of the Steering Committee on Consultancy Services Wing (CSW) is in progress) 4.84 As per the decision of the Steering Committee, a Sub-Group has been constituted on November 26, 2010, to examine the details of the feasibility study, Assessment of Survey Capabilities of Private Sector undertaken with the assistance of Indian Agricultural Statistics Research Institute (IASRI) and institutional form of the proposed establishment of a 41 Consultancy Services Wing (CSW) in the Ministry of Statistics and Programme Implementation. Human Resource Development Overview 4.85 The responsibility to equip the country’s large set of statistical personnel with newer practices in the official statistics and data management has been entrusted to the National Academy of Statistical Administration (NASA) which is functioning under the overall guidance of the Training Division, Central Statistics Office (CSO). The task before NASA is not only to develop an effective training strategy and impart training to the statistical personnel working in various Ministries and Department of Central Government and the statistical officers and officials from State/UTs Governments and Public Sector Undertakings but also to update curriculum, course material from time to time. The programmes conducted and organised at NASA entail induction, refresher trainings and a few need based specialised trainings on official statistics & related methodology. 4.86 NASA is also supporting capacity development of the statistical personnel of the friendly and neighboring countries. This entails conducting as well as organising request based trainings, International workshops and seminars. 4.87 During 2010-11 NASA has also initiated steps for popularizing Official Statistics through trainings & workshops for faculty and students of various universities. It is proposed to continue this initiative in future too. Besides, the Training Division of Central Statistics Office provides internships to PG students. In view of the overwhelming demand for learning the activities of CSO as well as NSSO, internship programme has been enlarged. From 201112 there is a proposal to increase the number of interns from 20 to 130 along with the increase in the coverage of placement. National Academy of Statistical Administration (NASA) 4.88 Since the operationalization of the National Academy of Statistical Administration (NASA), at Knowledge Park – II, Greater NOIDA, UP, on 13thFebruary, 2009, the Training Division functions from the NASA Complex with a camp office at the Jeevan Prakash Building, Kasturba Gandhi Marg, New Delhi. The Training Division is headed by an Additional DG, supported by two DDG level officers, 5 Directors, 6 Deputy Directors, 8 SSO, a few supporting and contractual staff. Facilities 4.89 The NASA has state–of-the-art facilities for training and boarding and lodging for trainees, alongside administration and residential accommodation for faculty and supporting staff. It is situated in a serene environment, almost 50 Kms away from Delhi, in the midst of an upcoming institutional area, in the NCR region. The NASA complex has three well organised building blocks, the centrally air conditioned Academic cum Administrative Block, the Hostel Block and the Residential block, surrounded by well maintained landscapes . 42 4.90 The facilities available in the Academic and Administrative Block,besides the office space for administrative functions inter-alia include a Conference Hall with a seating capacity of around 120 persons; a centrally air conditioned Auditorium- “Mahalanobis Auditorium”, equipped with digital sound, light and stage system, back stage rooms and with a seating capacity of around 160 persons; five Lecture/Training/ Seminar Halls, fitted with latest computerised teaching aids; a library, namely the Sukhatme Library; IT teaching centre equipped to conduct training of 30 trainees at any point of time , attached with an IT Lab for practising and Electronic Data Processing (EDP). Utilization of these facilities has been to its full potential, during the year. 4.91 NASA has boarding and lodging facilities for around 100 trainees at any point of time, housed in 40 Single Bedded and 30 Double Bedded air-conditioned Rooms. During 2010-11, on an average 85% of the boarding and lodging facilities have been utilized. The complex has 20 residential flats/ houses for the faculty and the support staff. This year, indoor recreational facilities like Billiards, Table Tennis etc. have been operationalised, besides promoting outdoor games like volleyball and badminton. The participants are encouraged to refer to books and magazines in theSukhatme Library. Steps have been initiated to computerise the library with Library Management software. Infrastructure Development 4.92 During the year, the Academy focussed on establishment of IT infrastructure as a precursor to its plan of automating its activities and registering interactive online presence for multifarious tasks including e learning. Necessary upto date Hardware & Softwares for implementation of centralised administration & monitoring of the LAN are in place and the implementation would be completed shortly. TPAC 4.93 A high level Committee, the “Training Programmes Approval Committee” (TPAC) under the chairmanship of DG, CSO and comprising of very senior officers from CSO /MOSPI and a few outside experts from ISI, IIPA and NIFM assesses and approves the needbased training calendar for the year besides reviewing the syllabi, duration and training methodology for all the modules. Most of the courses are devised and conducted at NASA while some of the specialized courses are outsourced to reputed institutes/organizations in Delhi or outside. 4.94 Subjects covered in the various programmesby NASA are mainly in the areas of various Official Statistical Systems, Theoretical & Applied Statistics, Large Scale Sample Surveys, SNA 1993, Data Management Techniques, Information Technology, Management, Leadership, Communication, TQM, Presentation Skills, Financial Management, Micro and Macro Economics, etc. for the statistical personnel of the country covering induction and refresher training programmes for the cadre of Indian Statistical Service (ISS) officers and officials of the Subordinate Statistical Service (SSS). It also conducts/organizes customized training courses for statistical officers of State/UT Governments, Public Sector Undertakings and International participants as well. Regular Training schedule during the year 4.95 The training programmes organized by NASA are as follows: 43 (i) Two year Induction training of officers of the Indian Statistical Service (ISS); (ii) Induction and integrated training programmes for the Subordinate Statistical Service (SSS) officers including training of Trainers (TOTs) for these courses; (iii) Refresher Training Courses for the in-service ISS officers and senior officers from the States/UTs, officers/ officials of Central Ministries/Departments, State/UT Directorates of Economics & Statistics & other Line Departments and officers from PSUs; (iv) Request based refresher Training programmes for officers from Central/State/UTs and Public Sector Undertakings. (v) Three weeks exposure to official statistical system to M. Stat. Students of Indian Statistical Institute, Kolkata and other centres; (vi) Official Statistics Awareness Programmes for the faculty and students of Universities and Workshop at Universities. International Programmes: (vii) 6 weeks Training on official Statistics for the 11-month duration International Statistical Education Centre (ISEC) course for the international participants, conducted by ISI, Kolkata; (viii) International Conferences, Seminars and Workshops on emerging areas of Official Statistics; (ix) Short term training programmes and study visits for the statistical personnel / participants from countries in the SAARC region, Asia & pacific, Africa and other countries. Training Courses conducted till to date: 4.96 The highlights of this year’s training programmes are as follows: Induction Training: (i) Seven (7) Probationers belonging to XXX th batch of ISS completed the first year of induction training The probationary training for these officers is likely to end in June 2011. (ii) Eight (8) probationers (XXXI batch)joined the Indian statistical service during the 2010-11 and they have been put to the training modules devised for the first year of their probation. (iii) One induction training programme of 12 weeks for promotee JTS level officers of ISS was organised at NASA. 44 (iv) Eleven 8 weeks duration training programmes for the newly recruited SSS officials are being organized during 2010-11. Refresher Courses: 4.97 Out of the thirty one refresher training programmes planned for 2010-11, sixteen such training programmes on various topics have been conducted till January, 2011 and three additional trainings are planned during Feb/March 2011. Two Advanced Management Programme with overseas learning component have been started from this year, in collaboration with IIM, Lucknow. Of the two programmes, one programme of 3 weeks was exclusively for Director level officers and other course of 6 weeks duration was for Deputy Director General & above level officers. About 220 ISS officers shall finally be trained during 2010-11 through these programmes. 4.98 For the purpose of specialized training, NASA collaborates with various reputed/specialized Institutes inter-alia including ISI, Kolkata; JNU, Delhi; Madras School of Economics, Chennai; RIPA, Jaipur; IIRS, Dehradun; ASCI, Hyderabad; Labour Bureau, Shimla; IIPA, IIPS, NIFM, NIRD, ISTM, Delhi School of Economics, Delhi; IASRI, ICAR, V.V. Giri National Labour Institute and many more. Training of State Statistical Personnel: 4.99 As of now, these programmes are based on specific requests received from the States and UTs. These training programmes solely depend on receipt of adequate nominations from the concerned State/UTs/PSUs. 4.100 Till January, 2011, seven training programmes have been organized in various areas of interest to State Governments/UT’s. One additional training on Computer is planned during the remaining year. Around 100 officers will be trained during the year. Refresher Training Programme for SSS Officials: 4.101 Nineteen Integrated Training Programmes (ITP) of 2-week duration each are being organized for SSS officials during 2010-11. It includes the trainings conducted at DPD, Kolkata& Zonal Centers of FOD. In all about 250officials are being trainedin these programmes, in the current year. International Trainings / Workshops: 4.102 Like previous year, Six Weeks ISEC training porgramme was organized during 4th October - 12th December, 2010 wherein about 23 participants from 7 countries, namely – Afghanistan, Sri Lanka, Myanmar, Russia, Gambia, Cuba & Mongolia participated in the training on “Official Statistics “. Other Trainings : 4.103 three-week course on “Official Statistics” was conducted for M. Stat. Students of Indian Statistical Institute, Kolkata during 24th May – 11th June 2010. A total of 56 students attended the training programme. 45 Official Statistics Awareness Programmes: 4.104 With an aim to popularize Official Statistics among the University teachers, as well as students, two Training of Trainers for University HOD’s and two training programmes for University students were organised during 201-11. Besides this, One workshop was also organised at Punjab University wherein senior officers from the Ministry interacted with the participants and exposed them to broad areas of Official Statistics & opportunities therein. Other Important Events: 4.105 Two Committees were set up in the previous year for issues pertaining to training on Gender Statistics & Training Need Assessment (TNA) of State Government/UT’s . During 2010-11 course curriculum for training on Gender Statistics was devised on the basis of the recommendation of the Committee headed by DG, CSO and a five day training was conducted drawing resources from various organisations/Departments like UNDP, M/o W&CD, SSD, CSO, IIPA etc. Agency for carrying out TNA was also selected and further action has been initiated. Commonwealth Conference: 4.106 The Training Division of the Ministry of Statistics & PI organised the 15th Conference of Commonwealth Statisticians in New Delhi during 7-10 February, 2011. The Conference was inaugurated by the Hon’ble Union Minister of Statistics & PI, Dr.M.S Gill. It was attended by more than 500 participants comprising delegates from most of the Commonwealth Countries, International Organisations, senior officers from Government of India/State Governments, universities, reputed institutes, experts and academicians. The four days conference deliberated on issues of relevance to Commonwealth countries particularly in the field of managing economic, social and environmental issues. It also dealt with the current issue of developing appropriate economic and social indicators measuring bubbles in the economy, the progress of societies and issues of demographic transition. At the end of the conference, a working group of ten countries namely Australia, Belize, Cameroon, Canada, Ghana, Guyana, India, South Africa, Tonga and UK was constituted to guide for continuity of the network of Commonwealth Statisticians and for evolving the future framework. 46 CHAPTER V NATIONAL SAMPLE SURVEY OFFICE Organisation and Functions 5.1 The National Sample Survey Office (NSSO), a subordinate office of the Ministry of Statistics & Programme Implementation entrusted with the responsibility of conducting large scale nation-wide sample surveys for generating statistics for bridging the data gaps on varied socio-economic aspects, crucial for planning, policy formulation and informed decision making. Primary data is collected regularly through nation-wide household surveys on various Socio Economic subjects, Annual Survey of Industries (ASI) of establishments under the Collection of Statistics Act, 1953 and Enterprise surveys as a follow up of the Economic Census. Besides these surveys, NSSO collects data on rural and urban prices for construction of Consumer Price Indices for different segments of population and plays a significant role in the improvement of Agriculture statistics through supervision of the area enumeration and crop estimation surveys of the State agencies under Improvement of Crop Statistics, a Centrally Sponsored Scheme. It also maintains a frame of urban area blocks as an equivalent of villages in rural sector for use in sample surveys in urban areas. The Organisation functions under the overall direction of National Statistical Commission and thus, has requisite autonomy in matters relating to data collection, its processing and publication/dissemination of results. Director General and Chief Executive Officer (DG & CEO) is responsible for coordinating and supervising all activities of the organization and is assisted by three Additional Director Generals and 65 Deputy Director Generals in discharge of his responsibilities. 5.2 The NSSO has four Divisions namely Survey Design and Research Division, Field Operations Division, Data Processing Division, and Co-ordination & Publication Division. The Survey Design and Research Division (SDRD) is located at Kolkata. It is responsible for technical planning of the survey, formulation of sample design, designing of enquiry schedules & other survey instruments and preparation of survey reports. The Field Operations Division (FOD) has its headquarters at Delhi / Faridabad with a network of six Zonal Offices, 49 Regional Offices and 116 Sub-Regional Offices spread throughout the country. This Division is responsible for the collection of primary data for the various surveys undertaken by NSSO. The Data Processing Division (DPD) has it’s headquarter at Kolkata. It has six Data Processing Centres located at Delhi, Nagpur, Ahmedabad, Bangalore, Giridih and Kolkata. It is responsible for sample selection, software development, processing and tabulation of the data collected through surveys. The Coordination and Publication Division (CPD) functions as secretariat of DG&CEO NSSO and coordinates all the activities of different Divisions. It also brings out the bi-annual journal of NSSO “Sarvekshana” and organizes seminar on Survey Results of different NSS rounds. 47 Release and Finalisation of NSS Reports NSS 64th round 5.3 The 64th round of NSS (July 2007-June 2008) focused on Education, Employment and Migration along with the annual survey on Household Consumer Expenditure. The following reports on the survey were released. • • • • Report No.530: Household Consumer Expenditure in India: 2007-08 Report No.531: Employment & Unemployment Situation in India 2007- 08 Report No.532: Education in India 2007- 08: Participation & Expenditure Report No.533: Migration in India 2007- 08 After publication and release of the Reports relating to NSS 64th Round, the unit level data pertaining to three schedules of the survey have also been disseminated in the public domain. NSS 65th round 5.4 The 65th round of NSS (July 2008-June 2009)was devoted to survey on Tourism, Housing Condition and Slum. The following reports based on the survey have been released. • • • Report No. 534: Some Characteristics of Urban Slums 2008-09 Report No.535: Housing condition and Household amenities in India, 2008-09 Report No.536: Domestic Tourism in India, 2008-09 The Unit level data sets on Domestic Tourism, Survey on Housing Condition and Slum were finalized coinciding with release of reports and have been disseminated. NSS 66th Round (July’09-June’10) 5.5 The 66th Round of NSS (July’09-June’10) was devoted to quinquennial survey on Employment & Unemployment and Household Consumer Expenditure. A total of 12784 first stage sample units (FSUs) were covered in Central Sample. The field work of 66th round was completed successfully by all the field offices of FOD by the end of June 2010 as per the schedule. The following reports of the survey are scheduled to be released. Sch. 1.0(Household Consumption Expenditure) (i) Level and Pattern of Consumer Expenditure, 2009-10 (ii) Household Consumption of Various Goods and Services in India, 2009-10 (iii) Public Distribution System and Other Sources of Household Consumption, 2009-10 (iv) Energy Sources of Indian Households for Cooking and Lighting, 2009-10 (v) Nutritional Intake in India, 2009-10 48 (vi) Household Consumer Expenditure among Socio-Economic Groups, 2009-10 (vii) Perceived Adequacy of Food Consumption in Indian Households, 2009-10 Sch. 10( Employment And Unemployment) (i) Employment and Unemployment Situation in India: 2009-10 (ii) Employment and Unemployment Situation among Social Groups in India: 2009-10 (iii) Status of Education and Vocational Training in India: 2009-10 (iv) Participation of Women in Specified Activities along with Domestic Duties: 2009-10 (v) Employment and unemployment situation in cities and towns in India, 2009-10 (vi) Informal Sector and Conditions of Employment in India, 2009-10 (vii) Home-based Workers in India: 2009-10 (viii) Employment and Unemployment Situation among the Major Religious Groups in India: 2009-10 Presently the data processing work of the round is underway. Data validation of Sub-rounds-I and II of 66th round has been completed so far. Data validation of other sub-rounds is now in progress. Development of software for tabulation is also underway. Activities related to ongoing Socio-economic Surveys and other ad-hoc surveys NSS 67th round (July’10-June’11) 5.6 The 67th Round of NSS (July'10-June'11) is devoted to the survey on 'Unincorporated Non-agricultural Enterprises covering manufacturing, services and trading enterprises". The survey would cover Non-Directory Establishments (NDEs), Directory Establishments (DEs) and Own Account Enterprises (OAEs). Survey instruments for the survey viz. Sampling Design, Field Scrutiny Programme, Pre- Data Entry Scrutiny Programme, Computer Scrutiny Programme have been finalized as per time schedule and currently the field work of the survey is in progress. 5.7 A total 16000 First Stage Units (FSUs) are expected to be covered under the survey in order to obtain reliable estimates for each of the three sectors viz. Manufacturing, Trade and Services from a single survey. The field work of survey is in progress. The field work for 6301 FSUs has been completed and filled-in schedules for 5142 FSUs have been dispatched to the designated Data Processing Centres by the end of Nov. 2010. 5.8 An All India Data Processing Conference for NSS 67th Round was held at Kolkata during th th 5 -6 October, 2010. This was followed by a series of regional Data Processing Conferences in each of the DP Centres of DPD during November-December, 2010. Officials of Directorates of Economics & Statistics of various States/UTs were also imparted training in those Conferences organised by the DP centres. 49 5.9 A separate Training Workshop for the North-Eastern States is planned to be held during last quarter of 2010-11 at Guwahati. Software for data entry and other instruments for validation have been finalized. Pre-data entry checking of the received Schedules is underway. NSS 68th round 5.10 As per the decision of National Statistical Commission, the 68th round of NSS (July 2011-June 2012)will be devoted to quinquennial survey on ‘Household Consumer Expenditure’ and ‘Employment Un-Employment’. The Working Group has been constituted under the chairmanship of Prof. A.K. Adhikari, Retd. Prof. Indian Statistical Institute Kolkata to deliberate all technical aspects of the survey and finalise its design and survey instruments The Working Group already has held two meetings on 22-23 September 2010 and 20-21October 2010. The third meeting of the Working Group has been scheduled on 6th – 7th January 2011. The Working Group is expected to finalize the issues concerning concepts, definitions and all other technical matters including sample design and schedules of enquiry in its third meeting. 5.11 In addition to the normal round work as above, the following had been accomplished: (i) The final Report of the NSC Committee on Periodic Labour Force Surveys(PLFS) has been submitted to NSC . (ii) Survey on NREGA: NSSO is conducting a survey on NREGA (sponsored by Ministry of Rural Development) to measure the impact of the implementation of Mahatma Gandhi National Rural Employment Guarantee Act (MNREGA) in the States of Madhya Pradesh, Andhra Pradesh and Rajasthan with effect from August 2009. This is a panel survey to be conducted in four visits during a period of two years. The objective of the survey is to measure employment generated through NREGA programmes and its impacts on key socio-economic characteristics of the participating households. Field work of the survey, which started in August 2009, is currently under progress. A total of 912 samples (FSUs) have been allotted for each visit to these three states ( Andhra Pradesh, Madhya Pradesh, Rajasthan) (304 samples each for two sub-rounds), spread in eight regional offices of Field Operations Division namely Cuddapah, Hyderabad, Vijaywada, Bhopal, Gwalior, Jabalpur, Ajmer and Jaipur. The work of 1st sub round of third visit has been completed and work of 2nd sub-round of third visit has started in October, 2010. Up to the end of November, 2010, work in 772 Sample FSUs was completed out of an allotment of 912 sample FSUs. Data processing work relating to the 1st visit has been completed. (iii) On the request of Ministry of Social Justice and Empowerment, NSSO undertook a pilot survey on Prevalence of Harmful Drugs in February – March 2010 by the NGO under the supervision of FOD. The field work of pilot survey was carried out in three regions viz. Mumbai, Amritsar and Imphal. The draft report of the pilot survey has been prepared. 50 (iv) The Committee on Optimum Sample size of NSS surveys for North Eastern states was set up under the chairmanship of Prof. Atul Sharma, former Member, 13th Finance Commission. The report of the Committee is under finalization. Other Surveys Agricultural Statistics Surveys: 5.12 NSSO (FOD) has the responsibility of guiding the States in developing suitable technique for obtaining reliable and timely estimates of area and yield and ensuring adoption of uniform concepts, definition and procedures in the collection of crop area and yield statistics by States. It keeps a constant watch on the quality of Agriculture Statistics through the scheme for Improvement of Crop Statistics (ICS). Under the scheme, sample check on the primary field work relating to area enumeration and area aggregation in approximately 5000 villages in an agriculture season and supervision of about 16000 crop cutting experiments in each agricultural year are undertaken by NSSO(FOD). 5.13 In Agricultural Year 2010-11,upto November, 2010, sample check on area enumeration has been completed in 1206 villages during Early Kharif and 4560 villages during Kharif as against 1270 and 4939 villages planned respectively.As regards progress of sample check on crop cutting experiments, 858 experiments have been supervised during Early Kharif, 5433 experiments during Kharif and 43 experiments during Summer 2010-11 as against 930, 8768 and 950 experiments planned respectively. 5.14 The data collected through the supervision of crop cutting experiments at harvest stage are also utilized to compute the estimates of yield rate of specified crops for the States covered under ICS. Estimates of yield rate for as many as 192 Crops pertaining to these States for the year 2009-10 and 21 Crops for the year 2010-11 were prepared and forwarded to the Ministry of Agriculture, New Delhi as per the pre-decided time schedule. 5.15 The findings of ICS are brought out in the form of reports “Review of Crop Statistics System in States through Scheme for Improvement of Crop Statistics”. The State wise reports are brought out for Kharif and Rabi seasons of each Agricultural Year. During 2010-11 up to November, 2010, State wise Reports for Kharif & Rabi, 2008-09 have been brought out for all 22 States/UTs and for Kharif, 2009-10 for 3 States/UTs. These Reports have been sent to DES of the respective State Governments , M/o Agriculture, and other agencies for necessary action. A consolidated All India report “Review of Crop Statistics System in India through Scheme for Improvement of Crop Statistics” is prepared annually. The last report was published for 2007-08 and report for 2008-09 is under progress. Urban Frame Survey: 5.16 Urban Frame Survey (UFS) is conducted on continuing basis to provide an updated frame of First Stage Units (FSUs) for conducting Socio-Economic surveys in Urban Areas. The UFS Blocks are updated once in five year period. The maps prepared during updation along with 51 block information of UFS are made available to users in Government Departments and Private Institutions. 5.17 The work of the current phase 2007-12 started in the month of July, 2008, under revised Guidelines. In this phase, 4991 Towns consisting of 503222 blocks have been formed/updated up to the end of November, 2010. The updation process of the current phase is still going on and is expected to cover around 5,300 towns or 6,00,000 UFS Blocks. Price Data Collection Surveys: Rural Retail Price Collection: 5.18 The FOD collects regular monthly rural price data for the compilation of consumer price index for agricultural and rural labourers. The Labour Bureau, Ministry of Labour, compiles and publishes the CPI (AL/RL) with the base year 1986-87=100, which covers 603 villages in 340 districts of 23 States/UTs across the country. Field Operations Divisions of NSSO has earmarked 69 Investigators for RPC in 603 villages on behalf of Labour Bureau. The Labour Bureau provides the required budget under CPI-Plan Scheme for conducting the RPC survey. Consumer Price Index (Urban), CPI (U): 5.19 Regular price collection work for CPI (U) was started from 1st May 2008 for 1114 quotations from 310 towns/ markets centres by the field offices of FOD as the CPI (U) has replaced the erstwhile (Middle Class Price Collection) used for compilation of CPI (UNME). FOD is concerned for only 1078 quotations, while the remaining 36 quotations are being monitored by the PCL Unit of CSO. In this scheme, 155 S.I Gr. II are involved in data collection and 31 S.I Gr-I for supervision/inspection work. A web portal has been created by NIC for the speedy transmission of data from field. Field functionaries have been provided with laptops for the collection of data and transmission as an innovation in data collection Annual Survey of Industries 5.20 Annual Survey of Industries (ASI) is a regular survey undertaken by NSSO . The field work is conducted by NSSO FOD . The data collected in the prescribed ASI returns is forwarded to CSO (IS Wing) which process the data. The field work of ASI 2008-09 has been completed and total 58300 units have been surveyed. The gross allotment for ASI 2009-10 is 61080 Units, out of which 10274 Units have been surveyed till the end of November, 2010. The Standing Committee on Industrial Statistics(SCIS) is the apex body to decide on various issues of ASI including sampling design, criterion for Census unit and finalization of ASI Schedules etc. Training and Human Resource Development 5.21 Training of staff and officers , as an area of priority, has been undertaken in NSSO since very beginning . The Training Courses are being organized time to time for both ISS & SSS officers on different subjects/ schemes to improve the knowledge and skills of all officers and staff working in this organization. For ISS (in–service) officers ,NASA, CSO, organizes 52 refresher Courses on regular basis. Training Programmes for Field Staff/SSS officials are also being organized at Training Centers set up in each of the Six Zonal Offices of FOD. 5.22 These Training Centers conduct different types of training programmes for different categories of in-service staff as per the functional requirement of field offices on a regular basis such as on (i) Socio Economic (ii) Annual Survey of Industries (iii) Agriculture Statistics etc. About 1116 officials of FOD of different categories were trained up to the end of November, 2010 State Assistance 5.23 DPD is assisting the states in processing the state sample data of each round. DPD provides Sample List, all software including Data Entry Package, Validation software and tabulation software to the participating States and also shares the Central sample data with them. Tabulation of State sample data is also done at DPD as and when requested by the States. The Tabulation Workshop for 63rd round, where 33 representatives from 17 States / UTs had participated was held in Kolkata during 13 &14th Sept, 2010. Similar workshop for NSS 64th Round is scheduled to be held during 24-25thJanuary, 2011. Sarvekshana 5.24 Effective secretarial assistance to the Editorial Advisory Board of ‘Sarvekshana,’ an in house technical journal of NSSO was rendered to finalise the content of its issues. As a result, 93rd and 94th issues of Sarvekshana were brought out during the year. Papers for inclusion in the next issue, 95th in the series, were also finalized and this issue of ‘Sarvekshana’ is under printing and is likely to be released shortly. 5.25 Material for 96th issue of the journal was compiled and collated based on the papers short-listed for publication including integrated summary of the survey results of 63rd round of NSS, and sent to the chairman of the reconstituted Editorial Advisory Board for their view. Plan Scheme 5.26 The NSSO operates the Plan Scheme – ‘Capacity Development of NSSO’ during XI Five Year Plan. The achievements of the scheme are as under:i) During the year 2010-11, the infrastructure in field offices and head quarters of FOD are being further developed and strengthened. The authorization of funds amounting to `746.55 lakhs has been made for renovation work at FOD(HQ), Delhi/Faridabad, construction of building/hostel at Baroda, Ahmedabad and Jaipur and on-going construction work at RO Kohima and Meerut. ii) To extend the use of Information Technology in the field offices/ Headquarters of FOD, supply order for 300 Laptops and MS Office has been placed. About 250 Laptops are going to be procured after receipt of additional budget. 53 iii) Publicity of surveys conducted by NSSO is an important aspect of implementation of the schemes by FOD. Publicity material is being sent to all field offices. Calendars have already been dispatched to all field offices. First phase of publicity campaign through Newspapers about conduct of the Socio-Economic Survey (67th Round) has been completed during Aug.2010. This advertisement was repeated in November, 2010 and also proposed to be repeated during February, 2011. Video spots on 67th round of NSS were arranged for telecast by popular Channels .Publicity through advertisement about conduct of ASI 2009-10 have been made through newspapers iv) A Hostel building at Mahalanobis Bhavan, 164, G.L.T. Road, Kolkata was approved with the project cost of ` 4.28 crores for civil and electrical work by CPWD. The work started in the month of July 2006 with the plan of constructing G + 4 floors with 20 double-bedded rooms, 10 single-bedded rooms, 6 suites and 5 lounges in the building. The hostel building (named appropriately as “Sankhyiki Aawas”) including site development and furnishing was completed during the year and was inaugurated by Shri Sriprakash Jaiswal, Hon’ble Minister of State for Coal and Statistics &P.I., on 22nd June, 2010. The building is now being regularly used for accommodation of participants of various in-house training programmes v) Upgradation of existing computer system for reducing time-lag in data processing and data warehouse to ensure maximum efficiency in processing and tabulation of survey data thereby minimising the processing/ tabulation time. vi) Develop appropriate data archiving system for NSS data - archiving of old NSS Round data and software started for NSS surveys from 50thRound onwards. A comprehensive RDBMS proposal is under consideration. vii) The Data Processing Division, with its HQ at Kolkata and Data Processing Centres at Kolkata, Nagpur, Delhi, Bangalore, Ahmedabad & Giridih, is responsible for data entry, processing and tabulation of data from schedules of enquiry canvassed in various socioeconomic surveys of NSSO. Since the work involves computer intensive technology, there is a need for continuous review of the requirements (in terms of the system as also the computer equipments) in order to keep pace with fast technological development and obsolescence of IT equipments all over the world. viii) In DPD (Hq), a high-end server has been procured and installed, replacing the old server. At DP Centers Nagpur and Giridih, new LAN have been installed. At DPD(Hq) LAN has been upgraded. Tender processing for procuring 14 number of Xeon servers have been completed for replacing the old servers at the DP Centers. 54 ix) Rationalisation of Data Processing Facilities-In order to accelerate the data processing of socio economic surveys undertaken by NSSO, to facilitate complete data entry of listing Schedules and handling of additional workload (arising out of doubling the no. of households for annual consumer expenditure survey) two Data Processing Centres were established at Ahmedabad and Bangalore during Eighth Plan under the scheme “Rationalization of data processing facilities”. Improvement of quality and timeliness of data processing was thus the primary objectives of the scheme. With the creation of these two Data Processing Centres, the time lag in data processing of survey schedules has been substantially reduced. x) Digitisation of Survey Documents and NSS Reports are under progress. xi) Hard copies of the reports are published in-house and are disseminated in the form of both hard and soft copies. Seminar on 63rdRound Survey results 5.27 A national seminar on the results of NSSO 63rd round ( July 2006-June 2007) - survey on Service Sector Enterprises (excluding trade) and Household Consumer Expenditure was held at New Delhi during 2-3 June 2010. The seminar was inaugurated by Hon’ble MOS (Independent Charge) of Statistics & Programme Implementation and Coal, Shri Sriprakash Jaiswal. Papers were presented by ISS officers, Officers of State Directorates of Economics & Statistics, Central Ministries and other concerned Organisations / Institutions for discussion in the Seminar. 20 Papers were presented in three technical sessions in this seminar. Other Activities and achievements 5.28 The Statistics Day was celebrated on 29th June’2010 at Kolkata.On this occasion ,an exhibition on ‘India in Graphs and Charts’ was organized for two days. A publication, “Glimpses of Education in India” was released on the occasion. In the field offices of FOD also, functions were organized to commemorate the Statistics Day and seminars/workshops were held at number of places. 55 CHAPTER VI COORDINATION OF STATISTICAL ACTIVITIES 6.1 The Coordination and Publication (CAP) Division is mainly responsible for coordinating the statistical activities of various Divisions of the Ministry of Statistics and Programme Implementation, and maintaining a liaison with Central Government Ministries /Departments as also with State Governments and other Statistical Agencies. The Division isalso responsible for plan coordination for the Ministry as a whole, and formulation of Five Year and Annual Plans of the Ministry. Besides, the Division is also responsible for preparation of the Outcome Budget of the Ministry and for bringing out ad-hoc publications viz. “Statistical System in India” and “Directory of Sample Surveys in India”, besides some other regular publications. A. Coordination of Statistical Activities 6.2 As a part of the mechanism set up by the Government for coordinating the activities in the field of statistics in different States/UTs and Central Ministries/Departments, the Ministry organizes Conference of Central and State Statistical Organisations (COCSSO) every year. This is a major forum for discussing important statistical issues by the Central and State statistical agencies with the objective of putting in coordinated efforts for making available reliable and timely statistics to planners and policy makers for informed decision making. 6.3 The 17th COCSSO was organized during 8-9th February 2010 at Thiruvananthapuram, Kerala. The topics selected for the 17th COCSSO were (i) Consumer Price Indices by States- Need for Uniformity, and (ii) Economic Census. Besides, review of progress on India Statistical Strengthening Project (ISSP) and action taken on the recommendations of 16th Conference were also taken up. Presentations were also made on “Compilation of Infrastructure Statistics”, “Expectations of States/UTs from National Academy of Statistical Administration (NASA)” and “Conduct of Horticulture Census” as part of efforts to pursue the decisions taken in earlier Conferences and implement them in right spirit. The 18th COCSSO is being organized at Bhubneswar during January/February, 2011. 6.4 The Fourth Statistics Day was celebrated on 29th June 2010 by the Ministry, coinciding with the birthday of Prof. Mahalanobis, the doyen of Indian Statistical System. The day was inaugurated by Shri M. Hamid Ansari, Hon’ble Vice-President of India. Hon’ble Minister of State (Independent Charge) for Statistics & Programme Implementation, Shri Sriprakash Jaiswal and Prof. R.Radhkrishna, Chairman National Statistical Commission also graced the occasion. The Ministry has instituted two National Awards in Statistics in honour of great Indian Statistician Prof. C.R. Rao and in memory of Prof. P.V. Sukhatme to be conferred in alternate years. On Fourth Statistics Day 2010, the award in memory of Prof. P.V. Sukhatme was conferred on Dr. Alok De of Indian Statistical Institute, Delhi. On this occasion, prizes were also distributed to winners of Essay Writing Competition, organized for Post Graduate students in Statistics for various Universities. The theme of the Fourth Statistics Day was “Child Statistics”. On the occasion, a commemorating Brochure, and a poster were also brought out and released by the Ministry. Statistical Publications “Mid-Term Statistical Review of MDG Report, 2009”, CD on Dz 56 Ǧ ͷͲǦͲ dz the statistical publication “Energy Statistics-2010” were also released on the Statistics Day. 6.5 On the occasion of Statistics Day 2010 29th 2010, National Award in Statistics, constituted in the memory of Prof. P.V. Sukhatme was conferred to Dr. Alok De. Winners of the Essay Competition, organized by MOS&PI were also given prizes on the occasion. B. Plan Coordination and Review 6.6 The CAP coordinates the formulation of Five Year and Annual Plan activities of the Ministry of Statistics & Programme Implementation and submits to the Planning Commission. For the Annual Plan 2010-11, the Division prepared Annual Plan Proposals in respect of various schemes being operated by MOS&PI and submitted to Planning Commission. An outlay of ` 268 crore was approved for seven central sector and centrally sponsored schemes of the Ministry, excluding MPLADS for which ` 1580 crore was allocated. 6.7 The proposals for Annual Plan 2011-12 were also submitted to the Planning Commission during the year. The total outlay proposed for the central sector and centrally sponsored schemes for Annual Plan 2011-12 is to the tune of ` 1464.49 crore For MPLADS, `1700 crore has been proposed. Discussions on proposals of the Annual Plan, 2011-12 was held in January 2011 in the Planning Commission where besides the review of programme of plan schemes during 2010-11, proposed allocations and activities for 2011-12 were discussed. Subsequent to the discussion in the Planning Commission, proposed total outlay of the Ministry was revised to ` 771.78 crore against which Planning Commission approved an outlay of `600.00 crore. C. Outcome Budget 6.8 The Division is also responsible for bringing out the Outcome Budget of the Ministry. This Division prepares the Outcome Budget based on inputs from different Divisions/ Units of the Ministry. The Outcome Budget 2010-11 of the Ministry was brought out on time, and copies of the same were presented to both the Houses of Parliament. The work on preparation of Outcome Budget for 2011-12 has already started. D. Annual Action Plan 6.9 The Annual Action Plan (AAP) of the Ministry of Statistics and Programme Implementation is prepared by the Division every year at the beginning, and monitored quarterly after obtaining inputs from all the Divisions of the Ministry. The objectives of the AAP are: (ii) To reflect the manner and time frame of action in respect of activities and functions to be performed during the course of the year; (iii) To indicate the milestones and targets to be achieved in a each quarter; and (iv) To serve as an instrument for timely and efficient implementation of all the programmes and activities. 57 6.10 Annual Action Plan, 2010-11 was prepared during the year which contained the pending activities of previous year to be undertaken during the year and new initiatives proposed to be taken in 2010-11, besides routine items of the respective Divisions. In the Annual Action Plan 2010-11 each individual distinguishable activity was enumerated along with financial and physical targets giving the total workload to facilitate effective monitoring of progress. 6.11 During the year (till December 2010), the progress made by various Divisions of Ministry during the first quarter (April-June, 2010) and second quarter (July-September, 2010) were reviewed in the senior officers meeting at Secretary (S&PI)’s level, and further directions/ guidance were given. E. Sevottam Compliant Citizens’ Charter &Public Grievance System 6.12 The Division has been entrusted with the responsibility for preparing the Sevottam Compliant Citizen’s Charter and Public Grievance Mechanism of the Ministry. In this regard, appropriate action has been initiated as per the directions of the Cabinet Secretariat. Both the Citizen’s Charter and Public Grievance Mechanism of MOS&PI are being reviewed. F. Results-Framework Document (RFD) 6.13 During the year, as a part of the mechanism set up by the Cabinet Secretariat for monitoring and evaluating the performance of Government Ministries and Departments, the CAP Division has prepared a Results-Framework Document (RFD) of the Ministry for the year 2010-11 and submitted to Cabinet Secretariat, after the approval of Hon’ble Minister of State (Independent Charge) for Statistics and Programme Implementation. The RFD was discussed in a meeting with the Ad-hoc Task Force formed by the Cabinet Secretariat and revised based upon the observations of the Task Force. The activities contained in the RFD 2010-11 are being reviewed by Secretary (S&PI) on regular basis to ensure their completeness as per the targets. G. Strategic Plan 2011-16 6.14 As per the directions of Performance Monitoring Division of Cabinet Secretariat, the MOS&PI included a mandatory indicator in its RFD 2010-11 towards preparation of Strategic Plan 2011-16 of MOS&PI by 15thDecember, 2010. A series of Brainstorming Sessions and consultation with a large number of stakeholders were organized during the year. The Strategic Plan of MOS&PI was finalized and submitted to Cabinet Secretariat in time. 58 CHAPTER VII COMPUTER CENTRE Introduction 7.1 Computer Centre was set up in 1967 under the then Department of Statistics in the Cabinet Secretariat with 3 Honey-well-400 Computer Systems to meet the data processing needs of various Government Ministries/Departments/Organisations and Public Sector Undertakings located in and around Delhi. The Honeywell-400 Systems were replaced in 1981 by a more powerful third generation Burrroughs-3845 mainframe Computer System. After about a decade, the Burroughs-3845 Computer System was replaced in May, 1992 by a 4th generation mainframe Computer System DPS 7000/240. The Centre has now installed a sophisticated PC-based computer system under Client/Server Architecture using WINDOWS 2000/NT as the operating system and ORACLE 9i as data base software along with software tools Developer and Designer 2000. Now the Computer Centre is equipped with three servers i.e. Wipro server, HCL server and Sun Microsystemsweb server. Sun Microsystems web server has been installed exclusively for the development of National Data Warehouse. Main Activities of the Computer Centre 7.2 The main activities of the Centre are: (i) Creation and maintenance of website for the Ministry of Statistics and Programme Implementation (ii) Storage and Dissemination of NSSO, ASI and Economic Census data sets (iii) Creation and Maintenance of National Data Warehouse (iv) Training on Electronic Data Processing, Software Engineering and Information Technology (v) Designing and Development of software for CPI-New Series (Rural/Urban) (vi) Creation of and maintenance of National Data Bank on socio-religions categories (viii) Development of internal IT applications for the Ministry like intranet, video conferencing, cadre management systems etc. Progress of various activities during April, 2010 to December 2010: Data Preservation and Dissemination 7.3 As per the "National policy on dissemination of statistical data", Computer Centre has preserved a large volume of data generated through various socio-economic surveys, Enterprise Survey, Economic Censuses, Annual Survey of Industries and price data on CD-ROMs. These data are being disseminated regularly to a large number of national and international users. Technical guidance for the use of basic data and their processing are also provided to the users both within and outside the country, on request. The users includes individuals, universities, government and private organizations at national and international level. 59 The following table shows the Revenue received for different surveys during the year April 2007 to December 2010: Type of Surveys NSSO ASI EC NSSO ASI EC NSSO ASI EC NSSO ASI EC Year 2007-08 2008-09 2009-10 2010-11 No. of Users 180 42 9 162 34 29 96 32 6 129 46 12 ` 2179096 1143254 34563 2099437 475055 528687 1278526 168680 420652 2757008 1056846 471112 Revenue US $ 33636 26816 86 35499 38545 10557 43520 55576 3597 35185 9499 10369 UK £ 2131 37 0 2843 0 1088 444 0 0 196 0 0 Note : In the above table figures shown for 2010-11 are upto 31st December, 2010. Training Activity 7.4 Training has been one of the main activities of the Centre since beginning. Till now it has conducted IT courses for various States/UTs and Central government departments. Following training programmes were conducted from April 2010 to December 2010. (i) Training programme on ‘VB.Net & ASP.Net' for Computer Centre Officers conducted by STG Ltd. from 5th – 9thApril, 2010 (one week) was completed successfully. (ii) One officer from Computer Centre Attended Training Programme on ‘First group training course in application of information management and related ICT for official statistics’ during 5th May to 10th July, 2010 in Chiba, Japan. (iii) One officer was deputed as a resource person (expert) for United Nations ESCAP to conduct course on “Data Processing and CSPro” as a part of the “1st Group Training Course in Application of Information Management and Related ICT for Official Statistics” organized by the Statistical Institute for Asia and the Pacific, SIAP held in Chiba, Japan from 14th to 18th June, 2010. (iv) Knowledge sharing session on ‘First group training course in application of information management and related ICT for official statistics’ was organized by the officer concerned the Computer Centre on 4th October, 2010. 60 (v) Training programme on ‘CSPro Software’ for the officers of DPD (HQ) and SDRD, Kolkata from 20th – 24th September, 2010 (one week) was completed successfully in the Centre. (vi) Training programme on ‘ Fundamentals of Computer and MS-Office & Internet’ for Data Entry Operators of Computer Centre from 6th – 10th September, 2010 (one week) was completed successfully in the Centre. (vii) Two officers of Centre attended 2 days ( 09-10 June,2010) seminar on DevInfo India version 3.0 organized by CSO & UNICEF to develop in-house capacity for DevInfo software. (viii) Thirteen B.E (Computer Science & Engg.) / BCA/ B.Tech (Computer Science & Engg.) students of different universities are doing project in Computer Centre for two months to six month period. Among these four students were doing project under the scheme of Post Graduate / Researchers Internship program sponsored by NASA. Eight students have successfully completed the project. National Data Warehouse of Official Statistics 7.5 The Cabinet had approved creation of a 'Data Warehouse of official statistics' in the Ministry of Statistics and Programme Implementation to enable the data users and general public to have an easy access to the published as well as un-published validated data from one source. The development of this data warehouse was entrusted to Computer Centre. To set up the National Data Warehouse the Computer Centre procured COGNOS Data Warehouse tools. This comprises of applications and technologies for collecting, managing, processing and presenting multidimensional data for analysis. It will allow users to navigate data by drilling down to lower level details, drilling up to higher-level details, and pivoting. It will enable client applications to efficiently access the data in the warehouse through web. Achievements of work done from April 2010 to December 2010 1. Complete Meta data of all NSS rounds in NDW portal. Currently 25 Senior Officers of the Ministry have been allowed to access to the warehouse. 2. Requisite data marts/cubes has been updated for the followings NSS rounds: • Employment-Unemployment • Consumer Expenditure • Annual Survey of Industries • Disabled Persons • Index of Industrial Products • Slum • Non Agriculture Enterprises • National Accounts 61 Updation and Maintenance of Web-site of MOS & PI 7.6 The Web-site of the Ministry of Statistics and Programme Implementation is being developed and maintained by the Computer Centre. All the reports brought out by various Divisions of the Ministry are uploaded in the website and made available to users free of cost. Total no. of users registered during the year (Jan. to Dec. 2010) Total no. of reports/publications downloaded during the year (January 2010 – December 2010) = 13237 = 97723 Achievements during 2009-10: • The New Web Site has been launched after web-audit • Maintenance / updating of Existing /New Web Site is carried out as a regular activity . Intranet and Audio Visual Conferencing 7.7 The Computer Centre is in the process of formulating steps to implement Intranet applications including video conferencing facilities in the Ministry. Several meetings of Empowered Group for Video Conferencing and Intranet facilities wereheld to discuss various issues relating to Video Conferencing and Intranet such as; scope, coverage & specifications, size of LCDs, bandwidth connectivity for high speed of transmission, quality, site preparation, onsite warranty of equipments, onsite deployment of AMC Engineers to supervise the equipments and budget provision for implementation of the project. It was decided that the project may be awarded to National Informatics Centre(NIC), Ministry of Information and Technology on turn-key basis that should include both connectivity and VC equipment installation & maintenance for all 15 locations (excluding NASA, Greater Noida, UP) of the Ministry. On this decision, Dy. Director General, Computer Centre and Member Secretary of the Empowered Group were advised to complete the formalities to obtain the complete project proposal from the NIC. National Data Bank of Socio – Religion Categories 7.8 A web portal for the proposed National Data Bank of Socio–religious categories has been updated with data from Registrar General of India Office. ( New Price Series (CPI-Urban/Rural) The following activities were performed during the year 1. Software for the following applications were developed: • Generation of Price Index at Item, Subgroup and group level For All States/UTs and All India. • To generate House Index. 62 • Prepared the various CPI(U) files Price, PDS & House Rent required for Uploading on Web Portal. • Generate the Region wise Price Scrutiny list of CPI(U). • Generate the Week wise Missing Price quotations of CPI(U). • Generate the monthly Region wise Price position list. (viii) Data processing of CPI(Urban) to upload data January’2010 to October’2010. on Web Portal for the period (ix) Prepared Master Directories for Region wise allocation of Price data. (x) Prepared Item Directories for all States/UTs and All India for CPI(Urban) (xi) Trial Index generated for CPI(Urban) for the month of February 2010 and sent to CSO for checking (xii) Creation of Web Portal Address ‘urbanprices.gov.in’ for CPI(U) has been completed Economic Census (i) Prepared the district wise data & image files of 6 state/uts by extracting images from external media provided by State DES and handed over to Data Entry Unit for correction. (ii) Prepared 18 special tables using data of Fifth Economic Census, 2005 for all India and state-wise for number of establishments/workers by NIC X Sector X type of establishment . (iii) Prepared four special tables for sixth economic census using data of Fifth Economic Census, 2005 for all India and state-wise for number of establishments by 3 / 4 digit NIC. (iv) Imparting 4 days training for officers / officials of States/UTs DES on data correction software for Address slip schedule. ( 24-25 June,2010 and 30.06.10 & 01.07.10) and two day training for data entry operators for modification in data of address slip schedule pertaining to fifth economic census 2005. (v) Merged the corrected data of address slip schedule 57 provided by Data Entry Unit & prepared tables for 24 State/UTs in pdf format and sent to CSO along with unit level data. (vi) Generated sample tables for DDG, O/o, DC(MSME), M/o Micro, Small & Medium Enterprises, AGCR Building , ITO, New Delhi. Cyber Security Guidelines 7.9 In order to implement the Cyber Security guidelines issues by Ministry of Home Affairs and Department of Information Technology, Ministry of Information Technology, a Committee 63 has been constituted for protection of critical information, infrastructure and the steps to ensure security policy compliance at all levels: 7.10 The Computer Centre of the Ministry is having its own LAN system connected through firewall and a switch. In this LAN about 85 nodes are connected. Recently, the Ministry has procured two RISC servers and SAN for implementation and creation of the National Data Warehouse project. The entire network is checked up regularly and anti virus is updated weekly. IT Audit 7.11 The Computer Centre has entrusted with the responsibility for auditing of the IT infrastructure of the Ministry. It was decided by the competent authority to take up the audit work in phased manner. Accordingly, the following work has been approved by the IFD in the month of August 2009 for the first phase i.e. IT audit of the hardware/software items procured by the Centre is taken up by the STQC,M/O Communication & Information Technology:1. Dynamic website Audit. 2. Security Assessment on Network architecture of the Computer Centre. 3. Vulnerability Assessment of Servers and Network components installed at Computer Centre. 4. Remote Penetration testing of the Servers installed at Computer Centre. 5. The STQC has also recommended redesigning of data centre including Net Working 6. Process audit and Gap Analysis of the Computer Centre. 7.12 The STQC after security audit of the web site of the Ministry issued a certificate of security audit of MOSPI website on March, 2010 mentioning that site is free from OWASP(and any other known) vulnerabilities and is safe for hosting. The audit of the remaining items mentioned above is also taken-up and completed by the STQC and the report is submitted in the month of October, 2010 and the recommendations including gap analysis of the computer centre is under implementation. As and when the first phase is completed, the remaining divisions/units of the Ministry will be taken up on priority basis. 64 CHAPTER VIII STATISTICAL SERVICES I. Indian Statistical Service 8.1 The Indian Statistical Service (ISS) was constituted in 1961 by agglomeration of isolated posts performing Statistical functions in various Ministries /Departments of Government of India. The service was conceived as a Group ‘A’ Central Service with the objective of providing an organized cadre to man posts having Statistical functions in various Ministries at the Centre. The allocation of posts in various grades, at the time of initial constitution and at present is given in Table - 8.1. Table - 8.1 Grade As on 1.11.1961 Higher Administrative Grade(HAG) Senior Administrative Grade(SAG) Junior Administrative Grade(JAG) Senior Time Scale (STS) Junior Time Scale (JTS) ------15 54 116 Sanctioned Strength (As on 01.01.2011 12 81 220# 207 281* (231+50**) Total 185 801 # Including post upgraded to SAG which is personal to officers concerned. * One post of JAG at M/o Corporate Affairs was encadred to ISS (vide order No.12011/1/2006-ISS dt.01.12.2010) ** 50 posts for leave, deputation and training reserve. 8.2 Ministry of Statistics & Programme Implementation act as the Cadre Controlling Authority of Indian Statistical Services. The ministry is concerned with all matters pertaining to the service including recruitment, promotion, training, career and manpower planning, etc. However, day-to-day administrative matters of ISS officers are looked after by the Ministries/Departments in which the officers are posted. 8.3 The ISS Rules, 1961 as amended from time to time provide for 50 per cent of the posts in JTS to be filled up by direct recruitment and 50 per cent by promotion from Subordinate Statistical Service (SSS) cadre. There is no direct recruitment at any level except in JTS of the service. All the vacancies in other grades are filled up by promotion. 8.4 The first examination for direct recruitment to JTS of the service was held in the year 1967 and the first batch of the service was appointed in the year 1968. Till date, 31 batches of direct recruits have joined the service. 65 8.5 During the period 1st January 2010 to 31st promotion orders in respect of: December 2010, the Ministry has issued (i) 18 officers from feeder grade (i.e. SSS) to JTS (On adhoc basis) 40 Officers of JTS to STS (ii) 75 Officers of STS to JAG (Sl.No.1-52)on regular and Sl.No.53-75 on adhoc basis. (iii) officers SAG to HAG-II (iv) 1 officer of HAG-II to HAG-I 8.6 The edition of Civil List 2010 of Indian Statistical Service (ISS) giving basic information of the officers of ISS which is useful for general information and guidance was brought out by the Ministry in April 2010. II. Subordinate Statistical Service (SSS) 8.7 In the post 6th CPC scenario, SSS stands reconstituted into two grades of Statistical function posts in various Ministries/Departments/Organizations scattered all over India. Statistical Investigator Grade-I is having Grade Pay of ` 4600 in the pay band of ` 9300-34800 where as S.I Grade-II is having Grade Pay of ` 4200 in the same pay band. The sanctioned strength and number of incumbents in position in these two grades as on 01.12.2010 was as below: Sl. No. Name of the Post 1. Statistical Investigator Grade-I Sanctioned Strength 1561 In Position 1414 2. Statistical Investigator Grade-II 2322 1319 3. Total Strength 3883 2733 The followings are the important areas of activity in the Year of 2010-11. • 312 candidates have joined in S.I. Grade II out of 440 dossiers of successful candidates received from Staff Selection Commission against 2008 Examination. • Induction Training Program (ITP) for new Statistical Investigators Grade II of SSS Cadre have been arranged through NASA. • Civil List 2010 of SSS has been compiled in the form of a virtual CD and distributed to FOD and Non-FOD offices. In addition the CD has also been supplied to some new Departments inviting them to offer their posts to the SSS cadre for encaderment if they have any Statistical function posts. 66 • New proforma from Annual Performance Appraisal Report (APAR) has been developed replacing the old Annual Confidential Report (ACR) in respect of S.I Grade I and S.I Grade II separately. • The Cadre Management Information System (CMIS) has been developed with the help of Computer Centre and placed on the website of the Ministry under SSS Section which is providing comprehensive information on SSS Cadre. • For the benefit of SSS personnel, an online programme of viewing/printing of particulars with a search mode has been introduced. A provision for sending ‘feedback’ to the cadre has also been made in the CMIS programme. • The MACP scheme has been implemented in the SSS cadre in accordance with DOPT guidelines. • The services of 110 Statistical Investigators of Grade II have been confirmed during the year 2010. • 38 posts consisting of Statistical Investigators Grade I and II spread across seven Departments/Organisations/Offices have been newly encadred into SSS during the period. 67 CHAPTER IX INDIAN STATISTICAL INSTITUTE 9.1 In the early thirties, realizing the necessity for advancement of theoretical and applied statistics in India, the Indian Statistical Institute came into being following the pioneering initiative and efforts of Professor P.C. Mahalanobis. The Indian Statistical Institute was registered on 28thApril, 1932 as a nonprofit distributing learned society under the West Bengal Societies Registration Act, 1860. From the beginning, the Institute started showing its excellence in its own way. As the Institute expanded its research, teaching, training and project activities, it started earning national/international recognitions. The outstanding contributions made by the Institute in theoretical and applied statistical work culminated in the recognition of the Institute as an “Institute of National Importance” by an Act of the Parliament, known as “Indian Statistical Institute Act No. 057 of 1959”, which conferred on the Institute the right to hold examinations and award degrees/diplomas in Statistics. Significantly, none other than Pandit Jawaharlal Nehru, the then Prime Minister of India, himself piloted the bill in the Parliament in 1959. As a result, degree courses leading to Bachelor of Statistics (B. Stat.) and Master of Statistics (M. Stat.) and Post Graduate Diplomas in SQC & OR and Computer Science were started from June 1960. The Institute was also empowered to award the Ph.D. / D.Sc. Degree from the same year. Subsequently, Master of Technology (M. Tech) courses in Computer Science (CS) and in Quality, Reliability & Operations Research (QROR) were also introduced. Scope was further enlarged as the Institute was empowered to award degrees/diplomas not only in Statistics but also in Mathematics, Quantitative Economics, Computer Science and such other subjects related to Statistics by virtue of “Indian Statistical Institute (Amendment) Act, 1995, No. 38 of 1995” by the Parliament, which gave greater encouragement to research activities not only in Statistics/Mathematics but also in various branches of Computer and Communication Sciences, Natural and Social Sciences, Physics and Earth Sciences, Biological Sciences, Statistical Quality Control & Operations Research, Library and Information Sciences in a broader way. The Institute is engaged in an integrated programme of research, training & practical application of statistics through several projects in close collaboration with the Govt. of India, maintaining a very high standard as a centre of excellence which has resulted in earning several national/international recognitions over the years. 9.2 The objectives of the Institute are: (i) to promote the study and dissemination of knowledge of statistics, to develop statistical theory and methods, and their use in research and practical applications generally with special reference to problems of planning of national development and social welfare. (ii) to undertake research in various fields of natural and social sciences, with a view to the mutual development of statistics and these sciences. (iii)to provide for and undertake the collection of information, investigations, projects and operational research for purposes of planning an the improvement of efficiency of management and production. (iv) to undertake any other ancillary activities in fulfillment of the objectives (i), (ii) and (iii) above. 68 9.3 The Institute has its Headquarters in Kolkata, with three other centres at Delhi, Bangalore, Chennai and a branch at Giridih. The fourth Centre of the Institute is also coming up at Tezpur, Assam in 2011. The Institute has also a network of service units of Statistical Quality Control and Operations Research Division across the country at Vadodara, Mumbai, Pune, Coimbatore and Hyderabad apart from Kolkata, Delhi, Bangalore and Chennai. 9.4 As envisaged in the “Indian Statistical Institute Act, 1959, No. 57 of 1959”, the Institute is fully funded by the Government of India. The major amount of internal receipts comes from the sale of prospectus, realization from staff on account of licence fee, share of overhead charges from externally funded projects, fees from consultancy rendered by the Statistical Quality Control and Operations Research Division etc. 9.5 The accounts of the Institute for 2010 – 2011 will be audited by M/S L. B. Jha & Co., Chartered Accountants, Kolkata who were appointed by the Institute for the purpose after their selection by the Government of India in consultation with the Controller & Auditor General India and the Institute, as per provision contained in Section 6 (1) of the “Indian Statistical Institute Act, 1959, No. 57 of 1959”. 9.6 The progamme of work in a particular year, the financial estimates thereof and quantum of grants to be given by the Ministry of Statistics and Programme Implementation for the purpose, are decided in the light of the recommendations of a committee set up by the Ministry of Statistics and Programme Implementation under Section 8 (1) of the “Indian Statistical Institute Act, 1959, No. 57 of 1959”. The composition of the committee includes distinguished economists and scientists as well as representatives from the Government of India, namely the Ministry of Statistics & Programee Implementation and Ministry of Finance. The programme of work and the expenditure estimates/grants for 2010 – 2011 were accordingly worked out on the basis of the recommendations of the aforesaid committee. During 2010 – 2011, Grant in Aid approved for Institute are as follows : Nature of Budget Budget Estimate (BE) Plan Non-Plan 28.00 91.01 Revised Estimate (RE) (Excluding OB + Income) 36.00 99.36 9.7 During the year the Institute continued to conduct its regular and professional courses for students leading to award degrees in B. Stat. (Hons.), B. Math. (Hons.), M. Stat., M. Math., Master of Science (M.S.) in Quantitative Economics, M.S. in Library and Information Science, M. Tech. in Computer Science, M. Tech. in Quality, Reliability and Operations Research, and Research Fellowships in Statistics, Mathematics, Quantitative Economics, Computer Sciences, Quality, Reliability and Operations Research, Biological Anthropology, Physics and Applied Mathematics, Agriculture & Ecology, Sociology, Human Genetics, Psychology, Population Study and Library and Information Science. Admission tests were conducted at 22 different 69 centers all over the country. A total of 7603 candidates finally appeared for admission tests and a total of 600 candidates qualified in the written tests, and were called for interviews. Based on the performance in the written tests, interview and the academic records, 260 candidates were offered admission to various courses during the academic session under review. The annual examinations for all the regular courses during 2009-2010 academic sessions were held during May 2010. The 2010-11 academic session commenced from July, 2010. 9.8 The Institute runs an International Statistical Education Centre (ISEC) in Kolkata, under the auspices of the UNESCO and the Government of India. The centre provides training in the theoretical and applied statistics at various levels to selected participants from the countries in the Middle-East, South and South-East Asia, the Far-East and the Commonwealth countries in Africa. The Centre, as an associated body of the Institute, functions under a joint board of Directors. Professor P.C. Mahalanobis was the Chairman of the Board of Directors since its inception in 1950 until his death in 1972. Since then, National Professor C.R. Rao, F. R. S., has been the Chairman of the Board of Directors. The announcement of the 64th term Regular course was issued from the Centre at Kolkata. In addition, a number of prospectus and application forms were also distributed through ITEC, Ministry of External Affairs, Government of India. The Governments of different countries were invited to nominate suitable candidates for training at the Centre. The applications for admission were forwarded to the Centre through the respective Indian Missions. On behalf of the Board of Directors, the Member-Secretary shouldered the responsibilities of selecting the candidates for the 63rd term ISEC regular course. This year 23 trainees from 7 different countries, namely Afghanistan, Mongolia, Myanmar, Cuba, Gambia, Sri Lanka, and Russia joined the course. Of these 23 trainees, 3 trainees from Afghanistan were supported by fellowship of Asian Development Bank (ADB) while the other two Afghan and 13 trainees were supported by fellowships of the ITEC/SCAAP of Government of India. Two trainees from Mongolia were supported by fellowships of the National Statistical Office (NSO), Mongolia, while the other three trainees were supported by the fellowships of Central Bank of Sri Lanka. 9.9 The Annual Report for the year 2010 – 2011 indicates the details of research work carried out by the Institute during the year in Theoretical Statistics and Mathematics Division; Applied Statistics Division; Computer and Communication Sciences Division; Physics and Earth Sciences Division; Biological Sciences Division; Social Sciences Division; Statistical Quality Control and Operations Research (SQC & OR) Division; and Library, Documentation & Information Sciences Division. The composition of each Division is given below : o Theoretical Statistics And Mathematics Division : Stat-Math Unit atKolkata, Delhi, and Bangalore. o Applied Statistics Division : Applied Statistics Unit and Bayesian & Interdisciplinary Research Unit. o Computer And Communication Sciences Division : Advanced Computing & Microelectronics Unit, Computer Vision & Pattern Recognition Unit, Documentation Research & Training Centre, Electronics & Communication Sciences Unit, Machine Intelligence Unit and Systems Science & Informatics Unit. 70 o Physics And Earth Sciences Division : Geological Studies Unit and Physics & Applied Mathematics Unit. o Biological Sciences Division : Agricultural and Ecological Research Unit, Biological Anthropology Unit and Human Genetics Unit. o Social Sciences Division : Economic Research Unit, Economic Analysis Unit, Linguistic Research Unit, Planning Unit, Population Studies Unit, Psychology Research Unit and Sociological Research Unit. The Economic Analysis Unit is located at Bangalore and the Planning Unit at Delhi whiles remaining five other Units located at Kolkata. o Statistical Quality Control And Operations Research Division : Bangalore, Chennai, New Delhi, Hyderabad, Kolkata, Mumbai, Pune and a Central SQC (CSQC) Office located in the main Campus at Baranagar. The Division has been accredited by the Quality Council of India to offer certificate course in Six Sigma Green Belt. o Library, Documentation And Information Sciences Division : Central Library at Kolkata, Delhi and Bangalore. o Apart from the above, there is a “Center for Soft Computing Research : A National Facility”, which was established in 2004 by the Department of Science and Technology, Government of India under its IRHPA (Intensification of Research in High Priority Areas) Scheme. 9.10 There is also a Computer and Statistical Services Centre (CSSC) which manages the central computing facilities of ISI, Kolkata. It serves approximately 700 users. Software packages available at the centre are – Oracle, Arc GIS, BMDP, Mathematica, SAS, SHAZAM, S-Plus and TSP, manages campus-wide network and internet facilities at ISI, Kolkata, in consultation with the Committee for Extension and Monitoring of Campus Network and Internet Services. The center also manages the inventory of computers in consultation with the Computer Purchase Committee, provides statistical and numerical consultancy services to scientists and research scholars, including non-ISI scientists. The centre occasionally conducts workshop for training ISI officials on using of computers, organizes courses for North-eastern states of India. Members of CSSC take part in teaching different courses of the Institute; supervise project work of non-ISI students studying MCA, B-Tech, etc. Externally Funded Project 9.11 Apart from theoretical and experimental plan research, the Institute also undertook a variety of about ninety-eight externally funded projects from different Government and nonGovernment organizations like Intel Corporation; University of Western Sydney, Australia; East – West Center, USA; West Bengal State Council of Science and Technology; Department of Biotechnology, Govt. of India; West Bengal State Council of Technical Education (WBSCTE), Got. of West Bengal; SLMA, Govt. of Tripura; Indian Council of Agricultural Research (ICAR); Ministry of Tourism, Govt. of India; WESEE, Ministry of Defence; Ministry of Information 71 Technology; Hewlett Packard, Bangalore; European Commision; Saha Institute of Nuclear Physics; Durgapur Steel Plant (Steel Authority of India); Enercon India Pvt. Ltd; Ministry of Statistics and Programme Implementation, Govt. of India; National Bank for Agricultural and Rural Development; Department of Science & Technology; Department of Atomic Energy, Govt. of India; Fogarty International Center, NIH, USA; UHP, Nancy; Ministry of Civil Aviation, Govt. of India; Ministry of Information and Communication Technology; Allianz Cornhill Information Services, Trivandrum; National Academy for Defence Production (NADP), Nagpur; ITC-PSPD, Coimbatore; J K Industries Limited, Mysore; Quality Mind Global, Bangalore; NVTQC, Bangalore; Infosys BPO Pvt. Limited, Bangalore; Robert Bosch Limited, Bangalore; Cognizant Technologies, Kolkata; TVS, Hosur; Reliance BPO; Asia Motor Works; HDFC Standard Life Insurance; HDFC Bank; Welspun Gujarat Stahl Rohran Ltd; Larsen & Toubro Limited, Mumbai; BHEL, Bangalore; Beceem Communications, Bangalore; Hinduja Global Solutions, Bangalore; HP Global Soft Pvt. Ltd., Bangalore; Accenture Services Ltd., Bangalore; Toyota Kirloskar Motors, Bidadi; Microsoft Global Support Centre, Bangalore; Cadbury India Ltd., Bangalore; Bharat Builders Ltd., Bangalore; Ultratech; Xavier Institute of Management, Bhubaneswar; Blue Lotus; IBM; Dr. Reddy’s Laboratory; Central Electricity Regularity Commission; DIC India Limited, Kolkata; TATA BP Solar, Bangalore; TATA Capital; Petroleum Planning and Analysis Cell, Ministry of Petroleum & Natural Gas, Govt. of India; The Automotive Research Association of India, Pune; Lloyds Register Quality Assurance; Ispat Industries Ltd.; Technova Imaging Systems Ltd.; Marico Limited; ICMR; NBHM; CSIR; & DST, Govt. of India. Seminars, Workshops, Conferences, Symposiums etc. organised 9.12 During the year, the Institute organized several seminars, workshops, conferences, symposiums with the participation of leading academicians/scientist from India and abroad. A few of them are highlighted below: • Seminar on “Large deviations for truncated heavy-tailed random variables” by Arijit Chakraborty, Indian Institute of Science, Bangalore on June 1, 2010. • Seminar on “New conjectures related to the Jacobian Conjecture” by David Wright, Department of Mathematics Washington University, St. Louison on August 16, 2010. • Seminar on “Patching results on certain algebras” by Nobuharu Onoda, University of Fukui, Japan on September 22, 2010. • Seminar on “Stolarsky's conjecture and sum of binary digits of n and n2”organized by Stat-Math Unit, Delhi, ISI on September 8, 2010. • Winter School on “Functional Analysis” jointly organised by Stat-Math Unit, Delhi, ISI and The Institute of Mathematical Sciences, Chennai during December 6-22, 2010. • Conference on “Functional Analysis and Operator Theory” (A Satellite Conference of the ICM 2010) organised by Stat-Math Unit, Bangalore during August 8 – 11, 2010. 72 • International Conference on “Quantum Probability and Related topics” (A Satellite Conference of the ICM 2010) organised by Stat-Math Unit, Bangalore at the Jawaharlal Nehru center for Advanced Scientific Research, Bangalore during August 14 – 17, 2010. • Seminar on “Some Issues in Measuring Employment” by TCA Anant, Delhi School of Economics at ASU, Kolkata on July 7, 2010. • Seminar on “Improved Estimation of the intercept parameter of Simple Linear Regression Model” by Zahirul Hoque, United Arab Emirates University at ASU, Kolkata on August 6, 2010. • Seminar on “A Flexible Modeling Framework for Over dispersed Hierarchical Data” by Geert Molenberghs, Hasselt University, Diepenbeek, Belgium and Christel Faes, Katholieke Universiteit Leuven, Belgium at ASU, Kolkata on October 26, 2010. • Training programme “ISS Probationers Officers Training Programme” (Batch No. XXX) at ASU, Kolkata on during October 25-November 4, 2010. • Workshop for North-East Region on “Probability & Statistical Methods” organized by BIRU at Debraj Roy College, Golaghat, Assam during October 25-29, 2010. • Seminar on “Kemelization: A Survay” by Dr. Somnath Sikdar, IMSc Chennai at ACMU, Kolkata on July 13, 2010. • Seminar on “Aligning Individual and Societal Interests Via Subsidies” by Dr. John Augustine, School of Physical Mathematical Science, Nanyang Technological University, Singapore at ACMU, Kolkata on December 3, 2010. • International Conference on “Frontiers in Handwriting Recognition” (ICFHR 2010) organized by CVPRU, Kolkata at ITC Fortune Park Panchwati Hotel, Howrah during November 16-18, 2010. • Workshop on “Advances in Image and Document Processing” for North-East region will be organize by CVPRU, Kolkata at Indian Institute of Management, Shillong during 16– 20 March, 2010. • Seminar on “Mathematical Morphology in Image Analysis, GISci, Geomorphology” by Prof. Jean Serra, Prof. Jean Cousty and Prof. Laurent Najman, University Paris-Est, France at SSIU, Bangalore during October 25-26, 2010. • Seminar on “Living Fossils and Long Branches: The Origins, Phylogeny, Ecology and Biogeography of Deep-Sea slit snails” by M.G. Harasewych, Curator of Marine Mollusca Dept. of Invertebrate Zoology, MRC-163 National Museum of Natural History, Smithsonian Institution, Washington, D.C., at GSU, Kolkata, July 27, 2010. 73 • Seminar on “Some new evidence from Kimberlites on the origin and original spatial extent of the purana sedimentary basins and the Deccan flood basalts” by Dr. N.V. Chalapathi Rao, Banaras Hindu University at GSU, Kolkata on November 12, 2010. • Seminar on “Understanding transport phenomena at the naroscale using mocular dynamics” by Ganesh Balasubramanian, State University of Virginia at PAMU, Kolkata on May 31, 2010. • Seminar on “Thin Film Problems in Fluid Mechanics” by Prabir Daripa, Department of Mathematics, Texas A & M University, College Station, USA at PAMU, Kolkata on July 29, 2010. • Seminar on “Application of Fractional Calculus” by Shantanu Das, Scientist – H, Reactor Control Division, BARC, Mumbai at PAMU, Kolkata on December 3, 2010. • Workshop on “Research & Data Analysis using IBM SPSS Statistics” organized by AERU, Kolkata during September 29-30, 2010. • Seminar on “Overcoming drug resistant cancer” by Dr. Ananda Mookerjee, Ovarian Cancer Center, University of Pennsylvania School of Medicine, USA at HGU, Kolkata on October 21, 2010. • Seminar on “Significance of Ostioponting as a diagnostic marker in breast cancer” by Dr. Gopal Kundu, NCCS, Pune at HGU, Kolkata on November 25, 2010. • Seminar on “Emergence of Independent Candidates: A Negative Binomial Regression Model of an Indian Parliamentary Election” at ERU, Kolkata on May 10, 2010. • Seminar on “Competition in Buyer-Seller Markets: One-Sided Simultaneous Offers Bargaining” at ERU, Kolkata on July 28, 2010. • Workshop on “Estimation of technical manpower requirement in West Bengal through effective means for improving quality of training of technicians: Preliminary Workshop and Focus Group Discussion” at PSU, Kolkata on October 8, 2010. • Seminar on “Dalit Households in Village Economies” at SRU, Kolkata to be held on January 7-8, 2011. • Training program on “Statistical Techniques for Data Mining Techniques & Business Analytics” organized by SQC & OR Unit, Bangalore during July 22-23, 2010. • Training program on “Six Sigma Green Belt (GB05)” organized by SQC & OR Unit, Bangalore during November 19-21 & 27-28, 2010. 74 • Week-end Training program on “Six Sigma Black Belt” organized by SQC & OR Unit, Chennai April–September, 2010. • Week-end Training program on “Six Sigma Green Belt” organized by SQC & OR Unit, Chennai during November 8-12, 2010. • Training program on “Six Sigma Green Belt” organized by SQC & OR Unit, Delhi at Accretive Health Services Pvt. Ltd. during September 17–19, 2010. Training program on “Six Sigma Black Belt 1st Module” organized by SQC & OR Unit, Delhi during August 4–6, 2010. Training program on “Statistical Process Control for Process Industries” organized by SQC & OR Unit, Mumbai at Ultratech Cement’s premises during May 24-26, 2010. • • • Training program on “Statistical Process Control” organized by SQC & OR Unit, Mumbai at Ordnance Factory Ambernath during November 19-20, 2010. • International Workshop on Six Sigma, Lean Philosophy & Taguchi Methods organized by SQC & OR Unit, Delhi at ISI Delhi during 4 – 5 February, 2011. • International Congress on Productivity, Quality, Reliability, optimization And Modelling organized by SQC & OR Division of ISI in association with Quality Council of India and DRDO, Government of India during 7- 8 February, 2011 • ISEC Diamond Jubilee Conference on Statistics, Economic Development and Public Administration organized by ISEC at Delhi during 11- 12 February, 2011 Publication 9.13 The internationally renowned journal Sankhya, an official publication of the Indian Statistical Institute, was founded by Professor P.C. Mahalanobis in 1932 and began publication under his editorship. It is devoted to original research articles in Probability, Mathematical Statistics and Applied Statistics. Reviews and discussion articles on current research activity in the above areas are also published. A rigorous peer review process is followed for acceptance of articles submitted for publication in Sankhya. Many seminal articles in Probability, Theoretical Statistics and Applied Statistics have appeared in Sankhya. The journal is published in two separate series – Series A and Series B. Series A with two issues per year, one in February and the other in August, covers Probability and Theoretical Statistics, while Series B with two issues per year, one in May and the other in November, covers Applied and Interdisciplinary Statistics. Beginning 2010, Springer has entered into a co-publication agreement with the Institute and has exclusive rights for the international distribution of the journal. The editorial system is now completely electronic, that is, the entire process starting from submission of articles to editorial processing ending in final editorial decision for articles is now done online. 75 Scientific Papers and Publication 9.14 During the year, about 438 scientific papers were published for publication in different journals of national and international importance. Scientific Assignments Abroad 9.15 Seventy-four Scientists of the Institute visited a number of foreign countries either on invitation or under cultural exchange programme to attend international seminars and conferences. Most of them presented scientific papers and delivered lectures in those seminars and conferences. Countries visited by ISI faculty members were China, Spain, USA, Japan, North Korea, South Korea UK, Brazil, Bangladesh, Malaysia, Poland, Italy, France, Israel, Portugal, Singapore, Germany, Egypt, Turkey, Switzerland, Taiwan, Czech Republic, Belgium, Philippines, Netherland, Sweden, Hong Kong, Cuba, Australia, Nepal, Sri Lanka, Thailand, Finland, etc. Visiting Scientists 9.16 Sixty-two scientists from Portugal, Italy, Turkey, South Korea, Canada, USA, Japan, Denmark, France, Spain, Mexico, Sweden, New Zealand, Brazil, Singapore, UK, Japan, Germany and India visited the Institute to attend various Workshops, Conferences, Seminars etc. and also to participate in collaborative research, teaching and other scientific activities of the Institute. Recognition to ISI Scientists 9.17 In appreciation and recognition to the high standard of research and scientific excellence maintained by the researchers of the Institute, several faculty members received laurels in the forms of Awards, Fellowship from organizations of national and international importance like DST, IEEE, INSA, etc. Several faulty members served as visiting scientist, honorary professor, visiting professor, Visiting Professors in various universities in US and Europe; Indian Council of Social Sciences Research (ICSSR); Indian National Science Academy etc. Besides, many faculty members were invited by national and international Institute/bodies to act as chairman, members, chief editor, editor in their several committees/editorial board etc. Among those, some of the most notable recognitions earned by the faculty members are indicated below: • Debashish Goswami awarded Swarnajayanti Fellowship for the year 2009-10 byD.S.T., Govt. of India. • Ashis SenGupta selected Advisor, Scientific Advisory Board of Institute of Statistical Mathematics, Tokyo, Japan and Citizen Ambassador of People to People Ambassador Programs, USA and American Statistical Association, USA. • Bikas K. Sinha selected Member - Monitoring Committee for 5 year term at C.R. Rao Advanced Institutes for Mathematics, Statistics & Computer Sciences, Hyderabad and 76 also selected as Member of Municipal Valuation Committee, Kolkata, Govt. of West Bengal. • Nikhil R. Pal elected as a fellow of Indian National Science Academy for Research Contributions. • Sanghamitra Bandyopadhyay awarded Shanti Swarup Bhatnagar Prize in Engineering Sciences, 2010 for Research Contributions by Council of Scientific and Industrial Research. • Satya R. Chakravarty selected Fellow of Human Development and Capability Association, USA for significant contributions to Research on Human Development and Capability. • Niladri Sekhar Dash selected consultant of Language Processing in Bilingual Users of South Asian Languages, Department of Psychology, Faculty of Arts & Social Sciences, University of Windsor, Ontario, Canada. • U.H. Acharya selected Team leader for Southern Zone in Rajiv Gandhi National Quality Award assessments for the year 2010. ****** 77 CHAPTER X TWENTY POINT PROGRAMME Twenty Point Programme (TPP) – 2006 10.1 The Twenty Point Programme (TPP) initiated in the year 1975 was restructured in the years 1982, 1986 and 2006. The thrust of the Programme restructured in 2006 is to eradicate poverty and improve the quality of life of the poor and the under-privileged people all over the country. The Programme covers various socio-economic aspects like poverty, employment, education, housing, agriculture, drinking water, afforestation and environment protection, energy to rural areas, welfare of weaker sections of the society, etc. The restructured Programme is called Twenty Point Programme (TPP) – 2006 and its monitoring mechanism became operational with effect from 1st April, 2007. 10.2 The Twenty Point Programme (TPP) – 2006 originally contained 20 Points and 66 items monitored individually by different Central Nodal Ministries concerned. Out of these 66 items, 25 items were for monthly monitoring, while the rest were to be monitored on annual basis by this Ministry. The monthly information in respect of 21 items was collected from various States/UTs and for the remaining 4 items, the information was collected from the concerned Central Nodal Ministries. The monitoring mechanism for TPP- 2006 has now been widened by including Block level monitoring in addition to the existing Central, State and District level monitoring. 10.3 TPP-2006 has now completed four years of its operationalisation. One of the 66 items viz. “Sampoorna Grameen Rojgar Yojana (SGRY)” has since been subsumed into another item namely “National Rural Employment Guarantee Act” with effect from 1st April, 2008, and therefore, SGRY has been dropped from the list of 66 items under TPP- 2006. Out of the remaining 65 items, 20 items are now being monitored on monthly basis. The monthly information in respect of 16 items is collected from various States/UTs and for the remaining 4 items, the information is collected from concerned Central Nodal Ministries. Monitoring Mechanism 10.4 The primary responsibility of implementation and monitoring of the programme lies with the agencies entrusted with the execution of the programme, which in this case are the State Governments/UT administrations and the Central Nodal Ministries. The Ministry of Statistics and Programme Implementation monitors the programme/schemes covered under TPP-2006 on the basis of performance report received from State/UT Governments and Central Nodal Ministries. 78 Monitoring Committees 10.5 Monitoring Committees at State, District and Block Level, for monitoring the progress of implementation of all schemes/items covered under the Twenty Point Programme - 2006, have been constituted by many States/UTs as per the provisions of TPP-2006 Guidelines. Interactive meetings with State Governments on implementation of TPP – 2006 10.6 Officers of the Ministry hold interactive discussions with the officers of the State Governments/UT Administrations on implementation of schemes/items covered under the Twenty Point Programme - 2006. Various issues relating to implementation are discussed with the officers of State Planning Departments and different line Departments concerned. The Management Information System for TPP - 2006 consists of the following: 10.7 (i)Monthly Progress Report (MPR) with information for 20 items is prepared by this Ministry. The MPR provides information on the Annual Physical Targets, Cumulative targets and achievements for the period under report. Coverage is based on the data furnished by the State Governments/UT Administrations on their performance for 16 items and by the Central Nodal Ministries in respect of 4 items. A detailed analysis is made in the MPR to assess the relative performance of monthly monitored items/parameters and the States/UT’s against the set targets. The MPR is sent to the State/UT Governments and Nodal Ministries concerned for taking appropriate measures in the areas of concern. (ii)The Annual Review Report on TPP - 2006 covers all the items (except the items which are not yet operational) under the Programme. The information on these items is provided by the respective Central Nodal Ministries and State/UT Governments. The second issue of the Annual Review Report for 2008-09 has been released and Annual Review Report for 2009-10 is under preparation. Monitoring and Impact Assessment of Twenty Point Programme - 2006 10.8 As per TPP Guidelines, the Ministry is required to undertake Monitoring and Impact Assessment Studies on selected programmes/schemes covered under TPP-2006. The concerned Nodal Ministry is apprised of the findings of such studies in order to improve the performance of schemes/programmes undertaken for study. The Ministry carried out an Impact Assessment Study of MGNREGA in 3 States of North East and initiated another study on Rehabilitation of Disabled Persons under Deendayal Disability Rehabilitation Scheme (DDRS) in the States of Delhi, Karnataka, Madhya Pradesh and West Bengal during 2010-11. Twenty Point Programme-2006 Review meeting 10.9 In order to improve the implementation of schemes/programmes covered under TPP by State/UT Governments, specially the schemes/programmes where the performance of States/UTs has been rather poor, the Ministry Organised the first All India Review Meeting of Twenty Point Programme- 2006 during October, 2010with State/UT Governments and discussed various issues 79 like, State-wise performance of Programmes and Schemes covered under Twenty Point Programme, Variation in reported performance figures by States/UTs and furnished by Central Nodal Ministries, Delays in reporting of monthly performance figures, Constitution of TPP Monitoring Committees at State, District & Block levels and their meetings at regular interval, Fixation of Annual Targets by Central Nodal Ministries/Departments, etc. The States/UT’s and the concerned Nodal Ministries have been requested to take follow up action on the decisions arrived at in the meeting. Performance of monthly monitored items under TPP-2006 during 2009-10 and AprilSeptember, 2010. 10.10 Based on the data received from the Central Nodal Ministries and State Governments/UT Administrations, an analysis of the overall performance of monthly monitored items for the year 2009-10 and for the period April -September 2010 is given in the following paragraphs and in Annexure IV& V. During 2009-10, 20 items were monitored on monthly basis, out of which 15 items consisting of 19 parameters weremonitored against targets fixed by concerned Nodal Ministries. Monthly targets in respect of items/parameters where the Nodal Ministries have provided annual/quarterly targets only have been worked out on pro-rata basis. 10.11 The analysis for the year 2009-10 as shown in Annexure-IV indicates that the performance under twelveitems/parameters of the TPP-2006 has been ‘Very Good’ (90% or above the targets).These items/parameters are: 1. Individual Swarozgaries Assisted- SGSY 2. Pumpsets Energised 3. Houses constructed under EWS/LIG 4. SHGs Provided Income Generating Activities under SGSY 5. Road Constructed under Prime Minister Grameen Sadak Yojana (PMGSY) 6. SC Families Assisted 7. Food Security:Targeted Public Distribution System only for AAY 8. Village Electrified under Rajiv Gandhi Grameen Vidyutikaran Yojana(RGGVY) 9. Food Security: Targeted Public Distribution System only for BPL 10. ICDS Blocks Operational (Cum.) 11. Seedlings Planted (Public and Forest Lands) and 12. Supply of Electricity 10.12 The performance of the following fiveitems/parameters has been observed to be ‘Good’ (80% to 90% of target). (i) Food Security:Targeted Public Distribution System for APL, BPL & AAY (ii) Habitations covered (NC and PC)- ARWSP (iii)Area Covered under Plantation (Public and Forest Lands) 80 (iv) Anganwadis Functional (Cum.) and (v) Houses Constructed under Indira Awaas Yojana (IAY) 10.13 The performance of two items/parameters viz. (i) Urban Poor Families Assisted under Seven Point Charter and (ii) Slipped back habitations and habitations with water quality problems addressed–ARWSP has been observed to be ‘Poor’ (below 80% of target). 10.14 The analysis for the period of April-September, 2010 as shown in Annexure-II indicates that the performance under the following fourteen items/parameters has been ‘Very Good’ (90% or above the targets). 1. Road Constructed under Prime Minister Grameen Sadak Yojana (PMGSY) 2. Urban Poor Families Assisted under Seven Point Charter 3. Seedlings Planted (Public and Forest Lands) 4. Area Covered under Plantation (Public and Forest Lands) 5. Individual Swarozgaries Assisted under SGSY 6. Houses Constructed under Indira Awaas Yojana (IAY) 7. Pumpsets Energised 8. Food Security: Targeted Public Distribution System only for BPL 9. ICDS Blocks Operational (Cum.) 10. SHGs Provided Income Generating Activities under SGSY 11. Food Security:Targeted Public Distribution System only for AAY 12. Food Security: Targeted Public Distribution System for APL, BPL & AAY 13. SC Families Assisted and 14. Supply of Electricity 10.15 The performance of twoitems/parameters viz. (i) Anganwadis Functional (Cum.) and (ii) Houses constructed under EWS/LIGhas been observed to be ‘Good’ (80% to 90% of target). 10.16 However, the performance of the following threeitems/parameters has been ‘Poor’ (below 80% of target). 1. Village Electrified- Rajiv Gandhi Grameen Vidyutikaran Yojana (RGGVY) 2. Slipped back habitations and habitations with water quality problems addressed– ARWSP and 3. Habitations covered (NC and PC)- ARWSP 81 Achievements under Monthly Monitored Items/Parameters National Rural Employment Guarantee Scheme (NREGS) 10.17 Providing gainful employment is the most important method of eradicating poverty in the country. Many employment generation programmes are being implemented in the rural areas. The National Rural Employment Guarantee Scheme (NREGS) has come into existence for the enhancement of livelihood security of the households in the rural areas of the country by providing at least one hundred days of guaranteed wage employment in every financial year to every household whose adult members volunteer to do unskilled manual work. During 2009-10, 18561 thousand job cards were issued, 2,997,827 thousand mandays of employment was generated and `27052 crore were paid as wages under the Scheme. During the period April – September, 2010, 6213 thousand job cards have been issued, 1,396,289 thousand man days of employment was generated and wages to the tune of `13693 crore have been given. Swaranjayanti Gram Swarozgar Yojana (SGSY) 10.18 Swaranjayanti Gram Swarozgar Yojana (SGSY) was launched in 1999 with the objective of bringing the poor families (Swarozgaries) above the Poverty Line by providing them with income generating assets through a mix of bank credit and Government subsidy. The Programme aims at establishing a large number of micro enterprises in rural areas based on the ability of the poor and the potential of each area. The scheme has been showing impressive result with achievements far exceeding the targets fixed. During 2009-10, as against the target of assisting 269600 total individual swarozgaries, 625322 swarozgaries were assisted which is 232% of the target. Similarly for the period April– September, 2010, as against the target of assisting 112734 individual swarozgaries, 147578 swarozgaries have been assisted which is 131 % of the target. Self Help Groups 10.19 The objective of programmes like SGSY is also to organize the rural poor into self help groups (SHGs) for capacity building and prevention of exploitation by intermediaries for running micro enterprises in rural areas under the cluster approach. Income generating activities are provided to such SHGs for upliftment of the poor. During 2009-10, 516,117 SHGs were formed under SGSY. Further, against the target of providing income generating activities to 155285 SHGs, 177843 SHGs were provided with income generating activities, which is 115% of the target. During April-September, 2010, 140320 SHGs have been formed. Further, during the same period, against the target of providing income generating activities to 64947 SHGs, 63460 SHGs have been provided which is 98% of the target. Distribution of waste land to landless 10.20 Agrarian reforms have been a core issue for rural reconstruction as a means of ensuring social justice to actual tillers and the landless rural poor. Increasing the access of landless rural 82 poor to land is considered an important component of the effort aimed at poverty alleviation. The main objective of land reforms has been the re-ordering of agrarian relations in order to achieve an egalitarian social structure, elimination of exploitation in land relations, realizing the age old goal of land to the tiller, enlarging the land base of the rural poor, increasing agricultural productivity and infusing an element of equality in local institutions. During the year 2009-10, 38,781 hectares of wasteland was developed and distributed among the landless. During the current financial year (i.e. for the period April – September, 2010) 38,985 hectares of wasteland has already been developed and distributed among the landless. Minimum Wages Enforcement (including Farm Labour) 10.21 In a labour surplus economy like India, fixation and enforcement of minimum wages can save labourers, particularly unorganised rural labourers, from exploitation. The Minimum Wages Act, 1948 empowers both the Central and the State Governments to fix, review, revise and enforce minimum wages in scheduled employments falling under their respective jurisdictions. The establishments violating the Minimum Wages Act, 1948 are prosecuted with fine or imprisonment or both. During the year 2009-10, 95313 inspections were carried out by the officials of Central and State Governments and 19580 irregularities were detected out of which 18292 irregularities were rectified. Also during the same period, 2719 claims were settled and 2484 fresh claims were filed. The number of prosecution cases pending, filed and decided during the year 2009-10 were 11315, 15 and 65 respectively. During the period April – September, 2010, 77470 inspections were carried out by the officials of Central and State Governments and 9183 irregularities were detected and 9328 irregularities (including some from the previous period) have been rectified. During the same period, 3469 fresh claims have been filed and 1387 claims settled. Prosecution cases pending, filed and decided during this period are 6284, 183 and 25 respectively. Food Security Targeted Public Distribution System (TPDS) 10.22 Under the Targeted Public Distribution System (TPDS) each poor family is entitled for essential commodities at subsidised prices. The emphasis is on inclusion of only the really poor and vulnerable sections of society such as landless agricultural labourers, marginal farmers, artisans/craftsmen (potters, tappers, weavers, blacksmiths, carpenters, etc.) in the rural areas and slum dwellers and daily wagers in the informal sector (porters, rickshaw pullers and hand cart pullers, fruit and flower sellers on the pavements, etc.) in the urban areas. During the year 200910, the target was to allocate 47602697 tonnes of food grain to States. However, the off-take by States against this allocation was 42402685 tonnes of foodgrain which was 89% of the allocation. Similarly during April - September, 2010 as against allocation of 23503679 tonnes, actual off-take of food grains by States/UTs under TPDS has been 21879280 tonnes which is 93% of the allocated quantity. 83 Targeted Public Distribution System (TPDS) for Antyodaya Anna Yojana (AAY) 10.23 This Scheme aims to make PDS benefits more substantial in terms of both quantity and nutrition, for the poorest section of the Below Poverty Line (BPL) population. Detailed guidelines have been issued to the States/UTs for identification of the Antyodaya beneficiary families and implementation of the scheme. All the States/UTs have implemented AAY. The Antyodaya Anna Scheme contemplates identification of one crore poorest families out of a total of 6.52 crore BPL families covered under TPDS. These identified families are being provided foodgrains at rates below the rate charged for the BPL families. During the year 2009-10, the actual off-take of food grains by States/UTs under AAY was 9794358 tonnes against the allocated quantity of 10195578 tonnes, which is 96% of the allocated quality. During the period April – September, 2010, the actual off-take of food grains by States/UTs under AAY has been 4971437 tonnes against the allocated quantity of 5110469 tonnes, which is 97% of the allocated quality. Targeted Public Distribution System (TPDS) for Below Poverty Line (BPL) population 10.24 This parameter has been included in the monthly monitored parameters since April, 2009. During 2009-10 as against the target allocation of 17413031 tonnes of food grains for BPL families, the actual off take has been 16545424 tonnes which was 95% of the target. During the period April- September, 2010 as against the target of allocation of 8728495 tonnes of food grains for BPL families the actual off take has been 8727982 tonnes which is 100% of the target. Rural Housing-Indira Awaas Yojana 10.25 Indira Awaas Yojana (IAY) is a flagship scheme implemented by the Ministry of Rural Development. The scheme provides houses to the poor in rural areas. The objective of IAY scheme is primarily to help construction/upgradation of dwelling units of members of Scheduled Castes/Scheduled Tribes, free bonded labourers, minorities in the below poverty line category and other below poverty line non-SC/ST rural households by providing them a lump sum financial assistance. IAY, being a Centrally Sponsored Scheme, is funded on cost-sharing basis between the Government of India and the State Governments in the ratio of 75:25. However, in case of North-Eastern States and Sikkim, funding is shared between Government of India and these States in the ratio of 90:10 and in case of Union Territories, the entire funds under this scheme are provided by the Government of India. The allocation of funds under the Indira Awaas Yojana to the States/UTs is made on the basis of the poverty ratio, as approved by the Planning Commission, and rural housing shortage, as specified in the Census. The allocation criteria for Central Assistance assign 75% weightage to rural housing shortage and 25% weightage to poverty ratio. Within a State/UT, the inter-districts’ allocation is made by giving 75% weightage to housing shortage and 25% weightage to rural SC/ST population of the concerned districts. 10.26 The ceiling on grant of assistance for construction of a new house, including sanitary latrine and smokeless chulha, under the IAY currently is `45, 000/- for plain areas and `48, 500/for hilly/difficult areas. Similarly, ceiling on grant of assistance for upgradation of an unserviceable katcha house under the IAY currently is `15, 000/- for both plain and 84 hilly/difficultarea. In addition, a beneficiary can avail a loan of upto ` 20,000/- per housing unit under differential rate of interest (DRI) scheme at an interest rate of 4% per annum. Under the scheme, 3276248 houses were constructed during 2009-10 as against the target of construction of 4052242 houses which is 81% of the target. During the period April – September, 2010 as against the target of construction of 842622 houses, 886969 houses have been constructed which is 105% of the target. EWS/LIG Houses in urban Areas 10.27 The Ministry of Housing and Urban Poverty Alleviation (MH&UPA), Government of India has designed an interest subsidy scheme as an additional instrument for addressing the housing needs of the Economically Weaker Sections/ Low Income Groups segments in urban areas. The Scheme envisages the provision of interest subsidy to EWS and LIG segments to enable them to buy or construct houses. The Scheme will provide home loan with Central Government subsidy to EWS/LIG persons for acquisition of house as also for construction of house to such beneficiary, who does not own a house in his/her name or in the name of his/her spouse or any dependent child. Such beneficiaries who own land in any urban area but do not have any pucca house in their name or in the name of their spouse or any dependent child will also be covered under the Scheme. 10.28 The economic parameter of EWS is defined as households having an average monthly income upto `3,300 and the economic parameter of LIG is defined as households having an average monthly income between `3,301 upto `7,300. This will be subject to revision by the Steering Committee of the Scheme from time to time. The scheme will provide a subsidized loan for 15 – 20 years for a maximum amount of `1,00,000 for an EWS individual for a house at least of 25 sq.mts. Additional loans, if needed would be at unsubsidized rates. A maximum loan amount of `1,60,000 for a LIG individual for a house at least of 40 sq.mts will be admissible. However, subsidy will be given for loan amount upto ` 1 lakh only. Additional loans, if needed would be at unsubsidized rates. As against the target of construction of 159707 EWS/LIG houses during 2009-10, 184347 houses were constructed and the achievement was 115%. During the period April – September, 2010, as against the estimated pro-rata target of construction of 79834 EWS/LIG houses, 66416 houses have been constructed which is 83% of the target. Accelerated Rural Water Supply Programme - Rural Areas 10.29 The Department of Drinking Water Supply under the Ministry of Rural Development has been mandated to provide safe drinking water to all rural habitations. Considerable success has been achieved in meeting the drinking water needs of the rural population. Drinking Water Supply is one of the six components of Bharat Nirman, which has been conceived as a plan to be implemented in four years, from 2005 - 06 to 2008 - 09 for building rural infrastructure. During the year 2009-10 as against the target to cover 586 habitations (NC and PC), 508 habitations were actually covered under the programme, which is 87% of the target. Also, as against the target to cover 158003 slipped back habitations and habitations with water quality problems, 90586 habitations were addressed which is 57% of the target. During the period April – September, 2010 as against the target to cover 114 habitations (NC and PC), 7 habitations have been covered under the programme. This is 6% of the target. Also, during this period as against 85 the target to cover 36431 slipped back habitations and habitations with water quality problems, 22744 habitations have been addressed which is only 62% of the target. Sanitation Programme in Rural Areas 10.30 Rural Sanitation is a State subject. The efforts of the States are supplemented by the Central Government through technical and financial assistance under the Central Rural Sanitation Programme (CRSP). The Programme was launched in the year 1986 with the objective of improving the quality of life of the rural people and providing privacy and dignity to women. The components of the Programme include construction of individual sanitary toilets for households below the poverty-line (BPL), conversion of dry latrines to flush toilets, construction of village sanitary complexes for women, setting up of sanitary marts and production centres, intensive campaign for creating awareness, health education, etc. School Sanitation has been introduced as a major component to encourage wider acceptance of sanitation among the rural masses. During the year 2009-10, 12519 thousand individual household latrines were constructed. During the period April – September, 2010, 4576 thousand individual household latrines have been constructed. Institutional Delivery 10.31 The Hon’ble Prime Minister launched ‘Janani Suraksha Yojana’ under the National Rural Health Mission on 12th April, 2005. The scheme has the dual objectives of reducing maternal and infant mortality by promoting institutional delivery among poor women. Cash benefits are provided to the beneficiaries belonging to below poverty line (BPL) families and also to the village link worker/ASHA for coming to the institution for delivery, the cost of transportation, etc. Benefits are graded in nature and vary from high performing to low performing States and also from rural to urban areas. The scheme is 100% centrally sponsored. It is funded through the RCH flexi pool mechanism. Monitoring parameter under this scheme is number of deliveries that took place in specialised institutions. During the year 2009-10, 13785 thousand deliveries were conducted in institutions all over the country. During the period April – September, 2010, 7376 thousand deliveries have taken place in institutions. Scheduled Caste Families Assisted 10.32 The SC (Scheduled Caste) population, according to 2001 Census, accounts for 16% of the country’s total population. The strategy evolved for their upliftment includes: (i) special component plan of the States and central ministries, (ii) special central assistance, and (iii) assistance through the Scheduled Castes Corporations in the States. During the year 2009-10, as against the target of assisting 4774 thousand SC families, 5225 thousand SC families were assisted which is 109% of the target. During the period April – September, 2010, as against the target of assisting 2387 thousand SC families, 2163 thousand SC families have been assisted which is 91 % of the target. 86 Universalisation of ICDS Scheme 10.33 Integrated Child Development Services (ICDS) was conceived as the most viable vehicle for achieving holistic development with a focus on mother and child. The intended development of women and children, as a national priority, is being guided and pursued through the National Policy for Children - 1974 and the National Plan of Action for Children. The target population includes pregnant women, nursing mothers, children upto 6 years of age and adolescent girls. Supplementary Nutrition, Pre-school Education, Immunization, Health Check-up, Referral Services and Nutrition and Health Education are the main intervention packages offered under the scheme. In addition, the scheme envisages effective convergence of inter-sectoral services in the Anganwadi centres. The beneficiaries under ICDS scheme are drawn from the poorest families. During the year 2009-10, as against the target of making 7073 ICDS Blocks (cumulative) operational, 6581 Block (cumulative) were made operational which is 93% of the target. During the period April – September, 2010 as against the target of making 6815 ICDS Blocks (cumulative) operational, 6657 Block (cumulative) have been made operational which is 98% of the target. Functional Anganwadis 10.34 Under Integrated Child Development Services (ICDS), the Anganwadi is the primary unit which extends services such as supplementary feeding to bridge the calorie gap between the national recommended standards and average intake of children and women. In order to promote improved behavioural actions for the care of pregnant women and young children, the Anganwadi also provides an important contact opportunity with pregnant women and mothers of infants, who are 4 to 6 months of age. Throughout the country, the Anganwadi Worker and Helper have been utilized forvarious programmes/ schemes related to health and family welfare. The target for the year 2009-10 was to make 1356027 Anganwadis (cumulative) functional and the achievement against it was 1147257 which is 85% of the target. The target for April – September, 2010 was to make 1356027 Anganwadis (cumulative) functional against which achievement has been 1186106 which is 87% of the target. Urban poor families assisted under seven point charter viz. land tenure, housing at affordable cost, water, sanitation, health, education and social security 10.35 Urban slums, particularly in the big cities of our country, are the picture of human misery and degradation. Urbanization is an inevitable phenomenon of modernization and economic development. Slums grow as a result of structural inequities in the development of the urban sector. Due to the high price of land and housing and low purchasing power, the urban poor are forced to join the existing slums for cheap shelter or to occupy any vacant land/areas wherever available in the city. With a view to paying particular attention to the needs of slum dwellers, urban poor families are assisted under the seven point charter viz. (i) land tenure, (ii) housing at affordable cost, (iii) water, (iv) sanitation, (v) health, (vi) education and (vii) social security. For the year 2009-10, the target was to assist 233711 poor families and against this, 149167 families were assisted, which is 64% of the target. For the period April – September, 2010, the target was to assist 116843 poor families and against this, 200242 families have been assisted, which is 171% of the target. 87 Afforestation: (i) Area covered under plantation (Public & Forest Land) (ii) Seedlings Planted (Public & Forest Land) 10.36 This programme has been conceived to increase the green cover of the country. Under this programme, two major items are being monitored on monthly basis i.e. (i) area covered under plantations in respect of public lands including forest lands and (ii) seedlings planted on public and forest lands. During the year 2009-10, as against the target to cover 1813 thousand hectares of public and forest land under plantations, 1547 thousand hectares of land was covered, showing 85% of achievement. Similarly, the target for tree plantation during the year was to plant 11785 lakh seedlings on public and forest land and against it the planting of 10613 lakh seedlings was achieved, which is 90% of the target. During the period April – September, 2010 as against the target to cover 866 thousand hectares of public and forest land under plantations, 1166 thousand hectares of land has been covered showing 135% of achievement. Similarly, the target for tree plantation during the period was to plant 5429 lakh seedlings on public and forest land. The achievement of planting of 8843 lakh seedlings has been made, which is 163% of the target. Rural Roads – PMGSY 10.37 The President of India, in his address to Parliament on 25th February, 2005, announced a major plan for rebuilding rural India called Bharat Nirman. The Government has identified Rural Roads as one of the six components of Bharat Nirman and has set a goal to provide connectivity to all villages with a population of 1000 (500 in the case of hilly or tribal areas) with an all weather road by 2009 through the Pradhan Mantri Gram Sadak Yojana (PMGSY). Grameen Sadak (Rural Roads) has been added to give highest priority to the development and expansion of Rural Roads as through connectivity, the fruits of development can reach the rural areas. The target for the year 2009-10 was for construction of 55000 Km of road in rural areas whereas the achievement was 60172 Km of road constructed, which is 109% of the target. The target for the period April – September, 2010 was construction of 8609 Km of road in rural areas and the achievement against it has been of 21193 Km of road contructed, which is 246% of the target. Rajiv Gandhi Grameen Vidyutikaran Yojana (RGGVY) 10.38 This scheme of Rural Electricity Infrastructure and Household Electrification has been introduced in April, 2005 for achieving the National Common Minimum Programme objectives of providing access to electricity to all Rural Household in a period of four years. The Rural Electricity Corporation (REC) is the nodal agency for implementing the programme. The target for the year 2009-10 was electrification of 17500 villages and against it, 16701 villages electrified, which is 95% of the target. The target for the period April – September, 2010 was electrification of 8722 villages and the achievement of 6557 villages has been made, which is 75% of the target. 88 Energization of Pump Sets 10.39 Electric power in rural areas is not only required for domestic and agricultural purposes, but also for irrigation. Pumpsets are energized to provide irrigation facilities for agriculture. During the year 2009-10, 352247 pumpsets were energized against the target of energization of 210594 pumpsets which is 167% of the target. During the period April – September, 2010, 167843 pumpsets have been energized against the target of energization of 164459 pumpsets which is 102% of the target. Supply of Electricity 10.40 Government has notified the National Electricity Policy, which inter-alia aims at accelerated development of the power sector, providing supply of electricity to all areas and protecting interests of consumers and other stakeholders. The salient features of the policy are access to electricity and availability of power. During the year 2009-10, as against demand of 815659 million units (MUs) of electricity, 732372 MUs of electricity could be supplied which is 90% of the demand. During the period April – September, 2010, as against the demand of 421144 million units (MUs) of electricity, 380956 MUs of electricity could be supplied which is 90% of the power demand. 89 CHAPTER XI INFRASTRUCTURE AND PROJECT MONITORING 11.1 The Infrastructure and Project Monitoring Division is the management arm and apex monitoring institution of the Government. Itis responsible for the monitoring of 11 key Infrastructure Sectors and monitoring of Central Sector Projects in 16 sectors costing more than ` 150 crores. (The threshold level for monitoring has been revised w.e.f. April, 2010). The projects are monitored on monthly as well as on quarterly basis. The monitoring of Infrastructure Sectors viz. Power, Coal, Steel, Railways Telecommunications, Ports, Fertilizers, Cement, Petroleum & Natural Gas, Roads and Civil Aviation involves bringing out a monthly Review Report on Infrastructure Performance and Capsule Report on Infrastructure Performance. 11.2 Apart from this Division brings out a consolidated report on the Accelerated Irrigation Benefit Programme (AIBP). It also plays an important role in institutional development and capacity building in the area of project planning, implementation and management and other inter-sector issues. The Division has also played an extensive role in the adoption of state-of-theart technology and practices in project management all over the country. The IPMD also organizes training/seminar/workshop on project planning, evaluation and overall project management, usage/application of OCMS, data capturing techniques. Infrastructure Performance Monitoring 11.3 The monitoring of important infrastructure sectors in the country is designed to provide an overview of the performance with a view to highlighting slippages, if any, before the decision making authorities. This Ministry monitors the performance of the country’s eleven key infrastructure sectors, viz., Power, Coal, Steel, Railways, Telecommunications, Ports, Fertilizers, Cement, Petroleum & Natural Gas, Roads, and Civil Aviation. The performance of these sectors is analyzed with reference to the pre-set targets for the month and for the cumulative period and the achievements during the corresponding month and cumulative period of the last year. 11.4 Infrastructure performance is regularly reported through the following monthly reports: (i) Review Report on Infrastructure Performance. (ii) Capsule Report on Infrastructure Performance Overall Performance of Infrastructure Sectors 11.5 The production performance of the infrastructure sectors during the year 2009-2010 and 2010-2011 (April- November) is at Annex - VI. Infrastructure Performance during 2010-11 (April-November) 11.6 The overall infrastructure performance during 2010-11 (April - November) has shown moderate growth. All sectors except roads recorded a positive growth over the performance for 90 the corresponding period of the previous year. The growth rate in respect of production of finished steel, crude oil & refinery, performance of civil aviation (cargo as well as passengers) and addition in switching capacity of telephone exchanges (telecom sector) was higher than the growth rates achieved during the corresponding period of the last year. However, as compared to the targets set for this period, except refinery production and highway up-gradation by NH(O) & BRDB most of the sectors have lagged behind their targets. The trend in the overall infrastructure performance during 2010-11 (April – November) as compared to the targets set for the period and the performance for the year 2009-10 is at Annex-VI. Sector-wise details are given in the following paragraphs. Power 11.7 The overall power generation during the past few years has increased consistently, as indicated in the adjoining graph. During 2009-2010 the power generation at 771.55 Billion Units (BU) recorded a growth of 6.8% over the power generation for 2008-2009. The growth rate was higher compared to 2.5% achieved during 2008-09. The All India Plant Load Factor (PLF) of the Thermal Power Stations (TPS) during 2009-2010 was 77.5%, which was higher than the PLF of 77.3% achieved during 2008-2009. 11.8 During 2010-11 (April – November) the power generation in the country at 530.41 Billion Units (BU) recorded a growth of 4.6% over the power generation during the corresponding period of the last year. However, compared to the target set for the period, it lagged behind by 3.1%. The adjoining chart shows the position of power generation vis-à-vis target and the achievement of the previous year. The thermal generation at 426.60 BU recorded a growth of 3.2%. The PLF was 72.4% compared to 75.7% achieved during the corresponding period of last year. So far as sector-wise thermal generation is concerned, Central and Private sectors recorded a positive growth of 5.2% and 25.4% respectively, but the State sector achieved a negative growth of 5.5%. The Hydro power generation at 83.18 BU was higher than the target as well as the generation, during the corresponding period of the previous year, by 0.4% and 8.2% respectively. The Nuclear power generation at 15.44 BU was 9.1% higher than the target set for the period and it was also 29.3% higher than the generation during the corresponding period of previous year. 91 Coal 11.9 The coal production during 2009-2010 at 526.15 Million Tonnes (MT) was marginally higher than the target set for the year and it registered a growth of 8.0% over the production of 487.27 MT during 2008-09. The trend of coal production during past five years is brought out in the adjoining graph. 11.10 The overall coal production during 2010-11 (April – November) at 319.80 MT recorded a growth of 0.6% over the production of 317.79 MT during the corresponding period of the last year. However it lagged behind its target for the period by 10.4%. The production of coking coal at 23.32 MT registered a growth of 16.5% and the production of washed coal at 2.07 MT was 7.9% higher than the production during the corresponding period of previous year. The overall coal despatches during 2010-11 (April-November) at 332.13 MT was 3.0% higher than the despatches of 322.47 MT during the corresponding period of previous year. Steel 11.11 The overall production of finished steel during the year 2009-2010 was 65.46 MT, which recorded a growth of 3.2% over the production of 63.44 MT in 2008-2009. The trend in production of finished Steel during past five years is indicated in the adjoining graph. 11.12 During 2010-11 (April – November), the production of finished steel at 45.81 MT recorded a growth of 6.7% over the production of 42.92 MT during the corresponding period of last year. The capacity utilization of main producers (SAIL+VSP+Tata Steel) during the period was 88.5%, which was higher than the utilization of 88.1% during the corresponding period of previous year. Cement 11.13 The production of cement during 2009-2010 at 206.61 million tonnes (MT) was 10.1% higher than the production of 187.61 MT for the last year. The growth rate has 92 increased compared to 7.6% during 2008-09. The overall capacity utilization at 84% was lower than the achievement of 87% during 2008–2009. The trend in cement production during past few years is indicated in the side chart. 11.14The production of cement during 2010-11 (April – November) at 137.43 MT was 4.1% higher than the production of 132.00 MT for the corresponding period of last year. The overall capacity utilization at 73% was lower than the achievement of 81% during the corresponding period of previous year. Cement consumption during 2010-11 (April – November) was 135.76 MT. Coal supply to the Cement industry during the period was 78.30 lakh tonnes compared to the supply of 73.60 lakh tonnes during the corresponding period of last year. Fertilizers 11.15 The overall production of fertilizers (nitrogen and phosphate) during 2009-2010 at 16.22 million tonnes (MT) was slightly higher (0.1%) than the target set for the year and it was also 13.2% higher than the production during 2008-2009. During the year, the overall capacity utilization (Nitrogen + Phosphate) was 93.6% was equal to the target for the year but it was higher than the achievement of 82.7% during 2008-09. The production trend during the past few years is given in the side chart. 11.16 During 2010-11 (April – November) the production of fertilizers at 10.97 MT was 5.4% lower than the target for the period and it was almost equal than the production during the corresponding period of last year. The overall capacity utilization was 95.0% compared to the target of 100.4%. The same capacity (95.0% ) was utilized during the corresponding period of the last year. The production of nitrogen at 8.02 MT was lower by 3.6% than the target; but it was 1.2% higher than the production during the corresponding period of previous year. The production of phosphate fertilizers at 2.95 MT was lower than the target set for the period as well as the production during the corresponding period of the last year by 9.9% and 3.0% respectively. 93 Petroleum 11.17.1 Crude Oil: The production of Crude Oil during 2009-2010 at 33.69 million tonnes (MT) was 11.4% lower than the target of 38.00 MT but it recorded a growth of 0.5% over the production of 33.51 MT during the corresponding period of last year. The trend in crude oil production during past few years is indicated in the side chart. 11.17.2 The production of Crude Oil during 2010-11 (April – November) at 24.81 MT was slightly lower (0.3%) than the target of 24.89 MT, but it was 11.5% higher than the production of 22.25 MT during the corresponding period of last year. 11.18.1 Refinery Production: The refinery production (in terms of crude throughput) during 2009-2010 at 160.12 MT was higher than the target of 153.18 MT, but it was 0.4% lower than the production of 160.77 MT during the year 20082009. The overall capacity utilization at 107.5% during 2009-10 was lower than the achievement of 107.9% in the previous year. The production trend during past few years is given in the above chart. 11.18.2 The refinery production during 2010-11 (April – November) at 106.53 MT was 2.1% higher than the target of 104.37 MT and it was also 0.8% higher than the production of 105.69 MT during the corresponding period of the last year. The overall capacity utilization was 102.6% compared to 101.8% achieved during the corresponding period of previous year. The above chart shows the target and achievement of crude oil and refinery production. 11.19.1 Natural Gas: The overall natural gas production during 2009-2010 at 47,573 Million Cubic Meters (MCM) was 8.8% lower than the target of 52,167 MCM, but it recorded a growth of 44.8% over the production of 32,846 Million Cubic Meters gas produced during 2008-2009. 11.19.2 The Natural Gas production during 2010-11 (April – November) at 35,292 Million Cubic Meters (MCM) was 1.4% lower than the target of 35,790 MCM; but it was 19.8% higher than the production of 29,467 MCM during the corresponding period of the last year. Roads 11.20 In Road sector, the National Highway Authority of India (NHAI) and Border Road Development Board (BRDB) & National Highways (Original) NH (O), in the Ministry of Road 94 Transport and Highways are engaged in construction and up-gradation of highways. During 2009-2010, the NHAI has constructed/ strengthened 2673.94 Kms national highways to four lanes against the target of 3165.00 Kms and the achievement of 2203.00 Kms during 2008-2009. The NH (O), and BRDB have widened / strengthened 68.64 Kms to four lanes, 1233.85 Kms to two lanes and strengthened 1012.70 Kms of existing weak pavement. In addition they have improved 30.67 Kms of low-grade sections and riding quality of 3168.02 Kms highways. As part of up-gradation of highways, 122 bridges were also reinforced/ constructed. 11.21 During 2010-11 (April – November) the NHAI has widened/strengthened 1007.08 Kms, highways against the target of 1293.83 Kms and the achievement of 1486.00 Km during the corresponding period of the last year. The trend in up-gradation of highways is indicated in the adjoining chart. The NH (O) and BRDB widened 62.33 Kms to four/six lanes, 653.82 Kms to two lanes and strengthened 575.35 Km of existing weak pavement. They have also improved only one Kilometer low grade sections and 1215.36 Kms of riding quality of highways. As part of the up-gradation, during this period 59 bridges were also reinforced /constructed. Railways 11.22 The revenue earning freight traffic moved by the Railways during 2009-2010 at 887.99 MT recorded a growth of 6.6 % over the freight traffic movement for the year 20082009. It was marginally lower (0.2%) than the target set for the year. All commodities recorded positive growth. The Railways booked 7442.65 million passengers during the year 2009-10, which was 4.9% higher than the passengers booked in the last year. The annual trend in freight traffic during last five years is indicated in the side chart. 11.23 During 2010-11 (April – November) the freight traffic moved by the Railways at 593.43 MT recorded a growth of 3.3% over the freight movement of 574.40 MT during the corresponding period of last year. But it was 1.9% lower than the target set for the period. The growth rate was lower compared to 7.4% during the 95 corresponding period of previous year. The Railways booked 5235.84 million passengers, which was 6.0% higher than the passengers booked during the corresponding period of the last year. The adjoining chart indicates the performance of Railways vis-à-vis target for the period and achievement during the corresponding period of the previous year. Shipping and Ports 11.24 The major ports in the country handled 560.97 MT cargo during 2009-2010, which was 5.7% higher than the achievement for the previous year but it was 3.5% lower than the targets set for the year. The trend in cargo handled at major ports is indicated in the side chart. 11.25 During 2010-11 (April– November) the major ports handled 365.92 MT cargo which recorded a growth of 0.8% over the handling of 362.91 MT cargo during the corresponding period of previous year, but it was 8.5% lower than the target of 399.95 MT. Shortfall from target was due to less handling of the cargo. 11.26 The coastal shipment of coal (thermal and coking) to South India during 2009-10 at 71.58 MT was 14.8% lower than the target for the year, but it was 1.7% higher than the shipment during the previous year. During 2010-11 (April – November) the over all coastal shipment of coal was 47.75 MT which was 1.8% higher than the shipment during the corresponding period of the previous year. Civil Aviation 11.27 During 2009-2010, the five international airports namely Mumbai, Kolkata, Delhi, Chennai, and Trivandrum collectively handled 5,93,234 tonnes of export cargo, which was 10.4% higher than the cargo handled during 2008-09. Further these five international airports handled 4,63,289 tonnes of import cargo during this year, which was 7.9% higher than the import 96 cargo handled during 2008-09. Annual trend in handling of export and import cargo is indicated in the adjoining chart. 11.28 During 2010-11 (April – November) these airports handled 4,59,311 tonnes of export cargo, which was 17.7% higher than 3,90,124 tonnes of export cargo handled during the corresponding period of the previous year. Further these airports handled 3,70,785 tonnes of import cargo during this period which recorded a growth of 26.1% over 2,94,136 tonnes cargo handled during the corresponding period of the previous year. 11.29 During 2009-10 the international airports at Mumbai, Kolkata, Delhi, Chennai and Trivandram handled 231.76 lakh passengers at international terminals, which was 5.7% higher than 219.26 lakh passengers handled during 2008-2009. The domestic terminal of these five airports handled 492.29 lakh passengers during 2009-10, which recorded a growth of 14.5% over 429.76 Lakh passengers handled during 2008-2009. Annual trend in handling passengers during past few years is indicated in the side chart. 11.30 During 2010-11 (April – November) the international terminals of these airports handled 167.12 lakh passengers, which was 12.7% more than 148.25 lakh passengers handled during the corresponding period of the previous year. The Domestic terminal of these airports handled 369.01 lakh passengers during 2010-11 (April– November), which was 15.9% higher than 318.41 lakh passengers handled during the corresponding period of the last year. 97 Telecommunications 11.31 During 2009-2010, at the national level 138.80 lakh lines were added in the switching capacity of telephone exchanges, which was 3.6% lower than the addition of 143.93 lakh lines during 2008-09. During 2009 - 2010, the private sectors provided 5.84 lakh new (net) wire line (Fixed) telephone connections, which was 32.0% lower than 8.60 lakh connections provided during the previous year. while the public sector surrendered 15.92 lakh connections. The mass surrendering of wired telephone connections by the public sector was due to non-payment of bills and preference for cell phones.Further both the public and private sectors provided 1925.30 lakh new (net) Cell phone connections, which was 47.3% more than 1306.82 lakh cell phone connections provided during 2008-09. Total 1915.22 lakh connections (fixed + cell phones) were provided during 2009– 2010, which were 48.2% higher than 1292.33 lakh phones provided during 2008-2009. Annual trend in provision of landline and Cell phone connections during past few years is indicated in the side chart. 11.32 In the current financial year of 2010-11 (April–November), 99.28 lakh new telephone lines were added in the switching capacity of telephone exchanges, which was 39.7% higher than the addition of 71.06 lakh lines during the corresponding period of previous year. During April November 2010, private sectors provided 3.09 lakh new (net) wire line (Fixed) telephone connections, which was 22.5% lower than 3.99 lakh connections provided during the corresponding period of the last year. The public sector surrendered 20.78 lakh connections. The mass surrendering of wired telephone connections by the public sector was due to preference for cell phones.During April - November 2010, both the public and private sectors provided 1452.56 lakh new (net) Cell phone connections, which was 27.1% higher than the Cell phone connections provided during April - November 2009. The growth rate in respect of the public sector was 62.4% and 24.1% in respect of the private sector. The connections of WLL (Wireless local loop) also included in wireless (Cell) phones. 11.33 Total (fixed plus cellular) telephone connections provided by the public and private sectors at 1434.87 lakh was 26.4% higher than 1134.75 lakh phones provided during the corresponding period of the last year. Monitoring of Projects Project Implementation Status during 2009-10 11.34 At the beginning of the year 2009-10 i.e. as on 1.4.2009, there were 925 projects costing `20 crore and above on the monitor of the Ministry. During the year 2009-10, 205 projects were taken on the monitor and 125 projects were dropped due to completion and other reasons leaving 98 1005 projects on the monitor at the end of the year 2009-10. The details have been summarized in the Table - 11.1 below. Table - 11.1 Summary of Projects during 2009 – 2010 Project Implementation Scenario during 2010-11 Sr. No. 1 2 3 4 5 6 7 8 9 10 11 12 13 14 15 16 Sector ATOMIC ENERGY CIVIL AVIATION COAL INFORMATION BROADCASTING MINES STEEL PETROLEUM POWER HEALTH & FW RAILWAYS ROAD TRANSPORT HIGHWAYS SHIPPING & PORTS TELECOMMUNICATION URBAN DEVELOPMENT WATER RESOURCES INFORMATION TECHNOLOGY Total 6 29 125 No. of Projects Added during 2009-2010 0 33 19 No. of Projects Dropped during 2009-2010 1 14 16 1 1 0 0 0 0 1 1 55 53 70 1 262 3 35 27 0 19 9 7 7 0 15 49 81 90 1 266 195 50 12 12 36 4 171 58 46 28 1 18 27 0 16 0 0 48 55 1 2 2 925 0 205 0 125 No. Of Projects As on 01-04-2009 No. Of Projects As on 31-03-2010 5 48 128 & & 1005 11.35 In view of the threshold level for monitoring revised from `20 crores to `150 crores with effect from 01.04.2010, there were only 574 projects on the monitor of the Ministry as on 01.04.2010. During 2010-11, upto30th November, 2010, 99 new projects were taken up for monitoring and a total of 101 projects were dropped from the monitoring during this period. The sector-wise details of the projects have been summarized in the Table - 11.2 on the following page. 99 Table 11.2 Summary of Projects during 2010-2011 (at the end of November, 2010) Sr. No. 1 2 3 4 5 6 7 8 9 10 11 12 13 14 15 Atomic Energy Civil Aviation Coal Fertilizers Mines Steel Petroleum Power Health & Family Welfare Railways Road Transport & Highways Shipping & Ports Telecommunications Urban Development Water Resources 5 9 42 0 1 22 78 80 1 138 No. of Projects added during 2010-11 0 1 8 6 0 0 13 14 0 22 136 10 1 135 22 37 2 1 2 23 0 0 0 6 0 0 24 54 2 1 Total 574 99 35 572 Name of the Sector No. of Projects as on 01/04/2010 No. of Projects dropped during 2010-11 No. of Projects as on 30/11/2010 1 1 5 0 0 2 8 7 0 4 4 9 45 6 1 20 83 85 1 136 11.36 The chart below depicts the number of projects completed along with their cost, yearwise starting from 1994-95. 11.37 As on 1st December, 2010 , as illustrated below there were 572 projects with an anticipated cost of ` 714501.64 crore on the monitor of the Ministry. For the purpose of monitoring, the projects have been grouped into two categories, viz., (i) mega projects, each costing ` 1000 crore and above, and (ii) major projects, costing ` 150 crore and above. The total number of projects in each category, and the anticipated cost, sector-wise, are given in the Table - 11.3 below. 100 Table – 11.3 Sector-wise summary of mega and major project (as on 1-12-2010 Projects Completed in 2010-11 Sr. No. Name of the sector No of Mega Projects Anticipate d Cost (`crore) Original Cost (`crore) No of Major Projects Anticipat ed Cost (`crore) Original Cost (` crore) 1 Atomic Energy Civil Aviation Coal Fertilisers Mines Steel Petroleum Power Railways Road Transport & Highways Shipping & Ports Telecommun ications Urban Developmen t Water Resources 4 24,167.29 21,982.29 0 0.00 0.00 2 3,215.51 3,215.51 6 1596.89 1596.89 7 3 1 6 35 42 25 6 15,940.38 4,065.66 4,401.76 60,562.00 138,007.30 167,048.96 70,086.48 9,445.07 13,075.27 4,065.66 4,091.51 39,671.00 125,178.48 162,809.25 34,760.58 8,265.07 37 3 0 13 35 41 122 117 12606.91 1,251.75 0.00 4817.56 17198.80 18028.14 56087.93 36659.84 12134.93 1,251.75 0.00 4109.53 17152.11 16950.32 33817.77 36138.04 5 9,297.78 8,979.48 17 7628.48 7,103.14 2 2,876.94 2,876.94 40 17819.85 17357.55 2 30,503.36 15,071.00 0 0.00 0.00 1 1,187.00 542.90 0 0.00 0.00 141 540,805.49 444,584.94 431 173696.15 147612.03 2 3 4 5 6 7 8 9 10 11 12 13 14 11.38 70 projects at an anticipated completion cost of Rs 46177.12 crore were completed during the year 2010-11 (upto 30.11.2010) as per the list given in Annex-VII. Project Implementation Status during the 11th Plan *For 2010-11, all projects costing more than ` 150 crores are being monitored by this Ministry instead of ` 20 crores and above 101 *For 2010-11, all projects costing more than ` 150 crores are being monitored by this Ministry instead of ` 20 crores and above 11.39 During the Eleventh plan (April 2007 to November, 2010), 384 projects were completed. This includes 93 projects completed in 2007-08, 124 projects completed in 2008-09, 97 projects completed in 2009-10 and 70 projects completed upto 30.11.2010 in 2010-11. Sector-wise break up of these projects are given in Table 11.4 below. 102 Table - 11.4 Summary of Projects Completed during 11th Plan (April, 2007 to November, 2010) SL NO . 1 2 3 4 5 6 7 8 9 10 11 12 Sector Atomic Energy Civil Aviation Coal Petroleum Power Health & Family Welfare Railways Road Transport & Highways Shipping & Ports Steel Telecommunications Urban Development Total No. of Projects Original Cost (`crore) Final Estimated Cost 2 27 24 35 43 1 52 3415.26 1543.87 4795.45 40618.19 32911.58 71.18 7348.06 3415.26 1572.30 6419.69 50343.66 36413.77 443.15 15836.03 Final Expenditur e Reported 2479.05 1522.87 4992.17 41987.62 30699.72 547.78 13641.03 88 29579.54 30490.09 33334.87 17 24 65 6 384 6018.79 3138.10 17816.05 189.33 147445.40 6091.74 3224.35 16663.10 195.82 171108.96 3702.05 2288.81 7400.54 158.88 142755.39 11.40 Sector-wise analysis of the cost and time overrun of projects under implementation on our monitoring system (excluding completed projects) is indicated in Table - 11.5. 103 TABLE-11.5 Extent of the time overrun in projects with respect to original schedule (Status of Projects as on 30.11.2010) (` Crore Sr. No. 1 2 3 4 5 6 7 8 9 11 12 13 14 Sector Atomic Energy Civil Aviation Coal Fertilisers Mines Steel Petroleum Power Railways Shipping & Ports Telecomm unications Urban Developm ent Water Resources Total No. of Proj ects Total cost Original Anticipate d Cost Projects with time overrun Cost overrun (%) No. Original cost Anticipate d Cost Range (Months) 4 21982.29 24167.29 9.94 3 20876.00 23061.00 12 - 36 8 44 6 1 19 70 83 147 4812.40 25210.20 5317.41 4091.51 43780.53 142330.59 179759.57 68578.35 4812.40 28547.29 5317.41 4401.76 65379.56 155206.10 185289.32 126174.41 0.00 13.24 0.00 7.58 49.33 9.05 3.08 83.99 2 19 0 1 11 31 41 26 2155.86 13439.80 0.00 4091.51 31356.04 39019.62 105637.36 17681.46 2155.86 16616.47 0.00 4401.76 37455.14 56326.32 110079.48 39580.32 3- 5 3 - 64 27 - 27 6 - 36 1 - 74 1 - 83 3 - 225 22 16082.62 16926.26 5.25 11 6224.59 6880.29 3 - 78 42 20234.49 20696.79 2.28 38 18186.25 18711.63 3 - 58 2 15071.00 30503.36 102.40 2 15071.00 30503.36 6 - 15 1 542.90 1187.00 118.64 1 542.90 1187.00 60 - 60 592196.97 714713.86 20.70 299 309140.38 382338.42 572 11.41 An analysis of the total 572 projects as on 30.11.2010 shows that 299 projects have contributed to time overrun w.r.t their original schedule. The time overrun accounted by these projects ranges from 1-225 months. The overall cost overrun has resulted in 20.7% increase in original cost. The cost overrun for all projects together is ` 122516.89 crore. The chart below depicts the percentage of delayed projects during the last 18 years. This shows a decline in the delayed projects. 104 Time and Cost overrun in projects 11.42 Time and cost overruns have been a major problem affecting the implementation of Central Sector Projects. With the support of all the Ministries concerned, the time overrun in projects is coming down resulting in reduction in the cost overrun of the projects due to close monitoring, timely resolution of problems and systems improvement brought out by the Ministry of Statistics & Programme Implementation,. An analysis of the trend in the last 19 years shows that the cost overrun has come down from 61.6% in March, 1991 to 20.7% in November, 2010 resulting in savings. The Chart below depicts the trend of cost overrun during the last 19 years. 105 Causes of Time and Cost Overrun 11.43 Time overrun, apart from upsetting the Plan targets, leads to cost overrun on account of inflationary increase, exchange rate variation and higher interest and administrative cost. Time overrun takes place due to factors such as paucity of financial resources, delay in obtaining clearances, delay in acquisition of land, poor performance of consultants, vendors and contractors, disputes and court cases, inadequate infrastructure support, resistance by land owners and poor law and order situation in certain parts of the country. Increases in the scope during construction, higher compensation for rehabilitation, higher cost incurred on environmental protection measures, judicial awards in contractual disputes are some of the reasons for cost overruns in projects. The problems reported by ongoing projects on the monitor may be seen in Table 11.6. Table - 11.6 Major Factors for Delay(Status of Projects as on 01.12.2010) Sr. No. (0) 1. 2. 3. 4. 5. 6. 7. 8. 9. 10 11. 12. 13. 14. 15. 16. 17. 18. 19. 20. Sector (1) ATOMIC ENERGY CIVIL AVIATION COAL FERTILISERS FINANCE HEALTH & FW HEAVY INDUSTRY INFORMATION & BROADCASTING INFORMATION TECHNOLOGY MINES PETROCHEMICALS PETROLEUM POWER RAILWAYS ROAD TRANSPORT & HIGHWAYS SHIPPING & PORTS STEEL TELECOMMUNICATI ON URBAN DEVELOPMENT WATER RESOURCES Total Delay in Slow Supply of Progre Equipmen ss ts (5) (6) 0 0 0 0 1 2 0 0 0 0 0 0 0 0 Law & Ord er (7) 0 0 2 0 0 1 0 Fund Constrai nts Land Acquisit ion Environm ent Clearance (2) 0 0 2 0 0 2 0 (3) 0 0 5 0 0 1 0 (4) 0 0 7 0 0 0 0 0 0 0 0 0 0 0 0 0 0 0 0 0 0 0 0 0 0 16 0 0 1 0 39 0 0 0 0 0 0 0 0 0 44 0 0 0 0 2 0 0 0 0 1 0 0 2 4 32 0 1 0 0 0 0 2 0 0 0 0 0 0 0 1 0 1 0 0 3 2 0 0 0 0 0 0 0 0 0 0 0 0 0 0 0 20 0 47 0 7 0 46 0 5 0 4 0 52 106 Othe rs * (8) 0 1 2 1 0 3 0 * includes Technology selection and agreement, Award of contract, Delay in civil works and governmentclearance, Geomining, Court case, Inadequate Infrastructure and bad weather. Remedial Measures 11.44 The measures taken to reduce delays in project implementation are of continuing nature and they include stricter appraisal of projects, weeding out unviable projects, transfer of projects to private/joint sectors, re-prioritisation of projects in the light of resource constraints, appointment of a nodal officer for each project co-terminus with the gestation period of the project, formation of Empowered Committees in the administrative Ministries for periodic review of the status of Government-owned projects, quarterly performance reviews of PSUs projects by the administrative Ministries concerned, delegation of more financial power to the undertakings, strengthening of the monitoring system and use of Standard Contract Bidding Documents for domestic bidding. 11.45 Following specific initiatives have been taken during the year to improve the project implementation scenario:Standing Committee on Time and Cost Overruns 11.45.1 In pursuance of the suggestions of the Standing Commit on Finance, a Committee on Time and Cost Overruns under the Chairmanship of Additional Secretary with members from different Ministries has been constituted. Meetings have been held on 7-7-10, 13-9-10, 29-10-10 and 26-11-10 for indepth analysis of time and cost overruns, and discuss project specific case studies in various sectors such as Petroleum, Steel, Coal, Surface Transport, Highways, Railways, Telecommunication and Power sectors. The findings of the Committee would be utilized in preparation of a consolidated report which would be submitted before the Parliamentary Standing Committee on Finance. Review of Projects by Hon’ble Minister of State (I/C) and Senior Officers 11.45.2 The following projects were reviewed during the period from April to December, 2010 1) Hon’ble Minister of State (I/C) dedicated the Mine-II Expansion Project of NLC to the nation on 05.04.10. Hon’ble Minister reviewed the Expansion Project of TPS-II of NLC and Prototype Fast Breeder Reactor of Bhavini at Kalpakam. 2) Officers from Infrastructure and Project Monitoring Division visited the project sites of 4 Airport Expansion projects at Chennai Airport on 07.04.10. The Executive Director (Projects), General Manager (Electrical) and General Manager (Civil) were also present, during the review, along with Director (Airport). MOS(I/C) addressed a letter to Ministry for Defence for vacation of land falling in the project area of the Chennai Airport Expansion Projects. 3) Six projects were reviewed by senior officer of the Infrastructure and Project Monitoring Division (IPMD) along with an officer from the Planning Commission at projects sites at 107 Visakhapatnam from 21.07.10 to 23.07.10. The names of the reviewed projects are given below: (i) Vishakhapatnam Crude Cavern Project of Indian Strategic Petroleum Reserve Ltd.(ISPRL), (ii) Vizag Steel Plant of Rashtriya Ispat Nigam Ltd. (RINL) (iii) Review of Clean Fuel project of Vizag Refinery, HPCL, (iv) Diesel Hydro Treater Plant, HPCL (v) Single Point Mooring Facility Project, HPCL (vi) Visakh Storage Terminals Resitement Project, HPCL 4. The IPMD appraised the New Green Field Airport Project near Itanagar, Arunachal Pradesh. The project is not yet ready for Stage-II clearance as land is yet to be acquired and cost estimates not firmed up. The project is proposed to be funded from 100% grant. The project is recommended for Stage-I of clearance. 5. Additional Secretary visited ONGC’s Neelam Offshore and Jawaharlal Nehru Port Trust (JNPT) and reviewed the projects under implementation, at Mumbai. Associated Transmission lines along with Kaiga Atomic Power projects 3, 4 and the infrastructure projects of Murmagao Port trust were reviewed at their sites in Goa. 6. The IPMD facilitated review of projects of Gas Authority of India Ltd. in the southern region at Bangalore and projects of National Highway Authority of India in the Southern Region at Hyderabad by the Parliamentary Standing Committee on Finance. 7. The Infrastructure and Project Monitoring Division evaluated six new Railway Projects namely; (i) Madurai-Tuticorin via Aruppukottai, New Line. (ii) Tumkur-Chiradurg-Davangere, New Line. (iii)Whitefield-Kolar via Hosakote, New Line. (iv) Udhampur-Srinagar-Baramulla, New line, Revised estimate (v) Doubling and Electrification of Vijayawada to Nidadavolu via Gudivada and Bhimavaram, Gudivada to Machillipattnam and Bhimavaram to Narsapur. (vi) Multi-Modal Transport system (Phase-2) in twin cities of Hyderabad and Secunderabad. The views of the Ministry were communicated in the meeting of the Expanded Board for Railway Projects held on 09-12-2010. Participation in the meetings of the Standing Committees 108 11.45.3 The officers of the IPMD are participating in the meetings of the Standing Committees of the concerned administrative Ministries with a view to fix responsibility for time and cost overruns in delayed projects. During the year 2010-11, the officers attended meetings of the Standing Committees in respect of the following projects. a. Strategic crude oil storage project at Visakhapatnam. b. Tripura gas based power project, Monarchak – RCE at November, 2009 Price level. c. Second cost and time overrun of CSIR Tenth Plan Network Project on “Spearheading Small Civilian Aircraft Design” Development and Manufacture. d. Koteshwar H.E. Project being executed by THDCIL in Uttarakhand. e. Delay in commissioning of Teesta – V HEP in Sikkim implemented by NHPC. On-Line Computerised Monitoring System (OCMS) 11.46 The IPMD took the initiative of strengthening project monitoring mechanism, OCMS, in place for last 4 years. Efforts were made to train officers from all the users agencies and obtain information on-line from the project enterprises. The system has been technically modified during the course of the year to avoid difficulty in connectivity and transferring information online. OCMS requires internet connectivity to access the website (www.cspm.gov.in). The system will have online project-wise data collection and communication without time lag, transfer of graphics, photos, PERT/CPM Charts, access to sectoral reports by the Ministries, guidelines, procedures and circulars relating to project management. It will also give an opportunity for project managers and engineers to write about their experiences on the electronic magazine. The data-base of the system is secured through a firewall which allows only authorized persons to make any changes in the data. All user agencies are provided access code for access to sector reports and project specific details. Efforts are being made to remove constraints and stabilize the system to increase on-line flow of information. One day training programme on Online Computerized Monitoring System (OCMS) was organized on 10th November, 2010. 28 participants of different public sector enterprises and Government Ministries and departments using the OCMS attended the training programme. Project Implementation Manual: 11.47 A Project Implementation Manual had been prepared with the objective of laying down appropriate guidelines covering all the aspects of project management and the entire gamut of project activities commencing from inception to commissioning covering the complete project cycle. The Project Implementation Manual inter-alia provides the checklist for all sectors including infrastructure and Utilities Sector covering Roads and Bridges, Shipping and Ports, Airports and Civil Aviation, Energy and Power Generation, Telecommunications, Water Supplies and Sewerage, Housing and Railways, Social and Community Development sectors, covering Education and HRD, Health and Medical Services and Economic Sector covering Agricultural, Fisheries, Forestry, Industry and Industrial Estates and Tourism. It was released on 23rd June, 2010 by then Hon’ble Minister (Independent Charge) for Coal and Statistics & Programme Implementation 109 Training Programme in Project Planning and Management : 11.48 A 5 day Training Programme was organized in June, 2010 at Nainital in collaboration with Indian Society for Training and Development. The training covered the complete project cycle and discussed contract and management techniques. The training was attended by 40 participants from CPSUs and State & Central Governments. Two training programmes on Project Planning and Management were completed in January, 2011: (i) Three days (19 to 21 January, 2011) programme in Sikkim, in which 50 participants from the Govt. of Sikkim participated. (ii) Five days (24 to 28 January, 2011) programme at National Academy of Statistical Adminstration (NASA). In this hands on training was imparted to 30 participants from central PSUs. (iii)Ministry has supported 5 training programmes on project management organized by the PHD Chamber of Commerce and Industry. These are already in progress. (iv) A Special Training on project management for project officers of PSUs is being organized in March, 2011. (v) Three more training programmes are planned during the current financial year in Arunachal Pradesh, Orissa and at NASA, Delhi. National Workshops 11.49 The Ministry organized and sponsored several workshops on Project Management related topics. These are: 1. National Consultation Workshop on Certification of Project Managers was held on 23.06.2010 at Vigyan Bhawan. The Conference was addressed by by Hon’ble Minister, Coal and MOSPI (I/C), Dr. A.S.Pillai, Director General and CEO, Brahmos, Member Secretary, Planning Commission, Addl. Secretary, Human Resource Development,. The Consultation was represented by senior executives from industry in the public and private sectors, premier institutions like IIMNs and IITs, MDI,Gurgaon, IGNOU and representatives from Project Management Institute, USA, International Project Management Association along with their counterparts in India. Necessary follow up action has been initiated to enhance development of Project Management Certification. 2. A 3 days Global symposium was organized in association with the International Project Management Association (IPMA) and PMA, India. This provided a good forum for experience sharing among the project manages across various countries. 3. A 3 day National Workshop was organized by PMI India in collaboration with the Ministry at Mumbai. The Workshop was attended by Public & Private Sectors and discussed various aspects of Project Management. 110 Other Important Activities of the Division • • • • • In order to strengthen the capacity of the Division with latest project management techniques and tools, a two – member delegation led by the Additional Secretary attended the World Congress on Project Management and Network Meetings organized by Project Management Institute, USA between 10th to 14th May, 2010 at Milan, Italy. The Ministry has taken lead role in MOU negotiation meetings organized by Department of Public Enterprises. The emphasis is on providing high weightage to project implementation to ensure timely achievement of key milestones, financial and other dynamic parameters. Meeting of the Consultative Committee of the Ministry of Statistics and Programme Implementation was held under Chairmanship of Hon’ble Minister, Coal and MOSPI (I/C) on 29th September, 2010 on Project Monitoring. Members of the Committee have emphasized on removing defects in the formulation stage and suggested critical review of top 10 projects with large delays by involving Members. They have also suggested to involve them in the monitoring process. The Infrastructure and Project Monitoring Division presented the monitoring mechanism to participants from Commonwealth countries in the Programme on Project Management organised jointly by Commonwealth Secretariat, IIPA and Strategic Management Group. A case study on innovative strategies to save time and cost overruns in Strategic Oil Storage Facility at Vizag, was presented in the World Congress at New Delhi organised by International Federation of Consulting Engineers. Accelerated Irrigation Benefit Programme (AIBP) 11.50 The Government of India announced the Accelerated Irrigation Benefits Programme during 1996-97 to extend special Central Assistance to those projects which could yield irrigation benefits in the next four agricultural seasons. These projects are being monitored by the Central Water Commission with the help of its regional offices and the release of funds is regulated on the basis of progress and utilization of funds released. The funds are released by the Ministry of Finance on the recommendations of the Ministry of Water Resources. The Division prepares an Annual Report every year. The annual report for 2009-10 has been released. The overview of the progress of AIBP since the inception of the Programme is given in the table below: 111 1. Total projects under AIBP : 283 2. CLA/Grant released upto 2008-09 : `34783.7823 crore 3. CLA/Grant released during 2009-10 : `6945.5903 crore 4. Total CLA /Grant released upto March 2010 : `41729.3726 crore 5. Number of projects completed under AIBP : 124 6 Target Irrigation potential of AIBP Projects : 11929.2611 Th. Hectare 7. Irrigation potential created upto 2007-08 : 4947.863 Th Hectare 8. Irrigation potential created during 2008-09 : 538.0498 Th Hectare 9. Cumulative AIBP : Irrigation potential created 112 through 5485.9128 Th Hectare CHAPTER XII MEMBER OF PARLIAMENT LOCAL AREA DEVELOPMENTSCHEME (MPLADS) Background 12.1 The MPLAD Scheme was launched on 23rd December, 1993, to provide a mechanism for Members of Parliament to recommend works of developmental nature for creation of durable community assets and for provision of basic facilities including community infrastructure, based on locally felt needs. Thus, addressing locally felt developmental and infrastructural needs and bridging the gap for developmental works is envisaged under the Scheme. 12.2 The Scheme is governed by a set of Guidelines, which were issued by the Ministry of Rural Development in February, 1994. After the Scheme was transferred to the Ministry of Statistics and Programme Implementation, revised Guidelines were issued in December, 1994. The Guidelines were further revised in February, 1997, September, 1999, April, 2002 and November, 2005. The revision of Guidelines takes into account the suggestions made by Hon’ble Members of Parliament, Rajya Sabha and Lok Sabha Committees, observations of the Comptroller and Auditor General of India, Programme Evaluation Organization of the Planning Commission and operational experience over the years. Salient features 12.3 The salient features of the MPLAD Scheme are as follows:- MPLADS is a Plan scheme under which funds are released in the form of Grant in-aid, as Special Central Assistance to States. Works which are developmental in nature, based on locally felt needs and always available for public use at large, are eligible under the scheme. The Members of Parliament have a recommendatory role under the Scheme. The MPs recommend the works based on locally felt needs to the concerned District Authoritieswho get the works implemented by following the established procedure of the concerned State Government. Examining the eligibility, sanctioning, funding, selection of implementing agencies, prioritization and overall execution and monitoring of the scheme at the ground level, is done by the district authorities. The Lok Sabha Members can recommend works in their respective constituencies. The elected members of the Rajya Sabha can recommend works anywhere in the State from which they are elected. Nominated Members of the Lok Sabha and Rajya Sabha may select works for implementation anywhere in the country. 113 The funds released under the scheme are non-lapsable i.e. the liability of funds not released in a particular year is carried forward for making releases in the subsequent years subject to eligibility. The annual entitlement per MP is ` 2 crore. Important items of work like drinking water, education, public health, and funds for development of SC/ST are given priority. There is no limit for a work to be executed by Government Agencies. There is a ceiling of `25 lakh for the works to any Trust/Society. Also to encourage Trusts/Societies to work for the betterment of the tribal people, the ceiling of `25 lakh has been increased to 37.5o lakh where the additional amount of `12.50 Lakh should be used for the creation of public utility building assets primarily for the benefit of tribal people exclusively in the notified tribal CD blocks with more than 50% tribal population. MPLADS emphasizes work relating to provision of drinking water in the notified drought affected districts, such as hand pumps for drinking water, storage tanks, reservoirs, community rain water harvesting, etc. The maximum limit for rehabilitation work in areas affected by severe calamities is now ` 50 lakh. In order to give special attention to development of areas inhabited by Scheduled Castes and Scheduled Tribes, 15% of MPLADS funds would be utilized for areas inhabited by SC population and 7.5% for areas inhabited by ST population and if there is no tribal population in the constituency of the Lok Sabha members of Parliament , they can recommend works within their state of election upto 7.5% of their annual entitlement in the notified CD blocks with more than 50% tribal population . The role of Panchayati Raj Institutions and Urban Local Bodies as Implementing Agencies is stressed. Release of `1 crore in respect of MPs at the time of constitution of Lok Sabha and election to the Rajya Sabha is done automatically without waiting for any document from district authorities. To bring in more financial accountability, Utilization Certificate for the previous financial year and the Audit certificate for the funds released in the year prior to the previous year are also pre-requisites for the release of the second instalment. Release of first instalment is made on the basis of the release of second instalment of previous year being made. Funds received by the Government of India are deposited by the District Administrations in nationalized banks. The normal financial and audit procedures prevalent in the states in which the works are executed apply with regard to the implementation of the works. 114 The roles of Central Government, State Government, District Authorities and Implementing Agencies have been clearly demarcated for implementation of MPLAD Scheme. The MPLADS Parliamentary Committee of the Lok Sabha and Rajya Sabha make suggestions and recommendations to the Ministry of Statistics and Programme Implementation on representations received from MPs and issues raised by the MPs from time to time. The role of the Central Government inter-alia is to monitor overall position of fund release, receipt of completion reports etc. and to bring out the annual report on the implementation of MPLADS. The role of the State/UT Government inter-alia is to coordinate with the Ministry as well as from district authorities for effective implementation of the Scheme. The role of the District Authority inter-alia is to inspect and monitor the works regularly. The implementing agencies are to furnish physical and financial progress of each work to the District Authorities every month and also furnish completion report certificates. Impact 12.4 Since its inception, the Scheme has benefited the local community by meeting various developmental needs such as drinking water facility, education, electricity, health and family welfare, irrigation, non-conventional energy, community centres, public libraries, bus stands/stops, roads, pathways and bridges, sports, etc. These works are sanctioned, executed and monitored as per the provisions of the MPLADS Guidelines. Scheme Performance 12.5 Physical Performance (As on 31.12.2010) As compiled from reports received from the Districts, since inception of the scheme :• 1368115 works have been recommended • 1212243 works have been sanctioned. • 1109086 works have been completed. • The percentage work completed to sanctioned is 91.49 • In the current financial year, 77800 works have been recommended, 31567 works have been sanctioned and 57445 works have been completed. 115 12.6 Financial Performance (As on 31.12.2010) • • • • Rs 22098.25 crore have been released since the scheme inception. Expenditure of ` 20058.21 crore incurred since inception of the Scheme. The percentage of expenditure over release is 90.77 ` 1141.00 crore has been released in 2010-11 (upto 31.12.2010) and an expenditure of Rs 952.96 crore has been incurred during this period. The year-wise funds released so far under the scheme is furnished below:Table 12.1 Year 1993-1994 1994-1995 1995-1996 1996-1997 1997-1998 1998-1999 1999-2000 2000-2001 2001-2002 2002-2003 2003-2004 2004-2005 2005-2006 2006-2007 2007-2008 2008-2009 2009-2010 2010-11 (As on 31.12.2010) Total Funds Released (` in Crore) Cumulative Release 37.80 771.00 763.00 778.00 488.00 789.50 1390.50 2080.00 1800.00 1600.00 1682.00 1310.00 1433.90 1451.50 1470.55 1580.00 1531.5 1141.00 37.80 808.80 1571.80 2349.80 2837.80 3627.30 5017.80 7097.80 8897.80 10497.80 12179.80 13489.80 14923.70 16375.20 17845.75 19425.75 20957.25 22098.25 22098.25 180040.00 Achievements Scheme performance: 12.7 A quantum jump in utilization of funds, reduction in unspent balance and faster completion of pending works, especially since the start of year 2004-05, has been made under the scheme. 116 The improvements have been achieved on account of • • • • Pro-active policy initiatives aimed towards ensuring greater financial discipline and proper utilization of funds Focused monitoring of implementation of the scheme A series of review meetings held in the states, by Hon’ble Minister and senior officers The comparative position at different time periods is given as under:i) During 2009 -2010: a) Funds released during the period: ` 1531.5 crore was released and as compiled by the reports received from the districts, an expenditure of ` 1073.59 crore was incurred, i.e. the percentage utilization over release forthis period works out to 70.10. b) Utilization of funds: The Percentage utilization over release was 70.10% during the period which is low corresponding to previous years due to the release of 1st instalment of the year 2009-10 to all 15th Lok Sabha MPs after the constitution of the Lok Sabha and also due to low expenditure as there was code of conduct upto May, 2009 and lesser works were recommended during the earlier part of the year. c) Completion of works: 42582 works were sanctioned and 49690 works were completed during this period. ii) Overall Performance (April 2004 to December, 2010): (a) Improved utilization of the funds: There has been a remarkable improvement in the utilization of funds, during the period, as highlightedby the increase of 8.59% in the percentage utilization over release, which is90.77% as on 31.12.2010 as compared to 82.18% as on 31.3.2004. While`9918.45 crore was released during the period, an expenditure of` 10048.83 crore was incurred which reflects a percentage utilization over release of 101.30 for the period. (b) Completion of works: 497955 works have been completed during the period whereas 449689 works had been sanctioned, i.e. the percentage of works completed to sanctioned during the period is of the order of 110.73%. The percentage of works completed to sanctioned has increased to 91.49 as on 31.12.2010 from 80.14 as on 31.3.2004 (increase of 11.35%). 117 iii) During April 2010 to December, 2010:Funds released: `1141.00 crore has been released during this period and ` 657.22 crore is the expenditure incurred. 18479 works have been completed, whereas 19834 works have been sanctioned during this period. MPLADS works monitoring software 12.8 To bring in greater transparency and accountability at the ground level and to promote e-governance, a software for monitoring MPLADS works was launched in November 2004. The software enables online monitoring of details of works. The software is being used by all District Authorities to upload the information on the website from recommendation stage onwards of each work recommended by Hon’ble MPs. Tsunami Rehabilitation 12.9 In order to help rehabilitation works in the Tsunami affected areas, the Government had relaxed the provisions of the Guidelines on MPLADS to enable the MPs to recommend any amount out of their entitlement. In response to the appeals issued to MPs, 207 Lok Sabha MPs and 167 Rajya Sabha MPs had given their consent for ` 2273.5 lakh and ` 3136 lakh respectively. 57 works to the tune of ` 2189.30 lakh consented by Lok Sabha MPs and 130 works to the tune of ` 3134.30 lakh consented by MPs of the Rajya Sabha were authorized in the Tsunami affected areas of Andhra Pradesh, Kerala, Tamil Nadu, Pondichery and A&N Islands. As per the latest report received 52 Lok Sabha works and 124 Rajya Sabha works have been completed. One authorized work each of Lok Sabha and Rajya Sabha has been dropped. Bihar Flood Rehabilitation 12.10 In view of the extensive damage caused by the unprecedented and devastating floods in Bihar, the Ministry of Home Affairs (Disaster Management-I Division) declared the natural calamity in the state of Bihar as a “Calamity of severe nature”. Hon’ble Chairman, Rajya Sabha, Hon’ble Speaker, Lok Sabha and Hon’ble MOS(IC), S&PI appealed to the MPs to contribute `10 lakh each from their MPLADS funds for reconstruction projects as permissible under MPLADS Guidelines. In response to the aforesaid appeals, 155 Lok Sabha MPs have contributed `22.05 crore and 173 Rajya Sabha MPs have contributed `22.81 crore towards Bihar Flood Relief works so far. The Ministry, in consultation with the MPLADS Committees of Parliament authorized construction of 44 Disaster-cum-Community Shelters costing ` 46.285 lakh per unit and 38 Cattle Shelter costing 12 lakh per unit out of the MPLADS funds. Cyclone ‘AILA’ 12.11 Cyclone‘AILA’ hit the State of West Bengal on 25th May, 2009. Ministry of Home Affairs declared it as a ‘Calamity of Severe Nature’. Pursuant to an appeal by MOS(I/C), Statistics &PI, 12 MPs from Rajya Sabha and 8 MPs from Lok Sabha have consented to 118 contribute `350 lakhs and `165 lakhs, respectively for rehabilitation of affected areas. The Ministry has distributed the consented amount for rehabilitation works as recommended by the Government of West Bengal and directed the nodal district authorities of the MPs to transfer fund to the district where the rehabilitation works are to be executed. Rehabilitation works in Cloudburst affected areas of Leh (Jammu & Kashmir) 12.12 The Members of Parliament have been requested to consent amount from their MPLADS fund for reconstruction works in Leh district of Jammu & Kashmir where massive destruction occurred due to flood which was triggered by cloudburst on 6th August, 2010. Till date, 17 Lok Sabha and 25 Rajya Sabha MPs have respectively consented ` 285 lakh and `380 lakh for rehabilitation works. The works are being finalised in consultation with State Government and district administration. Revision of MPLADS Guidelines: 12.13 An exerciseto see whether any revision of the MPLADS Guidelines is necessary has been initiated. In this regard,a Consultationwith State Govts/UTs on revision of MPLADS Guidelines, proposed shelf of projects and convergence with other Central Schemes was held alongwith various Central Ministries on 20.12.2010. Monitoring 12.14 MPLADS performance has improved due to intensive reviews and visits taken by Hon’ble Minister and senior officers. 12.15 Meetings with the Secretaries of State Nodal Departments, to clarify policy initiatives, monitoring of release of funds and taking stock of the implementation of the scheme in the States/UTs, have been held 11 times (twice each in 2005-06, 2006-07, 2007-08, 2008-09,200910 and once in 2010-2011). 12.16 Financial and technical assistance is being provided to States/UTs to conduct training programmes for district officials to facilitate better implementation of the scheme. The statelevel reviews/ trainings on Guidelines for district authorities were undertaken in the States/UTs of Himachal Pradhesh, Uttar Pradhesh, Manipur, Maharashtra, Delhi, Karnataka, Goa, West Bengal, Andhra Pradhesh, Puducherry and Nagaland during the year 2010. Physical Monitoring of MPLADS works 12.17 An effective mechanism of monitoring of implementation of MPLADS is most essential, for efficacious implementation of the Scheme. Ministry has, therefore, envisaged direct physical monitoring of MPLADS works on sample basis in selected districts, through an independent agency viz. NABARD Consultancy Services (NABCONS) launched from 2007-08. This initiative was envisaged as an important instrument for monitoring and a source of feedback on the status of implementation at the ground level so that corrective action may be taken. So far, 133 districts of the country have been covered in first three phases such as 30 districts in 2007- 119 08, 43 districts in 2008-09 and 60 districts in 2009-10. The concerned District authorities have been asked to take corrective measures on the basis of the report. In fourth phase during 201011, monitoring of 75 districts have been taken. In their overall assessment of the implementation of MPLAD Scheme ,the NABARD Consultancy Services has reported that :• At the macro level, the achievements of the Scheme appear incomparable with other schemes mainly due to concentration on the decentralized approach and secondly the nature of the small works of very important nature required for the lifeline of community at large. • Most of the sample works were found to have positive impact on the socio-economic well being of the user communities. The community was very happy and perceives MPLADS works in a positive manner while using roads, schools, public toilet facilities & other works • Most of the works were executed through tendering process and regular visit by Subengineer helped in timely completion of works. • The estimates for the sample works were prepared by Implementing Agency to avoid any cost overrun and the works were executed as per technical estimates. • Participatory planning through decentralization, currently in vogue in the state, had right blend with MPLADS. • Visibility of PRIs like, Gram Panchayat has increased considerably in implementation process of MPLADS works. • As an implementing agency and user agency, PRIs have acquired skills of implementation. The role of these PRIs has also considerably improved. • Sector-wise distribution of works was largely as per the requirements of each sector, covering all the major sectors. All works selected under eligible categories of sectors are as per scheme guidelines. • Public Works Department had adopted standard technical design for additional class rooms for schools/colleges and construction of community centres with standardised unit costs. This enabled allocation of MPLADS funds to the actual extent of cost required. Most of the assets created under the scheme were properly used by the targeted end users. • 120 CHAPTER XIII HINDI PROMOTION 13.1 In pursuance of the Annual Programme issued by the Deptt. of Official Language, the Ministry of Statistics & Programme Implementation has been making continuous and concerted efforts for propagation and development of Hindi as official language in the Ministry and in its attached & subrodinate offices, keeping in view the OL policy of the Union. Hindi Section of the Ministry is responsible for monitoring and overseeing the implementation of various statutory provisions and policies as laid down in the Official Languages Act, 1963 and the Official Language Rules, 1976. As on 31.12.2010, out of 522 officers/ employees, 516 were either proficient in Hindi or having working knowledge of Hindi and out of 55 stenographers and 10 LDCs, 45 stenographers and 06 LDCs have been trained in Hindi stenography and Hindi typing respectively. Official Language Implementation Committee 13.2 An Official Language Implementation Committee under the Chairmanship of the DG & CEO, NSSO, undertakes quarterly review of the progress made in the use of Hindi as well as in the compliance of provisions of the OL Act, 1963 & OL Rules, 1976 in the Ministry and in its attached/subordinate offices. A view of meeting of the Official Language Implementation 121 Committee of the Ministry 13.3 The officers of the Ministry conduct inspections of the attached/subordinate offices as well as sections of the Ministry to observe the position of the progressive use of Hindi and give necessary instructions on the lapses found therein. Awards and Incentives 13.4 The incentive scheme for original noting/drafting in Hindi continued during the year. Two employees were given cash awards of ` 1000/- each (first prize) and three employees were given cash awards of ` 600/- each (second prize) for the year 2009-2010. Hindi Month/Pakhwara is observed in the Ministry and also in its attached/subordinate offices during the month of September. In the Ministry, the period from 1.9.2010 to 30.09.2010 was observed as "Hindi Month". During the period, various competititions were organised & cash prizes were given to the winners of the competitions. A special event "Prashna Manch" was also organised in which questions related to Official Language Policy and activities of the Ministry were asked. An extempore speech competition was also organised, in which different topics were given to the different participants. This competition was held separately for Hindi and Non-Hindi participants. For encouraging the use of Hindi in the official work, “Rajbhasha Chal Vaijayanti” is awarded to the Section/Division/Unit for doing maximum work in Hindi Rajbhasha Chal Vaijayanti’ is being presented to the Section Officer of Admn.IV Section by the Chairman of Official Language Implementation Committee of the Ministry 122 on quarterly basis and certificates are awarded to the officers/employees who have play important role for winning “Rajbhasha Chal Vaijayanti”. For promoting the implementation of the Official Language Policy in the attached and subordinate offices of the Ministry, a Kshetriya Rajbhasha Shield is awarded on yearly basis to the office doing maximum work in Hindi and the offices standing IInd and IIIrd, are given certificates as encouragement. Survey Design & Research Division, Kolkata was awarded Kshetriya Rajbhasha Shield for the year 2009-10. Computer Centre, New Delhi andField Operation Division, New Delhi were awarded certificates. Kshetriya Rajbhasha Shield is being presented by the Chairman of Official Language Implementation Committee of the Ministry to the SDRD in its meeting Meeting of Hindi Salahkar Samiti 13.5 The fourth meeting of Hindi Salahkar Samiti consisting of 15 non official members and 16 official members under the chairmanship of Hon’ble Minister of State (IC), S&PI was held on 07th September, 2010 to review the progress made in the use of Hindi as official language in the Ministry. A view of meeting of the Hindi Salahkar Samiti of the Ministry being chaired by MOS (IC) Hindi Training and Workshops 123 13.6 During 2010-11, 2 officers/employees were sponsored for training in Hindi stenography under the Hindi Teaching Scheme of the Department of Official Language. Four workshops were organised for the officers and staff of the Ministry having working knowledge or proficiency in Hindi to remove their problems and removing hesitation in using Hindi in their day-to-day official work. Publication of House Journal “Pridrashya” 13.7 4th issue of the House Journal “Pridrashya” has been released by giving a new look with a perfect professional attitude, during the year. The editing of the 5th issue of the House Journal “Pridrashya” has since been completed and will be sent to press for printing soon. 124 CHAPTER XIV OTHER ACTIVITIES Departmental Council 14.1 JCM Scheme provides Departmental Council /Office Council as a forum for redressal of the grievances of the employees belonging to Group ‘C’ and Group ‘D’ posts. Due to up gradation of various posts from Group ‘C’ to Group ‘D’ vide DOPT order dated 9.4.2009, there is need to reconstitute the departmental council for conducting meeting. Accordingly, reconstitution of Departmental council is under process and next meeting of Departmental Council will be held after completion of this process. Internal Work Study Unit 14.2 During 2010-2011 the Internal Work Study Unit of the Ministry continued to provide its services in the areas of Organization and methods . Regular exercises to review records and weed out old records in the Ministry and its attached / subordinate offices were carried out. Internal Work Study Unit also performed coordination and liaison work with Staff Inspection Unit in connection with the work measurement study of various attached / subordinate offices of the Ministry. Vigilance Cell 14.3 Due importance has been given in preventive vigilance in the Ministry. Instructions were issued for review of the Annual Property returns filled by Gr. ‘A’ and ‘B’ Gazetted officers by the respective Administrative Wing. The prescribed monthly returns on Disciplinary cases and quarterly returns on complaints received through Prime Minister’s office regarding allegation of corruption are regularly being sent to Deptt. Of Personnal and Training and Prime Minister’s Office respectively.Annual Vigilance Inspection of Attached / Subordinate / Regional Offices is being carried out regularly. During 2010-11 three offices have been inspected. A Vigilance Awareness week was also observed in the Ministry and its attached / subordinate offices from 25.10.2010 to 1.11.2010. 010 the Internal Work Study Unit of the Ministry continued to provide its services in the areas of Organization and methods. Regular exercises to review records and weed out old records in the Ministry and its attached/subordinate offices were carried out. Internal Work Study Unit also performed coordination and liaison work with Staff Inspection Unit in connection with the work measurement study of various attached/subordinate offices of the Ministry. In pursuance of Department of Personnel & Training’s OM Number 2/8/2001-PIC, dated 16.5.2001 regarding optimization of direct recruitment to civilian posts, Ministry of Statistics & PI carried out an exercise to review the direct recruitment vacancies in Gr. A, B, C and D categories for the recruitment year 2008-09 and cleared 41 direct recruitment posts in Gr. B, C and D categories and DOPT gave its consent for filling up of 12 Gr. ‘A’ direct recruitment posts. The Screening Committee also recommended abolition of 106 direct recruitment posts in all categories. 125 Redressal of Public Grievances 14.4 This Ministry and its Attached/Subordinate offices have negligible public interface .Nevertheless, a gtrievance redressal machinery is functioning in this ministry under Deputy Secretary (Staff/Public Grievance) as per the guidelines of the Deptt. of Administrative Reforms and Public Grievance. The grievances are received either directly in the Ministry or through Deptt. of AR & PG and Deptt. of Pension & Pensioner’s Welfare, who has also developed a system of filling online grievances. The PG Portal of Deptt. of Administrative Reforms & Public Grievances is regularly monitored by the officers of PIGR. Section for redressal of grievances. During the year 2010, 07(Seven) grievances have been received directly and through D/D/AR&PG. Out of 07 grievances, two grievances have been sent to the concerned section/office and settled. The grievances received so far are sent by serving or retired employees of this ministry pertaining to their pay/pension etc. Remaining five grievances are being followed up. Besides, this Section is also dealing with monthly return of Court cases concerning the entire ministry. The number of court cases pending in various court during the calendar year 2010 is given below:Court matters Statistics 14.5 The number of court cases pending in various court during the calendar year 2010 is as under:First of month ,2010 No. of Court Cases Jan. Feb. March April May June July Aug. Sept. Oct. Nov. Dec. 145 140 147 143 138 132 130 119 118 117 116 112 Information and Facilitation Counter 14.6 The Ministry has an Information and Facilitation Counter (IFC).situated at Main Gate. The information pertaining to the functions of the Ministry is available at the counter, in addition to this, the Statistical data for use by the Research Scholar, Economists, Financial Institutions, Educational Institutions, Universities, etc. Citizen’s Charter of this Ministry is also on display and available at the counter. A well –informed person has been placed at IFC for disposing the queries. General Administration 14.7 The Ministry is responsible for proper maintenance of Sardar Patel Bhawan through regular liaison with CPWD.Besides this Ministry, the Department of Administrative Reforms and Public Grievances,National Security Council Secretariat,Ministry of Panchayati Raj and Public Grievances Wing of Cabinet Secretariat are also accommodated in this building. An interdepartmental Co-ordination Committee looks into the needs of each of department for proper 126 upkeep of the building. Regular liaison is also maintained with CISF on security matters of the building. Offices of this Ministry are also located in Jeevan Prakash Building and R.K. Puram. During 2009-10, an exercise has been carried out for ( a) Renovation of basement of Sardar Patel Bhawan to provide Conference Room, Library, Record Room and space for PG &RTI Cell ( b) Renovation of a few rooms on the 2nd floor ( for officials of TPP/IMPD divisions) and ground floor (for ATM facility/recreation room) at Sardar Patel Bhawan. RTI matters: 14.8 All RTI applications/appeals are normally received in PIGR Section and then forwarded to concerned CPIOs for their disposal. Ministry has designated DG&CEO (NSSO) as the Appellate Authority and one RTI Nodal officer of Director level under the RTI act. The Ministry has also designated 17 officers of Director level and above as Central Public Information Officers (CPIOs) and 25 Asstt. CPIOs. 14.9 No. of Requests & Appeal received in year -2010 under RTI Sl. No. 1 2. 3 4 5 6 7 8 9 10 11 12 Name of Month January, 10 February, 10 March, 10 April,10 May, 10 June, 10 July, 10 August, 10 September, 10 October, 10 November, 10 December, 10 Total No. of Request Received 67 55 76 47 55 52 38 57 48 50 39 48 632 No. of Appeal Received 3 3 5 3 8 2 10 4 10 1 2 7 58 Persons with Disabilities: 14.10 This Ministry and its Attached/Subordinate office have 4971 employees in position as on 01.01.2010. Break up of Persons with Disabilities amongst these employees is as under:Group A B C D Total No. of total employees in the Ministry/ Attached/ Subordinate Offices 331 2786 1569 285 4971 127 No. of Persons with Disabilities 03 02 14 19 *ISI is not included 14.11 The Ministry has implemented instructions/orders issued by Govt. of India from time to time for the welfare of Persons with Disabilities. Following facilities have been provided by the Ministry for the benefit of PWDs: a) b) c) d) A special toilet has been constructed on the Ground Floor of S.P. Bhavan; Two wheel chairs have been provided in the building; A separate space for parking of vehicles of PWDs has been provided. Ramp has been provided in the porch of the building Apart from this, all Appointing Authorities have been directed to launch a Special Recruitment Drive to fill up the backlog vacancy of PWD, as per the directions of DOPT International Coordination & Training 14.12 International Coordination and Training Section maintains liaison with international agencies such as the United Nations Economic & Social commission for Asia and the Pacific (UNESCAP), the International Monetary Fund (IMF)/ World Bank, the Asian Development Bank (ADB), the Food and Agricultural Organization (FAO), Statistical Institute for Asia and the Pacific (SIAP) and the International Labour Office (ILO) in different statistical matters which cover interchange of statistical intelligence, participation in international conferences, seminars, workshops and trainings for the development of statistical system capabilities and serving as clearing house for statistical matters. India is also ex-officio member of International Statistical Organization, Voorburg, Netherlands. 128 129 130 131 132 133 134 135 136 Annex-II Allocation of Business to the Ministry of Statistics and Programme Implementation I STATISTICS WING 1. Act as the nodal agency for planning integrated development of the statistical system in the country. 2. Coordination of statistical work with a view to identifying gaps in data availability or duplication of statistical work in respect of Departments of the Government of India and the State Statistical Bureaux (SSBs) and to suggest necessary remedial measures. 3. Laying down and maintenance of norms and standards in the field of statistics, evolving concepts, definitions and methodology of data collection, processing of data and dissemination of results. 4. Advising the Departments of the Government of India on statistical methodology and on statistical analysis of data. 5. Preparation of National Accounts as well as publication of annual estimates of national income, gross/net domestic product, Government and private final consumption expenditure, capital formation, savings, capital stock and consumption fixed capital, quarterly estimates of Gross Domestic Product, preparation of National Input-Output Transactions Table, State level estimates of domestic product and fixed capital formation of supra-regional sectors, preparation of comparable estimates of State Domestic Product (SDP) at current prices. 6. Compilation and release of the Index of Industrial Production (IIP) every month in the form of Quick Estimates, conducting Annual Survey of Industries (ASI) and providing statistical information, to assess and evaluate the changes in the growth, composition and structure of the organised manufacturing (factories) sector. 7. Development of Environment Statistics, development of methodology, concepts and preparation of National Resource Accounts for India. 8. Organisation and conduct of periodic all India economic census and follow-up sample surveys. 9. Conducting nation-wide sample surveys on various socio-economic aspects, such as, employment, consumer expenditure, housing conditions, debt and investment, land and livestock holdings, literacy, education, health, family welfare, unorganised manufacturing and services etc, to provide the database needed for development, research, policy formulation and economic planning. 10. Conducting quality checks and auditing of statistical surveys and data sets through technical scrutiny and sample checks and generate correction factors and alternative estimates, if required. 11. Undertaking the processing of survey data collected through various socioeconomic surveys and follow up surveys of Economic Census and Annual Survey 137 of Industries by the National Sample Survey Organisation and the Central Statistical Organisation. II 12. Dissemination of statistical information through a number of regular or adhoc publications to Government, semi-Government or private data users/agencies, and dissemination of data, on request, to United Nations Agencies like United Nations Statistics Division, Economic and Social Commission for Asia and the Pacific, International Labour Organisation and other relevant international agencies. 13. Giving grants-in-aid to registered non-governmental organizations and research institutions of repute for undertaking special studies or surveys, printing of statistical reports and finance seminars, workshops or conferences relating to different subject areas of official statistics. 14. Functioning as the Cadre Controlling Authority and dealing with all aspects of managing the Indian Statistical Service including all matters pertaining to training, career planning and manpower planning. 15. The Indian Statistical Institute and ensuring its functioning in accordance with the provisions of the Indian Statistical Institute Act, 1959 (57 of 1959). 16. Compilation and release of monthly Consumer Price Index Numbers for Urban Non-Manual Employees. 17. Undertaking methodological studies and pilot surveys for evolving better sampling techniques and estimation procedures including small area estimates. PROGRAMME IMPLEMENTATION WING 18. Monitoring of 20 - point programme. 19. Monitoring of projects of `150 crores and above. 20. Monitoring of the performance of Infrastructure Sectors. 21. Member of Parliament Local Area Development Scheme (MPLADS). 22. Coordination and policy issues relating to National Common Minimum Programme excluding sectoral policies allocated to other Ministries/Departments. **** 138 Annexure-III Statement of Budget Estimate (SBE) -2010-11 Ministry/Department :Ministry of Statistics and Programme Implementation Sl.No Scheme Annual Plan 2010-11(BE) (` Crore) Outlay Earmraked Total for North East 201011 BE GBS IEBR 3 4 5 00.00 00.00 00.00 68.00 2.10 28.00 7.01 00 2.80 00.00 4.90 0.49 00.00 00.00 50.00 1580.00 5.00 78* 1733.00 00.00 1733.00 93.30 India Statistical Strengthening 100.00 Project (ISSP) Basic Statistics for Local Level 15.00 Development (BSLLD) 115.00 Total(B) Grand Total (A+B) 1798.00 00.00 100.00 10.00 00.00 15.00 1.50 00.00 115.00 1798.00 11.50 104.80 1 2 (A) Central Sector Schemes(CS) 1 2 3 4 5 6 Capacity Development 68.00 Strengthening of Computer Centre 2.10 Grants-in-Aid to Indian Statistical 28.00 Institute, Kolkata Strengthening Monitoring and 4.90 Evaluation for Projects and Programmes Economic Census 50.00 Member of Parliament Local Area 1580.00 Development Scheme (MPLADS) Total (A) (B)Centrally Sponsored Schemes(CSS) *There are 39 MPs (LS+RS) in NE States 139 6 Annexure-IV Performance of Monthly Monitored Items under Twenty Point Programme – 2006 during the period April, 2009 to March, 2010 \Sl. No. Item Name ALL INDIA PERFORMANCE Units Targets April,2009March,2010 Achievements April,2009March,2010 Percent Achievements w.r.t. the Target mployment generated under MGNREGS 1 2 No. of Job cards issued Employment generated 000 Nos. 000 Mandays Lakh ` 3 Wages given 4 Swaranjayanti Gram Swarozgar Yojana No. of Individual Swarozgaries Number Assisted - SGSY* 5 6 7 8 9 10 11 12 13 14 15 16 Self help Groups No. of SHGs formed No. of SHGs to whom income generating activities provided under SGSY* @ 18561 - @ 2997827 - @ 2705199 - 269600 Number 516117 @ Number 155285 Distribution of waste land to landless Land distributed Hectare @ Minimum Wages Enforcement (including Farm Labour) No. of Inspections made Number @ No. of Irregularities detected Number @ No. of Irregularities rectified Number @ No. of Claims filed Number @ No. of Claims settled Number @ No. of Prosecution cases Number @ pending No. of Prosecution cases filed Number @ No. of Prosecution cases decided Number @ Food Security : (i) TPDS (ii) AAY Food Security:Targeted Public Tonnes 47602697 Ditribution System (TPDS)* 140 625322 232 - 177843 115 38781 - 95313 19580 18292 2484 2719 11315 - 15 65 - 42402685 - 89 17 Food Security:Antyodaya Anna Yojana(AAY)* Tonnes 10195578 9794358 96 18 Food Security:Targeted Public Ditribution System (Only BPL)* Tonnes 17413031 16545424 95 3276248 81 184347 115 508 87 90586 57 19 20 21 22 23 Rural Housing - Indira Awaas Yojana (IAY) Houses constructed - IAY* Number 4052242 EWS/LIG Houses in Urban Areas Houses constructed - EWS/LIG* Number 159707 Rural Areas - Accelerated Rural Water Supply Programme (ARWSP) Habitations covered (NC and Number 586 PC) - ARWSP* Slipped back habitations and habitations with water quality problems addressed-ARWSP* Number 158003 Sanitation Programme in Rural Areas No. of Individual household 000 Nos. latrines constructed 12519 @ - Institutional Delivery 24 No. of deliveries in Institutions 000 Nos. 13785 @ SC Families Assisted 25 SC Families Assisted* Number 4774200 5225297 109 Universalisation of ICDS Scheme 26 ICDS Blocks Operational Number 7073 6581 93 (Cum.)* Functional Anganwadis 27 Anganwadis Functional (Cum.)* Number 1356027 1147257 85 No. of Urban poor families assisted under seven point charter viz. land tenure, housing at affordable cost, water, sanitation, health, education and social security 28 Urban Poor Families Assisted under Seven Point Charter* Number 233711 149167 64 Afforestation: (i) Area covered under Plantation (Public & Forest Lands) (ii) Seedlings planted (Public & Forest Lands) 29 Area Covered under Plantation (Public and Forest Lands)* 30 Seedlings Planted Forest Lands)* 31 000 Hectares 1813 1547 85 (Public and Lakh Number 11785 10613 90 Rural Roads- PMGSY Length of Road Constructed* Kilometer 55000 Rajiv Gandhi Grameen Vidyutikaran Yojana (RGGVY) 60172 109 141 32 33 34 No. of Villages Electrified* Energized Pump sets No. of Pumps sets energized* Supply of Electricity Electricity supplied* Number 17500 16701 95 Number 2,10,594 352247 167 Million Units 815659 732372 90 142 Annexure-V Performance of Monthly Monitored Items under Twenty Point Programme – 2006 during the period April, 2010 to September, 2010 ALL INDIA PERFORMANCE Sl. No. Item Name (1) (2) Units Targets April,2010September,2010 (3) (4) April,2010September,2010 Percent Achievements w.r.t. the Target (5) (6) Achievements Employment generated under MGNREGS 1 2 No. of Job cards issued Employment generated 000 Nos. 000 Mandays Lakh ` 3 Wages given 4 Swaranjayanti Gram Swarozgar Yojana No. of Individual Swarozgaries Number Assisted - SGSY* 5 6 7 8 9 10 11 12 13 14 15 16 Self help Groups No. of SHGs formed No. of SHGs to whom income generating activities provided under SGSY* @ 6213 - @ 1396289 - @ 1369318 - 112734 Number 140320 @ Number 64947 Distribution of waste land to landless Land distributed Hectare @ Minimum Wages Enforcement (including Farm Labour) No. of Inspections made Number @ No. of Irregularities detected Number @ No. of Irregularities rectified Number @ No. of Claims filed Number @ No. of Claims settled Number @ No. of Prosecution cases Number @ pending No. of Prosecution cases filed Number @ No. of Prosecution cases decided Number @ Food Security : (i) TPDS (ii) AAY 23503679 Food Security:Targeted Public Tonnes Ditribution System (TPDS)* 143 147578 131 - 63460 98 38985 - 77470 9183 9328 3469 1387 6284 - 183 25 - 21879280 - 93 17 Food Security:Antyodaya Anna Yojana(AAY)* Tonnes 5110469 4971437 97 18 Food Security:Targeted Public Ditribution System (Only BPL)* Tonnes 8728495 8727982 100 886969 105 66416 83 7 6 22744 62 19 20 21 22 23 Rural Housing - Indira Awaas Yojana (IAY) 842622 Houses constructed - IAY Number EWS/LIG Houses in Urban Areas 79834 Houses constructed - EWS/LIG Number Rural Areas - Accelerated Rural Water Supply Programme (ARWSP) 114 Habitations covered (NC and Number PC) - ARWSP* Slipped back habitations and habitations with water quality problems addressed-ARWSP* Number 36431 Sanitation Programme in Rural Areas No. of Individual household 000 Nos. latrines constructed 4576 @ - Institutional Delivery 24 No. of deliveries in Institutions 000 Nos. 7376 @ SC Families Assisted 2387042 2162746 91 25 SC Families Assisted* Number Universalisation of ICDS Scheme 6815 6657 98 26 ICDS Blocks Operational Number (Cum.)* Functional Anganwadis 1356027 1186106 87 27 Anganwadis Functional (Cum.)* Number No. of Urban poor families assisted under seven point charter viz. land tenure, housing at affordable cost, water, sanitation, health, education and social security 28 Urban Poor Families Assisted under Seven Point Charter* Number 116843 200242 171 Afforestation: (i) Area covered under Plantation (Public & Forest Lands) (ii) Seedlings planted (Public & Forest Lands) 29 Area Covered under Plantation (Public and Forest Lands)* 30 Seedlings Planted Forest Lands)* 31 000 Hectares 866 1166 135 (Public and Lakh Number 5429 8843 163 8609 21193 246 Rural Roads- PMGSY Length of Road Constructed* Kilometer Rajiv Gandhi Grameen Vidyutikaran Yojana (RGGVY) 144 32 33 34 No. of Villages Electrified* Energized Pump sets No. of Pumps sets energized* Supply of Electricity Electricity supplied* Number 8722 6557 75 Number 164459 167843 102 Million Units 421144 380956 90 145 Annex-VI Infrastructure Sector performance during ( April - November 2010 ) (Figures are quick estimates and provisional) Sl. No. Sector Unit Actual April - Nov. 2010 2009-10 Target Actual * April Nov. 2009 Actual % Variation Over April AprilNov. Nov. 2010 2009 Target Actual 1 Power BU 771.55 547.16 530.41 507.03 -3.1 4.6 2 Coal MT 526.15 356.81 319.80 317.79 -10.4 0.6 3 Steel MT 65.46 NA 45.81 42.92 - 6.7 4 Cement MT 206.61 NA 137.43 132.00 - 4.1 5 Fertilizers Lakh Tonnes 162.25 115.99 109.73 109.72 -5.4 0.0 6 Petroleum i) Crude oil ii) Refinery iii) Natural Gas MT MT MCM 33.69 160.12 47573 24.89 104.37 35790 24.81 106.53 35292 22.25 105.69 29467 -0.3 2.1 -1.4 11.5 0.8 19.8 Roads - Upgradation of NH I) NHAI ii) NH(O) & BRDB # Kms Kms 2673.94 2315.19 1294 1209 1007 1292 1486 1294 -22.2 6.8 -32.2 -0.2 Railways MT 887.99 605.07 593.43 574.40 -1.9 3.3 MT 560.97 $ 399.95 365.92 362.91 -8.5 0.8 Tonnes 593234 NA 459311 390124 - 17.7 Tonnes 463289 NA 370785 294136 - 26.1 Lakh 231.76 NA 167.12 148.25 - 12.7 Lakh 492.29 NA 369.01 318.41 - 15.9 Lakh lines 138.80 NA 99.28 71.06 - 39.7 7 8 9 10 11 Shipping & ports Civil Aviation i) Export Cargo handled at major Airport ii) Import Cargo handled at major Airport iii) Passengers handled at International Terminal iv) Passengers handled at Domestic Terminal Telecommunications i) Addition in switching Capacity(Fixed+wireless) ii) Provision of net new 146 wire line connections iii) Provision of net new wireless connections Lakh Nos -10.08 NA -17.68 -8.09 - - Lakh Nos 1925.30 NA 1452.56 1142.84 - 27.1 # : Includes widening to four/six lanes and two lanes and strengthening of existing weak pavements. * : Provisional BU : Billion Units MT: Million Tonnes NA : Not Available MCM : Million cubic metre $ : Prorata Target 147 Annex - VII List of Projects Completed during 2010-11 (as on 30.11.2010) ȋ` Ȍ ȋ`Ȍ Sl. No. May,2010 Petroleum 1 SHORT TERM LOW COST MUMBAI REFINERY(BHARAT PETROLEUM CORPORATION LIMITED) - [N16000082] 390.00 01/2010 188.43 248.94 08/2009 164.48 1,635.00 05/2006 2,095.36 168.33 12/2008 175.77 463.61 12/2009 106.13 289.60 05/2010 198.16 405.82 12/2009 354.93 254.07 06/2009 1,687.78 416.50 09/2009 305.14 June,2010 Steel 2 REBUILDING OF COKE OVEN BATTRY NO.-4(STEEL AUTHORITY OF INDIA LIMITED (SAIL)) - [N12000021] Petroleum 3 CLEAN FUELS PROJECT AT VISAKH REFINERY(HPCL)(HINDUSTAN PETROLEUM CORPORATION LIMITED) - [160100281] 4 EXPANSION OF 750K GSM LINES(MAHANAGAR TELEPHONE NIGAM LIMITED) - [N26000049] DELHI EXP. OF 1250K LINES OF 2G/3G GSM LINES(MAHANAGAR TELEPHONE NIGAM LIMITED) [N26000052] Telecommunications 5 July,2010 Petroleum 6 7 BARGE BUMPER-BOAT LANDING-RISER PROTECTOR PROJECT(OIL & NATURAL GAS CORPORATION LIMITED) [N16000055] BINA KOTA PIPE LINE PROJECT(BHARAT PETROLEUM CORPORATION LIMITED) - [N16000079] September,2010 Coal 8 BARSINGSAR MINE 2.10 MTPA LIGNITE (NLC)(NEYVELI LIGNITE CORPORATION) - [060100090] Steel 9 REBUILIDING OF COKE OVEN BATTERY-10(STEEL AUTHORITY OF INDIA LIMITED (SAIL)) - [N12000016] 148 List of Projects Completed during 2010-11 (as on 30.11.2010) ȋ` Ȍ ȋ`Ȍ Sl. No. Petroleum 10 11 12 13 14 15 16 17 18 PANIPAT NAPHTA CRACKER PROJECT(INDIAN OIL CORPORATION LIMITED) - [160100292] DADRI- PANIPAT R-LNG SPUR PIPELINE(INDIAN OIL CORPORATION LIMITED) - [N16000018] LUBE OIL BASE STOCK QUALITY UPGRADATION AT MUMBAI REFINERY(HINDUSTAN PETROLEUM CORPORATION LIMITED) - [N16000026] INST. OF FCC GASOLINE DESULPHUN UNIT AT MATHURA RE(INDIAN OIL CORPORATION LIMITED) - [N16000034] MSQ UPGRADATION PROJECT AT PANIPAT REFINERY(INDIAN OIL CORPORATION LIMITED) - [N16000035] CHAINSA-JHAJJAR PIPE LINE PROJECT(GAS AUTHORITY OF INDIA LIMITED) - [N16000047] SINGLE POINT MOORING PROJECT AT VISAKHAPATNAM(HINDUSTAN PETROLEUM CORPORATION LIMITED) - [N16000067] Construction of Tank and Blending Facility at Vadi(INDIAN OIL CORPORATION LIMITED) - [N16000075] PETROLEUM BINA DESPATCH TERMINAL(BHARAT CORPORATION LIMITED) - [N16000078] 12,138.00 09/2009 12,054.37 250.66 06/2008 350.96 638.90 04/2009 796.21 348.00 12/2009 186.58 1,131.00 12/2009 750.71 967.77 09/2009 416.90 643.46 - 726.45 267.00 - 72.99 490.71 12/2009 590.52 105.22 12/1999 283.49 536.85 03/2003 1,005.50 223.00 - 586.85 352.00 03/2008 616.44 86.44 03/2009 201.79 440.93 12/2006 641.40 534.39 05/2007 716.15 372.40 07/2004 406.05 467.93 03/2005 453.64 399.75 03/2005 424.96 276.00 04/2008 360.00 310.00 04/2008 392.26 Railways 19 20 21 22 23 HOSPET-GUNTAKAL(LD),SCR(RAIL VIKAS NIGAM LTD.) [220100195] NEW JALPAIGURI-NEW BONGAIGAON (GC),NEFR(NORTH EAST FRONTIER RAILWAY) - [220100224] TAHANJAVUR-VILLUPURAM GAUGE CONVERSION (G.C)(SR)(RAIL VIKAS NIGAM LTD.) - [220100244] AJMER-PHULERA-RINGUS-REWARI (G.C.)(NWR)(RVNL)(RAIL VIKAS NIGAM LTD.) - [N22000033] ABOHAR- FAZILKA, NR, NL(NORTHERN RAILWAY) [N22000055] Road Transport & Highways 24 25 26 27 28 29 30 ALLAHABAD BYPASS (KM.158-KM.198) GQ, NH-2(NATIONAL HIGHWAYS AUTHORITY OF INDIA) - [240100203] ALLAHABAD BYPASS (KM.198-KM.242.708) GQ, NH2(NATIONAL HIGHWAYS AUTHORITY OF INDIA) - [240100204] FATEHPUR-KHAGA (GQ) KM.38-KM.115 (NH-2)(NATIONAL HIGHWAYS AUTHORITY OF INDIA) - [240101178] VARANASI-MOHANIA (GQ) KM.317-329 & KM.0-KM.65 (NH2)(NATIONAL HIGHWAYS AUTHORITY OF INDIA) - [240101181] GORHAR-BARWA ADDA (GQ) KM.320-KM.398.75 (NH2)(NATIONAL HIGHWAYS AUTHORITY OF INDIA) - [240101187] PURNEA-FORBESGANJ (BR-1) PHASE-II, KM.309 TO 268, NH57(NATIONAL HIGHWAYS AUTHORITY OF INDIA) - [240106227] PURNEA-FORBESGANJ (BR-2) PHASE-II, KM.268 TO 230, NH57(NATIONAL HIGHWAYS AUTHORITY OF INDIA) - [240106228] 149 List of Projects Completed during 2010-11 ȋ` Ȍ ȋ`Ȍ Sl. No. 31 32 33 34 35 36 37 38 39 40 41 (as on 30.11.2010) MADURAI -KANNIAKUMARI SEC. (NS-42/TN) NH-7, KM.120 TO KM.160(NATIONAL HIGHWAYS AUTHORITY OF INDIA) [240106241] DHULE-PIMPALGAON, NH-3, KM.380 TOKM. 265(NATIONAL HIGHWAYS AUTHORITY OF INDIA) - [240106257] SALEM TO KERALA BORDER SEC(TN6), KM.203.96 NH7 TO KM 53 NH47(NATIONAL HIGHWAYS AUTHORITY OF INDIA) [240106273] TRICHY BYPASS END TO TOVARAMKURCHI (NH45B)(NHAI)(NATIONAL HIGHWAYS AUTHORITY OF INDIA) [240106285] TOVARAMKURCHI-MADURAI,NH45B (NHAI)(NATIONAL HIGHWAYS AUTHORITY OF INDIA) - [N24000054] AP/KARNATKA BORDER-NANDI HILL CROSSING AND DEVANHA(NATIONAL HIGHWAYS AUTHORITY OF INDIA) [N24000060] PADALUR-TRICHY, NH-45(NATIONAL HIGHWAYS AUTHORITY OF INDIA) - [N24000083] MAHARASHTRA/AP BORDER TO ISLAM NAGAR,(NS-2/BOT/AP6),NH-7(NATIONAL HIGHWAYS AUTHORITY OF INDIA) [N24000093] ELEVATED HIGHWAY FROM SILK BOARD JUNCTION TO ELECT(NATIONAL HIGHWAYS AUTHORITY OF INDIA) [N24000105] ISLAM NAGAR TO KADTAL(NATIONAL HIGHWAYS AUTHORITY OF INDIA) - [N24000109] WAINGANGA BRIDGE -CHHATISGARHMAHARASHTRA(NATIONAL HIGHWAYS AUTHORITY OF INDIA) - [N24000120] 507.49 03/2008 342.80 556.00 03/2009 568.50 469.80 12/2008 665.80 261.00 08/2008 286.30 263.00 08/2008 317.74 402.80 03/2009 453.70 320.00 05/2009 636.10 360.42 11/2009 478.40 450.00 07/2008 876.61 546.83 03/2010 667.80 424.00 09/2010 298.40 411.32 03/2010 406.28 2,118.00 11/2004 .00 279.97 12/2004 136.24 1,174.75 03/2006 371.41 741.77 10/2007 151.37 364.52 - 51.44 409.21 12/2008 470.24 180.53 12/2009 25.97 Shipping & Ports 42 43 ACQUISITION OF TWO NOS.OF 470000 DWT MR TANKERS(SHIPPING crp. of india) - [N25000013] DEV. & OPRATION OF AN INTERNATIONAL CONTAINER TRA(PORT TRUST) - [N25000046] Telecommunications 44 45 46 47 48 49 NATIONAL RADIO SPECTRUM MANAGEMENTand MONIT. SY. I(DEPARTMENT OF TELECOMMUNICATION) - [260100051] GSM EXPANSION PH.IV (B) (BSNL) MAHARASHTRA(BHARAT SANCHAR NIGAM LIMITED) - [260100095] EXP. OF 750K GSM LINES OF 2.5 GSM AND VALIDATION EQU(MAHANAGAR TELEPHONE NIGAM LIMITED) - [N26000026] COMMISSIONING OF GSM EQUIPMENT OF 650K LINES (PH(BHARAT SANCHAR NIGAM LIMITED) - [N26000028] GSM EQUIPMENT OF 1006280 LINES IN TAMILNADU PH4.5(BHARAT SANCHAR NIGAM LIMITED) - [N26000042] EXPANSION OF EXISTING 2G&3G GSM N/W BY 750 KPE NO(MAHANAGAR TELEPHONE NIGAM LIMITED) - [N26000061] 150 List of Projects Completed during 2010-11 (as on 30.11.2010) ȋ` Ȍ ȋ`Ȍ Sl. No. October,2010 Health & Family Welfare 50 NORTH EAST INDIRA GANDHI INST-ITUTE OF HEALTH &MS(HEALTH & FAMILY WELFARE) - [210100001] 71.18 03/1999 547.78 200.00 - 567.49 263.00 02/2009 420.80 205.88 06/2010 214.90 1,658.59 07/2010 1,657.45 239.19 04/2008 96.97 488.76 10/2010 198.65 180.53 06/2010 40.92 577.35 09/2010 40.76 1,876.00 04/2009 2,747.34 806.00 03/2008 840.06 665.46 09/2007 982.76 417.76 12/2010 266.42 408.36 12/2010 304.83 Railways 51 DHARMAVARAM-PAKALA RAILWAY) - [220100282] (GC), SCR(SOUTH CENTRAL Road Transport & Highways 52 53 JALANDAR-AMRITSAR, KM.407/100 TO KM.456/100, NH1(NATIONAL HIGHWAYS AUTHORITY OF INDIA) - [240106268] AMRITSAR-WAGHA BORDER(NATIONAL HIGHWAYS AUTHORITY OF INDIA) - [N24000121] Shipping & Ports 54 ACQUISITION OF 6 NOS. 60470 DWT LR-I PRODUCT TANKE(SHIPPING crp. of india) - [N25000029] Telecommunications 55 56 57 58 GSM BASED NETWORK EXPANSION PLAN PH-4(BHARAT SANCHAR NIGAM LIMITED) - [N26000034] Provision of data network for CWG delhi(MAHANAGAR TELEPHONE NIGAM LIMITED) - [N26000076] Expn of existing 2G & 3G GSM N/W by 750k(MAHANAGAR TELEPHONE NIGAM LIMITED) - [N26000077] GSM equipment of 2,00,000Lines (2G) Rajasthan ( Ph(BHARAT SANCHAR NIGAM LIMITED) - [N26000079] November,2010 Petroleum 59 60 INST. OF FACILITIES FOR IMPROVEMENT IN DIESEL QUALITY (IOCL)(INDIAN OIL CORPORATION LIMITED) - [160100289] EXPANSION OF PANIPAT REFINERY FROM 12 TO 15 MMTPA(INDIAN OIL CORPORATION LIMITED) - [N16000017] Power 61 62 63 SEWA- II H.E.P (NHPC)(NATIONAL HYDRO-ELECTRIC POWER CORPORATION) - [180100220] NORTHERN REGION SYSTEM STRENGTHENING-XI(POWER GRID CORPORATION OF INDIA LIMITED) - [N18000034] NORTHERN REGION SYSTEM STRENGTHENING SCHEMEX(POWER GRID CORPORATION OF INDIA LIMITED) [N18000036] 151 List of Projects Completed during 2010-11 ȋ` Ȍ ȋ`Ȍ Sl. No. 64 65 NORTHERN XII(POWER [N18000039] NORTHERN IX(POWER [N18000055] (as on 30.11.2010) REGION SYSTEM STRENGHTENING SCHEMEGRID CORPORATION OF INDIA LIMITED) - 261.55 11/2010 143.36 REGION SYSTEM STRENGHTENING SCHEMEGRID CORPORATION OF INDIA LIMITED) - 525.14 07/2011 354.9971 180.82 03/2006 272.46 205.92 08/2009 204.50 243.64 08/2009 256.40 908.30 08/2009 211.83 300.00 - .00 Railways 66 RAJGIR-TILAIYA (NL), ECR(EAST CENTRAL RAILWAYS) [220100312] Road Transport & Highways 67 68 HYDERABAD-BANGALORE SEC.(NS CORR.PH-II)[KM 376418(NATIONAL HIGHWAYS AUTHORITY OF INDIA) [N24000079] HYDERABAD-BANGALORE SEC.(NS CORR.PH-II)[KM 418463(NATIONAL HIGHWAYS AUTHORITY OF INDIA) [N24000080] Telecommunications 69 70 GSM EQUIPMENT OF 1625K LINES(2G) & 325K LINES IN M(BHARAT SANCHAR NIGAM LIMITED) - [N26000051] CENTRALISED TRANSMISSION NMS(BHARAT SANCHAR NIGAM LIMITED) - [N26000064] 152 ANNEXURE-VIII A A. Total Plan Gross Budgetary Support (GBS) for 2009-10 (BE and RE) for North-Eastern Region. (Rs in lakh) Provision for NE during 2009-10 Actual BE RE Expenditure Name of Plan Scheme 1 2 1. Basic Statistics for Local Level Development 2. Indian Statistical Strengthening Project (Modernisation of Statistical System in India) 3(a). Capacity Development (Capacity Development of CSO & Institutional Development & Capacfity Building) 120.00 5.00 0.00 1000.00 0.00 0.00 3.(b) Capacity Development (Capacity Development of NSSO Grant-in-aid to the states for carrying out central NSS sample work in NER region) 4. Institutional Development Capacity Building (P.I. Wing) 5. Grant-in-aid ti ISI, Kolkata (*) GRAND TOTAL & 3 4 50.67 519.00 164.00 5.98 98.00 119.00 41.85 114.50 16.00 311.00 384.00 40.00 0.00 0.00 300.00 2290.00 387.00 940.00 387.00 833.00 (*) State wise details not received 153 NE States Remarks 5 6 NE States Mizoram Arunachal Pradesh Manipur Mizoram Tripura Sikkim ANNEXURE-VIII B B. Total Plan Gross Budgetary Support (GBS) for 2010-11 (BE and RE) for North-Eastern Region. (Rs inlakh) Name of Plan Scheme 1 1. Basic Statistics for Local Level Development 2. Indian Statistical Strengthening Project (Modernisation of Statistical System in India) 3(a). Capacity Development (Capacity Development of CSO & Institutional Development & Capacfity Building) 3.(b) Capacity Development (Capacity Development of NSSO Grant-in-aid to the states for carrying out central NSS sample work in NER region) 4. 6th Economic Census 5. Institutional Development & Capacity Building (P.I. Wing) 6. Grant-in-aid to ISI, Kolkata (*) GRAND TOTAL Provision for NE during 2010-11 Actual Expenditure (upto BE RE December, 2010) 2 3 4 150.00 169.00 1000.00 0.00 301.00 NE States Remarks 5 6 68.70 Arunachal Pradesh 174.25 Manipur 45.00 Mizoram 75.00 Tripura 75.75 400.00 583.30 30.00 Sikkim 500.00 0.00 49.00 49.00 12.12 280.00 360.00 210.07 2680.00 1230.00 622.19 (*) State wise details not received 154 ANNEXURE-IX List of Publication released during 2010-11 S.No. Name of the Publication Periodicity Release Month 1. Monthly Abstract of Statistics Monthly 2. Statistical Abstract India Annual 3 Statistical Pocket Book-India Annual 4 India in Figure Annual 5 Monthly Abstract of Statistics (MAS) Volume 62 Monthly for the months of November, 2009 to December, 2009 issue 6 Monthly Abstract of Statistics (MAS) Volume 63 for the months of January, 2010 to March, 2010 issue 7 Monthly Abstract of Statistics (MAS) Volume 63 for the months of April, 2010 to June, 2010 issue 8. Compendium of selected Indicator of India Economy –Volume II (Social sector) 9. Statistical year Book-2011 10. Annual Review on Twenty Point Programme- Yearly 2006 2008-09 11. Monthly Progress Report on Twenty Point Monthly Programme-2006 January, 2010 to September, 2010 12. National Product Classification for Services Sector (NPCS) – 2010 June, 2010 13. Infrastructure Statistics, 2010 14. National Accounts Statistics-2010. 15. Household Consumer Expenditure in India, 2007-08 (Report No. 530) June, 2010 Yearly Annual 155 April 2010 16. Employment and Unemployment Situation in India, 2007-08(Report No. 531) 17. Education in India, 2007-08: Participation and Expenditure(Report No. 532) 18. Migration in India, 2007-08(Report No. 533) 19. Some Characteristics of Urban Slums, 2008-09 (Report No. 534) 20 Housing Condition and Amenities in India, 200809 (Report No. 535) 21. 22. Domestic Tourism in India, 2008-09 (Report No. 536) Energy Statistics, 2010 23. Glimpses of Education in India 156 ANNEXURE-X Category-wise break up of Staff Strength of the Ministry (as on 01.01.2011) Group A B C D Total No. of total employees in the Ministry/ Attached/ Subordinate Offices 331 2786 1569 285 4971 SC % ST % 19 379 193 47 638 5.74 13.60 12.3 16.49 12.83 16 175 67 3 261 4.83 6.28 4.27 1.05 5.25 157 No. of Persons with Disabilities 03 02 14 19 Printed & Designed By Shri Ganesh Associats Ph.: 22914661, Mob.: 9810096326
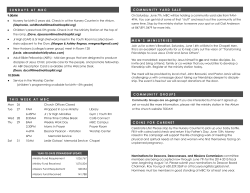


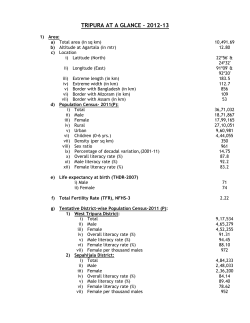

© Copyright 2026