
Non-invasive methods for the determination of
Scholz, A.M., Bunger L., Kongsro, J., Baulain, U. and Mitchell, A.D.
(2015) Non-invasive methods for the determination of body and
carcass composition in livestock: dual-energy X-ray absorptiometry,
computed tomography, magnetic resonance imaging and ultrasound:
invited review. Animal. ISSN 1751-7311 .
Copyright © The Animal Consortium 2015.
This is an Open Access article distributed under the terms of the
Creative Commons Attribution License
(http://creativecommons.org/licenses/by/3.0/), which permits
unrestricted reuse, distribution, and reproduction in any medium,
provided the original work is properly cited.
http://hdl.handle.net/11262/10703
http://dx.doi.org/10.1017/S1751731115000336
Deposited on: 24 April 2015
SRUC Repository – Research publications by members of SRUC
http://openaccess.sruc.ac.uk/
Animal, page 1 of 15 © The Animal Consortium 2015. This is an Open Access article, distributed under the terms of the Creative
Commons Attribution licence (http://creativecommons.org/licenses/by/3.0/), which permits unrestricted re-use, distribution, and
reproduction in any medium, provided the original work is properly cited.
doi:10.1017/S1751731115000336
animal
Non-invasive methods for the determination of body and carcass
composition in livestock: dual-energy X-ray absorptiometry,
computed tomography, magnetic resonance imaging and
ultrasound: invited review
A. M. Scholz1†, L. Bünger2, J. Kongsro3, U. Baulain4 and A. D. Mitchell5
1
Livestock Center Oberschleißheim, Ludwig-Maximilians-University Munich, Sankt-Hubertusstrasse 12, 85764 Oberschleißheim, Germany; 2SRUC, Animal and
Veterinary Sciences, Roslin Institute Building, Easter Bush, Midlothian, Scotland EH25 9RG, UK; 3Norsvin, Department of Animal and Aquacultural Sciences, c/o
Norwegian University of Life Sciences, PO Box 5003, N-1432 Ås, Norway; 4Institute of Farm Animal Genetics, Friedrich-Loeffler-Institut, Hoeltystr.10, 31535
Neustadt, Germany; 5Agricultural Research Service (Retired), US Department of Agriculture, 10300 Baltimore Avenue, BARC-West, Beltsville, MD 20705, USA
(Received 10 May 2014; Accepted 8 February 2015)
The ability to accurately measure body or carcass composition is important for performance testing, grading and finally selection
or payment of meat-producing animals. Advances especially in non-invasive techniques are mainly based on the development of
electronic and computer-driven methods in order to provide objective phenotypic data. The preference for a specific technique
depends on the target animal species or carcass, combined with technical and practical aspects such as accuracy, reliability, cost,
portability, speed, ease of use, safety and for in vivo measurements the need for fixation or sedation. The techniques rely on
specific device-driven signals, which interact with tissues in the body or carcass at the atomic or molecular level, resulting in
secondary or attenuated signals detected by the instruments and analyzed quantitatively. The electromagnetic signal produced by
the instrument may originate from mechanical energy such as sound waves (ultrasound – US), ‘photon’ radiation (X-ray-computed
tomography – CT, dual-energy X-ray absorptiometry – DXA) or radio frequency waves (magnetic resonance imaging – MRI). The
signals detected by the corresponding instruments are processed to measure, for example, tissue depths, areas, volumes or
distributions of fat, muscle (water, protein) and partly bone or bone mineral. Among the above techniques, CT is the most
accurate one followed by MRI and DXA, whereas US can be used for all sizes of farm animal species even under field conditions.
CT, MRI and US can provide volume data, whereas only DXA delivers immediate whole-body composition results without (2D)
image manipulation. A combination of simple US and more expensive CT, MRI or DXA might be applied for farm animal
selection programs in a stepwise approach.
Keywords: animal, body composition, X-ray attenuation, magnetic resonance imaging, ultrasound
Implications
Introduction
The ability to accurately and precisely measure body or carcass composition is important for performance testing,
grading and finally the selection or payment of meatproducing animals. Advances especially in non-invasive
techniques are mainly based on the development of electronic and computer-driven methods in order to provide
objective phenotypic data. This review provides a summary
of the recent developments in the application of dual-energy
X-ray absorptiometry, X-ray computed tomography, magnetic
resonance imaging and ultrasound.
Although meat consumption in Europe and worldwide is not
increasing at the same rate, meat from farm animals will
continue to be the major source of protein for human nutrition throughout the world (OECD/Food and Agriculture
Organization of the United Nations, 2014). In order to provide a fair and comparable payment for farmers, it is necessary to base the classification of carcasses or meat-producing
animals on harmonized procedures with the least impact on
the quality and quantity of the products for human consumption. Non-invasive grading or classification procedures
have preference over invasive procedures like dissection or
chemical analysis. The ability to accurately and precisely
†
E-mail: [email protected]
1
Scholz, Bünger, Kongsro, Baulain and Mitchell
measure body composition or carcass composition is also
important for applications related to PHENOTYPING in performance testing and breeding programs or scientific studies
focusing on growth, nutrition, genetics, housing and behavior or farm animal well-being.
Background
Humans started to classify or select animals with the
domestication of wild animals thousands of years ago. This
classification and selection process was (and still is) mainly
based on visual and tactile appraisal with a preference for
less-aggressive and easily fed animals. Apart from selection
procedures based on the form, size, weight, speed, behavior,
fertility, antlers, horns or coat color, it took thousands of
years until ‘more’ scientifically based procedures for farm
animal evaluation or classification were invented. In almost all
cases, farm or wild animals had or have to be sacrificed in order
to be able to process the products for human consumption or
utilization – with the exception of milk, egg, wool, work,
company or manure. Tissue dissection, however, is still the main
European reference standard for the approval of carcass classification procedures or formulas (Nissen et al., 20061).
First ‘non-invasive imaging’ methods on farm animals
were tested by Kronacher and Hogreve (1936) and Hogreve
(1938) using X-radiography in order to study the pelvis shape
of different pig breeds and the adipose tissue deposition of
fattening pigs, respectively. The first studies using the specific
velocity of ultrasound (US; >20 kHz) in different body tissues
were started in meat-producing farm animals by Temple et al.
(1956). More than 30 years ago, the first papers dealing with
X-ray-based computed tomography (CT; Skjervold et al., 1981)
and nuclear magnetic resonance imaging (tomography – MRI:
Groeneveld et al., 1983; even earlier spectroscopy, Casey and
Miles, 1974) for the evaluation of meat or carcass and body
composition of farm animals were published. Early attempts to
cope automatically with MRI inhomogeneity were made by
Scholz et al. (1993) using a cluster analysis for the segmentation
into fat and muscle tissue of pigs in vivo only after defining a
region of interest of the body part MR scanned. The first dualenergy X-ray absorptiometry (DXA) studies – especially
regarding farm animal body composition – started with Mitchell
et al. (1996).
Since then, technical progress continued providing ‘bigger,
quicker and smarter’ non-invasive imaging or scanning
devices for the determination of body and/or carcass composition measurements in farm animal selection programs.
Besides Australia, New Zealand, Norway and the United
Kingdom, quite a few countries like, for example, Austria,
Canada, Denmark, France, Germany, Hungary, Ireland,
Spain, Sweden and the United States of America use(d) CT (e.g.
Junkuszew and Ringdorfer, 2005; Romvari et al., 2006; Font-i
-Furnols and Gispert, 2009; Vester-Christensen et al., 2009;
Picouet et al., 2010) or MRI (e.g. Mitchell et al., 2001; Collewet
et al., 2005; Monziols et al., 2006; Margeta et al., 2007;
1
References before 2010 in Supplementary Material S1.
2
Baulain, 2013) as the reference technology for carcass grading
in abattoirs (e.g. Branscheid et al., 2011; Daumas et al., 2013)
or for performance testing in farm animal breeding programs
(e.g. sheep: von Korn et al., 2005; Baulain et al., 2011; rabbits:
Nagy et al., 2010; Gyovai et al., 2012; Szendrő et al., 2012;
pigs: McEvoy et al., 2009; Kremer et al., 2012, 2013; broiler:
Davenel et al., 2000; Milisits et al., 2013; laying hens: Szentirmai
et al., 2013; and turkeys: Andrássy-Baka et al., 2003).
Owing to changes in carcass confirmation caused by
breeding progress in various farm animal populations, differences among breeds/species themselves or gender-specific
carcass composition, there is a steady need for newly derived or
adapted formulas for the (S)EUROP classification in carcass
grading (Baulain et al., 2003; Branscheid et al., 2011; Monziols
et al., 2013) or for performance testing (Tholen et al., 2003;
Bernau et al., 2013 and 2015). This is necessary as long as no
whole-body or whole-carcass information would be used
(Kongsro et al., 2008).
Non-invasive techniques for body/carcass composition
measurements
A common feature of non-invasive techniques for body or
carcass composition measurements is that they work with
electromagnetic or mechanical energies, which are able to
pass completely or partially through body or carcass tissues
such as muscle (lean meat = protein + water), adipose tissue
(fat, lipids) and bone. Figure 1 summarizes the different (electromagnetic) energy levels that are being used for a number of
non-invasive measurement techniques.
All techniques shown in Figure 1 rely on specific devicedriven signals, which interact with tissues in the body or
carcass at the atomic or molecular level, resulting in secondary or attenuated signals detected by the instruments
and analyzed quantitatively. The signal (energy) produced by
the instrument may be in the form of sound waves (US),
X-radiation (e.g. CT and DXA) or radio frequency (RF) waves
(MRI). The signals detected by these instruments are processed
to measure, for example, tissue depths, areas, volumes or distributions of fat, muscle (water, protein) and partly bone or
bone mineral (Table 1).
In many cases, these metrology results have to be compared with or validated against a (SI) reference standard
directly derived from the carcass. The difference between the
arithmetic mean from the non-invasive technique and the
arithmetic mean of the reference provides a measure of BIAS
or trueness. In addition, the (adjusted) coefficient of determination or regression coefficient (R²) combined with an
error term or term of uncertainty serves as a statistically
defined term of accuracy (i.e. precision). For example, partly
depending on the statistical modeling procedure, the root
mean squared error of estimation and/or prediction or (cross)
validation sometimes standardized as residual standard
deviation (root mean squared error divided by the standard
deviation of the reference mean) provide information about
the uncertainty if compared with a reference technique
(Johansen et al., 2007, e.g. Table 2). A standard description
DXA, CT, MRI and US in farm animals
(Electromagnetic) Frequencies (Hz)
(NAA)
(PET)
1018
Ionisation
(CT/DXA)
Gamma rays
X-rays
1016
1014
No Ionisation
1012
1010
108
(MRI/NMRS)
106
(mechanical energy - US)
104
Signal source
Radioactive Isotopes
„X-ray“photons,
attenuation
Ultra Violet
Visible Light
Infrared Light
Microwave
(Hyper sound)
Radio
Frequency
waves
Ultra sound
Photon intensity,
Light reflexion
Net magnetisation,
Proton density,
Relaxation times
Speed of sound
Figure 1 Overview of imaging methods.
Table 1 Traits determined by non-invasive techniques
Non-invasive technique
Trait
Dual-energy X-ray absorptiometry (DXA)
Photon number passage (tissue level)
X-ray attenuation coefficient from two energy levels
Bone mineral content
Bone mineral area
Bone mineral density
Soft tissue mass
Lean tissue mass
Fat tissue mass
Whole-body and regional data
Photon number passage (tissue level)
X-ray attenuation in Hounsfield units (HU)
Tissue areas or volumes depending on anatomical position and HU
Regional and whole-body data
Nuclear magnetic resonance pattern (atomic level)
Energy level (net magnetization) of nuclei with uneven proton and neutron number
Longitudinal and transversal relaxation times
Proton density
Tissue areas or volumes depending on anatomical position and (arbitrary) signal intensities
Regional and whole-body data
Speed of (ultra) sound (tissue level)
Mechanical energy level v. electrical energy level
Signal amplitude, signal brightness
Regional distances, areas, volumes
Computed tomography (CT)
Magnetic resonance imaging (MRI)
Ultrasound imaging (US)
is provided by ISO 5725 (https://www.iso.org/obp/ui/#iso:std:
iso:5725:-1:ed-1:v1:en). If two techniques are being compared without a ‘gold standard’ or ‘true’ reference, an
improved Bland–Altman analysis might be the first choice as
the statistical procedure (Liao and Capen, 2011).
Several publications summarize further invasive or noninvasive methods that are not considered in this review.
Simeonova et al. (2012), for example, provide a recent
review focusing on methods for determining pig body
composition, especially on protein deposition during growth.
All ‘radiology’ applications reviewed in this paper are based
on the inventions and findings of a number of scientists and
engineers summarized in the book Classic Papers in Modern
Diagnostic Radiology.
DXA
Both the techniques, CT and DXA, are based on the measurement of the attenuation of X-rays (photons) passing
3
Scholz, Bünger, Kongsro, Baulain and Mitchell
Table 2 Relationship between carcass composition from dissection and DXA carcass or in vivo body composition, depending on species (pig, sheep,
cattle) studied (all whole-body DXA data from the same GE Lunar DPX-IQ scanner1)
Pig (n = 61)
R 2 (√m.s.e./s.d.)
Dissection v. DXA
Reference
FAT (%)
FAT (g)
Meat (%)/soft lean (%)
Meat (g)/soft lean (g)
Carcass
Lamb (n = 93)
R 2 (√m.s.e./s.d.)
In vivo
CV
0.19
0.28
0.05
0.14
Carcass
Calf (n = 34)
R 2 (√m.s.e./s.d.)
In vivo
CV
0.80 (0.46)
0.90 (0.32)
0.70 (0.57)
0.94 (0.39)
0.74 (0.46)
0.89 (0.43)
0.65 (0.64)
0.82 (0.55)
0.22
0.31
0.04
0.10
Carcass
In vivo
0.28 (0.86)
0.64 (0.78)
0.53 (0.69)
0.98 (0.13)
0.003 (1.02)
0.42 (0.39)
0.09 (0.97)
0.94 (0.12)
CV
0.73 (0.52)
0.83 (0.42)
0.57 (0.66)
0.88 (0.35)
0.51 (0.69)
0.71 (0.27)
0.50 (0.70)
0.57 (0.33)
0.14
0.23
0.04
0.23
DXA = dual-energy X-ray absorptiometry.
1
This is the only known comparison for the three livestock species using the same DXA device always to compare carcass and in vivo data with reference dissection,
modified from Scholz et al. (2013).
through a body (in vivo) or a carcass (postmortem). Tissues or
elements in the body or carcass are characterized by specific
mass attenuation coefficients, depending on the photon
energy level being applied for the measurement. DXA and a
combination of DXA and CT (dual-energy X-ray computed
tomography – DECT; see Johnson, 2009; Magnusson et al.,
2011) are based on the application of two different X-ray
photon energy levels (high and low), whereas CT works
(simplified) only with one (monochromatic) X-ray photon
energy level (Kalender, 1988). The ratio (by using the natural
logarithm = ln) of the attenuated (I) and the initial X-ray
photon number (IO) for the low (L) and the high (H) energy
levels provides the so-called R value (X-ray attenuation
coefficient). This R value is – depending on the energy levels
used – a unique trait for a certain element or compound
tissues, such as bone mineral, soft, lean or fat tissues
(Crabtree et al., 2007; Wang et al., 2010). Different generations of DXA (or CT) machines use either pencil or fan-beam
technology. The fan-beam technology has been extended to
a so-called cone-beam or a flash-beam technique. A wholebody scan with a rather slow but very accurate pencil-beam
scanner could take up to 35 min, whereas a whole-body
scan with a high-speed cone-beam scanner takes <3 min.
Different manufacturers of DXA (or DECT) scanners use different
approaches to create a high and a low X-ray energy levels
(Ulzheimer and Flohr, 2009). Therefore, DXA needs crossvalidation for transferring composition results among devices
and software modes (Plank, 2005; Scholz et al., 2007 and 2013;
Hull et al., 2009; Lösel et al., 2010). In addition, DXA as an
indirect tool (Dunshea et al., 2007; Scholz and Mitchell, 2010;
Hunter et al., 2011) does not provide a measure of the lean
meat percentage. It is still necessary to determine the accuracy
of DXA by reference dissection or chemical analysis. The wholebody/carcass composition estimate is available immediately
after the scan is completed. Alone, a regional analysis in order
to quantify the 2D tissue distribution requires manual
manipulation time, depending on the number and anatomical
specification of the regions of interest.
DXA studies have been performed on a large variety of
farm animal species such as pigs (or pork): Mitchell et al.
(2000 and 2003); Scholz et al. (2002); Suster et al. (2004);
4
Marcoux et al. (2005); Scholz and Förster (2006); Latorre
et al. (2008); Kremer et al. (2012, 2013); Kogelman et al.
(2013); chicken/broiler/eggs: Swennen et al. (2004); Schreiweis et al. (2005); England et al. (2012); Salas et al. (2012);
turkeys: Schöllhorn and Scholz (2007); sheep (or lamb carcasses): Mercier et al. (2006); Hopkins et al. (2008), Ponnampalam et al. (2008); Pearce et al. (2009); Hunter et al.
(2011); Scholz et al. (2013); calves/calf carcasses: Bascom
(2002); Scholz et al. (2003); Hampe et al. (2005); fish: Wood
(2004), or beef: Ribeiro et al. (2011); as well as in the wool and
meat industry: Kröger et al. (2006) and Ho et al. (2013).
The accuracy of DXA measurements comparing pigs,
lambs, calves and turkeys has been summarized recently by
Scholz et al. (2013). To our knowledge, this is the only
comparison performed always with the same GE Lunar DPXIQ (GE Healthcare, Oskar-Schlemmer-Strasse 11, D-80807
München) machine (Table 2). Accuracies for turkeys
(n = 100) measured with the same GE Lunar DPX IQ pencilbeam scanner comparing DXA carcass with chemical analysis
data resulted in the following coefficients of determination
as are for fat (%): R 2 = 0.74 (√m.s.e. = 2.11), fat (g):
R 2 = 0.86 (√m.s.e. = 254), protein + water v. soft lean (%):
R 2 = 0.69 (√m.s.e. = 2.33) and protein + water v. soft lean
(g): R 2 = 0.99 (√m.s.e. = 178) (data from Kreuzer, 2008). The
accuracy (low R 2, high r.s.d.) for lean meat percentage in calves
(Table 2) is rather low due to the relatively low variability in the
lean meat percentage of the young calves in comparison with
the relatively high variability of the lean tissue weight especially
in vivo. The error (inaccuracy) is even inflated during reference
dissection, especially by the individual butcher effect (Nissen
et al., 2006). The relatively low absolute amount of fat leads
to relatively large errors in percentage values for lean and fat
tissues. The main difference among calves originates from different BWs causing variations in lean tissue weight. Bascom
(2002) concluded that DXA is not suitable for the prediction of
the percentage of carcass fat or carcass CP in Jersey calves
(adjusted R 2 < 0.1), although it is unclear what was done
during that study in terms of the DXA analysis. Dunshea et al.
(2007) found higher prediction accuracies for chemically determined reference carcass composition in sheep with R² of 0.98
for lean weight and of 0.94 for lean percentage. In addition,
DXA, CT, MRI and US in farm animals
Hunter et al. (2011) stated that DXA-derived estimates of total
and individual tissue masses are highly related to, and can be
used to predict, chemical composition in vivo or of whole
carcasses and carcass halves (in sheep). An adjustment of
the prediction equations, however, depends in all cases on the
manufacturer (General Electrics, Hologic, Norland, Diagnostic
Medical Systems), species, age or weight, software mode and
animal positioning on the scan table.
CT
Contrary to DXA and DECT, CT works with only one (monochromatic) X-ray level (Kalender, 2006). The mass attenuation coefficient of the object (tissue) of interest is
transformed into the so-called Hounsfield units (HU) or CT
values by taking the mass attenuation for water and air into
account. The almost-fixed range of HU for a given tissue
could be used for (fully) automated image segmentation,
distinguishing among the body tissue fat, muscle (water) and
bone (Glasbey et al., 1999; Johansen et al., 2007; Bünger
et al., 2011; Gjerlaug-Enger et al., 2012; Font-i-Furnols et al.,
2013; Jay et al., 2013; Judas and Petzet, 2013; Monziols
et al., 2013). There is, however, for in vivo studies, some
overlap between fat and mammary tissue or fat and lung
tissue on one side of the HU scale, and bone or muscle, as
well as internal organs such as liver, tumor tissue and blood
on the upper side of the HU scale. It has to be considered,
additionally, that differences in CT protocols may lead to
variations of up to 20% in the HU values, especially for (bone
containing) tissues with densities >1.1 g/cm3 (Zurl et al.,
2014). As described above, tissue segmentation, for example, by threshold setting is based on assumptions of specific
mass attenuation coefficients for different body or carcass
tissues, which are calculated as HU. It is, however, not
always given – not alone depending on the tissue temperature (Szabó and Babinszky, 2008) – that muscle tissue is
detected automatically as muscle tissue (or meat ≠ meat,
fat ≠ fat) when comparing different CT machines using the
same individual(s) (Bünger et al., 2011). Besides small
variations for non-adipose tissue (HU = +49 to +52), there
is variation in CT values or HU of the adipose tissue within
growing pigs. The mean adipose tissue HUs for all pigs
(n = 9) in a study by McEvoy et al. (2008) were −90, −98
and −101 at mean BWs of 51.4, 93.8 and 124.1 kg,
respectively. Owing to the anatomical structure of farm animals (or fish: Nanton et al., 2007; Kolstad et al., 2008),
however, CT, like DXA, is very well-suited for the discrimination between bone and soft tissues in sheep, chicken,
rabbits, beef including buffalo and goose liver in vivo (sheep:
Johansen et al., 2007; Kvame and Vangen, 2007; Navajas
et al., 2007; Macfarlane et al., 2009; Bünger et al., 2011; Ho
et al., 2013; chicken: Milisits et al., 2013; Szentirmai et al.,
2013; rabbits: Nagy et al., 2010; beef: Hollo et al., 2008;
Navajas et al., 2010; buffalo carcass: Holló et al., 2014;
goose liver in vivo: Locsmandi et al., 2005). Milisits et al.
(2013) and Szentirmai et al. (2013), for example, provided a
so-called fat index for determining the body fat content in
broiler chicken and laying hens, respectively, by calculating
the ratio of the number of fat pixels within the HU range from
−20 to −200 to the total number of pixels with HU values for
muscle, water and fat between −200 and +200. The muscle
index provided additionally by Milisits et al. (2013) uses the
number of muscle pixels within the HU range from +20 to
+200, instead of the fat pixel HU range. The variation found
by Chang et al. (2011) for various points of visceral and
subcutaneous fat in minipigs lies in the range of the abovedefined HU threshold values for ‘chicken’ fat (−20 and
−200), with −108.80 ± 5.77 as the lowest mean value
(± s.d.) for subcutaneous fat and with −119.41 ± 6.90 as the
highest HU value for visceral fat. Johansen et al. (2007)
provided the following HU thresholds for tissue segmentation in lambs: bone v. soft tissue ‘kC’ = 296; soft tissue v.
background noise (air) ‘kA’ = − 156 and fat v. muscle ‘kB’
= 10. The sum of pixels within these thresholds served as
estimates of fat and muscle tissue, although according to the
thresholds mentioned water was included into the fat tissue.
The latest machines are now the so-called multi-slice spiral
(or helical) CTs based on a rotating X-ray source and an array
of X-ray photon sensors on the opposite side of the CT gantry
(Ulzheimer and Flohr, 2009). Especially for CT, the development of technology occurs at a breathtaking speed. It took
only about 10 years from single-slice to multi-slice machines to
be developed (Kopp et al., 2000), with now more than 100
slices for one rotation. The body region covered increased from
about 1 cm to more than 10 cm/s, whereas the minimal slice
thickness decreased from 5 mm to <0.5 mm at the same time
(Kalender, 2006). In addition, the gantry size now reaches up to
90 cm providing space for bigger (heavier) farm animals.
After semi-automatic image analysis using OsiriX (Rosset
et al., 2004) or ATAR (Animal Tomogram Analysis Routines)
software (Haynes et al., 2010; Bünger et al., 2011; Jay et al.,
2013), fat, muscle and bone areas can be calculated within
the slices of interest. The traits (phenotypes) calculated serve
as the basis for the prediction of carcass and tissue weights
or volumes and proportions of muscle, fat and bone
in combination with additional linear measurements for
2D gigot muscularity, loin eye muscle area and 2D loin
eye muscularity and finally as basis for breeding value
estimation (Bünger et al., 2011). Present developments aim
at whole-body spiral scanning in order to measure the above
traits instead of having to predict them, leading additionally to
3D gigot muscularity and 3D loin eye muscularity. The 3D
information can even help to include the retailer into the
development of new products by applying ‘PorkCAD’, a new
‘design butcher’ (Virtual Slaughterhouse) system based on
a virtual pig created from CT scanning as suggested by Laursen
et al. (2013).
Somewhat different approaches and assumptions among
the European colleagues from Denmark, France, Hungaria,
Ireland, Norway, Sweden, Spain and United Kingdom led to
different solutions for carcass grading, and especially formulas for the prediction of the lean meat percentage, which
is or should be the basis for the payment of producers (Szabó
and Babinszky, 2009). There is, for example, a discussion
going on whether meat yield should be determined on the
5
Scholz, Bünger, Kongsro, Baulain and Mitchell
basis of scale weight or on the basis of CT volume (Olsen and
Christensen, 2013 v. Daumas et al., 2013). Scale weight
would require assumptions or knowledge about the ‘true’ CT
density of lean meat (Daumas et al., 2013). Differences in the
calculation of CT densities for lean meat result in different
lean meat weights for similar lean meat volumes, making the
harmonization among different countries or among various
CT scanners more complicated (Daumas et al., 2013; Olsen
and Christensen, 2013).
Correspondingly, CT studies post mortem are also aiming
to determine the salt content in the dry-cured ham, because
the changing NaCl and H2O proportions lead to modified
X-ray attenuations (Fulladosa et al., 2010); whereas Frisullo
et al. (2010) used micro-CT for the rapid estimation of
intramuscular fat (IMF) in beef and for the description of the
fat microstructure. Anton et al. (2013) compared chemical
analysis or dissection with CT in order to determine the IMF
and carcass fat content of beef in a study focusing on the
thyroglobulin (TG) polymorphism. They calculated correlations between IMF (% from Soxhlet analysis) and CT fat (%)
in musculus longissimus dorsi, and between dissected fat (%)
of the right carcass-half and CT fat (%) between the 11th and
13th rib joint of 0.71 and 0.96 (P < 0.001), respectively. In
this context, Jose et al. (2009) stated that CT scanning does
not negatively affect the quality of (beef or lamb) meat,
especially in terms of color. Kongsro and Gjerlaug-Enger
(2013) – in pigs – and Clelland et al. (2013) – in sheep –
started using CT for the measurement of meat quality (IMF
content) in vivo. The regression coefficients between CT IMF
in vivo (+ further variables) and IMF in the carcass loin eye
reached values of adjusted R 2 ⩽ 0.71 (r.m.s.e. ⩾ 0.36) for
Texel lambs, whereas a significantly lower relationship
between IMF and CT intensity values was found (R 2 = 0.18;
RMSEP = 0.48) according to Kongsro and Gjerlaug-Enger
(2013) in pigs. In contrast to the US study by Jiao et al.
(2014), the relatively low level of IMF and small variation in
the Duroc boars studied in comparison with ordinary
slaughtered pigs may have led to low prediction accuracies
based on CT signal intensities. Font-i-Furnols et al. (2013)
describe a further method to determine IMF in pork loins
using CT. The best prediction of IMF resulted from ordinary
linear regression analysis when data from two tomograms
were used (R 2 = 0.83 and RMSEPCV = 0.46%). However,
genomic selection for IMF improvement based on NIR
derived IMF might be a more promising approach according
to Gjerlaug-Enger et al. (2014).
Deeper insights into the physiological role of IMF in comparison with intermuscular fat (adipose tissue) are provided
by Hausman et al. (2014).
MRI
The principle of MRI relies on the net magnetization of
spinning nuclei with uneven proton and neutron numbers
and RF-induced 3D-coded voltage readings with tissuespecific relaxation times depending on spin-lattice (T1) and
spin–spin (T2) interactions combined with the proton
density (Laurent et al., 2000; Baulain and Henning, 2001;
6
Mitchell et al., 2001). In addition, T1 and T2 depend on the
magnetic field strength (Kato et al., 2005). Furthermore, the
effect of dehydration plays a crucial role not alone in (dry)
cured ham and can be used for MRI applications by taking
advantage of changing T1 and T2 relaxation times, which
depend on the salt content in the ham (Fantazzini
et al., 2009).
A combination of magnetic field produced either by a
ferromagnetic, electromagnetic or superconducting system
with a field strength between 0.1 and 7 T and so-called
gradient coils with a corresponding RF frequency (Larmor
frequency) sequence creates a number of cross-sectional
images with a 3D voxel definition for the x-, y- and z-axis
direction. A Fourier transformation helps in recalculating the
signal information from the spectral domain into pixel (or
voxel)-wise signal intensity values in a ‘gray scale domain’
visible on the ‘computer’ screen. For a T1-weighted sequence
with a TR (time between two consecutive RF pulse signals or
between successive excitations) of 300 ms and a TE (time
between echoes = between middle of exciting RF pulse
signal and middle of spin echo production) of 17 ms, the fat
tissue containing pixels have rather high signal intensities,
whereas the non-fat pixels show lower signal intensities. This
pattern, however, changes on chilled objects (Monziols et al.,
2005 and 2006). As shown in Figure 2, a T1-weighted
sequence would show dark pixels (low signal intensity) for
fat tissue and brighter pixels for lean meat tissue (relatively
higher signal intensity).
The above-mentioned Larmor (resonance) frequency differs depending on the isotope of interest and the magnetic
field strength. Because the isotope 1H has the largest relative
sensitivity and highest natural frequency compared with 2H
and 3H, proton or 1H nuclear MRI is the most often used
method, and is even applied for the study of pork pie (Gaunt
et al., 2013).
Usually, an MRI or also a CT (DECT) scan starts with a socalled scout or localizer image sequence in order to be able
to define the ‘slice’ positions and directions as targeted. After
successful image acquisition and data storage, a quantitative
image analysis is required in order to measure – either in the
most simple way – the regions of interest (distances or areas)
or calculate – after a more challenging segmentation procedure – the volumes of interest relevant for body or carcass
composition measurements. Based on T1 mapping, Kullberg
et al. (2006 and 2007), for example, described a fully automated protocol for MR image analysis, focusing on the segmentation of visceral and subcutaneous fat in humans,
whereas Addeman et al. (2015) suggested a so-called fat
fraction mapping for the automatic determination of subcutaneous adipose and intra-abdominal adipose tissue
within the total adipose tissue.
Various free or commercial software packages are available in order to automate image segmentation into muscle/
lean meat, fat, bone and, if necessary, gastrointestinal tract/
abdominal content (Figure 3). This procedure can be standardized more easily for CT images than for MRI images,
because of the ‘unique’ application of HU for tissues like
DXA, CT, MRI and US in farm animals
1H
Magnetic Resonance Imaging
in vivo
carcass
Characteristics of isotopes (1H)
T1 weighted sequence
Figure 2 Differences in NMR proton characteristics depending on body temperature (left: lamb in vivo ~37°C, right: lamb carcass chilled <8°C, free
software DicomWorks, ©Philippe PUECH).
1H
Magnetic Resonance Imaging
automatic, semi-automatic or manual
segmentation into muscle, fat or bone volumes
Virtual dissection of a lamb
(data from Kremer 2013)
no “unique” signal intensities
Figure 3 Examples for image analysis and 3D re-calculation (left software used: sliceOmatic, Tomovision Inc.; right software used: 3D DOCTOR, Able Inc.,
data from Kremer, 2013).
bone, muscle (water) and fat. Signals within MR images
depend on the tissue-specific relaxation times T1 and T2,
including proton density, and on various technical conditions
and sequence settings such as the magnetic field strength,
the RF pulse sequence(s), slice thickness, distance between
slices, number of acquisitions and the specification of (body)
coil used.
A relatively new non-invasive (but non-imaging) method
‘QMR’ – quantitative magnetic resonance – is still in the
evaluation phase for farm animals (Mitchell et al., 2012).
7
Scholz, Bünger, Kongsro, Baulain and Mitchell
Loin eye
?
Fat depth:
Loin eye
48.9 cm2
~ 50 mm
Fat depth:
Muscle depth: ~ 45 mm?
~ 20 mm
Muscle depth: ~ 50 mm?
Figure 4 Comparison of ‘obese’ and ‘standard’ pigs (using a variable 2.5 to 5 MHz ‘backfat’ 17-cm transducer).
US scanning/imaging
Information retrieval by measuring the velocity of sound is
the only method among the methods described in this study
that depends on mechanical energy fluctuations. The general
principle is based on the partial reflection of (longitudinal) US
waves from the interface between different media and/or
body tissues (>20 kHz, Scholz and Baulain, 2009; Halliwell,
2010; Scholz and Mitchell, 2010; Pathak et al., 2011).
Different tissues have different (sound) attenuation coefficients depending on the frequency for the creation of the US
(waves), whereas the speed of longitudinal sound waves
increases with the density of the material the sound wave is
travelling through (Halliwell, 2010; Culjat et al., 2012).
Because the density of (body) tissues is also temperaturedependent, it makes a difference if a (chilled) carcass or a
living animal is ‘ultrasonographed’. The speed of US is
1403 m/s in water of a temperature of 0°C and 1472 m/s in
water of a temperature of 17°C (Vogt et al., 2008). Van de
Sompel et al. (2012) obtained a calculated speed of US of
1524 m/s in water with a temperature of 37°C for a salinity of
0% at 0 meter below water.
Because of the accelerated technical improvement of
real-time linear-phased array ultrasonic transducers and
scanners, this technique has become the most common
technology for (farm) animal body and carcass composition
assessment (Starck et al., 2001; Mitchell and Scholz, 2009,
Scholz and Baulain, 2009).
Two-dimensional US images from so-called B-mode
(brightness) devices provide information about adipose tissue depots and cross-sectional areas of muscles, whereas
8
A-mode devices (amplitude) can be used for simple distance
measurements of fat or muscle (meat) layers. Real-time
B-mode information (2D or 3D images) result from rapid
electronic switching or phased array transducers (a number
of piezoelectric elements) of different shapes (Starck et al.,
2001). At present, most of the US devices for performance
testing use (linear) phased array transducers to convert
electronic energy to high-frequency ultrasonic (mechanical)
energy that travels through the animal body in short pulses.
As soon as ultrasonic waves meet at an interface between
two tissues that differ in acoustical properties, a part of the
(longitudinal) ultrasonic waves are reflected back to the
receiver probe (the phased array transducer). Variations in
fat, muscle or bone tissue depths or in the distribution of, for
example, intermuscular and especially IMF result in time
differences in reflected ultrasonic wave signals affected
additionally by absorption and refraction (scatter) of the
mechanical energy (Starck et al., 2001). These effects combined with variations caused by the expertise of the testing
person, age/weight of the animal and the behavior of the
animal tested lead in some cases to a challenging interpretation of the US imaging or scanning results, as can be
seen from Figure 4. They make the measurement of areas or
even volumes (weights) less accurate in comparison with
MRI or CT. Depending on the transducer and on the scan
settings in terms of frequency, it might be the case that the
measurement of, for example, the loin eye area becomes
almost impossible and requires a lot of educated ‘anatomical’
guessing in order to provide reasonable data (Figure 4).
Related to the above measurement site on the (beef) animal,
DXA, CT, MRI and US in farm animals
Table 3 Examples of heritability estimates (h 2, s.e.) for intramuscular fat determined by US in vivo
Non-invasive Trait
Technique
Species
Breed
Intramuscular fat (%)
US
Cattle
Angus
Angus–Brahman
Diverse
Duroc
Pig
h² (s.e.)
0.12 (0.03)
0.78 (0.09)
0.12−0.88
0.54 (0.11)
Reference
Ravagnolo et al. (2010)
Elzo et al. (2010)
Suther (2009)1
Jiao et al. (2014)
US = ultrasound imaging.
1
References before 2010 in Supplementary Material S1.
Harangi (2013) stated for Charolais bulls that the relationship between ultrasound rib eye area (UREA) and ‘planimeter’ carcass rib eye area (CREA) was higher when
measured between the 12th and 13th rib instead of between
the 11th and 12th rib with R 2 of 0.91 and 0.84 (CV 2.16% v.
5.3%), respectively. Török et al. (2009) found slightly modified relationships between UREA and CREA for four different
beef breeds (Limousin R 2 = 0.92, Charolais R 2 = 0.64,
Angus and Simmental R 2 = 0.55).
It must always be considered that the attenuation of
ultrasonic energy increases with a rising frequency, whereas
the tissue penetration depth of the ultrasonic energy waves
decreases with increasing attenuation. Therefore, probes
with a frequency between 2 and 5 MHz will be used for
measurements, including muscle depth or muscle area
(volume), whereas probes with frequency >5 MHz (up to
7.5 MHz) will be used for ‘subcutaneous’ scanning where
deeper muscle regions are not of interest (Schröder and
Staufenbiel, 2006; Pillen and van Alfen, 2011).
As muscle tissue has a higher US attenuation than fat
tissue, US technology is widely used in farm animal performance testing (Stouffer, 2004; Pathak et al., 2011; Ayuso
et al., 2013), obesity diagnostics (Barbero et al., 2013), body
condition scoring (Schröder and Staufenbiel, 2006) or for
carcass grading (Branscheid et al., 2011).
Application in existing breeding programs
The above-mentioned practical applications of US measurements of live animals and carcasses are being extended to
genetic selection programs (Müller and Polten, 2004; Kleczek
et al., 2009; Emenheiser et al., 2010; Case et al., 2012;
Maximini et al., 2012; Harangi, 2013), by including in vivo
IMF (uIMF) measurements in Duroc pigs (Maignel et al.,
2010), and, for example, in Angus cattle (Ravagnolo et al.,
2010), Nelore cattle (Bonin et al., 2010) or Angus–Brahman
crossbred cattle (Elzo et al., 2010).
As ‘…heritability is a simple dimension less measure of
the importance of genetic factors in explaining the differences between individuals, and it allows an immediate
comparison of the same trait across populations and of different traits within a population’ (Visscher et al., 2008), we
use that (additive) genetic variance indicator in the following
comparisons of different traits derived from non-invasive
techniques (Tables 3 and 4). Heritability estimates for uIMF
were rather low with h 2 = 0.12 for Angus in Urugay
(Ravagnolo et al., 2010) in contrast with very high (most
likely overestimated) h 2 of 0.78 for a very variable Angus–
Brahman population in Florida (Elzo et al., 2010). Suther
(2009) summarizes a number of earlier studies and shows a
similar range of heritability estimates for marbling (IMF) in
beef cattle (Table 3).
Expectedly, real-time US data of muscle depth in sheep or
breast muscle thickness in broilers showed medium-to-high
direct heritability estimates between 0.2 and 0.51 (Jones
et al., 2004, Wolf and Jones, 2007; Grosso et al., 2010,
Maximini et al., 2012; Table 4), whereas heritability estimates – depending on age – varied in a similar range
between 0.31 and 0.42 for loin muscle (or rib eye) area
(between 12th and 13th ribs) in Bos indicus (Bonin et al.,
2010; Pinheiro et al., 2011), Angus–Brahman (Elzo et al.,
2010) and multi-breed beef cattle (Jeyaruban and Johnston,
2014). Heritability estimates for back fat thickness (between
12th and 13th ribs) showed slightly lower values ranging
from 0.06 to 0.32 (Bonin et al., 2010; Elzo et al., 2010;
Pinheiro et al., 2011) as well as for rump fat thickness with
values from 0.26 to 0.29 (alone Pinheiro et al., 2011). The
advantage of US scanning can be concluded from the above
references. US is the only method among the reviewed ones
that can be applied in (beef) cattle (Drennan et al., 2009)
without size restrictions as there exist for CT, DXA and MRI.
Besides US, CT alone is being used in practical farm animal
breeding programs, especially for the selection of body
composition traits in pigs and sheep. In this context, CT is,
meanwhile, declared as ‘part of the routine genetic selection
programs in modern times’ (Ley, 2013). This, however, is true
for only a very few breeding organizations or CT service
(research) units in the world so far – such as, for example, for
sheep selection in Australia, New Zealand and United Kingdom
(e.g. Lambe et al., 2008; Arthur et al., 2011, Bünger et al., 2011)
or pig (and sheep) selection in Norway (e.g. Kvame et al., 2006;
Kongsro et al., 2008; Gjerlaug-Enger et al., 2012). GjerlaugEnger et al. 2012 estimated heritabilities for CT lean meat
percentage (LMP) between 0.5 and 0.57 (Table 4).
Therefore, the available high additive genetic variance for
lean meat percentage in both Norwegian pig breeds based
on in vivo whole-body CT measurement makes that technique very efficient for selection decisions without having to
sacrifice potential breeding animals. At present, the capacity
of modern CT machines allows the acquisition of more than
1100 slices per farm animal (e.g. male or female breeding
pigs) in an actual whole-body scanning time of less than a
9
Scholz, Bünger, Kongsro, Baulain and Mitchell
Table 4 Examples of heritability estimates (h², s.e.) for body composition traits determined by DXA, CT or US1
h² (s.e.)
Non-invasive trait
Technique
Species
Breed
Lean meat (%)
CT
Pig
Fat (%)
Lean Meat (g)
DXA
CT
Pig
Sheep
Fat (g)
DXA
CT
Pig
Sheep
Bone mineral (g)
Bone mass (g)
DXA
DXA
CT
Pig
Pig
Sheep
Bone mineral density (g/cm²)
Loin eye area (cm²)
DXA
CT
Pig
Sheep
US
Cattle
Fat area (cm²)
CT
Pig
Sheep
Muscle depth (mm, cm)
US
Sheep
Fat depth (mm, cm)
US
Pig
Sheep
Duroc
Landrace
F2 with Göttinger Minipig
Charolais, Suffolk, Texel
Norwegian White
Scottish Blackface
F2 with Göttinger Minipig
Charolais Suffolk, Texel
Norwegian White
Scottish Blackface
F2 with Göttinger Minipig
F2 with Göttinger Minipig
Norwegian White
Scottish Blackface
F2 with Göttinger Minipig
Scottish Blackface
Five diverse Austrian
Nellore
Hanwoo
Duroc, Landrace, Yorkshire
Scottish Blackface
five diverse Austrian
Charolais Suffolk, Texel
Norwegian White
five diverse Austrian
Broiler commercial line
Duroc
Charolais, Suffolk, Texel
Norwegian White
five diverse Austrian
Angus
Nellore
Hanwoo
Duroc
Duroc, Landrace, Yorkshire
Cattle
Pig
0.57 (0.05)
0.50 (0.05)
0.57 (0.14)
0.47, 0.45, 0.46 (0.09)
0.57 (0.16)
0.48 (0.17)
0.71 (0.14)
0.38, 0.41, 0.40 (0.09)
0.29 (0.13)
0.6 (0.28)
0.43 (0.13)
0.76 (0.15)
0.51 (0.15)
0.14 (0.11)
0.92 (0.16)
0.33 (0.12)
0.24 (0.03)
0.31 to 0.34 (0.03)
0.09 to 0.24 (0.09 to 0.16)
0.21 to 0.22 (<0.01)
0.5 to 0.76 (0.08 to 0.22)
0.36 to 0.4 (0.03)
0.30, 0.32, 0.29 (0.01 to 0.02)
0.28 (0.05)
0.28 (0.05)
0.28 to 0.51 (0.02)
0.39 (0.09)
0.34, 0.35, 0.38 (0.01 to 0.02)
0.44 (0.06)
0.29 (0.05)
0.26 to 0.46 (0.03 to 0.08)
0.23 (0.02)
0.05 to 0.47 (0.06 to 0.15)
0.58 (0.09)
0.32, 0.41, 0.38 (<0.01)
Reference
Gjerlaug-Enger et al., 2012
Kogelman et al., 2013
Jones et al. (2004)2
Kvame and Vangen (2007)
Karamichou et al. (2006)
Kogelman et al. (2013)
Jones et al. (2004)
Kvame and Vangen (2007)
Karamichou et al. (2006)
Kogelman et al. (2013)
Kogelman et al. (2013)
Kvame and Vangen (2007)
Karamichou et al. (2006)
Kogelman et al. (2013)
Karamichou et al. (2006)
Maximini et al. (2012)
Caetano et al. (2013)
Lee et al. (2014)
Choi et al. (2013)
Karamichou et al. (2006)
Maximini et al.( 2012)
Jones et al., 2004
Kvame & Vangen, 2007
Maximini et al. (2012)
de Genova Gaya (2013)
Jiao et al. (2014)
Jones et al. (2004)
Kvame and Vangen (2007)
Maximini et al. (2012)
MacNeil and Northcutt (2008)
Caetano et al. (2013)
Lee et al. (2014)
Jiao et al. (2014)
Choi et al. (2013)
CT = computed tomography; DXA = dual-energy X-ray absorptiometry; US = ultrasound.
1
Many more studies with ‘US’ heritability estimates exist.
2
References before 2010 in Supplementary Material S1.
minute in vivo (Gjerlaug-Enger et al., 2012). Handling,
scanning and image analysis for one potential breeding boar
or gilt under performance testing takes, in the meantime,
only about 15 min. Image analysis is fully automated using
MatLab® (The MathWorks Inc., Natick, MA, USA) procedures, especially adapted to CT volume information. A total
of 24 boars tested per day is a routine application at TopigsNorsvin facilities. Information from 1100 slices per potential
breeding boar are processed for the body composition phenotypes like lean meat (kg, %), fat (kg, %), bone (kg, %),
primal cuts (kg), live and ‘carcass’ weight (kg), as well as
carcass yield (%) (Gjerlaug-Enger et al., 2012).
Slightly modified approaches serve for sheep selection
programs at the SRUC (Scotland, UK) in Edinburgh. Routine
application at the SRUC covers three important body regions
such as thorax (transversal slice at thoracic vertebra 8), loin
10
(lumbar vertebra 5) and gigot (ischium – back of the pelvis)
of breeding sheep (Bünger et al., 2011).
Maximini et al. (2012) compared genetic (across breeds)
parameters for phenotypes derived from either CT or US in
five Austrian sheep breeds. They found moderate h² estimates for US scan traits for eye muscle depth (0.28) and for
fat depth (0.29), whereas CT traits showed higher (across
breed) h 2 estimates for fat (0.36 and 0.40), but not for the
eye muscle area (0.24) (Table 4). Among other unknown
reasons, these slightly problematic across-breed heritability
estimates (Visscher et al., 2008) led Austrian sheep breeders
to abandon CT in favor for US (Fürst-Waltl and Grill, 2013).
In contrast with Maximini et al. (2012), Karamichou et al.
(2006) found, for all CT tissue areas, moderate-to-high heritability estimates between 0.23 and 0.76. The heritability
estimates for CT fat areas started at 0.5, whereas the
DXA, CT, MRI and US in farm animals
estimates for loin eye muscle area showed an average value
of 0.33 for the univariate model (Table 4). Meanwhile, sheep
breeders from New Zealand advocated the combination of
US and CT in a stage breeding design because ‘selection of
meat sheep on CT measurements will increase genetic progress, compared with selection on US measurements alone’
(Bünger et al., 2011). In this context, Moore et al. (2011)
demonstrated that, for sheep, combining CT with US scanning would increase the estimated breeding value (EBV)
accuracy by 6% to 20% in comparison with US scanning
alone, thus supporting the great benefit of CT. These calculations are derived from US prediction accuracies (R 2) in the
order of 0.65 and 0.50 for fat (kg) and muscle (kg), respectively, with heritabilities for US-measured muscle and fat
depth of 0.24 to 0.32 and 0.19 to 0.38, respectively (Jones
et al., 2004; Bünger et al., 2011; Mortimer et al., 2014),
whereas accuracies of CT-based predictions in meat sheep
for fat and muscle weight are significantly higher with
R 2 = 0.99 (r.s.d. = 434 g) and 0.97 (r.s.d. = 611 g),
respectively, combined with expected corresponding heritabilities between 0.4 and 0.5 (Young et al., 2001) or between
0.35 and 0.45 (Jones et al., 2004).
Neither DXA nor MRI are being actively used in commercial breeding programs so far, although Kogelman et al.
(2013) estimated ‘heritability’ estimates in a F2 pig population originating from crosses of Duroc or Yorkshire and
Göttinger Minipig. The heritability estimate for DXA lean
mass, of 0.71, is higher than that for DXA fat mass, of 0.43.
This observation corresponds with the order of the sheep CT
heritability estimates for lean and fat mass, with the exception of h² estimates for the Scottish Blackface (Table 4).
Harmonization and comparison of techniques
Reference (volume) phantoms could help making different CT
machines comparable (Christensen and Angel, 2013). The
same is true for DXA, because different machines within or
among different manufacturers use various settings in order
to measure the X-ray attenuation coefficient (R value) based
on the specific X-ray attenuation of body tissues for highand low-energy levels (Wood, 2004; Plank, 2005; Lösel et al.,
2010). It is even more difficult with MRI, because there
are no standardized signal intensities describing one or the
other tissue (Baulain and Henning, 2001; Mitchell et al.,
2001; Kremer et al., 2012 and 2013; Collewet et al.,
2013; Addeman et al., 2015; Pérez-Palacios et al., 2014). In
addition, not only the velocity of sound depends on the
surrounding temperature of body/carcass tissues but also
the attenuation of X-rays (Szabó and Babinszky, 2008), and
the electromagnetic patterns of protons lead to different
results for in vivo and postmortem (carcass) measurements
within the same animal.
The objective of all imaging techniques is to achieve an
optimum signal-to-noise ratio combined with small voxel
sizes for discrete image segmentation into the body tissues
(structures) of interest (Hanna and Cuschieri, 2001). Chemical
shift or partial volume effects must be considered when
interpreting the accuracy of MRI-derived body/carcass composition estimates (Monziols et al., 2005). Monziols et al. (2006)
found an increase in estimation accuracy (higher R 2, lower
residual standard deviation) for muscle or fat weight and percentage with an increase in body regions (slices) analyzed. If the
most relevant body regions are accounted for, or even the
whole body, according to the Cavaleri method, MRI, like CT
(and DXA), is a very useful tool for growth- or obesity-related
studies, because there is no need for serial slaughter anymore
(Cavaleri method: Gong et al., 2000; Glasbey and Robinson,
2002; Baulain et al., 2003; Mandarim-De-Lacerda, 2003; Vogt
et al., 2007; Szabó and Babinsky, 2009; Arthur et al., 2011).
Only a very few studies exist where DXA measurements
are being compared with MRI (Vogt et al., 2007; Brandberg, 2009; Bernau et al., 2015). Vogt et al. (2007) found a
relationship of R 2 = 0.95 between whole-body fat measurements performed by DXA (pencil-beam scanner) and
by MRI (1.5 T) in human probands, whereas DXA (GE
Lunar DPX-L) underestimated the total fat weights compared with both CT −5.23 kg (1.71 kg) and MRI −4.67 kg
(2.38 kg) in another study on human probands, summarized in the thesis by Brandberg (2009). Bernau et al.
(2015) showed for 20 intact boars that both, MRI and
DXA, can be used with high accuracy (R 2 = 0.88 or 0.91,
r.m.s.e. = 0.9% or 0.82%, respectively) to predict lean meat
percentage from dissection. The combination of both techniques resulted in an R 2 of 0.95 (with r.m.s.e. = 0.61%).
Mitchell and Scholz (2009) could additionally show that the
relationship between DXA measurements and the corresponding reference carcass traits was higher than the
relationship between US measurements and the same
corresponding reference carcass traits with a correlation
of r = − 0.85 (−0.87) for DXA lean % v. carcass fat % in
comparison with a corresponding relationship for US fat-free
mass % v. carcass fat %, with r = −0.69 (−0.74) for pigs
with a BW of 110 or 100 kg, respectively. These findings
were supported by Suster et al. (2004), who reported that
DXA measurement values are more closely related with
chemically determined carcass values than are carcass P2
back fat measurements performed using a ruler. DXA
(or whole-body/carcass MRI/CT) covers the total amount
or percentage of body fat or lean meat, whereas US- or
ruler-based back fat measurements can only account for
subcutaneous fat layers on a limited number of body regions,
and therefore cannot account for all the differences in the
distribution of fat layers when comparing different farm
animal breeds or genotypes, for example.
Table 5 summarizes studies with the ‘closest’ published
relationships between lean meat percentage (LMP) from
dissection and the four techniques (DXA, CT, MRI and US)
reviewed in this study. All data originate from pigs
(carcasses/in vivo) for two reasons. First, pigs still have a
relatively high variability in body or carcass composition,
especially in the subcutaneous fat layer, and, second, reasonable data for the four techniques in the review exist
mainly for pigs, followed by sheep and to some extent by
poultry or fish.
11
Scholz, Bünger, Kongsro, Baulain and Mitchell
Table 5 Comparison of non-invasive techniques (reference: lean meat % from dissection)
Accuracy (alone for pigs)
R2
Method
Reference tissue
CT
MRI
DXA
US
Lean meat (%)
Lean meat (%)
Lean meat (%)
Lean meat (%)
r.m.s.e.
R2
In vivo
Carcass
<0.99
<0.98
<0.91
<0.77
>0.54
>0.62
>0.82
>0.70
r.m.s.e.
<0.94
<0.87
<0.72
<0.53
>1.00
>1.20
>1.75
>1.95
Scan time whole body
X-radition exposure (mrem)
5 to 30 s
15 to 30 min
7 to 13 min
–
9 to 15
None
0.03 to 0.06
None
CT = computed tomography; MRI = magnetic resonance imaging; DXA = dual-energy X-ray absorptiometry; US = ultrasound.
Carcass: CT data from Judas et al. (2005), Romvari et al. (2006), Vester-Christensen et al. (2009), Monziols et al. (2013); MRI data from Baulain and Henning (2001),
Mitchell et al. (2001), Baulain et al. (2003), Collewet et al. (2005); Monziols et al. (2006); DXA data from Bernau et al. (2015); Dunshea et al. (2007) (ewes and wheters:
% chemical lean: R 2 = 0.94); and US data from Branscheid et al. (2011).
In vivo: CT data from Romvari et al. (2005) (no error terms provided); MRI data from Baulain and Henning (2001) (R 2 = 0.91, r.m.s.e. = 1.90% in lambs), Mitchell et al.
(2001), Scholz (2002); DXA data from Scholz and Förster (2006), Mitchell et al. (2002) (pigs: R² = 0.84 for chemical lean %); and US data from Youssao et al. (2002),
Doeschl-Wilson et al. (2005).
References before 2010 in Supplementary Material S1.
Table 6 Advantages and disadvantages of non-invasive techniques for the determination of body or carcass composition
Dual-energy X-ray absorptiometry (DXA)
Computed tomography (CT)
Magnetic resonance imaging (MRI)
Ultrasound imaging (US)
Advantages
Disadvantages
Easy handling
Low radiation
Medium price
Quick data analysis
Regional data analysis
Very high anatomical resolution
High speed
Whole-body 3D data
Automatic data analysis
Excellent soft tissue differentiation
Whole-body 3D data
Functional imaging
No radiation
Portable, extensive database for some species
Reasonably priced
No radiation
Real time, online
No size limit, no sedation/anesthesia
Alone 2D information (so far)
No direct data for lean meat (in vivo)
Conclusion for imaging/non-invasive methods
If sufficient automatic procedures are available, the ‘Cavalieri’
method, or even better a whole-body scan, is the preferred
CT or MRI imaging procedure, because whole-body information does not require breed, species or age-/weight-specific
prediction equations.
For performance testing, a combination of the various methods
listed below might be optimal based on cost and accuracy:
(1) If radiation and the high investment price are not an
issue, then use a ‘New Generation’ spiral, multi-slice CT
for the measurement of body/carcass composition.
(2) If 3D information (e.g. carcass cuts, muscle or fat
volumes) is not required, use DXA.
(3) If radiation is an issue, use MRI. Anesthesia is required in
most cases (1–3)!
12
X-radiation exposure
Expensive
Expensive (if high field strength magnet)
Rather slow (whole body)
Availability (farm animal sector)
Less accurate anatomical resolution
Image analysis not easily automated
No whole-body information
(4) If a ‘quick’ and ‘easy’ answer is the objective, use
A-mode US and for little more B-mode. In all cases (1–4),
a scale is very useful!
According to Kallweit (1992), one could still conclude that
‘There are advantages and disadvantages of individual systems in their present state...’ as summarized in Table 6. ‘...
The rapid progress in technical development may lead to
further improvements in the future.’ Actually, nothing has
changed in the past 20 years .
Present and potential future applications – non-invasive
measurements of new exactly measured ‘phenotypes’ to be
associated with new ‘genotypes’ and/or fairer payment types
The future of non-invasive techniques or imaging will certainly
consider ‘new’ phenotypes, which are of interest for animal
DXA, CT, MRI and US in farm animals
breeders, and need attention for next generations of farm animals, such as lean meat and fat deposition efficiency (Martinsen
et al., 2014). Most often these will be traits, which could not be
recorded routinely without the application of non-invasive techniques like, for example, traits related to leg health. New selectable leg health traits could be bone mineral content or bone
mineral density derived by DXA and/or CT (Charuta et al., 2012;
Laenoi et al., 2012; Rangkasenee et al., 2013, Rothammer et al.,
2014) or osteochondrosis scores as suggested by Aasmundstad
et al. (2013), with a promising heritability estimate of 0.31
(±0.09). Several groups are already trying to implement meat and
partially fat quality (water proportion in fat) measurements
in vivo. Beef cattle breeders have been using US imaging in order
to measure muscle marbling for several years now, whereas CT
scanning is being studied in order to measure the IMF content in
sheep and pigs during performance testing in vivo, without
sacrificing the potential high EBV sire or dam breeding animals.
More futuristic, but not less relevant, traits could be the volume of
(internal) organs as an indicator of the metabolic capacity of
breeding animals or a number of morphological traits under
indirect selection pressure by present or future breeding objectives (Kongsro personal communication 2012 to 2014, Carabús
et al., 2013). Bünger (personal communication 2013 and 2014)
suggests to including more 3D information about muscularity of
the gigot, as well as the longissimus dorsi muscles or other body
parts, for UK sheep breeding programs. Other traits could be, for
example, the number of vertebrae counted using CT (Donaldson
et al., 2013), the gut or rumen size as an indicator of greenhouse
gas output (Goopy et al., 2014) and, for example, pelvic dimensions as indictors for ease of lambing.
In addition, the combination of exact phenotypic data
derived from non-invasive techniques in combination with
(whole) genome data will provide more knowledge and
deeper insight into the control of growth and body/carcass
composition of farm animals (Cavanagh et al., 2010;
Rothammer et al., 2014). In particular, phenotypic traits,
which are difficult and expensive to measure as the ones
derived from the non-invasive techniques discussed in this
review, will provide extra value for genomic selection (Hayes
et al., 2013).
In general, it seems that non-invasive (imaging) methods
have become common practice in the growing scientific
community and partly in breeding organizations and abattoirs, like the development of an on-line CT for carcass
classification in Denmark.
Acknowledgments
This invited review is based on an invited presentation at the
64rd Annual Meeting of the European Association for Animal
Production held in Nantes, France, August 2013, and has been
supported by the EU COST action FA1102 (FAIM).
Supplementary material
To view supplementary material for this article, please visit
http://dx.doi.org/10.1017/S1751731115000336.
References (Since 2010)2
Aasmundstad T, Kongsro J, Wetten M, Dolvik NI and Vangen O 2013. Osteochondrosis in pigs diagnosed with computed tomography: heritabilities and
genetic correlations to weight gain in specific age intervals. Animal 7, 1576–
1582.
Addeman BT, Kutty S, Perkins TG, Soliman AS, Wiens CN, McCurdy CM, Beaton
MD, Hegele RA and McKenzie CA 2015. Validation of volumetric and single-slice
MRI adipose analysis using a novel fully automated segmentation method.
Journal of Magnetic Resonance Imaging 41, 233–241.
Anton I, Zsolnai A, Holló I, Repa I and Holló G 2013. Effect of TG gene polymorphism on the intramuscular fat content in cattle examined by CT and Soxhlet
methods. Archiv Tierzucht 56, 59–66.
Arthur PF, Barchia IM, Giles LR and Eamens GJ 2011. Chemical composition
of growing pigs and its relationship with body tissue composition assessed
by X-ray-computed tomography. Journal of Animal Science 89, 3935–
3944.
Ayuso D, González A, Hernández F, Corral JM, Izquierdo M 2013. Prediction of
carcass composition, ham and foreleg weights, and lean meat yields of Iberian
pigs using ultrasound measurements in live animals. Journal of Animal Science
91, 1884–1892.
Barbero A, Astiz S, Lopez-Bote CJ, Perez-Solana ML, Ayuso M, Garcia-Real I and
Gonzalez-Bulnes A 2013. Maternal malnutrition and offspring sex determine
juvenile obesity and metabolic disorders in a swine model of leptin resistance.
Public Library of Science ONE 8, e78424.
Baulain U 2013. Body composition of farm animals by MRI. In Farm animal
imaging Dublin 2012 (ed. C Maltin, C Craigie and L Bünger), pp. 16–19. Quality
Meat Scotland, Ingliston, UK.
Baulain U, Schön A, Brandt H and Brade W 2011. Leistungsstand der niedersächsischen Schafzucht dargestellt anhand von Ergebnissen der stationären
Nachkommenprüfung von 1993 bis 2007. Züchtungskunde 83, 439–450.
Bernau M, Kremer PV and Scholz AM 2013. Vergleich der Körperzusammensetzung von Schweinen bei 80 kg und 100 kg Lebendmasse mittels
Magnetresonanztomographie. Züchtungskunde 85, 430–439.
Bernau M, Kremer PV, Lauterbach E, Tholen E, Pappenberger E and Scholz AM
2015. Evaluation of carcass composition of intact boars using linear measurements from performance testing, dissection, dual energy X-ray absorptiometry
(DXA) and magnetic resonance imaging (MRI). Meat Science. doi:10.1016/j.
meatsci.2015.01.011; in press.
Bonin MN, Ferraz JBS, Silva SL, Gomes RC, Cucco DC, Silva Neto PZ, Santana ML
Jr, Eler JP, Oliveira ECM, Pedrosa VB, Oliveira PS and Groeneveld E 2010.
Genetic parameters for body measurements and ultrasound carcass traits in
Nellore cattle. Proceedings 9th World Congress on Genetics Applied to Livestock
Production, Leipzig, DE.
Branscheid W, Judas M and Höreth R 2011. Zur Klassifizierung von Schweinehälften: Neue Schätzformeln und neue Geräte. Mitteilungsblatt Fleischforschung
Kulmbach 50, 9–28.
Bünger L, Macfarlane JM, Lambe NR, Conington J, McLean KA, Moore K,
Glasbey CA and Simm G 2011. Use of X-ray computed tomography (CT) in UK
sheep production and breeding. CT scanning – techniques and applications (ed.
S Karuppasamy), pp. 329–348. INTECH Europe, Rijeka, Croatia.
Caetano SL, Savegnago RP, Boligon AA, Ramos SB, Chud TCS, Lôbo RB and
Munari DP 2013. Estimates of genetic parameters for carcass growth and
reproductive traits in Nellore cattle. Livestock Science 155, 1–7.
Carabús A, Gispert M, Muñoz I, Čandek-Potokar M and Font-i-Furnols M 2013.
Testes characteristics of entire and immunocastrated male pigs from 30 to
120 kg live weight measured in vivo with computed tomography. In Farm animal
imaging Kaposvar 2013 (ed. C Maltin, C Craigie and L Bünger), pp. 38–41.
Quality Meat Scotland, Ingliston, UK.
Case LA, Wood BJ and Miller SP 2012. The investigation of ultrasound
technology to measure breast muscle depth as a correlated trait to breast
meat yield in turkey (Meleagris gallopavo). Journal of Animal Science 90,
3410–3417.
Cavanagh CR, Jonas E, Hobbs M, Thomson PC, Tammen I and Raadsma
HW 2010. Mapping quantitative trait loci (QTL) in sheep. III. QTL for carcass
composition traits derived from CT scans and aligned with a meta-assembly
for sheep and cattle carcass QTL. Genetics Selection Evolution 42, 36.
2
References before 2010 in Supplementary Material S1.
13
Scholz, Bünger, Kongsro, Baulain and Mitchell
Chang J, Jung J, Lee H, Chang D, Yoon J and Choi M 2011. Computed tomographic evaluation of abdominal fat in minipigs. Journal of Veterinary Science
12, 91–94.
Charuta A, Cooper RG, Pierzchała M and Horbańczuk JO 2012. Computed
tomographic analysis of tibiotarsal bone mineral density and content in turkeys
as influenced by age and sex. Czech Journal of Animal Science 57, 573–580.
Choi JG, Cho CI, Choi IS, Lee SS, Choi TJ, Cho KH, Park BH and Choy YH 2013.
Genetic parameter estimation in seedstock swine population for growth
performances. Asian-Australasian Journal of Animal Sciences 26, 470–475.
Christensen LB and Angel JAB 2013. Inter-laboratory comparison of medical
computed tomography (CT) scanners for industrial applications in the slaughterhouses. In Farm animal imaging Kaposvar 2013 (ed. C Maltin, C Craigie and
L Bünger), pp. 27–32. Quality Meat Scotland, Ingliston, UK.
Clelland N, Bünger L, McLean KA, Knott S and Lambe NR 2013. Prediction of
intramuscular fat in Texel lamb loins using different x-ray computed tomography
(CT) scanning techniques. In Farm animal imaging Kaposvar 2013 (ed. C Maltin,
C Craigie and L Bünger), pp. 53–56. Quality Meat Scotland, Ingliston, UK.
Collewet G, Bugeon J, Idier J, Quellec S, Quittet B, Cambert M and Haffray P
2013. Rapid quantification of muscle fat content and subcutaneous adipose
tissue in fish using MRI. Food Chemistry 138, 2008–2015.
Culjat MO, Goldenberg D, Tewari P and Singh RS 2012. A review of tissue substitutes
for ultrasound imaging. Ultrasound in Medicine and Biology 36, 861–873.
Daumas G, Donko T and Monziols M 2013. Identification of possible and relevant post mortem reference methods for carcass composition. In Farm animal
imaging Kaposvar 2013 (ed. C Maltin, C Craigie and L Bünger), pp. 14–17.
Quality Meat Scotland, Ingliston, UK.
de Genova Gaya L 2013. Genetic variability in ultrasound records of breast
muscle in a broiler breeding program. Natural Science 5, 1–4.
Donaldson CL, Lambe NR, Maltin CA, Knott S and Bunger L 2013. Between and
within breed variations of spine characteristics in sheep. Journal of Animal
Science 91, 995–1004.
Elzo MA, Johnson DD, Lamb GC, Maddock TD, Myer RO, Riley DG, Hansen GR,
Wasdin JG and Driver JD 2010. Heritabilities and genetic correlations between
postweaning feed intake, growth, and ultrasound traits in a multibreed AngusBrahman cattle population in the subtropics. Proceedings of the 9th World
Congress on Genetics Applied to Livestock Production, Leipzig, DE.
Grosso JLBM, Eler JP, Balieiro JCC, Ferraz JBS, Mattos EC and Michelan Filho T
2010. Genetic correlation for real-time ultrasound and fleshing of breast muscle
with carcass traits in broilers. Proceedings of the 9th World Congress on
Genetics Applied to Livestock Production, Leipzig, DE.
Gyovai P, Nagy I, Gerencsér Z, Matics Z, Radnai I, Donkó T, Bokor Á, Farkas J and
Szendrő Z 2012. Genetic parameters for litter weight, average daily gain and
thigh muscle volume measured by in vivo computer tomography technique in
Pannon White rabbits. Livestock Science 144, 119–123.
Halliwell M 2010. A tutorial on ultrasonic physics and imaging techniques.
Journal of Engineering in Medicine 224, 127–142.
Harangi S 2013. Application of ultrasound measurement technique to evaluate
the meat producing ability and carcass value of beef cattle. PhD Thesis,
University of Debrecen, Hungary.
Hausman GJ, Basu U, Du M, Fernyhough-Culver M and Dodson MV 2014.
Intermuscular and intramuscular adipose tissues – bad v. good adipose tissues.
Adipocyte 3 (4), 1–14.
Hayes BJ, Lewin HA and Goddard ME 2013. The future of livestock breeding:
genomic selection for efficiency, reduced emissions intensity, and adaptation.
Trends in Genetics 29, 206–214.
Haynes FEM, Greenwood PL, Siddell JP, McDonagh MB and Oddy VH 2010.
Computer tomography software program ‘Osirix’ aids prediction of sheep body
composition. Proceedings of the Australian Society of Animal Production 28, 49.
Ho H, Hunter P and Pearson G 2013. Parametric representation of lamb carcasses based on computed tomography (CT) images. In Farm animal imaging
Kaposvar 2013 (ed. C Maltin, C Craigie and L Bünger), pp. 76–79. Quality Meat
Scotland, Ingliston, UK.
Holló G, Barna B and Nuernberg K 2014. Characterisation of carcass composition and meat quality of male suckling buffalo calves kept on natural grassland.
Archiv Tierzucht 56, 107.
Hunter TE, Suster D, Dunshea FR, Cummins LJ, Egan AR and Leury BJ 2011. Dual
energy X-ray absorptiometry (DXA) can be used to predict live animal and whole
carcass composition of sheep. Small Ruminant Research 100, 143–152.
Jay NP, van de Ven RJ and Hopkins DL 2013. Relationship in lambs between lean
weight estimated using CT scanning and VIASCAN®. Proceedings of the 59th
International Congress of Meat Science and Technology, August 18–23, Izmir,
Turkey.
Emenheiser JC, Greiner SP, Lewis RM and Notter DR 2010. Longitudinal changes
in ultrasonic measurements of body composition during growth in Suffolk ram
lambs and evaluation of alternative adjustment strategies for ultrasonic
scan data. Journal of Animal Science 88, 1341–1348.
Jeyaruban MG and Johnston DJ 2014. Estimated additive and non-additive
breed effects and genetic parameters for ultrasound scanned traits of a multibreed beef Population in tropical Australia. Proceedings of the 10th World
Congress of Genetics Applied to Livestock Production, Vancouver, CA.
England JA, Salas C, Ekmay RD and Coon CN 2012. Dual energy X-ray absorptiometry analysis of broiler breeder eggs for prediction of egg components and
evaluation of egg shell quality. International Journal of Poultry Science 11, 316–325.
Jiao S, Maltecca C, Gray KA and Cassady JP 2014. Feed intake, average daily
gain, feed efficiency, and real-time ultrasound traits in Duroc pigs: I. Genetic
parameter estimation and accuracy of genomic prediction. Journal of Animal
Science 92, 2377–2386.
Font-i-Furnols M, Brun A, Tous N and Gispert M 2013. Use of linear regression
and partial least square regression to predict intramuscular fat of pig loin
computed tomography images. Chemometrics and Intelligent Laboratory Systems
122, 58–64.
Frisullo P, Marino R, Laverse J, Albenzio M and Del Nobile MA 2010. Assessment
of intramuscular fat level and distribution in beef muscles using X-ray microcomputed tomography. Meat Science 85, 250–255.
Fulladosa E, Santos-Garcés E, Picouet P and Gou P 2010. Prediction of salt and
water content in dry-cured hams by computed tomography. Journal of Food
Engineering 96, 80–85.
Fürst-Waltl B and Grill L 2013. Prerequisites for the implementation of a
breeding value prediction for sheep. Universität für Bodenkultur, Wien, Austria.
Retrieved April 24, 2014, from https://www.dafne.at/dafne_plus_homepage/
download.php?t=ProjectReportAttachment&k=3248.
Gaunt AP, Morris RH and Newton MI 2013. Magnetic resonance imaging: a tool
for pork pie development. Foods 2, 393–400.
Gjerlaug-Enger E, Nordbø Ø and Grindflek E 2014. Genomic selection in pig
breeding for improved meat quality. Proceedings of the 10th World Congress of
Genetics Applied to Livestock Production, Vancouver, CA.
Gjerlaug-Enger E, Kongsro J, Ødegard J, Aass L and Vangen O 2012. Genetic
parameters between slaughter pig efficiency and growth rate of different body
tissues estimated by computed tomography in live boars of Landrace and Duroc.
Animal 6, 9–18.
Goopy JP, Donaldson A, Hegarty R, Vercoe PE, Haynes F, Barnett M and Hutton
Oddy V 2014. Low-methane yield sheep have smaller rumens and shorter rumen
retention time. British Journal of Nutrition 111, 578–585.
14
Judas M and Petzet A 2013. Statistical dissection – for which tissues does PLS
regression work? In Workshop on Farm Animal and Food Quality Imaging, DTU
Compute Technical Report‐2013‐12, Espoo, Finland, June 17, 11–16.
Kogelman LJA, Kadarmideen HN, Mark T, Karlskov-Mortensen P, Bruun CS,
Cirera S, Jacobsen MJ, Jørgensen CB and Fredholm M 2013. An F2 pig resource
population as a model for genetic studies of obesity and obesity-related diseases
in humans: design and genetic parameters. Frontiers in Genetics | Livestock
Genomics 4, 1–14.
Kongsro J and Gjerlaug-Enger E 2013. In vivo prediction of intramuscular
fat in pigs using computed tomography. Open Journal of Animal Sciences 3,
321–325.
Kremer PV 2013. In vivo Phänotypisierung von Schlachtkörpermerkmalen bei
Schwein und Schaf mittels Magnetresonanztomographie. Habilitation thesis,
University of Munich, DE.
Kremer PV, Förster M and Scholz AM 2013. Use of magnetic resonance imaging
(MRI) to predict the body composition of pigs in vivo. Animal 7, 879–884.
Kremer PV, Fernández Fígares I, Förster M and Scholz AM 2012. In vivo body
composition in autochthonous and conventional pig breeding groups by dual
energy X-ray absorptiometry and magnetic resonance imaging under special
consideration of Cerdo Ibérico. Animal 6, 2041–2047.
Laenoi W, Rangkasenee N, Uddin MJ, Cinar MU, Phatsara C, Tesfaye D, Scholz
AM, Tholen E, Looft C, Mielenz M, Sauerwein H, Wimmers K and Schellander K
2012. Association and expression study of MMP3, TGFβ1 and COL10A1 as
candidate genes for leg weakness-related traits in pigs. Molecular Biology
Reports 39, 3893–3901.
DXA, CT, MRI and US in farm animals
Laursen LF, Bærentzen JA, Igarashi T, Petersen MK, Clemmensen LKH, Ersbøll BK
and Christensen LB 2013. PorkCAD: case study of the design of a pork product
prototype. In Proceedings of the 5th International Congress of International
Association of Societies of Design Research, Tokyo, Japan, August 26–30. Retrieved
February 19, 2015, from http://design-cu.jp/iasdr2013/papers/1134-1b.pdf.
(ed. C Maltin, C Craigie and L Bünger), pp. 18–21. Quality Meat Scotland,
Ingliston, UK.
Lee JH, Lee YM, Oh S-H, Son HJ, Jeong DJ, Whitley N and Kim JJ 2014. Estimation
of genetic parameters for real-time ultrasound measurements for Hanwoo cows
at different ages and pregnancy status. Asian Australasian Journal of Animal
Science 27, 155–160.
Pérez-Palacios T, Caballero D, Caro A, Rodríguez PG and Antequera T 2014.
Applying data mining and computer vision techniques to MRI to estimate quality
traits in Iberian hams. Journal of Food Engineering 131, 82–88.
Ley C 2013. Pig genetics is all about sustainable profitability. Pig International
43, 4–7.
Liao JJZ and Capen R 2011. An improved Bland-Altman method for concordance
assessment. The International Journal of Biostatistics 7, Art. 9, 1–17.
Lösel D, Kremer P, Albrecht E and Scholz AM 2010. Comparison of a GE Lunar
DPX-IQ and a Norland XR-26 dual energy X-ray absorptiometry scanner for body
composition measurements in pigs – in vivo. Archiv Tierzucht 53, 162–175.
Magnusson M, Malusek A, Muhammad A and Alm Carlsson G 2011. Determination of quantitative tissue composition by iterative reconstruction on 3D DECT
volumes. Proceedings of the 11th International Meeting on Fully ThreeDimensional Image Reconstruction in Radiology and Nuclear Medicine, Potsdam, DE, 120–123.
Pathak V, Singh VP and Sanjay Y 2011. Ultrasound as a modern tool for carcass
evaluation and meat processing: a review. International Journal of Meat Science
1, 83–92.
Picouet PA, Teran F, Gispert M, Font-i-Furnols M 2010. Lean content prediction
in pig carcasses, loin and ham by computed tomography (CT) using a
density model. Meat Science 86, 616–622.
Pillen S and van Alfen N 2011. Skeletal muscle ultrasound. Neurological
Research 33, 1016–1024.
Pinheiro TR, Mercadante MEZ, Albuquerque LG, Cyrillo JNSG and Branco RH
2011. Phenotypic and genetic parameters compared during repeated measures
of longissimus muscle area and subcutaneous fat thickness in Nelore cattle.
Genetics and Molecular Research 10, 2944–2952.
Rangkasenee N, Murani E, Brunner R, Schellander K, Scholz AM, Luther H,
Hofer A, Ponsuksili S and Wimmers K 2013. KRT8, FAF1 and PTH1R gene
polymorphisms are associated with leg weakness traits in pigs. Molecular
Biology Reports 40, 2859–2866.
Maignel L, Daigle JP, Gariépy C, Wilson D and Sullivan B 2010. Prediction
of intramuscular fat in live pigs using ultrasound technology and potential use
in selection. Proceedings of the 9th World Congress on Genetics Applied to
Livestock Production, Leipzig, DE.
Ravagnolo O, Brito G, Aguilar I, Ciappesoni G and Lema M 2010. Genetic
parameters for ultrasound live traits in pasture fed Angus cattle. Proceedings of
the 9th World Congress on Genetics Applied to Livestock Production, Leipzig, DE.
Martinsen KH, Ødegård J, Olsen D and Meuwissen THE 2014. Genetic variation
in efficiency to deposit lean meat and fat in Norwegian Landrace pigs.
Proceedings of the 10th World Congress of Genetics Applied to Livestock
Production, Vancouver, Canada.
Ribeiro FRB, Tedeschi LO, Rhoades RD, Smith SB, Martin SE and Crouse SF 2011.
Evaluating the application of dual X-ray energy absorptiometry to assess dissectible and chemical fat and muscle from the 9th-to-11th rib section of
beef cattle. The Professional Animal Scientist 27, 472–476.
Maximini L, Brown DJ, Baumung R and Fuerst-Waltl B 2012. Genetic parameters
of ultrasound and computer tomography scan traits in Austrian meat sheep.
Livestock Science 146, 168–174.
Milisits G, Donkó T, Dalle Zotte A, Sartori A, Szentirmai E, Emri M, Opposits G,
Orbán A, Pőcze O, Repa I and Sütő Z 2013. Application of computed tomography to assess the effect of egg yolk ratio on body composition in chickens of
different genotype and gender at hatch and during the rearing period. British
Poultry Science 54, 611–619.
Rothammer S, Kremer PV, Bernau M, Fernandez-Figares I, Pfister-Schär J,
Medugorac I and Scholz AM 2014. Genome-wide QTL-mapping of nine body
composition and bone mineral density traits in pigs. Genetics Selection Evolution
46, 68.
Mitchell AD, Ramsay TG and Scholz AM 2012. Measurement of changes in body
composition of piglets from birth to 4 kg using quantitative magnetic
resonance (QMR). Archiv Tierzucht 55, 64–67.
Monziols M, Rossi A and Daumas G 2013. Impact of pig population (light or
heavy) on computed tomography (CT) and dissection relationship for lean meat
percentage measurement. In Farm animal imaging Kaposvar 2013 (ed. C Maltin,
C Craigie and L Bünger), pp. 22–26. Quality Meat Scotland, Ingliston, UK.
Moore K, McLean KA and Bunger L 2011. The benefits of computed tomography
(CT) scanning in UK sheep flocks for improving carcase composition. Proceedings of the British Society of Animal Science and the Association of Veterinary
Teaching and Research Work, April 4–5, Nottingham. Advances in Animal
Biosciences 2, 10.
Mortimer SI, Swan AA, Brown DJ and van der Werf JHJ 2014. Genetic parameters
revisited for ultrasound scanning traits in Australian sheep. Proceedings of the 10th
World Congress of Genetics Applied to Livestock Production, Vancouver, CA.
Nagy I, Gyovai P, Radnai I, Matics Z, Gerencsér Z, Donkó T and Szendrő Z 2010.
Genetic parameters of growth in vivo CT based and slaughter traits in Pannon
white rabbits. Proceedings of the 9th World Congress on Genetics Applied to
Livestock Production, Leipzig, DE.
Navajas EA, Richardson RI, Fisher AV, Hyslop JJ, Ross DW and Prieto N 2010.
Predicting beef carcass composition using tissue weights of a primal cut assessed by computed tomography. Animal 4, 1810–1817.
OECD/Food and Agriculture Organization of the United Nations 2014. OECDFAO agricultural outlook 2014. OECD Publishing, 2, rue André-Pascal, 75775
PARIS CEDEX 16. Retrieved February 19, 2015, from http://dx.doi.org/10.1787/
agr_outlook-2014-en.
Olsen EV and Christensen LB 2013. Comparison of accuracy of reference methods
based on CT and manual dissection. In Farm animal imaging Kaposvar 2013
Salas C, Ekmay RD, England J, Cerrate S and Coon CN 2012. Determination of
chicken body composition measured by dual energy X-ray absorptiometry.
International Journal of Poultry Science 11, 462–468.
Scholz AM and Mitchell AD 2010. Body composition: indirect measurement. In
Encyclopedia of animal science, 2nd edition. (ed. DE Ullrey, CK Baer and WG
Pond), pp. 152–156. CRC Press, Boca Raton, FL, USA.
Scholz AM, Kremer PV, Wenczel R, Pappenberger E and Bernau M 2013. Body
composition in farm animals by dual energy X-ray absorptiometry. In Farm
animal imaging Dublin 2012 (ed. C Maltin, C Craigie and L Bünger), pp. 9–14.
Quality Meat Scotland, Ingliston, UK.
Simeonova ML, Todorov NA and Schinckel AP 2012. Review of in vivo-methods
for quantitative measurement of protein deposition rate in animals with
emphasize on swine. Bulgarian Journal of Agricultural Science 18, 455–481.
Szendrő Z, Metzger S, Nagy I, Szabó A, Petrási Z, Donkó T and Horn P 2012.
Effect of divergent selection for the computer tomography measured thigh
muscle volume on productive and carcass traits of growing rabbits. Livestock
Science 149, 167–172.
Szentirmai E, Milisits G, Donkó T, Budai Z, Ujvári J, Fülöp T, Repa I and Sütő Z
2013. Comparison of changes in production and egg composition in relation to
in vivo estimates of body weight and composition of brown and white egg layers
during the first egg-laying period. British Poultry Science 54, 587–593.
Van de Sompel D, Sasportas LS, Dragulescu-Andrasi A, Bohndiek S and Gambhir
SS 2012. Improving image quality by accounting for changes in water temperature during a photoacoustic tomography scan. Public Library of Science ONE
7, e45337.
Wang ZM, Heymsfield SB, Chen Z, Zhu S and Pierson RN 2010. Estimation of
percentage body fat by dual-energy x-ray absorptiometry: evaluation by in
vivo human elemental composition. Physics in Medicine and Biology 55,
2619–2635.
Zurl B, Tiefling R, Winkler P, Kindl P and Kapp KS 2014. Hounsfield units variations: impact on CT-density based conversion tables and their effects on dose
distribution. Strahlentherapie und Onkologie 190, 88–93.
15


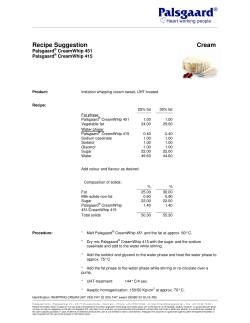
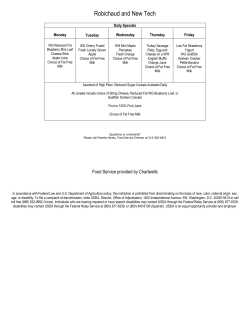


© Copyright 2026