
2014 County Commissioner Satisfaction Survey:
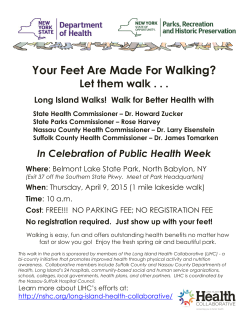
2014 County Commissioner
Satisfaction Survey:
CSU Extension Services in Colorado
Survey Results Summary Report
April 2015
Colorado State University Extension
2014 County Commissioner Survey Results
Introduction: 2014 County Commissioner Survey
The seventh annual County Commissioner Satisfaction Survey was conducted from September
22 to October 31, 2014. The design and methodology were approved by the CSU Research
Integrity and Compliance Review Office in 2012. A five-point scale was used for evaluation.
The variables studied included: (1) the quality of programs and services provided by local
Extension offices; (2) the expertise and knowledge of Extension personnel; (3) the
responsiveness and service level of county Extension personnel; (4) the perceived value to
citizens of Extension programs and services; and (5) respondent insights and comments
regarding CSU Extension.
Methodology
While the survey was designed by CSU Extension and the Office of the Vice President of
Engagement, the survey was conducted by an independent contractor for the Office of
Engagement. The confidential survey protocol allowed survey administrators to see which
counties did and did not respond. Participants received a letter directly from the President
containing the link to take the survey online. A hard copy of the survey and a pre-paid return
envelope were also enclosed, offering the choice to complete a paper survey. The letter stressed
the importance of the input, the confidential nature of the survey and the voluntary nature of the
survey. Roughly two weeks after the initial letter, a second reminder letter and second hard copy
survey were sent from the Chief of Staff, Office of the President, only to those counties that did
not respond. A final email reminder from Colorado Counties, Inc. was sent on behalf of CSU,
also only to counties that had not yet responded. All results were received, compiled, and
analyzed by the independent contractor.
Surveys are sent annually to all Colorado county commissioners/council members in counties
where CSU has Extension offices or provides Extension services. The survey cover letter and
email, however, recommend that only commissioners who have contact with and/or knowledge
of CSU Extension complete the survey. As many counties appoint one commissioner or council
member to serve as the Extension liaison, this means that not every commissioner is expected to
complete the CSU Extension survey.
Per-county responses (N = 51) are calculated using the mean of all commissioner responses for
that county. As begun in 2010, data is reported here as per-county response. Where relevant,
commissioner responses (N = 86) are also reported in this document. Each graphic indicates the
type of data calculation used.
A total of 213 surveys were sent to all commissioners/council members in counties where CSU
has Extension offices or provides Extension services. Commissioners were encouraged to
complete the survey if they worked with Extension, or to forward the survey to the appropriate
commissioner contact if they did not work personally with Extension. The total number of
returned surveys was 86, for an overall response rate of 40%.
The per-county response rate was 82%, with 51 of the 62 counties surveyed by CSU extension
responding (Lake and San Juan, two new service counties, chose not to participate in the 2014
survey and will participate in 2015). Response rates by region were also strong: Front Range
1
Colorado State University Extension
2014 County Commissioner Survey Results
region (Front Range urban corridor), 83%; Eastern Peaks and Plains region (Southeast, Northeast
Golden Plains, and the San Luis Valley), 87%; Western region (all Western Slope counties),
75%. Counties that did not respond to the survey were: Adams, Conejos, Costilla, Custer,
Douglas, Garfield, Moffat, Otero, Ouray, Pitkin and Rio Blanco.
Two additional surveys were received after the postmarked deadline. These surveys were
excluded from the following analysis.
Summary of 2014 Survey Results
Overall, commissioners responded favorably to questions about Extension program value and
quality, and agent expertise and responsiveness. Comparisons between commissioner level and
county level data reveal no statistically significant differences, indicating a trend toward
consistent scoring with no extreme highs or lows. Scores tend to cluster tightly at the positive
end of the scale. Comments indicate that lower scores are likely tied to desires for additional
services and related funding needs and/or better agent coverage.
Survey Results: 2013–2014 Key Indicator Comparison of County Responses
As begun in 2010, data is analyzed primarily at the county level. This standardizes any potential
systematic bias caused by some counties having a larger number of commissioners respond
versus a county in which the Board of Commissioners assigns only one member to respond to the
survey. This methodology levels the playing field and allows for a survey of county attitudes and
satisfaction, rather than county commissioner attitudes and satisfaction.
Overall, counties responded favorably to questions about program quality, value, responsiveness,
and overall satisfaction. We compared 2014 data on four key indicators to 2013 data and found
that key indicators for quality, responsiveness, and overall satisfaction trend slightly higher in
2014, while value trends slightly lower. These trends can be seen in both the averaged scores and
in the graphs of individual responses below. All four score have trended consistently high since
2012; in 2014, three of four median scores are above 4.0 on a 5-point scale.
The four key indicators are graphed below for both 2014 and 2013 county responses. This
includes the “overall satisfaction” question used to indicate mean satisfaction with CSU
Extension. In aggregate, “Acceptable” ratings decreased in 2014, but so did “Excellent” ratings.
This will be an area for follow-up conversations.
2
Colorado State University Extension
2014 County Commissioner Survey Results
Rate the quality of the programs and services provided from your local Extension office.
2014 Quality of Programs/Services
28
County Level Mean = 4.07
N= 50 Counties
10
1
1
Poor
Below
Acceptable
10
Acceptable
Above
Acceptable
Excellent
2013 Quality of Programs/Services
County Level Mean = 4.01
N= 55 Counties
18
18
Acceptable
Above
Acceptable
17
2
0
Poor
Below
Acceptable
Excellent
3
Colorado State University Extension
2014 County Commissioner Survey Results
How would you rate the value received by the citizens of your county from programs and
services delivered by Extension?
2014 Value Received by Citizens
19
18
County Level Mean = 3.83
N= 49 Counties
9
3
0
Not
Valuable
Somewhat
Valuable
Valuable
Very
Valuable
Highly
Valued
2013 Value Received by Citizens
County Level Mean = 3.86
N= 54 Counties
17
18
14
5
0
Not
Valuable
Somewhat
Valuable
Valuable
Very
Valuable
Highly
Valued
4
Colorado State University Extension
2014 County Commissioner Survey Results
Rate the responsiveness and service level of your county Extension personnel in meeting the
needs of your county citizens.
2014 Responsiveness & Service Level
County Level Mean = 4.03
N= 48 Counties
21
13
1
1
Poor
Below
Acceptable
12
Acceptable
Above
Acceptable
Excellent
2013 Responsiveness & Service Level
County Level Mean = 3.90
N= 54 Counties
23
18
11
0
Poor
2
Below
Acceptable
Acceptable
Above
Acceptable
Excellent
5
Colorado State University Extension
2014 County Commissioner Survey Results
Rate your overall satisfaction with the service the citizens receive from your local county/area
Extension office.
2014 Overall Satisfaction
County Level Mean = 4.01
N= 48 Counties
23
13
10
0
Poor
2
Below
Acceptable
Acceptable
Above
Acceptable
Excellent
2013 Overall Satisfaction
County Level Mean = 3.94
N= 54 Counties
23
18
12
0
Poor
1
Below
Acceptable
Acceptable
Above
Acceptable
Excellent
6
Colorado State University Extension
2014 County Commissioner Survey Results
Survey Results: Commissioner Level Data on Program Value and Agent Ability
As indicated below, commissioner responses were positive about CSU Extension services,
program quality, and agent expertise. The quality of CSU programs and responsiveness of local
agents and county offices received particularly positive ratings.
Commissioners rated the services provided from local Extension office favorably, with
97.61% rated as acceptable, above acceptable or excellent. As one commissioner
commented: "…very responsive, professional, and capable."
7
Colorado State University Extension
2014 County Commissioner Survey Results
Commissioners were satisfied with the local offices’ ability to meet the needs of each
county, with 95.24% rated acceptable, above acceptable or excellent.
8
Colorado State University Extension
2014 County Commissioner Survey Results
The value received by the citizens from programs and services delivered by Extension was
valuable, very valuable or highly valuable according to 87.81% of respondents.
9
Colorado State University Extension
2014 County Commissioner Survey Results
Commissioners rated the expertise and knowledge of Extension personnel positively,
with 96.3% rated as acceptable, above acceptable or excellent. One commissioner
comments: "Always available and providing great knowledge…"
10
Colorado State University Extension
2014 County Commissioner Survey Results
The responsiveness and service level of Extension personnel in meeting the needs of citizens
was found to be 95.13% acceptable, above acceptable or excellent.
11
Colorado State University Extension
2014 County Commissioner Survey Results
Regional Results Comparison: Commissioner Level Data
The table below reports commissioner responses divided into the three CSU Extension regions as
percentages. As these percentages indicate, the three regions vary in their response trends. The
Western region (all Western Slope counties) trends higher overall, while the Front Range region
(Front Range urban corridor) and the Eastern Peaks and Plains region (Southeast, Northeast
Golden Plains, and the San Luis Valley) trend lower on all issues. Overall, regions are most
satisfied with program quality, responsiveness, and agent knowledge; scores trend lowest with
regard to program value.
Program Quality
Capacity
Value
Knowledge
Responsiveness
Satisfaction
2014 Regional Results Comparison
Excellent/Above
Acceptable
Acceptable
Front West
East
Front West
East
Range
Range
79%
83%
64%
21%
13%
33%
63%
78%
62%
26%
17%
36%
61%
83%
51%
22%
13%
34%
67%
83%
70%
28%
13%
28%
59%
78%
67%
41%
17%
26%
59%
87%
61%
41%
9%
32%
Below Acceptable/Poor
Front
Range
0%
11%
17%
6%
0%
0%
West
4%
4%
4%
4%
4%
4%
East
2%
2%
15%
3%
7%
7%
Survey Comments: Kudos and Concerns
Each question on the survey allowed unlimited space for comments. Comments on local agents
and offices were generally very positive. Many comments reflected positive perceptions of local
agents and reported leveraging Extension resources to partner with county efforts in Open
Space/recreation, animal shelters, lawns and gardens, fire mitigation, water usage, and youth
services. Comments also, however, raised concerns about lack of awareness and/or the need to
adapt programming to changing needs.
Praise for Extension Agents and Services
• I didn’t know what a great Extension office looked like until I met these folks.
• Our Extension director is friendly, hard-working, and a team player. He has a lot of great
ideas, and works in partnership with the county in a variety of roles.
• We are very pleased to be a part of and have this program continue in our county!
• Thanks for asking our opinion. We want to continue working with CSU Extension to
maximize our community’s involvement.
12
Colorado State University Extension
2014 County Commissioner Survey Results
Concerns: Appropriate Programming and Awareness
• Many suburban citizens don’t know that CSU Extension has programs for them, too.
• I continue to think that Extension needs to partner with industry more and more.
• We wonder if Extension might be useful in areas which are largely unknown to our
citizens (e.g., the Idea 2 Print Lab).
• I would like to see more widespread knowledge of what’s offered and why it is important.
Recommendations from Respondents
Multiple respondents recommended adapting Extension programming to fit changing needs. At
the same time, several respondents requested information to help counties understand how to use
Extension in “non-traditional” areas.
Conclusion
The 2014 survey data indicate that commissioners feel very positively about their agents and are
highly satisfied with CSU Extension overall. Current county revenues continue to be based on
property values that lowered during the recession, and on severance taxes on the Western Slope.
Continued and increasing county financial commitment is a strong sign of support. Counties
particularly affected by water issues continue to appreciate the support received from the
Colorado Water Institute and the three regular water specialists in CSU Extension.
The Office of Engagement and the Office of Community and Economic Development are
working with CSU Extension to explore how best to meet some of the requests and
recommendations from respondents, such as those that advocate for additional community
services or partnering with local resources.
This report will be made publicly available on the CSU website, through the CSU Extension and
VP Engagement web pages. A link to the report is also mailed to all survey participants, with
thanks for their interest and participation. The survey results are shared with CSU Extension
program leaders and regional directors, to be used in planning and recommendations for 2016.
13


© Copyright 2026