
The Impact of Poverty, Race and Cultural Bias on Educational
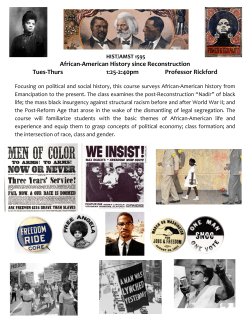
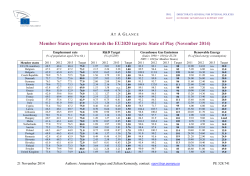
The Impact of Poverty, Race and Cultural Bias
on Educational Opportunity
Part 1: The Wrong War
The Elementary and Secondary Education Act or ESEA was designed to be public education's contribution to the
War on Poverty. Renamed the No Child Left Behind Act (NCLB) in 2001, ESEA turned the war against public
education itself.
The Standards and Accountability Game
Corporate interests set up a manufactured crisis in
public education using the rhetoric of higher
“standards and accountability.”
The S & A game uses standardized test scores to
label and punish students, teachers, and schools.
The agenda is to destroy teachers unions, pave the
way for vouchers, and open up the multi-billion dollar
“education marketplace” for corporations and other
wealthy donors to political campaigns.
The Failure of NCLB
NCLB, the signature law of the S & A movement, failed to significantly increase average
academic performance or to significantly narrow achievement gaps, as measured by the
the National Assessment of Educational Progress (NAEP). In fact, U.S. students made
greater gains before NCLB became law than after it was implemented (FairTest report,
2012).
The Impact of Poverty, Race and Cultural Bias
on Educational Opportunity
Part 2: The Real Problem
U.S. Poverty
For the first time in at least 50 years, a majority -
51%
of U.S. public school students come from low-income families
(Southern Poverty Law Center)
The U.S. poverty rate has been increasing even as the economy has
improved. (chart from Mother Jones magazine>>>)
States with high student-poverty rates tend to spend less per student:
of the 27 states with the highest percentages of student poverty, all
but five spent less than the national average of $10,938 per student.
(Southern Education Foundation)
Not a Level Playing Field
Wealth and poverty are “sticky” - the wealthy tend to stay wealthy; the poor tend to stay poor.
PAA workshop: The Real Problem p.2
White families are much wealthier than black and Hispanic
families at every education level. More than that, all white
families, even those at the lowest education level, have a
higher median wealth than all black and Hispanic families,
even those at the highest education level. >>>>
For too many low-income students or
students of color, education does not
level the playing field.
African-American college students are about
as likely to get hired as whites who have dropped
out of high school.
PAA workshop: The Real Problem p.3
Students eligible for free or reduced lunch have the lowest NAEP scores.
School segregation, “double segregation” by race and poverty
In spite of declining residential segregation
for black families and large-scale movement
to the suburbs in most parts of the country,
school segregation remains very high for
black students. It is also double segregation
by both race and poverty. Nationwide, the
typical black student is now in a school
where almost two out of every three
classmates (64%) are low-income, nearly
double the level in schools of the typical
white or Asian student (37% and 39%,
respectively). New York, Illinois, and
Michigan consistently top the list of the most
segregated states for black students.
43 percent of Latinos and 38 percent of
blacks attend intensely segregated schools
(those with only 0 to 10 percent of white
students) across the nation (Civil Rights
Project, “E Pluribus”)
PAA workshop: The Real Problem p. 4
Other Effects
Bias in standardized tests
A Fact Sheet by Parents United for Responsible Education, “Bias in Standardized Tests,”
says that “although in recent years test makers have attempted to address concerns about
test bias by establishing review committees to 'scour' the tests for bias, and by using
statistical procedures, significant problems remain in the content of the questions, the
cultural assumptions inherent in the 'wanted' answers, etc.”
Here are just a few examples from PURE's Fact Sheet:
Discriminatory item selection: Jay Rosner, executive director of the Princeton Review
Foundation, which provides test preparation programs for the college-entrance Scholastic
Aptitude Test (SAT), reported in 2003 that potential SAT questions which are answered
correctly more often by black students than white students are rejected by the test makers. This was apparently
done to assure that test results (showing African-Americans scoring lower than whites) would be “consistent” from
year to year.
Outright racism: A series of questions on the 2006 global history New York State Regents exam asked students
to describe how Africa “benefitted” from imperialism. Using this 150-year-old quote: "We are endeavoring ... to
teach the native races to conduct their own affairs with justice and humanity, and to educate them alike in letters
and in industry," students were asked to name "two ways the British improved the lives of Africans."
Socio-economic bias masquerading as cultural diversity: The 2006 New York State Regents third grade
reading practice test used the example of African-American tennis stars Serena and Venus Williams to ask
children questions about tennis “doubles” and country clubs.
Accidental (?) bias: In 2001, the Illinois Standards Achievement Test (ISAT) included a reading passage taken
from Ann Cameron’s book, More Stories Julian Tells. The book is about an African-American family and is familiar
to many African-American children, but the illustrations showed a white family.
Lack of cultural awareness: A Latina “bias reviewer” caught this item while reviewing questions prepared for the
Iowa Test of Basic Skills. “I remember one question that showed a picture of a couch on a porch and asked, 'What
doesn't fit?' " she says. "I started laughing...the way I grew up, everyone had a couch outside."
School Closures
In Chicago, 88% of the students affected by the school closures are African-American. The numbers are just as
glaring in Philadelphia, where 81% are black. In both cities more than 93% of the affected students come from
poor families. The numbers have played out much the same way in Detroit, New York, Newark, NJ, Oakland and
Washington, D.C. Parents of school children in each of these cities have filed federal complaints under the 1964
Civil Rights Act to fight school closings.
PAA workshop: The Real Problem p. 4
Other Effects
Retention
African-American and Latino students are most likely to be retained in grade, which is strongly correlated with
dropping out.
The pie chart on the left shows
that African-American students
have been disproportionately
retained in the Chicago Public
Schools.
The bar graph on the right shows
what percentage of each subgroup
was retained in Chicago in 2008.
For example, 16% of all CPS 3rd,
6th and 8th grade AfricanAmerican students had to repeat
the grade.
A recent national study of retention found a major drop in the number of students being held back, but across all
grades, retention rates remained higher among African-American and Latino students, children of less educated or
single parents, urban children, immigrants, and children in Southern and Northeastern states, the researchers
found.
African-American students in grades 2 through 9 were about twice as likely as white students to be retained.
(Warren, Hoffman and Andrew, Educational Researcher 2014)
PAA workshop: The Real Problem p. 5
Other Effects
Student Discipline


© Copyright 2026