
Iskandar Malaysia Property Market
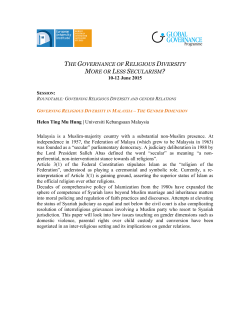
ISKANDAR MALAYSIA
Property Market Overview
May 2015
savills.com.au
GEOGRAPHICAL COVERAGE OF IM
• Manufacturing
(Electronics,
Petrochemicals,
Oleochemicals)
• Oil Storage Terminals
• Trade & Expo City
(APTEC City)
• Johor and Tanjung
Langsat Port
• Logistics
• Manufacturing
(Aerospace Park, Senai
Intl Airport, Airport City,
Senai Free Zone)
• Tourism (JPO)
• MSC Cyberport Malaysia
SENAI-SKUDAI
PASIR GUDANG /
TANJUNG LANGSAT
• Education & Health
Services (Edu City & Afiat
Healthpark)
• Entertainment &
Recreation (LEGOLAND,
Kota Iskandar, Puteri
Harbour)
• State Administration
• Business & Finance
• SiLC and Medini
Iskandar
•
•
•
•
•
NUSAJAYA/MEDINI
Financial,
Cultural & Urban
Tourism (Sultan Ibrahim
Building)
Danga Bay
CIQ Complex, The
Causeway
Leisure (KOMTAR
JBCC)
JB CITY CENTRE
• Logistics
• Free Zone Industrial Area
• Regional Distribution,
International Procurement
• Oil Storage Terminals
• Port of Tanjung Pelepas
TANJUNG PELEPAS
Source: IRDA
Region
Iskandar Malaysia
Greater KL
Dubai
Hong Kong
Singapore
Area (km2)
2,217
2,790
3,885
1,095
690
Population (million)
1.88
7.0
2.2
7.2
5.5
SELECTED PROJECTS IN IM
Flagship A
Iskandar Waterfront
Development: under
Flagship B
Educity: completed in
2014
planning
Country Garden
Danga Bay:
completion in 2018
Legoland: completed
in 2013
Puteri Harbour: Phase
2 completed in 2013
(other phases under
construction/planning)
Source: IRDA
Flagship C
Port of Tanjung Pelepas:
completed in 2012
Flagship D
Pasir Gudang Specialist
Hospital: completed in
Flagship E
Johor Premium Outlets:
completed in 2011
2012
Petrochemical & Maritime
Industrial Hub Tanjung Bin:
completion in 2015 (phase 2)
Universiti Teknologi
MARA: opened in 2013
Pinewood Iskandar
Malaysia Studios:
completed in 2013
Senai Hi-Tech Park:
launched in 2011
Source: Savills Research
PRESENCE OF CHINESE DEVELOPERS IN IM
Developer: Zhuoda
Group
Project: 1
Paradiso Nuova
5
4
2
(high-rise residential
development on 16
acres)
6
Developer: Guangzhou
R&F Properties
Project: 6 Princess
Cove (116-acre
development with
residences, retail units
and offices)
1
3
Developer: Country Garden
Projects: 2 Country Garden Danga Bay
(residential and retail units on 57 acres)
3 Forest City
(integrated development
on reclaimed land –
about 1,386 hectares)
Developer: Greenland
Projects: 4 Jade Palace (retail and residential
units on 13.6 acres)
5 Tebrau Bay Waterfront City
(128-acre mixed-use
development)
Developer: Hao Yuan
Project: not announced
yet (purchased 37 acres
in Danga Bay)
Source: Savills Research
INVESTMENTS INTO IM
IM continues to receive strong investment interest with 47% realised to date (RM78.53 billion out of RM166.11 billion).
During the first quarter of 2015, IM secured RM7.98 billion in new investments, recorded a total cumulative committed investments of
RM166.11 billion.
Manufacturing sector continues to be the top performer, contributing 31% (RM50.82 billion), followed by supporting sectors such as
residential & retail property sector at 41% (RM68.75 billion) and industrial properties, government, utilities, and emerging technologies at 6%, 5%,
8%, and 1% respectively.
The other promoted sectors merely contributing 9% of the total investments into IM, such as logistics (3%), healthcare (2%), tourism (2%),
education (1%), and creative & finance (1%).
Total Cumulative Investments into Iskandar Malaysia [2006 – Q1 2015]
RM166.11
RM158.13
Government
RM160
RM131.64
Utilities, Tourism & Others
Manufacturing
RM120
8.31
Total Committed Investment
RM93.89
RM69.48
RM80
RM55.56
6.28
6.28
21.83
RM60
RM41.75
RM20
RM0
RM25.80
RM11.30
5.80
7.10
5.80
5.50
11.90
2006
2007
Source: IRDA
6.83
8.17
5.05
40.06
38.58
RM105.14
RM100
RM40
Total Investments into Iskandar Malaysia
8.31
Properties
RM140
8.31
6.28
7.31
33.25
61.15
35.14
66.92
(47%)
43.26
27.30
28.79
19.98
16.52
14.45
9.11
21.70
23.65
26.92
31.22
2008
2009
2010
2011
33.90
2012
Realised
RM78.53
billion
46.82
50.09
50.82
2013
2014
Mar-15
Committed
RM87.58
billion
(53%)
FOREIGN INVESTMENTS INTO IM
Foreign investments stand at 38% of the total committed
investment as of Q1 2015. Top 5 foreign investors are:
Investments from Singapore mainly consist of education,
healthcare, manufacturing and property development sectors.
Investments from China are mainly from the property
development sector.
Singapore
USA
Top 5 Foreign Investors
Spain
China
RM3.74 bil
Japan
China
Japan
RM4.06 bil
Domestic vs Foreign Investments
Singapore
RM12.06 bil
Total Investments (RM Billions)
180
160
140
120
Foreign
Investments
Domestic
Investments
37.45
80
Spain
RM4.18 bil
USA
RM6.30 bil
34.14
40
20
63.77
44.81
100
60
56.99
50.64
67.69
83.40
101.14
102.34
2014
Q1 2015
0
2011
2012
2013
Source: IRDA
IM INCENTIVES SUPPORT PACKAGE (ISP)
APPROVED DEVELOPER
Income tax exemption on income derived from disposal of land in the approved nodes (up to 2025); and
Income tax exemption on income derived from sale or rental of a building in the approved nodes (up to 2030)
APPROVED DEVELOPMENT MANAGER
Income tax exemption on income derived from the provision of management, supervisory & marketing services to an
Approved Developer company, specific to an approved project in the approved nodes (up to 2030)
IDR STATUS COMPANY
10 year corporate tax exemption for qualifying activities or an Investment Tax Allowance of 100% for five (5) years
Other incentives:I.
Exemption from EPU property acquisition guidelines
II.
Each foreign knowledge worker employed by an ISP approved company will be eligible to import or purchase a
duty free car for his or her own personal use
III. Flexibility to recruit foreign knowledge workers subject to the guidelines of the Iskandar Malaysia Expatriate
Committee (IMEC)
IV. Flexibility from foreign exchange administrative rules set forth by BNM
FLAGSHIP INCENTIVES – FISCAL & NON-FISCAL
5 year corporate tax exemption / Import duty & sales tax exemption / flexibility to recruit foreign workers / flexibility from
foreign exchange administrative
Note:
1) The ISP to be extended for another 10 years after the initial expiration on 31 Dec 2015.
2) The approved nodes are Medini, Vantage Bay, Danga Bay and Pinewood Iskandar Malaysia Studio.
Source: IRDA
RECENT MARKET UPDATES
February
2015
Iskandar
Malaysia
declared
as
a
Regional Centre of
Expertise
for
Sustainable
Development (RCE)
to
promote
sustainable
future
developments and to
provide a platform for
individuals
and
organizations
to
generate ideas.
Employees Provident
Fund (EPF) entered
into a joint venture
with
Australia’s
Goodman Group to
develop
logistics
assets in Klang Valley
and Iskandar Malaysia
with
a
total
development value of
RM1.4 billion.
March
2015
CapitaLand’s Ascott Limited (Ascott) raised
its presence in Iskandar with its 3rd property
(the 214-unit Citadines Medini Nusajaya)
Australian developer Walker Corporation
together with an investment firm named
Wang & Wong Pte Ltd will develop
“Senibong Hills”. This development consists
of landed homes and high-rise apartments
together with a club house.
3 new firms to invest approximately RM600
million in Medini:
Goldbury is establishing a global
information technology (IT) automotive
hub in Medini
Brandt International will set up a BPO
and knowledge process outsourcing
(KPO)
Vision Technology Consulting will
develop a development centre that will
provide
Oracle
technology
implementation and related outsourcing
services as well as enterprise mobility
solutions.
April
2015
Traders Hotel Puteri Harbour has
rebranded itself as Hotel Jen Puteri
Harbour, Johor. It’s the 10th hotel to adopt
this new brand name
unveiled
its
UEM
Sunrise
Bhd
comprehensive development plans for the
2nd phase of Gerbang Nusajaya, which
consists of a 210ha integrated eco-friendly
tech park (“Nusajaya Tech Park”) and a
212.4ha motorsport city (“FASTrack
Iskandar”)
United Malayan Land Bhd is collaborating
with Thailand’s Onyx Hospitality Group to
open the first Amari Hotel in Malaysia. It will
be part of a mixed-use development in
Johor Bahru named “Suasana Iskandar”.
Upon completion in 2017, Amari will have
242 rooms with indicative average price per
room between RM1,158 and 1,552 per
night
RESIDENTIAL PROPERTY MARKET
As of end of 2014, the total supply of residential properties in IM stands at 429,018 units, an increase of 2.3% y-o-y.
Landed properties = 274,010 units (64% of supply)
Non-landed properties = 56,087 units (13%)
Low cost housing = 98,921 units (23%)
The total existing stock of condominiums/serviced apartments increased by 65% between 2006 (20,512 units) and 2014 (33,840 units)
Residential units under construction = 106,487 residential units (37% are landed properties, 58% non-landed properties and 5% low
cost housing)
Residential units under planning = 141,960 units
Therefore, 248,447 new units in the pipeline = 58% increase over the existing supply.
Total Residential Supply in IM (2006 – 2014)
5.7%
5.0%
51,658
2.5%
56,087
2.3%
Source: JPPH
20,000
3.0%
2.0%
1.1%
230,755
239,456
246,421
251,249
254,904
260,716
268,755
274,010
10,000
2006
2007
2008
2009
2010
2011
2012
2013
2014
-
1.0%
0.0%
Total Low-Cost Stock
Total Landed Residential Stock
909
15,000
1.7%
217,877
50,000
50,110
2,471
25,000
Total Non-Landed Residential Stock
Growth Rate (%)
2007
2008
27,484
1.9%
150,000
4.0%
2.4%
200,000
100,000
49,164
98,921
27,313
48,412
98,921
26,129
46,306
98,767
25,205
39,509
44,044
98,753
2,985
6,356
25,205
35,797
97,914
98,669
22,731
96,764
97,734
98,068
2,985
3,349
2,915
21,372
350,000
2,985
30,000
2,985
24,665
3.6%
400,000
250,000
35,000
5.0%
450,000
300,000
Cumulative High Rise Residential Properties in IM
6.0%
19,603
500,000
2009
2010
2011
2012
2013
2014
5,000
2006
Serviced Apartment
Condominium / Apartment
NEW LAUNCHED CONDOMINIUMS IN IM
The incoming supply of condominiums reached its peak in 2013, as a total of 34,949 units were launched
during the year with the majority (80%) located in Johor Bahru City Centre and surrounding suburbs.
As a comparison, Kuala Lumpur launched about 22,000 units of condominium units in 2013 and the number of
private residential units launched in Singapore was 15,885 units only (inclusive of landed and non-landed
properties) that year.
2014 was a slow year as the number of newly launched condominium units shrank by 63% from a year ago.
Only 12,934 units were launched in 2014. This could be a consequence of the recent cooling measures such
as the raise in Real Property Gains Tax (RPGT), minimum foreign threshold raised to RM1 million as of 1
May 2014 and the tight lending market.
Causeway Regency
However, any development that was approved before 1 May 2014 does not have to comply with the RM1
million threshold rule. For instance, units in “Causeway Regency”, launched in January 2015, can still be sold
below RM1 million to foreigners.
Besides, the lack of new launches could be attributed to the low take-up rates of launched projects, as
developers with new stock to the market could have taken their cue from the performance of their
competitors.
In April 2015, we witnessed the launch of “Causeway Regency” (228 units) and “Jade Palace” (2,456 units).
Jade Palace is a 13.6-acre waterfront development jointly developed by Greenland Group and IWH that
consists of 13 towers of residential building (4 towers are open for booking now). Anecdotal evidence shows
that Phase 1 was 80% booked. During the same period, MB Group launched their wellness development
located in the Sungai Pulai Ramsar Wetland Reserve and named “Sungai Pulai Wellness Resort”, and offered a
preview of its high-rise residential development at Tampoi named “Aliff Avenue” (282 units).
Aliff Avenue
In December 2014 was announced that all new serviced apartment applications will be frozen, but those
who have received their approval prior to this announcement can continue their projects.
RECENT LAUNCHES IN IM
Scheme Name
Location
Built-up (sq ft)
Price Range (psf)
No of Units
Take Up Rates
Aliff Avenue
Tampoi
538 - 1,098
RM400-640
282
Preview only
Princess Cove - Phase 1
Tanjung Puteri
469 - 1,343
RM750 - RM1,300
868
50%
G Residence
Citywoods
Acquaint Danga
Centara Residences
Causeway Regency
Jade Palace
Seventh Cove
Grand Medini
Plentong
JBCC
Danga Bay
Nasa City
JBCC
Danga Bay
Masai
Medini
653 - 1,552
764 - 1,240
549 - 4,730
785 - 1,690
776-1,408
488 - 1,047
907 – 4,861
474 - 1,149
RM450 - RM500
RM540
RM900 - RM1,200
RM660 - RM732
RM800-980
RM850
RM978 – RM1,149
RM770 - RM1,100
480
417
818
232
228
2,456
392
672
70%
40%
80%
20%
n/a
Booking stage
Citrine @ The Lakeview
Medini
933 - 1,348
RM850
328
75%
RM1,000-1,100
Tower A: 583
Tower B: 322
Tower C: 322
Tower B: 100%
Meridin - Phase 2
Source: Savills Research
Medini
318-885
50%
OFFICE PROPERTY MARKET
As at end of 2014, the total private purpose-built office supply stands at 5.89 million sq ft. Refurbishment works at Menara Komtar were recently
completed (total NLA is 409,000 sq ft) and is now fully occupied by Jcorp and its subsidiaries.
There is no major office cluster located in IM per se, but approximately 95% of the existing offices are located within the JB City Centre with most
of the buildings being old.
Overall occupancy rate averages 73% across Iskandar Malaysia, with only a few well-located office building that manage to achieve higher than
85%, such as Menara MSC Cyberport, JB City Square Office Tower, Menara TJB, Menara Ansar and Menara Landmark. Menara Landmark is
located within an integrated development that consists of 4 levels of medical suites as well as the Doubletree by Hilton.
Rental rates for prime office space in Johor Bahru City Centre are ranging between RM2.50psf and RM3.50psf per month.
Future office supply is mostly sited within master-planned developments such as Medini Business District, Medini Central, Iskandar Waterfront
District, Iskandar Financial District & Sunway Iskandar
Apart from the manufacturing sector, sectors that require office space such as Financial Advisory & Consulting, Education, Creative Industries,
Tourism and Healthcare are encouraged to move to Iskandar Malaysia.
Selected New Launches of Office Suite in IM
Occupancy Rate of Purpose Built Office -Private
80%
Name
Developer
Expected
Completi
on Date
Size
(sq ft)
Status
Medini Lakeside
UMLand
2018
683-2,120
Open for
registration
Markers Iskandar Tower A
Ra Ta Land Sdn
Bhd
2017
1,5004,300
Tower A
100% leased
Markers Iskandar –
Tower B
Ra Ta Land Sdn
Bhd
2017
1,5004,300
140 units
available
Lakefront Southkey –
Tower A & B
Southkey
Properties Sdn Bhd
2015
A: 80,000
B: 50,000
n.a.
Citrine Office Suites
Sunway Iskandar
Sdn Bhd
2017
746-1,671
100% sold
Average Occupancy Rate
75%
70%
65%
60%
55%
50%
45%
40%
2006
Source: JPPH
2007
2008
2009
2010
2011
2012
2013
2014
Source: Savills Research
RETAIL PROPERTY MARKET
New completions in 2014 include:
KOMTAR JBCC (405,000 sq ft)
Sutera Mall – Entertainment City (approximately 300,000 sq ft)
Mydin Pelangi Indah (21,528 sq ft)
As of 2014, there is a total of 12.49 million sq ft of NLA of retail space in IM, with retail space per capita slightly over 6.33 sq ft per
person (lower than Greater KL’s 7.6 sq ft per person).
Average prime rents in IM are ranging between RM5psf and RM20psf; however, JB City Square, located opposite the CIQ, managed
to achieve as high as RM40psf.
Retail growth in IM is evident asproven by the opening of Johor Premium Outlet Phase 2 (2013) and KOMTAR JBCC (2014). Moreover,
AEON Tebrau City is undergoing expansion to house a multi-storey car park, a department store and a supermarket.
With the population expected to grow and plans set in place in IM to boost its economy, this will support the growing retail market in
the years to come.
Major malls in the pipeline are listed below:Name
Developer
Expected Completion
Year
Net Lettable Area
(sq ft)
Paradigm Mall
WCT
-
750,000
Midvalley Southkey Megamall
Southkey Properties Sdn Bhd
2018
1,500,000
Tropicana Danga Bay Mall
Tropicana Danga Bay
-
*250,000
Capital 21
Hatten Group
2017
1,000,000
Country Garden Lifestyle Mall
Country Garden Danga Bay
2017
430,000
Note: (*) Tropicana Danga Bay Mall was initially announced at 1 million sq ft and it has now reduced to 250,000 sq ft.
Source: Savills Research
INDUSTRIAL PROPERTY MARKET
As at end of 2014, the total number of existing supply of industrial properties in Iskandar Malaysia stood at 14,159 units. Terraced
factories accounted for 54%, followed by detached (21%) and semi detached factories (21%).
2014 observed a growth rate of +2.65% Y-o-Y, which is the highest since 2006.
This strong growth can be attributed to the new quality industrial parks (Frontier Industrial Park, i-Park@SiLC, Setia Business Park,
SiLC, Skudai 8 Biz Hub and Indahpura Industrial Park) which were launched in 2013 and 2014.
With other industrial developments coming on stream in a couple of years such as the Nusajaya Tech Park, Sime Darby’s Harvest
Green Industrial park and UMLand’s Dover Business Park, the supply is expected to improve significantly. In addition, we expect more
MNCs shifting their operations to IM, as foreign investments currently account for 38% of the total committed investments.
Future Supply of Industrial Properties by Type
Current Existing Supply of Industrial Properties by Type
1,800
Total number of Units
12,000
10,000
8,000
6,000
Planned Industrial Supply
1,600
1,400
1,200
1,029
909
1,000
804
800
600
4,000
409
335
400
2,000
Incoming Industrial Supply
1,681
14,000
272
200
-
23
10
2011
2012
2013
Detached
Cluster
2014
Cluster
2010
Semi-detached
Industrial complex
Industrial complex
2009
Flatted factory
2008
Detached
2007
Semi-detached
2006
Terraced factory
Flatted factory
Terraced factory
-
-
Source: JPPH
-
251
THANK YOU
For further enquiries, kindly contact:
Savills (Malaysia) Sdn Bhd
Research & Consultancy
[email protected]
Disclaimer: This document is prepared by Savills (Malaysia) for general informative purposes only. Whilst reasonable care has been exercised in preparing this document, it is subject to change and these
particulars do not constitute, nor constitute part of, an offer or contract; interested parties should not rely on the statements or representations of fact but must satisfy themselves by inspection or otherwise as to
the accuracy. No person in the employment of the agent or the agent's principal has any authority to make any representations or warranties whatsoever in relation to these particulars and Savills (Malaysia)
cannot be held responsible for any liability whatsoever or for any loss howsoever arising from or in reliance upon the whole or any part of the contents of this document.


© Copyright 2026