
The Effects of Broadband in Schools: Evidence from
The Effects of Broadband in Schools: Evidence from
Portugal
Rodrigo Belo∗
Engineering and Public Policy, Carnegie Mellon University
129 Baker Hall
Pittsburgh, PA 15213
Pedro Ferreira†
H. John Heinz III College, Carnegie Mellon University
3042, Hamburg Hall
Pittsburgh, PA 15213
Rahul Telang‡
H. John Heinz III College, Carnegie Mellon University
3040 Hamburg Hall
Pittsburgh, PA 15213
April 14, 2011
Word Count
Main text: 8322; Total: 10469
JEL: I21
∗
Rodrigo Belo, [email protected], Engineering and Public Policy, Carnegie Mellon University, IST - Technical University of Lisbon, FCEE - Universidade Cat´olica Portuguesa
†
Pedro Ferreira, [email protected], H. John Heinz III College, Carnegie Mellon University, Engineering
and Public Policy, Carnegie Mellon University, IST - Technical University of Lisbon, Phone: (412) 268-5526
‡
Rahul Telang, [email protected], H. John Heinz III College, Carnegie Mellon University, Phone:
(412) 268-1155, Fax: (412) 268-5337
1
Electronic copy available at: http://ssrn.com/abstract=1636584
Abstract
The introduction of broadband in schools provides a new resource for learning but also an opportunity for distraction. Consequently, broadband use in
schools can either increase or reduce students’ performance. This paper provides
a model that shows how these two effects trade off. We use a rich panel of data
with information on broadband use in all schools in Portugal and on students’
performance in the 9th grade national exams to learn how broadband use affects
performance. We use a first-differences specification to control for school-specific
unobserved effects. We also use a proxy for the quality of the broadband connection as an instrument to control for unobserved time-varying effects. We show
that high levels of broadband use in schools in 2008 and 2009 are detrimental
for the grades of 9th grade students. For the average broadband use in schools,
grades reduce about 0.76 and 0.67 of a standard deviation in 2008 and 2009,
respectively. We also show evidence suggesting that broadband has a negative
impact on exam scores regardless of gender, subject or school quality. We also
find suggestive evidence that the way schools allow students to use the Internet
affects students’ performance, in particular, students in schools that block access
to websites such as YouTube perform relatively better. Although test scores do
not measure all the effects that broadband in schools have on the performance
of students throughout life, our results show that the introduction of Internet in
schools is a task that deserves careful planning.
2
Electronic copy available at: http://ssrn.com/abstract=1636584
1
Introduction
There is a generalized consensus that education plays an important role in the economic performance of countries as well as on the success of firms and of individuals in the labor market.
Research has shown that higher levels of education are associated with both higher productivity at
the country level (e.g., Mankiw et al., 1992) and higher wages at the individual level (e.g., Card,
1999). There is also a general belief that providing more resources to schools contributes to increase
the quality of education, which raises students’ performance and, consequently, productivity levels
both at the individual and at the aggregate level.
However, researchers have hardly reached a consensus regarding whether better resources (including
technology) in schools lead to better outcomes. For a long time research on the impact of resources
in education has produced mixed results. A review of such studies provided by Hanushek (1986)
suggested that there is “no strong or systematic relationship between school expenditures and
student performance”. In fact, teasing out the impact of resources on student performance from
archival data is challenging because many unobserved factors contaminate the estimates. More
recent studies, that control for such factors, show that some types of resources (e.g., class size,
school hours) have a consistent positive impact on students’ performance, but others do not, such
as Information and Communications Technologies (ICTs) (Webbink, 2005).
ICTs are perceived by many as potential powerful tools to improve the quality of education. They
facilitate real time access to information, provide a more hands-on learning experience and foster
new learning methods that promote more interaction and feedback, ultimately increasing students’
interest and performance (e.g., Underwood et al., 2005). Governments around the world are heavily
subsidizing computers and now broadband access in schools. However, the Internet also offers
significant opportunities for students to indulge in leisure and entertainment activities. Without
effective monitoring and controls by schools, students may predominantly use broadband to play
games, chat and watch movies. This can distract them from traditional study which can ultimately
hurt the productivity of learning at school. In fact, some studies indicate that children spend
considerable amounts of time playing computer games (Malamud & Pop-Eleches, 2010). It is also
quite likely that teachers may find it hard to effectively use ICTs as part of the curriculum. Despite
3
the large investments in computers and Internet access in schools, there are only a few studies that
examine the impact of broadband use in school on students’ performance. Moreover, these studies
provide mixed results on whether ICTs indeed help students. Thus there is little understanding of
how broadband can help learning.
In this paper, we first provide a model for how broadband use in schools contributes to students’
performance. In essence, broadband use can be beneficial when students spend a considerable
amount of time in productive activities, and detrimental when students engage mainly in distracting
activities that substitute traditional study. We then provide empirical evidence on the impact of
actual usage (as opposed to existence of a broadband connection in schools) of broadband in
schools on students’ performance drawing from the case of Portugal. Actual usage is measured by
the amount of information exchanged with the Internet over ADSL connections. Performance is
measured by scores obtained in national exams. We collect a panel of data on broadband use and
school performance in more than 900 Portuguese schools, between 2005 and 2009. We use a first
differences model to account for school-specific unobserved effects. The school performance may
be endogenous to broadband use. We overcome this by instrumenting schools’ broadband use with
the distance between the school and the provider’s Central Offices (COs), which proxies the quality
of the ADSL connection. Distance has some unique and desirable properties for a good instrument
providing us confidence in the results obtained.
For 9th grade students, our estimates indicate that more broadband use is detrimental for students’
test scores. We find that, on average, grades declined about 0.76 of a standard deviation between
2005 and 2008 and about 0.67 of a standard deviation between 2005 and 2009 due to broadband
use. We find that there is little difference across genders (both boys and girls suffer equally) and
across math vs language (grades in both Portuguese and math exams reduce equally). In addition,
schools are equally affected by Internet use regardless of their performance prior to the deployment
of broadband.
To explore the distraction effect of Internet in more detail, we conduct a survey to understand
how Internet is utilized in schools. In particular we focus on school policy regarding blocking or
allowing applications and services such as Facebook, YouTube and file-sharing, which are likely to
4
cause distraction. We find some evidence that schools that allow these activities perform worse and
the effect of Internet is significantly more negative when schools allow YouTube use. Overall, our
results suggest that merely providing broadband access does not help students. Without proper
monitoring and control, broadband access in schools may be more harmful than helpful.
This paper is structured as follows. Section 2 provides a review of relevant literature. Section 3
introduces the initiatives sponsored by the Portuguese government to provide Internet to schools.
Section 4 and Section 5 describe the data we used and a model of how broadband affects student’s
performance. Section 6 presents the model we have empirically estimated. Section 7 and Section
8 present empirical results and some suggestive evidence for the distraction hypothesis. Section 9
concludes.
2
2.1
Related work
School Resources and Students’ Performance
There is a vast literature on the impact of class size, school hours, teacher training, computer
use and peer group effects on students’ performance. One of the first studies is Coleman’s report
(Coleman, 1968), which concludes that higher levels of school resources do not necessarily translate
into improved test scores. A series of subsequent works have also been inconclusive in this respect.
In his influential meta-analyses, Hanushek (Hanushek, 1986; Hanushek et al., 1996) also concludes
that there is no systematic relationship between school expenditures and student performance.
These early results have been questioned because unobserved effects might have biased some of the
conclusions. Concerns about endogeneity cast doubts on the causality of the relationship between
education inputs and students performance (see Webbink, 2005, for a detailed explanation of the
endogeneity problem in these studies).
Some of the more recent studies that overcome the endogeneity problem find a positive impact of
class size (e.g., Krueger, 1999; Angrist & Lavy, 1999), school hours (e.g., Lavy, 1999) and peer
5
group effects (e.g., Sacerdote, 2001).1 The impact of other characteristics, such as teacher training
and computer use, either remains non-significant or exhibits mixed results (e.g., Angrist & Lavy,
2002; Webbink, 2005; Barrera-Osorio & Linden, 2009).
We note that most studies look at students’ test scores in a standardized test as an outcome measure
(e.g., Angrist & Lavy, 2002; Goolsbee & Guryan, 2006; Leuven et al., 2007; Machin et al., 2007).
Even though test scores have some obvious limitations, most studies use test scores as a measure
of student performance mainly because they are reliably measured, and provide a tangible and
standard way to measure student performance. Test scores are also a barometer used by policy
makers and administrators to assess a school’s performance which affects teacher benefits, school
subsidies and parents’ demand. As a consequence, schools, teachers and students all have incentives
to improve test scores.
2.2
ICT Investments and Students’ Performance
Research on the contribution of ICTs to students’ performance has also produced mixed results.
Early studies on the use of computers in the classroom report positive effects on students’ performance, but are often criticized either because they fail to account for endogeneity or because they
report effects with small magnitudes (Cuban & Kirkpatrick, 1998; Webbink, 2005).
More recent work overcomes the endogeneity problem by exploiting exogenous sources of variation
in computer use. Angrist & Lavy (2002) present the first study along these lines. They exploit a
randomization (determined by a lottery) in the timing of school computerization in Israel. They
find no effect on students performance, except for a negative effect in math exam scores for 8th
graders. Goolsbee & Guryan (2006) study the impact of subsidizing schools’ Internet access and
find no evidence that more classrooms with Internet has an impact on students’ performance, as
measured by the Stanford Assessment Test (SAT). Leuven et al. (2007) exploit a discontinuity in
a subsidy given to schools in the Netherlands. In 2000, Dutch schools in which more than 70% of
1
All these studies take advantage of an exogenous source of variation to overcome the endogeneity problem.
For example, Krueger (1999) use an experimental setting; Angrist & Lavy (1999) take advantage of a
maximum class size rule; Lavy (1999) taps on variations on the allocation of school hours; and Sacerdote
(2001) uses random dorm assignments.
6
the students were considered disadvantaged were eligible to receive a subsidy to acquire computers.
Using a differences-in-differences framework, they find that this subsidy had a negative impact on
students’ performance, especially on girls. Malamud & Pop-Eleches (2010) exploit a discontinuity
in a subsidy provided in Romania in 2008. This subsidy would allow low-income families to acquire
a home computer. They find that the students of families that used this subsidy (households
that indeed bought a home computer) had significant lower school grades in math, English and
Romanian. They also find that these students had higher scores in tests of computer skills and in
self-assessment tests of computer fluency.
An exception to this recent trend of non-significant or negative results is provided by Machin et al.
(2007). In 2001 the rules governing ICT investment in different regions in the UK changed.2 This
change created a quasi-experiment setting with winners and losers across regions. Machin et al.
(2007) find evidence of a positive effect of ICT investment in elementary schools.
A few studies show positive effects of computer-aided learning on students’ performance. Rouse
& Krueger (2004) study the results of a randomized experiment on the use of a specific software
designed to improve language or reading skills (FastForWord). Their results suggest that the use
of this software improves some aspects of students’ language skills, but this does not necessarily
translate into better language acquisition and reading skills.
Banerjee et al. (2007) report the results of randomized experiments in schools in urban India aimed
at improving the test scores of students lagging behind. One of such projects consisted in using a
computer-assisted program aimed at improving math scores. They find that math scores increased
by 0.47 of a standard deviation, but this result fades to 0.1 of a standard deviation one year after
the end of the project. These results did not seem to spillover to other subjects.
Barrow et al. (2009) find that students randomly assigned to a computer-aided instruction program
scored significantly higher in algebra and in pre-algebra tests, than those that were not assigned to
the program. They ran the experiments between 2003 and 2005 in 17 schools (146 classes) in the
U.S and hypothesized that the higher scores were due to the individualized instruction provided
by the program.
2
ICT funds are awarded to each region in proportion to population, whereas before a bidding process
took place.
7
In summary, the impact of ICTs and school resources on student performance is an empirically
challenging question. Also, most studies published so far look at the impact of investment in ICTs
on student’s performance and not at the impact of actual usage of ICTs. Furthermore, most of these
studies look at the availability of ICTs in general rather than the use of a specific technology. This
paper looks at the impact of actual broadband use on a real school environment. We also examine
the impact of specific applications and services. We provide a credible instrument to alleviate the
endogeneity concerns. Overall, we find that broadband usage over the 2005-2009 period had an
adverse effect on school performance.
3
3.1
Broadband in Portuguese Schools
Broadband Provision to Schools
In Portugal most elementary and secondary schools are public schools, funded either by the Central
Government or the Local Government, with limited autonomy to manage their resources. The provisioning of Internet to schools has been managed by FCCN - the Portuguese National Foundation
for Scientific Computation. FCCN is a private foundation, under the tutelage of the Ministry of Science, Technology and Higher Education, that runs the National Research and Education Network
(NREN). The NREN connects all schools, institutions of higher education and research labs in the
country. The same institutional model is followed by a number of other European countries, each
´
having its own NREN. NRENs interconnect forming a trans-European NREN, called the GEANT
network.
In Portugal, by the end of 1997, all private and public preparatory, middle and high schools had
at least one computer connected to the Internet with at least a 64 Kbps ISDN connection. By
mid 2001, all 7135 elementary schools in the country had also been connected (FCT, 2001). This
initiative was complemented by programs aimed at providing technical skills to teachers on how to
use the Internet (see, for example ESES, 2002). Up-front capital costs to connect all schools were
covered by the Ministry. The monthly costs associated with the ISDN connection of elementary
schools were supported by City Halls. The Ministry covered these costs for the reminder of the
8
schools.
In 2004, the same Ministry launched another major initiative, this time aimed at replacing all the
existing ISDN connections by broadband ADSL.3 This project was completed by January 2006,
despite the fact that only less than 15% of the schools had migrated to ADSL before July 2005
(UMIC, 2007). Most schools (>95%) received a DSL modem from FCCN and an ADSL connection
of at least 1 Mbps over the copper line that connects them to the ISP’s Central Office (COs) from
which FCCN buys connectivity to the Internet backbone (Figure 1).4 As before, the Ministry
covered all up-front capital costs to deploy broadband to schools. City Halls foot the broadband
monthly bill for elementary schools and the Ministry covers these costs for the reminder of the
schools.
[Figure 1 about here.]
There is no information about whether some schools had already purchased broadband from the
market by the time this intervention took place, but the schools’ tight budgetary constraints must
have allowed only a small fraction of them to do so, if at all. More importantly, FCCN strongly
encouraged schools to use the broadband connection provided by the Government, after all traffic
over this broadband connection is free of charge to schools, so even if some schools had bought
a DSL connection before, they had a strong incentive to shut it down and use only the FCCN’s
connection. Therefore, the broadband use over the Internet connection provided by FCCN seems
to be a good proxy for the school’s overall broadband use.
3.2
Internet Use at School
We conducted preliminary informal interviews with teachers in 8 different schools to learn more
about how Internet is used in schools. Some teachers are comfortable with using ICTs in the
3
Migration to ADSL was complemented with several other initiatives. One such initiative was ICTs
training for teachers. Another initiative was the subsidization of 150-Euro laptops to students. This initiative,
called “e-schools”, might have boosted Internet use in many schools. A third initiative was to award up
to 24 laptops to each and every school. Most schools use these laptops to bring Internet to the classroom.
Some schools have a dedicated room in which these laptops remain and can be used as desktops.
4
The remainder of the schools, where this speed could not be offered over copper, got a symmetric 256
Kbps ISDN connection to the Internet.
9
classroom and consider the Internet a good tool to capture the students’ interest and to improve
the learning process.5 Other teachers look at the Internet as just another resource that students
can possibly use for learning. However, not all teachers felt that Internet always provides easy to
use information.6 Differences in skills and in the attitude of teachers towards the Internet translate
into significant differences on how and how much students use the Internet in the classroom.
School-specific Internet access policies may also explain part of the differences in the pattern of
Internet use across schools. While some schools provide an open wireless network that any computer
can tap into, such as students’ laptops, other schools disallow access to their wireless network to all
but school computers. Some schools block access only to a restricted set of web sites (mainly adult
content sites), while other schools block access to a whole range of sites considered inappropriate
in the school context.7 All these factors influence how students use the Internet at school and,
consequently, their incentive to bring their laptop to school. Students in some schools bring their
laptops several days a week to school and use them pervasively, while in other schools students
seldom make use of their own laptops.
The time that students spend at school after classes is yet another aspect that might explain
variations in Internet use across schools. In some schools students usually stay at school after class
time, while in other schools most students leave school right after classes. Most students that stay
at school after hours often do so to use the school’s computers and the Internet, most likely, in
some unsupervised way.
Finally, students that do not have Internet at home are likely to exhibit different usage patterns
than those who do. On the one hand students that only access the Internet at school might develop
a more mature approach to use it because they learned how to navigate the Internet under the
teachers’ supervision. Students that have Internet at home might know better how to use it for
recreational purposes and carry that practice to school. However, it might also be that students
5
Some of the teachers interviewed referred that students engage more in discussions and are more motivated when Internet is used in class.
6
One of the teachers interviewed pointed out that he had difficulty in explaining to students that
Wikipedia is not a reliable source of information and that they should always check their sources.
7
Video, chat, social network and adult content sites are among the categories most often blocked. In the
later section of the paper, we provide more details on the distribution of which applications and services are
allowed at different schools
10
that use the Internet at home for recreational activities do not need to do so at school and thus
indulge in learning activities while at school. All in all, there is a wide variation across schools in
terms of how students use the Internet. Teacher knowledge and attitude towards the use of ICTs
in the classroom, school’s Internet and wireless network access policies, time spent at school after
classes and the number of students that access the Internet, both at school and elsewhere, are some
of the factors that contribute to such a variation.
4
Data
School traffic data were obtained from the monitoring tools set up by FCCN. From the ISDN
project, we obtained data for all ISDN sessions between November 2002 and January 2005 for all
schools in the country. From the ADSL project, we obtained monthly reports that include download
and upload traffic per school between November 2005 and June 2009. School traffic is measured at
the school’s edge router and consists of all traffic exchanged between the school and the Internet.
For our measure of school broadband use, we average out the total monthly traffic (upload plus
download) over the entire academic period.8
Internet use in schools grew significantly since the introduction of ADSL in late 2005. Before 2006,
Internet use was virtually zero, compared to usage levels in 2008 and 2009 (see Figure 2), probably
because the ISDN connections could not carry more traffic. Inbound traffic is the major contributor
for this increase; outbound traffic remains relatively little across most schools. Broadband use per
student exhibits high variability across schools (see Figure 3 for a histogram). In 2009, students
used 111 MB per month on average, which corresponds to watching almost one hour of YouTube
video (at 260 Kbps), browsing 350 webpages (at 320 KB per page), or exchanging 850 emails (at
130 KB per email).9 The standard deviation of broadband use in 2009 is considerably large (95
MB), which highlights the heterogeneity in usage.10 Overall, broadband use per student in school
8
We use as academic year the period between September and June.
Average webpage size was obtained from http://code.google.com/speed/articles/web-metrics.html. We
use the average email size of one of the authors as reference, as we found no reliable information on this
statistic.
10
When a video is watched at school, several students might be watching it at the same time, for example
in the classroom.
9
11
is considerable.
[Figure 2 about here.]
[Figure 3 about here.]
Performance is measured by the school’s average score at the 9th grade national exams. The Ministry of Education publishes anonymous disaggregated data at the exam level since 2005, including
information on exam score, course, gender, and age of the examinee. 9th graders are examined in
two subjects, Portuguese and math, and their exam scores constitute part of their final score on
these subjects and might determine whether the student graduates. Therefore, students have clear
incentives to perform well in the 9th grade national exams.11
Figure 4 shows average exam scores for both the 9th grade normalized to a 0-100 scale.12 Average
exam scores have increased from 2005 to 2009 (14.0%), which may reflect a positive impact of
broadband on students’ performance. Alternative explanations for this rise include unobserved
factors, such as exams becoming easier with time, particularly in 2008.
[Figure 4 about here.]
Finally, regional data were provided by the Portuguese National Statistics Institute. These data
include population density (2001 census data; at the civil parish level), average earnings and regional
dropout rates (2005; at the municipality level) across municipalities. Table 1 presents summary
statistics of these variables for schools in our sample.13
[Table 1 about here.]
11
Even though this is a standardized exam, it is not necessarily a multiple choice or binary response only
exam. The students have to write detailed answers.
12 th
9 grade exam scores are published in a 1-5 scale (with increments of 1).
13
Portugal has a population of 10.6 million. The country is divided into 308 municipalities, which are
further divided into 4,261 civil parishes. Schools in our sample cover 277 municipalities and 723 civil
parishes.
12
5
Framework
We introduce a model that explains how the time students spend using the Internet at school
affects their performance. Let p represent students’ performance. Let I represent the time they
spend using the Internet at school. Let S represent the time they spend at school without using
the Internet, otherwise hereinafter called traditional study time at school. Let T = I + S represent
the total time students spend at school. We assume that the total time students spend at school
remains unchanged with the introduction of Internet in the school.
The performance of students depends on the effectiveness of the time they spend using the Internet
at school and on the effectiveness of the time they dedicate to traditional study at school. Therefore,
define p = f (I, S), where f is a production function. All else being equal, more of one input cannot
reduce output, thus we have fI ≥ 0 and fS ≥ 0.
The effect of Internet use in school on students’ performance is given by
dp
= fI − fS .
dI
At school, time on the Internet substitutes traditional study time without the Internet. The
productivity of Internet time at school (fI ) trades off with the productivity of traditional study
time (fS ) and thus performance can either increase or decrease when Internet is introduced in
schools.
Furthermore, split Internet time at school into learning time, L, and distraction time, D, and make
I = L + D. We also have ∂L/∂I ≥ 0, that is, all else being equal, more time on the Internet
does not reduce learning time. Likewise for distraction and thus ∂D/∂I ≥ 0. These statements,
together with I = L + D, imply that ∂L/∂I ≤ 1.
Consider now that the students’ performance depends on the effectiveness of the time they spend
learning on the Internet at school and on the effectiveness of the time they dedicate to traditional
study at school. Therefore, define p = g(L, S), where g is a production function. As before, we
have gL ≥ 0 and gS ≥ 0.
13
In this case, and using the fact that T = S + I is constant, the effect of Internet use at school on
students’ performance is given by
dp
∂L
= gL ·
− gS .
dI
∂I
The productivity of learning with the Internet (gL ) weighted by how Internet time is devoted to
learning (∂L/∂I) trades off with the productivity of traditional study time at school (gS ). Note
that gL · ∂L/∂I ≥ 0 and gS ≥ 0 and thus, again, the introduction of Internet in schools can either
increase or decrease performance. In fact,
gL
(∂L/∂I) − 1 .
sgn [dp/dI] = sgn
gS
The impact of Internet at school on students’ performance (dp/dI) is positive when the relative
productivity of learning time on the Internet at school to the productivity of traditional study time
at school (gL /gS ), weighted by how Internet time is devoted to learning (∂L/∂I), is greater than
one. One may expect that learning with the Internet may be more productive than traditional
study ( ggLS > 1). Even then, our model highlights that the impact of Internet is critically affected
by how Internet time is devoted to learning. Even if gL > gS , only if ∂L/∂I is large, that is, only
if students are largely using the Internet for learning purpose, we could expect their performance
to improve.
Consider a CES production function
p = [βLr + (1 − β)S r ]1/r ,
with 0 ≤ β ≤ 1 and r ≤ 1. Differentiating with respect to I yields
sgn [dp/dI] = sgn γ(L/S)r−1 · ∂L/∂I − 1 ,
where γ ≡ β/(1 − β). In this case, γ(L/S)r−1 is the relative productivity of learning time on the
Internet to traditional study time. For the case of a linear production function (r = 1), the effect of
Internet use in school is given by γ(∂L/∂I) − 1. Furthermore, if students devote a constant share
14
of the time they spend on the Internet at school to learning activities, call it α (α ≡ ∂L/∂I), then
the effect of Internet use in school is constant and given by
dp
= γα − 1.
dI
(1)
Or, in other words, the impact of Internet depends on how effective it is relative to standard study
and how much time students actually devote to learning activities.
6
6.1
Empirical Specification
First-Differences Model
School performance is assumed to depend on broadband use, on socio-economical factors, such as
average earnings, population density and percentage of people with mandatory level of education,
and on school-specific unobserved factors, such as the quality of teachers and the comfort and
size of the classrooms. Therefore, school performance can be expressed by the following structural
equation
pit = δ + ωIit + Xi β + Wit θ + ci + uit
(2)
where pit represents the performance of school i at time t; ω ≡ (γα − 1) is the effect of Internet use
on school performance (see Equation 1), our parameter of interest; Iit represents broadband use;
Xi and Wit are row vectors with time-fixed and time-varying school- and region-specific control
variables. We include, as time-invariant control variables, school size (measured by the number
of students in each school), population density, earnings in 2005, and the percentage of people
with mandatory level of education in 2001 in the municipality where the school is located. As
time-varying control, we use average Internet traffic rate per person (in Mbps per capita) at the
school’s closest ISP’s Central Office (CO). This variable is used as a proxy for home Internet use
in the region where the school is located. β and θ are parameter vectors; ci is an unobserved
15
time-constant school specific effect; and uit is a random error term.
This is the classic fixed-effects specification. Specifying a separate dummy for each school in the
form of ci allows for controlling for school-specific unobserved factors. Alternatively, we can write
this as a first-differences model as
∆pi = φ + ω∆Ii + ∆Wi θ + ∆ui .
(3)
Given that we will use only two time periods, we drop time subscript t. Furthermore, we assume
Internet use to be zero in 2005 and thus replace ∆I by broadband use in the last year of our period
of analysis.14 φ in equation (3) captures the average change in exam scores over the period of
analysis. For example, a φ > 0 captures the fact grades increased because, for example, exams
became easier. Note that the term Xi β in equation (2) gets differenced out because it corresponds
to time constant factors. However, to account for the possibility that some school-specific variables
in Xi might also drive the change in performance and in broadband use, we include the baseline
values of Xi as additional controls:
∆pi = φ + ω∆Ii + Xi β + ∆Wi θ + ∆ui .
(4)
This is equivalent to adding an extra term d2 · Xi β to our structural equation where d2 is an
indicator variable such that d2 = 1 for the later period in our analysis (2008 and 2009). This means
the effect of Xi on performance is different in the later period.15
We use three- and four-year differences to capture the accumulated effect of broadband use on
performance because differences in broadband use in schools over one single academic year are only
likely to have a little impact on that year’s exam scores, if at all. We estimate the first-differences
specification by running separate regressions for 2005-2008 and for 2005-2009, clustering the stan14
Broadband was brought to schools during the second half of 2005. Thus it is safe to assume there was
no broadband use for most of 2005, and in fact Internet use in 2005 is negligible when compared to 2008 and
2009 levels. In any case, we have used the exact differences in our regressions and obtained similar results.
15
Our results are similar whether or not we include Xi as controls. We leave these controls in the differences
equation for generality.
16
dard errors at the municipality level. We have also estimated pooled first-differences regressions
with 2005-2008 and 2005-2009. Both approaches yield the same qualitative results.16
6.2
Identification
Despite the first-differences setting and the controls in Xi , potential unobserved time-varying factors may result in increased broadband use and better (or worse) exam scores in 2008 and 2009,
leading to inconsistent estimates for ω. For example, a change in the resources available to a
school17 , internal organization or technical savviness, might have influenced both broadband use
and exam scores during the period of analysis. The school-specific dummies do not capture these
time-varying unobserved effects and therefore our estimates might become inconsistent.
We ensure identification by exploiting the variation in the quality of broadband connections across
schools as an exogenous source of variation in our setup. Schools that benefit from a better
connection to the Internet are more likely to use it more and therefore more likely to register more
traffic. With ADSL technology, a greater distance between the costumer’s premises and the ISP’s
Central Office (CO) results in a lower maximum transfer bitrate. Therefore, schools further away
from the CO are likely to get less throughput on their connection. Such lower throughput leads to
degraded performance decreasing the attractiveness of the broadband connection at the school and
thus lowering the amount of traffic exchanged with the Internet. Consequently, we use line-of-sight
distance between each school and its closest CO as a proxy for the quality of the school’s broadband
connection.18
Distance is an attractive choice for the instrument because one expects that the distance between
the schools and the CO would be fairly randomly distributed; schools and COs have been around for
much longer than broadband. The population in Portugal is fairly densely distributed. Therefore,
unlike the US where one would worry about rural schools being systematically farther from the CO
16
When pooling differences, we add a 2009 year dummy and an interaction term between broadband use
and the year 2009 to control for different effects in each of the differences.
17
During the period of analysis students were awarded laptops, under a parallel Governmental program.
This may have changed both broadband usage patterns and scores.
18
Line-of-sight distance is calculated from information on the GPS coordinates of both schools and the
ISP’s COs. We obtain similar results when using walking distance between the schools and CO, as calculated
by Google Maps.
17
than urban schools, Portugal is more homogeneous: many schools are within 2 Km from a CO (see
Figure 5) and there is little difference in distance of a urban school vs the rural school.
[Figure 5 about here.]
In Table 2 we provide the correlation matrix with distance and socio-economic characteristics for
middle schools. Distance does not seem to be correlated with any of the socio-economic characteristics. This strengthens our intuition that distance to CO seems to be fairly independent of specific
regional characteristics. Figures 6, 7 and 8 in the appendix offer more details on relationship
between distance and demographic characteristics.
[Table 2 about here.]
We also test whether distance explains grades before the deployment of broadband in schools. We
regress average school grades in 2005 on distance and other covariates for middle schools. Table 3
presents the results.
[Table 3 about here.]
Distance to CO is statistically and economically insignificant in Table 3 suggesting that school
grades are not affected by distance.19 Thus schools that perform better or worse are not systematically located closer or further from the CO. These facts suggest that distance from the CO is a
viable instrument for our analysis. More details on the appropriateness of distance as an instrument
are provided in the Appendix.
More importantly, notice that since we use the school fixed effects, we need distance to be uncorrelated with ∆ui in Equation (4) and not necessarily with ui . In other words, our strategy allows us
to control for various school unobserved effects increasing the robustness of our instrument. With
distance as an instrument, we estimate a two stage least squares (2SLS) specification as follows:
19
This coefficient on distance would yield a reduction of 0.08 of a standard deviation in grades per kilometer.
18
∆pi = φ + ω∆Ii + Xi β + ∆Wi θ + ∆ui
(5)
∆Ii = % + ηDistancei + Xi ϕ + ∆Wi ϑ + i
7
7.1
Results
Estimates without the instrument
We first estimate Equation (4) without accounting for endogeneity concerns. However, notice that
we still control for school unobservable effects via first differences. We use two separate time
windows, 2005-2008 and 2005-2009. The results are presented in columns (1) and (2) of Table 4.
Estimates with and without covariates are very similar. Broadband use is measured as average use
per student taking 100 MB as the unit. Results show a very small and statistically insignificant
relationship between change in exam scores and change in broadband use, both between 2005
and 2008, and between 2005 and 2009 (see Table 4). The signs also are different with a positive
estimate in 2008 and a negative one on 2009. However, not only the standard errors are high, the
estimates are economically insignificant. Given that we are using school fixed effects, as expected,
most control variables are statistically and economically insignificant. In short, the OLS produces
insignificant coefficients.
[Table 4 about here.]
7.2
Correcting for Endogeneity
The OLS estimates may be spurious due to time-varying unobserved effects. Namely, a change in
the internal organization of the school or new resources that a school might have obtained during
the period of analysis can influence both test scores and broadband use. To overcome this problem,
we estimate our Instrumental Variable (IV) specification as given by equation (5). The results are
19
presented in Table 5. Columns (1) and (2) present results without covariates while columns (3)
and (4) present results with all covariates. We present results for both 2005-2008 and 2005-2009.
[Table 5 about here.]
The first stage of the IV specification is presented in columns (1) and (3). The estimate on distance
is highly significant and negative in all specifications across both 2008 and 2009 years. This suggests
that our instrument works as expected. A one kilometer increase in the distance between a school
and the CO leads to about 13.0 MB (14.1 MB) decrease in total usage per student in 2008 (2009).
Notice that including covariates does not change the estimate on distance which confirms our earlier
analysis that distance is uncorrelated with other covariates. We provide additional details on the
effectiveness of our instrument the Appendix. Other estimates are sensible as well. Number of
students, earning of the municipality, and educational level at the municipalities all affect Internet
usage negatively. However, the estimates are quite small. Recall that most of the control variables
are pegged at 2005 levels.
Our key focus is in the results of the second stage which are presented in columns (2) and (4) of
Table 5. The key estimate of interest is how per capita broadband growth has affected grades. The
estimates for both 2005-2008 and 2005-2009 windows are negative, large and significant (at the
5% level for 2008 and at the 10% level for 2009). The sign on the estimate is now unequivocally
negative, pointing clearly the adverse effect of broadband on performance. Moreover, this effect
seems to be reasonably large. The 2008 estimate (-4.86) suggests that a unit (100 MB) increase in
broadband use at the student level leads to about 4.86 reduction in average grade. The average
broadband use per student in schools in 2008 was about 87 MB and the average grade in 2005 was
about 51. Therefore, broadband growth between 2005 and 2008 resulted in an average decrease of
8.3% in the average exam score, i.e., a decrease of about 0.76 standard deviations in 2008 scores.
This effect is still negative for the 2005-2009 period, though it becomes smaller in magnitude.
For 2009 broadband growth resulted in an average decrease of 7.4% in grades since 2005, which
represents a decrease of 0.67 standard deviations in 2009 scores. These results may suggest that the
adverse effect of broadband use can wear off with time. The estimates on other control variables
20
seem to be similar to OLS specification. Given the school fixed effects, most of the control variables
are insignificant.
In summary, for OLS specifications, we find no effect of broadband use on students’ performance.
However, once we instrument for broadband use, we consistently find a strong negative effect.
Therefore, our results seem to suggest that broadband use in school is generally detrimental for
students’ performance, at least during the years right after its introduction into the school’s environment. If one believes that distraction activities on the Internet (for example, listening to music,
playing games and watching movies) are inherently bandwidth intensive, then our instrument provides a consistent reason for the observed behavior. Schools which are closer to the CO, allow
higher throughput and thus make it easier for students to indulge in distractive activities, lowering
their exam scores. We will explore the distraction hypothesis in more detail in section 8.
The deployment of broadband in schools can certainly provide significant benefits and our results
do not suggest that schools should not have broadband. There are many other benefits broadband
may accrue which we do not measure. However, our results seem to suggest that merely connecting
schools to broadband may not be enough. Various other measures need to be implemented in
parallel in order to increase the productivity of investments in school broadband. We discuss the
implications of our results in detail in later sections.
7.3
Impact on Different Courses
The 9th grade score combines scores in math and Portuguese. Since we have information on scores
in each of these courses, we now split the data between math and Portuguese and examine how these
scores are affected by broadband usage. Literature does not provide a clear guidance on whether
computer or broadband should affect math or languages. Angrist & Lavy (2002) find a negative
effect in math exam scores for 8th graders. Malamud & Pop-Eleches (2010) find that families that
acquire computers had significant lower school grades in math, English and Romanian. Rouse &
Krueger (2004) find that use of a specific software designed to improve language or reading skills
(FastForWord) improves some aspects of students’ language skills. Banerjee et al. (2007) report
use of computer-assisted program improve the math scores slightly.
21
We estimate Equation 5 for math and Portuguese separately. For brevity we do not report the first
stage of IV regression. First stages yield consistent estimates as before. The results are presented
in Table 6.
[Table 6 about here.]
We get large, negative and statistically significant estimates for math and Portuguese in both years.
The only exception is the estimate for math in 2009 which is still negative but not statistically
significant. Consistent with Malamud & Pop-Eleches (2010), our results indicate that the adverse
effect of broadband is similar for math and Languages.
7.4
Impact Across Gender
We compute separate average scores for boys and girls for each school and run separate regressions
of performance on broadband use. Table 7 shows the results from separate IV regressions for 9th
graders. In all regressions broadband usage is detrimental for grades. In the 2005-2008 difference,
girls seem to be more affected than boys, both statistically and in magnitude. For the 2005-2009
difference, the coefficients for boys and girls are very similar though only the former is statistically
significant. Overall, these estimates are in line with the aggregate results and, essentially, show
that broadband in schools affects boys and girls alike.
[Table 7 about here.]
7.5
Low Performance vs. High Performance Schools
We also study which schools suffer the most with the introduction of broadband. We split our
sample of schools into quartiles based on their 9th grade average exam score in 2005, thus just
prior to the deployment of broadband. Table 8 shows the descriptive statistics for schools in the
1st and 4th quartiles. Notice that the distance of schools from the CO for the first and fourth
quartile schools in terms of test scores is economically insignificant confirming the validity of our
22
instrument. In 2005 average grade in the 4th quartile is 32% higher than in the 1st quartile. This
difference reduces to 19% and 18% in 2008 and 2009 respectively.
[Table 8 about here.]
We interact broadband use and distance with each of the quartile dummies in our IV setting.
Table 9 shows the results obtained. None of the quartile interaction variables displays a statistically
significant coefficient either in 2008 or 2009. Moreover, Wald tests suggest that there is no difference
across these coefficients. If anything, we see that the coefficient of the 4th quartile is more negative,
possibly indicating a slight approximation of schools in extreme quartiles. Overall, these results
suggest that broadband affects exam scores across all types of schools, independently of how good
they were prior to the deployment of broadband.
[Table 9 about here.]
8
Distraction Hypothesis: Additional evidence
The total amount of Internet traffic at each school is not enough to estimate α and γ in equation
(1) separately. To better understand how distraction and learning with the Internet at school affect
students’ grades we need to acknowledge that different schools put in place different strategies to
benefit from the Internet that ultimately result in different usage patterns and learning experiences.
In particular, some schools restrict access to distracting websites and applications such as Facebook
and YouTube (i.e., schools with higher α), while other schools allow full access to the Internet. If
the impact of broadband on school performance is negative due to these distractive activities, we
should see the effect of such policies on school performance and broadband use.
We designed a survey to middle schools in Portugal in order to better understand current Internet
access policies and practices. The survey consisted of 27 questions and was administered over the
phone to school ICT managers between December 10th 2010 and January 17th 2011.20 A total of
20
The role of ICT manager is well defined in each school, and corresponds to the person that is responsible
for the maintenance of the school’s computers and network. This role is usually attributed to one of the ICT
teachers in the school.
23
344 answers were obtained (response rate of 55%). Schools who completed the survey are similar
to schools that did not in terms of grades, size and distance to the CO, but are different21 in terms
of Internet usage, population density, income levels and basic education levels (see Table 1022 ).
[Table 10 about here.]
Among other questions, the survey asked whether the school blocks access to specific websites or
applications. Respondents indicated a subset of the following options as sites or applications blocked
in the school: YouTube, Facebook, Hi5, MySpace, Chat Applications, Online Games, Other Video
Sites, File Sharing Applications, Blocking is performed by ISP, Other Sites, No Sites or Applications
are Blocked. This question seems to be the one that best proxies distraction activities with the
Internet at school. The other questions in the survey covered mostly IT resources and skills. For
example, we asked if schools had wireless networks on campus that students could tap into and
we asked if teachers had any specific IT related training. The answers to these questions show
substantial variance across schools in terms of the practices put forward to benefit from Internet
connectivity.
We will examine if these policies have an impact on school performance. Such policies possibly
proxy for the school attitude towards technology use. By explicitly capturing these in our analysis,
we are controlling for these (hence) unobserved differences across schools. Though we use school
fixed effects, we cannot completely rule out that the policies might be endogenous. Our focus,
however, is to extend our earlier model by examining how the marginal effect of broadband is
conditioned by school policies.
Schools seem to be quite heterogeneous in terms of what content and activities they allow. We will
focus on two measures. First, we examine if the schools that block all activities perform differently.
Second, we examine the role of YouTube. We focus on YouTube in particular because not only it
may be a distracting activity, it is also bandwidth intensive. Thus the marginal effect of Internet
use in schools that allow YouTube should capture the effect of distraction. We first present some
summary statistics in Table 11.
21
We use 95% confidence interval t-tests to test whether the two groups have the same mean.
The ‘*’ symbols correspond to significance levels in equal variance t-tests for the difference between
surveyed and non-surveyed schools. See table footer.
22
24
[Table 11 about here.]
The differences in these characteristics between schools that block and allow these applications are
not large. The average 2005 grades across schools are quite similar. Still, schools in slightly higher
income and more educated regions are more likely to block YouTube. The Internet use in schools
that allow YouTube is substantially higher as expected.
Our hypothesis is that Internet use is more harmful in schools that do not restrict access to distracting websites or applications. To test this hypothesis we add the indicator No Blocks to our IV setup
along with the the interaction between Internet use and the No Blocks indicator in the 2005-2008
and 2005-2009 windows.23 We also assume that the Internet usage policies in these schools have
not changed from 2005 to 2008 and 2009.24 Since we are assuming No Blocks to be a time-fixed
school characteristic, it would be differenced out along with the other time-fixed covariates. By
including it in the differences equation we are allowing it to drive the change in school performance,
along with all other time-constant covariates (see Section 6.1).
Table 12 shows the results obtained.25 Schools that do not block access to any web site or application performed worse than average: 3.5% between 2005 and 2008 (column (1)), i.e., 0.32 of a
standard deviation. The magnitude of the No Block coefficient, 1.778, corresponds to about 3.5%
of 50.95 — the average grade in 2005 — and to about 0.32 of 5.579, the average grades’ standard
deviation in 2008. This effect wears off in 2009. After including the interaction term of No Blocks
and Internet usage (column (3)), the effect of school policy disappears. The marginal effect is large
and negative for 2008 suggesting that the effect of Internet is more negative for schools which do
not block distrative activities but it is not precisely estimated, and wears off by 2009.
[Table 12 about here.]
The No Blocks indicator provides preliminary evidence that between 2005 and 2008 schools that
23
We use the interaction between the predicted Internet use and the No Blocks indicator as a second
instrument.
24
Several schools reported that they have been blocking more sites over time, taking advantage of a filtering
service provided by the ISP for this purpose. Thus, our estimates might be biased downwards, and, therefore,
should be interpreted as a lower-bound.
25
Some covariates are missing for some of the middle schools that were surveyed and therefore the number
of observations in these regressions falls short of 344. First stage estimates are provided in Appendix.
25
do not block any type of content perform worse. However, we do not find evidence that this is
related to Internet use given that the estimate on the interaction terms is statistically insignificant
in the regressions above. One of the reasons for this result might be that not all websites are
bandwidth-intensive and thus it is hard to establish a relationship between the time students spend
in distraction activities and the amount of bytes consumed. For all the web sites and applications
considered in our survey, YouTube seems to be the one for which a linear relationship between
Internet use and distraction time is more likely to hold. Social network sites, chat applications
and online games are relatively low-bandwidth intensive, so students can spend a lot of time with
them without consuming many bytes. On the other hand, file-sharing applications are bandwidth
intensive, but students can share files in the background as they perform other activities. Hence,
as explained earlier, we build an indicator, called Allow YouTube to identify laxer schools in terms
of Internet access policies.
As before, we use our IV setup to regress change in average grade in the 2005-2008 and 20052009 windows on Internet use, our regional co-variates, the Allow YouTube indicator, and the
interaction between Internet use and this indicator. Again, we use the interaction between the
predicted Internet use and the Allow YouTube indicator as a second instrument. Table 13 shows
the results obtained.26 Schools that allow YouTube perform worse than the average: the magnitude
of the Allow YouTube coefficient, 1.856, corresponds to about 3.6% decline between 2005 and 2008
and the estimate 1.975 correspond to about 3.7% decline between 2005 and 2009 (columns (1) and
(2)), i.e., 0.33 of a standard deviation. Including the interaction effect shows that the Internet use
in schools that allow YouTube leads to a large adverse effect on grades, especially for 2008 (column
(3)). For 2009 the effect is negative and large but not precisely estimated (column (4)).
In sum, consistent with our story, we find evidence that the way schools allow students to use
Internet connectivity affects students’ performance and students do relatively worse in schools that
enact laxer access policies that do not control the opportunities for exaggerated distraction.
[Table 13 about here.]
26
First stage estimates are provided in Appendix.
26
9
Conclusion and Discussion
There is a general belief that providing schools with computers and broadband improves the quality
of education and, consequently, increases productivity levels and wages. However, reliable empirical
evidence of this fact has been hard to establish. Our paper lays out a model to explain why the
introduction of broadband in schools might have competing effects on student performance. The
trade-off comes from the fact that broadband in schools provides students and teachers with a
new resource to learn that can complement traditional study but also with an opportunity for
distraction whereby students indulge in unproductive activities what take time away from study.
We use a comprehensive dataset on broadband use in every middle school in Portugal to examine
its impact on students’ performance. We measure performance by the scores that students obtain
in 9th grade national exams. Despite using school fixed effects, one of the challenges we face is that
school performance and broadband usage may be endogenous. We correct for potential endogeneity
using the distance between the school and the ISP’s Central Office as an instrument for broadband
use. All tests on the robustness of our the instrument suggest that it is a credible instrument. In
this regard, our paper makes a significant methodological contribution. Once we instrument for
broadband usage, we find evidence that the broadband hurts student performance. Our analysis
shows that on average broadband is responsible for a decline of 0.76 of a standard deviation in
grades in the 2005-2008 window. This statistic becomes 0.67 in the 2005-2009 window, which
might suggest that this effect might wear off over time.
We also study the effects of broadband use on math and Portuguese exam scores separately. Consistent with the aggregate results, we find negative and statistically significant estimates for math
and Portuguese in both 2005-2008 and 2005-2009, the only exception being the estimate for math
in 2005-2009 which is still negative but not statistically significant. Thus, our results seem to
indicate that the adverse effect of broadband in schools affects math and Portuguese scores alike.
We also show that both boys and girls are negatively affected by broadband use. We then split
schools into quartiles based on their test scores in 2005 and observe if schools in different quartiles
behave differently. We find that all types of schools are equally affected by broadband regardless of
their performance in 2005. Therefore, we find that merely providing broadband to low performing
27
schools is not sufficient to push them towards the mean.
To explore the distraction effect of Internet in more detail, we conduct a survey to understand how
Internet in utilized in schools. Some schools block many applications and services which can be
characterized as distractive (such as music, movies, chat, online gaming). Using these additional
data, we find that schools that block access to all such activities perform better that the schools
which do not. More interestingly, we focus on YouTube access, which is a bandwidth intensive
application. In fact, schools which allow YouTube, typically also consume more bandwidth. Therefore, the marginal effect of Internet use should be large for such schools if one believes that YouTube
causes distraction. We find strong evidence that indeed Internet use is significantly more adverse
in schools that allow access to YouTube.
Our study, applied to the case of Portugal, shows that the introduction of broadband in schools
does not necessarily contribute to increase students’ performance, at least in the years right after its
deployment. While we do not have direct measurement, our results suggest that the introduction
of broadband in the school environment must be complemented with policies aimed at effectively
embedding the Internet in the education system that promote productive use of the Internet in
ways that complement traditional study. This may be particularly true for students in early high
school who, without proper monitoring, may be more likely to engage in distracting activities. We
also find that merely providing technology resources to poor performing schools is not enough to
bridge the performance gap. A technology like broadband may not always be used productively,
hence its availability in poor performing schools might not necessarily translate into better grades
all of a sudden.
While we use a very detailed dataset, our study is not without limitations. We do not know precisely
the kind of activities students engage in with the Internet. Future work should complement this
paper by either monitoring Internet connections in schools at the protocol level or surveying directly
teachers and students in order to gather a deeper understanding of how broadband is effectively
used. Similarly, broadband may still be beneficial for students in ways that test scores do not
capture, whose effects our study cannot appreciate. For example, broadband deployment in schools
allows students to be exposed to new sets of technologies that they will most likely use later both in
28
their professional careers to increase their productivity and in their personal lives to facilitate, for
example, communication with friends and family. However, these kinds of benefits are extremely
difficult to measure and our study fails to take them into account. Nevertheless, we must emphasize
that in any country education policy today is largely shaped by schools’ performance and in that
regard our paper is the first of its kind to provide concrete evidence of how the introduction of
broadband in schools affects student performance.
Funding
This work was supported by the Funda¸c˜ao para a Ciˆencia e Tecnologia (Portuguese Foundation for Science and Technology) through the Carnegie Mellon Portugal Program under Grant
SFRH/BD/35680/2007 and Research Contract NGN/56.
Acknowledgements
The authors thank Marvin Sirbu, Francisco Lima, Shane Greenstein, seminar participants at Engineering and Public Policy and SETChange at Carnegie Mellon University, at the Wharton School
of Business, University of Pennsylvania, at the Foster School of Business, University of Washington,
the National Bureau of Economic Research, and International conference on Information Systems
(ICIS) for many constructive comments. All errors are ours. Author names are in alphabetical
order.
References
Angrist, J., & Lavy, V. (1999). Using Maimonides’ Rule to Estimate The Effect of Class Size on
Scholastic Achievement*. Quarterly Journal of Economics, 114 (2), 533–575.
Angrist, J., & Lavy, V. (2002). New evidence on classroom computers and pupil learning. Economic
Journal , (pp. 735–765).
29
Banerjee, A. V., Cole, S., Duflo, E., & Linden, L. (2007). Remedying education: Evidence from
two randomized experiments in india. Quarterly Journal of Economics, 122 (3), 1235–1264.
Barrera-Osorio, F., & Linden, L. L. (2009). The Use and Misuse of Computers in Education :
Evidence from a Randomized Experiment in Colombia. SSRN eLibrary.
Barrow, L., Markman, L., & Rouse, C. (2009). Technology’s Edge: The Educational Benefits of
Computer-Aided Instruction. American Economic Journal: Economic Policy, 1 (1), 52–74.
Card, D. (1999). The causal effect of education on earnings. Handbooks in Economics, 5 (3 PART
A), 1801–1864.
Coleman, J. (1968). Equality of educational opportunity. Equity & Excellence in Education, 6 (5),
19–28.
Cuban, L., & Kirkpatrick, H. (1998). Computers Make Kids Smarter–Right?. Technos, 7 (2), 26–31.
´ - Internet nas Escolas. (in Portuguese).
ESES (2002). ESE DE SANTAREM
URL http://nonio.eses.pt/asp/proj2/
FCT (2001). Fct - internet na escola. (in Portuguese).
URL http://www.fct.mctes.pt/programas/interescola.htm
Goolsbee, A., & Guryan, J. (2006). The impact of Internet subsidies in public schools. The Review
of Economics and Statistics, 88 (2), 336–347.
Hanushek, E. (1986). The economics of schooling: Production and efficiency in public schools.
Journal of economic literature, 24 (3), 1141–1177.
Hanushek, E. A., Rivkin, S. G., & Taylor, L. L. (1996). Aggregation and the estimated effects of
school resources. The Review of Economics and Statistics, 78 (4), 611–627.
URL http://www.jstor.org/stable/2109949
Krueger, A. (1999). Experimental Estimates of Education Production Functions*. Quarterly Journal of Economics, 114 (2), 497–532.
30
Lavy, V. (1999). Using dual natural quasi-experimental designs to evaluate the effect of school
hours and class size on student achievement. Department of Economics, Hebrew University,
Jerusalem.
Leuven, E., Lindahl, M., Oosterbeek, H., & Webbink, D. (2007). The effect of extra funding for
disadvantaged pupils on achievement. The Review of Economics and Statistics, 89 (4), 721–736.
Machin, S., McNally, S., & Silva, O. (2007). New Technology in Schools: Is There a Payoff?*. The
Economic Journal , 117 (522), 1145–1167.
Malamud, O., & Pop-Eleches, C. (2010). Home computer use and the development of human
capital. NBER Working Papers 15814, National Bureau of Economic Research, Inc.
URL http://econpapers.repec.org/RePEc:nbr:nberwo:15814
Mankiw, N., Romer, D., & Weil, D. (1992). A contribution to the empirics of economic growth.
The quarterly journal of economics, (pp. 407–437).
Rouse, C., & Krueger, A. (2004). Putting computerized instruction to the test: a randomized
evaluation of a “scientifically based” reading program. Economics of Education Review , 23 (4),
323–338.
Sacerdote, B. (2001). Peer Effects with Random Assignment: Results for Dartmouth Roommates*.
Quarterly Journal of Economics, 116 (2), 681–704.
Staiger, D., & Stock, J. H. (1997). Instrumental variables regression with weak instruments. Econometrica, 65 (3), 557–586.
URL http://www.jstor.org/stable/2171753
Stock, J., Yogo, M., & Center, L. (2002). Testing for weak instruments in linear IV regression.
NBER Working Paper .
UMIC (2007). Todas as escolas p´
ublicas de portugal acedem `a internet em banda larga. (in
Portuguese).
URL http://www.umic.pt/index.php?option=com content&task=view&id=2595&Itemid=86
31
Underwood, J., Ault, A., Banyard, P., Bird, K., Dillon, G., Hayes, M., Selwood, I., Somekh, B., &
Twining, P. (2005). The impact of broadband in schools. Nottingham Trent University/Becta.
Webbink, H. (2005). Causal effects in education. Journal of Economic Surveys, 19 (4), 535–560.
32
Appendix
Robustness tests for Distance as an Instrument
The distance between a school and the CO that serves it is a good instrument because the speed of
the ADSL connection reduces with the length of the copper wire (see Figure 9 for ADSL theoretical
limits.27 )
Our first stage regressions show that this is the case. Also, grades in 2005 seem to be unaffected
by distance, after controlling for region and school-specific characteristics (see Table 3).
There is, however, the concern that end-users may not be able to appreciate differences in the quality
of ADSL connections for short distances between schools and COs, rendering our instrument invalid
for schools that are very close to the CO. Also, ADSL speeds may have been capped by the provider,
which would render the quality of ADSL connections similar for all schools close to the CO. We
test these hypotheses by introducing distance threshold dummies in the first-stage regression.
Table 14 shows that none of the distance thresholds is significant in 2009.28 This shows that usage
reduces with distance for schools close and far away from the CO alike. This is consistent with the
hypotheses that ADSL connections have not been capped, at least not at a rate that schools do
use, and that users perceive differences in the quality of the ADSL connection even across schools
that are close to the CO.
[Table 14 about here.]
There is also a concern that distance to CO and regional co-variates such as population density,
earnings and mandatory education are correlated. Table 2 shows that this is not the case. Furthermore, Figure 6 shows that the distance to CO for schools in both high and low density areas
ranges from a few meters to as much as 5 Km. Likewise for earnings and mandatory education as
Figures 7 and 8 report.
[Figure 6(a) about here.]
[Figure 7(a) about here.]
27
28
Data obtained from http://whirlpool.net.au/wiki/?tag=DSLAM speeds.
Regressions for 2008 yield similar results.
33
[Figure 8(a) about here.]
Testing for weak instrument
As mentioned by Staiger & Stock (1997), weak instruments may lead to a more severe bias than
the bias introduced by OLS estimates when one of the regressors is endogenous. We follow Stock
et al. (2002) to test whether distance to the ISP’s CO is a weak instrument. We use the sizebased definition of weak instruments to test whether the correlation between our instrument and
the endogenous regressor is weak, in which case the conventional first-order asymptotics no longer
hold. Table 15 shows the F-statistics for the distance to the CO in the first-stage of our main
regressions. The Stock et al. critical value for a test of size r = 0.2 and significance level α = 0.05
is 6.66. Therefore, our instrument does not belong in the set of weak instruments, for this size and
significance level, for both 2008 and 2009. In fact, in 2009 we can even consider a stricter size for
our test, such as r = 0.1 whose critical value is 16.38.
[Table 15 about here.]
Schools’ descriptive statistics by restriction policy
Table 16 shows the descriptive statistics for middle schools by restriction policy. Roughly 26% of the
schools report blocking Facebook. These schools are usually smaller and located in more affluent
areas. Schools that block YouTube (7%) tend to be bigger and located in areas with higher levels of
basic education. These schools also did slightly better in national exams than other schools in 2008
and 2009, but not in 2005. Schools that block chat applications (33%) tend to have lower grades
and tend to be more distant from the central office. Schools that block online games (54%) tend to
be smaller and to use more Internet on a per-student basis. Schools that block adult content (79%)
and schools that block file sharing applications (49%) do not seem to be different from schools that
do not.
[Table 16 about here.]
34
First-stage regressions by restriction policy
Tables 17 and 18 show the first stages for the regressions presented in Tables 12 and 13 in section
8. All instruments are highly significant and behave as expected. We also test the weakness
of the new sets of instruments. Table 19 shows Kleibergen-Paap Wald F-statistics for each of
the regressions and the corresponding minimum size of r so that each set of instruments is not
considered weak at the significance level α = 0.05. As before, setting r = 0.2 is enough to rule
out the weakness hypothesis for 2008 when using Distance to CO as the only instrument. When
using two instruments, we need to set r = 0.25. For 2009 we can use the stricter value of r = 0.1,
independently of whether we are using one or two instruments.
[Table 17 about here.]
[Table 18 about here.]
[Table 19 about here.]
35
Figures
Figure 1: Broadband schools’ connection to the Internet. Schools connect through a copper
line to the ISP’s central office. From there, the ISP ensures connectivity to the Internet
backbone through fiber.
36
Average Monthly Traffic / Student (MB)
Middle−schools
20
40
60
80
100
Total
Download
0
Upload
2002
2004
2006
Year
2008
2010
Figure 2: Middle school Internet traffic between 2003 and 2009.
37
150
Frequency
100
50
0
0
200
400
600
INet Usage / Student (MB)
Middle−schools
800
Figure 3: Middle school monthly average Internet use per student in 2009.
38
80
9th Grade Average Exam Score
40
50
60
70
30
2005
2006
2007
Year
2008
2009
Figure 4: 9th grade average exam scores between 2002 and 2009.
39
150
100
Frequency
50
0
0
1
2
3
School Distance to CO (Km)
Middle Schools
4
Figure 5: Middle Schools’ distances to the closest CO.
40
5
100
0
20
Frequency
40
60
80
100
80
Frequency
40
60
20
0
0
1
2
3
School Distance to CO (Km)
Middle Schools
Pop. Density <= 500
4
5
0
(a) Pop. Density ≤ 500.
1
2
3
School Distance to CO (Km)
Middle Schools
Pop. Density > 500
4
(b) Pop. Density > 500.
Figure 6: Middle School distances to the closest CO by Population Density.
41
5
100
0
20
Frequency
40
60
80
100
80
Frequency
40
60
20
0
0
1
2
3
School Distance to CO (Km)
Middle Schools
Earnings lower than median
4
5
0
(a) Earnings lower than median
1
2
3
School Distance to CO (Km)
Middle Schools
Earnings higher than median
4
(b) Earnings higher than median
Figure 7: Middle School distances to the closest CO by Earnings.
42
5
100
0
20
Frequency
40
60
80
100
80
Frequency
40
60
20
0
0
1
2
3
School Distance to CO (Km)
Middle Schools
Mand Educ. lower than median
4
5
0
(a) Mand Educ. lower than median
1
2
3
School Distance to CO (Km)
Middle Schools
Mand. Educ higher than median
4
(b) Mand Educ. higher than median
Figure 8: Middle School distances to the closest CO by Educ Level.
43
5
26 000
20 000
Speed (Kbps)
ADSL2+
15 000
10 000
ADSL
5000
0
0
0.5
1
1.5
2
2.5
3
3.5
4
4.5
5
Distance (Km)
Figure 9: Bandwidth versus distance for ADSL and ADSL2+, assuming a downstream
attenuation of 13.81 dB and an attainable rate of 8,000 kbps and 22,500 kbps for ADSL and
ADSL2+, respectively.
44
Tables
Table 1: Summary statistics.
VARIABLES
(1)
N
(2)
mean
(3)
sd
(4)
min
(5)
max
Avg. Grade 2009 (0-100)
Avg. Grade 2008 (0-100)
Avg. Grade 2005 (0-100)
INet Usage 2009 / Stu. (MB)
INet Usage 2008 / Stu. (MB)
Students
Pop. Density
Earnings 2005
Mandatory Educ. (%)
628
628
628
628
628
628
628
628
628
57.89
59.77
50.95
111.2
86.70
579.3
1,820
787.0
39.14
5.669
5.579
5.035
95.32
97.42
239.2
2,868
186.8
13.73
39.39
39.44
35.88
4.22e-04
0.123
72
5.800
532.8
10.38
75.94
79.29
68.94
800.5
1,766
1,412
20,648
1,487
80.05
45
Table 2: Cross-Correlations for Middle Schools.
Variables
Students
Pop. Density
Earnings
Mandatory Educ. (%)
Avg. CO Traffic 2005 (Mbps)
Distance (Km)
0.034
-0.030
-0.023
-0.106
0.121
Students
Pop. Density
Earn. 2005
Mand. Educ. (%)
0.323
0.095
0.401
0.090
0.496
0.521
-0.047
0.579
-0.124
0.011
46
Table 3: Average score in 2005 as a function of distance and other controls (OLS).
(1)
Avg. Grade 2005
VARIABLES
Distance (Km)
Students (x 1000)
Pop. Density (x 1000)
Earnings (x 1000)
Mandatory Educ. (%)
Avg. CO Traffic (Mbps)
Constant
-0.379
(0.236)
1.494
(1.191)
-0.183**
(0.0838)
-0.464
(1.116)
0.119***
(0.0245)
-154.2
(221.9)
46.50***
(0.984)
Observations
538
R-squared
0.098
Robust standard errors in parentheses
*** p<0.01, ** p<0.05, * p<0.1
47
Table 4: Changes in 9th grade performance as a function of broadband use (OLS).
VARIABLES
INet Usage / Student (100 MB)
Students (x 1000)
Pop. Density (x 1000)
Earnings (x 1000)
Mandatory Educ. (%)
∆ Avg. CO Traffic (Mbps)
Constant
(1)
2008
(2)
2009
0.0459
(0.174)
0.505
(0.898)
-0.155
(0.0983)
1.230
(1.638)
0.0289
(0.0179)
-1.546
(69.77)
6.686***
(1.374)
-0.130
(0.334)
-0.573
(1.067)
-0.0264
(0.0897)
-2.940**
(1.195)
-8.66e-03
(0.0186)
-21.56
(38.88)
10.26***
(1.326)
Observations
534
527
R-squared
0.012
0.020
Robust standard errors in parentheses
*** p<0.01, ** p<0.05, * p<0.1
48
Table 5: Change in 9th grades as a function of broadband use (IV).
2008
VARIABLES
(1)
1st Stg
INet Usage
(2)
2nd Stg
Pop. Density (x 1000)
Earnings (x 1000)
Mandatory Educ. (%)
∆ CO Traffic
Constant
Observations
R-squared
(4)
2nd Stg
-4.859**
(2.367)
Students (x 1000)
Distance (Km)
2009
(3)
1st Stg
-0.130**
(0.0501)
0.994***
(0.0891)
640
0.011
13.00***
(1.929)
640
-1.522***
(0.244)
4.52e-03
(8.60e-03)
-0.493***
(0.176)
-9.60e-03**
(3.72e-03)
9.153
(8.009)
-0.161***
(0.0544)
2.669***
(0.353)
(1)
1st Stg
-4.999**
(2.268)
-7.402**
(3.044)
-0.134
(0.116)
-1.616
(2.297)
-9.52e-03
(0.0255)
14.18
(87.43)
19.37***
(5.064)
(3)
1st Stg
-3.415*
(1.993)
-0.141***
(0.0453)
1.259***
(0.0834)
534
534
631
0.222
0.013
Robust standard errors in parentheses
*** p<0.01, ** p<0.05, * p<0.1
49
(2)
2nd Stg
10.72***
(2.204)
631
-1.856***
(0.220)
1.11e-03
(9.55e-03)
-0.968***
(0.238)
-8.51e-03***
(3.04e-03)
2.577
(5.883)
-0.166***
(0.0379)
3.455***
(0.285)
527
0.368
(4)
2nd Stg
-3.400*
(1.770)
-6.794*
(3.502)
-0.0230
(0.105)
-6.347***
(2.324)
-0.0297
(0.0246)
-24.06
(48.53)
21.02***
(5.913)
527
Table 6: Performance in math and Portuguese and Broadband use (IV)
VARIABLES
INet Usage / Student (100 MB)
Students (x 1000)
Pop. Density (x 1000)
Earnings (x 1000)
Mandatory Educ. (%)
∆ Avg. CO Traffic (Mbps)
Constant
Observations
(1)
2008
Port.
-4.290**
(2.164)
-6.927**
(3.145)
-0.121
(0.113)
-1.920
(2.097)
-0.0116
(0.0267)
29.52
(77.49)
13.34***
(4.968)
(2)
Math
(3)
2009
Port.
Math
-5.823**
(2.825)
-8.005**
(3.764)
-0.154
(0.140)
-1.517
(2.878)
-9.15e-03
(0.0323)
4.658
(113.4)
25.68***
(6.331)
-4.021**
(1.684)
-6.934**
(3.261)
-0.0370
(0.0951)
-5.642***
(2.051)
-0.0343
(0.0280)
33.87
(45.22)
11.68**
(5.560)
-3.000
(2.413)
-7.017
(4.767)
-0.0152
(0.146)
-7.358**
(3.368)
-0.0278
(0.0324)
-79.49
(66.66)
31.05***
(8.056)
534
534
Robust standard errors in parentheses
*** p<0.01, ** p<0.05, * p<0.1
50
527
(4)
527
Table 7: Estimates for Boys and Girls.
VARIABLES
INet Usage / Student (100 MB)
Students (x 1000)
Pop. Density (x 1000)
Earnings (x 1000)
Mandatory Educ. (%)
∆ Avg. CO Traffic (Mbps)
Constant
Observations
(1)
2008
Male
-3.959
(2.417)
-3.567
(3.411)
-0.192
(0.130)
1.669
(2.643)
-0.0122
(0.0301)
16.93
(90.58)
12.96**
(5.672)
(2)
Female
(3)
2009
Male
Female
-5.921**
(2.714)
-10.66***
(3.568)
-0.0970
(0.129)
-4.937*
(2.624)
-1.76e-03
(0.0316)
-14.38
(116.5)
25.25***
(5.914)
-3.201*
(1.895)
-4.934
(3.728)
-0.0726
(0.134)
-5.453*
(3.269)
-0.0290
(0.0279)
-4.354
(49.70)
18.17***
(6.655)
-3.234
(2.276)
-8.278*
(4.358)
0.0186
(0.0968)
-7.034***
(2.520)
-0.0335
(0.0301)
-30.81
(56.05)
23.27***
(7.379)
528
528
521
Robust standard errors in parentheses
*** p<0.01, ** p<0.05, * p<0.1
51
(4)
521
Table 8: Descriptive statistics for schools in the 1st and 4th Quartiles in 2005.
Variable
1st Quart. 4th Quart.
Diff.
Avg. Grade 2005 (0-100)
44.78
59.26
-14.48***
Avg. Grade 2008 (0-100)
55.89
66.51
-10.61***
Avg. Grade 2009 (0-100)
54.31
64.22
-9.92***
Students
549.6
582.9
-33.36
Pop. Density
2017.7
2221.0
-203.3
Earnings
786.43
833.14
-46.71**
Mandatory Educ. (%)
36.49
44.46
-7.97***
Distance (Km)
1.10
0.95
0.15*
*** p<0.01, ** p<0.05, * p<0.1 (t-tests eq. var.)
52
Table 9: Change in 9th grade performance as a function of broadband use (2008 and 2009).
VARIABLES
INet Usage * 1st Q.
INet Usage * 2nd Q.
INet Usage * 3rd Q.
INet Usage * 4th Q.
Students (x 1000)
Pop. Density (x 1000)
Earnings (x 1000)
Mandatory Educ. (%)
∆ Avg. CO Traffic (Mbps)
Constant
Quartile Dummies
(1)
2008
(2)
2009
-3.053
(2.418)
-8.136
(11.13)
-1.428
(3.860)
-16.06
(12.04)
-10.56*
(6.365)
-0.303*
(0.163)
-3.936
(4.419)
0.0392
(0.0476)
-4.030
(116.8)
22.20***
(6.580)
-3.998
(4.869)
0.267
(3.743)
-3.744
(2.677)
-5.661
(5.889)
-5.873
(4.080)
-0.131
(0.118)
-7.834**
(3.498)
0.0236
(0.0323)
-67.83
(49.64)
23.73**
(9.586)
Yes
Yes
Observations
534
527
Robust standard errors in parentheses
*** p<0.01, ** p<0.05, * p<0.1
53
Table 10: Summary statistics. Surveyed vs. non-surveyed schools.
VARIABLES
Avg. Grade 2005 (0-100)**
INet Usage 2009 / Stu. (MB)***
INet Usage 2008 / Stu. (MB)**
Students
Pop. Density**
Earnings 2005**
Mandatory Educ. (%)***
Distance (Km)*
(1)
No Survey
(2)
Survey
51.36
(5.122)
100.2
(81.41)
77.30
(65.81)
589.0
(231.9)
2,142
(3,211)
802.8
(183.0)
40.84
(13.74)
1.025
(0.716)
50.60
(4.943)
120.2
(104.7)
94.46
(116.8)
571.2
(245.1)
1,553
(2,523)
773.9
(189.2)
37.74
(13.59)
1.111
(0.815)
Observations
284
344
*** p<0.01, ** p<0.05, * p<0.1 (t-tests eq. var.)
54
Table 11: Summary statistics by blocking policy: No Bocks and Allow YouTube.
VARIABLES
Avg. Grade 2005 (0-100)
INet Usage 2009 / Stu. (MB)
INet Usage 2008 / Stu. (MB)
Students
Pop. Density
Earnings 2005
Mandatory Educ. (%)
Distance (Km)
Observations
(1)
No Block
(2)
Block
(3)
Allow YouTube
(4)
Block YouTube
51.76
(4.231)
120.4
(104.0)
83.41
(65.83)
607.4
(255.4)
1,766
(2,028)
766.9
(168.1)
39.54
(12.51)
1.164
(0.883)
50.41
(5.030)
120.2
(105.0)
96.25
(123.1)
565.3
(243.4)
1,519
(2,596)
775.1
(192.7)
37.45
(13.75)
1.102
(0.805)
50.55
(4.887)
121.8
(106.9)
95.83
(120.4)
563.6
(246.4)
1,557
(2,564)
770.0
(182.9)
37.36
(13.49)
1.103
(0.808)
51.33
(5.670)
100.0
(68.50)
76.95
(49.40)
668.5
(209.6)
1,508
(1,965)
824.3
(255.8)
42.59
(14.13)
1.215
(0.911)
48
296
319
25
55
Table 12: Change in 9th grade performance as a function of broadband use and site blocking
policy (IV).
VARIABLES
INet Usage / Student (100 MB)
(1)
2008
(2)
2009
(3)
2008
(4)
2009
-3.271**
(1.626)
-2.528*
(1.456)
-1.778**
(0.804)
-5.050*
(2.680)
0.0293
(0.119)
-1.015
(2.872)
-0.0300
(0.0325)
-37.91
(97.24)
17.21***
(4.251)
-0.215
(0.822)
-6.752*
(3.864)
0.171
(0.123)
-6.206**
(2.478)
-0.0160
(0.0307)
-73.88
(69.75)
19.68***
(5.777)
-3.094*
(1.632)
-3.026
(2.087)
0.722
(1.713)
-5.409*
(2.822)
0.0411
(0.119)
-1.535
(2.821)
-0.0283
(0.0327)
-32.48
(102.4)
17.55***
(4.399)
-2.534*
(1.466)
0.0885
(0.936)
-0.319
(1.038)
-6.732*
(3.875)
0.171
(0.124)
-6.186**
(2.483)
-0.0160
(0.0307)
-73.80
(69.75)
19.66***
(5.778)
INet * No Blocks
No Blocks
Students (x 1000)
Pop. Density (x 1000)
Earnings (x 1000)
Mandatory Educ. (%)
∆ Avg. CO Traffic (Mbps)
Constant
Observations
289
286
Robust standard errors in parentheses
*** p<0.01, ** p<0.05, * p<0.1
56
289
286
Table 13: Change in 9th grade performance as a function of broadband use and YouTube
block policy (IV).
VARIABLES
INet Usage / Student (100 MB)
(1)
2008
(2)
2009
(3)
2008
(4)
2009
-2.967*
(1.596)
-2.422*
(1.413)
-1.856**
(0.935)
-4.801*
(2.739)
0.0360
(0.121)
-0.925
(2.893)
-0.0319
(0.0314)
-60.79
(89.26)
18.28***
(4.470)
-1.975**
(0.975)
-6.838*
(3.780)
0.192
(0.128)
-6.400**
(2.489)
-0.0159
(0.0303)
-81.78
(65.28)
21.54***
(6.035)
4.009
(2.853)
-6.975***
(2.445)
3.161
(2.000)
-4.701*
(2.687)
0.0219
(0.120)
-1.081
(2.770)
-0.0196
(0.0323)
-73.92
(86.19)
12.92***
(4.788)
-0.778
(3.133)
-1.572
(2.566)
-0.505
(2.826)
-6.629*
(3.819)
0.186
(0.129)
-6.205**
(2.531)
-0.0129
(0.0310)
-78.84
(66.57)
19.60***
(7.270)
INet * Allow YouTube
Allow YouTube
Students (x 1000)
Pop. Density (x 1000)
Earnings (x 1000)
Mandatory Educ. (%)
∆ Avg. CO Traffic (Mbps)
Constant
Observations
289
286
Robust standard errors in parentheses
*** p<0.01, ** p<0.05, * p<0.1
57
289
286
Table 14: Distance threshold regressions for schools with 9th grade students.
(1)
(2)
(3)
(4)
(5)
(6)
-16.56***
(4.315)
-0.186***
(0.0203)
1.10e-04
(9.80e-04)
-0.0968***
(0.0217)
-0.850***
(0.314)
257.1
(585.4)
-0.299
(11.31)
-19.53***
(5.775)
-0.187***
(0.0209)
9.33e-05
(9.83e-04)
-0.0972***
(0.0220)
-0.858***
(0.299)
286.5
(585.6)
-17.66**
(7.259)
-0.186***
(0.0207)
1.17e-04
(9.81e-04)
-0.0967***
(0.0220)
-0.849***
(0.303)
254.3
(581.3)
-16.80***
(5.467)
-0.186***
(0.0206)
1.11e-04
(9.82e-04)
-0.0968***
(0.0220)
-0.850***
(0.304)
254.6
(587.6)
-16.63***
(4.094)
-0.186***
(0.0207)
1.11e-04
(9.82e-04)
-0.0968***
(0.0220)
-0.851***
(0.300)
257.7
(580.9)
1.077
(24.22)
345.6***
(26.37)
345.5***
(26.17)
-30.40*
(16.27)
-0.187***
(0.0208)
1.14e-04
(9.75e-04)
-0.0979***
(0.0219)
-0.844***
(0.316)
250.8
(587.1)
3.706
(11.98)
12.54
(12.64)
13.28
(20.54)
20.05
(32.02)
351.7***
(28.62)
527
0.368
527
0.369
VARIABLES
Distance (Km)
Students
Pop. Density
Earnings 2005
Mandatory Educ. (%)
∆ Avg. CO Traffic (Mbps)
Dist. > 0.5 Km
Dist. > 1 Km
6.324
(9.041)
Dist. > 2 Km
3.340
(16.60)
Dist. > 3 Km
Constant
Observations
R-squared
345.6***
(27.18)
347.1***
(26.58)
346.1***
(26.53)
527
527
527
527
0.368
0.369
0.368
0.368
Robust standard errors in parentheses
*** p<0.01, ** p<0.05, * p<0.1
58
Table 15: F-statistics for the Distance to CO on first-stage regressions.
Regression
2005-2008
2005-2009
59
F-statistic
8.766
19.340
60
Observations
Distance (Km)
Mandatory Educ. (%)
Earnings 2005
Pop. Density
Students
INet Usage 2008 / Stu. (MB)
INet Usage 2009 / Stu. (MB)
Avg. Grade 2005 (0-100)
Avg. Grade 2008 (0-100)
Avg. Grade 2009 (0-100)
VARIABLES
253
57.89
(5.543)
59.34
(5.300)
50.50
(4.759)
123.1
(108.5)
98.28
(132.0)
587.1
(244.2)
1,537
(2,187)
760.6
(176.1)
37.94
(13.41)
1.147
(0.815)
91
57.64
(5.774)
60.11
(6.099)
50.88
(5.438)
112.4
(93.39)
83.82
(55.37)
527.0
(243.6)
1,600
(3,297)
810.9
(218.4)
37.20
(14.13)
1.012
(0.813)
(2)
Facebook
Block
319
57.68
(5.495)
59.36
(5.463)
50.55
(4.887)
121.8
(106.9)
95.83
(120.4)
563.6
(246.4)
1,557
(2,564)
770.0
(182.9)
37.36
(13.49)
1.103
(0.808)
(3)
YouTube
No Block
25
59.68
(6.623)
61.89
(5.869)
51.33
(5.670)
100.0
(68.50)
76.95
(49.40)
668.5
(209.6)
1,508
(1,965)
824.3
(255.8)
42.59
(14.13)
1.215
(0.911)
(4)
YouTube
Block
229
58.22
(5.129)
59.54
(5.424)
50.65
(4.688)
126.1
(105.1)
101.1
(135.0)
572.8
(250.6)
1,545
(2,420)
771.8
(196.6)
37.83
(13.39)
1.047
(0.772)
(5)
Chat
No Block
115
57.04
(6.381)
59.54
(5.742)
50.50
(5.435)
108.5
(103.2)
81.25
(65.62)
568.0
(234.8)
1,569
(2,727)
778.2
(174.3)
37.57
(14.03)
1.239
(0.883)
(6)
Chat
Block
158
58.60
(5.475)
59.74
(5.172)
50.66
(5.030)
108.2
(81.38)
83.61
(67.19)
603.9
(258.3)
1,622
(2,502)
772.6
(176.1)
38.49
(13.53)
1.144
(0.874)
(7)
Games
No Block
186
57.16
(5.630)
59.37
(5.815)
50.56
(4.880)
130.5
(120.3)
103.7
(145.9)
543.5
(230.5)
1,495
(2,546)
775.1
(200.2)
37.10
(13.64)
1.083
(0.763)
(8)
Games
Block
73
58.50
(5.013)
59.45
(5.013)
51.50
(4.551)
113.0
(101.2)
81.57
(66.19)
600.3
(252.2)
1,677
(2,185)
793.9
(184.1)
38.91
(11.59)
1.138
(0.831)
(9)
Adult
No Block
Table 16: Summary statistics by blocking policy (Middle Schools).
(1)
Facebook
No Block
271
57.64
(5.740)
59.57
(5.662)
50.36
(5.023)
122.2
(105.7)
97.93
(126.9)
563.4
(243.1)
1,520
(2,609)
768.5
(190.6)
37.43
(14.08)
1.104
(0.812)
(10)
Adult
Block
175
58.08
(5.455)
59.51
(5.475)
50.64
(4.743)
118.7
(102.9)
95.15
(146.2)
585.6
(253.2)
1,841
(2,786)
778.1
(196.7)
38.22
(13.60)
1.157
(0.880)
(11)
F. Sharing
No Block
169
57.55
(5.745)
59.57
(5.591)
50.57
(5.155)
121.8
(106.8)
93.74
(75.54)
556.3
(236.2)
1,255
(2,187)
769.6
(181.6)
37.25
(13.60)
1.063
(0.741)
(12)
F. Sharing
Block
61
Observations
Constant
[
IN
et * No Blocks
Distance (Km)
∆ Avg. CO Traffic (Mbps)
Mandatory Educ. (%)
Earnings (x 1000)
Pop. Density (x 1000)
Students (x 1000)
No Blocks
INet * No Blocks
INet Usage / Student (100 MB)
VARIABLES
289
3.121***
(0.562)
-0.0132
(0.103)
-1.877***
(0.389)
0.0218
(0.0171)
-0.560**
(0.275)
-0.0110**
(5.54e-03)
5.835
(13.68)
-0.236***
(0.0850)
(1)
1st Stg
289
17.21***
(4.251)
-1.778**
(0.804)
-5.050*
(2.680)
0.0293
(0.119)
-1.015
(2.872)
-0.0300
(0.0325)
-37.91
(97.24)
-3.271**
(1.626)
(2)
2nd Stg
0.194
(0.129)
3.40e-03
(0.0356)
4.39e-03
(3.33e-03)
-0.163**
(0.0656)
3.78e-04
(1.11e-03)
-2.143
(4.867)
0.0103
(0.0136)
0.757***
(0.153)
0.0989**
(0.0384)
(4)
1st Stg
17.55***
(4.399)
-3.094*
(1.632)
-3.026
(2.087)
0.722
(1.713)
-5.409*
(2.822)
0.0411
(0.119)
-1.535
(2.821)
-0.0283
(0.0327)
-32.48
(102.4)
(5)
2nd Stg
289
289
289
Robust standard errors in parentheses
*** p<0.01, ** p<0.05, * p<0.1
0.233
(0.235)
-1.967***
(0.464)
0.0221
(0.0177)
-0.577**
(0.280)
-0.0112*
(5.66e-03)
7.504
(13.88)
-0.245***
(0.0925)
-0.295
(0.301)
3.197***
(0.626)
2008
(3)
1st Stg
286
3.906***
(0.414)
0.124
(0.142)
-2.188***
(0.327)
0.0122
(0.0198)
-1.147***
(0.356)
-7.61e-03
(4.79e-03)
-1.037
(10.15)
-0.247***
(0.0523)
(1)
1st Stg
286
19.68***
(5.777)
-0.215
(0.822)
-6.752*
(3.864)
0.171
(0.123)
-6.206**
(2.478)
-0.0160
(0.0307)
-73.88
(69.75)
-2.528*
(1.456)
(2)
2nd Stg
286
-0.0341
(0.294)
-2.140***
(0.354)
0.0122
(0.0195)
-1.132***
(0.356)
-7.58e-03
(4.78e-03)
-1.537
(10.15)
-0.243***
(0.0553)
0.133
(0.271)
3.863***
(0.441)
2009
(3)
1st Stg
286
-0.151
(0.248)
0.0382
(0.0623)
4.38e-03
(4.52e-03)
-0.170
(0.117)
-1.69e-04
(1.89e-03)
-5.244
(6.245)
0.0219
(0.0248)
1.128***
(0.229)
0.111*
(0.0564)
(4)
1st Stg
286
19.66***
(5.778)
-2.534*
(1.466)
0.0885
(0.936)
-0.319
(1.038)
-6.732*
(3.875)
0.171
(0.124)
-6.186**
(2.483)
-0.0160
(0.0307)
-73.80
(69.75)
(5)
2nd Stg
Table 17: Change in 9th grade performance as a function of broadband use and site blocking policy (IV).
62
Observations
Constant
[
IN
et * Allow YouTube
Distance (Km)
∆ Avg. CO Traffic (Mbps)
Mandatory Educ. (%)
Earnings (x 1000)
Pop. Density (x 1000)
Students (x 1000)
Allow YouTube
INet * Allow YouTube
VARIABLES
INet Usage / Student (100 MB)
289
3.170***
(0.579)
-0.0434
(0.0809)
-1.884***
(0.392)
0.0222
(0.0173)
-0.566**
(0.276)
-0.0111**
(5.59e-03)
5.434
(13.60)
-0.237***
(0.0855)
(1)
1st Stg
289
18.28***
(4.470)
-1.856**
(0.935)
-4.801*
(2.739)
0.0360
(0.121)
-0.925
(2.893)
-0.0319
(0.0314)
-60.79
(89.26)
(2)
2nd Stg
-2.967*
(1.596)
-0.0795
(0.205)
0.111
(0.198)
-2.15e-03
(0.0156)
-0.0496
(0.290)
2.26e-03
(3.86e-03)
-11.70
(12.03)
0.0301
(0.0485)
1.092***
(0.274)
-0.120
(0.198)
(4)
1st Stg
12.92***
(4.788)
(5)
2nd Stg
4.009
(2.853)
-6.975***
(2.445)
3.161
(2.000)
-4.701*
(2.687)
0.0219
(0.120)
-1.081
(2.770)
-0.0196
(0.0323)
-73.92
(86.19)
289
289
289
Robust standard errors in parentheses
*** p<0.01, ** p<0.05, * p<0.1
-0.289
(0.237)
-1.239***
(0.426)
0.0150
(0.0159)
-0.391
(0.304)
-7.30e-03
(4.75e-03)
0.473
(14.16)
-0.150**
(0.0695)
0.355
(0.340)
2.350***
(0.564)
2008
(3)
1st Stg
286
3.983***
(0.432)
-0.0588
(0.102)
-2.194***
(0.331)
0.0134
(0.0199)
-1.172***
(0.358)
-7.34e-03
(4.84e-03)
-0.746
(10.01)
-0.244***
(0.0530)
(1)
1st Stg
286
21.54***
(6.035)
-1.975**
(0.975)
-6.838*
(3.780)
0.192
(0.128)
-6.400**
(2.489)
-0.0159
(0.0303)
-81.78
(65.28)
(2)
2nd Stg
-2.422*
(1.413)
286
-0.361*
(0.209)
-1.473***
(0.476)
9.93e-03
(0.0198)
-0.823**
(0.356)
-4.92e-03
(5.16e-03)
-2.635
(9.938)
-0.157**
(0.0759)
0.342
(0.254)
3.007***
(0.653)
2009
(3)
1st Stg
286
-0.0537
(0.167)
0.0512
(0.234)
-6.89e-04
(0.0200)
-0.0294
(0.290)
1.64e-03
(4.93e-03)
-4.703
(9.454)
0.0132
(0.0590)
1.049***
(0.168)
-0.0674
(0.212)
(4)
1st Stg
286
19.60***
(7.270)
(5)
2nd Stg
-0.778
(3.133)
-1.572
(2.566)
-0.505
(2.826)
-6.629*
(3.819)
0.186
(0.129)
-6.205**
(2.531)
-0.0129
(0.0310)
-78.84
(66.57)
Table 18: Change in 9th grade performance as a function of broadband use and YouTube block policy (IV).
Table 19: Kleibergen-Paap statistics for the first-stage regressions.
Regression
Year
2005-2008
No Block
2005-2009
2005-2008
Allow YouTube
2005-2009
Instruments
Distance to CO
Distance to CO
[
IN
et * No Blocks
Distance to CO
Distance to CO
[
IN
et * No Blocks
Distance to CO
Distance to CO
[
IN
et * Allow YouTube
Distance to CO
Distance to CO
[
IN
et * Allow YouTube
63
Kleibergen-Paap
Wald F-statistic
7.718
r=
0.20
3.824
0.25
22.422
0.10
11.835
0.10
7.666
0.20
3.850
0.25
21.298
0.10
9.442
0.10


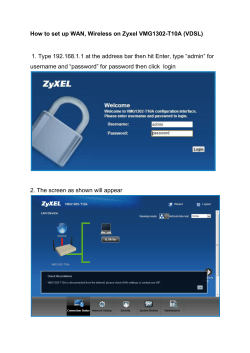


© Copyright 2026