
Planning for affordable housing during densification in
Planning for
affordable
housing during
densification in
Kathmandu
Lessons from four settlements
Amit Bajracharya, Pragya Pradhan,
Poonam Amatya, Bhagawat Bhakta Khokhali,
Sabina Shrestha and Arif Hasan
Working Paper
June 2015
Urban
Keywords:
housing, Kathmandu, urban density,
urban development, urban planning
About the authors
Partner organisation
Amit Bajracharya is a practicing architect- urban designer/
planner, working as a technical manager at Maitreya Awas Pvt.
Ltd. He worked as an architect for Lumanti Support Group
for Shelter and is still involved in Lumanti as a volunteer. He
completed his Masters in Ecological and Sustainable Design
from Kansas State University at Kansas, USA. He is a founding
member of Pro-poor Technical Assistance Group (PTAG) which
works in coordination with Lumanti.
LUMANTI- Support Group for Shelter was registered in 1993
as a non-government organization dedicated to alleviate urban
poverty in Nepal through integrated approach of improving
shelter conditions. Lumanti with its approach of providing
housing for urban poor is now working for onsite upgrading
of settlements with the provision of secure tenure, support in
the construction of housing and improved access to sanitation
and water supply and credit facilities. Lumanti promotes all
these activities through community led finance mechanisms by
strengthening of saving and credit programs and cooperatives.
Email: [email protected], [email protected]
Pragya Pradhan is working as urban planner consultant at the
Ministry of Urban Development, Government of Nepal for the
preparation of National Urban Development Strategy and Plan.
She holds Master’s Degree in Urban and Regional Planning
from University of Hawaii at Manoa, USA.
Email: [email protected]
Poonam Amatya is working as an architect- urban planner at
Creative Space Pvt. Ltd. She holds Master’s degree in Urban
Management from Technical University of Berlin, Germany.
Email: [email protected]
Bhagawat Bhakta Khokhali is working as Urban Planner
in Kathmandu Valley Development Authority (KVDA). He
holds a Master’s degree in Urban Planning from Institute of
Engineering, Tribhuvan University, Kathmandu.
Email: [email protected]
Sabina Shrestha studied architecture at Kathmandu
Engineering College, Tribhuvan University, Kathmandu and
qualified in 2010. She has been involved in Lumanti and Propoor Technical Assistant Group as a volunteer for last three
years. She currently works as an architect for Habitat for
Humanity Nepal.
Email: [email protected]
Arif Hasan is an architect/planner in private practice in Karachi,
dealing with urban planning and development issues in general
and in Asia and Pakistan in particular. He has been involved
with the Orangi Pilot Project (OPP) since 1981. He is also a
founding member of the Urban Resource Centre (URC) in
Karachi and has been its chair since its inception in 1989.
E-mail: [email protected]
Produced by IIED’s Human Settlements
Group
The Human Settlements Group works to reduce poverty and
improve health and housing conditions in the urban centres of
Africa, Asia and Latin America. It seeks to combine this with
promoting good governance and more ecologically sustainable
patterns of urban development and rural-urban linkages.
International Institute for Environment and Development
80-86 Gray’s Inn Road, London WC1X 8NH, UK
Tel: +44 (0)20 3463 7399
Fax: +44 (0)20 3514 9055
email: [email protected]
www.iied.org
@iied
www.facebook.com/theIIED
Download more publications at www.iied.org/pubs
Acknowledgements
Lumanti Support Group for Shelter, the International Institute
for Environment and Development (IIED) and the authors
acknowledge the contribution of all the individuals and
organisation who contributed to the consultative workshops and
interviews.
The authors would also like to acknowledge the help of the
projects advisors (Gordon McGranahan, Prafulla Man Singh
Pradhan and Lajana Manandhar) and the editors (Donald
Brown, Christine Ro, Paula Morais, Pragya Pradhan and
Benjamin Conner).
Picture credits:
Figures 2, 3, 4, 7, 8, 10, 11, 12, 14, 15 and 16 are
photos taken by Amit Bajracharya.
Figures 1, 5, 6, 9 and 13 are Google earth images
labelled by the authors.
All Maps have been drawn by the authors.
Published by IIED, June 2015
Amit Bajracharya, Pragya Pradhan, Poonam Amatya,
Bhagawat Bhakta Khokhali, Sabina Shrestha and Arif Hasan.
2015. Planning for affordable housing during densification
in Kathmandu: Lessons from four settlements. IIED Working
Paper. IIED, London.
http://pubs.iied.org/10739IIED
ISBN 978-1-78431-208-4
Printed on recycled paper with vegetable-based inks.
IIED Working paper
Preface
This working paper was in press when a devastating earthquake struck Kathmandu on the 26th of April 2015,
and then a second struck on the 12th of May. The current priority is recovery. The authors of this paper are now
busy conducting post-earthquake building assessments and providing low cost house design and construction
supervision for people building transit homes. Going forward, much more will need to be done to provide better
housing for the residents of Kathmandu, and to reduce the risks they face from future earthquakes and other
environmental hazards. This is also a daunting task that will need to be faced with courage. The paper takes a
broad look at the challenges posed by Kathmandu’s rapid population growth and densification. It extends its focus
to the poorest and most vulnerable residents, and seeks out ways of addressing the shortfall in affordable housing
while reducing risk and building resilience. Hopefully this will contribute to a safer and more liveable Kathmandu in
the future.
www.iied.org
3
Planning for affordable housing during densification in Kathmandu
Kathmandu faces serious urban planning and
housing challenges. Most development is
occurring beyond the legal limits of zoning bylaws
and building regulations in response to housing
shortages. As settlements densify haphazardly,
affordable housing options are increasing, but living
conditions, services and crowding are worsening.
The potential consequences for low-income
residents are disastrous given the danger of an
imminent earthquake. This paper examines four
types of settlements in Kathmandu to understand
the impacts of densification. It then presents
conceptual reimaginings of these settlements to
apply the lessons for planning affordable housing
in densifying settlements without compromising
unduly on safety and liveability.
Contents
Executive summary
5
1 Introduction
7
2 Transformation of Kathmandu 8
4 Case studies
14
4.1 Naradevi: Traditional settlement
4.2 Sankhamul and Bansighat: Informal settlements
4.3 Khusibu: Land-pooling project
4.4Chabahil
14
22
29
37
5 Conclusions
45
5.1 General conclusions and recommendations
45
5.2 Conclusions and recommendations for the four
case studies
48
2.1 History of planning practices in Kathmandu
2.2 Current trends in residential development
2.3 Rental housing in Kathmandu
2.4 Kathmandu: An urban density study
9
9
10
11
References50
3 Methodology
12
Appendix 1
51
3.1 Site selection
3.2 Preparation of questionnaire
3.3 Sampling method
3.4 Field observations
3.5 Data handling
3.6 Data analysis
3.7 Hypothetical replanning exercise
12
12
12
13
13
13
13
Appendix 2: Questionnaire
67
Appendix 3: List of Survey Team Members
71
Appendix 4
72
Related reading
74
4
www.iied.org
Acronyms75
IIED Working paper
Executive summary
Kathmandu is experiencing rapid urban growth, with
its population nearly doubling in the past decade.
This trend has been accompanied by densification
in inner-city traditional settlements and in newer
peripheral settlements facing urban growth and
expansion pressures.
Naradevi is an inner-city traditional settlement that
is densifying outside of official rules and regulations
through the addition of storeys to existing structures; the
construction of new, taller buildings; and the subdivision
of jointly owned properties. Densities are currently as
high as 2,112 people per hectare. The original owners
who can afford automobiles have begun to migrate to
However, most urban growth and densification are
suburban areas where vehicular accessibility is better.
being accommodated haphazardly in the absence
This has made the area more affordable to lower-income
of appropriate and enforceable zoning bylaws and
households and renters; however, living conditions and
building regulations. In practice, land owners and private
crowding have worsened, particularly in rental spaces.
developers often build beyond legal limits in response
These conditions have also intensified the settlement’s
to housing shortages, particularly among low-income
existing vulnerability to earthquake and fire risks.
renters. Consequently, informal rental markets have
grown, whilst living conditions, service provision and
The hypothetical replanning exercise for Naradevi
crowding have worsened.
explored four approaches. The least exclusionary
approach would involve protecting the area’s
Haphazard densification has potentially disastrous
historically and culturally significant courtyard systems.
consequences for Kathmandu given the danger of
It would also examine options for promoting fire
an imminent earthquake. This applies especially to
safety, earthquake-resistant measures and heritage
low-income households living in inadequate housing.
conservation, without imposing prohibitive costs for land
A number of actions can be taken to avoid these
owners or driving up rents for low-income groups.
consequences by planning and managing urban growth
more effectively and equitably. These actions must be
Sankhamul and Bansighat are informal settlements
grounded in an understanding of local realities and the
housing some of the poorest residents unable to afford
reasons formal regulations have been so ineffectual.
rental spaces in other parts of the city. Because these
settlements are located along rivers, they are vulnerable
To develop this understanding, this study has
to flooding and erosion. They are also under constant
three objectives:
threat of eviction due to insecure tenure. Despite these
a) To better understand how different types of
risks, Sankhamul and Bansighat offer residents access
settlements in Kathmandu have developed and
to employment opportunities, basic services and public
densified over time
facilities in central areas they might not otherwise be
able to access.
b) To better understand how these development
processes have impacted on urban form and on
In Bansighat, the hypothetical replanning exercise
social, economic and environmental conditions, and explored relocation and resettlement options due
to the settlement’s location in a ten-year floodplain.
c) To identify and apply the lessons that these
However, such options would need to be determined in
settlements present for planning and developing
partnership with the community to ensure that its needs,
affordable housing in densifying settlements.
priorities and affordability requirements, particularly
To provide a way forward, hypothetical replanning
among the poorest renters, are considered.
exercises have been undertaken for each settlement
In Sankhamul, the hypothetical replanning exercise
to illustrate how these lessons, applied retrospectively,
explored on-site redevelopment options. High land
could have been translated into planning and design.
values meant that houses on plots as small as 30m2
The four types of settlements and their hypothetical
would be unaffordable for low-income households.
redesigns are outlined below.
Thus, higher-density two-storey walk-up apartments
www.iied.org
5
Planning for affordable housing during densification in Kathmandu
were explored to reduce the cost of land and public
infrastructure provision. The construction of individual
houses, which are cheaper to build than apartments
(in terms of construction, but not land cost), was
also explored as an alternative, but further study is
required to assess both of their social, economic and
environmental implications. Ultimately, these options
should be seen as a response to environmental and
eviction risks and not as a replicable contribution
to addressing the affordable housing shortage in
Kathmandu. Addressing this shortage will require a
broader housing strategy that is capable of reaching
the poorest renters. These renters would likely not be
able to afford apartments or individual houses without
significant public subsidies, which are not guaranteed.
Khusibu is situated on the periphery of the city and
was historically protected for agricultural purposes. In
1995, the government initiated a land-pooling project
to readjust irregularly shaped agricultural land so that it
could be redeveloped for residential uses.
Over time, Khusibu has evolved into a mixed-use
settlement, reflecting broader socioeconomic dynamics
in Kathmandu. The area also provides affordable
housing for renters who work in the city centre. As in
other parts of Kathmandu, most housing growth has
been accommodated by new builds and incremental
additions violating bylaws and regulations. With
densification, other problems involving road congestion,
infrastructure deficiencies, pollution, and earthquake risk
are emerging.
The replanning exercise also examined designs
that would support Chabahil’s development into a
compact, mixed-use, walkable and more functional
settlement. Also considered was the need to develop
more appropriate bylaws and regulations to guide
this process whilst promoting rental markets and
risk reduction.
Key lessons and conclusions
The lessons identified across the five settlements
reveal a common tension between enforcement and
affordability. There is a clear need to ensure that bylaws
and regulations are adopted by land owners and private
developers accustomed to evading regulations, and
affordable to lower-income groups accustomed to
living informally. If this tension is not addressed, it is
unlikely that existing bylaws and regulations (let alone
new bylaws and regulations supporting, for example,
earthquake safety) would be followed.
One potential action area for local authorities would
be to partner with a local NGO, such as the Lumani
Support Group for Shelter, that has experience working
with land owners, private developers and low-income
groups. The purpose would be to establish a platform
where discussions around how a more appropriate and
enforceable regulatory framework could be achieved.
This platform could also serve as a basis for discussing
how the potential lessons learnt from land-pooling
projects could be shared and applied more widely, and
how appropriate earthquake-resistant measures could
The hypothetical replanning exercise explored alternative
be incorporated into a regulatory framework that is more
spatial reconfigurations involving gridiron layouts
likely to be followed.
and traditional courtyards to address some of these
Ultimately, the development of a more appropriate and
problems. New building plans were also devised to
enforceable regulatory framework (including one that
illustrate the potential to accommodate high densities
increases safety and reduces risk) will depend largely
within smaller plots without compromising unduly
on whether the tension between enforcement and
on liveability and safety. Given that most bylaws are
affordability can be reconciled. If it can, the planning
violated, land-pooling projects were also highlighted
system will have a real chance of addressing the
as opportunities to test deviations from current bylaws
affordable housing shortage as the city continues to
and to discuss their impacts and implications for
grow and densify.
future developments.
Chabahil is a spontaneously developing settlement
on farmland located outside the old city. The area is
home to a diverse population living in various housing
types, ranging from single-family bungalows to more
compact rental spaces. Although the settlement remains
predominantly low-rise, it is beginning to densify. This
presents an important opportunity for local authorities to
guide the process. The hypothetical replanning exercise
emphasises the opportunity to learn from potential
experiments conducted in land-pooling projects.
6
www.iied.org
1
IIED Working paper
Introduction
This study seeks to understand how planning can better
respond to Kathmandu’s affordable housing shortage
as the city grows and densifies. To develop this
understanding, the paper examines four distinct types
of settlements that represent different ways in which
growth and densification are being accommodated
in Kathmandu. It also identifies the lessons these
settlements present for planning affordable housing in
densifying settlements and applies them to hypothetical
replanning exercises for each type of settlement. These
replanning exercises are intended to illustrate how
affordable housing could be planned and designed,
still allowing organic development and without
compromising on safety and liveability in Kathmandu.
They also indicate the regulatory reforms that would be
required to achieve this.
This study is comprised of five sections. Section 2
examines the transformation of Kathmandu, with a
focus on urban growth and expansion trends. Section 3
outlines the methodologies used by the study. Section 4
examines each type of settlement, with a focus on urban
growth and densification trends, lessons learnt, and the
hypothetical replans. Section 5 concludes by discussing
the key issues and lessons that need to be considered
when planning and developing affordable housing
during densification in Kathmandu.
www.iied.org
7
2
Planning for affordable housing during densification in Kathmandu
Transformation of
Kathmandu
The Kathmandu Valley, historically a lake, has a recorded
history of settlements since the 2nd century AD,
after the lake was drained by the mythological figure
Manjushree. Covering an area of 654.7 km2 and lying
in the Bagmati River watershed, the valley is gifted with
rich soil and a temperate climate, which has attracted
migrants to settle in this valley ever since. Over time,
with numerous ruling dynasties, it has undergone
various social, political and physical transformations. A
marked change was witnessed in 1768, when the valley
was conquered by the Shah dynasty, which declared
Kathmandu the capital of Nepal. After much-awaited
democratisation in the 1950s, the valley underwent
drastic transformation from agricultural to urban due to
the influx of migration and the introduction of vehicles
(Haack and Rafter, 2006).
At present, the valley is administratively divided into
five municipalities and 94 rapidly urbanising Village
Development Committees (VDCs), of which Kathmandu
Metropolitan City is the most populated. Kathmandu,
once a magnificent city with a history visible in its
architecture, has in the last half-century turned into a
sea of people housed in clustered concrete structures.
It has attracted people from all over the country due
to centralised development, as the valley serves as
the economic and administrative capital of the nation.
Migration in search of employment opportunity and
high-end services, coupled with the insurgency period
between 1996 and 2006, has resulted in a rapid
population influx into the city and the valley.
grew by 61 per cent in the last decade. The city of
Kathmandu has experienced mounting population
growth at a rate of 4.8 per cent from 1991 to 2001
and 4.1 per cent from 2001 to 2011. The Kathmandu
Valley had an average growth rate of 4.63 per cent
in 2001–2011, compared to the national average of
3.43 per cent.
The increase in population also points towards an
increase in density.In 2001 the average density of
Kathmandu City was 136 people per hectare (ppha),
which increased to 197 ppha in 2011. The dense
core area of the city has a ward density of up to 1,181
ppha. Population growth and densification have also
been marked by the enlargement of the built-up area
manifested by urban sprawl. This has been especially
evident in the rapidly urbanising VDCs around the
valley, whose population growth rates are as high as 14
per cent per year (Central Bureau of Statistics, 2002
& 2012).
Urban sprawl has been the major driver of land-use
change in Kathmandu, where agricultural land is
rapidly being converted into built-up areas as a result
of haphazard development. The built-up area in the
municipalities grew from 38km2 to 999km2 between
1990 and 2012, an almost threefold increase. The
built-up coverage has changed from 5 per cent to 16
per cent, while agricultural land has decreased from 58
per cent to 47 per cent. The areas of mixed residential
and commercial land have increased six fold and the
residential land four fold (Genesis Consultancy, 2013).
Rural to urban migration together with natural population This growth is clearly visible in the valley’s peripheral
growth is doubling the population of Kathmandu at a
areas, with significant development extending up into
rapid pace. According to the 2011 National Population
the hills.
and Housing Census, the population of Kathmandu
8
www.iied.org
IIED Working paper
2.1 History of planning
practices in Kathmandu
With rapid demographic, spatial and social
transformations, physical development of the
Kathmandu Valley has also been approached with
various policies and plans, as an attempt to address
growing urban issues and to guide urban growth.
In many cases, the intention has been to plan the
Kathmandu Valley in an integrated way, rather than
as a series of individual municipalities. Many planning
documents have been prepared. The Physical
Development Plan of the Kathmandu Valley, 1969 was
one of the initial attempts to plan the development of
the valley. It sought to preserve the valley’s environment
and rich agricultural land by guiding development to the
western and south-western areas, thereby reducing
population pressures in the central and eastern regions.
Another significant planning document, the Kathmandu
Valley Physical Development Plan, 1972, was formulated
to respond to the geographical structure of the valley.
It proposed development in the plains (tar) and the
preservation of wetlands (dol) for agriculture. It was
followed by the Land-use Plan of Kathmandu Valley,
1976, which introduced extensive land-use zoning
for the valley together with building regulations. This
divided the valley into three categories: the inner
core, its adjacent area and the sparse new settlement
area. One of the significant outputs of the document
was the establishment of the Kathmandu Valley Town
Development Committee, which still exists in the form of
the Kathmandu Valley Development Authority.
The Urban Development and Conservation Scheme,
1988, was launched under the leadership of the
Ministry of Housing and Physical Planning, which
introduced land pooling and land development
programmes in the valley. The Kathmandu Valley Urban
Development Plans and Programmes, 1991, stressed
the densification of the Kathmandu and Lalitpur
municipalities, with development of an inner ring road
to preserve agricultural land and reduce the impacts of
urban sprawl. The Environment Plan and Management
of Kathmandu Valley, 1999, had a similar intent, and
envisioned Kathmandu as an eco-town. It proposed to
redefine Kathmandu’s physical boundaries, conserve
traditional settlement, and upgrade and extend the road
and sewerage network.
The latest significant planning document, the Long Term
Development and Conservation Plan of Kathmandu
Valley, 2000, considered the regional context of the
Kathmandu Valley, treating it as a development node
and looking forward to 2020. The intention was to
support a holistic approach to urban development,
with efficient integration of land-use and transportation
planning, conservation of agriculture and public land
through the demarcation of a city growth boundary, as
well as adequate infrastructure facilities supporting the
increased carrying capacity of the valley.
Though many planning documents have been prepared,
they have not achieved anything like their ambitions
and have had very few impacts. Most of the documents
have stressed the preservation of agricultural land
and ecology of the Kathmandu Valley, due to its
fragile geological conditions, but these plans have
existed mainly on paper. Major impediments to plan
implementation have included: lack of synchronisation
between projects and plans; lack of coherence between
building regulation and land-use planning; and lack of a
strong legal basis, political will and institutional capacity
for plan implementation.
2.2 Current trends in
residential development
With changing urban form and growth in residential
units, a number of identifiable housing trends have
emerged in the valley. They are:
• Class-based gated communities and group housing,
including high-rise apartments targeted to uppermiddle and higher-income groups
• The rapid decay of the historic core area, with an influx
of low-income migrant renters and the relocation of
natives to peripheral/suburban areas
• Urban sprawl and rapid unplanned development of
peripheral/suburban areas, including an increase in
mixed residential units
• Initiation of land pooling projects in some areas to
adjust the configuration of land and provides services,
and
• The undocumented rise in squatter settlement along
the river banks and public land, due to migration of the
rural poor in search of a better life.
These development trends reflect failing land-use
control and building regulations, declining living
conditions among particular segments of the urban
poor, emerging segregated class-based settlements,
and rising demand for rental housing to accommodate
the growing migrant population.
www.iied.org
9
Planning for affordable housing during densification in Kathmandu
2.3 Rental housing in
Kathmandu
The rapid growth in population, coupled with physical
constraints on expansion posed by the Kathmandu
Valley’s natural boundaries, explain the unprecedented
rises in land and housing prices. Rising prices have
been further augmented by the lack of an effective
land information system and transparent land market.
A distorted land and housing market has emerged,
controlled by a land mafia, brokers and speculators
more concerned with future land prices than with
current land uses.
The city’s housing prices have outpaced the economic
capacity of all but the wealthiest in Kathmandu. Though
the National Shelter Policy 2012 affirms ‘shelter for all’
as its goal, the National Shelter Plan 2070/711 indicates
that this goal is far-fetched, as the projected number of
housing units required in urban areas is 1,300,000, with
about 900,000 new units required to be constructed
by 2023. However, UN-Habitat (2010) has projected
housing unit production from 2011 to 2021 to be
35,039 annually. Based on this UN-Habitat study, for
a family to build a minimum standard house of 54m2,
it needs an average monthly income of NPR 60,471
(US$610) to afford a loan that is 40 per cent of the
total income. This means “more than 75% of the urban
population does not have sufficient income to afford the
minimum standard 50 m2 self constructed house on 80
m2 plot in the outskirts of a city and 95 percent cannot
afford to purchase a readily built property”. As a result,
the lack of affordable and secure housing for the urban
poor has become one of the most problematic planning
issues for Kathmandu. Neither the government nor the
private development sector has formulated appropriate
housing options for Kathmandu’s poorest citizens.
Public housing is non-existent mainly because of the
excessive cost of land, and owner-occupiers are in
the minority. Renting at least one or two rooms is
affordable for the vast majority of the population (90
per cent), while only 40 per cent can afford to rent a
basic four-bedroom apartment in the outskirts of the
city (UN-Habitat, 2010). More than 48 per cent of
the urban population is renting space from individual
homeowners, who often live in the same building. Much
of this demand for rental units is being met by informal
markets, which provide affordable housing options to
low-income residents willing to accept overcrowded
living conditions and inadequate basic amenities, light
and ventilation. These conditions create unhealthy
living environments, particularly where overcrowding is
combined with inadequate water and sanitation.
The need for rental housing units is clearly visible in the
Kathmandu Valley, where the proportion of households
living in rental units significantly increased from 33 per
cent in 2003 to 48.5 per cent in 2011 (Central Bureau
of Statistics, 2012). With almost half of the population
living in rented space, it is high time for Kathmandu to
incorporate the rental sector into its planning efforts.
There is also a clear need to reassess zoning
regulations and other land-use controls. For example,
limitations to floor area ratios (FAR2) currently restrict
the amount of floor space that can be legally developed,
thereby exerting downward pressures on housing supply
and upward pressures on housing prices in formal
markets. The unreasonably strict regulatory framework
often ends up being ignored by private developers and
informal settlers, contributing to the formation of informal
markets. If formal rules and regulations were strictly
enforced, then a large share of Kathmandu’s population
living in illegal non-conforming structures,3 including
informal settlements, would be forced to move out of
their homes, exacerbating the housing scarcity.
Recent studies in Asian cities, including Karachi,
Pakistan (Hasan et al. 2010) and Bangkok, Thailand
(Usavagovitwong et al. 2013), show how density
can be used as a tool for planning and developing
affordable housing, as the construction of additional
units at smaller sizes can reduce the cost of land and
increase the efficiency of providing basic infrastructure
and services. This study therefore aims to explore
how density can be used as a tool for planning and
developing affordable housing in Kathmandu.
1
This refers to the year 2013–2014 in the internationally conventional Gregorian calendar.
2
FAR refers to the ratio of a building’s total floor area to the size of the plot upon which it is constructed.
Illegal non-conforming structures have been developed or expanded beyond the legal limits of the prevailing zoning bylaw. In contrast, legal non-conforming
structures were developed or expanded before the current zoning bylaw made the development or expansion illegal.
3
10
www.iied.org
IIED Working paper
2.4 Kathmandu: An urban
density study
This study has three main objectives:
a) To better understand how different types of
settlements in Kathmandu have developed, densified
and consolidated over time
b) To better understand how these development
processes have impacted on urban form and on
social, economic and environmental conditions, and
c) To identify and apply the lessons that these
settlements present for planning and developing
affordable housing at high density.
To achieve these objectives, this study examines four
distinct types of settlements that represent current
development and expansion trends in Kathmandu.
It also identifies lessons and recommendations for
planning and developing affordable housing at high
density in these and other settlements in the city. As a
hypothetical exercise, a series of hypothetical redesigns
are presented to illustrate what these settlements could
possibly look like. The four forms of settlements are:
1. The densification of traditional settlements,
which currently house a significant proportion of
Kathmandu’s population. However, given current
density levels, the scope for continued development
in this form is limited. The settlement examined
is Naradevi.
2. The development of informal settlements on marginal
land. Informal settlements currently house 3–4 per
cent of Kathmandu’s population, but a larger share
of the city’s low-income residents. The settlements
examined are Sankhamul and Bansighat.
3. Land-pooling and housing projects in peripheral
areas, which are an increasingly important housing
form and which also accommodates low-income
tenants. The settlement examined is Khusibu.
4. The spontaneous and incremental conversion of
farmland into housing, which currently accounts for a
large and growing share of Kathmandu’s population.
The settlement examined is Chabahil.
The conditions of these sites are compared in
Appendix 1.
www.iied.org
11
3
Planning for affordable housing during densification in Kathmandu
Methodology
3.1 Site selection
3.3 Sampling method
A study site within each of the four settlement groupings
was demarcated using local roads. Each study site
encompassed approximately 700 to 950 houses.
However, due to the relatively small size of the squatter
settlements, only 110 and 115 houses in Sankhamul and
Bansighat were included, respectively.
Different teams, each with a team leader, were formed
for each of the study sites (Appendix 3). A systematic
random sampling method was used to select 100 in
each settlement, such that a consistent interval was
maintained between selected houses. This interval
varied depending on the morphology of the settlement,
such that, for example, every sixth house was selected
in Khusibu while every second house was selected in
Sankhamul. Both owner-occupiers and renters were
interviewed during the survey for each site. However, the
main purpose of the surveys was to provide a general
socioeconomic picture of the area using the most
systematic methods possible rather than to necessarily
achieve a representative sample. It should be noted
that since only one respondent from each building
was selected for the questionnaire in each settlement,
respondents in buildings with multiple households may
be under-represented.
3.2 Preparation of
questionnaire
In each study site, primary data were collected through
a questionnaire designed to capture both the physical
and social conditions of the settlement, as perceived by
the dwellers (including home owners and renters). The
questionnaire was framed in seven sections: household
information; social condition; environmental condition;
housing information; details of renters; opinion regarding
the current neighbourhood; and preference for housing
type in an existing or relocated area. However, due to
people’s reluctance to share financial information, data
on income and willingness to pay could not be obtained
from most interviewees across the four settlements.
Appendix 2 contains the questionnaire.
12
www.iied.org
IIED Working paper
3.4 Field observations
3.6 Data analysis
Surveys were coupled with field observations to
incorporate a professional analysis of the settlement,
including a focus on building conditions and the overall
physical and social environment. Key elements on the
observation list were:
Results from the survey were analysed and compared
to draw conclusions for better planning and more
appropriate development across the settlements. Data
from each settlement helped in identifying lessons learnt
and in guiding the hypothetical redesigning exercise.
• Current physical environment
• Sociocultural relationships; existence and functions of
community organisations like a Guthi4 and tole-lane
organisation (TLO)5, sports clubs, religious festivals,
schools and health services, and
• Economics of land and housing, job markets and
transport issues.
3.5 Data handling
The surveyed houses from each study site were plotted
in Google Maps to map the settlement for future
analysis. EpiData software was used to systematically
enter, code and analyse the survey data.
3.7Hypothetical
replanning exercise
Hypothetical settlement and house plans were
developed for the four settlement groupings based on
the lessons and recommendations identified for each.
The results of the redesigning exercise were compared
with the existing situation to show envisioned changes
in, for example, density, land coverage and land-use
patterns. (Appendix 4 presents the results of these
comparisons.) These exploratory plans are intended
to inspire planning and policy for similar settlements
as they grow and densify. As reimaginings rather
than prescriptions, they are not being proposed as
formal redevelopment plans to be implemented in the
selected settlements.
4
Guthi: traditional caste-based community organisation / group formed for a specific purpose.
5
Tole-lane organisation (TLO): community organisation formed at ward level.
www.iied.org
13
4
Planning for affordable housing during densification in Kathmandu
Case studies
4.1 Naradevi: Traditional
settlement
4.1.1 Naradevi: Then and now
The study area comprises a section of the ancient
traditional settlement in Kathmandu that flourished
during the Malla Dynasty between 1200 and 1768.
Figure 1. Naradevi location map
14
www.iied.org
The Mallas superimposed a grid pattern around the
Kathmandu palace complex. The area grew into a dense,
compact settlement, stratified by caste, with higherclass groups living closer to the palace and lower-class
populations living towards the area’s outskirts. Similar
hierarchies were maintained in the streets and open
spaces, with major open spaces and wider streets
converging towards the palace square (Figure 1).
IIED Working paper
The residential areas were traditionally compact
and dense, delimited by the city walls and walkable.
Extended families belonging to same caste lived in
clustered residential blocks comprised of three- to fourstorey buildings surrounding courtyards, facing either
the street or an open court (Figure 2). Mud, brick and
wood were the local materials used in the valley, giving
the buildings a vernacular aesthetic. The buildings were
for private use while the ground floor opening towards
the street had provisions for shopfronts and other
business activities. The open residential courtyards
were used for communal gatherings, household chores,
playing, and similar uses, and were adequately ventilated
and lit due to moderate building height.
The study site is centred on a residential block close
to the city’s major markets and to the main trade route
with Tibet. The reason for investigating urban density
in a traditional settlement is to capture the mechanisms
used to attain high density in low-rise settlements with
mixed uses. At present, the traditional morphology of
the settlement is still intact within clusters of residential
blocks and street grid patterns. However, the area has
undergone significant transformation in its physical form,
composition of dwellers and use of buildings. With
native families preferring to live in the suburbs, these
settlements are becoming affordable rental units for
low-income families.
However, there are serious issues of proper access,
light, ventilation and toilets in these rental spaces. With
increased density achieved in part through crowding, a
lack of maintenance in old buildings, and inaccessibility
to emergency vehicles, Naradevi is increasingly
vulnerable to earthquake and fire. In addition, most
of the new construction has not followed the height
restriction according to the bylaws, which has also
increased vulnerabilities. The older buildings have either
been modified through vertical increments by using
modern materials or have been completely replaced by
new concrete structures). The use of modern materials
to incrementally increase building heights to more
than five storeys has in many instances disrupted the
traditional aesthetic of the area and undermined the role
of open spaces in maintaining ventilation and sunlight.
The population density of the Kathmandu Valley has
increased drastically in as little as one decade due to
immigration from other parts of the country during the
insurgency period. It has also become heterogeneous;
once a cluster of households from an extended
family belonging to the same caste, the area is now
Figure 2. Courtyards in contemporary Naradevi
www.iied.org
15
Planning for affordable housing during densification in Kathmandu
home to a mixture of people from different castes,
speaking different languages, and holding various
economic statuses.
A team of five conducted surveys of a total of 100
households in the study site. The study site was
bounded between the junction of Bhedashing and
Bangemudha on the Y-axis (north–south) and extending
parallel in the western direction, joining the junction with
Tunche Galli, a street near the famous Naradevi temple.
The boundary of the study area was also defined based
on the approximate number of houses within the defined
boundaries. To estimate the total number of houses
within the area, a rectangular space was selected from
the junction of the Naradevi temple to about 39.6m
north and 51.8m east. Every house within the enclosed
area, which is 1/14th of the total study area, was
counted. As there were 67 houses within the area, the
total number of houses in the study area was estimated
to be approximately 940.
Both local owner-occupiers and renters were
interviewed. Based on systematic random sampling,
the team sought to interview every fifth house along the
area’s main streets. But as inner courts were irregular
in shape, the interviews were based on estimated
proximity, so that a consistent distance was maintained
while conducting interviews with two houses sharing
a courtyard.
Figure 3. Narrow paths in Naradevi
16
www.iied.org
Walking through the streets at the present time is still a
privilege as one can capture the ambience of traditional
morphology with deep-rooted planning and building
philosophies. However, as noted above, the picturesque
quality of the streetscape has undergone visible
changes as the homogeneity of buildings is disrupted
by modern structures. Today, streets are narrower and
courtyards are darker due to increased building height
(Figure 3). In other instances, pedestrian streets with
stone and brick pavement have radically changed into
roads for two- and four-wheeler vehicles. This has
resulted in conflict between pedestrians and vehicle
users, accompanied by externalities associated with
pollution and congestion.
Mixed uses with shops, medical clinics, small offices
and compact residential units have infused diversity
into the settlement. The current density of Naradevi is
as high as 2,112 people per hectare, which excludes
the population renting shops and office spaces but
not residing in the area. According to the survey, 33
per cent of renters prefer to live in the area due to job
opportunities and access to local businesses. Also,
proximity to facilities, such as markets, hospitals,
schools, and transportation (often within a 3-minute
walking distance) has added value to the locality.
Mixed uses with small shops and street vendors,
religious temples at the street intersections, and narrow
lanes opening to shared courtyards maintain the
residential scale.
IIED Working paper
By studying the streetscape, one can identify buildings
of various types, some traditional, some modern
and some a mixture of both. According to the field
observations, 36 per cent of the buildings are new
concrete structures, which have replaced traditional
ones. 68 per cent of the buildings have mixed uses,
for either commercial or rental purposes together with
residences. Also, 20 per cent of traditional houses
have signs of incremental growth. As the traditional
compact residences could not cater to the spatial needs
of residents, increasing height or reconstruction has
been supported by more than 50 per cent of the total
population. This has not only disturbed the physical
homogeneity, but has obstructed light and ventilation to
the central courtyard, creating a feeling of congestion.
Therefore, the relationship between open spaces and
buildings is a major factor determining the aesthetic and
environmental value of the place.
Open courtyards within the traditional settlement are
still the main socialising areas; one can observe people
washing their clothes, children playing and elderly
people sunbathing. The study site is comprised of 65
per cent built-up area, 9 per cent streets and 26 per
cent open space in the form of courtyards. Children
in 58 per cent of households surveyed play in these
courtyards, which are also actively used during feasts
and for parking vehicles. Whilst these shared open
spaces once belonged to extended families of the
same caste, they are now shared by owner-occupier
and rental populations of different castes, age groups
and genders. Though some open courts are less
maintained than others, most are well maintained by
the surrounding community. According to the survey,
38 per cent of people prefer to live in the area due to
its social environment and 40 per cent still prefer to live
in houses around courtyards in new settlements. The
value of open courtyards is evident; these have not only
increased the physical value of the community, but have
also contributed to a collective sense of social tolerance
and inclusivity.
The inner streets within the study site are mostly for
pedestrian use, with access by two-wheelers, while the
main street passing through the area has four-wheeler
access. Main doors of the houses opening towards the
inner streets have prevented the creation of dark corners
in the narrow alleys. However, these narrow alleys
prevent access of emergency vehicles like fire trucks,
ambulances, etc., which presents a clear threat to safety
Figure 4. Narrow access points under houses in Naradevi
www.iied.org
17
Planning for affordable housing during densification in Kathmandu
during times of crisis. In some cases, the streets are
too narrow, obstructing flow of more than one person
at a time. The only access points for many open courts
are narrow passageways underneath houses (Figure 4).
Earthquake risk within the Kathmandu Valley calls into
question whether these streets and passageways can
be used as evacuation routes or rather are likely to trap
people on their way out. Also, frequent maintenance of
sewerage and water supply lines block the way, creating
a nuisance for commuters. Surprisingly, 39 per cent and
37 per cent of those interviewed rated road access as
good and moderate, respectively, even in the absence
of direct road access. Along the main outer streets,
pedestrian and vehicular movement is dense, with
shops opening directly onto the street and with sporadic
vendors obstructing traffic flow and creating conflicts
between people and vehicles.
4.1.2 Lessons learnt and way forward
Based on the survey and field observations, a number of
lessons can be learnt from traditional settlements. The
list below summarises these lessons for both enhancing
the physical and social ambience of traditional
settlements and for developing new settlements in
the future.
• As the housing preferences of higher-income families
shift towards suburban areas, traditional settlements
are becoming affordable to growing numbers of lowerincome families and renters.
• Increased density (achieved in part through crowding),
combined with inadequate access, light, ventilation
and sanitation, is a growing concern in rental
spaces. The need to improve living conditions must
be balanced against the need to ensure that rental
spaces remain affordable to lower-income groups.
According to the survey, 50 per cent of respondents
think their houses are not earthquake-safe and 12 per
• Crowding combined with a lack of maintenance in
cent do not know about the condition of their houses,
older buildings and limited accessibility to emergency
which is indicative of low levels of perceived safety
vehicles has increased risk to earthquake and fire in
in these areas. Field inspection showed direct risks
traditional settlements. Risk reduction measures (eg
from the imminent threat of an earthquake in the form
integrating earthquake-resistant technologies into
of narrow streets, unauthorised incremental growth,
building codes and standards) are clearly required.
narrow access to courtyards from underneath houses
But the measures must be made enforceable in a
and degrading traditional houses (40 per cent of all the
setting where private developers are accustomed to
buildings were assessed to be in moderate condition
evading regulations, and the costs and subsequent
and 12 per cent in poor condition). Many owners
rent hikes must be affordable to low-income groups.
have moved to the valley’s suburbs, with some renting
deteriorating traditional houses to low-income renters.
• Future reforms to regulatory frameworks should
Moreover, land conflicts over ancestral property have led
consider what private developers and local residents
(including owners and renters) are willing and able
some owners to stop using them and allow them to fall
to afford. This could be determined through their
into disrepair. There are many jointly owned properties
engagement in participatory planning processes led
that are subdivided and reconstructed. At times,
by local authorities with the support of local NGOs.
these subdivisions are too small and left in dilapidated
condition due of the lack of commercial return. These
• Densification can be accommodated in traditional
deteriorating and abandoned buildings, inhabited by
areas where courtyards provide adequate sunlight
renters seeking low rents, are considered a threat to
and ventilation, but only where incremental building
their inhabitants and to people living nearby while also
and new development do not overshadow courtyards
reducing the aesthetic value of the area.
or exceed other basic infrastructure and service
capacities. Conversely, arguments for limiting or
Only 34 per cent of households had members involved
reducing density in crowded and overburdened
in social groups and organisations, showing that the
settlements must not overlook the reality of
traditional Guthi system is dissipating, which may be
housing scarcity.
due to relocation of the native population. However, new
groups like youth clubs are emerging, which reflects the
• Courtyards are an important social and cultural
area’s changing social composition. The survey shows
amenity that can be used as a structuring element for
that 38 per cent and 54 per cent of respondents gave
developing new settlements that are dense, liveable
high and moderate ratings, respectively, to the current
and socioculturally appropriate.
social environment.
• Mixed uses offer various economic and social
opportunities as well as access to community
facilities (eg hospitals, schools) and markets within
walking distance.
18
www.iied.org
IIED Working paper
• Incremental housing construction is an important
practice among low-income households, as it
addresses the economic and spatial needs of
growing families. To improve incremental construction
practices, built environment professionals should
provide technical assistance to local builders
on issues ranging from building regulations to
fire safety and risk reduction, with the support of
local authorities.
wellbeing of the existing low-income residents
without causing unaffordable rent increases.
This would involve new structural regulations for
incremental building. It would also seek to reduce
seismic and fire vulnerability of the traditional
settlements to galvanise affordable solutions.
4.1.3 Hypothetical replanning of
Naradevi
• Vehicular movement into the mixed-use, compact
areas should be limited by preventing through traffic
to encourage and increase the safety of pedestrians
wherever possible.
The study site lies in the cultural heritage conservation
zone and is designated as a combination of the
Preserved Cultural Heritage Sub-Zone, the major
streets, the mixed old residential sub-zone and the
The study’s results have helped to formulate four
residential cluster. Considering the area’s close
approaches for addressing current issues in the
proximity to a UNESCO World Heritage Site, its
settlement. Though all four approaches have pros and
economic potential to support a tourism-based
cons, they should help to frame discussions on how
economy deserves to be exploited. However, among the
other traditional settlements in the Kathmandu Valley
four recommendations outlined above, the fourth option
might be addressed by future planning efforts.
is the most suitable for addressing the housing needs
of Kathmandu’s low-income majority. It focuses on fire
1. A radical way to create a disaster-resilient settlement
and earthquake safety, height restriction and gradual
is to demolish and redevelop the area through
upgrades while reducing density to acceptable limits,
house/land pooling. However, this would have severe
without undermining the liveability or this already dense
social, economic and environmental impacts. While
area. If tourism development is prioritised in some parts
potentially attracting the rich and middle-class, the
of the area, this would likely lead to the displacement
process would also likely drive away poor renters
of low-income residents. However, if a mixed strategy
and transform parts of the settlement from mixed-use
is deployed, tourism development could provide local
to commercial uses.
employment opportunities, while a more supportive
2. A less radical way to reduce disaster risk in the
policy environment for affordable low-income rental
settlement would be to lower density by strictly
housing could limit the exclusionary pressures.
enforcing bylaws such that additional floors beyond
To support this option, a number of guidelines have
permissible building heights would be demolished
been developed:
(in this case, those beyond 5 storeys). If these
bylaws were strictly enforced, then the density of the i) Fire safety approach
settlement would be reduced from approximately
Based on the information from the Fire Brigade of
2,133 to 1,805 people per hectare. However, from
Kathmandu Municipality, the minimum length of a
a housing perspective, this approach has clear
water hose is 25 metres. Capacity and sizes of the fire
limitations because it overlooks the housing scarcity
engines also vary, ranging from 400 to 4,000 litres, with
and the need to find alternatives to evictions for
a minimum width of 1.7m.
people living in illegal, non-conforming structures.
Map 1 demarcates the area accessible within the
This approach thus needs to be weighed against
range of a 25m-long water hose, which is thus a
other approaches, including those promoting
relatively safer zone. However, narrow inner streets
appropriate and affordable building retrofits.
and insufficient turning radius prevent a large fire
3. A conservation plan that assesses the heritage value
brigade vehicle of 2.1m or above in width from entering
of the buildings and squares is a possibility. This
the inner streets. So a smaller vehicle of 1.7m width
would provide protection and regulatory guidelines
and 400-litre capacity is the available option, which
for renovation and reconstruction to conserve and
requires a minimum street width of 2.1m. Therefore, in
develop the area as a tourist destination, while
this hypothetical remapping the inner streets have been
minimising the displacement of the local population
divided into three categories: 2.1m+ width, 1.7m to 2.1m
and service providers.
width and less than 1.7m width.
4. A much simpler solution is to protect the communal
courtyards and adapt the bylaws to protect the
www.iied.org
19
Planning for affordable housing during densification in Kathmandu
Map 1. Conceptual fire safety plan for Naradevi
The structures obstructing access to the 2,1m+ wide
streets are identified, which include a small single-storey
shop made of corrugated metal sheeting, a private
shrine, private walls, a raised plinth, an uneven street
level, a cow shed, and single houses with access to a
wider street and a larger courtyard. These streets give
access to some sections of the inner part of the block,
which otherwise would not be accessible by the fire
brigade. However, some major obstructions, like a series
of interconnected buildings along the inner streets,
block access to the inner courts, creating hazard zones
that cannot be accessed by the fire brigade. Therefore,
future planning efforts in the area need to allow access
by fire brigade vehicles at a minimum width. Map 1
identifies some of the specific areas where future
attention is required.
ii) Earthquake safety approach
In the area, there is an urgent need to properly
assess the structural vulnerability of both old and
new structures during seismic activity. Different types
of retrofitting measures (eg reconstruction, addition
of structural elements, reduction of loads, etc) can
be explored to improve the earthquake resistance of
buildings. For safety, communal open spaces and
underpasses need to be given special priority while
20
www.iied.org
retrofitting, as they are used as escape routes during
earthquakes. Map 2 identifies major communal open
spaces and underpasses that are likely to be used
by local people, who will search for open space for
evacuation and safe shelter during earthquakes.
Based on a study done by Ritsumeikan University, Japan
and the Institute of Engineering, Kathmandu (2012), two
simple techniques (as shown in Map 2) of strengthening
load-bearing buildings have been proposed. These
are: i) addition of vertical timber posts as an additional
structural element along the inner walls at regular
spacing, connected with horizontal timber beams at
floor level, and ii) addition of horizontal concrete bands
at lintel and beam levels in each storey, which are
inserted as a structural element by partially cutting out
the walls and tying the additional concrete bands to the
walls with hooks. Columns are placed at the corner to
support the concrete bands.
Similarly, research on strengthening reinforced concrete
row buildings of four storeys or more and a single bay
suggests an increase in wall thickness to 9 inches on
all floors along the longer span of the building. Also
recommended is replacement of masonry walls by
reinforced concrete shear walls (walls with braced
panels to resist horizontal loads) in the traverse direction
IIED Working paper
Map 2. Available open spaces and potential earthquake-resisting techniques in Naradevi
(Dixit and Shrestha, 2008). The cost per square
metre of floor for such retrofitting was estimated to be
US$104 for the year 2008. With an average built-up
area of 225m2 (based on an average of 44.1m2/floor and
5.1-floor height), the total cost of retrofitting a typical
house is about NPR 2,300,000, which is very high.
Though the cost of retrofitting depends on the level of
intervention, high cost is one of the major impediments
that discourage people from adopting these techniques.
In addition, since most buildings have been rented to
low-income migrants by owners who have relocated
to other places, the general absence of a sense of
ownership and responsibility for the safety of dwellers
makes expensive retrofitting techniques even more
implausible. There is thus a clear need to develop more
appropriate and affordable technologies for retrofitting
in traditional settlements and new developments.
iii) Urban regeneration approach
As one walks along the streets of the study area, one
can see many foreigners walking past, taking pictures
of vendors, local shops and the bustling people of
the area. The study area lies near a UNESCO World
Heritage Site, and its ambience has signficant potential
to attract tourists. Since the buildings along the major
street lie in the Preserved Cultural Heritage Sub-Zone,
there are specific bylaws to guide building restoration
and reconstruction. Regeneration efforts could be
initiated in a section of this zone through public–
private partnership. Potential incentives could include
the introduction of small grants and loans (subject
to available public finance) for investing in building
restoration in accordance with the bylaws. This could
also encourage other tourism-related activities (eg
lodging, restaurants, etc) and provide employment
opportunities, among other spillover effects.
Urban regeneration should also address three critical
issues inherent within the traditional mixed-used
residential clusters:
1. Vertical division of the ancestral house between
sons reduces the efficiency and value of the
space. In addition, insensitive vertical division and
reconstruction of half of the once intact single
structure make these buildings structurally unsafe
and architecturally incoherent. Therefore, either new
property ownership mechanisms (which are now
based on land only) or plot-size restriction should be
used to discourage vertical division of the buildings.
2. In the study area, one can find old buildings
in dilapidated condition, which are structurally
www.iied.org
21
Planning for affordable housing during densification in Kathmandu
vulnerable, degrade the ambience of the place,
and restrict use of valuable space. Institutional
arrangements are needed that establish guidelines
and a technical support system for regeneration of
old structures, so that these buildings can be reused
and rehabilitated to cater to various functions tied
to the local economy. Similarly, financial incentives
such as tax rebates, low-interest loans, infrastructure
services and facilities can encourage local people
to maintain and keep the old structures intact and
functional.
4.2 Sankhamul and
Bansighat: Informal
settlements
4.2.1 Sankhamul and Bansighat: Then
and now
As people migrate to cities in search of a better life, they
look for affordable homes. But in their absence, some
are forced to live informally on vacant land without basic
3. The regeneration effort should also set guidelines to
urban provisions. Eventually, these settlements expand
delineate spatial requirements for liveable conditions,
in size and are called squatter settlements.
services required, and minimum physical standards
that need to be maintained to inhabit the structure.
A small share of Kathmandu’s population amount to
However, experimentation is needed to ensure that
more than 12,000 people live in 40 informal settlements,
this will not result in housing unaffordable to lowaccounting for only 3–4 per cent of the city’s population,
income renters.
but a significant share of the low-income populace
(UN-Habitat, 2010). Most of these settlements are in
iv) Replication of mixed-use courtyards
high-risk areas, such as riverbanks and steep slopes
Mixed use and high densities in traditional settlements
vulnerable to flooding and erosion. Sankhamul and
can be replicated in other places, as this is economically Bansighat are two of 13 informal settlements along
viable in terms of provision of services, pedestrian
the Bagmati River. They were chosen for this study to
friendly and socially inclusive.
examine alternative housing options for low-income
residents and how high-density housing can be
1. Open spaces in traditional settlements have been
achieved on small plots of land.
successful in maintaining social harmony, and are
Sankhamul, also known as Buddha Marga, is one of
actively used as public spaces. Such communal
the oldest informal settlements in Kathmandu. People
open spaces can be replicated in development of
new settlements. Taking the case of the smallest plot have been living there since the mid-1960s. Before its
settlement, the land was used as pasture during winters
of land of 80m2 (2.5 Nepalese aana), and adhering
to the regulations for other residential zones, such as and would become flooded during the rainy seasons. In
1965, the area was occupied by 45 families that were
80 per cent ground coverage and 1.75 FAR, results
not able to afford rental space in the city. They built their
in a 2.5-storey building. However, if the ground
shelters using bamboo, plastic sheets and jute bags.
coverage is fixed at 60 per cent and FAR at 3, it
At present, 110 houses comprise the settlement, which
results in four- to five-storey building with a ground
is in a rapidly growing urban pocket just 3.5km away
floor area of 47.7m2. If the land is plotted in a 1:2
width–length ratio, with width of 6.3m and length
from one of the major city centres of Kathmandu (New
of 12.6m, the open space shared by the building in
Baneswor and Thapathali). With the Bagmati River and
front will be 3.7m and at back 1.4m. If two buildings
the traditional cremation area to the west, Sankhamul
facing an open space contribute 3.7m each and the has a mixed residential and commercial zone to the east.
developer contributes another 1.8m, then the length As a whole, the settlement encompasses an area of 2.1
of open space becomes 9.1m. This is more than
hectares, with a blacktopped road separating it from
sufficient as according to the light plane requirement the surrounding formal settlements in the east (Figure
of 63.5 degrees, a five-storey building of 2.7m floor
5). The current density of the study area is 377 people
height needs open space of around 7m in length for per hectare, which also includes the rental population.
appropriate light penetration.
According to the survey, respondents preferred to live
in the area due to job opportunities, close proximity
2. Bylaws on beautification of the buildings should be
to facilities (within a five-minute walking radius) and
introduced to maintain scale, texture and external
adjacent schools, despite the looming threat of eviction.
space for harmony in the built environment. However,
they must take into consideration the affordable
housing requirements of low-income groups to avoid
any potential exclusionary impacts.
22
www.iied.org
IIED Working paper
Figure 5. Sankhamul location map
Bansighat is a comparatively newer settlement where
people have been living since the late 1980s. The
settlement is located next to the traditional cremation
area with historical monuments, which has raised
some concerns among government officials and
conservationists. Compared to Sankhamul, Bansighat
is more organic and haphazard, with the Bagmati River
towards the south and an institutional and commercial
area towards the north (Figure 6). The settlement
occupies an area of 1.87 hectares with 115 houses. The
current density of Bansighat is 432 people per hectare,
which is higher than that of Sankhamul. As in the case
of Sankhamul, respondents in Bansighat preferred to
live in the area due to job opportunities, proximity to
facilities (within a five- to ten-minute radius) and schools,
even though they face a constant threat of eviction. Due
to proximity to the city centres and lower rent, growing
numbers of families are renting rooms in Bansighat.
A team of three was formed to conduct household
surveys and interviews in Sankhamul and Bansighat.
Both owner-occupiers and renters were interviewed
during the survey. One hundred houses were surveyed
out of 110 and 115 houses in Sankhamul and Bansighat,
respectively. Using systematic random sampling
methods, the team sought to interview every second or
third house.
In Sankhamul, the houses are arranged in a row that
opens out into the main road. At first glance, most of
the houses appear small and dilapidated. However,
the temporary structures are gradually being replaced
by more permanent reinforced cement–concrete
construction materials (Figure 7). According to the
field observations, 14 per cent of the buildings are new
concrete structures, while the remaining 86 per cent
are either temporary or semi-permanent structures.
With long narrow plots between 1.5 and 5 aana (48
to 159m2), the houses extend up to 20m towards the
riverbank from the road. As families grew in size, people
started adding rooms in the backyard, resulting in
long, narrow houses. With small frontages and rooms
aligned one behind another, all houses lack adequate
lighting and ventilation. According to the survey, 16 per
cent of the houses have signs of vertical incremental
growth, which is likely to increase. This will contribute to
overcrowding and other environmental issues and risks,
which will be difficult to address at a later stage.
Compared to Sankhamul, Bansighat is a more compact
and haphazard settlement, with narrow streets and
houses of one or more rooms built in an area ranging
from 1 to 3 aana (32 to 95m2). Temporary and semipermanent structures, made with bamboo or brick
walls and corrugated galvanised iron sheets as roofing
material, are predominant. Most of the houses are
www.iied.org
23
Planning for affordable housing during densification in Kathmandu
Figure 6. Bansighat location map
Figure 7. Concrete structures in Sankhamul
24
www.iied.org
IIED Working paper
single-storeyed, while a few residents have refurbished
their houses to semi-permanent double-storeyed
structures without any structural considerations.
According to the survey, 56 per cent and 31 per cent
of the houses are of a temporary and semi-permanent
character, respectively, while only 10 per cent of the
houses are permanent structures (Figure 8). Fear
of eviction is a key factor preventing investment
in structures.
Sankhamul has a linear layout, with a single row of
houses extending across the entire length of the
settlement along the bank of the Bagmati River. On the
other hand, Bansighat is a compact settlement with
organic, narrow streets sitting on the riverbank. As an
informal settlement, every square foot of land off the
street is occupied with buildings, which results in a lack
of open space within the settlement. There are, however,
open spaces along the riverbanks that have become
the main socialising areas for people. These spaces,
besides being used by children as playgrounds, are
used for household chores like washing clothes as well
as sunbathing and chatting. According to the survey,
children in 92 per cent of households interviewed in
Bansighat and 70 per cent of those in Sankhamul play
in these open spaces along the bank of Bagmati River,
while 34 per cent children in Sankhamul and 15 per
cent children in Bansighat play in the streets.
In Sankhamul, all the houses are aligned along the
5m-wide blacktopped road, with a few renting out
the front room for commercial activities. In contrast,
Bansighat has narrow and unpaved inner streets
accessible to pedestrians and two-wheelers only, while
the main street surrounding the area is wide enough for
four-wheeler access. Despite the road conditions, 47
per cent and 43 per cent of people in Bansighat rate
road access as moderate and good, respectively, while
32 per cent and 52 per cent of people in Sankhamul
rate road access as moderate and good, respectively.
All families in both informal settlements have access to
electricity, communal water supply and toilets. However,
sanitation and solid waste disposal systems need
improvements because sewage lines in Sankhamul are
directly connected to the river, while Bansighat lacks a
solid waste disposal system.
With availability of most basic facilities, easy access to
public transportation, prosperous markets, job networks
and affordable rent, these informal settlements are also
attracting low-income renters. 75 per cent of renters in
Sankhamul and 60 per cent of renters in Bansighat are
paying less than NPR 2,000 (US$20) per month to rent
a room. Another important aspect of these settlements
is the social organisation and sense of community. 89
per cent of people in Sankhamul and 42 per cent of
people in Bansighat are involved in social groups like
women’s groups, clubs or saving groups. This high
percentage of resident involvement in social groups is
Figure 8. House made from temporary materials in Bansighat
www.iied.org
25
Planning for affordable housing during densification in Kathmandu
indicative of strong social bonding and NGO activities.
In addition, settlement committees have been formed
to address social issues and bring programmes and
training to the people.
With the threat of eviction looming, people do not
see flooding and seismic hazards as major threats.
According to the survey, most people think their houses
are safe from earthquakes, and few said they were
not aware of the condition of their house. Thus, 59
per cent and 44 per cent of people in Sankhamul and
Bansighat, respectively, believe that their houses are
safe from earthquakes. During field inspection, however,
narrow streets, incremental growth and substandard
construction raised issues of the community’s high
vulnerability to seismic hazards. According to residents,
flooding is rare in both settlements, though experts
disagree as Bansighat lies within a ten-year floodplain
area (an area with a 10 per cent probability of a flood
occurring in any given year).
• Planning and regulatory frameworks are likely to
continue to have exclusionary impacts on housing
access so long as the needs and affordability
requirements of lower-income groups are not taken
into account.
4.2.3 Hypothetical replanning of
Sankhamul
Sankhamul and Bansighat represent two of many
informal settlements that are threatened with eviction,
in part because of flood risk, but also because of the
perceived threats these settlements pose to the nearby
river and heritage sites. There is an immediate need
for alternative housing options for residents of these
communities. In settlements that are safe from natural
hazards, such as flooding and erosion, alternative spatial
and architectural arrangements can be explored in line
with on-site upgrading, land sharing and densification.
Based on the study results, a hypothetical re-envisioning
exercise has been undertaken for Sankhamul and
4.2.2 Lessons learnt and way forward
Bansighat to show how it may be possible to achieve
The survey and interaction with people from informal
risk reduction, river environment protection and
settlements have helped to reveal the lifestyle and space upgrading. This remodelling is intended as a response
requirements of lower-income people. Based on the
to the particular combination of environmental and
eviction risks, and not as a replicable contribution
survey and field observations, there are many lessons
to addressing the shortage of low-cost housing
learnt for addressing housing and living conditions in
informal settlements and for developing new settlements in Kathmandu.
with the needs of lower-income groups in mind.
According to conservationists, the religious cremation
area as well as surrounding historical monuments
• Informal settlements play a key role in providing
needs to be renovated and conserved by relocating the
accommodation for people unable to afford rental
informal settlement from Bansighat. The settlement’s
space in other parts of the city. Whilst these
location in a ten-year floodplain also makes it vulnerable
people represent a small minority (3–4 per cent) of
to flooding during rainy seasons. Hence, a relocation
Kathmandu’s population, they represent a significant
plan to a safer location is one potential solution.
proportion of the lower-income populace.
However, this plan would need to be determined in
• Areas that offer easy access to economic
partnership with the community to ensure that the
opportunities (particularly livelihoods and markets),
needs, priorities and affordability requirements of lowsocial networks, and basic services and facilities
income groups are taken into account.
(eg hospitals and health clinics, schools, public
transportation) within walking distance are top
Sankhamul is located on higher ground, decreasing the
priorities for people living in informal settlements.
risk of flooding, and does not have historical monuments
nearby. Thus, on-site approaches (eg upgrading, land
• Lack of secure tenure is a major obstacle for
sharing and densification) would be possible. However,
improving living conditions through upgrading housing
the area’s high densities and poor environmental
and providing basic infrastructure and services.
conditions would make such approaches especially
Tenure insecurity can thus undermine long-term
difficult. An alternative on-site option could include
planning, development and risk reduction objectives.
comprehensively redeveloping the area to include a new
• Upgrading and resettlement options ought to be
spatial and architectural arrangement featuring low-rise
seen more as a means of resolving land disputes
high-density building typologies, river environmental
(particularly in situations where tenure is insecure) and upgrading, strategically located open spaces and
less as a means of providing significant quantities of
new services.
new affordable housing.
However, due to high land prices, individual houses on
• Incremental housing construction is an important
plots even as small as 30m2 would become unaffordable
practice among low-income households, as it
for low-income households. A more affordable option
addresses the economic and spatial needs of
could include higher-density ground-plus-two-storey
growing families.
walk-up apartments with floor areas between 30
26
www.iied.org
IIED Working paper
Map 3. Conceptual replanning exercise for Sankhamul
and 40m2., These apartments would be affordable to
low-income households if adequate public subsidies
were made available. Since Sankhamul is located
near a riverbank, mid-rise apartments taller than three
storeys would not be acceptable due to the low bearing
capacity of riverbank soil.
Given this constraint, Map 3 provides a conceptual
rendering of the densities that could be achieved
by constructing three-storey walk-up apartments
in Sankhamul. However, since these apartments
are not guaranteed to be affordable for low-income
groups unless subsidized, there is a clear need for a
broader housing strategy that supports other options
and approaches.
achieve a mixed-use compact courtyard plan that could
also potentially increase the efficiency of supplying
basic services. With facilities like schools and hospitals
already available within walking distance, the project
seeks to integrate local shops along the main street. The
plan also maintains a 20-metre setback from the current
riverbank, where a riverfront park and sewage treatment
plant could be developed as a part of river environment
upgrading.
This option could be supported by following
guidelines for:
1. Open space: Courtyards can support circulation and
the need for communal open spaces. The streets
have been reconfigured in an attempt to facilitate
i) High density walk-up apartments
pedestrian movement and non-motorised circulation
to limit automobiles. As the sense of community
The objective is to achieve a mixed-use high-density
is strong and the presence of an empowered
plan that increases economic and social opportunities
and active community organisation is a special
for inhabitants of Sankhamul. According to the survey,
characteristic, providing open spaces to strengthen
most inhabitants prefer a gridiron pattern, while few
social interactions and provide a platform for people
wish to live in courtyard houses. Courtyards are
to come together is vital in these areas. Due to
small open spaces surrounded by houses, which can
limited land availability and high land values, streets
effectively bring together people as a community, as
are a vital space that can be used by the community.
seen in the traditional settlement above. Thus, during the
Streets as public spaces can serve people of
hypothetical remodelling of Sankhamul, an effort was
different age groups, such as play areas for children
made to integrate courtyards into gridiron planning to
www.iied.org
27
Planning for affordable housing during densification in Kathmandu
and sitting areas for elderly people, which helps in
bolstering social tolerance and creating a healthy
social environment. Streets that promote pedestrian
flows, street-level activities and mixed uses can
also serve as a passive surveillance mechanism for
helping to enhance safety and sense of place.
2. Space allocation: Based on field observations, the
site lacks proper road access and open spaces. In
replanning, the circulation area increases from 12.86
per cent to 24.29 per cent to ease accessibility
within the site for serving a high-density area. On
the other hand, with social public space a basic
necessity, greenery/courtyard spaces have been
integrated into the planning, which covers an area of
13.33 per cent. However, space was not allocated
for educational purposes because the planning is
being done in an area as small as 2.1 hectares and
there are already schools available within walking
distance. 38 ground-floor units along the main street
are made available for commercial purposes.
settlement from flooding and landslides. Earthquakeresistant planning and construction based on the
National Building Code needs to be followed to
ensure minimum damage during earthquakes,
although this code may need to be reassessed if
it imposes prohibitive costs that effectively price
lower-income groups out of planned developments.
Courtyards together with parks, aside from being
socialising spaces, will serve as evacuation routes
during earthquakes.
5. Land regulations and building bylaws: The current
bylaws of 5 per cent ground coverage and 3 FAR,
with minimum 4m setback, support mid- to highrise apartments. However, the survey suggests
that people prefer three- to four-storey walk-up
apartments and individual houses. With high land
prices in Sankhamul, individual houses on even small
plots are unaffordable. Thus, we have proposed
three-storey walk-up apartments with a minimum
setback of 1.5m. This would require amendments to
the bylaw to permit:
3. Population density: One of the reasons to
conceptually remodel the Sankhamul settlement
Ground coverage = 60%
into walk-up apartments is to achieve higher density,
FAR = 3
while integrating quality open spaces in the form of
courtyards. In the proposed planning, 760 apartment
Minimum setback = 1.5m
units (38 ground-floor units to be turned into shops)
Maximum height = 13.7m
have been achieved in 266 walk-up apartments,
which can accommodate 760 families compared to
6. Housing design: As noted above, walk-up
150 families that are currently living in 110 plots. The
apartments may be affordable to low-income
population density (residential population) of the area
groups if certain financial subsidies are provided.
has increased from 377 people per hectare to 1,907
The proposed replanning supports 133 three-story
people per hectare.
apartment blocks with 760 apartment units and 38
commercial units. Each apartment with an area of
Average family size = 5.27
38m2 has two bedrooms (containing two beds each),
Total number of residential units = 760
a kitchen and a toilet, as shown in Map 3.
Total residential population = Number of residential
units x average family size = 760 x 5.27 = 4,005.2
people
Total area of site = 2.1 hectares
Proposed residential population density =
Total residential population
Total area of site
4005.2
= 1,907.24 people per hectare
2.1
4. Disaster-resilient planning: Minimising the effects
of disaster is one of the most important aspects
to consider while planning and designing walkup apartments in Sankhamul. A setback of 20m
from the riverbank has guided planning for the
settlement outside of the ten-year floodplain. In
addition, creating a park in the setback area helps
upgrade the river environment while protecting the
28
www.iied.org
ii) Individual houses:
According to the survey, the majority of people in
Sankhamul (84 per cent) and Bansighat (79 per cent)
prefer to live in three-to-five room houses on 50–100m2
plots, while few people prefer to live in walk-up
apartments. Thus, the option proposed above does not
conform to what the residents consider most desirable.
However, as previously mentioned, high land prices
mean that individual houses on plots as small as 30m2
would be unaffordable, unless sufficient subsidies were
made available.
On the other hand, individual houses could have a
number of advantages: i) it is cheaper to build houses
(the average apartment cost is US$5,000, to be repaid
by owners over time); ii) people can build on their own
or participate in the building process, which could
foster community cohesion; iii) residents can carry out
economic activity in their homes more readily; and iv)
future maintenance of the property would be easier
IIED Working paper
as it would be the responsibility of one family rather
than several.
Constructing individual houses would yield lower
densities than low-rise apartments. After deducting a
circulation space of 25 per cent, 234 double-storey
homes could be accommodated on plots as small as
32m2. At 5.27 persons per family, this would yield a
density of 1,233 persons per hectare. However, owners
would have the option of incrementally building a
second floor (as a rental or for additions to the family),
thus increasing the density to a minimum of 1,708
persons per hectare. The pros and cons of houses
versus apartments need to be further studied through
a design exercise that takes social, environment and
economic factors into consideration.
4.3 Khusibu: Land-pooling
project
4.3.1 Khusibu: Then and now
The Khusibu study site is situated on the outskirts of
the urban core and was historically protected by the
fortified walls of the city for agricultural purposes (Figure
9). Even before 1995, when the land readjustment
project began, the site was still used for cultivation.
With few houses in the area, infrastructure was not
developed except for a 3m-wide east–west road and a
3.5m peripheral road. The increasing pressure of urban
growth and proximity to the city centre naturally led to
the land of Kushibu absorbing urban sprawl. Foreseeing
the pressure of urbanisation, the government initiated a
land readjustment project for the planned development
of the area.
The Khusibu Land Readjustment Project (NLRP), which
was scheduled for three years, was accomplished in five
years at an approximate cost of US$1 million (Pradhan,
2000). The project area spreads over 42 hectares
within ward numbers 16 and 17. Following the principles
of land pooling, the project was initially designed to
regulate plot shape and size with road access, followed
by other facilities, depending upon the land contribution
from the individual landowner. Prior to the project,
there were 393 houses and 1,051 land parcels. The
plot size ranged from 130 to 150m2, with some plots
as small as 90m2. 95 per cent of the plots had private
owners, who were traditionally farmers. 58 per cent of
the owners and thir families were the sole inhabitants
of their houses, while 31 per cent rented out rooms.
Figure 9. Khusibu location map
www.iied.org
29
Planning for affordable housing during densification in Kathmandu
Map 4. Khusibu existing settlement
When categorised by function, 85 per cent of houses
were used for residential purposes while 12 per cent
were used as residential–commercial buildings. After
land readjustment, 70 per cent of the land was adjusted
into regular-sized plots, 21 per cent was developed as
roads, 4 per cent was allocated as open space (as per
regulation) and another 4 per cent was assigned for
development of services (Map 4).
The planning was governed by existing infrastructure
– ie peripheral and east–west axial roads and some
existing houses served to guide the readjustment
process. Hence, a concentric plan was devised with
access roads at regular intervals. At present, about
60 per cent of plots planned for residential purposes
have been developed while other plots have been held
for speculation. Few old houses are still standing in
the area, and most new houses are four–five storeys
tall. Though a discernible architectural style is largely
absent, certain elements have been repeated in almost
every house, like a peaked roof, slopes, parapet design,
aluminium windows, etc (Figure 10).
However, a large number of private educational
institutions emerged following the readjustment project.
Once a homogeneous society of Maharjans (the
farmer group), the area is now a heterogeneous
society with people from different castes, speaking
different languages, and from different socioeconomic
backgrounds. The proximity to the city core and lush
green hills in the distance has attracted people to this
locality even though NLRP has increased the price of
the land by 1.8 times.
This land-pooling site was selected for the study to
better understand the level of densification that can
be achieved without compromising on living standards
and to assess the implications for accommodating
Kathmandu’s future urban growth and expansion. The
study area spreads across 20.35 hectares and is
delimited by the peripheral road and the main public
road along the east–west axis that separates two wards.
The area has a total of 710 houses, but also many
unbuilt plots.
A team of three members conducted surveys for a total
A gym was built to serve as the central communal space
of 100 households. Both owner-occupiers and renters
and a playing field demarcates the edge of the site.
were interviewed. Using systematic random sampling
Except for these two communal facilities, space has not
been allocated for educational or recreational purposes.
30
www.iied.org
IIED Working paper
Figure 10. Row houses in Khusibu
are three–five storeys, with shops on the ground floor,
renters on the first and second floors, and owners on
the top floor. The current FAR for residential building
Based on the field observations, the area has mixed
in the land-pooling area is 2, while maximum ground
uses, including shops, small offices and rental units. The
coverage is 80 per cent. However, three- to five-storey
region is also located close to the main tourist centre,
buildings have FAR as high as 4. Informality in the
Thamel, and retains an active traditional marketplace.
rental market has provided the additional floors as
Furthermore, it provides housing for renters whose
rental space for the lower-middle and lower-income
jobs are in the city centre. According to the survey, 40
groups. Almost all of the surveyed buildings have 80
per cent of renters prefer to live in the area due to job
per cent ground coverage with 20 per cent open space,
opportunities. Similarly, proximity to facilities like markets
merely for minimum setback from the road. Most of the
(within three minutes’ walk), schools and transportation
houses lack a proper open and green area within the
is significantly appreciated by the dwellers. Mixed uses
compound, and even roads lack trees, which has led to
with small shops and street vendors, as well as minimal
a dry and grey appearance.
vehicular traffic (except along the main public vehicle
The study site lacks open spaces that serve for
route), are among the settlement’s most desirable
features. Current trends show that settlements designed socialising. 46 per cent of children in households
surveyed play inside houses, 28 per cent on the streets,
for single purposes (eg residential) gradually transition
into mixed-use settlements, which reflect broader social and 8 per cent in playgrounds. People also use the
and economic dynamics in the city. However, the project empty plots and road for sunbathing, chatting, parking,
etc. The only public space available is a football ground,
seems to be guided by the landowners’ demands for
land along major commercial streets. Field observations which is mostly used by youth. There are no parks or
playgrounds for children and older people. Only 4 per
revealed a general lack of sufficient separation among
cent of the total area is allocated to open space. The
residential, educational and commercial streets,
only available greenery comes from of trees planted
resulting in widespread through traffic. In addition, the
near riverbanks and residences with rooftop gardens.
lack of landmarks and the presence of monotonous
According to the survey, 34 per cent of people prefer
streets make navigating the area confusing.
living in the area due to its social environment, which
According to the survey, 96 per cent of the buildings
does not appear to be limited by the absence of
in the study site are concrete structures and 18 per
open spaces.
cent of houses have signs of incremental growth,
After land readjustment, almost 21 per cent of the total
mostly vertical. In addition, most of the buildings have
area was allocated for roads. The main roads are 8m
violated the building bylaws (Figure 11). Most buildings
methods, the team sought to interview every sixth house
in the study site.
www.iied.org
31
Planning for affordable housing during densification in Kathmandu
Figure 11. Examples of building bylaw violations in Khusibu
wide and the secondary roads vary from 2.5m to 6m.
In the surveyed area, 4.6km of 8m-wide road, 2.3km
of 6m-wide road, 1.5km of 4m-wide road and 0.6km
of 2.5m-wide road exist. The roads lack demarcation
for pedestrian and green areas, which has resulted
in conflict between vehicles and pedestrians and has
increased usage of the road for parking. The condition
of the paved road is also unpleasant as dust and dirt
have degraded the area’s environment. During the
survey, 19 per cent of the interviewees mentioned
air pollution and 12 per cent pointed to poor road
conditions as the major problems. Drainage is also
causing irritation as surface water drains overflow and
roads with potholes become inundated during the
monsoon season (Figure 12).
Road access to every house is a major pull factor as 67
per cent of people consider road access in the area to
be good, despite their condition. Also, public transport
facilities within ten minutes’ walk is a plus as 29 per cent
of people like the public transportation facilities in the
area. Public transport remains popular along the east–
west road connecting Sorhakhutte to the other side of
the Bishnumati River. Lastly, the easy walk to the city’s
centre makes the area a desirable place to live.
A land readjustment plan requires land to be acquired
from the owners. A successful land-pooling project
thus entails co-operation among owners, local
dwellers, community organisations and the government.
Social organisations have important roles in the land
readjustment process in representing the voice of
local people. According to the survey, 23 per cent
32
www.iied.org
of the people are involved in social groups and
organisations. However, only 7 per cent are involved in
the neighbourhood committee, which may be due to
floating populations – ie most of the people in the area
are renters who are not involved in land pooling and
may feel excluded from organisations set up during the
process. Interestingly, 11 per cent of respondents are
involved in co-operatives, 4 per cent in Guthi and 3 per
cent in women’s groups. The youth group looks after a
local gym, which serves as the main community building.
A separate building has been built as the community
centre, mainly for special gatherings and feasts, but
most residents are unaware of this development due to
the building’s off-centre location.
Of the respondents, 41 per cent think their houses lack
earthquake resistance and 13 per cent do not know
about the condition of their house. 46 per cent believe
their houses to be safe from earthquakes even though
they are not built with earthquake-resistant technology.
Also, during field observations, 68 per cent of the
houses were deemed to be in good condition and only 3
per cent of the houses were in deteriorating form.
4.3.2 Lessons learnt and way forward
In general, the land-pooling projects have both positive
and negative externalities. The aim here is to build on the
community’s strengths for planning better settlements in
land-pooling areas.
IIED Working paper
Figure 12. Drainage problems in Khusibu
Advantages of land pooling
• Reduces infrastructure cost compared to providing
infrastructure in a spontaneous settlement
• Provides an opportunity to combat unmanaged
urban sprawl by avoiding ‘leapfrog development’
in which land on the periphery of an urban area is
developed, leaving large land parcels between the
periphery and the city centre vacant. In this way, land
pooling projects can also play a role in shaping the
densification and consolidation of peripheral areas
• Requires human resources in terms of both numbers
and qualifications as land readjustment requires
private–public co-operation and negotiation, and
• Increases the potential difficulty of upholding the
rights of all stakeholders (particularly where renters
and other floating populations are prevalent) given the
variety of interests involved.
Lessons learnt
Based on the interviews and field observations, there
are many lessons to be learnt for planning future land• Clarifies land ownership, which can lead to increases pooling projects, which may also be relevant to other
in public revenue collection through municipal taxation new developments in the Kathmandu Valley.
• Increases access to plots if administered with the
• Increased property values in land-pooling areas
affordability requirements of all income groups in mind
could make land less accessible to lower-income
populations. This highlights the need to ensure that
• Caters to physical and social infrastructure despite
bylaws and regulations do not work to further price
varying income status, and
low-income groups out of new developments.
• Provides opportunities for government officials and
• Social organisations represent the voice of local
residents to discuss whether bylaws and regulations
residents and thus have important roles to play in the
are appropriate and realistic for all income groups.
land readjustment process. However, renters tend not
Disadvantages of land pooling
to be involved in such organisations in part because
they may feel excluded from the process. As a result,
• Increases land values through the conversion of
renters may need to be actively sought out and
agricultural land into urban uses, which could displace
encouraged to participate to ensure that their needs
lower-income groups
and affordability requirements are considered.
• Encourages land speculation (in the study site, only
• Bylaws and regulations are often violated to build
60 per cent of plots have been constructed since
additional storeys. These storeys provide rental units
1995)
for lower-middle and lower-income groups that might
www.iied.org
33
Planning for affordable housing during densification in Kathmandu
not otherwise be able to afford housing in landpooling areas.
• Given that most bylaws are violated in Kathmandu,
land-pooling projects present opportunities to test
deviations from current bylaws and to discuss their
impacts and implications with land owners, private
developers and local residents. Such experiments
could yield valuable lessons and innovations that
could be applied to the implementation of more
appropriate and realistic bylaws in future land-pooling
projects as well as other developments. They may
also yield insights into how communities and private
developers can be engaged in more participatory
planning processes.
must anticipate future demand, particularly related to
incremental growth.
• Incremental growth meets the spatial needs of
growing low- and middle-income families. To improve
this practice, built environment professionals (eg
planners, architects, engineers) should provide
technical assistance to local builders on important
issues (eg building regulations, fire safety, disaster risk
reduction) with the support of local authorities.
• Rather than allocating large open spaces, smallscale communal open spaces integrated within
neighbourhoods (eg courtyards) can meet the social
needs of the community.
• Hierarchies of roads are needed, with segregation
of commercial plots along the main streets and
residential plots along the secondary streets without
heavy traffic.
• Areas that offer easy access to economic
opportunities (particularly livelihoods and markets),
social networks, and basic services and facilities
(eg hospitals and health clinics, schools, public
transportation) within walking or reasonable
commuting distances are top priorities for residents in
land-pooling areas.
4.3.3 Hypothetical replanning of
Khusibu
• Mixed uses with high density and small- to regularsized plots can enhance the cost efficiency of
providing infrastructure (eg electricity, sewerage,
water, roads). However, infrastructure investments
The main objective of this exercise is to plan a low-rise
high-density settlement that can provide affordable
housing, including for renters, without compromising
overall living standards. The conceptual remodelling,
Map 5. Conceptual replanning exercise for Nayabazar
34
www.iied.org
IIED Working paper
informed by the lessons outlined above, has envisioned
altered spatial patterns, plot sizes and space allocation
in the study area (Map 5). There is no expectation
that the area will be redeveloped to conform to the
recommendations of this replanning exercise, but only
that this will provide lessons both for the Khusibu area
and for future replanning exercises.
i) Planning pattern
According to the survey, most of the people preferred
gridiron patterns, and some preferred courtyard
planning. Hence, a gridiron pattern in combination
with integrated courtyards has been selected for this
remodelling exercise. The main aim is to promote
an asymmetrical gridiron pattern to break monotony
through non-repetitive blocks, as illustrated by Map 5.
For promoting social interactions, public open spaces
are integrated within the blocks. Revenue-generating
commercial spaces are allocated towards the main
transportation axis, while a residential zone occupies
the rear side. The survey found that people preferred
to walk five–ten minutes for shopping. Hence, within
the residential zone, formally commercial public spaces
(kiosks, cafes) are allocated at walking distance to
promote mixed-use planning.
alongside the main vehicular road (Ropeway Sadak), as
the commercial zone contains traffic and congestion,
as illustrated in Map 5. 9 per cent of the total area
is assigned for commercial use. This excludes the
small kiosks and cafes inside the residential area. This
commercial space acts as a revenue generator that
would serve the population. Also, the road system has
been redesigned to restrict the sort of traffic likely to
support high levels of commercial activities from the
residential areas away from the main road, as shown in
Map 5. This can also be done by creating cul-de-sacs.
The residential zone is on the rear side of the
commercial zone, which is planned for low-rise highdensity development with three families per plot. This
helps to increase the total built-up area from 34 per cent
to 57.42 per cent. Also, the main point of remodelling is
to increase accessibility of societal amenities and open
spaces. Hence, instead of a large portion of open space
located on a corner, open/green spaces are allocated
in every neighbourhood block. The coverage of open
space is increased from 3.4 per cent to 5.7 per cent.
Similarly, educational facilities are allocated to two
corners considering a minimum walking distance of
two–five minutes from each neighbourhood. According
to the survey, 21 per cent of the population is below 16
ii) Circulation
years old and 43 per cent of the population is 16–35.
The main access to the site is from three roads –
The average number of people per plot is 14. There
namely Ropeway Sadak (parallel to Bishnumati link
are 1,433 plots in total. So the total population on
road), Indrayani Sadak (road adjacent to the Bishnumati 20.38 hectares is 20062 people. Hence, 4,072 are
River) and Pahikwo Sadak (peripheral road segregating below 16 years old who go to school. As 1.5m2 space
the land-pooling area). During remodelling, the width
is the standard area required for a student, 6,108m2
of total area is required for the 4,072 children who are
of the main commercial road (Ropeway Sadak) was
under 16s. With three-story buildings, there is a need
increased to 18m and the existing Indrayani Sadak
remained unaltered, as this road is located parallel to the for approximately 2,019m2 of educational area and in
the conceptual replanning, a 2,996m2 area has been
Bishnumati Riverbank.
allocated for educational purposes.
The remodelling of three major circulation roads is
The central circulation axis has demarcated the
assigned for this specific residential zone: first, the
residential zone into two neighbourhoods. Hence,
road alongside the river; second, the central road in
a park and community block is designated in each
between the residential areas; and third, the peripheral
road, as shown in Map 5. The internal residential streets neighbourhood. For better usage, parks and social
amenities are centrally located. The educational facilities
are retained at widths of 9m and 6m. The 9m-wide
and amenities are increased in this exercise from 1.22
roads also accommodate a paid parking lane. The land
per cent to 3.67 per cent. The modifications in space
coverage of roads located within the study area after
allocation before and after remodelling can be better
readjustment was augmented from 16 per cent to 19.6
observed in the table on Map 5.
per cent due to the increment in road width.
iii) Space allocation
iv) Population density
In existing conditions, space allocation and use are
inefficient. One of the major drawbacks of the existing
planning scheme is the restriction of residential planning
with no space for commercial activities. Clearly, roads
attract commercial activities. Hence, shopfronts should
have been developed along the street converting the
residential land-pooled site to mixed-use. So keeping
this in mind, a mixed-use residential plan is developed
conceptually that restricts the major commercial space
The total number of residential plots is increased from
710 to 1,385. Assuming 14 persons per plot, the
residential density of the area is increased from 526
people per hectare to 1,046 people per hectare.
www.iied.org
35
Planning for affordable housing during densification in Kathmandu
Based on survey, average family size = 4.57
vi) Land regulations and building bylaws
Total number of residential plots is increased to
1,385
As per the current building bylaws and land regulation,
Proposed families per plot = 3 (1 house owner’s
family and 2 renting families)
Number of proposed people per plot = 3 x 4.57 =
13.71 = 14
Total residential population = Number of residential
plots x proposed people per plot = 1,385 x 14 =
19,390 people
Total site area = 20.38 hectares
Total site area excluding commercial space = 18.53
hectares
Proposed residential population density = 1,046.41
people per hectare
Based on survey, existing residential population
density = 526.48 people per hectare
FAR = 2
Ground coverage = 60% to 80%
Minimum plot size = 80m2
Minimum frontage of plot = 6m
But the survey indicated ground coverage up to 90 per
cent and FAR of 3–4.
Hence, in the conceptual remodelling the FAR is
increased to 3 so as to escalate revenue generation
for the local authority and maximise rental space. The
minimum plot size is decreased to 72m2 (with frontage
of 6m and depth of 12m) to maximise the plot numbers
and density. These interventions reduce the cost of land
and increase the number of plots needed to better serve
the population.
As per the proposal, with a minimum setback of 1.5m
on either side of a plot (front and back), the maximum
Hence, the imagined redevelopment of Khusibu would
ground coverage possible is 54m2 out of a 72m2
considerably increase the residential density of this area
standard plot size. Furthermore, provision for three
by 519.93 people per hectare. This suggests that more
families per plot – the ground and first floors for renters
people would have access to better infrastructure and
and the remaining second and third floors for owners –
diversity in land uses. Middle-income groups would be
suggests a maximum of a four-storey building. This will
able to buy the land and build houses with rental flats for
require a new FAR and ground coverage.
lower-income groups.
So according to our proposed building bylaws:
v) Disaster-resilient planning
Ground coverage = 75%
There are various natural disasters that severely threaten
the longevity of a project such as earthquake, fire,
FAR = 3
landslide, flood, drought, etc. Disaster-resilient planning
Proposed plot size = 72m2
approaches support the coping capacity of the system
Maximum permissible total floor area = 216m2
in the face of sudden shocks and stresses. Among
these disasters, earthquakes present an impending
vii) Individual house plan
threat for Nepal. Preparedness and awareness amongst
The survey indicated that the majority of people desire
local residents along with effective implementation of
a house of 92.9m2 with three bedrooms. Hence, a
the National Building Code can rectify the effects of
minimum plot size of 6m x 12m (72m2) is allocated
earthquake to some extent. Hence, green spaces are
planned in such a way that they would be fit to serve as and a row house (also known as a terraced house or
townhouse) was designed to show that higher density
collection and recovery sites in case a disaster strikes.
can be achieved on smaller plots without compromising
Total residential population = 19,390 people
on liveability (Map 6). As the average family size is 4.57,
Collection site area = 3.5m2 per person = 67,865m2 and three families would inhabit each plot, a maximum of
required for all
14 people could inhabit each building. This suggestion
for two renter families with four people each and an
Evacuation site area = 10m2 per person =
owner family with five–six people requires a building of
193,900m2 required for all
three–four storeys. Two floors would be rented and the
Provided area for collection site = 31,759m2
remainder would be used by the owner for a residence.
= area serving 9,074 people (47% of total
A simple two-bedroom home with an attached – kitchen
population)
per floor was designed. The ground floor includes a
porch, a staircase, two bedrooms and a hall kitchen.
Since the site is not large enough for an evacuation
The second floor includes three bedrooms and a hall
area, it is recommended that the road adjoining the
kitchen. The remaining two floors have spaces to be
Bishnumati River be used as the evacuation area.
allotted as per the comfort of the owner.
36
www.iied.org
IIED Working paper
Map 6. Conceptual floor plan for Nayabazar
4.4Chabahil
4.4.1 Chabahil: Then and now
Chabahil holds a significant place in the history of the
Kathmandu Valley. It is named after Charumati, daughter
of King Ashoka, who in the 3rd century BC built the
oldest Buddhist stupa in the Kathmandu Valley. The
location is still a site of worship by the city’s patrons and
attracts pilgrims every year (Figure 13). The presence
of a popular Hindu temple in the proximity of a rapidly
developing settlement reflects the importance of taking
account of social harmony and religious tolerance
in guiding Kathmandu’s development. Historically
located on the outskirts of the city, Chabahil is now a
bustling area that has captured the spillover impacts of
population growth and urban expansion (Figure 14). It
is now located at the periphery of the ring road, which
was created in an attempt to ease traffic of the core
city by having a road around the city boundary. In the
land-use plan of Kathmandu, Chabahil lies in the Urban
Expansion and Residential Zone and Other Residential
Sub-Zone. Due to population pressures, the city has
grown past the ring road and yet another outer ring road
is currently being formulated. Currently, Chabahil can
be regarded as a part of the city centre that reflects the
spontaneous and haphazard growth of the Kathmandu
Valley, driven by rapid urban growth coupled with poor
planning practices.
The study site is a part of the Urban Expansion Zone
adhering to the periphery of the ring road. The reason
for studying urban density in Chabahil is to analyse
whether it would have been possible to attain higher
density and better living conditions than is emerging
www.iied.org
37
Planning for affordable housing during densification in Kathmandu
Figure 13. Chabahil location map
Figure 14. Chabahil landscape
through Chabahil’s haphazard development through
planned interventions, with or without land pooling.
The area is irregular in shape, bounded by the ring
road along the west, with the Chabahil junction to
the northwest, while a forest borders the southeast
corner. The remaining three sides follow the winding
roads to demarcate an area of 22.57 hectares with
844 buildings.
38
www.iied.org
A team of four members conducted household surveys
of 100 households in the selected area. Systematic
random sampling methods were used to interview a
respondent from every seventh house, and if the building
was institutional, the building immediately next to it was
sampled. Both owner-occupiers and renters who lived
in the area were interviewed.
IIED Working paper
Chabahil underwent unplanned growth early on;
therefore roads are irregular in size and non-linear,
attempting to serve land of irregular sizes and shapes.
Houses are built along the road in a haphazard manner,
creating a cluster of settlements that lack a pattern and
are confusing to navigate (Figure 15). Based on the
survey, the average number of people living in a plot,
with two households per plot, is 11.02. As there are
approximately 840 households, the total population
is roughly 9,257 and the population density is 410.14
people per hectare. The population is still on the rise
as more than one fourth of the land is still vacant and
serves as the Urban Expansion Zone that attracts both
locals and migrants. According to the survey, only 25
per cent of the landowners inherited land. In general,
22 per cent chose to live in the area due to its close
proximity to their workplace; 16 per cent due to their
friends and family living nearby; 12 per cent due to
availability of physical facilities; and 10 per cent due to
the Pashupatinath Temple nearby.
The residential area has an overlay of commercial,
institutional and industrial uses. Based on the survey,
11 per cent of the buildings have commercial uses and
52 per cent have rental units together with residences.
The total ground coverage by buildings is calculated
to be 35.03 per cent, the public open area 2.81 per
cent, the educational and religious area 3.26 per cent,
private open spaces around the houses to meet the
bylaws 18.39 per cent, circulation space (roads and
streets) 11.66 per cent, and vacant plots (temporary
structures, open land, etc) 28.86 per cent. Present
land-use data give us a clear picture that public space is
largely absent in the area. Expansion in vacant plots can
increase the population of this site.
The main asset of the study area is its proximity to the
holy temple of Pashupatinath and its conserved forest
area, listed as a UNESCO World Heritage Site. As it is
within 10–20 minutes’ walking distance, local residents
use the area for religious, cultural and recreational
purposes. As for other needs, 88 per cent of people
shop within a 15-minute walking range. There are a
few schools and colleges within the site and its tenminute walking distance buffer. However, the area lacks
designated playgrounds for children. According to the
survey, 47 per cent of children play inside their homes
and 31 per cent play in the streets. This reflects the lack
of designated open spaces in this new Urban Expansion
Zone, which is only partially compensated for by the
conservation forest around Pashupatinath. 82 per cent
of respondents were also unaware of any community
centres in the vicinity. With the area’s moderate level
of safety, more than 80 per cent have a moderate
preference to live in the social environment of the area
as most of them have adapted to the environment.
The study area follows an organic pattern, with
predominantly isolated buildings along the inner streets.
However, the main roads consist of row houses with
Figure 15. Haphazard development in Chabahil
www.iied.org
39
Planning for affordable housing during densification in Kathmandu
Figure 16. Bustling main road in Chabahil
shopfronts that work to maximise efficient usage of the
available area, although congestion is often a problem
(Figure 16). Physical infrastructure like drinking water
and solid waste management is in moderately good
condition. However, problems with rain water drainage
currently plague the area. Air pollution is at a moderate
level and noise pollution within the site is low. Though
more than 50 per cent of dwellers indicated that road
access and public transportation facilities were good,
traffic congestion and a lack of public parking space
are the major problems identified by residents. Based
on the survey, almost 79 per cent of respondents
had a moderate preference for living in the current
physical environment.
As the area is in the Urban Expansion Zone, which is
growing rapidly, the buildings are comparatively new and
constructed with modern reinforced cement concrete
(RCC). From the field observation and survey, it was
established that almost 95 per cent of the buildings are
permanent structures in visually good condition. RCC
is the major construction technique, used for 67 per
cent of total construction, with load-bearing structures
comprising 31 per cent. Though there are no visible
signs of incremental growth, more than 50 per cent of
the respondents referred to future plans for incremental
extensions. Though the houses are currently in good
condition, almost 50 per cent of respondents did not
know about the capacity of their buildings to resist
seismic forces. While 35 per cent feel their structure
is safe, 18 per cent considered their buildings to be
unsafe in the event of an earthquake. Most of the houses
40
www.iied.org
have flat roofs used for sunbathing in winter, as well
as drying and washing clothes. The flat roofs of the
modern concrete houses partially serve the purpose of
courtyards found in traditional settlements.
Based on the survey, 51 per cent of the households
are engaged in one or more types of community
organisations: 32 per cent are engaged in traditional
groups, 28 per cent are involved in neighbourhood
committees and 20 per cent are involved in cooperatives. The results show that a sense of community
is still maintained in new settlements, as people have
either continued their participation with old social
groups or formed new ones.
4.4.2 Lessons learnt and way forward
Based on the findings of the surveys and field
observations, there are many important lessons that
can be drawn from this clustered organic settlement.
Similarly, there are opportunities to improve the living
conditions of residents and to enhance the built
environment of the area. A summary of the lessons
learnt and means of better development of planned
settlements is given below.
• Bylaws permitting only residential uses do not
reflect the needs or preferences of residents, who
often circumvent these bylaws by establishing local
businesses in their neighbourhoods. Living in close
proximity to sources of employment and local markets
for meeting basic needs (eg food, clothing) benefits
residents by reducing their daily trips and transport
IIED Working paper
costs, which also presents opportunities for achieving
broader city-planning objectives (eg promoting
active modes of transportation and reducing traffic
congestion). These objectives could be supported by
introducing bylaws permitting mixed uses.
• Areas with low-rise buildings that are beginning to
densify spontaneously (including through incremental
growth) present an opportunity for local authorities
to guide this process by working with local NGOs
to engage local builders and private developers
through, for example, providing technical assistance
on building regulations, fire safety, disaster risk
reduction, etc.
• Densification presents another opportunity to
enhance the efficiency of providing and/or upgrading
basic infrastructure and services to cope with future
population and incremental growth.
• Currently, the area is low-rise and low-density, and is
gradually becoming denser. As there are no density
limits in the area, Chabahil is evolving organically.
Therefore, guided development with density limits
depending upon infrastructure limits should be
introduced in the near future.
• The construction of buildings that do not follow
regulations has resulted in haphazard growth and
the lack of proper monitoring is another factor in
un-regularised development. Informal developers
should be provided with technical advice and
managerial guidance from an NGO and/or a specially
created government department so as to prevent
haphazard growth.
• The settlement’s heterogeneous nature is contrasted
by the prevalence of buildings surrounded by gated
boundary walls. There is a concern that these
boundaries are instilling a sense of insularity that
could weaken social linkages.
• Vehicular movement has been given priority in these
settlements. Almost all homes have vehicular access.
However, vehicular traffic on residential roads is very
low as people use them for playing, gathering, etc.
The function of open space is partially fulfilled by
these roads. Therefore, streets can also be developed
as a multi-functional public space, but safety issues
would need to be considered in the design process.
• Social bonding should be increased through
participation in neighbourhood committees, which
have traditionally been supported by the Guthi
system. Local NGOs can play a key role in supporting
and mobilising communities (including low-income
and other marginalised groups) to participate in
planning processes.
The study’s results have helped formulate an approach
to address the issues related to the settlement. The
approach’s aim is to promote discussions about
planning for other organic and planned settlement in the
Kathmandu Valley.
The process of growth should be guided by developing
appropriate bylaws and guidelines that are capable of
addressing current as well as future problems related
to urban infrastructure decay and deficiency due to
population growth and densification. If these problems
are not averted though proper planning, then people
may start migrating to other locations that are better
serviced. On the other hand, residents unable to afford
the costs of housing elsewhere would be forced to
cope with declining environmental conditions. The ability
to maintain and improve basic services as the area
continues to grow is thus key to ensuring adequate living
conditions, particularly among lower-income residents.
One potential approach would be to test new bylaws
and regulations in land-pooling areas, as outlined
above, and to apply the lessons learnt in peripheral
areas as they continue to grow, consolidate and densify.
Identifying relevant lessons and applying them in these
and other settlements (including traditional settlements),
where applicable, could be aided by a local NGO
working in partnership with local authorities. This
partnership would seek to engage private developers
and residents (both owners and tenants) in discussions
regarding the appropriateness of existing bylaws and
regulations, along with the potential revisions that could
make them both more realistic and enforceable. This
discussion would have to reconcile a recurring tension
between enforcement and affordability. That is there
is a clear need to ensure that bylaws and regulations
are adopted by building owners and private developers
accustomed to evading regulations, and affordable to
lower-income groups accustomed to living informally.
If this tension is not addressed, then it is unlikely that
existing bylaws and regulations (let alone new bylaws
and regulations that would impose additional costs) will
be followed.
One potential action area for local authorities is to
identify and partner with a local NGO like Lumanti
Support Group for Shelter that has experience
working with low-income groups around housing
and infrastructure- related issues, with the aim of
establishing a platform for these discussions. This
platform could also serve as a basis for discussing how
appropriate earthquake resistant technologies could
be incorporated into a regulatory framework that is
more likely to be followed. To inform the development
of this framework, a university or research organisation
that has experience working on these technologies
could be engaged. Such engagement would present
opportunities for future action research as part of a
larger and more inclusive community of practice around
urban planning and development in Kathmandu.
www.iied.org
41
Planning for affordable housing during densification in Kathmandu
4.4.3 Hypothetical replanning of
Chabahil
This hypothetical replanning exercise takes a radical
approach to identify the level of density that could
potentially be achieved in the area as it continues to
densify while maintaining adequate living conditions
(Map 7). Various measures that would lead to
increased density have been conceptualised, and
their expected impacts have been estimated. They are
described below.
i) Planning concept
The replanning exercise imagines a compact walkable
settlement in a low-rise high-density environment.
Surveys showed that the inhabitants walked only a
15-minute distance for shopping, which is within the
radius of 500m. Given this trend, it is anticipated that
mixed uses will emerge in the central area, which could
be supported by the creation of shopfronts facing
12m-wide pedestrian lanes. These pedestrian lanes
could serve as public open spaces within a 400m
radius from the site boundary used for walking, sitting,
eating, shopping, etc. This would encourage community
Map 7. Conceptual replanning exercise for Chabahil
42
www.iied.org
interaction throughout the area, responding to residents’
current concerns. Circulation of three quarters of the
site is conceptually replanned in a gridiron pattern
whereas one quarter of the site is planned in a radial
pattern. 11 per cent of the site area is assumed to end
up being used for business and commercial purposes.
This is located linearly along the existing ring road, with
a right of way extending 31m along both sides from the
road centre.
ii) Circulation
The site can be accessed from three sides, with the
ring road and a four-lane highway with a 31m setback
defining the western border. In replanning, intersections
with the ring road have been limited in two locations to
avoid nodal development and to ease traffic flow. Both
pedestrian and vehicular access has been planned for
complementarity with an inner ring road serving major
vehicular circulation, while a straight, linear pedestrian
lane provides easy access by pedestrians. A 12m-wide
pedestrian road could also provide spaces for social
activities. The hierarchy of the roads is maintained by the
different road widths: 12m, 6m and 3m.
IIED Working paper
iii) Space allocation
Families per plot = 3 (1 house owner’s family and 2
renting families)
Based on field observations, the site lacks proper
Population per plot = 3 x 5.66 = 16.98 = 17
road access and footpath demarcation, which has
affected vehicles as well as pedestrians. In conceptual
Total residential population = Number of residential
replanning, the circulation area increases from 11.66 per
plots x proposed people per plot = 1,480 x 17 =
cent to 31.72 per cent to ease accessibility within the
25,160 people
site for serving a high-density area. A high percentage
Total area of site = 228,244.98m2 = 22.82 hectares
of the road coverage is also due to the 31m right of way
for the ring road, which accounts for more than 17 per
Proposed population density = 1,102.54 people per
cent of the total road coverage. In residential areas,
hectare
each plot can now accommodate three families. The
commercial area is concentrated along the ring road,
Existing population density = 410.14 people per
which makes up 11 per cent of the total area. The cost
hectare
of infrastructure improvements to the project will be
Hence, after redevelopment of the Chabahil site, the
covered by sale of these commercial plots at higher
density of this area will increase significantly by 692.4
prices than residential plots.
people per hectare. High density will help in efficient
According to the survey, 24 per cent of the population is and cost-effective planning of infrastructure and will
below 16 years old and 70 per cent of the population is increase accessibility to land and housing units for
between the ages of 16 and 55. With an average family prospective buyers and renters alike.
size of 5.66 and 1,480 plots generated from replanning,
v) Disaster-resilient planning
the total population on 22.82 hectares of land is 25,160.
Therefore, 24 per cent of the population is below 16,
To minimise the impacts of an earthquake, the
meaning the population of this demographic comes to
development of a socially and technically appropriate
6,038. As 1.5m2 space is the standard area required for building code is fundamentally required. The focus
a student, 9,057m2 of total area is required for the 6,038 should be on the development of an appropriate and
children who are under 16s. With three-story buildings, enforceable bylaw, as outlined above. Planning for
there is a need for approximately 3,019m2 of educational disaster response is equally important and requires
identification and demarcation of evacuation areas. In
area and in the conceptual replanning, a 3,832.45m2
the study, open green spaces are planned to act as
area has been allocated for educational purposes.
collection points in case of earthquake.
With social public space a basic necessity, the central
Total residential population = 25,160 people
space has been envisaged as the community space
(west side), along with the park (east side) on both
Density of residential population = 1,102.54 people
sides of the pedestrian lane. This pedestrian lane could
per hectare
also serves as a community space, with storefronts
Collection site area = 3.5m2 per person = 88,060m2
and community-based markets and restaurants within
the mixed-use zone. There are pockets of green play
area required for all
spaces for children in various places, which cover
Evacuation site area = 10m2 per person =
5.06 per cent of the total site. Two spaces for service
251,600m2 area required for all
amenities are placed on the southern part of the site.
Future expansion has also been anticipated in this
Provided area for collection site = 11,556.97m2
reimagining and combined with the existing residential
= area serving 3,302 people (13.12% or total
and commercial areas.
population)
iv) Population density
Based on survey, average family size = 5.66
Total number of residential plots after conceptual
replanning = 1,480
Since the site is insufficiently large for evacuating
community members, it is recommended that the area
adjoining the site, ie open space of the Pashupatinath
forest area, be used as the evacuation area.
www.iied.org
43
Planning for affordable housing during densification in Kathmandu
vi) Land regulations and building bylaws
Minimum size of plot allowed = 79.52m
(0 – 2 – 2 – 0)
2
Minimum width of plot = 6m
Standard ratio of length to width of plot is 2:1,
ie L = 2B, or 3:1, ie L = 3B
Considering the standard ratio, 6m x 13.253m =
79.52m2 is the standard minimum area required. By
simplifying the size to L = 2B, a 6m-wide and 12m-long
plot yields a 72m2 area. Furthermore, the proposed area
of the minimum allowable plot is 72 m2.
As per building bylaws, the site lies in a Residential
Zone, Other Residential Sub-Zone. In this subzone, a site smaller than 127.24 m2 will have the
following parameters:
Ground coverage = 80%
FAR = 1.75
Proposed plot size = 72m2
Maximum permissible ground coverage area =
57.6m2
Maximum permissible total floor area = 126m2
During replanning, buildings are realigned as row
houses that require a 1.5m setback in the rear and a
1.5m setback at the front. Residents would thus have
parking as well as a lawn in every plot, a plinth area of
6m x 9m = 54m2 and a building of 2.5 storeys. This
would provide three habitable rooms on the ground floor
with parking; four habitable rooms on the first floor; and
a puja (Hindu worship) space, laundry and store on the
top floor. These would be three–four-bedroom houses
in which only one family could live. However, analysis
from the survey shows that on average two families live
in one house and the average family size is 5.66. So
in total 11.02 people live in one house. The replanning
proposes that three families inhabit one house. This
requires a 4.5-storey building to accommodate three
families with 16.98 = 17 people per plot.
44
www.iied.org
Hence, the proposed parameters for replanning:
Proposed ground coverage = 80%
Proposed FAR = 3.5
Ground floor area = 57.04m2
First floor area = 57.31m2
Second floor area = 57.31m2
Third floor area = 57.31m2
Fourth floor area = 10.73m2
Total floor area = 239.7m2 maximum
Maximum proposed ground coverage area = 57m2
Maximum proposed total floor area = 252m2
Typical house plan:
The ground floor of the suggested housing plan
contains one car parking area, two bedrooms, one
kitchen-cum-dining area and one toilet. The second
floor contains two bedrooms, one kitchen-cum-dining
area, one toilet and one extra bedroom. The kitchen has
one small balcony. The second and third floors follow
the first floor plan.
5
IIED Working paper
Conclusions
A number of general conclusions and recommendations
can be drawn from the findings of the report. These can
be divided into two sections: one, general conclusions
and recommendations; and two, case study-specific
conclusions and recommendations.
5.1 General conclusions
and recommendations
Rentals as a housing option: Land in Kathmandu,
even on the periphery, is far too expensive for the poor.
Therefore, almost all housing being constructed is for
middle- and, at best, lower-middle income groups. The
only option left for the poor is to rent in other people’s
homes, including in informal settlements. The market
has responded to this need and rental accommodation
is available, not only in new middle-income schemes,
but also in the ancient inner city of Kathmandu. Much of
this rental accommodation is not planned as rentals and
as such is haphazard, congested and poorly serviced. It
is also argued that it is affordable to the poor because it
is of poor quality.
Building, especially for rentals, is not an economically
viable option. The cost of land and construction is so
high that it cannot be recovered in fewer than 20 years
from the rents. Therefore, people building homes for
themselves rent out rooms that they construct as part
of their house for this purpose. This also guarantees
them an extra income. How this can be done through
appropriate architectural design remains an issue.
To overcome the haphazard and congested nature
of rental units, it is recommended that a process is
developed in making house plan alternatives available to
those who are constructing a house/commercial activity.
As outlined above, this could be done by engaging an
existing NGO, or establishing a new one, whose agenda
is to create a platform for engaging builders, developers
and residents in the production of plans, providing
technical advice, and facilitating discussions around
how a more appropriate and enforceable regulatory
framework can be achieved. A government department
or NGO–government–academia partnership could also
be created for this purpose.
The importance of rentals for low-income groups is
important. Therefore, some incentives to promote rentals
would help in increasing them and improving their
quality. Such incentives could be tax rebates, better loan
facilities for construction, and other legal and financial
instruments.
Squatter settlements: Because of the cost of
land combined with the unavailability of state land,
squatting is not increasing except within existing
squatter settlements, which remain relatively small in
size. They have a total population of only 12,000 living
in about 40 settlements. Their future is uncertain and
their resettlement or upgrading is required. Attempts
at demolition and resettlement have not been very
successful (Box 1).
www.iied.org
45
Planning for affordable housing during densification in Kathmandu
Box 1: Facing eviction:
The experience of
Thapathali
On 9th May 2012, as children from Thapathali
squatter settlement in Kathmandu were getting
ready for their school and men were hurrying for
work, their normal life was brought to a halt by Nepal
Government’s four bulldozers. 251 houses in the
settlement were bludgeoned with the help of 2,200
security personnel from Nepal Police, the Armed
Police Force and the City Police. The government
had plans to relocate the settlement to safer areas
away from the river. As people were not willing to
go, they were evicted. However, government was
not been able to find appropriate location to relocate
the Thapathali settlement because of people’s
unwillingness to live away from the city centre
and protest from the locals where the government
tried to relocate. Thus, the people come back to
Thapathali and starting building their houses with the
debris. Three years after the eviction, the Thapathali
settlement is still there.
A law is required for regularising existing squatter
settlements. However, this would have to be a political
decision, which civil society could lobby for. This law
may provide ownership rights to existing residents and
support a process of upgrading and/or redevelopment.
Redevelopment could entail medium-rise apartments
and/or individual houses on small plots, as proposed.
Prioritising these options should be based on residents’
needs, preferences and affordability requirements.
However, whilst apartments can achieve higher
densities, houses have the advantage of supporting
incremental growth and other modifications to meet the
needs of growing families.
lobbied local government to finance and build the
‘off-site’ infrastructure to support these plans, allowing
communities to finance and develop the ‘on-site’
infrastructure with OPP technical assistance. A similar
process with the support of a local NGO could be
followed here.
Land pooling: The government carried out a landpooling exercise for one settlement in 1995. Problems
with its planning have been identified in the case study
on Khusibu. To make optimum use of expensive land,
the owners of the houses have violated government
bylaws and zoning regulations, especially FARs. In
addition, even after 18 years, 40 per cent of the plots
remain unoccupied. The plots are held for speculation,
distorting the real estate market. To control land
speculation in pooling schemes, a non-utilisation fee
for land should be imposed. Land pooling offers a way
out by providing planned development for housing and
should be encouraged.
Seismic considerations: Kathmandu is in a highactivity seismic zone. Much of its old construction
and almost all of its more recent buildings are not
earthquake resistant. Retrofitting these buildings is
beyond the financial capacity and technical capability
of building owners or the state. Finding alternatives to
improve the safety of these buildings is essential. In
addition, it is necessary to provide technical support to
make new buildings earthquake resistant and to ensure
sufficient spacing and access to facilitate evacuation
and emergency response.
Retrofitting must be approached by examining more
appropriate technologies since conventional engineering
methods are far too expensive. Determining which
technologies are most viable (particularly for lowerincome groups) can be investigated through discussions
on how a more appropriate and enforceable regulatory
framework can be achieved. Such discussions
should also consider other approaches, including, for
example, the integration of disaster risk reduction into
Present form of settlement creation: The present
school curricula. However, the barriers to accessing
form of development involves conversion of farmland into education, among other basic services in Kathmandu,
housing. This is done in two ways. One, farmers start
are particularly high among poorer families, which
building houses for themselves on their farms adjacent
often force their children out of school and into work
to the city. Other people join in by purchasing land to
(Brown and Dodman 2014). These barriers are also
build their own homes. In the process, settlements
evident in the tension between the enforcement of
arise informally. Two, developers purchase land from
bylaws and regulations, and the ability of lower-income
the farmers and convert it into housing. The second
groups to afford their associated costs. Ultimately, the
process is increasingly replacing the first. In both
development of a more appropriate and enforceable
processes, government bylaws and zoning regulations
regulatory framework (including one that increases
are not followed.
safety and reduces risk) will depend largely on whether
this tension can be reconciled.
To ensure that the development plans of the farmers
and the developers are ‘environment-friendly’, advice
From a practical perspective, simple rules of thumb in
can be provided to them. For example, the Orangi
the Nepali language, along with illustrations, need to
Pilot Project (OPP) in Pakistan has given such advice
be developed for new construction projects. A process
to informal developers and also developed plans for
whereby local masons can be trained and house
providing infrastructure in informal settlements. It has
builders can be encouraged to use these has to be
46
www.iied.org
IIED Working paper
developed. Ideally, this should be a joint venture of local
government, relevant NGOs, local community-based
organisations and academia. For example, Lumanti –
a local NGO engaged in housing and infrastructure
issues facing the urban poor – is currently using these
rules of thumb in its housing projects.
Bylaws and zoning regulations: The existing bylaws
and zoning regulations do not support the levels of
density that land values justify, nor do they address
the housing scarcity and commercial needs of the city.
For this reason, they are violated in almost all cases. A
revision of the bylaws and zoning regulations, especially
FARs, is required. In addition, it is not possible under the
bylaws to divide property horizontally. This has adverse
repercussions, both architectural and environmental, on
the built environment.
There is also a serious need to revisit bylaws, zoning
regulations and the National Building Code so as to
accommodate positive trends in the built environment
of Kathmandu. Two issues have emerged from the case
studies as particularly important to consider. One, all
settlements gradually become mixed-use settlements;
and two, regulations related to FAR are violated by
incremental growth. An important issue is the nature of
commercial/economic activity that should be permitted
in the settlement and in which location.
Social transformation: A transition is taking place in
Kathmandu whereby caste-based settlements are being
converted into heterogeneous settlements. Castebased settlements used to have traditional community
organisations that managed the infrastructure and its
maintenance in the settlement, along with settling family
and community disputes. At present, heterogeneous
community organisations are rare, except where NGOs
have intervened to promote them.
There is no option but for communities to participate
in managing their own settlements in partnership with
local government. The NGO effort to create community
organisations has to be encouraged and the local
government should be advised on negotiating with them
and building relationships based on such negotiations.
In the case of Lumanti, these relationships are already
being built.
A conservation plan already exists in the Heritage Act.
However, old buildings are being demolished to create
new and denser neighbourhoods with more floors.
Also, vertical subdivisions of buildings are taking place
without any architectural or design advice. The creation
of a platform as described above that provides such
advice is necessary. Further research, discussion
and advocacy are needed concerning the role of this
platform and its institutional powers and structure (eg
which government agency or civil society/academic
institution should host it).
Land markets: The land market in Kathmandu is not
transparent. There are a number of informal dealings
and hidden costs in property values and ownership.
Existing land-use plans are also not followed due to
institutional weaknesses. There is a need to make
property ownership, rentals and current land-use
information easily accessible. This will have a positive
effect on the market.
Renters: In land pooling areas and in squatter
settlement upgrading/redevelopment, the rights of
existing renters are an issue that is not addressed in
planning. There are many renters, including agricultural
workers, who live in land-pooling areas where farmlands
have been converted informally into urban settlements.
The pros and cons of potentially accommodating these
renters in the replanning process need to be assessed.
Institutional arrangements: To support the
conclusions and recommendations given above,
new institutional arrangements are required. Such
arrangements will be supported and/or contested by
different groups for different political and economic
reasons, including those related to the control of turf.
Effective institutional arrangements can thus only be
created if civil society can come together to frame
the necessary proposals and to promote them with
the political parties and government bureaucracies.
Certain steps can be taken by NGOs through pilot
projects. These pilot projects could eventually feed into
government policies and procedures and lead to the
creation of relevant institutional arrangements.
Conservation issues: Kathmandu is an ancient city
with a large volume of built heritage. This heritage
is gradually being destroyed through reconstruction
and ad-hoc building additions. To address these
issues, it is necessary to have a rational conservation
plan that takes into consideration existing trends of
densification and that can provide technical help and
managerial guidance to property owners interested in
demolition, reconstruction, additions and modifications
to existing structures.
www.iied.org
47
Planning for affordable housing during densification in Kathmandu
5.2 Conclusions and
recommendations for the
four case studies
5.2.1Naradevi
Different approaches: The replanning of Naradevi
has been looked at through different approaches: i) fire
safety; ii) lower density; iii) earthquake safety; and iv)
urban generation. All four can be assimilated into the
urban generation approach through a conservation plan.
Conservation plan: The conservation plan can
list buildings in three categories: i) buildings of high
heritage value that need to be preserved; ii) buildings
in which alterations and/or additions can be made
while conserving the facade, scale and texture; and iii)
buildings that can be demolished and reconstructed
according to conservation-consistent bylaws that
need to be developed. These bylaws must ensure that
the scale, texture and external space in Naradevi are
maintained. Scale does not mean height but is related
to the manner in which fenestration (windows and other
openings) is applied to the facade. These bylaws must
necessarily balance architectural and conservation
objectives with the affordability requirements of lowincome groups.
Traffic management: Naradevi is overcrowded, with
a major difference between day and night density. As
such, one of the proposals for it looks at the possibility
of de-densifying the area. Through this hypothetical
process, the density of Naradevi has been reduced from
2,133 to 1,805 per hectare, or by 15.4 per cent. Though
this will improve congestion, it is not a viable proposition
and can only be achieved if more attractive locations for
tourism and businesses are developed. In addition, it
has been noted that 20 per cent of houses have signs of
incremental growth.
One of the major reasons for congestion, which will
also make an earthquake disaster less manageable, is
the absence of traffic management. Therefore, a traffic
rerouting and management plan is essential. This can
improve both the physical and the social environment.
However, it can only be effective if it is a part of a larger
traffic management plan for Kathmandu. New construction: New construction on the site of
demolished buildings must follow some conservationconsistent bylaws. To prevent vertical subdivision of
plots and buildings, horizontal division of buildings must
be made possible through a change in laws.
Additional floors: The area is densifying with the
addition of floors to existing buildings. There is a clear
need for these floors given the shortage of affordable
housing. The possibility of adding two floors with
lightweight materials should be examined. Simple
48
www.iied.org
bylaws related to sun angles could help determine if
floors should be added.
Disaster-related recommendations: The proposals
for mitigating the effects of fire and earthquake disasters
by developing new bylaws and regulations that take into
consideration what land owners, private developers and
informal dwellers would be willing and able to afford are
strongly recommended in this report.
5.2.2 Sankhamul and Bansighat
Relocation of Bansighat: Bansighat is a settlement
along the river next to a location of religious significance.
It is also prone to flooding. For this reason, it has
been proposed that the settlement be relocated. The
upgrading of the religious site (which is in a poor state
at present) will also raise land values and exert pressure
for relocation. However, such options would need to be
determined in partnership with the community to ensure
that its needs, priorities and affordability requirements,
particularly among the poorest renters, are considered.
Apartments versus houses: Sankhamul has a density
of 377 persons per hectare living in 110 houses. It has
been proposed to convert the settlement into 760 lowrise (ground floor plus two) apartments with a density
of 1,907 persons per hectare. Given the number of
apartments, households from Bansighat and other
settlements could potentially be shifted to this location.
According to the survey findings, people prefer living
in individual houses rather than apartments. However,
further research is required to weigh the costs and
benefits of each option and their social, economic and
environmental implications.
5.2.3Khusibu
Replanning proposals: Khusibu is a land-pooling site.
The proposals have taken into account the preferences
of the existing residents, which are for mixed land use,
more commercial plots, and higher FAR, which has
been increased from 1.75 to 3 and in some cases to 4.
As a result, density has increased from 710 to 1,385.
The commercial plots have been placed on the main
road in keeping with research findings. Car parking was
also seen as a problem; this has been overcome by
providing 9.82 per cent of the site for it.
Conflict between regulations and practice: The
layout has two-to-three-storey houses but given the
demand and current practice, the houses are often four
or five storeys. Future planning must accommodate
these trends; otherwise the space for providing rentals
will be limited. In addition, given that most bylaws are
violated, land-pooling projects have also highlighted
as opportunities to test deviations from current bylaws
and to discuss their impacts and implications for
future developments.
IIED Working paper
Need for multi-class settlements: For creating a
mixed-class settlement, at least 30 per cent of plots
should be of 80 square metres or smaller. Their cost
should be subsidised by a higher cost for commercial
and larger residential plots. Criteria for ensuring that
low-income households most in need are able to
access these plots should be developed and a process
for preventing speculation should be put in place.
Traffic planning: Effective segregation between
pedestrian and vehicular movement and between
through and local traffic should be created to ensure
security and safety, and to mitigate pollution.
5.2.4Chabahil
Density: Chabahil is a spontaneously developed
settlement on farmland. It is haphazardly laid out. It has
a density of 410 persons per hectare and it has been
replanned to a density of 1,103 persons per hectare.
Planning advice: Settlements such as Chabahil and
those developed by developers from land purchased
from farmers call for planning advice, which could
be informed by the lessons learnt from land pooling
projects. The house owners also need house plans
and technical advice for supporting appropriate and
affordable earthquake-resistant construction practices
and adequately serviced rental units. This advice can be
given as detailed in Section 5.1 above.
Accommodation of trends: For future planning,
mixed land-use trends and increase in FAR should be
accommodated in a manner that does not damage
the physical and social environment or come at the
expense of living conditions, particularly among lowincome renters.
www.iied.org
49
Planning for affordable housing during densification in Kathmandu
References
Brown, D and Dodman, D (2014) Understanding
children’ s risk and agency in urban areas and their
implications for child- centred urban disaster risk
reduction in Asia: Insights from Dhaka, Kathmandu,
Manila. IIED Asian Cities Climate Resilience Working
Paper Series 6, London.
Oli, O (2003) Land Pooling: The Public Private
Participatory Urban Development in Nepal. https://
www.fig.net/pub/morocco/proceedings/TS22/TS22_3_
oli.pdf.
Pradhan, T (2000) Land Readjustment in Kathmandu:
The Naya Bazar Project. www.lth.se/fileadmin/hdm/
alumni/papers/ad2000/ad2000-11.pdf.
Dixit, AM and Shrestha, H (2008). Identifying Seismic
Retrofitting Measures for Common Reinforced Concrete
Ritsumeikan University and Institute of Engineering
Frame Buildings in Nepal. The 14th World Conference
(2012) Disaster Risk Management for the Historic City
on Earthquake Engineering, 12–17 October, Beijing.
of Patan, Nepal. Rits-DMUCH, Kyoto.
Genesis Consultancy (P) Ltd (2013) Updating Existing
UN-Habitat (2010) Nepal Urban Housing Sector
Long Term Development Plan of Kathmandu 2059.
Profile. http://mirror.unhabitat.org/pmss/listItemDetails.
Kathmandu Valley Development Authority, Kathmandu.
aspx?publicationID=3248.
Haack, B and Rafter, A (2006) Urban Growth Analysis
Usavagovitwong, N et al. (2013) Housing density
and Modeling in the Kathmandu Valley, Nepal. Habitat
and housing preference in Bangkok’s low-income
International 30(4) 1056–1065.
settlements. Urbanization and Emerging Population
Central Bureau of Statistics (2003) Population Census Issues Working Paper 12. IIED, London. http://pubs.iied.
2001. Central Bureau of Statistics, National Planning
org/10631IIED.html.
Commission Secretariat, Government of Nepal,
Kathmandu
Central Bureau of Statistics (2012) National Planning
and Housing Census 2011. Central Bureau of Statistics,
National Planning Commission Secretariat, Government
of Nepal, Kathmandu
Hasan, A, Sadiq, A and Ahmed, S (2010) Planning
for high density in low-income settlements: Four case
studies from Karachi. Urbanization and Emerging
Population Issues Working Paper 3. IIED, London.
http://pubs.iied.org/10582IIED.html.
50
www.iied.org
IIED Working paper
Appendix 1
Comparison of environmental, housing and socioeconomic conditions for five sites
Case Study
Traditional
settlement
(Naradevi)
Settlement
outside
ring-road
(Chabahil)
Land-pooling Informal
site (Khusibu) settlement
(Sankhamul)
Informal
settlement
(Banshighat)
Remarks
Household Information and Socio-economic Conditions
Average
household size
4.99
5.66
4.57
5.27
4.87
Average number 2.48
of men per
household
2.87
2.34
2.48
2.33
Average number 2.51
of women per
household
2.79
2.23
2.79
2.54
Average number 0.94
of children
below 15
1.125
1.11
0.84
1.04
Average number 0.48
of people above
60
0.6
0.25
0.25
0.27
Average number 1.75
of working
members per
household
1.87
1.79
1.96
2.48
Dominant age
groups
16–35
16–35
16–35
16–35
16–35
39% – 16–
35 yrs; 32%
– 36–55 yrs;
19% – less than
15 yrs; 10% –
more than 60 yrs.
36% – 16–
35 yrs; 34%
– 36–55 yrs;
20% – less than
15 yrs; and 10%
– more than
60 yrs.
43% – 16–
35 yrs; 27%
– 36–55 yrs;
24% – less
than 15 yrs; and
5% – more than
60 yrs.
50% – 16–
35 yrs; 28%
– 36–55 yrs;
17% – less
than 15 yrs; and
5% – more than
60 yrs.
45.16 years
18.85 years
6.39 years
29.4 years
13.4 years
36% of the
population (native
population) has
been residing
for more than
70 yrs, 46% for
less than 20 yrs
(insurgency
period: rental
population),
and 18% for
20–50 yrs.
29.63% <
10 yrs, 37.04%:
10 – 20 years,
24.69%: 20–50
years and 8.64%
>50 years.
13% residing
for more than
20 yrs and 77%
less than 10 yrs
(previously
agricultural
community).
67% of the
population has
been residing
for 40 yrs.
33% of the
population has
been residing for
more than 20 yrs.
Average
occupancy age
Urban household size:
4.88 (Population Census
2011, CBS). This implies
that nuclear families are
rising.
Significant percentage
of population is children,
almost 1/5 in all
settlements.
Nearly half of the family
members are employed.
Informal settlements have
more earners compared to
other settlements.
There is higher percentage
of youth in all settlements,
thus the settlement
46% – 16–
planning needs to cater
35 yrs; 27%
to their needs like youth/
– 36–55 yrs;
community centre, parks,
21% – less than
etc. (the percentage is
15 yrs; and 6% –
even higher in informal
more than 60 yrs.
settlements).
There has been a
significant increase in
population within last
20 years (mostly due to
migrants during insurgency
period) in all settlements.
Naradevi is loosing its
native population and
number of renters is
increasing.
www.iied.org
51
Planning for affordable housing during densification in Kathmandu
Case Study
Traditional
settlement
(Naradevi)
Settlement
outside
ring-road
(Chabahil)
Land-pooling Informal
site (Khusibu) settlement
(Sankhamul)
Informal
settlement
(Banshighat)
Remarks
Household Information and Socio-economic Conditions
Average
monthly income
per household
NRs 20,005
NRs 40,687
NPR 34,315
NRs 14,932
Saving of
monthly income
(%)
77% families
save less than
10% of their
income while 9%
didn’t answer.
72% families
save less than
10%, 23%
families save
(10–40)% of
their income
while 5% didn’t
save (31% did
not answer).
76% families
save less than
10% of their
income.
70% families
save less than
10% of their
income while
14% didn’t
answer.
Monthly
transportation
expenses
NRs 1,288
NRs 4,971
NPR 2,570
NRs 1,839
NRs 1,110
92% of people
answered the
question.
69% of
interviewees
answered this
question.
84% of
interviewees
answered this
question.
59% of
interviewees
answered this
question.
60% of the
interviewees
answered this
question.
Place for
savings
27% in bank,
27% in home,
26% finance,
6% cooperative.
45% in banks,
24% finance,
18% at home
and only 10%
in cooperatives
and 3% don’t
save.
38% in bank,
77% in
17% in finances cooperatives,
and 17% kept
10% in bank.
their savings at
home.
42% in
cooperatives,
29% in finance.
93% of the
interviewees
answered this
question.
93% of the
interviewees
answered this
question.
Interestingly
99% of the
interviewees
answered this
question.
89% of the
interviewees
answered this
question.
60% of the
interviewees
answered this
question.
98% within 10
mins walk (1km)
– 2.76 mins on
average.
30% within 5
mins, 41% within
10 mins, 17%
within 15 mins
and 12% greater
than 15 mins.
42% within 15
mins walk and
44% within 30
mins walk near
city centre.
77% within
10 mins walk
(1km) – 9.6 mins
on average.
60% within 15
mins walk (2km)
– 13.5 mins on
average.
Place of
shopping
52
www.iied.org
NRs 12,418
Average income of families
in traditional settlement
is low compared to new
formal settlements, which
52% families save
may be due to increase
less than 10%
in renters and transient
of their income
population, relocation
while 38% didn’t
of native population, or
answer.
replacement of traditional
occupation and people’s
inability to adapt to current
needs.
One of the main reasons
for the increase in lowincome renter population
in traditional and informal
settlements is the
easy access to public
transportation, market, jobs
and facilities, which can
be related to their lower
transportation expense
than those of new formal
settlements (a pull factor).
Higher income families
prefer to live away from
city-core.
Families from traditional
city-core still prefer to keep
their saving in their houses.
Middle class people trust
banks while cooperatives
are quiet active in informal
settlements (bank is
not always accessible).
Cooperatives function
within the settlements and
are formed by local group
of people.
Core area and proximity
to old market place of
Ason shows higher level
of business activities in
Naradevi (a pull factor).
However, all settlements
have commercial area
for shopping within
walking distance.
IIED Working paper
Case Study
Traditional
settlement
(Naradevi)
Settlement
outside
ring-road
(Chabahil)
Land-pooling Informal
site (Khusibu) settlement
(Sankhamul)
Informal
settlement
(Banshighat)
Remarks
Household Information and Socio-economic Conditions
Place of
recreation
68.3% within
10–20 mins
walk (1–3km)
– play ground,
Kathmandu
Palace Square
and Malls.
53% within 30
mins walking
distance
(Pashupati
Temple Area),
34% more
than 30 mins
vehicular
distance
(Boudha, New
Road) and 13%
usually don’t go
anywhere.
36% didn’t
go anywhere,
22% within 30
mins walk. Most
people go to the
city centre of
Kathmandu.
52.8% within
20 mins walk
(2–3km) – Play
ground, Patan
Palace Square,
Zoo.
73.5% within
30 mins walk
(2–4km) – Malls,
Kathmandu
Palace Square,
Movies, etc.
Core area and proximity to
recreational place, shows
easy access to social and
recreational spaces for
Naradevi settlement. In
other settlements, people
have to travel 30–40 mins
to visit parks, temples or
other entertainment area.
Schools
Within 13.65
mins walk
on average
(schools in
neighbourhood).
10.05 minutes
average among
55 HH with
kids (school in
neighbourhood).
44% children
study in nearby
school within
5–10 mins walk.
Within 10.5
mins walk
on average
(schools in
neighbourhood).
Within 5.6 mins
walk on average
(schools in
neighbourhood).
Each settlement has an
educational area (mostly
kindergarten and primary
schools) within the
boundary.
Play area
for children
(under 14)
Good
Moderate
Bad
Good
Moderate
58% play in
courtyard; 26%
inside house
and 6% on the
streets.
47% of the
children play
inside their
home; 31% play
in the streets;
17% don’t have
play area and
5% play within
their compound.
46% children
play inside the
home, 28%
on the street
and 8% in the
playground.
52% of the
children play in
the nearby open
space; 34% play
in the streets.
70% of the
children play in
the nearby open
space; 15% play
in the streets.
Shows lack of open and
playing spaces for children
in new comparatively less
denser settlements. This
keeps the children within
their home preventing them
from social interaction,
which can make them more
reserved. However, the
courtyards in traditional
settlements have retained
their major characteristics
of providing open spaces
for children to play. New
settlements have higher
% of private open space
but less areas for social
mingling.
Usage and
availability of
open space
Good
Bad
Moderate
Good
Good
25% use for
feast, 21% for
playing and
walking, 16%
use it for parking,
14% use it for
washing clothes.
11% use the
open spaces
for morning
walk, playing
etc; while 81%
interviewees
said that they
don’t have open
spaces within
their settlement.
60%
interviewees
mentioned
playground as
the only open
space.
91% use open
space for
playground,
sunbathing,
feasts.
85% use open
space for
playground,
sunbathing,
feasts.
In traditional and informal
settlements, the open
spaces are shared, so
there are overlaid functions
of these spaces, where as
in new formal settlements,
these open spaces have
not been developed and
designed to cater to
multiple needs of people.
Ground in Kushibu land
pooling area is mostly
occupied by youth as a
playground.
www.iied.org
53
Planning for affordable housing during densification in Kathmandu
Case Study
Traditional
settlement
(Naradevi)
Settlement
outside
ring-road
(Chabahil)
Land-pooling Informal
site (Khusibu) settlement
(Sankhamul)
Informal
settlement
(Banshighat)
Remarks
Household Information and Socio-economic Conditions
Community
centre and its
use
Moderate
Bad
Bad (only 15%
know there is
a community
centre)
Good
Good
39% agree
on presence
of community
centre, 27%
use for feast,
24% for social
meetings, 18%
use it for waste
management
purpose for the
neighbourhood.
82% don’t have
community
centre or they
are not aware
about it or they
don’t use it; 8%
use it for feast;
and 6% for
ceremony.
Most of the
people are
unaware of
the existence
of the centre.
Most of the
people termed
neighbourhood
office and
gym centre
as community
centre.
47% use it
for meetings
while 33% use
it for health
check-ups and
trainings.
40% use it for
meetings while
34% use it for
health check-ups
and 17% use it
for tuitions.
Engagement in
social groups
Only 34% are
involved in social
groups (guthi,
neighbourhood
committee/Youth
group).
51% of
households
are involved in
various social
groups (among
them 32%
guthi / religious
/ cultural
groups; 28%
neighbourhood
community; 20%
savings and
cooperatives).
23% are
involved in
social groups
(11% in
cooperatives,
7% in
neighbourhood,
4% in guthi and
3% in women’s
group).
89% are
involved in social
groups (women/
housewife
and saving/
cooperative
groups).
42% are involved
in social groups
(women/
housewife
and saving/
cooperative
groups).
Surprisingly, lower
percentage of people in
traditional settlements
are involved in social
groups, which may
be due to decreasing
engagement in traditional
groups and increase in
renter population. Higher
percentage of people
involved in social groups
in informal settlement
shows stronger bonding.
With escalating renter
population in Kushibu,
the involvement in social
groups is decreasing.
Safety
Good
Moderate
Moderate
Good
Moderate
47% said safety
level is high and
37% said it is
moderate.
72% said safety
level is moderate
and 20% said it
is high.
53% said safety
level is moderate
and 21% said
it is high, while
18% have
relatively lower
feeling of safety.
46% feel their
neighbourhood
safety level to
be high while
32% feel it is
moderate.
53% feel their
neighbourhood
safety level to be
moderate while
27% feel high.
Level of safety is moderate
in all settlements, which
is comparatively high in
the denser settlements.
Denser settlements
encourage more social
interactions which makes
people feel safer.
Good
Good
Good
Good
Though the
frequency
of lending/
borrowing
money and
household
items is very
low, 50% have
good and 49%
have moderate
relationship with
their neighbours.
Though the
frequency
of lending/
borrowing
money and
household items
is very low, 20%
have very good,
51% good and
27% moderate
relationship
with their
neighbours.
Though the
frequency
of lending/
borrowing
money and
household
items is very
low, 54% have
good and 32%
have very good
relationship with
their neighbours.
Though the
frequency
of lending/
borrowing money
and household
items is very
low, 46% have
good and 42%
have moderate
relationship with
their neighbours.
Relationship
Good
with neighbours
Though the
frequency
of lending/
borrowing money
and household
items is low
(28%), 60% have
good and 10%
have very good
relationship with
their neighbours.
54
www.iied.org
Sense of community
is stronger in informal
settlements, where they
have communal spaces
for fulfilling various social
needs. In traditional
settlements, the new
youth clubs, old guthi
buildings and communal
courtyards have still been
able to provide spaces
for various activities,
whereas in new developing
settlements, these spaces
are clearly lacking.
(Denser settlements with
strategically located open
courtyards can promote
social bonding compared
to sparse settlement with
individual houses and
private open space.)
Bonding with neighbours
is high in all settlements,
which shows level of
acquaintance and social
trust.
IIED Working paper
Case Study
Traditional
settlement
(Naradevi)
Settlement
outside
ring-road
(Chabahil)
Land-pooling Informal
site (Khusibu) settlement
(Sankhamul)
Informal
settlement
(Banshighat)
Remarks
Household Information and Socio-economic Conditions
Preference of
living in the
same social
environment
Moderate
Moderate
Moderate
Moderate
Moderate
54% have
moderate
preference to
live in the current
location, while
38% have high
preferences.
80% have
moderate
preference to
live in the current
location, while
14% have high
preference and
only 6% have
low preference.
71% have
moderate
preference to
live in the area
while 23%
have high and
6% have low
preference.
56% have
moderate
preference
to live in the
current location,
while 42% have
very high and
high preference.
71% have
moderate
preference to
live in the current
location, while
21% have high
preference.
Most of the people are
quite happy with where
they are living, but higher
preference to live in
same location in informal
settlements suggest strong
communal bonding or also
lack of options to move to
other locations.
Environmental Conditions
Zoning
Mixed old
residential subzone
Urban expansion Planned
zone
residential subzone
River bank
River bank
Settlement
layout
Compact
courtyard
planning with
buildings
arranged around
courts and
aligned along the
street. Organic
morphology with
narrow inner
streets.
Cluster pattern
with major
predominantly
isolated houses.
Main streets
have row
housing along
the streets.
Planned
settlement
with grid iron
pattern.
Long plots with
3–4m width are
arranged in a
row along the
main street with
river-bank on the
back side.
Cluster pattern
with very narrow
access; and riverbank and main
street on either
side.
Water-supply
services
Bad
Moderate
Bad
Good
Moderate
53% and 22%
rate water-supply
services as bad
and very bad
respectively
(1 hour water
supply once in
every six days).
Identified causes:
increase in
population, old
system.
45% moderate;
32% bad and
21% good. As
Drinking water
corporation
provides water
once in every
5 days for 1–2
hours each.
33% rate water
supply service
as moderate
whereas
38% as bad.
And 14% as
worst. There
is intensive
use of boring
and buying
water despite
the municipal
connection.
41% and 48%
rate watersupply service
as moderate
and good
respectively
though they have
to buy water
and use underground water
(no municipal
connection).
46% and 30%
rate water-supply
respectively
though they have
to buy water
and use underground water
(no municipal
connection).
Moderate
Bad
Bad
Moderate
Good
52% and 43%
rate electricity
service as
moderate and
bad respectively.
Load shedding
and transformer
break down being
major issues.
46% and 12%
rate electricity
services as bad
and very bad
while 36% say
moderate.
39% termed
the electricity
service as good
and 57% as
bad.
55% and 34%
rate electricity
service as
moderate
and good
respectively.
Electricity
Water supply system in
general is not sufficient
in Kathmandu valley.
Water scarcity is higher
in traditional/dense
settlement, while new
pooled area also have
similar problem. But in
informal settlement (with
no municipal connection)
though the scarcity is
similar, their perception
and attitude towards water
availability is different from
those in formal settlement.
Load shedding is a
blanket problem in
48% and 52%
Kathmandu, which is
rate electricity
shown by the response
service as
of people in formal
moderate and
settlement. However,
good respectively.
in informal settlements,
their perception of having
access to electricity is
positive.
Environmental Conditions
www.iied.org
55
Planning for affordable housing during densification in Kathmandu
Case Study
Traditional
settlement
(Naradevi)
Settlement
outside
ring-road
(Chabahil)
Land-pooling Informal
site (Khusibu) settlement
(Sankhamul)
Informal
settlement
(Banshighat)
Remarks
Solid-waste
management
Good
Moderate
Good
Good
Good
48% and 32%
rate solid-waste
management
as good and
moderate
respectively.
However, one can
see scattered
plastic bags and
small heaps of
garbage in street
corners.
44% and 42%
rate solid-waste
management
as moderate
and good
respectively
while 11% say
bad.
67% are
satisfied with
the waste
management
service
provided. 25%
think the service
is moderate.
With vacant
lands nearby,
dumped waste
is seen in some.
43% and 30%
rate solid-waste
management
as good and
moderate
respectively.
No garbage
dump seen on
the streets.
Some NGOs
have given
solid waste
management
trainings.
52% and 46%
rate solid-waste
management
as good and
moderate
respectively. No
garbage dump
seen on the
streets. Some
NGOs have
given solid waste
management
trainings.
People are more actively
managing their waste
themselves in informal
settlements, while in other
formal settlements waste
is still seen dumped in
streets and vacant lands
even if there is availability
of waste collectors from
municipality. People rate
the current system of solid
waste management as
moderate to good.
Rain-water
drainage
Moderate
Good
Good
Good
Good
39% rate rainwater drainage
as bad and
36% rate it as
good and 21%
as moderate.
Depends on
location in the
neighbourhood.
46% and 40%
rate rain-water
drainage as
moderate
respectively,
while 14% say
bad.
53% rate rain
drainage as
good and
27% as bad.
Drainage
system can’t
tolerate
the heavy
prolonged rain.
55% and 27%
rate rain-water
drainage as
good and
moderate
respectively
though there is
the problem of
water-clogging
during rainy
season.
54% and 27%
rate rain-water
drainage as
good and bad
respectively
though there is
the problem of
water-clogging
during rainy
season.
Sanitation
Moderate
Good
Good
Good
Good
40% rate
sewerage system
as good and
24% rate it as
moderate and
33% as bad.
Major problem:
frequent drainage
blockage.
48% and 42%
rate sanitation
as good and
moderate
respectively
while 9% say
bad.
71% rate
sanitation as
good and 17%
as moderate.
34%, 30%
and 32% rate
sanitation as
good, moderate
and bad
respectively
though.
59%, 12%
and 27% rate
sanitation as
good, moderate
and bad
respectively.
Moderate
Bad
Moderate
Bad
48%, 28%
and 15% rate
air quality as
moderate,
good and bad
respectively.
Problem of
smoke from
vehicles along
the main road.
37% and
40% rate the
air quality as
moderate and
bad. Major
problem of
smell from
Bisnumati river
nearby. Dusty
road after rain.
28%, 42% and
23% rate air
quality as good,
moderate and
bad respectively.
Problem of smell
from river.
22%, 37% and
41% rate air
quality as good,
moderate and
bad respectively.
Problem of smell
from river and
dust from road.
Air quality/smell Moderate
51%, 25%
and 21% rate
air quality as
moderate,
bad and good
respectively.
Problem of air
pollution along
the main street.
Environmental Conditions
56
www.iied.org
Drainage system is
comparatively good
in developing formal
settlements. In case of
traditional settlements,
the older systems are
overwhelmed by increasing
population, which has
decreased its efficiency.
Whereas prolonged
rainfall cause problems in
both settlements. In case
of informal settlements,
drainage system is
managed locally and they
consider it to be good
except for rainy season.
Sanitation is a problem in
traditional settlement as
capacity is overwhelmed
by growing population,
whereas it is better in new
developing areas. Informal
settlements consider
sanitation provisions to be
good, which may be direct
disposal to rivers.
Air quality and bad smell
are major externalities
faced by people in all
settlements. Major
pollutants are vehicles on
the road, dusty roads, and
foul smell from river (natural
barrier of trees can help).
IIED Working paper
Case Study
Traditional
settlement
(Naradevi)
Settlement
outside
ring-road
(Chabahil)
Land-pooling Informal
site (Khusibu) settlement
(Sankhamul)
Informal
settlement
(Banshighat)
Remarks
Noise level
Moderate
Low
Low
Low
Low
42%, 31% and
20% rate air
quality as high,
low and moderate
respectively.
Problem of noise
along the main
street.
41%, 25%
and 25% rate
noise level as
low, moderate
and high
respectively.
Problem of noise
along the main
road.
31% thinks the
level of noise
pollution is
moderate and
50% consider it
to be peaceful.
37%, 34% and
18% consider
noise level to be
low, moderate,
and high.
54% and 40%
consider noise
level to be low
and moderate
respectively.
Noise level is high in the
traditional settlement with
high density, proximity to
market places and other
facilities. The main streets
of new formal settlements
also have similar noise
issues.
Road access
Good
Good
Good
Good
Moderate
Access
to public
transportation
Good
Good
Good
Very Good
Good
Congested
traffic on the
main road
with no public
parking for
cars except for
private parking.
Moderate;
Traffic flow is
Lower traffic
low with space
as residential
for bike parking.
area, house with
compounds
had car porch,
no communal
parking area as
such.
Having direct access
to vehicular road is not
39% and
63%, 19%, and 67% consider
52% and
47% and 43%
the only factor deciding
37% rate road
9% rate road
the road access 32% rate road
rate road access
locational benefit as
access as good
access as good, good whereas
access as good as moderate and
people on average are still
and moderate
moderate and
17% think it is
and moderate
good respectively
satisfied with not having
respectively even bad respectively. moderate. As
respectively as
though there
direct access to motorable
though houses
Most of the site it is designed
every house has is absence of
streets (especially in
in the inner
have motorable in grid iron
access to main proper roads.
traditional settlement).
courts lack direct road except
pattern, every
road.
access.
three alleys.
house has an
access road.
38% and 39%
rate access
to public
transportation
as good and
moderate
respectively.
Proximity to
Ratna Park (main
transit hub in
Ktm).
Traffic condition Congested traffic
and parking for on the main road
cars
with no clear
demarcation of
pedestrian and
vehicular ways.
Two way traffic
overlapped
with pedestrian
pathways and
hawkers have
crammed the
streets. No
defined area for
public parking.
Public transportation is
available close to all the
56%, 26%
76% and
68% and 21%
33% and 39%
settlements. However,
and 10% rate
14% rate the
rate access
rate access
people in informal
access to public transportation
to public
to public
settlements are more
transportation as reach as good
transportation
transportation as
satisfied with access to
good, moderate, and moderate
as very good
very good and
public transportation near
and very good
respectively.
and good
good respectively.
their settlements.
respectively.
Although there respectively.
There is a mircoThe main ringis bus stand in
There is a mirco- bus and bus
road is at the
5–10 mins walk, bus stand in 5
stand in 10 mins
maximum of 15
people didn’t
mins walking
walking distance.
mins walking
consider it as
distance.
distance.
very good.
Chabahil –
Mitrapark Road.
Traffic flow is low. Higher traffic flow is
related to congestion
in both Chabil (in the
main ringroad area) and
Naradevi (settlement
planned for pedestrians
only).
Environmental Conditions
www.iied.org
57
Planning for affordable housing during densification in Kathmandu
Informal
settlement
(Banshighat)
Remarks
Case Study
Traditional
settlement
(Naradevi)
Settlement
outside
ring-road
(Chabahil)
Land-pooling Informal
site (Khusibu) settlement
(Sankhamul)
Landscaping,
parks and
vegetation
Traditionally
non-green urban
landscape, with
no greenery or
parks within the
vicinity of the
study area.
Mitra-park and
Pasupative
conservation
area are notable
parks with
greenery just
outside the
settlement
No green areas
or parks within
the settlement
except some
restricted
private garden.
However, there
are trees on the
river banks and
some religious
spots nearby
that also serve
as public space
and park
Green area
Green area along
along river banks river banks
and open space
(controversial
land) in front of
the settlement
Non-green area in
traditional settlement
is a drawback which is
replicated in new landpooled area too. Though
presence of green spaces
around the settlement in
Chabil, the use of these
open spaces is still bad as
these spaces are walled.
Preference
of living in
the current
environment
condition
Moderate
Moderate
Moderate
Moderate
Moderate
69% and 16%
have moderate
and high
preference
for living in
the current
environment
condition
respectively.
79% and 16%
have moderate
and high
preference
for living in
the current
environment
condition
respectively with
5% having low
preference.
15% highly
prefer the living
environment
and 83% have
moderate
preference.
Interestingly,
65% of
interviewees are
migrants.
52% and 39%
have moderate
and high
preference
for living in
the current
environment
condition
respectively.
69% and 15%
have moderate
and high
preference
for living in
the current
environment
condition
respectively.
People in all settlements
have moderate preference
to live in current
environmental condition
as the problems they are
facing are not unique to
their location. However,
higher preference for
informal settlements
suggests that their
perception and attitude
towards their settlement is
positive.
Housing Conditions
By-laws
Mixed-oldresidential Subzone; Ground
Coverage:
80–100%;
FAR: 4–4.5;
Max. height of
building: 45ft;
Max. number of
floors: 5
Other-residential
Sub-zone;
Ground
Coverage:
60–80%; FAR:
1.75; Min. plot
size: 80sq.m
Plannedresidential Subzone; Ground
Coverage: 60–
80%; FAR: 2;
Min. plot size:
80sq.m; Min.
width of plot:
6m
Average plot
size
500 sq.ft
(0-1-1-3.4)
2305.41 sq.ft.
(0-6-3-0)
1646.17 sq.ft
(0-4-3-1)
865 sq.ft
(0-2-2-0.5)
786 sq.ft
(0-2-1-0.8)
Plot sizes in Khusibu and
Chabahil are much bigger
than min. plot size of
80sq.m. Most of the land
owners own their land as
ancestral property.
Ground
coverage
94.85%
65.84%
78%
75.78%
91.80%
Layout of
houses
Compact,
clustered
courtyard
houses.
Isolated in
Rectangular/
Long elongated
general area
square isolated houses.
and row in street and row houses.
façade.
Compact cluster
type.
Average house size of low
income families: 54sq.m
(2010, CIUD).
Average
household size
4.96
5.66
4.57
5.27
4.87
11.02
15.09
7.2
7.02
Average number 9.1
of people per
plot
Housing Conditions
58
www.iied.org
Lack of flexile by-laws is
not helping to promote
low-rise high-density
settlements.
Number of people per
plot in land pooled area is
quiet high due to increase
in migrant and rental
population in the area.
IIED Working paper
Case Study
Traditional
settlement
(Naradevi)
Settlement
outside
ring-road
(Chabahil)
Land-pooling Informal
site (Khusibu) settlement
(Sankhamul)
Informal
settlement
(Banshighat)
Remarks
Average number 5.1 (added floors 2.99 (2 to 5
3.6 (3 and
of floors
in old houses and storey buildings). 4 storey
most of the new
buildings).
ones above 4
floors).
1.27 (1 and 3
1.42 (1 and 2
storey buildings). storey buildings).
In all the formal
settlements, most of the
houses have ground and/
or first floor rented out for
commercial use which has
not been considered while
calculating the population
density.
Reason for
living in the
current location
For 58%
ancestral
property, for
33% near to
work or operating
business in the
area, and for 9%
education for self
or for children
were the top
three reasons
for living in the
location.
25% ancestral
property; 22%
near to work;
16% near friends
and family; 12%
due to physical
facilities; 10%
due to religious
pashupati area.
13% have their
ancestral land,
40% have their
workplace
nearby, 20%
people have
their relatives
and friends
nearby while
12% like the
open and calm
environment.
Because for
most (34%)
land was
available when
they migrated
to Kathmandu,
while other
reasons being
job availability,
cheap rental
space, near to
work place.
Because for most
(28%) land was
available when
they migrated to
Kathmandu, while
other reasons
being poverty, job
availability, near
to work place and
public facilities.
Ancestral property is a
key reason in traditional
settlement and in
development of settlement
outside ring road. Also,
near to work and presence
of close kins in the area
have made them settle
down in that very location.
For informal settlement,
availability of land, access
to it are main reasons.
Size of rental
units
40% rent 1
room, 39% rent
2 rooms and
15% rent 4 or
more rooms.
Predominantly
low and lowermiddle income
families are the
renters).
33% rent 2
rooms; 32% rent
2 rooms; 27%
rent 4 or more
rooms 8% rent
only 1 room.
Predominantly
(32%) 2 room
rental units,
11% rental units
have 3 rooms
while 12% have
1 room only.
Predominantly
(71%) 1 room
rental units.
Predominantly
low income
families are
renting the
rooms.
Predominantly
(50%) 1 room
rental units.
Predominantly
low income
families are
renting the rooms.
With higher density and
lower number of rooms
per plot, the owners rent
out as less numbers of
rooms to more number of
rentees. Thus, the trend
of renting out 1 room is
high in traditional and
informal settlement. High
rental price and economic
condition of renters is
another important factor
related to families renting
min. space. (Average
house size of low income
families: 54sq.m – 2010,
CIUD)
Average per
month rent
55% pay
rent between
Rs 2000–5000
per month.
55% pay rent
between Rs
2000–5000
while 41%
pay more than
Rs 5000 per
month.
53% pay more 75% pay less
than NPR 5000 than Rs 2000
and 42% pay
per month.
between NPR
2000–5000
per month.
60% pay less
Lumanti’s Rental
than Rs 2000 per Housing-1 has 24 units
month.
(each unit is 180sq.ft
which includes kitchen
corner, attached toilet
and verandah). The rent
is Rs 3000 per month
much cheaper and have
more facilities than current
rentals in Kathmandu.
Housing Conditions
www.iied.org
59
Planning for affordable housing during densification in Kathmandu
Settlement
outside
ring-road
(Chabahil)
Land-pooling Informal
site (Khusibu) settlement
(Sankhamul)
Informal
settlement
(Banshighat)
Remarks
Renters opinion 43% think rental
regarding rental price is moderate,
space
whereas 39%
think it to be high
for the space.
36.36%
complain about
lack of water,
18% have
livable good
rooms, 13.64%
have light and
ventilation
problems
(narrow rooms,
small room sizes,
no parking and
social behaviour
each have
4.55% votes)
35% consider
rent price
moderate while
17% say high
(Rent increases
every 1 year by
10–20%)
Most renters
(86%) find the
rental price
moderate (rent
increase by 10%
every year)
Most renters
(56%) find the
rental price
moderate while
33% find it high
(rent increase by
10% every year)
Current rental price is
affordable for almost
50% of the population.
However, some perceive it
to be higher for small areas
rented out.
Use of house
Residential
Residential +
Rental
Residential +
Rental
Residential
Residential
32% is owner’s
residence, 22%
for residence
and commercial
activities, 29%
for residence and
rental residence
and 17% for
rental only
52% residence
+ rental for
residence;
31% owner’s
residence only;
11% residence
+ commercial
and 6% rental
only.
41% are
residential
+ rental for
residence
and 23%
are owners’
residence
only (61%
interviewees are
renters) what
percentage is
rental only?
62% owner’s
residence,
31% residence
+ rental, 2%
residence +
commercial, and
5% rental only
48% owner’s
residence,
42% residence
+ rental, 6%
residence +
commercial, and
4% rental only
Predominantly, houses in
all the settlements either
have space for commercial
activities or space for
renters.
Type of house
68% of houses
are permanent
and 26% are
semi-permanent
95% houses
98% houses
are permanent
are permanent
structure (pakki).
40% temporary
(kachhi), 46%
semi-permanent
and 14%
permanent
(pakki)
59% temporary
(kachhi), 31%
semipermanent
and 10%
permanent (pakki)
Construction
type
20% are still
traditional
houses, 29%
are load bearing
(semi-traditional),
15% are
traditional with
modification and
36% are modern
pillar system
67% Houses are
R.C.C. Frame
structure; 31%
houses are
Load bearing
structure.
96% houses
are pillar system
and 3% load
bearing
52% load
bearing brick
masonry and
36% mudbamboo-CGI
construction
Incremental
growth
20% of houses
have signs of
incremental
growth (mostly
in traditional
buildings)
Though there
no sign of
incremental
growth, 56%
families have
plans for future
expansion.
In 18% houses
some signs of
incremental
growth
observed
(vertical growth)
Only 16%
Only 6% houses
houses
have incremental
have vertical
growth
incremental
growth while
mostly add
rooms on the
backyard of their
houses
Case Study
Traditional
settlement
(Naradevi)
Housing Conditions
60
www.iied.org
Higher density of people
where percentage of
permanent structure is
low shows vulnerability
of people to disasters. In
addition, it also suggests
various pull factors that
31% load bearing
is encouraging people
brick masonry
to choose to live in those
and 58% wood
ares. In case of informal
or mud-bamboosettlements, lack of tenure
CGI construction
security is discouraging
families to invest in their
houses.
Vertical increment is
sought by people to
cater to spatial need of
increasing population. On
the other hand, informal
settlements have horizontal
increments due to
structural restrictions.
IIED Working paper
Case Study
Traditional
settlement
(Naradevi)
Settlement
outside
ring-road
(Chabahil)
Land-pooling Informal
site (Khusibu) settlement
(Sankhamul)
Informal
settlement
(Banshighat)
Remarks
Physical
condition of
house
40% in good,
40% in moderate,
12% in bad
condition.
73% in good
condition; 20%
moderate, 6%
very good, 1%
bad.
15% houses
are in very good
condition while
53% houses are
in good, 29%
in moderate
and 3% in bad
condition.
77% houses
are in moderate
condition while
14% and 9%
houses are in
good and bad
conditions
respectively.
72% houses
are in moderate
condition while
10% and 18%
houses are in
good and bad
conditions
respectively.
Do you perceive
your house to
be safe from
earthquake?
38% feel safe,
50% feel unsafe
and 12% don’t
know about
condition of their
houses.
47% are don’t
know about their
home being safe
from earthquake;
35% feel safe
and 18% feel
unsafe.
46% believe
their houses is
safe whereas
41% think
theirs are not
and 13% are
unaware.
59% feel their
house to be safe
from earthquake
while 29% feel
their houses are
not safe and
12% don’t know
(though houses
are not built
with earthquake
resistant
design).
44% feel their
house to be safe
from earthquake
while 32% feel
their house is
not safe and
24% don’t know
(though houses
are not built
with earthquake
resistant design).
Most of the structures are
not constructed following
the earthquake safety
codes. Comparatively,
structural integrity
of houses in denser
settlements are less safe.
Also, having confidence
of earthquake safety over
these structures increases
their vulnerability.
Use of streets,
Used for washing Streets used by
open space and clothes, playing, children as play
courtyards
parking vehicles, area.
feasts.
Children’s play,
parking.
Children’s play,
sunbathing and
feast.
Children’s play,
sunbathing,
washing cloths
and feast.
Overall building
materials
Traditional
buildings have
mud bricks with
mud mortar.
However, vertical
increments
are of modern
material. Most
of the traditional
buildings have
been replaced
by modern RCC
structures.
Modern
construction
materials:
cement, brick,
wood, steel/ iron
rods, glass etc.
Modern
construction
materials: Brick,
concrete, steel,
glass etc.
Brick, concrete,
bamboo, wood,
mud and CGI
sheets.
Brick, concrete,
Modern construction
bamboo, mud and materials are replacing
CGI sheets.
traditional construction
materials and people are
either not aware or not
interested in cost-effective
building materials and
technologies.
Roofing
Traditional
houses (20%)
have sloped
roof with
terracotta tiles
or corrugated
sheets. Modern
RCC houses
(36%) and
remaining
traditional yet
modified houses
have flat roof of
RCC slab.
Most are flat
RCC roof
which the
residents use
for sunbathing,
drying cloths,
etc.
Most are flat
RCC roof
which the
residents use
for sunbathing,
drying cloths,
etc.
Most of the
houses have
CGI roofs
with gentle
slope while
few families
have built more
permanent
structures with
flat concrete
roof.
Most of the
houses have CGI
roofs with gentle
slope.
Open spaces in all
settlements are mostly
used for playing. In
traditional settlements, it is
even used for washing and
feasts. In khusibun it is also
used for parking.
In absence of adequate
communal open space in
new formal settlements,
roofs have become an
important space for
families, where people
sun bask, dry cloths and
children play.
Housing Conditions
www.iied.org
61
Planning for affordable housing during densification in Kathmandu
Land-pooling Informal
site (Khusibu) settlement
(Sankhamul)
Informal
settlement
(Banshighat)
Remarks
Case Study
Traditional
settlement
(Naradevi)
Settlement
outside
ring-road
(Chabahil)
Flooring
Traditional
houses mostly
have mud
floors and RCC
structures have
cement punning
or marble floors.
Mostly cement
Mostly cement
punning and few punning and
marble floors.
few marble
floors or even
tiles.
Mostly mudMostly mud-floors
floors with few
with few wooden
cement punning. floors and cement
punning.
Façade
treatment
Traditional
houses have
brick façade with
wooden windows,
Traditional yet
modified houses
have either brick
façade or cement
plaster. RCC
structures mostly
have cement
plaster and
few with brick
exposure.
Mostly
contemporary
building with
plaster and
paints.
Plaster and
paints.
Most of the
houses are
brick-exposed,
while few have
plastered and
painted their
houses.
Most of the
houses are either
brick-exposed
or bamboo and
timber finishing,
while few have
plastered and
painted their
houses.
Boundary walls
Almost none of
the buildings
have boundary
walls except for
few
Brick wall with
plaster and
paints mostly.
Brick wall with
plaster and
paints mostly.
No boundary
walls.
No boundary
walls.
Because of security
reasons, houses in new
formal settlements are
built as fortresses with
boundary walls. However,
as one comes out of the
house, the streets are
vacant not safe. People
in denser traditional
settlement of Naradevi
feel their area is safer
compared to those in
Chabahil and Khusibu.
Privacy
Moderate
High
High
Moderate
Low
Denser the settlement,
lesser is the sense of
privacy but more is the
security.
Livability of the
locality / opinion
regarding
current
neighbourhood
Likes: 28% social
environment,
16% facility
(accessibility to
market, hospital),
11% physical
facility, 10%
location and
proximity.
25% ancestral
property; 22%
near to work;
16% near friends
and family; 12%
due to physical
facilities; 10%
due to religious
pashupati area.
Likes: 34%
social
environment,
29% public
transportation,
29% location,
20% like
facilities.
Likes: social
environment
(24%); public
facilities like
transportation
and
infrastructures
(31%); natural
environment
(16%); and
location (12%).
Likes: social
environment
(23%); public
facilities like
transportation
and
infrastructures
(39%); and
location (24%).
Most of the people like the
social environment and
physical facilities of the
settlements are they are
living in. Hence, for being
a good residential area, it
is important to have good
infrastructures, public
facilities and good social
environment.
Dislikes: 25%
water supply,
13% noise
pollution, 10%
social problems
(population,
disputes),
8% waste
management, and
traffic.
Dislikes:
20% don’t
have anything
particular, 18%
noise pollution,
20% social
problems
(population,
disputes),
11% waste
management
and traffic.
Dislikes: 50%
water supply,
19% air
pollution, 12%
road condition
and traffic, 10%
noise pollution,
and 10%
insecurity.
Dislikes: badsmell from river
(26%); no land
ownership
(26%); unhealthy
environment
(28%); and
social problem
(12%).
Dislikes:
unhealthy
environment
(28%); badsmell from river
(18%); no land
ownership
(18%); and social
problem (15%).
Water supply, air pollution
and noise pollution are the
common problems in every
settlements.
Preferences
62
www.iied.org
IIED Working paper
Settlement
outside
ring-road
(Chabahil)
Land-pooling Informal
site (Khusibu) settlement
(Sankhamul)
Savings for new 45% are saving
house
money for new
house.
32% are saving
for their new
house.
22% had
savings for new
house.
Preferable
location to live
63% prefer to
relocate to new
place.
56% prefer
59% want to
same location,
relocate to new
while 43%
place.
prefer to relocate
in better place.
Preferable
shelter type
96% prefer to
live in individual
house.
96% wants
individual
houses.
Settlement
planning type
40% prefer to
live in courtyard
planning, while
37% prefer
clustered
settlements and
23% prefer grid
pattern.
Plot size
Case Study
Traditional
settlement
(Naradevi)
Informal
settlement
(Banshighat)
Remarks
34.1% are
23.1% are saving
saving money for money for new
new house.
house.
84% prefer to
leave in current
location, while
others prefer to
relocate.
51% prefer to
leave in current
location, while
others prefer to
relocate.
Even with all the problems,
most of the informal
settlers want to live in the
same location, while in
other settlements many
people want to relocate.
Fear of forceful eviction
and other political reasons
may have influenced the
answers of families from
informal settlement and
their preference to live in
current location.
88% prefer
84% prefer to
individual home. live in individual
houses, while
16% prefer
walk-up
apartment.
79% prefer to
live in individual
houses, while
19% prefer walkup apartment
and 2% prefer
highrise
apartment.
Even with high cost of land,
predominantly people still
prefer to live in an individual
home (large or small) rather
than apartment (may be
due to our social lifestyle
where house is a matter of
pride and investment).
44% prefer grid
iron pattern
settlement
with individual
houses; 39%
– Cluster /
organic.
79% like grid
iron planning
and 13%
courtyard plans.
95% prefer
to live in grid
pattern with
row-house and
wide roads, 5%
prefer courtyard
planning.
86% prefer to live
in grid pattern
with row-house
and wide roads,
12% prefer
cluster/organic
planning.
People from Naradevi
prefer clustered settlement
with courtyards, while
others predominantly
prefer grid-iron planning.
57% – 3–5 ana,
22% – 1–2 ana,
14% 6–9 ana.
40% wants 6–9
annas; 26%
9–16 annas;
24% 3–5 annas.
68% prefer
3–5 anna and
19% prefer 6–9
anna.
75% prefer 3–5
anna (1026–
1710 sq.ft.) plot
size, while 18%
prefer 1–2 anna
(342–684 sq.ft).
67% prefer 3–5
anna (1026–1710
sq.ft.) plot size,
while 19%
prefer 1–2 anna
(342–684 sq.ft).
3 to 5 ana land (1–2 anna
being second preference)
with individual houses of
3 to 5 rooms is the most
optimum space and size
preferred by the people.
Size of house
72% – 3–5
rooms, 15% – 2
or less, 13%
more than 5.
72% need more
than 5 rooms
and 27% 3–5
rooms.
60% prefer 3–5
bedrooms and
26% more than
5 bedrooms.
80% prefer to
have 3–5 rooms,
16% prefer more
than 5 rooms,
while 4% prefer
2 rooms.
72% prefer to
have 3–5 rooms,
16% prefer more
than 5 rooms,
while 12% prefer
2 rooms.
Willingness to
pay (in lakhs)
31% are willing
to pay less than
10 lakhs, 25%
– 10–30 lakhs,
22% – 31–
50 lakhs, and
14% – 51–
70 lakhs.
50% are willing
to pay 31–
50 lakhs.
27% are
capable of
paying 31–
50 lakhs and
20% prefers
71–90 lakhs
houses.
56% are willing
to pay 10 to
30 lakhs, while
37% are willing
to pay less than
10 lakhs.
48% are willing
to pay 10 to
30 lakhs, while
40% are willing
to pay less than
10 lakhs.
People are willing to pay
from 10 to 50 lakhs for
housing (30 lakhs on
average) nearly one third
of the average cost of a
house.
Preferences
www.iied.org
63
Planning for affordable housing during densification in Kathmandu
Case Study
Traditional
settlement
(Naradevi)
Settlement
outside
ring-road
(Chabahil)
Land-pooling Informal
site (Khusibu) settlement
(Sankhamul)
Informal
settlement
(Banshighat)
Remarks
Space for
economic
activities
41% require
space for
economic
activities.
52% don’t
want space
for economic
activities, while
48% want
commercialrental space.
51% want
space for
renting in their
home.
88.1% want
space for
economic
activities in their
new house.
81.3% want
space for
economic
activities in their
new house.
Having provision for
economic activities
or space for renting is
preferred by people.
Public facilities/
infrastructures,
property safety,
access to
transportation.
Plot and shelter
size, public
facilities/
infrastructures,
property safety.
Public facilities/
infrastructures,
job opportunities
and property
safety.
Public facilities/
infrastructures,
job opportunities
and
transportation.
Good
neighbours,
environment for
children, public
spaces.
Plot and
shelter size, job
opportunities,
disaster resilient
structures.
Public
spaces, good
neighbours,
environment for
children.
Plot and
shelter size,
transportation
and disasterresilient building.
Disaster-resilient
building, plot and
shelter size and
property safety.
Most of the families
give high preference
to public facilities /
infrastructure; property
safety; and availability of
transportation, market and
job compared to better
neighbours, public spaces
and better environment for
their children.
Access to
transportation,
job opportunities,
plot and shelter
size.
Environment
for children,
neighbours,
public space.
Job opportunity,
access to
transportation,
disasterresilient
structures.
Environment
for children,
neighbours and
public spaces.
Environment
for children,
neighbours,
public spaces.
Preferences
Public facilities/
while buying or infrastructures,
building a house disaster resilient
structures,
property safety.
Physical features
Total Area of
settlement
(hectares)
4.05
22.57
20.35
2.1 (Including
proposed
road along the
river bank and
excluding green
space along
river bank)
1.87 (Excluding
green space
along river bank)
Total number
of plots
with houses
(occupied)
940
844
710
110
115
Average family
size
4.99
5.66
4.57
5.27
4.87
Number of
2.04
families per plot
2
4.26
1.37
1.44
Number of household per
house is more than 2 (on
average) which shows the
increase in the population
of rentees. Number of
household per house was
1.52 (Population Census
2001, CBS).
Average number 9.1
of people per
plot
11.02
15.09
7.2
7.02
In Khusibu, number of
people per plot 15.09 is
less than average family
size (4.57) * number of
families per plot (4.26).
Total population 8554
(residential)
9301
10714
792
807
In Khusibun, if we take
average people per plot
4.57*4.26, total population
will be 13822.
Physical features
64
www.iied.org
IIED Working paper
Case Study
Traditional
settlement
(Naradevi)
Settlement
outside
ring-road
(Chabahil)
Land-pooling Informal
site (Khusibu) settlement
(Sankhamul)
Informal
settlement
(Banshighat)
Remarks
Population
density
(Number of
people per
hectare)
2112.10
412.09
526.48
377.14
431.71
The density calculated
is residential population
density. (Population
density in all formal
settlements is higher than
the derived number as
rental population using
ground and first floor for
commercial purposes
are not included in the
Household). The informal
settlements have lower
population density
compared to other
settlements because there
are predominantly one
storey buildings in these
informal settlements.
Average
residential plot
size
500 sq.ft.
(0-1-1-3.4)
2305.41 sq.ft.
(0-6-3-0)
1646.17 sq.ft
(0-4-3-1)
865 sq.ft
(0-2-2-0.5)
786 sq.ft
(0-2-1-0.8)
In case of Sankhamul,
the average plot size from
calculation is 1701sq.ft
(0-4-3-3.5).
Average market
price of one
built unit
Land cost:
15–70 lakhs
for 500sq.ft;
Building cost:
15–50 lakhs;
Total cost:
30–120 lakhs;
Average cost:
75 lakhs.
Land cost:
50–150 lakhs
for 2305.41sq.
ft; Building cost:
40–80 lakhs;
Total cost:
90–230 lakhs;
Average cost:
160 lakhs.
Land cost:
40–100 lakhs
for 1646.17sq.
ft; Building cost:
30–60 lakhs;
Total cost:
70–170 lakhs;
Average cost:
120 lakhs.
Land cost:
20–50 lakhs
for 565sq.ft;
Building cost:
1–12 lakhs;
Total cost:
21–62 lakhs;
Average cost:
41.5 lakhs.
Land cost:
15–35 lakhs for
786sq.ft;
Building cost:
1–8 lakhs; Total
cost: 16–
43 lakhs; Average
cost: 29.5 lakhs.
Land in Chabahil and
Kushibun seems to be as
expensive as in Naradevi.
This implies a new
commercial centre is being
developed in outskirts itself
leading to decentralized
Cental Business District
concept. This may be
useful to cut off relatively
high density from central
core areas.
Average market 31.24
price of a
house (land and
house) to annual
income ratio
32.77
29.14
23.16
19.8
Very high (probably
because income may be
more than what is told).
According to CIUD, 2010,
house price to annual
income ratio: 3.9 which is
little too low.
Total builtup area
(residential)
63.7%
(2.58 hectares)
35.7%
(8.06 hectares)
34.01%
(6.92 hectares)
37.14%
(0.78 hectares)
42.25%
(0.79 hectares)
Total open area 25.43%
(courtyards,
(1.03 hectares)
parks, play area,
greenery)
3.9%
(0.88 hectares)
3.39%
(0.69 hectares)
No communal
open space
within the
settlement
9.63%
(0.18 hectares)
Even with comparatively
less built-up area, open
spaces in Chabahil and
Khusibu does not meet
the minimum requirement.
Increasing min. communal
space required while
reducing minimum plot size
and allowing more ground
coverage and FAR can be
a strategy to encourage
quality communal space
while achieving higher
density.
Physical features
www.iied.org
65
Planning for affordable housing during densification in Kathmandu
Remarks
Case Study
Traditional
settlement
(Naradevi)
Settlement
outside
ring-road
(Chabahil)
Land-pooling Informal
site (Khusibu) settlement
(Sankhamul)
Informal
settlement
(Banshighat)
Empty plots
(number and
area)
0.5%
(0.02 hectares)
28.44%
(6.42 hectares)
36.52%
(7.43 hectares)
4 empty plots
that may develop
later.
18.72% can
turn into builtup area after
the remaining
empty plots are
developed.
28.49% can
turn into builtup area after
the remaining
empty plots are
developed.
No empty plots
to be occupied
unless some
families allow
houses to be
built in their
backyard.
Some empty plots There are still areas for
still seen.
construction in Khusibun
and Chabahil, which
means possibility of
increase in population
density in these areas.
Total circulation
(roads, streets
and alleys)
8.89%
(0.36 hectares)
11.46%
(2.59 hectares)
15.52%
(3.16 hectares)
12.86%
(0.27 hectares)
11.77%
(0.22 hectares)
Educational/
Religious area
1.48%
(0.06 hectares)
2.08%
(0.47 hectares)
1.22%
(0.25 hectares)
Small temple
(40sq.m)
Not available
Other spaces
around houses
NA
18.39 %
(4.15 hectares)
9.34%
(1.9 hectares)
Total road
length (rm)
5m wide road:
807m; 3m wide
road: 96.5m;
6m wide road:
106.4m; 1.2m
alley: 655.17m
17m wide road:
466m; 4.5m
wide road:
2136m; 3m wide
road: 1069m;
2m wide road:
512m; 1.5m
wide alley:
1561.75m
4590.06m of
8m wide road,
2295.47m of
6m wide road,
1497.94m of
4m wide road,
625.07m of
2.5m wide road
8m wide road:
419m; 4m wide
road: 253m;
3m wide road:
169m
8m wide road:
290m; 4m wide
road: 460m; 1m
wide alley: 210m
Total sewerage
line length (rm)
1665
5745
8907
Sewage line
directed into
river (toilets are
at the rear of
plots).
Sewage line
directed into river
(some even don’t
have toilets).
Total water lines 1665
length (rm)
5745
8907
Communal
water tanks.
Communal water
tanks.
sq.m of road per 3.81
plot
22.66
26.44
24.55
19.13
r.m of main
water line per
plot
1.76
5.03
7.45
NA
NA
r.m of main
sewage line per
plot
1.76
5.03
7.45
NA
NA
66
www.iied.org
Khusibu has greater
percentage of roads
compared to other
settlements because it is
planned in grid iron pattern.
Cost of infrastructure can
be reduced by planning
compact settlements
with smaller plots
and communal open
courtyards.
IIED Working paper
Appendix 2:
Questionnaire
LUMANTI Support Group for Shelter
Survey Questionnaires for the research titled
Urban Density Study of Kathmandu: Planning for low-rise high density settlements
Name of surveyor:
Date:
Time interview started:
Time interview
concluded:
Ward number:
Name of tole:
House number:
Name of respondent:
1. Household Information
1.1 Living in the house since:
1.2 Caste/Ethnic group:
1.3 Number of household members:
1. Male:
2. Female:
1.4 Age of household members:
1. Less than 15 years old:
2. 16–35 years old:
3. 36–55 years old:
4. More than 60 years old:
1.5 Occupation of household members:
SN.
Relation with household head
Occupation
Location of work
1.6 Total monthly household income:
1.7 Saving of monthly income (%)
1. Less than 10%
2. 11% – 30%
3. Above 30%
1.8 Where do you keep you savings?
1. Banks
2. Finances
3. Cooperatives
4. Home
5. Lend to others
6. Others ( )
1. Yes:
2. No:
1.9 Monthly trasportation expenses:
1.10 Are HH members engaged in social groups?
1.11 If yes, type of social group/activities:
1. Neighborhood Committee
2. Saving/Cooperative groups
3. Guthi/Religious/Cultural groups
4. Youth/Sports groups
5. Women/Housewife groups
6. Others ( )
1.12 Total number of people living in the house
(including renters):
www.iied.org
67
Planning for affordable housing during densification in Kathmandu
2. Social Condition:
2.1 Do you lend or borrow money from your
neighbors?
1. Yes:
2. No
2.2 If yes, how often do you lend or borrow money?
(freq.)
1. Very high
2. High
2.3 Do you lend or borrow HH items from your
neighbors?
1. Yes:
2. No
2.4 If yes, how often do you lend or borrow HH
items?(freq.)
1. Very high
2.5 Do you leave your home and children to
neighbors?
3. Moderate
4. Low
5. Very low
2. High
3. Moderate
4. Low
5. Very low
1. Very high
2. High
3. Moderate
4. Low
5. Very low
2.6 If yes, how often you do leave them to
neighbors? (freq.)
1. Very high
2. High
3. Moderate
4. Low
5. Very low
2.7 What is the level of relationship with your
neighbors?
1. Very good 2. Good
3. Moderate
4. Bad
5. Very Bad
2.8 What is the level of safety in your
neighborhood?
1. Very high
3. Moderate
4. Low
5. Very low
2.9 Where do childern (under 14) play?
1
2. High
2
3
2
3
2
3
2.11 How far do you need to go for shopping?
2.12 How far do you go for recreation?
2.13 Is there a community centre in your settlement? 1. Yes:
2. No
2.14 If yes, what do you use it for?
1
2.15 Do your children go to school in
neighborhood?
1. Yes:
2. No
2.17 Are there open spaces in your neighborhood?
1. Yes:
2. No
2.18 If yes, what do you use open space for?
1
2.19 Do you think that the available open space is
enough?
1. Yes:
2.16 If yes, how far is the school?
2.20 Overall preference of living in the current social 1. Very high
environment
2. No
2. High
3. Moderate
4. Low
5. Very low
3. Environmental condition:
3.1 How do you rate water-supply services?
1. Very good 2. Good
3. Moderate
4. Bad
5. Very Bad
3.2 How do you rate electricity services?
1. Very good 2. Good
3. Moderate
4. Bad
5. Very Bad
3.3 How do you rate waste management services?
1. Very good 2. Good
3. Moderate
4. Bad
5. Very Bad
3.4 How do you rate drainage system during rain?
1. Very good 2. Good
3. Moderate
4. Bad
5. Very Bad
3.5 How do you rate sewage services?
1. Very good 2. Good
3. Moderate
4. Bad
5. Very Bad
3.6 How do you rate road access to your home?
1. Very good 2. Good
3. Moderate
4. Bad
5. Very Bad
3.7 How do you rate access to public
transportation?
1. Very good 2. Good
3. Moderate
4. Bad
5. Very Bad
3.8 How do you rate air quality in your
neighborhood?
1. Very good 2. Good
3. Moderate
4. Bad
5. Very Bad
3.9 how do you rate level of noise pollution in your
neighborhood?
1. Very good 2. Good
3. Moderate
4. Bad
5. Very Bad
68
www.iied.org
IIED Working paper
4. Housing information:
4.1 Plot size:
4.2 No. of storeys:
4.3 Ground coverage:
4.4 Current use of house
4.5 Status in current house
1. Owner’s residence
2. Residence + Commercial
3. Residence + Rental for
residence
4. Rental only
1. Owner
2. Renting
4.6 Why did you choose to live/rent in this
location?
4.7 Are you migrant to the city?
1. Yes:
4.8 If yes, what is the main reason for
migration?
1
2. No
4.9 Type of house (tick by observation)
1. Temporary
(Kachhi)
2. Permanent
(Pakki)
4.10 Construction type (tick by observation)
1. Traditional Newari house
2. Load bearing construction
3. Modified traditional house
4. Pillar system
5. Mud, bamboo, and CGI
sheets
6. Others
2
3
4.11 Are there indicators of incremental
growth?
1. Yes:
2. No
4.12 What is the physical condition of the
house?
1. Very good
2. Good
3. Moderate
4.13 Do you perceive your house to be safe
from earthquake?
1. Yes
2. No
3. Don’t know
3. Semipermanent
4. Bad
5. Very Bad
5. Details of renters: (to be asked to renters
only, if interviewing owners, jump to question
no. 6)
5.1 Number of families living (including owner):
5.2 Total number of people living:
5.3 Size of rental units:
1. 1 room
2. 2 rooms
3. 3 rooms
5.4 How much do you pay for rent?
1. Less than
Rs. 2000
2. Rs. 20005000
3. More than
Rs. 5000
5.5 How do find the rental price?
1. Very high
2. High
3. Moderate
4. Low
5. Very low
5.6 What kind of problems do you face while
renting?
5.7 How offen does the rent increases?
5.8 Can you be asked to leave the place
without prior notice?
1. Every six months by
………. %
2. Every year by
……….. %
3. Every two years by
………... % )
4. Every three years by
……….. %
1. Yes
2. No
www.iied.org
69
Planning for affordable housing during densification in Kathmandu
6. Opinion regarding the current neighborhood:
6.1 What do you like about the overall living condition of the place?
1
2
3
4
6.2 What do you dislike about the overall living condition of the place?
1
2
3
4
7. Preferences
7.1 Are you saving money to buy or
construct a house?
1. Yes
2. No
7.2 Where do you prefer your live?
1. Current location
2. Relocate to other place
7.3 Where do you prefer to live?
1. Individual house
2. Highrise Apartment
3. Walk-up Apartment
7.4 What kind of settlement planning do
you prefer to live?
1. Courtyard planning
2. Grid pattern with rowhouses and wide roads
3. Cluster / Organic
planning
7.5 Preferable plot size
1. 1–2 anna
2. 3–5 anna
3. 6–9 anna
4. 9 anna–1 ropani
5. More than 1 ropani
1. 2 or less rooms
2. 3–5 rooms
3. More than 5 rooms
4. 4 or more rooms
1. less than 10
2. 10 to 30
3. 31 to 50
4. 51 to 70
5. 71 to 90
6. More than 90
1. Yes
2. No
High
Moderate
7.6 Preferable size of house
7.7 How much are you willing to pay for
the land & housing? (in lakhs)
7.8 Do you require space for economic
activities or for renting?
7.9 Select you preferences over the
following items:
Preferences
Preference on plot and shelter size
Preference on public facilities (sanitation,
electricity, water, waste,
drainage, etc)
Preference on public spaces
Preference on neighbors
Preference on community and property
safety
Prefernce on living environment (esp for
children)
Prefernce on job opportunities
Preference on transportation and
communication
Preference on disaster-resilent building
construction and settlement planning
(earthquake, flooding, erosion)
70
www.iied.org
Low
IIED Working paper
Appendix 3:
List of Survey Team
Members
Amit Bajracharya
Pragya Pradhan
Bhagawat Bhakta Khokhali
Poonam Amatya
Sabina Shrestha
Prajina Karmacharya
Rubina Manandhar
Sujata Shakya
Shreedhara Bajracharya
Nijula Singh
Subik Shrestha
Alok Bajracharya
Looza Shakya
Siddhartha Gautam
Sameer Poudyal
Shreejay Shrestha
www.iied.org
71
Planning for affordable housing during densification in Kathmandu
Appendix 4
Physical comparison with new proposals
Physical comparision with new proposals
Case study
Traditional
settlement
(Naradevi)
Naradevi
after replanning
Settlement
outside
ring-road
(Chabahil)
Chabahil
after replanning
Landpooling site
(Khusibu)
Khusibu
after replanning
Sankhamul
Informal
after resettlement
(Sankhamul) planning
Total Area of
settlement
(hectares)
4.05
4.01
22.57
22.57
20.35
20.38
2.1 (Including
proposed
road along
the river bank
and excluding
green space
along river
bank)
2.1
Total number
of plots
with houses
(occupied)
940
940
844
1480
710
1433
110
760
apartment
units
Average family
size
4.99
4.99
5.66
5.66
4.57
4.57
5.27
5.27
Number of
2.04
families per plot
1.6
2
3
4.26
3
1.37
NA
Average
number of
people per plot
7.7
11.02
17
15.09
14
7.2
NA
Total population 8554
(residential)
7240
9301
25160
10714
20062
792
4005
Population
2112.10
density (number
of people per
hectare)
1805.00
412.09
1102.32
526.48
1082.68
377.14
1907.24
Average
residential plot
size
500 sq.ft.
(0-1-1-3.4)
500
2305.41
sq.ft.
(0-6-3-0)
774.72 sq,ft.
(0-2-1-0)
1646.17
sq.ft
(0-4-3-1)
775 sq.ft
865 sq.ft
(0-2-2-0.5)
786 sq.ft (02-1-0.8)
Total
builtup area
(residential)
63.7% (2.58
hectares)
63.7% (2.58 35.7% (8.06
hectares)
hectares)
38.59%
(8.71
hectares)
34.01% (6.92 41.67%
hectares)
(8.49
hectares)
37.14% (0.78
hectares)
50% (1.05
hectares)
5.06 %
(1.15
hectares)
3.39% (0.69
hectares)
No communal
open space
within the
settlement
13.33% (0.28
hectares)
12.86% (0.27
hectares)
24.29% (0.52
hectares)
9.1
Total open area 25.43% (1.03 25.43%
(courtyards,
hectares)
(1.03
parks, play
hectares)
area, greenery)
Total circulation 8.89% (0.36
(roads, streets hectares)
and alleys)
72
www.iied.org
3.9% (0.88
hectares)
8.89% (0.36 11.46% (2.59 31.72%
hectares)
hectares)
(7.24
hectares);
and
25.65%
if we do
not count
466.37m
ring-road
5.76% (1.17
hectares)
15.52% (3.16 19.64%(4
hectares)
hectares)
IIED Working paper
Physical comparision with new proposals
Chabahil
after replanning
Landpooling site
(Khusibu)
Khusibu
after replanning
Sankhamul
Informal
after resettlement
(Sankhamul) planning
1.67%
(0.38
hectares)
1.22% (0.25
hectares)
1.47%(0.3
hectares)
Small temple
(40sq.m)
Small
temple (0.01
hectares)
18.39% (4.15 9.54%
hectares)
(2.17
hectares)
9.34% (1.9
hectares)
10.42%
(2.12
hectares)
NA
11.91% (0.25
hectares)
5m wide
road:
807m; 3m
wide road:
96.5m; 6m
wide road:
106.4m;
1.2m alley:
655.17m
17m wide
road: 466m;
4.5m wide
road: 2136m;
3m wide
road: 1069m;
2m wide road:
512m; 1.5m
wide alley:
1561.75m
12m wide
road
:1725.17m;
6m wide
road:
5509.22m;
3m wide
road: 96m;
12m wide
pedestrian
lane: 234m;
31m c/c
ringroad =
466.37m;
11mc/c
strategic
road=
99.57m.
4590.06m of
8m wide road,
2295.47m of
6m wide road,
1497.94m of
4m wide road,
625.07m of
2.5m wide
road
565.25m of
18m wide
road, 6159m
of 9m
wide road,
1315.5m
of 6m
wide road,
209.63m
of 5m wide
road
1665
1665
5745
7564.39
8907
7684.13
Total water lines 1665
length (rm)
1665
5745
7564.39
8907
7684.13
r.m of main
water line per
residential plot
1.76
1.76
5.03
5.11
7.45
5.36
r.m of main
1.76
sewage line per
residential plot
1.76
5.03
5.11
7.45
5.36
Settlement
outside
ring-road
(Chabahil)
Case study
Traditional
settlement
(Naradevi)
Naradevi
after replanning
Educational/
religious area
1.48% (0.06
hectares)
1.48% (0.06 2.08% (0.47
hectares)
hectares)
Other spaces
around houses
NA
NA
Total road
length (rm)
5m wide
road: 807m;
3m wide
road: 96.5m;
6m wide
road: 106.4m;
1.2m alley:
655.17m
Total sewerage
line length (rm)
www.iied.org
73
Planning for affordable housing during densification in Kathmandu
Related reading
Greene, M and Rojas, E (2008) Incremental
construction: a strategy to facilitate access to housing.
Environment and Urbanization 20(1) 89–108.
http://eau.sagepub.com/content/20/1/89.abstract.
Hasan, A (2010) High-density housing that works for all.
IIED Sustainable Development Opinion Papers, London.
http://pubs.iied.org/17079IIED.html?c=urban.
Hasan, A, Sadiq, A and Ahmed, S (2010) Planning
for high density in low-income settlements: Four case
studies from Karachi. Urbanization and Emerging
Population Issues Working Paper 3. IIED, London.
http://pubs.iied.org/10582IIED.html?k=Four%20
case%20studies%20from%20Karachi.
Hasan, A (2012) The Redesigning of Saiban City,
Lahore. IIED, London. http://pubs.iied.org/G03488.
html?c=urban.
Patel, SB (2011) Analyzing urban layouts – can high
density be achieved with good living conditions?
Environment and Urbanization 23(2) 583–595.
http://eau.sagepub.com/content/23/2/583.abstract.
Tanaka, M (2009) From confrontation to collaboration:
a decade of work in the squatters’ movement in Nepal.
Environment and Urbanization 21(1) 143–159. http://
eau.sagepub.com/content/21/1/143.abstract.
Usavagovitwong, N et al. (2013) Housing density
and housing preference in Bangkok’s low-income
settlements. Urbanization and Emerging Population
Issues Working Paper 12. IIED, London.
http://pubs.iied.org/10631IIED.html?k=density.
74
www.iied.org
IIED Working paper
Acronyms
FAR
Floor Area Ratio
NLRP
Nayabazar Land Readjustment Project
NPR
Nepalese Rupee
OPP
Orangi Pilot Project
ppha
People per hectare
RCC
Reinforced Cement Concrete
VDC
Village Development Committee
www.iied.org
75
Kathmandu faces serious urban planning and housing
challenges. Most development is occurring beyond the
legal limits of zoning bylaws and building regulations in
response to housing shortages. As settlements densify
haphazardly, affordable housing options are increasing, but
living conditions, services and crowding are worsening.
The potential consequences for low-income residents are
disastrous given the danger of an imminent earthquake.
This paper examines four types of settlements in
Kathmandu to understand the impacts of densification.
It then presents conceptual reimaginings of these
settlements to apply the lessons for planning affordable
housing in densifying settlements without compromising
unduly on safety and liveability.
IIED is a policy and action research
organisation. We promote sustainable
development to improve livelihoods
and protect the environments on which
these livelihoods are built. We specialise
in linking local priorities to global
challenges. IIED is based in London and
works in Africa, Asia, Latin America, the
Middle East and the Pacific, with some
of the world’s most vulnerable people.
We work with them to strengthen their
voice in the decision-making arenas that
affect them — from village councils to
international conventions.
International Institute for Environment and Development
80-86 Gray’s Inn Road, London WC1X 8NH, UK
Tel: +44 (0)20 3463 7399
Fax: +44 (0)20 3514 9055
email: [email protected]
www.iied.org
Funded by:
This research was funded by UK aid from the
UK Government, however the views expressed
do not necessarily reflect the views of the UK
Government.
Knowledge
Products
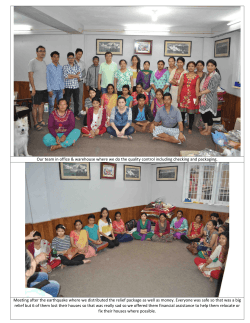


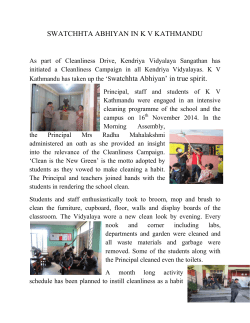


© Copyright 2026