
Immigrant Status Verification and Immigrants` Participation in the
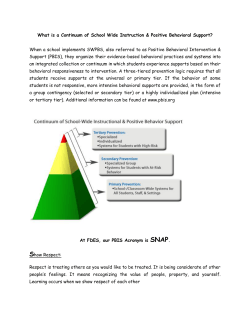
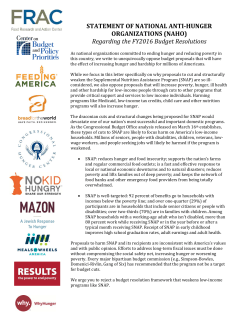
Immigrant Status Verification and Immigrants’ Participation in the
Supplemental Nutrition Assistance Program
Qinping Feng∗†
March 23, 2015
Abstract
This paper studies how the adoption of the Systematic Alien Verification of Entitlement
(SAVE) program affects the Supplemental Nutrition Assistance Program (SNAP) participation for immigrant adults and US-born children living with immigrant household heads. I
find that foreign-born adults without children have an insignificant drop in SNAP participation following the adoption of the SAVE program. This result suggests fraudulent claims by
undocumented immigrants prevented by SAVE are likely negligible. In addition, I find that
the SAVE adoption has a sizable negative impact on SNAP participation of US-born children
headed by immigrants, both for the participation rate (decrease by 12%) and the total number
of participation (decrease by 8%) in a household.
JEL-Classification: I38, H53
Keywords: Fraudulent Claims, SAVE, SNAP, Food Stamps, Immigrant Welfare Participation
∗
University of Illinois, Urbana-Champaign, [email protected].
I would like to thank Tami Gurley-Calvez, Ben Mark, David Albouy, Bradley Hardy, and Ian Stephens for their
comments.
†
1
“The State of Oklahoma finds that illegal immigration is causing economic hardship and
lawlessness in this state and that illegal immigration is encouraged by public agencies within this
state that provide public benefits without verifying immigration status.”
— Oklahoma Taxpayer and Citizen Protection Act of 2007
1
Introduction
In the wake of the Obama 2014 executive order1 , the nation has recognized the issue of immigration
policy dilemma. This paper studies one type of immigration policy in the context of immigrant
status verification for welfare participation, in particular, the Supplemental Nutrition Assistance
Program (SNAP) participation.
Immigrant households’ public benefit participation has always been a public policy interest and
one of the centerpieces in state-level legislation related to immigrants. On the one hand, a number
of anecdotal evidence suggests the existence of fraudulent claims for welfare by undocumented
immigrants. Yet, we do not know the magnitude. On the other hand, there is always concern
over low welfare take-up of US-born children living in immigrant-headed households. This paper
investigates how the adoption of the Systematic Alien Verification of Entitlement (SAVE) program
affects the Supplemental Nutrition Assistance Program (SNAP) participation for various immigrant
groups and uses US-born citizens as a baseline group.
By comparing before and after the adoption of the SAVE program, I do not observe a statistically significant drop in the SNAP participation among non-citizen adults, approximately half of
who are unqualified for the welfare given their immigrant status. This suggests fraudulent claims
by undocumented immigrants prior to the SAVE adoption are likely negligible. As the unintended
consequences, however, I find that the adoption of SAVE has a negative impact on the SNAP participation among US-born children headed by foreign-borns. This result suggests a great confusion
or error in applying the verification procedures.
1
November 20, 2014, the president announced a series of executive actions to prioritize deporting felons not families, and allow certain undocumented immigrants to temporarily stay in the U.S. without fear of deportation
2
While a large empirical literature has analyzed incomplete take up and hence the occurrence
of type Ia error, much fewer papers have estimated the occurrence of type Ib and type II errors.
A small literature looking at classification error rates in U.S. Social Security disability award processes suggests that both award and rejection errors are very common. For example, the recent
paper by Ben??tez-Silva et al. (2004) estimates the award error rate to about 20% and the rejection
error rate to about 60%.3 For the United Kingdom, Duclos (1995) studies classification errors in
the Supplementary Benefits scheme, the main welfare program until 1988 providing means-tested
cash benefits to the poor, and estimates an award error rate of 18.8% an a rejection error rate of
18.1%.
The most close to my paper in scope is Sommers (2010). The author shows that citizenship
documentation requirement for Medicaid applicants reduced Medicaid enrollment among noncitizens and did not significantly affect citizens. His analysis differs from this paper in several
respects. First, I look at a different welfare program, i.e., SNAP, instead of Medicaid. US-born
children with immigrant parents have caught up with their participation in Medicaid, possibly
due to the substantial outreach efforts. In contrast, SNAP participation among immigrants is still
significantly lower than their native counterpart. Second, I focus on two relevant groups: USborn children living with immigrant parents and foreign-born adults. Third, Sommers (2010) has
more emphasis on direct fiscal impact and he conducts a cost and benefit analysis. However, my
paper concerns more on how immigrant policy could affect the second generation of immigrants’.
Moreover, how US-born children fare in health and later labor market outcome would indeed have
longer run fiscal impact, although the details is out of the scope for this paper.
2
2.1
Background
Systematic Alien Verification of Entitlement Program
The Systematic Alien Verification of Entitlement (SAVE) program is an intergovernmental initiative designed to help federal, state, and local government agencies check immigration status for
3
granting public benefits, licenses, and other lawful purposes. The SAVE Program has access to
immigration status information from more than 100 million records contained in the Department
of Homeland Security databases. The public benefit agency makes the inquiry through SAVE after
completing document examination procedures. The U.S. Citizenship and Immigration Services
will then respond within a few days. The response will indicate the immigration status of a public
benefit applicant. By determining the immigration status of the benefit applicants, SAVE helps
authorized agencies ensure that only qualified immigrant applicants receive federal, state, or local
public benefits and licenses. The SAVE program, however, does not indicate whether a person is
eligible for a particular benefit. A benefit agency still has to determine whether the immigrant is
eligible for a particular benefit, given the immigrant’s legal status and other eligibility criteria.
In this paper, I compare the welfare participation in states before and after the adoption of
the SAVE program with states that have already adopted the SAVE program prior to 2004. The
adoption of the SAVE program in verifying immigrant status for public benefit applicants dates
back to the 1996 federal welfare law Personal Responsibility and Work Opportunity Reconciliation
Act (PRWORA). The law requires state and local agencies to verify the immigration status of all
applicants for federal public benefits. States have received waivers from the SAVE program if
they have another effective verification method or the cost of using SAVE would outweigh the
savings. I use agency verification inquiry data requested through Freedom of Information Act
(FOIA) to determine the timing of SAVE adoption. Specifically, if a state agency makes more than
one immigrant status request through SAVE in a fiscal year, I code the state as the SAVE program
user and vice versa. Up to now, all the states have registered for the SAVE program in granting the
public benefit studied in this paper except Washington.2 Because the data is only available since
2004, I do not observe the timing of the SAVE adoption if a state adopted SAVE before 2004. I
therefore compare the participation in states that adopted before 2004 (early states) and after 2004
(late states). Table 1 lists the states that adopt the SAVE program after 2004 and their estimated
number of undocumented immigrants. Not surprisingly, most of these states do not have a large
2
The state of Washington has received a waiver from the requirements to use SAVE for verification of benefit
eligibility.
4
amount of undocumented immigrants. They received waivers for SAVE in earlier years because
the cost of implementing it is larger than the savings.
2.2
Supplemental Nutrition Assistance Program and Access by Immigrant
Status
Supplemental Nutrition Assistance Program (SNAP), formerly known as the Food Stamp program,
provides food-purchasing assistance for low- and no-income people living in the U.S. It is a federal
aid program, fully funded by the federal government except for 50% of the administrative costs.. I
focus on the SNAP program to study the effect of SAVE for the following reasons. First, SNAP is
the only program with almost universal demographic eligibility. It covers all eligibles: all family
types and all age groups. Since the period I study overlaps with the Great Recession, this universal
demographic eligibility allows all demographic groups to benefit equally from the expansion of
SNAP during recession years. Therefore, compared to the other big programs such as Medicaid,
the analysis on SNAP can better isolate the verification effect from the effect due to demographic
compositional change. Second, in terms of expenditure, SNAP is the second largest means-tested
program (Medicaid is the first). The cost was $76.4 billion in fiscal year 2013 and supplied roughly
47.6 million Americans (USDA, 2014). Third, as Figure 1 shows, US-born children with immigrant parents have caught up with their participation in Medicaid, possibly due to the substantial
outreach efforts. In contrast, SNAP participation among immigrants is still significantly lower than
their native counterpart.
Different categories of immigrants are defined as follows. Immigrants are defined as those who
are foreign-born and who are not born by American parents. Immigrants include both naturalized citizens and non-citizens. Naturalized citizens are those who are immigrants and later acquire
citizenship of the U.S. Non-citizens include Lawful Permanent Residence (LPRs), Refugee, temporary visa holders (F-1 students, H-1B workers, etc.), and undocumented immigrants. Table 2
lists the federal laws regarding immigrant eligibility for SNAP. There are some major eligibility
changes for different immigrant status: 1996 PROWA and 1998 and 2002 farm bills. To the ex5
tent that these changes are the eligibility changes that affect all states, this macro shock will be
absorbed in year effects in all specifications.
In addition to the federal laws on immigrants’ eligibility for SNAP benefits, some states chose
to maintain coverage for legal immigrants with state-funded programs (known as “fill-in” programs). These states include California, Connecticut, Maine, Minnesota, Nebraska, Washington,
and Wisconsin. The eligibility rules for different immigrant groups on the state level have been
consistent throughout years, with little year to year change. Thus, the state fixed effect could
capture the participation difference due to the state-level eligibility rule differences.
3
Why Would SAVE Affect SNAP Participation?
For the immigrant adults, SAVE could both deter the fraud claims by unqualified immigrants and
decrease the participation by qualified immigrants. The participation for immigrant group has
two components: the participation for qualified immigrants and the participation for unqualified
immigrants. First, the implementation of SAVE would prevent the fraudulent claims by immigrants
who are not qualified for public benefits due to their immigrant status. Second, implementing noncitizen eligibility rules for the legal immigrants are challenging and error-prone. This would likely
wrongly reject the applicants who are otherwise qualified for public benefit. For example, some
non-citizen applicants could have a less common immigration status (for instance, asylees) that
SAVE database does not recognize, or the applicant presents an uncommon document. Some
immigrants may be eligible with some amounts of working hours per week, an unexperienced
state agency may decline the applicants based on immigrant status from database. This would
be of particular concern for areas with more recent immigrant inflows but non-citizen application
are still not frequent. (check more new immigrant inflows (change of immigrant percentage?)
differential impact.)
For the US-born children who live with immigrant parents, there are possible confusions from
both benefit granting agency and immigrant parents on whether the immigrant status of parents
6
need to be checked when they are applying on behalf of children. Moreover, undocumented immigrants may simply be discouraged from applying SNAP for their US-born children due to the fear
of deportation. Children living with immigrant parents are particularly vulnerable.
4
Data and Summary Statistics
The analysis uses data from the March Annual Demographic Supplements to the Current Population Survey (CPS) 2001-2014. The CPS asks whether each individual was covered by SNAP in the
previous calendar year. Therefore the study corresponds to 2000-2013 year participation. I choose
this period for the following considerations. On the one hand, the first year that a state adopted the
SAVE program after 2004 is 2005 in Maine, with the majority around 2009. Some years prior to
adopting the program are needed in order to get a credible estimate on the pre-existing trends on
SNAP participation. On the other hand, some research has documented the decline in the take-up
of several safety net programs of 3-4 percentage points following the 1996 welfare reform (Mazzolari, 2004). Therefore, starting from four years after the 1996 welfare reform arguably isolates the
verification effects from 1996 welfare reform effects in welfare participation. At the same time, it
also provides long enough years to estimate the pre-existing trends.
SNAP participation is measured at the household level. I investigate both the household-level
participation rate in SNAP and the total number of participation in the household. The primary
analysis focuses on two types of samples: adults living in households without children under age
18 (hereafter referred to as the adult sample) and US-born children living in households with
US-born children under age 18 (hereafter referred to as the US-born children sample). For the
adult sample, I study adults’ SNAP participation behavior. Since US-born children living with
immigrant parents are themselves eligible for SNAP, I focus on households without children to
isolate eligibility for immigrants from eligibility for their US-born children. For the US-born
children sample, I conduct a similar analysis on US-born children and investigate how the head
of the household’s immigrant status has differentially affected SNAP participation of US-born
7
children. To avoid the confounding factors that affect the poverty status of a state, which is a key
factor in determining a household’s eligibility for SNAP, I limit my sample to households with
income below the 200 percent poverty line.
A vector of controls includes individual-level control variables, state-level labor market conditions, and the state demographic distribution. Individual controls include age, sex, race, education,
total family incomes, and household poverty status. For the adult sample analysis, I also include
the individual’s employment status, whether she/he arrived in the U.S. prior to 1982, and whether
she/he resided in the U.S. for more than five years. For the US-born children sample analysis, I
include the household head’s employment status, whether the head arrived the U.S. prior to 1982,
and whether the head resided in the U.S. more than five years (I assume the household head makes
the decision for the children’s SNAP participation). Individual characteristics accounts for the participation difference due to the demographic composition difference. Previous research (Blank,
2001 and Fitzgerald, 1995) show that the local labor market conditions are associated with longer
welfare spells (AFDC). More relevant to this study, Lofstrom and Bean (2002) find that local economic conditions are responsible for the declines in immigrant welfare use following the passage
of the PRWORA bill. The sample time period overlaps with the great recession, the inclusion of
labor market variables is key to isolate the SAVE effect on SNAP participation. I use unemployment rate, log of employment, and the employment-to-population ratio to control for local labor
market opportunities. I also use fraction of Mexican-born immigrants to control for immigrant
distribution.
Table 3 and Table 4 present the summary statistics for the adult sample and the US-born children sample separated by immigrant status and early states and late states. A few points are worth
highlighting. First, the states who adopted the SAVE system after 2004 have a smaller fraction of
immigrants in the total population since states who adopted the SAVE program late are those who
have received waivers from the SAVE program in earlier years. (The cost of using SAVE would
outweigh the savings because they had smaller immigrant population.) Most of the states do not
have as many immigrants as the states who adopted SAVE earlier. Therefore, the adoption of
8
SAVE is less prone to endogeneity issues. Second, there are a smaller fraction of Hispanics in the
total foreign-born population. Immigrants in treatment states appear to be slightly more educated.
Third, there is a higher SNAP participation in the states who adopted SAVE late. These patterns
suggest that it is important to control for potential differences across states, but also for pre-SAVE
differences in SNAP participation outcomes among foreign-borns and natives.
5
Identification Strategy and Estimation Results
5.1
Basic Difference-in-Difference Model
The identification strategy is to exploit state-time variation in adopting the SAVE program to verify
immigrant status for SNAP applicants. I compare the SNAP participation in states before and after
adopting the SAVE program by using states that have adopted the SAVE program prior to 2004 as
a control for secure change over time. To formalize the idea, I estimate the following differencein-difference model:
0
yist = β0 + β1 SAV Est + αxist + ρyst + σs + γt + ist
The dependent variable yist is a participation outcome variable for individual i from state s in
year t. Participation outcomes include an indicator variable for household participation in SNAP
and the total number of participation in SNAP in the household. The main dependent variable
SAV E is an indicator variable. SAV Est = 1 if in the year t and all subsequent years, state s has
adopted the SAVE program for citizenship verification on SNAP applicants. SAV Est = 0 in all
years prior to the SAVE adoption or if a state never adopted the SAVE program. σs indexes state
fixed effects. It controls for state-level time-invariant characteristics. For example, it effectively
absorbs state differences of generosity for immigrants’ access to SNAP that do no change over
time. γt indexes time fixed effects. This term captures the macroeconomic change and the eligibility rule change for immigrants that is the same for all states. xist indexes individual level controls.
9
yst is state-level time-variant controls. It controls for state-wide labor market conditions and demographic compositions, which should account for other factors that might be slowly changing at
the state level over time.
5.2
Difference-in-Difference-in-Difference: Controlling for Differential Trends
In order to interpret the OLS estimate of β1 as the effect of the SAVE program, one must assume
that without the program, the outcomes would have changed over time by the same amount in the
states that adopted the SAVE program later and for the other states (parallel trend assumption). To
address the concern of differential trends, I pool all immigrants and natives together and use the
US-born citizen group as a baseline group in the estimation. Specifically, I estimate the following
linear model:
0
yif st = β0 +β1 SAV Est +β2 SAV Est ·∗I{F Bi = 1}+β3 I{F Bi = 1}+ρxist ·I{F Bi = 1}+σsf +γtf +if st
I{F Bi = 1} is an indicator variable and I{F Bi = 1} = 0 is the baseline group. For the
adult sample, it represents the US-born adults. For the US-born children sample, it represents
the US-born children from households headed by US-born citizens. I{F Bi = 1} = 1 is the
treatment group. For the adult sample, it represents the foreign-born adults. For the US-born
children sample, it represents the US-born children living in the households headed by foreignborns. Any effect of the state-wide shocks (for example, the economics shocks or eligibility rule
changes) that affect both US-born citizens and foreign-borns should be fully accounted for in the
estimate on the baseline group (β1 ). β2 is the key variable of interest. It is the effect of the SAVE
adoption on households headed by foreign-born after accounting for the effects that are common
to both natives and foreign-borns.
The full interaction between the basic difference-in-difference model and immigrant group
addresses a few concerns. One concern is the timing that most states start implementing the pro-
10
gram overlaps with the timing of the American Recovery and Reinvestment Act of 2009 (ARRA).3
US-borns as a control group can account for the eligibility rule change that are common to both
US-borns and foreign-borns. A second concern is different immigrant groups may respond differently to labor market downturn in participating SNAP when I pool all natives and foreign-borns
together. A full interaction takes into account this differential response in SNAP participation to
labor market conditions. Finally, state and immigrant group specific effect further reduces the
potential bias from participation differences across states and immigrant groups. For example,
states with a longstanding history of immigrants may have more outreach efforts in enrolling immigrants into SNAP which would cause the participation difference between US-born citizens and
immigrants.
Table 5 presents the main results for the adult sample. Overall, SAVE has a small and insignificant impact on SNAP participation for the adult sample. The first column presents results from
specifications without additional controls other than state- and year-fixed effects and shows the raw
participation change. The raw participation change has a positive sign. However, the sign becomes
negative after including the individual control variables. This suggests the differential response
to the Great Recession on welfare participation for treatment state immigrants and control state
immigrants due to differences in demographic composition (Hoynes et al., 2012). Therefore, excluding individual characteristics underestimates the effect of SAVE on SNAP participation. My
preferred specification (column 3) includes the individual-level control variables and state-level
labor market and demographic control variables. After accounting for any demographic change
and state labor market condition change, the estimated effect for citizens is still small in magnitude
and not statistically significant. All the remaining specifications consistently estimate a negative
participation effect on foreign-borns, although the effect is not statistically significant. In contrast, there is essentially no participation change for US-born citizens. Overall, before and after
3
ARRA was an economic stimulus package enacted by the 111th United States Congress in February 2009 and
signed into law on February 17, 2009 by President Barack Obama. One of the objectives was to provide temporary
relief programs for those most impacted by the recession and invest in infrastructure, education, health, and renewable
energy. It provides $16.5 billion to increase SNAP benefits by 12 percent through fiscal 2011 and issue a one-time
bonus payment.
11
the adoption of the SAVE program, relative to the US-born citizens, the foreign-born adults have
seen an approximately 2-3 percentage point drop in SNAP participation, but it is not accurately
estimated.
Panel A of Table 6 provides some suggestive evidence on the negative impact of SAVE on
SNAP participation in the household for the children sample. The estimated sign for the baseline
group (US-born children headed by US-born citizens) is positive across different specifications.
The positive sign could be due to the eligibility rule change or some other state-wide shock. The
effect for US-born children headed by foreign-borns are negative after accounting for the common
shock. My preferred specification (column 3) shows that relative to US-born children headed by
citizens, relative to US-born children headed by citizens, the US-born children headed by foreignborns have seen a roughly 4 percent point drop in SNAP participation, which is about 12% of the
mean participation rate for this group.
Panel B of Table 6 presents the analysis on log total participation for the children sample and it
shows negative impact consistent with panel A results. Since SNAP participation is not reported on
the individual level, the analysis on the household-level participation does not provide a full picture
of the participation effect following the SAVE adoption. I therefore conduct the analysis on the
extensive margin: the total number of SNAP participation in a household. The outcome variable
is measured as the log value of total participation plus one. The reason for this transformation is
to avoid the selection bias due to non-participants. For example, if the SAVE program causes the
immigrant household that would have participated SNAP but with a lower total numbers to not
participate in SNAP, then it would appear that SNAP increases the total number of participation in
a household. Including the non-participants therefore avoids the participation selection bias. The
sign on both groups is consistent with the analysis on participation indicator variable (panel B).
Before and after the adoption of SAVE, the total number of SAVE participation in the households
with foreign-born heads decrease by around 8 percentage relative to the households with US-born
household heads. Compared to the mean total participation number in a household, this was a
decrease of 10% total participation per household.
12
5.3
Validity of the Identification Assumption
The key identifying assumption is that once I include individual- and state-level controls, the timing of the SAVE adoption is not correlated with other factors that might have an effect on participation outcomes. I perform a set of tests to show whether the SAVE adoption is associated
some key characteristics that would affect participation. The set of dependent variables include
employment status last year, education level, and whether the head has been in the US less than
five years. Panel A of Appendix Table A.1 presents a set of regressions for the adult sample. Panel
B presents the set of regressions for the children sample. All regressions do no include any covariates other than state- and year-fixed effect. The employment status last year for the control groups
in both samples appear to be significantly estimated. This confirms the need for the differencein-difference-difference model. For the adult sample, after the SAVE adoption, states appear to
have more new immigrants in the non-citizen group. To the extent that most new immigrants in the
non-citizen category are not eligible for the SNAP benefit, I over-estimate the SAVE effect, if there
is any negative effect. My conclusion would still be robust. For the US-born children sample, I do
not observe a difference before and after the SAVE adoption using US-born children with US-born
with native heads as a control group.
5.4
Heterogeneous Impacts
Table 7 shows the heterogeneous impacts on the adult sample. Overall, the signs of the heterogeneous impacts are expected but not significantly estimated due to the small sample size in the
treatment group. High school educated, non-citizen foreign-born and individuals from states with
more undocumented immigrants all have a larger drop in SNAP participation following the SAVE
adoption, although none of them are precisely estimated. The exception is the first column: the
impact on new arrival foreign-borns. This may be due to the fact that newly arrived immigrants
have very low participation in SNAP before the SAVE adoption in the first place and the fact that
there are more newly arrived immigrant after the SAVE adoption (c.f., Appendix Table A.1). The
results indicate no significant fraudulent claims by undocumented immigrants. (Recall that non13
citizen group is composed of roughly half legal immigrants and half undocumented immigrants.)
We can rule out larger than the 2.5% percent of fraudulent claims prevented by SAVE.
Panel A in Table 8 provides the analogous analysis on US-born children. I separate the US-born
children by the immigrant status of their household heads: US-born children headed by US-born
citizens, US-born children headed by naturalized citizens, and US-born children headed by noncitizens. I take the US-born children headed by US-born citizens as the baseline group. The significantly positive sign for the baseline group is not surprising since the time period overlaps with
the American Recovery and Reinvestment Act (ARRA) of 2009.4 My preferred specification (column 3) shows that relative to US-born children headed by citizens, the US-born children headed
by foreign-borns have seen a roughly 8 percent point drop in SNAP participation, which is about
20% of the mean participation rate for this group. The US-born children headed by non-citizen
also shows negative impact, but it is not statistically significant. All specifications are consistently
estimated.
Overall, I find a consistently estimated negative impact in different specifications on SNAP
participation for US-born children headed by non-citizens and naturalized citizens. This result
suggests a great confusion or error in applying the verification procedures.
6
Interpretations and Discussions
6.1
The Usage and Effectiveness of SAVE
Ultimately, the purpose of SAVE is to prevent the fraudulent claims by unqualified immigrants. My
results suggest the fraud claims by unqualified immigrants prevented by SAVE are very limited: we
can rule out larger than a 2.6% of fraudulent claims decrease due to the SAVE adoption. The first
reason that SAVE does not prove to be effective in preventing frauds could be because SAVE is not
well-implemented. Ideally, one would like to investigate the intensity of SAVE usage for SNAP.
4
ARRA was an economic stimulus package enacted by the 111th United States Congress in February 2009 and
signed into law on February 17, 2009. It allocated $19.9 billion to SNAP.
14
However, All public benefit agency use SAVE for more than one program. Therefore, I focus on
the state agency who use it only for Temporary Assistance for Needy Families (TANF) 5 and SNAP.
TANF is also a federally funded program. Public benefit agency may use SAVE consistently for
SNAP and TANF. Also, TANF has very insignificant amount of participation compared to SNAP.
Figure 2 does not reveal a systematic correlation between the total number of SNAP recipients
and the SAVE requests for immigrant status verification. The fact that some states have very few
citizenship verification request indicates that not all public agency make full use of SAVE. Instead,
the public benefit agency may be more likely to make selective request if they are suspicious with
some foreign-looking applicants.
The second reason that SAVE does not prove to be effective in preventing frauds could be due
to the fact that frauds among immigrants are low in the first place. This paper focuses on the fraud
claim due to citizenship criteria, but not other eligibility criteria. For example, I do not study the
behavior of fraudulent claims by immigrants who are eligible for immigrants’ legal status but do
not satisfy other eligibility criteria. To further investigate this hypothesis, I focus on an immigrant
group who mostly are not eligible: non-citizen immigrants who arrived in the US less than 5 years
ago, who do not live with any citizen or children in the household, and who do not live in one of
those states with fill-in programs for legal immigrants. The participation for this immigrant group
is around 5%, compared to the average of 15% for their national counterpart. Note that this is
a slight overestimate of fraud claims because the eligibility rules still make exceptions for some
group, e.g. the disabled. Generalized to the adult sample, this is a fiscal cost equal to $743,000 a
year (average monthly benefits per person ($133.07) × 12 months × total number of non-citizen
adult population in 2013 (9318) × percentage of fraud (5%)) . The fraud by the immigrant adults
who do not have children under age 18 would at most cause the federal dollars at $743,000 a year,
compared to the total SNAP cost of $79,929.78 millions a year.
5
The TANF program provides cash assistance to children and their caregivers, mostly to those with only one
biological parent present, mostly single mothers. Eligibility requires low income and assets.
15
6.2
The Unintended Impact on US-born Children
The analysis on the US-born children sample suggest some modest impact of SAVE on SNAP
participation by US-born children living with immigrant household heads. The participation rate
in the household level decreases by 12% and the total number of participation in the household
decreases by 8% following the adoption of SAVE. According to 2013 American Community Survey, 40% of immigrant headed households have at least one US-born children under 18 living in
the household, and they make up about 20% of the total US-born children. My analysis suggests
that policy that aim at limiting the access of public benefits for immigrants also induce unintended
impact on US-born children, especially those who live with immigrant parents.
7
Conclusions
My results suggest a need to oversee programs that aim at immigrants in order to minimize the negative spillover in their US-born children. The verification process should be implemented precisely
to avoid confusion in already complicated welfare program eligibility.
References
Blank, R. (2001). What causes public assistance caseloads to grow. The Journal of Human Resources, 36(1):85–118.
Fitzgerald, J. M. (1995). Local labor markets and local area effects on welfare duration. Journal
of Policy Analysis and Management, 14(1):43–67.
Hoynes, H., Miller, D., and Schaller, J. (2012). Who suffers during recessions?
Journal of
Economic Perspectives, 26(3):27–48.
Lofstrom, M. and Bean, F. D. (2002). Assessing immigrant policy options: Labor market condi-
16
tions and post-reform declines in welfare receipt among immigrants. Demography, 39(4):617–
37.
Mazzolari, F. (2004). Effects of welfare reform on immigrants? welfare participation: How ?chilling? are they? Unpublished manuscript.
Passel, J. and Cohn, D. (2010). U.S. Unauthorized Immigration Flows Are Down Sharply Since
Mid-Decade. Pew Hispanic Center. Pew Hispanic Center Report.
Sommers, B. (2010). Targeting in medicaid: The costs and enrollment effects of medicaid’s citizenship documentation requirement. Journal of Public Economics, 94:174–182.
17
Figure 1: Participation Rate of SNAP and Medicaid by Children
(a) 1a
(b) 1b
18
Figure 2: Total Number of SNAP Recipients and SAVE Requests for SNAP and TANF
19
Table 1: States that Adopted SAVE after 2004
and their Immigrant Status Composition
State
Year of Adoption
Estimated Number of
Undocumented Immigrants
Maine
Hawaii
Mississippi
Montana
Louisiana
Michigan
2005
2009
2009
2009
2010
2011
less than 10,000
40,000
45,000
less than 10,000
65,000
150,000
Data Sources: year of adoption on the SAVE program data is
accessed through a FOIA request. Undocumented immigrants
estimates are measured in 2010 and come from Passel and Cohn
(2010). When the total number of undocumented immigrants is
less than 10,000, an accurate number is not provided.
20
21
Yes
Yes
Yes
Yes
Yes
Yes
Yes
Yes
Yes
Yes
Yes After 5 Years of Residence
Yes
Yes
Yes
Yes
Yes
Yes
Yes
Yes After 5 Years of Residence
Yes
Yes
Agriculture, Research Extension
and Education Reform Act
Personal Responsibility and Work
Opportunity Reconciliation Act
(PRWORA)
Yes
Yes
Yes
Yes
Yes
Yes
Yes
Yes
Yes
Yes
Yes
Farm Security and
Rural Investment Act
2002
Sources: USDA June 2011 “Supplemental Nutrition Assistance Program: Guidance on Non-Citizen Eligibility”
Note: All naturalized immigrants are eligible for SNAP benefits on the same basis as citizens. All unauthorized immigrants are ineligible
for SNAP benefits. A qualified immigrant is a non-citizen who belongs to one of the following categories: Lawfully admitted for permanent residence, asylees, parolees, deportation withheld, conditional entrants, Cuban or Haitian entrants, battered non-citizens, refugees,
trafficking victims, Iraqi and Afghan special immigrants. Post-enactment immigrants are those who lawfully resided in the U.S. since Aug
22, 1996 (PRWORA enactment date). Pre-enactment immigrants are those who arrive after Aug 22, 1996.
After Five Years of Residence
40 Qualifying Work Quarters
Children Under 18
Disabled
Elderly
Military Connection
Post-Enactment Qualified Immigrants
40 Qualifying Work Quarters
Children Under 18
Disabled
Elderly
Military Connection
Pre-Enactment Qualified Immigrants
Prior to
PRWORA
1998
August 22, 1996
Table 2: Federal Laws Regarding Immigrant Eligibility for SNAP
22
0.187
0.697
0.240
0.021
0.657
0.158
54.742
0.430
0.526
0.294
13675.24
N.A.
0.193
24639
US-born Citizens
0.184
0.444
0.056
0.173
0.640
0.230
53.050
0.483
0.548
0.335
13909.46
0.275
0.168
2177
Foreign-born
0.144
0.730
0.157
0.079
0.616
0.190
54.510
0.434
0.513
0.302
13670.76
N.A.
0.171
206979
US-born Citizens
0.115
0.248
0.076
0.458
0.673
0.212
51.297
0.483
0.525
0.379
14407.87
0.213
0.194
42386
Foreign-born
Early States
Data Sources: Current Population Survey (CPS) 2001-2014. SNAP participation is measured at the
household level. “Late States” refers to states that adopted the SAVE program after 2004 and “Early
States” refers to states that adopted the SAVE program before 2004.
SNAP Participation
White
Black
Hispanic
High School or Less
College Degree or Higher
Age
Male
Under 125% Poverty Line
Employed Last Year
Total Family Income
Arrive Less than 5 Years Ago
Any Public Health Care
Observations
Variables
Late States
Table 3: The Adult Sample (Adults Living in Households Without Children Under 18):
States That Adopted the SAVE Program After 2004 (Late States)
V.S. States That Adopted the SAVE Program Before 2004 (Early States)
23
0.437
1.650
0.469
0.410
0.043
8.218
0.430
0.605
0.620
0.157
0.294
N.A.
0.614
20308.79
26860
US-born Citizens
0.331
1.360
0.333
0.068
0.317
7.095
0.504
0.550
0.693
0.167
0.632
0.092
0.607
25048.73
2279
Foreign-born
0.373
1.375
0.505
0.245
0.187
8.141
0.434
0.544
0.592
0.182
0.302
N.A.
0.573
21646.42
228778
US-born Citizens
0.279
0.984
0.078
0.071
0.743
7.502
0.512
0.576
0.793
0.118
0.653
0.081
0.601
23933.46
67211
Foreign-born
Early States
Data Sources: Current Population Survey (CPS) 2001-2014. SNAP participation is measured at the household
level. “Late States” refers to states that adopted the SAVE program after 2004 and “Early States” refers to states
that adopted the SAVE program before 2004.
SNAP Participation
Total Number of Participation
White
Black
Hispanic
Age
Male
Any Public Health Care
Head High school or less
Head College degree or higher
Head Employed Last Year
Head Arrive Less than 5 Years Ago
Under 125% Poverty Line
Total Family Income
Observations
Variables
Late States
Table 4: The US-born Children Sample:
States That Adopted the SAVE Program After 2004 (Late States)
V.S. States That Adopted the SAVE Program Before 2004 (Early States)
Table 5: Difference-in-Difference Estimation of SNAP Participation:
The Adult Sample Under the 200% Poverty Line
Dependent Variable: Participation (Linear Probability Estimation)
(1)
(2)
(3)
(4)
(5)
Policy (β1 )
0.003
(0.006)
0.007
(0.005)
-0.002
(0.006)
0.004
(0.006)
-0.022∗∗∗
(0.009)
Policy × Foreign-Born (β2 )
0.018
(0.021)
-0.011
(0.021)
-0.019
(0.021)
-0.035
(0.022)
-0.037
(0.022)
R2
Observations
0.03
276186
0.11
276186
0.11
276186
0.11
276186
0.11
276186
yes
yes
yes
yes
yes
yes
yes
yes
yes
yes
yes
yes
yes
yes
yes
State and Year Fixed Effects
Individual Controls
State Labor Market Controls
State Demographic Controls
State Trends
NOTE: All regressions are linear probability regressions. Standard deviation is reported in parentheses. The outcome variable is measured at the household level.
The regressions are clustered by the state level. All regressions include state fixed
effect and time fixed effect. Individual controls include age, sex, race, education,
employment status, total family income, poverty status, an indicator for whether the
individual resided in the U.S. more than five years, and an indicator for whether the
individual arrived the U.S. prior to 1982. State-level controls include state unemployment rate, log of total employment, the employment-to-population ratio, the fraction
of immigrants who live in the U.S. less than five years, and the fraction of foreignborn in the total population.
* significant at the 10% level; **significant at the 5% level; ***significant at the 1%
level.
24
Table 6: Difference-in-Difference-in-Difference Estimation of SNAP Participation:
The US-born Children Sample Under the 200% Poverty Line
(1)
Panel A:
(2)
(3)
(4)
Dependent Variable: Participation
Policy (β1 )
0.028∗∗∗
(0.006)
0.029∗∗∗
(0.007)
0.042∗∗∗
(0.007)
0.033∗∗∗
(0.010)
Policy × Foreign-Born (β2 )
-0.039
(0.024)
-0.046∗
(0.025)
-0.044∗
(0.025)
-0.069∗∗∗
(0.025)
0.22
0.22
0.22
0.23
Observations
325128
325128
325128
325128
Panel B:
Dependent Variable: log(Total Number of Participation)
Policy (β1 )
0.038∗∗∗
(0.010)
0.035∗∗∗
(0.010)
0.049∗∗∗
(0.011)
0.046∗∗∗
(0.016)
Policy × Foreign-Born (β2 )
-0.069∗
(0.037)
-0.085∗∗
(0.038)
-0.074∗
(0.038)
-0.114∗∗∗
(0.039)
0.24
0.24
0.24
0.24
325128
325128
325128
325128
yes
yes
yes
yes
yes
yes
yes
yes
yes
yes
yes
yes
yes
yes
R2
R2
Observations
State and Year Fixed Effects
Individual Controls
State Labor Market Controls
State Demographic Controls
State Trends
NOTE: Standard deviation is reported in parentheses. The outcome variables are measured at the household level. The regressions are clustered by the state level. All regressions include state fixed effect and time fixed effect. Individual Controls include age, sex,
race, education, employment status, total family incomes, poverty status, an indicator for
whether the head resided in the U.S. more than five years, and an indicator for whether the
head arrived the U.S. prior to 1982. State-level controls include state unemployment rate,
log of total employment, the employment-to-population ratio, the fraction of immigrants
who live in the U.S. less than five years, the fraction of foreign-born in the total population.
* significant at the 10% level; **significant at the 5% level; ***significant at the 1% level.
25
Table 7: Linear Probability Estimation of SNAP Participation:
The Adult Sample Under the 200% Poverty Line
New Arrivals
High-School
Non-citizen
Foriegn-Born
Big
States
Panel A: Households With No Children, Under 200% Poverty
Policy × Foreign-Born Citizens
-0.020
(0.027)
-0.041∗
(0.023)
-0.039
(0.023)
-0.069
(0.045)
Policy × Foreign-Born × characteristics
0.018
(0.020)
-0.016
(0.018)
-0.009
(0.018)
-0.042
(0.049)
R2
Observations
0.11
276181
0.11
276181
0.11
276181
0.11
276181
NOTE: Standard deviation is reported in parentheses. The outcome variable is measured at the household level. The regressions are clustered by the state level. All regressions include state fixed effect
and time fixed effect. Individual Controls include age, sex, race, education, employment status, total
family incomes, poverty status, an indicator for whether the head resided in the U.S. more than five
years, and an indicator for whether the head arrived the U.S. prior to 1982. State-level controls include
state unemployment rate, log of total employment, the employment-to-population ratio, the fraction
of immigrants who live in the U.S. less than five years, and the fraction of foreign-born in the total
population.
* significant at the 10% level; **significant at the 5% level; ***significant at the 1% level.
26
Table 8: Linear Probability Estimation of SNAP Participation:
The US-born Children Sample Under the 200% Poverty Line
New Arrivals
High-School
Non-Citizen
Foriegn-Born
Big
States
Dependent Variable: Participation (Linear Probability Estimation)
Policy × Foreign-Born Citizens
-0.054
(0.037)
-0.042
(0.026)
-0.046∗
(0.027)
-0.069
(0.049)
Policy × Foreign-Born × characteristics
-0.011
(0.030)
0.009
(0.020)
0.002
(0.018)
-0.032
(0.055)
0.2
0.22
0.22
0.22
R2
Dependent Variable: log(Total Number of Participation) (OLS)
Policy × Foreign-Born Citizens
-0.124∗∗
(0.057)
-0.086∗
(0.039)
-0.082∗
(0.041)
-0.134∗
(0.075)
Policy × Foreign-Born × characteristics
-0.055
(0.046)
0.038
(0.030)
-0.011
(0.028)
-0.078
(0.084)
0.24
0.24
0.24
0.24
R2
NOTE: Standard deviation is reported in parentheses. The outcome variable is measured at the household level. The regressions are clustered by the state level. The total observation numbers are 325128.
All regressions include state fixed effect and time fixed effect. Individual controls include age, sex,
race, education, employment status, total family incomes, poverty status, an indicator for whether
the head resided in the U.S. more than five years, and an indicator for whether the head arrived the
U.S. prior to 1982. State-level controls include state unemployment rate, log of total employment, the
employment-to-population ratio, the fraction of immigrants who live in the U.S. less than five years,
and the fraction of foreign-born in the total population. Anti-Immigrant states are the states who have
passed comprehensive anti-immigrant legislation since 2000.
* significant at the 10% level; **significant at the 5% level; ***significant at the 1% level.
27
A
Appendix
Table A.1: Validity Test
Dependent Variable
Employment Status
Last Year
Education
Head Arrived
Less than 5 Years
Panel A: The Adult Sample Under the 200% Poverty Line
Policy
0.019∗∗
(0.009)
0.010
(0.021)
N.A.
N.A.
Policy*Naturalized Citizens
-0.017
(0.049)
0.065
(0.116)
-0.024∗∗
(0.012)
Policy*Non-Cizitens
0.089
(0.056)
0.142
(0.130)
0.103∗∗∗
(0.014)
R2
Observations
0.03
17707
0.04
17707
0.28
177077
Panel B: The US-born Children Sample Under the 200% Poverty Line
Policy
-0.015∗∗
(0.007)
-0.001
(0.001)
N.A.
N.A.
Policy*Naturalized Citizen Head
0.019
(0.041)
-0.003
(0.007)
-0.005
(0.010)
Policy*Non-Citizen Head
-0.013
(0.036)
0.000
(0.006)
0.010
(0.008)
0.01
0.00
0.08
325128
325128
325128
yes
yes
yes
R2
Observations
State and Year Fixed Effects
NOTE: All regressions are linear probability regressions. Standard deviation is reported in
parentheses. The unit of analysis is household-level. The regressions are clustered by the
state level. All regressions include state fixed effect and time fixed effect.
* significant at the 10% level; **significant at the 5% level; ***significant at the 1% level.
i


© Copyright 2026